incremental nonlinear dynamic inversion and multihole ... · incremental nonlinear dynamic...
TRANSCRIPT

Incremental Nonlinear Dynamic Inversion and MultiholePressure Probes for Disturbance Rejection Control of
Fixed-wing Micro Air VehiclesElisabeth S. van der Sman∗, Ewoud J. J. Smeur, Bart Remes, Christophe De Wagter, and Qiping Chu
Delft University of Technology, 2629 HS Delft, The Netherlands
ABSTRACT
Maintaining stable flight during high turbulenceintensities is challenging for fixed-wing mi-cro air vehicles (MAV). Two methods are pro-posed to improve the disturbance rejection per-formance of the MAV: incremental nonlineardynamic inversion (INDI) control and phase-advanced pitch probes. INDI uses the angularacceleration measurements to counteract distur-bances. Multihole pressure probes measure theincoming flow angle and velocity ahead of thewing in order to react to gusts before an inertialresponse has occurred. The performance of INDIis compared to a traditional proportional inte-gral derivative (PID) controller with and with-out the multihole pressure probes. The attitudecontrollers are tested by performing autonomouswind tunnel flights and stability augmented out-door flights. This paper shows that INDI im-proves the disturbance rejection performance offixed-wing MAVs compared to traditional pro-portional integral derivative controllers.
1 INTRODUCTION
THE number of Micro Air Vehicles (MAVs) flying in urbanareas is increasing due to the low cost, the low weight,
the availability of ready-to-use platforms and the variety ofapplications. Fixed-wing MAVs are ideal for tasks which re-quire a long range and endurance such as mapping the en-vironment, surveillance, photography and delivering goods.These tasks may require the MAV to fly between buildingsand obstacles which generate high energy turbulence [1]. Theturbulence intensity profile increases as the MAV flies closerto the ground reaching levels up to 50% [2]. The perceivedturbulence level depends on the MAV flight speed. The lowerthe flight speed the higher the turbulence intensity, indicat-ing that hover is the most critical condition for MAVs [3].Fixed-wing MAVs are particularly susceptible to wind gustsdue to the large wing area [3]. Mohamed et al. identifiedtwo main approaches to counteract turbulence: reactive and
∗Msc. Student, Control and Simulation Department, Faculty ofAerospace Engineering
phase-advanced [2]. Reactive techniques use sensors to mea-sure the inertial response to disturbances. This paper focuseson developing a reactive nonlinear controller in combinationwith phase-advanced sensors to increase the stability of fixed-wing MAVs flying through turbulence.
Gusts cause large variations in airspeed and attitude an-gles in MAV, leading to nonlinear behavior. To maintain anoptimal performance gain scheduling is needed [4]. Alter-natively, using the model based Nonlinear Dynamic Inver-sion (NDI) a uniform performance over the flight envelopeis guaranteed if the aerodynamic model is accurately known[5]. The major disadvantage of NDI is the sensitivity to modelmismatch [6]. Determining an accurate aerodynamic modelof the MAV is very expensive and time consuming. It hasbeen very successful in programs like the Lockheed MartingX-35 [7][8] and the NASA X-36 tailless aircraft [9]. Incre-mental Nonlinear Dynamic Inversion (INDI) [10][11][6] hasbeen proposed to highly reduce model sensitivity. It relieson angular acceleration, filtered from differentiated angularrate provided by the gyroscopes[12]. Smeur et al. [12] foundthat the same filter should be used on the actuators to providetime synchronization with the measured acceleration. Theonly model parameters required by the INDI attitude con-troller are the actuator dynamics and the control effectiveness[12]. INDI has been implemented on fixed-wing MAVs forthe first time by Vlaar [13].
Phase-advanced sensors are used to measure turbulencebefore an inertial response has occurred [14][15]. The firstphenomenon to occur is the change in flow pitch angle andvelocity ahead of the wing. These variations cause an unevenlift distribution over the wings leading to structural stresseswhich can be measured by strain sensors [16]. Mohamed etal. [2] developed a pitch probe sensor inspired by the leadingedge feathers of birds. This sensor measures the variationsin the angle of attack and speed of the incoming flow. Bymeasuring the incoming gust ahead of the wing a time advan-tage is created. The gust is related to the pressure distributionover the wing which in turn causes an angular accelerationmeasurement. The sensor was therefore placed at the pointof highest correlation between the surface pressure variationand the measured angular acceleration [16]. The gust mea-surement is used as a feed-forward component to each aileronseparately to locally counteract the gust on each wing [2].This sensor enhances the controller performance by decreas-
International Micro Air Vehicle Conference and Flight Competition (IMAV) 2017 111

ing the range of the roll and pitch angle displacements [2].Wind tunnel flights were performed by inserting static tur-
bulence generating grids at the inlet of the test section. Thedistance from the grids in the direction of the flow determinesthe turbulence intensity level experienced by the MAV [17].Outdoor tests are performed with natural turbulence. Thelength scale of indoor turbulence is in the order of 1 metercompared to 15 meters for outdoor flights [2]. The aim of thispaper is to investigate the disturbance rejection performanceof INDI applied to fixed-wing MAVs in high turbulence in-tensities and to compare the performance of the proposed sys-tem with a traditional PID controller. Finally research is per-formed on the incorporation of the pitch probe sensors in theINDI control structure. All systems are implemented on theSlick 360 Micro fixed-wing MAV with the Open-Source Pa-parazzi Autopilot system. The disturbance rejection perfor-mance is tested in the same turbulence intensity conditionswhich are typical for urban environments.
The structure of this paper is the following: Section 2 de-scribes the MAV model, Section 3 is dedicated to the designof the INDI and PID controllers and Section 4 describes thepitch probe sensors. Section 5 presents the experimental set-up. The results are presented in Section 6.
2 MAV MODEL
The sum of moments experienced during flight by theSlick 360 Micro fixed-wing MAV expressed in the bodyframe are described by Eq. 1 [6] [18].
Ω = I−1(M−Ω× IΩ) (1)
The sum of moments around the body axes XB , YB , ZBis given by MT =
[Mx My Mz
]. The angular rates are
denoted by ΩT =[p q r
]. The moment of inertia matrix
is defined by Eq. 2 assuming a plane of symmetry around thelongitudinal and vertical axis (XBZB − plane).
I =
Ixx 0 −Ixz0 Iyy 0−Ixz 0 Izz
(2)
The resulting system of equations is given by Eq. 3 [18] [19].
Mx = Ixxp+ (Izz − Iyy)qr − Ixz(r + pq)My = Iyy q + (Ixx − Izz)rp+ Ixz(p
2 − r2)Mz = Izz r + (Iyy − Ixx)pq − Ixz(p+ rq)
(3)
Expressed in terms of the angular accelerations Eq. 3 be-comes Eq. 4 [19].
p = (c1r + c2p)q + c3Mx + c4Mz
q = c5pr − c6(p2 − r2) + c7My
r = (c8p− c2r)q + c4Mx + c9Mz
(4)
The definitions of the multiplication parameters c1 up to c9with Γ = IxxIzz − I2xz [19]:
Γc1 = (Iyy − Izz)Izz − I2xz Γc3 = IzzΓc2 = (Ixx − Iyy + Izz)Ixz Γc4 = Ixzc5 = (Izz − Ixx)I−1yy c6 = IxzI
−1yy
c7 = I−1yy c8 = (Ixx − Iyy)Ixx − Ixz2Γc9 = Ixx
The moments can be spit into two components Eq. 5: a partdepending on the aerodynamic state variables and a part in-fluenced by the control surfaces of the vehicle.
M = Ma +Mc (5)
Substituting Eq. 5 into Eq. 3 leads to Eq. 6 around the rollaxis.
p = (c1r + c2p)q + c3Mxa(u, v, w, p, q, r)+
c3Mxc(V, δa, δe, δr) + c4Mza(u, v, v, w, p, q, r)+
c4Mzc(V, δa, δe, δr))
(6)
In the body frame the components of the free stream velocityV are defined as u, v, w. The control surface deflections aredenoted by δa, δe, δr for the ailerons, elevator and rudder re-spectively. Around the pitch axis substituting Eq. 5 into Eq. 3leads to Eq. 7.
q = c5pr − c6(p2 − r2) + c7Mya(u, v, w, w, p, q, r)+
c7Myc(V, δa, δe, δr, δt)(7)
A second derivative term is incorporated for the verticalvelocity component w. The thrust of the propeller is definedas δt.
Euler angles are used to define the orientation of the bodyframe with respect to the earth frame [18]. The kinematicattitude equations Eq. 8 for a flat non-rotating earth are usedto relate the angular rates to the Euler angles [18].
φ = p+ q sinφ tan θ + r cosφ tan θ
θ = q cosφ− r sinφψ = q sinφ
cos θ + r cosφcos θ
(8)
3 INCREMENTAL NONLINEAR DYNAMIC INVERSION
The angular accelerations around the body axes definedby Eq. 4 can be written in an incremental form by applying aTaylor series expansion. The resulting equation is used by thecontroller to predict the angular acceleration one step aheadin time based on the current time point [12].
3.1 Roll axisThree eigenmotions characterize the behavior of the MAV
around the roll axis: the aperiodic roll, the dutch roll andthe spiral. The fast aperiodic roll is used to model the an-gular acceleration based on aileron inputs. During this ma-neuver the MAV is flown at a constant speed V of 10m/swith ∆u = 0. The yawing motion and rudder input are ne-glected: ∆v = 0 ∆v = 0 ∆r = 0 ∆δr = 0. Due
112 International Micro Air Vehicle Conference and Flight Competition (IMAV) 2017
to this assumption the yaw moment Mz can be omitted [18].The asymmetric and symmetric motions are considered de-coupled. The effects of the symmetric motions are neglected:∆δe = 0 ∆w = 0 ∆q = 0. Applying a Taylor series ex-pansion to Eq. 6 with the above mentioned assumptions leadsto Eq. 9.
p = p0 +∂(c3Mxa)
∂p
∣∣∣∣p=p0
(p− p0)+
∂(c3Mxc)
∂δa
∣∣∣∣δa=δa0
(δa − δa0)(9)
The partial derivative of the aerodynamic moment ∂(c3Mxa)∂p
is defined as Fp. The partial derivative of the control moment∂(c3Mxc)
∂δais defined as Gδa , simplifying Eq. 9 to Eq. 10.
∆p = Fp∆p+Gδa∆δa (10)
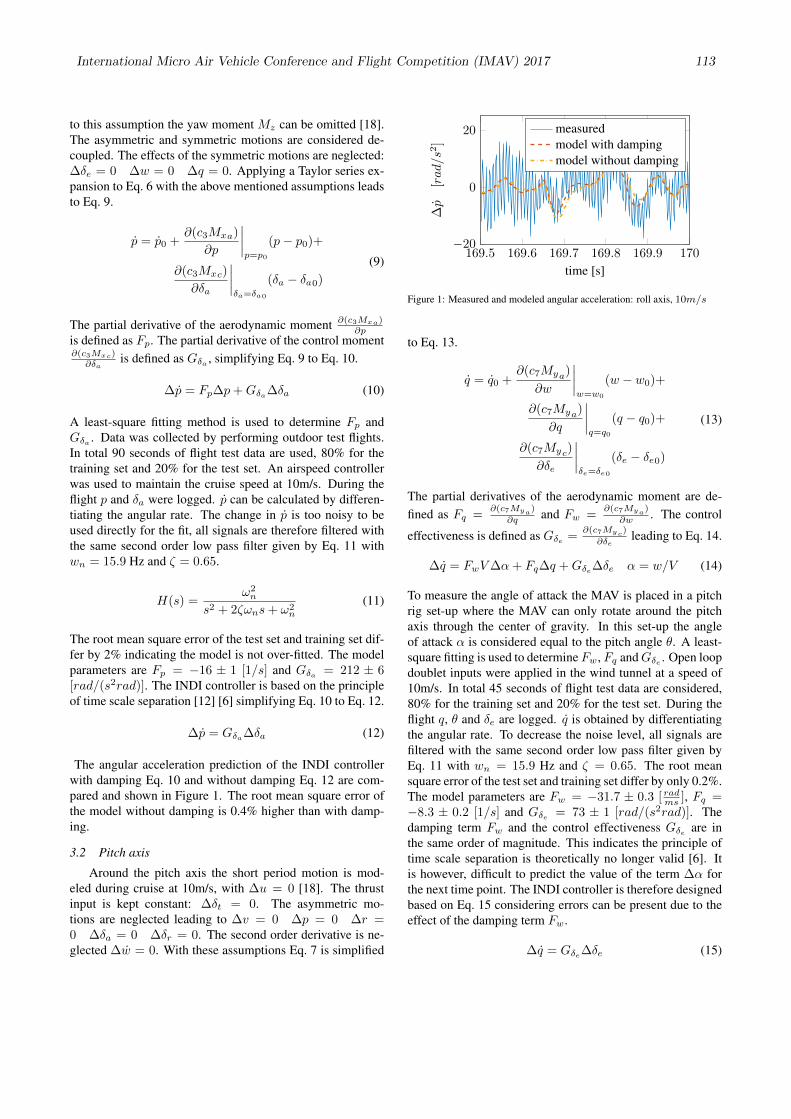
A least-square fitting method is used to determine Fp andGδa . Data was collected by performing outdoor test flights.In total 90 seconds of flight test data are used, 80% for thetraining set and 20% for the test set. An airspeed controllerwas used to maintain the cruise speed at 10m/s. During theflight p and δa were logged. p can be calculated by differen-tiating the angular rate. The change in p is too noisy to beused directly for the fit, all signals are therefore filtered withthe same second order low pass filter given by Eq. 11 withwn = 15.9 Hz and ζ = 0.65.
H(s) =ω2n
s2 + 2ζωns+ ω2n
(11)
The root mean square error of the test set and training set dif-fer by 2% indicating the model is not over-fitted. The modelparameters are Fp = −16 ± 1 [1/s] and Gδa = 212 ± 6[rad/(s2rad)]. The INDI controller is based on the principleof time scale separation [12] [6] simplifying Eq. 10 to Eq. 12.
∆p = Gδa∆δa (12)
The angular acceleration prediction of the INDI controllerwith damping Eq. 10 and without damping Eq. 12 are com-pared and shown in Figure 1. The root mean square error ofthe model without damping is 0.4% higher than with damp-ing.
3.2 Pitch axis
Around the pitch axis the short period motion is mod-eled during cruise at 10m/s, with ∆u = 0 [18]. The thrustinput is kept constant: ∆δt = 0. The asymmetric mo-tions are neglected leading to ∆v = 0 ∆p = 0 ∆r =0 ∆δa = 0 ∆δr = 0. The second order derivative is ne-glected ∆w = 0. With these assumptions Eq. 7 is simplified
169.5 169.6 169.7 169.8 169.9 170−20
0
20
time [s]
∆p
[rad/s2]
measuredmodel with dampingmodel without damping
Figure 1: Measured and modeled angular acceleration: roll axis, 10m/s
to Eq. 13.
q = q0 +∂(c7Mya)
∂w
∣∣∣∣w=w0
(w − w0)+
∂(c7Mya)
∂q
∣∣∣∣q=q0
(q − q0)+
∂(c7Myc)
∂δe
∣∣∣∣δe=δe0
(δe − δe0)
(13)
The partial derivatives of the aerodynamic moment are de-fined as Fq =
∂(c7Mya)
∂q and Fw =∂(c7Mya)
∂w . The control
effectiveness is defined as Gδe =∂(c7Myc)
∂δeleading to Eq. 14.
∆q = FwV∆α+ Fq∆q +Gδe∆δe α = w/V (14)
To measure the angle of attack the MAV is placed in a pitchrig set-up where the MAV can only rotate around the pitchaxis through the center of gravity. In this set-up the angleof attack α is considered equal to the pitch angle θ. A least-square fitting is used to determine Fw, Fq andGδe . Open loopdoublet inputs were applied in the wind tunnel at a speed of10m/s. In total 45 seconds of flight test data are considered,80% for the training set and 20% for the test set. During theflight q, θ and δe are logged. q is obtained by differentiatingthe angular rate. To decrease the noise level, all signals arefiltered with the same second order low pass filter given byEq. 11 with wn = 15.9 Hz and ζ = 0.65. The root meansquare error of the test set and training set differ by only 0.2%.The model parameters are Fw = −31.7 ± 0.3 [ radms ], Fq =−8.3 ± 0.2 [1/s] and Gδe = 73 ± 1 [rad/(s2rad)]. Thedamping term Fw and the control effectiveness Gδe are inthe same order of magnitude. This indicates the principle oftime scale separation is theoretically no longer valid [6]. Itis however, difficult to predict the value of the term ∆α forthe next time point. The INDI controller is therefore designedbased on Eq. 15 considering errors can be present due to theeffect of the damping term Fw.
∆q = Gδe∆δe (15)
International Micro Air Vehicle Conference and Flight Competition (IMAV) 2017 113

The root mean square error of the model without dampingis 22% higher compared to the model with damping. Theincrease in root mean square error is mainly due to the openloop response which includes a slow damping motion whichis not captured by the initial elevator input. The dampingis slower compared to the initial change in acceleration dueto the elevator input and can therefore be compensated bya closed loop control structure. The comparison of the twomodels and the measured change in angular acceleration isgiven in Figure 2.
79 79.5 80 80.5 81
−5
0
5
10
time [s]
∆q
[rad/s
2]
measuredmodel with damping termsmodel without damping
Figure 2: Measured and modeled angular acceleration: pitch axis, 10m/s
3.3 ImplementationThe INDI control scheme has the form given in Figure 3
and Figure 4 based on Eq. 12 and Eq. 15. The virtual controlinput v denotes the reference acceleration of the system whichis compared to the measured acceleration pf for roll and qffor pitch. The subscript f is used to denote all signals whichhave been filtered with second order low pass filterH(s). Theinverse of the control effectiveness G is used to calculate therequired change in input based on the angular acceleration er-ror. This change in input cannot be achieved instantaneouslybut is filtered by the actuator dynamics A(s). The actuatorposition that is achieved after a time step is fed back intothe system delayed by the same filter H(s) to achieve timesynchronization with the angular acceleration. The linear PDcontroller is used to control the attitude angles. The con-troller uses the angular rate to calculate the derivative term.For small pitch angles this assumption is valid as shown byEq. 8.
φ
f
∆δ
φ−p
p
a
δaf
δaref refp ∆p δac
+p
1/s
A(s)
H(s)
ACν + ++
−P
D
+
−G-1
INDI d
1/s
H(s)s
Figure 3: INDI control block structure roll
The actuators determine the reference tracking and dis-turbance rejection performance of the INDI controller [12].
θ
1/s
A(s)
H(s)
AC
f
ν ∆δ+ ++
−θ
P
D
+
− −q
q
e
δe f
δeref refqG-1
INDI
∆q
d
δec
+q
1/s
H(s)s
Figure 4: INDI control block structure pitch
The Slick 360 Micro uses 4 HK5330 micro servos to movethe control surfaces. These servos are the fastest in this cat-egory currently available with a speed of 0.04 sec from 0 to60 deg. The servo model is determined by logging the PWMcommand given by the autopilot and the position of the servoarm measured by the servo potentiometer. The servo is mod-eled as a first order system with a limited rate Eq. 16 and aninitial delay of 10 milliseconds.
A(s) = 60s+60(
∆δa∆t Gδa
)max
= 11 [rad/s](∆δe∆t Gδe
)max
= 4 [rad/s]
(16)
3.4 Closed-loop AnalysisThe closed-loop performance of the system can be cal-
culated by simplifying the INDI controller to the actuatordynamics block shown in Figure 5 [12]. The actuator dy-
60s+60
+
−ref +
P
D
Rate Limiter1s
rate
−
A(s)
angle angle
Figure 5: Linear gains analysis
namics block contains a first order system and a rate limiterwhich is influenced by the control effectiveness G. Due tothe rate limiter, increasing the PD gains does not necessarilylead to a faster reference tracking performance. During highturbulence intensities the system is considered to be operat-ing in the range influenced by the rate limiter. The closed-loop response is analyzed for a step input of 0.2 rad for pitchand 0.4 rad for roll. Figure 6 shows the performance of themodel with the parameters from Eq. 16 forP = 100, 185, 300and 400. The ratio between the proportional and derivativegain should remain constant leading to a corresponding set ofderivative gains D = 12, 22, 36 and 48. This shows that adrawback of using a higher P gain is the amplification of thenoise in the roll and pitch rate signals due to a higher D gain.Figure 6 shows that the response of the system for a rangeof proportional gains is identical except for the last part ofthe step response where the first order system determines thebehavior.
Around the roll axis, the linear gains are designed to ob-tain a rise time of 0.22 sec given a step input of 0.4 rad with-out overshoot. This leads to P = 185 and D = 22. For pitch,
114 International Micro Air Vehicle Conference and Flight Competition (IMAV) 2017

0.8 1 1.2 1.4 1.6 1.8 20
0.2
0.4
time [s]
φ[rad]
referenceP=400P=300P=185P=100
(a) Roll angle tracking of a step input of 0.4 radians
0.8 1 1.2 1.4 1.6 1.8 20
0.1
0.2
time [s]
θ[rad] reference
P=400P=300P=185P=100
(b) Pitch angle tracking of a step input of 0.2 radians
Figure 6: Reference tracking performance for varying PD gains
the reference tracking for a step input of 0.2 rad is designedto give a rise time of 0.23 sec and a small overshoot of 6%.This leads to the same set of gains P = 185 and D = 22.
The PID gains used in this paper were manually tuned toobtain comparable rise time and overshoot properties as theINDI controller. For roll, the manually tuned P gain is 1.6times higher compared to the INDI gain. The D gain usedin the PID structure is 0.7 times lower compared to the INDIgain.
4 PHASED-ADVANCED PITCH PROBES
The pressure probes system designed by Mohamed et al.[2] is used in the same configuration. The probe head is con-nected to a differential pressure sensor through acrylic tubesembedded in the wings. The probe is placed 15 cm ahead ofthe wing to create a 15 milliseconds time advantage at cruisespeeds. The signals are feed-forwarded to both ailerons sep-arately as shown in Figure 7 [2]. The probes sense changesin angle of attack of the incoming flow. Mohamed et al. [2]showed that a linear relationship between the angle of attackmeasurement and the differential pressure measurement. Theprobes are high pass filter using a fourth order Butterworthfilter given by Eq. 17. Based on flight test data, the cut-offfrequency was selected at 4Hz.
H(z) = b(1)+b(2)z−1+b(3)z−2+b(4)z−3+b(5)z−4
a(1)+a(2)z−1+a(3)z−2+a(4)z−3+a(5)z−4 (17)
High Pass Filter
left aileron+
δa +
+
High Pass Filter
right aileron+
P
P
Pitch Probe left
Pitch Probe right
Figure 7: Feed-forward control probes [2]
with b = [ 0.7194 −2.8774 4.3162 −2.8774 0.7194 ] anda = [ 1 −3.3441 4.2389 −2.4093 0.5175 ].
5 EXPERIMENTAL SET-UP
Figure 8: Slick 360 Micro
The tests presented in this paper are all performed withthe Slick 360 Micro shown in Figure 8. The MAV weighs 130grams and has a wing span of 49 cm. The MAV is equippedwith the LISA M Paparazzi open-source autopilot system andthe phase-advanced pitch probes developed by Mohamed etal. [2]. Tests were performed in the Open Jet Facility (OJF) atDelft University of Technology and outdoors during a windyday. To ensure the human element is not influencing the re-sults the MAV is flown completely autonomously with a ver-tical, longitudinal and lateral position control system.
5.1 Open Jet FacilityThe OJF tunnel cross section is 285 × 285 cm. In the
wind tunnel the coordinate system is defined as: Xw to theright perpendicular to the flow direction, Yw in the directionof the tunnel flow and Zw to the top of the wind tunnel. Theorigin of the axis system is given in Figure 9 in the middleof the cross section underneath the tunnel inlet. The head-
XY
Z
tunnel cross section
air ow
OJF
12 OptiTrack camera’s
N
O
Figure 9: OJF wind tunnel coordinate system definition
International Micro Air Vehicle Conference and Flight Competition (IMAV) 2017 115

ing is defined as 0 deg in the flow direction. The position ismeasured by 12 Optitrack cameras and sent at 20Hz.
Figure 10: Pitch rig set-up
The pitch rig wind tunnel tests were performed to ana-lyze the short period motion. The rig consists of a woodenconstruction attached to the tunnel floor and a movable rodconnected to the wooden frame through low friction bearings.The rotational axis of the rig passed through the quarter chordline which corresponds to the center of gravity of the MAV.The pitch rig set-up is shown in Figure 10.
To replicate high levels of turbulence intensity static gridswere placed at the test section inlet. The grids are built up ofmetal rods evenly spaced in the vertical direction and con-nected at the edges as shown in Figure 11. Close to the gridswake turbulence is generated which slowly decays into ho-mogeneous turbulence [17]. This decay is captured by thevariation of the turbulence intensity in the flow direction. Theresults shown in Section 6 are therefore always compared atthe same Xw, Yw, Zw position.
Figure 11: Turbulence grids set-up
5.2 Position ControlThe MAV has to fly in a box with a maximum cross sec-
tion of 285 × 285 cm minus the wing span. The positionin the flow direction has to be constant to ensure the samelevel of turbulence intensity is experienced throughout multi-ple flights. In the wind tunnel the course angle cannot be usedas the position of the MAV is constant and the MAV is effec-tively hovering. A heading based controller is used instead tocontrol the lateral position.
5.2.1 Vertical and longitudinal control
The throttle is used to control the longitudinal displacements.During outdoor flights the throttle is only used for the climband descent phases and therefore always combined with a cor-responding pitch angle. The vertical controller uses the alti-tude error to calculate the reference climb rate. The altitude
error is the difference between the reference altitude definedin the flight plan and the altitude z measured by the Opti-Track system. Based on climb rate, a feed-forward increasein throttle level on top of the cruise throttle is commanded.The longitudinal position y is compared to the reference po-sition. A standard PID control structure is used to keep theaircraft at one location in the tunnel, as shown in Figure 12.
alt
Optitrack
AC−
ref
+
err
1/s I
P
+ref errP
z
y
z+climb throttle
increment
s D
y
ref+
+
++−
cruise throttle
nominal throttle
y
δ tin
++
Figure 12: Vertical and longitudinal throttle control
The reference pitch angle is calculated from the desiredclimb rate which, as shown in Figure 13, depends on the alti-tude error.
Optitrack
pitch loop
− +
1/s I
+ACDs
alt−
ref errP
z
+
climbref+
+Feed Forward
++
zv
Figure 13: Vertical pitch control
5.2.2 Lateral control
The lateral controller defines a reference course (heading) an-gle χref as the arctangent of the x and y distances betweenthe MAV and the desired waypoint. A PD controller calcu-lates the roll angle setpoint based on the heading error. Anoverview of the lateral position control block is given in Fig-ure 14.
χ
Optitrack
roll loop+
−ψ
+ref
+err
s D
Proll setpoint
x +−
ref
x
y +
−ref
y
−: atan2
heading
Figure 14: Lateral roll control
116 International Micro Air Vehicle Conference and Flight Competition (IMAV) 2017

5.3 Outdoor test flightsThe flight tests were performed in a field surrounded by
trees to ensure the MAV is constantly subject to turbulence.The speed of the MAV was kept constant at 10m/s by a pro-portional integral (PI) airspeed controller regulating the throt-tle. The attitude was controlled by the test pilot. The turbu-lence length scale can be estimated by using the von Karmanmodel given by Eq. 18 [17].
Suu(f) =4σ2LxV
1(1 + 70.8
(LxfV
)2) 56
(18)
Suu is the power spectral density as a function of the fre-quency f expressed in Hz. The power spectral density fol-lows a -5/6 decay law as can be seen by the denominator ofthe function. σ is the standard deviation of the flow and Lxthe turbulence length scale.
6 RESULTS
Table 1: Preliminary and final parameters of the INDI controllers
Roll PitchPreliminary Final Preliminary Final
P 400 185 400 185D 22 22 22 22G 0.019 0.022 0.014 0.008ωn 3.2 15.9 1.6 15.9
Table 2: Preliminary and final parameters of the PID controllers
Roll PitchPreliminary Final Preliminary Final
P 12500 15000 4500 16000I 1 30 1 30D 700 700 1.5 1.5
6.1 Wind Tunnel FlightsApproximate values of the control effectiveness, linear
gains and filter cut-off frequency were used during the initialOJF windtunnel tests. The parameters calculated in Section 3are summarized in Table 1 and Table 2 and compared to theempirically determined preliminary parameters used duringthe autonomous wind tunnel tests.
The INDI controller proved to be very precise and ableto maintain the position within a 1x1x1 meter box during allflights. The performance of INDI and PID is evaluated for thesame time frame and for the the same position Xw, Yw, Zwand is shown in Figure 17.
The results given in Figure 15 and Figure 16 show thatthe range of the probability density function for the roll an-gle error decreases by 40% with the INDI controller com-pared to the PID controller. For the pitch angle the range
-0.3 -0.2 -0.1 0 0.1 0.20
0.05
0.1
0.15
Pro
babi
lity
Den
sity
Fun
ctio
n
INDIPID
Figure 15: Roll angle perturbation for PID and INDI controller
-0.2 -0.15 -0.1 -0.05 0 0.05 0.1 0.15 0.20
0.05
0.1
0.15
0.2
0.25
Pro
babi
lity
Den
sity
Fun
ctio
n
INDIPID
Figure 16: Pitch angle perturbation for PID and INDI controller
decreases by 43% for INDI compared to PID. The probabil-ity density functions of the PID controller for roll and pitchare not centered around zero. This indicates that the integralgains should be increased to obtain a better performance. Theintegral gains were therefore increased by a factor 30 for thefinal test flights, as shown in Table 2.
6.2 Outdoor flights
The reference tracking performance of the INDI con-troller around the roll axis is shown in Figure 18(a). Therise time of the step input given from 0 to 0.4 radians is onaverage 0.15 sec which is faster than the expected rise timeobtained with the closed loop analysis in subsection 3.4 ofSection 3. Overshoot is an average value of 10%. The ref-erence tracking performance of the PID controller around theroll axis is shown in Figure 18(b) with an average rise timeof 0.19 sec and overshoot of 5%. These tests were performedconsecutively outdoors on the same day.
The reference tracking performance of the INDI con-troller around the pitch axis is shown in Figure 19(a). Therise time for the test performed at 10.6 m/s is 0.37 sec andthe overshoot 13%. The variation between the three curvesis due to the high levels of turbulence experienced during theflight and the different airspeeds at which the step inputs weregiven. The PID step response test was executed twice duringthis flight. The performance is difficult to assess due to the
International Micro Air Vehicle Conference and Flight Competition (IMAV) 2017 117

−1 0 1 2
INDIPID
x [m]
−1 −0.5 0 0.5 1
INDIPID
y [m]
1 1.5 2 2.5
INDIPID
z [m]
Figure 17: Position variation comparison between INDI and PID
1 1.5 2 2.5
−0.5
0
0.5
1
time [s]
φ[rad]
φref
φ (V = 10.7 m/s)φ (V = 10.0 m/s)φ (V = 10.1 m/s)
(a) INDI
1.5 2 2.5
−0.5
0
0.5
1
time [s]
φ[rad]
φref
φ (V = 9.8 m/s)φ (V = 10.4 m/s)φ (V = 8.5 m/s)
(b) PID
Figure 18: Roll axis tracking performance.
influence of high energy turbulence as shown in Figure 19(b).On a calm day the results obtained with the same PID gainsshow a very high performance as given in Figure 20. A smallsteady state-error is visible in the results indicating the tuningof the integral gain can be improved to eliminate the steady-state offset.
1 1.5 2 2.5 3 3.5 4
−0.5
0
0.5
time [s]
θ[rad]
θref
θ (V = 9.4 m/s)θ (V = 10.6 m/s)θ (V = 13.3 m/s)
(a) INDI
1 1.5 2 2.5 3 3.5 4−0.4
−0.2
0
0.2
0.4
time [s]
θ[rad]
θref
θ (V = 9.6 m/s)θ (V = 11.6 m/s)
(b) PID
Figure 19: Pitch axis tracking performance.
The disturbance rejection of the INDI controller and thePID controller with and without pitch probes was tested onthe same day while flying the same trajectory multiple times.The analysis of all test flights showed that one on the pitchprobes got obstructed during landing causing a bias in themeasurements of the subsequent flights. Therefore no reliabledata was obtained on the performance of the INDI controllerin combination with the pitch probe sensors. The disturbancerejection performance is therefore analyzed for the other threecontrol approaches. In total 120sec of reliable flight data areanalyzed in this section, 40 seconds for each controller. Theturbulence intensity level of the flight data is Ti = 12.9%.The turbulence length scale is estimated by using the vonKarman spectrum Eq. 18 to be 2.5 meters. The performanceis evaluated for the part of the flight which used the airspeedcontroller to maintain the average velocity around 10m/s. Theaverage velocity of the flight test data is 9.7 m/s.
Figure 21(a) clearly shows an improvement in the prob-ability density function of the roll angle error for the INDI
118 International Micro Air Vehicle Conference and Flight Competition (IMAV) 2017

1 2 3 4 5
−0.2
0
0.2
time [s]
θ[rad]
θref
θ1
θ2
θ3
Figure 20: Pitch angle during doublet (PID, calm air, 10m/s)
controller compared to the PID controller. The box plot of thedata given in Figure 21(b) shows that the range decreases by21% for INDI compared to PID. The enhanced PID controllerwith the pitch probes does not show an improvement in per-formance compared to the traditional PID controller. This re-sult is not as expected from literature. Two main reasons havebeen identified which can influence the results: the high passfilter and degraded servos. The flight data show that the fil-tered probe values contain offsets. These offsets should havebeen eliminated by the high pass filter. The parameters usedfor the high pass filter during testing had a precision of 10−4.By increasing the accuracy of the filter parameters to 10−6
all offsets are removed from the data. Another factor whichwas not taken into account is the degrading performance ofthe servos due to overheating. To eliminate this aspect theservos should be replaced after each test flight. Additionalflight tests should be performed with accurate filter parame-ters and new servos to improve the performance of the pitchprobe sensors.
The pitch angle error shown in Figure 22(a) also shows aclear improvement with INDI compared to PID. The box plothighlights the difference in Figure 22(b) which indicates thatthe range decreases by 24% for INDI compared to PID.
7 CONCLUSION
This research shows the potential of incremental nonlin-ear dynamic inversion applied to fixed-wing micro air vehi-cles flown in high turbulence intensities. The angular accel-eration measurements are predicted based upon the controlsurface deflections eliminating the need for a complex aero-dynamic model. To test the performance of the system a novelcontrol solution is presented which allows autonomous freeflight in a wind tunnel. The throttle is used for both the lon-gitudinal an vertical control and the heading angle is used forlateral control. This experimental set-up eliminates all humanfactors and provides the opportunity to test in turbulence in-tensities which are beyond human capabilities. Autonomousfree flight wind tunnel tests in turbulence were performedwith estimates of the control effectiveness and the filter cut-off frequency. The performance of the estimated model ispresented as it illustrates the robustness of the system. The
−0.3 −0.2 −0.1 0 0.1 0.2 0.30
5 · 10−2
0.1
φref − φ [deg]
Prob
abili
tyD
ensi
tyFu
nctio
n
INDIPIDPID probes
(a) Probability density function of the roll angle error
−0.3 −0.2 −0.1 0 0.1 0.2 0.3INDIPID
PID probes
φref − φ [rad]
(b) Box plot of the roll angle error
Figure 21: Disturbance rejection performance around the roll axis
−0.3 −0.2 −0.1 0 0.1 0.2 0.30
5 · 10−2
0.1
0.15
θref − θ [deg]
Prob
abili
tyD
ensi
tyFu
nctio
n
INDIPIDPID probes
(a) Probability density function of the pitch angle error
−0.3 −0.2 −0.1 0 0.1 0.2 0.3INDIPID
PID probes
θref − θ [rad]
(b) Box plot of the pitch angle error
Figure 22: Disturbance rejection performance around the pitch axis
International Micro Air Vehicle Conference and Flight Competition (IMAV) 2017 119

results show that the controller eliminates all steady-state er-rors and counteracts accelerations caused by external distur-bances making it a suitable solution for precise movements inthe wind tunnel. Accurate model parameters for the controleffectiveness, the actuators and the filter cut-off frequency aredetermined in this paper and used to assess the performanceof the system during outdoor test flights. During outdoorflights the performance is compared to a proportional inte-gral derivative controller tuned to obtain the same referencetracking performance. The nonlinear incremental controllersignificantly improves the disturbance rejection performancearound both the roll and pitch axis. More research shouldbe performed to assess the performance of the nonlinear con-troller compared to an enhanced linear controller with phase-advanced pitch probes.
REFERENCES
[1] S. Watkins, A. Mohamed, A. Fisher, R. Clothier, R. Car-rese, and D. F. Fletcher. Towards autonomous mav soar-ing in cities: Cfd simulation, efd measurement and flighttrials. International Micro Air Vehicles Conference andFlight Competition 2015, 2015.
[2] A. Mohamed, M. Abdulrahim, S. Watkins, andR. Clothier. Development and flight testing of a turbu-lence mitigation system for micro air vehicles. Journalof Field Robotics, 33(5):639–660, 2016.
[3] S. Watkins, J. Millbank, B. J. Loxton, and W. H. Mel-bourne. Atmospheric winds and their implications formicroair vehicles. AIAA Journal, 44(11):2591–2600,2006.
[4] J. J. E. Slotine and W. Li. Applied Nonlinear Control.Prentice-Hall, 1991.
[5] H. P. Lee, S. E. Reiman, C. H. Dillon, and H. Youssef.Robust nonlinear dynamic inversion control for a hyper-sonic cruise vehicle. AIAA Guidance, Navigation, andControl Conference and Exhibit, 2007.
[6] S. Sieberling, Q. Chu, and A. J. Mulder. Robust flightcontrol using incremental nonlinear dynamic inversionand angular acceleration prediction. AIAA Journal ofGuidance, Control, and Dynamics, 33(6):1732–1742,2010.
[7] K. Bordignon and J. Bessolo. Control allocation for thex-35b. 2002 Biennial International Powered Lift Con-ference and Exhibit, 2002.
[8] G. P. Walker and D. A. Allen. X-35b stovl flight controllaw design and flying qualities. 2002 Biennial Interna-tional Powered Lift Conference and Exhibit, 2002.
[9] J. S. Brinker and K. A. Wise. Flight testing of re-configurable control law on the x-36 tailless aircraft.
AIAA Journal of Guidance, Control, and Dynamics,24(5):903–909, 2001.
[10] P. R. Smith. A simpified approach to nonlinear dynamicinversion based flight control. AIAA Atmospheric FlightMechanics Conference and Exhibit, 1998.
[11] B. J. Bacon and A. J. Ostroff. Reconfigurable flight con-trol using nonlinear dynamic inversion with a specialaccelerometer implementation. AIAA Guidance, Navi-gation, and Control Conference and Exhibit, 2000.
[12] E. J. J. Smeur, Q. Chu, and G. C. H. E. de Croon. Adap-tive incremental nonlinear dynamic inversion for atti-tude control of micro aerial vehicles. AIAA Journalof Guidance, Control, and Dynamics, 39(3):450–461,2016.
[13] M. C. Vlaar. Incremental nonlinear dynamic inversionflight control implementation and flight test on a fixedwing uav. Master thesis, Delft University of Technol-ogy, Delft The Netherlands, February 2014.
[14] A Mohamed, R Clothier, S Watkins, R Sabatini, andM Abdulrahim. Fixed-wing mav attitude stability inatmospheric turbulence, part 1: Suitability of con-ventional sensors. Progress in Aerospace Sciences,70:69–82, 2014.
[15] A Mohamed, S Watkins, R Clothier, M Abdulrahim,K Massey, and R Sabatini. Fixed-wing mav attitudestability in atmospheric turbulencepart 2: Investigatingbiologically-inspired sensors. Progress in AerospaceSciences, 71:1–13, 2014.
[16] A. Mohamed, S. Watkins, R. Clothier, and M. Ab-dulrahim. Influence of turbulence on mav roll pertur-bations. International Journal of Micro Air Vehicles,6(3):175–190, 2014.
[17] Sridhar Ravi. The influence of turbulence on a flat plateaerofoil at Reynolds numbers relevant to MAVs. PhDthesis, RMIT, Melbourne, Victoria, Australia, 2011.
[18] M. V. Cook. Flight Dynamics Principles. Elsevier,2007.
[19] Lars Sonneveldt. Adaptive Backstepping Flight Controlfor Modern Flighter Aircraft. PhD thesis, Delft Univer-sity of Technology, Delft, The Netherlands, 2010.
120 International Micro Air Vehicle Conference and Flight Competition (IMAV) 2017