increasing water use efficiency of mmi projects -...
TRANSCRIPT

Increasing
Efficiency of Water Use in
Major and Medium Irrigation
Projects
A S Dhingra Commissioner (Retd.), MOWR
JALMANTHAN – 222nd – 23rd Feb. 2016

National Water Use Efficiency Support Programme
• ADB’s Water Operational Plan (2011) emphasizes: - Prioritizing deepening and expanding analytical framework
- Strengthening ADB financial support to priority programmes
- Core agenda on boosting WUE of Irrigation projects through
improved water management and sustainable service delivery
• Study financed by Asian Development Bank
• Studies taken up by ADB: - Sector study on Development of Synthesis and Draft Action Plan for
Improving WUE of Irrigated Agriculture in Indian States (DSDAP)
- Scoping study for a National Water Use Efficiency Improvement
Support Programme (NWUEISP)
- Innovations for More Food with Less Water (MFLW)

Presentation setup
• Background
– Present status, NWM and 12th FYP reform
Agenda
• NWUEISP Framework to improve WUE of
MMI projects
• Pilot Testing of the Framework on two MMI
projects

Background

“India faces a major crisis of water as we move into the 21st century. This crisis threatens the basic right to drinking water of our citizens; it also puts the livelihoods of millions at risk. The demands of a rapidly industrialising economy and urbanising society come at a time when the potential for augmenting supply is limited, water tables are falling and water quality issues have increasingly come to the fore.”
Dr Mihir Shah,
Former Member for Water,
Planning Commission,
(January 2013).
Growing Water Crisis

6
Water and Food
Scarce River Basins
Source: Amarasinghe et.al. 2007 (IWMI)
Options to reduce scarcity:• Increase crop productivity per
drop • Increase ground water recharge• Increase economic value of
water• Inter-basin transfer
Growing regional water scarcity by 2050

Current Status, NWM and 12th FYP reform agenda
• Current Status of WUE under MMI
– MMI constitute more than 80% of Government created schemes
– Agriculture sector with draws about 80% of all withdrawal
– Irrigation efficiencies very low (35-38%)
• NWM Reform Objectives
– Improve WUE of MMI by 20% by 2017
– Emphasize on improving irrigation performance
– Need to increase crop per drop
• 12th FYP Reform Agenda for MMIIDs should: “move away from a narrow engineering-construction-centric approach
to a more multi-disciplinary, participatory management approach for MMI
schemes, with a focus on command area development and a sustained effort at
improving water use efficiency” (para. 5.5,12th FYP)
• Shift in management concept of Gap in irrigation potential
creation and utilization versus performance achievements through
improved WUE

The term WUE
• WUE Concept– Traditional definitions
– WUE boundaries
– Multiple dimensions of
WUE
– ICID concept
– WUE under NWUEISP
– Benchmarking WUE and
other indices
– Quick assessment of ET to
measure overall WUE

NWUEISP definition of WUE
• Water use efficiency for managing MMI schemes relates to the efficiency of
delivering water from the intake of the irrigation system to the crop root
zone for the purpose of beneficial crop evapotranspiration, taking account
of any use or reuse of seepage or other conveyance, distribution or
application losses as conventionally describe that might subsequently be
used by farmers within the boundaries of the irrigation scheme.
• WUE term thus relates to the fraction of irrigation water used for
productive crop evapotranspiration within the boundaries of the scheme
compared to the total volume of water diverted at the intake to the
irrigation system.
• For the purpose of clarification the use or reuse of
conveyance, distribution or conveyance losses may relate to pumping
from groundwater, direct use of seepage water, or other form of beneficial
reuse within the boundaries of the scheme.
• The improvement of the water use efficiency shall be measured against a
baseline determined from a standardised survey of scheme
performance, and subsequent seasonal and annual measurements as set
out in the baseline survey protocol and report”

NWUEISP Framework

NWUEISP Rationale and Framework
Monitor evaluate implementation and outcomes
Implementation of the identified solutions
Identification of the feasible solution
Analysing the problem
Collecting and processing data
Identifying key indicators
Identifying core processes
Setting the boundaries
Define the problem
NWUEISP FRAMEWORK
Rationale: To develop standardized pathway for sustainable irrigation supplies that
improves WUE and boosts production of MMI projects in a holistic manner

WUE Perceptions
Discipline Main area(s) of
interest (system)
Performance measures
Irrigation and
drainage
engineer
Irrigation and
drainage system
Conditions of infrastructure and volume, timing,
quality and cost of water delivery
Irrigation
agronomist
Irrigated
agriculture system
Crop production, soil condition and crop
marketing
Agriculture
economist
Agriculture
economic system
Economic and financial value of the crop
production, crop and farm budget, farmer
livelihood
Economist Rural economic
system
Economic development, value of the rural
production, community livelihoods and rural
poverty
Political
scientist/
Sociologist
Politico-economic
system
Employment, livelihood and rural poverty, social
welfare, community participation/ engagement
Farmer All systems Water delivery, agriculture production,
livelihood, crop and farm budgets, market
opportunities, sustainability and security of
farming systems
Defining the problem: • Clear without ambiguity
• Problems being multi
dimensioned people often
have different perception
• Overall objectivity is
improved productivity
• Need to define outcomes
at this stage itself
Setting boundaries:• Identify and fix boundaries
- Physical system; spatial and temporal dimensions
- Other; policy, institutional, social, economic, environmental, ecological
- Stakeholders perspectives

Core Processes

Core area key indicators
Performance Indicators Water
allocation per unit area
Water availability
Water allocations
Head regulator capacity
Supply response to demand
Etc.
Conveyance and distribution efficiency
Canal Capacity
Etc.
Application efficiency
Etc.
Rainfall
Depth to GW
GW quality
GW application
Crop yield
Productivity (Kg/m3)
Fee recovery
Etc.
Depth to water table
Salt balance
Etc.
Outputs of each process stage Water
allocations made
Water diverted according to plan
Water delivered (reliable , adequate, timely, equitable)
Root-zone filled
CWR met
Root zone filled
Area drained
Crop produced
Family food needs met
Income generated
ISF paid
Excess water removed
Safe depth to water table
Salt content controlled
Scheme objectives and desired outcomes Crop production and productivity
Water conservation and reuse
Social equity
Economic development and poverty alleviation
Environmental sustainability
Storage Diver-
sion
Conveyance &
distribution Appli-
cation
Agriculture production
& Marketing
Drain-age
Rainfall
Groundwater

Data Collection and Analysis
Gathering baseline information (FAO-MASSCOT)• Assessing system performance (RAP) through rapid system diagnosis
• Systematically and quickly identify the key baseline indicators
• Mobilize stakeholders to prioritize modernization improvements
• Examine physical capacity and sensitivity of the irrigation structures to perform their
functions of conveyance, control, measurement
• Assessing of and mapping the sensitivity of critical irrigation structures (offtakes and cross-
regulators)
• Record the perturbations (water level fluctuations) – examine causes, magnitudes,
frequency and options
• The networks and water balances of surface and ground water availability and use - gauge
constraints
• Mapping the cost of O&M – current costs of operational techniques, services, core
elements and processes, and also costs of improvements
Vision of service-orientated management and modernization of canal operation• Mapping the service to users
• The management units performance
• The demand for operation and allocations required
• The options for canal operation improvements/units
• Integration of service-orientated management (SOM) options
• Vision for a modernization plan, M&E

Suggested Analytical Tools
Benchmarking Benchmarking based on FAO RAP approach
Focus Group
Discussions
(FGDs)
Quick non-quantitative assessment of current farming systems, constraints and
indicative responses to possible initiatives
Participatory
Rural Approach
(PRA)
More detailed structured and detailed surveys including some quantitative assessment
of constraints, issues and responses to possible initiatives
Sample area
profiling
Semi-detailed studies in a sample areas including infrastructure, agriculture and social
and institution as in conjunction with FGDs
Medium and
detailed level
remote sensing
Quick analysis of land-use from freely available medium resolution imageries over 5
schemes
Pilot analysis over a selected area using high detail analysis to assess crop
productivity
Sub-basin water
balance
Scheme water balance of both surface and sub-surface sysems
Institutional and
technical
analysis
Compiling and integrating the outputs of RAP and PRA including costs
Improved water
management
Prefeasibility plans to assess options and present proposals to improve water
management and agriculture
Preliminary
plans for water
management
Preliminary plans for scheme modernization and increase efficiencies;
Report

NWUEISP Framework – Analysing for concerns
Physical
Inadequate Irrigation and Drainage Infrastructure
Irrigation design not matching current needs Inadequate maintenance
Systems designed for protective irrigation Faulty design; Changed hydrology Lack of or incomplete CAD works Lack of control and measuring structures
Insufficient funds Constrained system operation Need based budgeting not available Asset management plans not adhered to Routine maintainace by WUAs absent
Non-Physical
Inadequate management and operation of main system
Inadequate management Inadequate Operation
IDs focus on construction IDs Non accountable to WUAs IDs not multi-disciplinary Lack of participation of stakeholders and users Outdated and non-maintained records Lack of MOM Inadequate performance measurement and
accountability
Outdated data collection and processing methods
Lack of knowledge and skills Demand-supply mismatch No control on measurement Water charges not linked to service delivery Poor service fee collection
Inadequate management and operation of distributionsystem
Inadequate management Inadequate operation
Large number of small holdings Top-down PIM Acts need review Inadequate WUA formation and support Where formed WUAs not functioning Lack or inadequate control over funds constraints
service delivery
Poor water distribution Lack of WUA field staff (field masters) lack of water management knowledge and
skills Low level of adoption o f modern technology
by farmers
Inadequate capacity building and training services
Inadequate capacity building and training services
Poor performing WALMIs CADAs not functioning under I&Ds Limited number of experienced NGOs Limited water management extension services

NWUEISP Framework – Identifying solutions

19

NWUEISP Framework – Implementing identified solutions
Cost (financial, resources, effort, etc.)
Low High
Low
High
Imp
act
-Im
pro
ve
me
nt
in W
ate
r U
se
E
ffic
ien
cy
az
b
cps
m
j Identified Action
“Low hanging fruit” - Low cost, high return quadrant)
Identify cost effective measures

Sustainability of operations – Improving Service Delivery
Concept encompasses:
• ID/private player responsible
for service delivery and
scheme performance
• Focus on productive irrigated
agriculture
• Improved scheduling to match
supply and demand
• Linking service delivery to fee
collection
• Using modern technology –
Remote sensing for crop area
and ET, GIS, MIS, SMS linked
to web pages, etc.
SC
Payment
ServiceS - Specification
C - Conditions
Service Agreement
Service Provider
Water User
• SCADA followed by DSS
• Improved control and measurement (linked to scheduling)
• Adequate maintenance budget (linked to service delivery)
• Partnership with water users (through WUAs)
• Plan and manage for conjunctive use
• Supported by effective education and training
Economic viability, Cost, EIRR, B/C

Pilot Testing of the Framework

Pilot testing the framework
• Frame work tested on Dharoi (Gujarat) and Sanjay Sarovar (MP) irrigation projects
Modernization Proposals –
Infrastructure, Energy, Agriculture, Institutions etc.
Strategic Planning and Feasibility Analysis
Participatory Rural Appraisals/Consultation
Benchmarking, Water Balances, Remote
Sensing
Focus Group Discussions and Key
Interviews
Data Collection and Analysis
Analytical approach for pilot testing

Estimating Productivity of WaterData Collection and Analysis
• GIS mapping and assessment of command area,
crop area and crops sown
• Assessment of surface and ground water resources
and water diverted
• Assessment of productivity of water through remote
sensing for different crops under branch canals
Histograms of mean NDVI and surface
area per NDVI class
Productivity of Water - can be expressed
as total biomass production or crop yield
per unit of water”
‘Surface Energy Balance Algorithm
for Land’ (SEBAL) is used with high
resolution Landsat Imagery as input
and observed for a full season.
NDVI – Normalized Difference visible Index

(i) Mean NDVI (ii) Total ET (mm)
(iii) Total biomass (ton/ha) (iv) POW-biomass (kg/m3)
Mean NDVITotal ET (mm)
Total Biomass (ton/ha) POW-biomass (kg/m3)
Estimating Productivity of Water
Dharoi irrigation Project

Estimating Productivity of Water
Key performance indicators DIP SSIP
Wheat productivity of water (POW) (kg/m3) (World avg. 0.6 -1.9 kg.m3) 0.9 0.8
Average wheat yield (ton/ha) 3.05 2.9
Paddy productivity of water (POW) (kg/m3) (World avg. 0.5 -1.1 kg.m3) - 0.88
Average paddy yield (ton/ha) - 4,5
Bhimgarh Br. wheat productivity of water (POW) (kg/m3) (World avg. 0.6 -1.9
kg.m3)- >0.9
Bhimgarh Br. average wheat yield (ton/ha) - 3.5
Tail-end Wheat productivity of water (POW) (kg/m3) (World avg. 0.6 -1.9 kg.m3) - 0.7
Main canal level total water consumption Mm3 (Mm3/day)
0.9 (6.4)
(LBMC)
930.6 (5.8)
(RBMC)
304
(1.9)TBS
289 (1.6) DS
Cotton (seed +lint) productivity of water (POW) (kg/m3) 0.9 -
Cotton (seed +lint) average yield (ton/ha) 2.95 -
Fennel seed productivity of water (POW) (kg/m3) 0.8 -
Fennel (seed) average yield (ton/ha) 2.5 -
Castor oil (seed) productivity of water (POW) (kg/m3) 0.8 -
Castor oil (seed) average yield (ton/ha) 3.95 -
TBS: Tilwara Branch Scheme and DS: Dhuty Scheme under SSIP and LBMC: Left Bank Main Canal; RBMC:
Right Bank Main Canal under DIP

Baseline internal indicators
Data collection and analysis
• RAP results for performance benchmarking
Indicators assigned to a
scale of 0 to 4:
• 0 for least desirable &
• 4 for most desirable
Main Canal DIP SSIPCross regulator hardware (main canal) 2.4 0.9Turnouts from the main canal 2.8 1.5Regulating reservoirs in the main canal 0.0 0.0Communications for the main canal 2.9 2.5General conditions for the main canal 2.3 1.2Operation of the main canal 2.4 1.9
Second-level CanalsCross regulator hardware (second-level canals) 2.3 1.4Turnouts from the second-level canals 2.5 1.3Regulating reservoirs in the second-level canals 0.0 0.0Communications for the second-level canal 3.0 2.6General conditions for the second-level canals 1.7 1.2Operation of the second-level canals 2.4 1.6
Third-level CanalsCross regulator hardware (third-level canals) - -Turnouts from the third-level canals 1.3 1.0Regulating reservoirs in the third-level canals 0.0 0.0Communications for the third-level canals 2.7 2.5General conditions for the third-level canals 1.8 1.3Operation of the third-level canals 2.7 1.0

Baseline external indicatorsKey Indicator* DIP SSIP
Service delivery parameter
Annual project delivery efficiency % 67 41
Annual field irrigation efficiency% 44 51
Total annual volume of irrigation water delivery (Mm3/year) 443 391
Annual irrigation water delivery per unit command area (m3/ha) 6498 5521
Annual irrigation water delivery per unit irrigated area (m3/ha) 4825 5111
Maim system water delivery efficiency% 85 75
Annual relative water supply 2.62 5.01
Annual relative irrigation supply 1.68 2.79
Water delivery capacity 1.48 2.31
Cropping intensity % 1.35 108
Security of entitlement supply % 100 100
Financial
Cost recovery ratio 0.06 0.11
Maintenance cost to revenue ratio 5.05 0.57
Total O&M cost per unit area (US$/ha) 66 19
Total cost per person employed on water delivery (US$/person) 1307 1220
Revenue collection performance 0.85 0.60
Staffing number per unit area (persons/ha) 0.009 0.0113
Average revenue per cubic meter of irrigation water supplied (US$/m3) 0.0009 0.0005
Productive efficiency
Total gross annual agricultural production (tons) 833, 580 248,150
Total annual value of agriculture production (US$) 340,283,333 80,576,667
Output per unit service area (US$/ha) 3574 853
Output per unit irrigated area (US$/ha) 2654 790
Output per unit irrigated supply (US$/ha) 0.436 0.155
Output per unit water consumed (US$/ha) 0.662 0.243
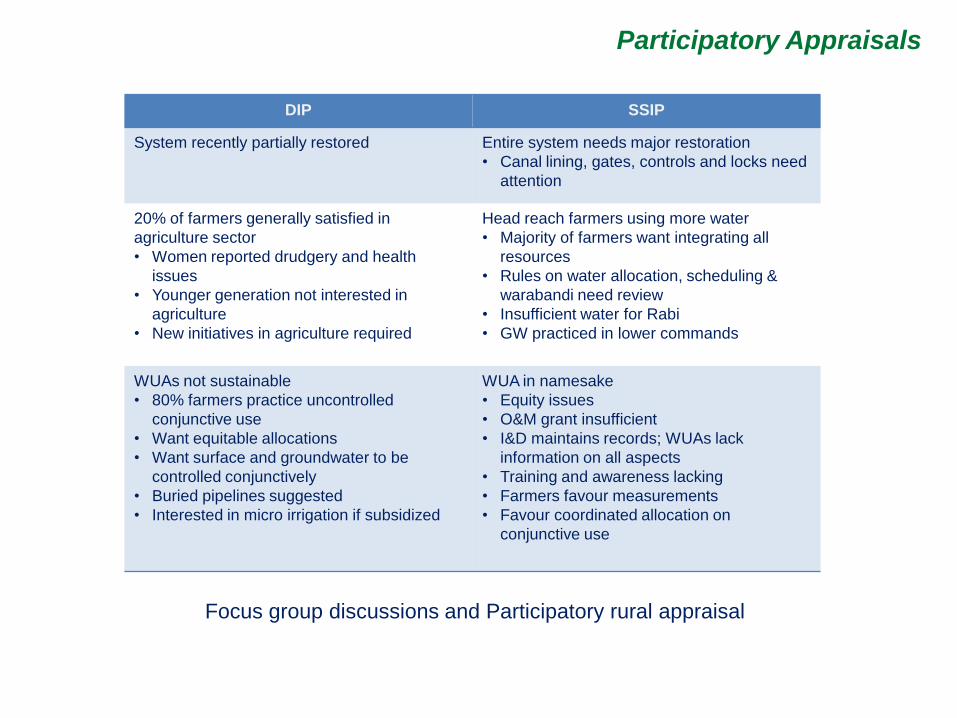
Participatory Appraisals
Focus group discussions and Participatory rural appraisal
DIP SSIP
System recently partially restored Entire system needs major restoration
• Canal lining, gates, controls and locks need
attention
20% of farmers generally satisfied in
agriculture sector
• Women reported drudgery and health
issues
• Younger generation not interested in
agriculture
• New initiatives in agriculture required
Head reach farmers using more water
• Majority of farmers want integrating all
resources
• Rules on water allocation, scheduling &
warabandi need review
• Insufficient water for Rabi
• GW practiced in lower commands
WUAs not sustainable
• 80% farmers practice uncontrolled
conjunctive use
• Want equitable allocations
• Want surface and groundwater to be
controlled conjunctively
• Buried pipelines suggested
• Interested in micro irrigation if subsidized
WUA in namesake
• Equity issues
• O&M grant insufficient
• I&D maintains records; WUAs lack
information on all aspects
• Training and awareness lacking
• Farmers favour measurements
• Favour coordinated allocation on
conjunctive use

Feasible Options
DIP SSIP
Canal
Infrastructure
• Technical and financial assistance needed for repairs
and fully functional canal operations
• Currently LBC area is under expansion – 15% canal
efficiency savings to be diverted here
• Technical and financial assistance needed for repairs
and fully functional canal operations
Area under
surface irrigation
• Expansion of CCA caused stress on resources –
allocations need revision
• Expansion of area suggested from savings through
improved efficiencies
Ground water
irrigation
• Abstraction from deep aquifer is key issue – needs
changes in abstraction strategies
• Upper area has limited scope on GW use – savings to
be used in the lower left area
Pumped
irrigation
• Pumping costs are high – use of prepaid meters
suggested
• Micro irrigation is recommended to partial area
• Micro irrigation planned in partial area
Water User
Associations
• WUAS need and willing to manage all resources –
training and capacity building is a concern area
• Possibility of PP management systems at and below
tertiary level to be examined
• Parallel farmers organizations suggested
• WUAs never had or allowed adequate governance –
insufficient funds for O&M
• Parallel farmers organizations suggested
Agriculture • Very high level of disillusion in traditional agriculture-
newer initiatives needed to increase agricultural
viability
• Crop failure is common - Farmers need support in
upper area to develop low water intensive Rabi crops
Water
Management
• Surface water delivery is poor (BM score 2 out of 4) –
conserving and controlled GW use is the key solution
• Systematic recharge and conjunctive use essential to
introduce Dhuty LBS expansion
Energy
Management
• Metered energy is key to control GW supplies – micro
irrigation will enhance energy requirements
• Solar power plant would be needed to enhance the
energy demand due to micro irrigation and
conjunctive use
O&M costs • Increased financial resources required – need to
change future funding strategies
• Increased financial resources required – need to
change future funding strategies
Management
Agreements
• Conjunctive water resource management an essential
requirement for long-term sustainability
• Significant upgrade in the management capacities is
required

Proposals & investment options
Proposals for modernization of DIP and SSIP
• Three scenarios examined
– Current scenario
– Upgraded Scenarios
• Option-1: Modernization of surface water system including
improved surface water management
• Option-2: Modernization of surface and ground water together
with increased cultivation, conjunctive use management and
partial piped and micro-irrigation
• Innovations and investment plans examined
– Data collection and examination, including monitoring
– Infrastructure upgradation including SCADA
– Piped and micro irrigation with prepaid metering
– O&M costs
– Agriculture support and extension
– Pilot recharge for GW management
– Proposal for solar energy including solar power plants
– Reviewed institutional and management framework
– Training and awareness
• Economical and financial analysis
– EIRR and sensitivity of results

Pilot testing of the framework – Recommended interventions
Interventions recommended for modernization of DIP and SSIP• Use of low cost remote sensing for water management applications and
high resolution for bio-mass productivity assessment
• Upgrade physical system to achieve high levels of WUE of canal system
• Expand and integrate ground water use
• Necessary schedules for surface and ground water joint use
• Introduce energy management for control and management of ground water;
insist pre-metering
• Cost recovery to be based on ground water use through hours of pumping
• Outsource management functions and establish long term financially
sustainable irrigation management organizations; improve institutional
capacities
• IDs to take nodal lead; effective IMO to manage project activities
• Wherever possible involve private players, NGOs, WUAs
• Water allocation against demands and sustainable service delivery to be the
main feature of the project
• Integrate sustainable agriculture support services in the entire agriculture
chain
• Intensive training and awareness programmes for stakeholders
• Coordinated and effective management of various management levels
through irrigation coordinated committees with support of local
communities, agriculture department and extension, law enforcers, WUAs
and IMO

Conclusions
“While NWUEISP framework emphasized importance of
performance assessment through WUE indices and bench
marking as a management tool for boosting productivity of
MMI, its pilot testing demonstrated effectiveness and
replicability of the NWUEISP framework; interventions
identified and economic analysis carried out”
Current SW interventions SW & GW interventions
DIP
CCA (ha) 80426 148520 163500 +25000 under
micro irrigation (MI)
WUE % 44% 51% 56%
SSIP
CCA (ha) 45300 53300 58000 with diversion to
new area + MI
WUE (%) 40% 46% 61%
Likely WUE improvements

Thanks for
Patient Listening