increasing share of non-participating business in india – systemic risks associated with it...
TRANSCRIPT

Increasing share of non-participating business in India – systemic risks
associated with it
Archana Anoor, Rahul Khandelwal and Rutika Kumar
Guide: Philip Jackson

Agenda
• Introduction
• Life insurance business evolution in India – changes in business mix
• Systemic risk – Definition & triggers– Macro-level– Insurance business (non-par, in particular)– Mitigation Measures

History of Par and Non- Par in India
20002000
20002001
20012001
20022002
20022003
20032003
20042004
20044.0
5.0
6.0
7.0
8.0
9.0
10.0
11.0
12.0
0
1000
2000
3000
4000
5000
6000
700010 yr Gsec Yield Vs Sensex
10 Year YieldSensex
Yiel
d
Sens
ex
Sources: IRDA Journal, BSE Sensex website, RBI website, Research Report of Miliman
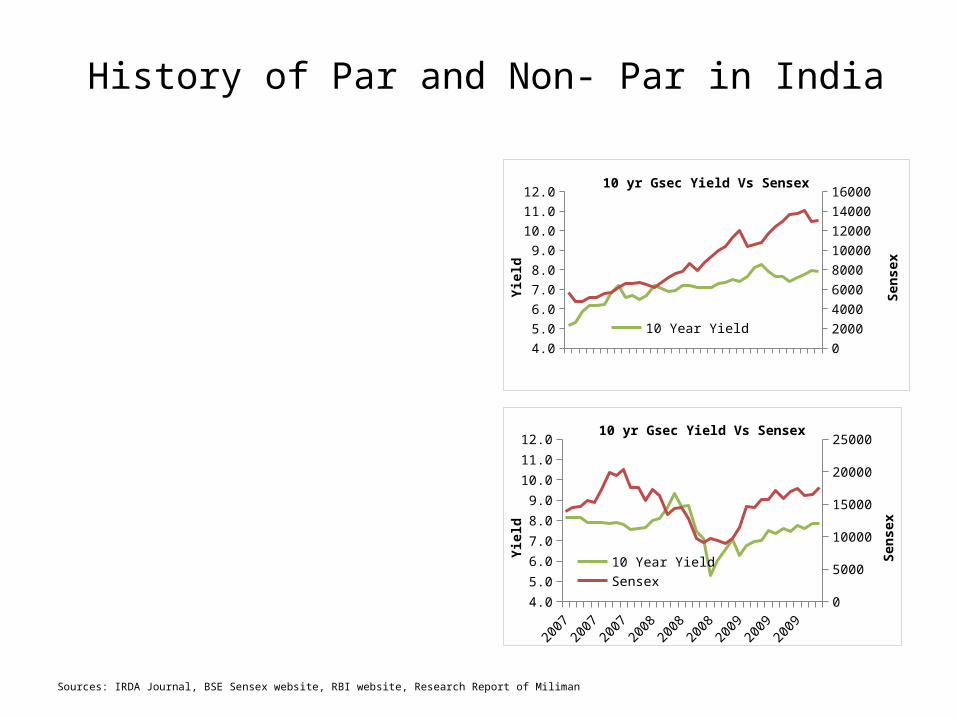
History of Par and Non- Par in India
20042004
20042005
20052005
20052006
20062006
20062007
4.05.06.07.08.09.0
10.011.012.0
0200040006000800010000120001400016000
10 yr Gsec Yield Vs Sensex
10 Year Yield Sensex
Yiel
d
Sens
ex
20072007
20072008
20082008
20082009
20092009
20092010
4.0
5.0
6.0
7.0
8.0
9.0
10.0
11.0
12.0
0
5000
10000
15000
20000
2500010 yr Gsec Yield Vs Sensex
10 Year YieldSensex
Yiel
d
Sens
ex
Sources: IRDA Journal, BSE Sensex website, RBI website, Research Report of Miliman

History of Par and Non- Par in India
20112011
20112011
20112011
20112011
20112012
20122012
4.05.06.07.08.09.0
10.011.012.0
0
5000
10000
15000
20000
25000
10 yr Gsec Yield Vs Sensex
10 Year Yield Sensex
Yiel
d
Sens
ex
2009-10 2010-11 2011-120%
20%
40%
60%
80%
100%
NB Premium
non par (link) non par (non link) Par
Sources: IRDA Segment wise data, BSE Sensex website, RBI website

History of Par and Non- Par in India
Sources: IRDA Journal
2010 - 11 2011 - 12 2012 - 130%
10%20%30%40%50%60%70%80%90%
100%
Tot Value of Investment under various fund – LIC
2010 - 11 2011 - 12 2012 - 130%
10%20%30%40%50%60%70%80%90%
100%
Tot Value of Investment under various fund – Private
UL fund Pension and GA & GF Life Fund

History of Par and Non- Par in IndiaFrom 2013 to Now
4.05.06.07.08.09.0
10.011.012.0
0
5000
10000
15000
20000
25000
3000010 yr Gsec Yield Vs Sensex
10 Year YieldSensex
Yiel
d
Sens
ex
Prospective Regulation - ‘0% customer IRR on Par and Illustrated MB of 90% of premiums paid on ULIPs @4%’• Easier to illustrate for ULIPs - less guarantees than par • More obvious for non par savings contracts (not a reg requirement) • Move towards non-par is expected.
Sources: BSE Sensex website, RBI website

Systemic Risk
Image source: http://www.gardalundur.is/g/images/stories/domino-effect.jpg

Systemic risk

Indicators of systemic Risk

Conclusions of Geneva association Systemic Risk Working Group
Source: FSB, IAIS

Do the findings apply to Indian insurance industry?
Size: Volume of financial services provided by the individual component of the financial system
If LIC is listed it could be the most valuable Indian company at Rs.4.5 – 5 lakh crore (Business Standard, June 2014)
If above metrics are aggregated for all insurers the impact will be higher

Do the findings apply to Indian insurance industry? (contd)

Do the findings apply to Indian insurance industry? (contd)

Sources of systemic risk – insurance industry

Systemic risk – insurance industry
* International Financial Services Research, Oct 2009

Systemic risk – insurance industry

Systemic risk – insurance industry

Systemic risk – insurance industry

Systemic risk – insurance industry

Systemic risk – insurance industry

Systemic risk – insurance industry

Systemic Risk – manage/mitigate?

Systemic risk mitigation measures

Questions?

Appendix: Sources/Reference