increasing insurance penetration in ghana: the …
TRANSCRIPT

INCREASING INSURANCE PENETRATION IN GHANA:
THE CHALLENGES AND STRATEGIES

i
TABLE OF CONTENTS
TABLE OF CONTENTS ............................................................................................................. i
LIST OF ABBREVIATIONS AND ACRONYMS .........................................................................iii
LIST OF TABLES ......................................................................................................................iv
LIST OF FIGURES .................................................................................................................... v
EXECUTIVE SUMMARY ......................................................................................................... viii
SECTION 1: INTRODUCTION AND BACKGROUND ............................................................... 1
1.1 Introduction ................................................................................................................................. 1
1.2 Background ................................................................................................................................. 1
1.3The objectives of the research ................................................................................................... 2
1.4 Methodology ............................................................................................................................... 2
SECTION 2: SUMMARY REVIEW ON INSURANCE IN GHANA .............................................. 4
2.1 Introduction ................................................................................................................................. 4
2.2 Brief overview of the Ghanaian insurance industry ................................................................. 4
2.2.2 Current development in the insurance industry of Ghana ............................................... 8
2.3 Stakeholders in the Ghanaian insurance industry ................................................................. 10
2.4 Insurance penetration in Ghana .............................................................................................. 12
2.4.1 Current coverage and penetration ................................................................................... 12
2.4.2 Current insurance penetration .......................................................................................... 12
2.4.3 Industry total asset and growth ........................................................................................ 16
2.5 Challenges facing the Insurance Industry .............................................................................. 17
2.5.1 Challenges in marketing ................................................................................................... 17
2.5.2 Challenges facing the insured public and stakeholders in the insurance industry ...... 18
SECTION 3.0: PRELIMINARY FINDINGS ................................................................................20
3.1 Introduction ............................................................................................................................... 20

ii
3.2 General background and characteristics of insurance companies ...................................... 20
3.2.1 Information on Insurer ....................................................................................................... 21
3.2.2 Insurance Activities ........................................................................................................... 24
3.2.3 Insurance Outlook ............................................................................................................. 44
3.2.4 Challenges in Insurance Marketing and Selling of insurance products ........................ 49
3.2.5 Supervisory Challenges .................................................................................................... 50
3.2.6 Marketing Strategy ............................................................................................................ 52
3.2.7 Industry Condition .............................................................................................................. 53
3.2.8 Insurance Sustainability .................................................................................................... 56
3.2.9 Organizational Information................................................................................................ 58
SECTION 4.0: RECOMMENDATIONS .....................................................................................64

iii
LIST OF ABBREVIATIONS AND ACRONYMS
GDP Gross Domestic Product
NIC National Insurance Commission
SPSS
IAIS
CDD
EDD
AML
CFT
ICP
GIC
GIA
GIBA
GIZ
MID
IPSA
GOGIP
RBS
FATF
ML
TF
Statistical Package for Social Sciences
International Association of Insurance Supervisors
Customer Due Diligence
Enhance Due Diligence
Anti-Money Laundering
Countering the Financing of Terrorism
Insurance Core Principles
Ghana Insurance College
Ghana Insurance Association
Ghana Insurance Brokers Association
The Deutsche Gesellschaft für Internationale
Zusammenarbeit GmbH
Motor Insurance Database
International Public Sector Accounting
Ghana Oil and Gas Insurance Pool
Risk Based Supervision
Financial Action Task Force
Money Laundering
Terrorist Financing

iv
LIST OF TABLES
Table 1: Insurance growth from 2013 to 2018 ........................................................................... 9
Table 2: Number of insurance companies and intermediaries ..................................................11
Table 3: Premium income growth .............................................................................................16
Table 4: Growth rate in assets as of 2018 ................................................................................16
Table 5:Number of branches in rural areas ...............................................................................21
Table 6: Number of branches in Urban Areas ...........................................................................21
Table 7: How long has the organization been in existence .......................................................23
Table 8:Challenges in insurance marketing and selling ............................................................49
Table 9:Supervisory challenges ................................................................................................50
Table 10:Marketing strategy for insurance in Ghana ................................................................52

v
LIST OF FIGURES
Figure 1: Design of the research ........................................................................................................ 3
Figure 2: Year-Premium in the Ghanaian insurance industry from 2013 to 2018 ........................ 10
Figure 3: Total number of branches for insurance companies in Ghana ...................................... 22
Figure 4:Type of insurance activity .................................................................................................. 24
Figure 5:Class of insurance products sold by life companies ........................................................ 24
Figure 6:Class of Non-Life products sold by Non-Life Companies ............................................... 25
Figure 7:Class of Non-Life products sold by brokers ..................................................................... 26
Figure 8:Fastest Growing Life Products .......................................................................................... 26
Figure 9:Fastest growing Non-Life Products for Non-Life companies .......................................... 27
Figure 10:Fastest growing Non-Life Products for Brokers ............................................................. 28
Figure 11:Fastest growing Non-Life Products for Reinurers .......................................................... 28
Figure 12:Slowest Life Product ........................................................................................................ 29
Figure 13:Slowest Non-Life Product for Non-Life companies. ....................................................... 30
Figure 14:Slowest Non-Life Product for Broking firms. .................................................................. 31
Figure 15:Slowest Non-Life Product for Reinsurers. ...................................................................... 31
Figure 16:Most profitable life product .............................................................................................. 32
Figure 17:Most profitable Non-Life product for Non-life companies .............................................. 33
Figure 18:Most profitable Non-Life product for Brokers. ................................................................ 33
Figure 19:Most profitable Non-Life product Reinsurers ................................................................. 34
Figure 20:Least Profitable Life Product ........................................................................................... 35
Figure 21:Least profitable Non-Life products for Broking Firms (Brokers) ................................... 36
Figure 22: Least profitable Non-Life products for Non- Life companies ....................................... 36
Figure 23:Least profitable Non-Life products- Non-life, Brokers and Reinsurers ........................ 37
Figure 24:Mode of selling insurance ................................................................................................ 37
Figure 25:Fastest growing distribution channel .............................................................................. 38
Figure 26: Mode of selling insurance products in rural areas(Life companies) ............................ 39
Figure 27: Mode of selling insurance products in rural areas(Non-Life companies) .................... 40
Figure 28:Mode of selling insurance products in rural areas (Broking Firms) .............................. 40
Figure 29:Mode of selling insurance products in urban areas(Life companies) .......................... 41
Figure 30:Mode of selling insurance products in urban areas(Non-Life companies) ................. 42
Figure 31:Mode of selling insurance products in urban areas(Broking firm) ............................... 42

vi
Figure 32:Language used in Selling Insurance............................................................................... 43
Figure 33:Language used in selling insurance in Rural Areas ...................................................... 43
Figure 34:Language used in selling insurance in Urban areas ..................................................... 44
Figure 35:Compared to previous years, insurance premiums are currently low .......................... 45
Figure 36:Over the next 12 months, insurance prices are likely to remain stable or increase ... 45
Figure 37:Insurance profitability is currently low ............................................................................. 46
Figure 38:Over the next 12 months, insurance profitability is likely to remain stable or increase
.............................................................................................................................................................. 46
Figure 39: Over the next 12 months, my organization intends to increase the number of
branches for selling insurance ........................................................................................................... 47
Figure 40:Over the next 12 months, my organization intends to introduce new products to the
Ghanaian insurance market ............................................................................................................... 47
Figure 41:Over the next 12 months, my organization will increase the number of staff .............. 48
Figure 42:Investment in sales force ................................................................................................. 53
Figure 43:Expenditure on charity activities in the society .............................................................. 53
Figure 44:Maintenance of higher quality standards for reputation purposes ............................... 54
Figure 45:Budgetary allocation for sales and marketing department............................................ 54
Figure 46:Reputation for quick claims settlement ........................................................................... 54
Figure 47:Use the media as a marketing tool ................................................................................. 55
Figure 48:Online selling .................................................................................................................... 55
Figure 49:Syndication of insurance to handle bigger risks ............................................................ 55
Figure 50:Rate of return on insurance product to other investment is low ................................... 56
Figure 51: There is low levels of market research in the insurance industry ............................... 56
Figure 52:There is the existence of premium undercutting ............................................................ 57
Figure 53:There is increasing levels of direct sabotage, industrial espionage and poaching of
customers by competitors .................................................................................................................. 57
Figure 54:There is frequent occurrence of fraud in the insurance industry .................................. 57
Figure 55:There is unfavorable competition between local and foreign insurance companies .. 58
Figure 56:Ownership structure of Insurance Companies ............................................................... 58
Figure 57:How long has your organization been in existence ....................................................... 59
Figure 58:How long has your organization been in existence ....................................................... 60
Figure 59: How long has your organization been in existence ...................................................... 60

vii
Figure 60: Staff strength of Life Companies .................................................................................... 61
Figure 61:Staff strength for Non-Life companies ............................................................................ 61
Figure 62:Staff strength for Broking firms ........................................................................................ 62
Figure 63:Staff strength for Reinsurance Companies .................................................................... 62
Figure 64:Staff strength for Reinsurance Brokers .......................................................................... 63

viii
EXECUTIVE SUMMARY
This research broadens the understanding of issues relating to insurance penetration in Ghana
by specifically, highlighting the antecedents of the low insurance penetration and coming out with
recommendations from insurance stakeholders to reverse this. It is important to state that, in
developing countries like Luxembourg, with GDP of more than $70Billion, insurance penetration
as at 2017 was 38.8%. This is followed by countries like Hong Kong/China and Ireland with
insurance penetration rate of 17.9% and 13.6% respectively. In Africa, South Africa has the
highest level of insurance penetration (16.99%) followed by Namibia (6.69%) and Lesotho
(4.76%) with Ghana hovering around 1% as at 2018. It is important to state that, there are
differences in the calculation of insurance premium. In the case of Ghana, the calculation
excludes pension and health insurance as this is not the case for some countries. This makes the
the role of stakeholders in the insurance industry imperative in increasing the level of penetration.
This study therefore offered an insight into the challenges and strategies to increase insurance
penetration with regards to all the various types of insurance companies.
The results of the study revealed that, delays in the payment of claims and the repudiation of
legitimate claims by insurance companies have led to a situation in which the public does not trust
the insurance sector and has a poor perception about insurance in our country. This reputation
has not helped the efforts to increase the patronage of insurance and also the number of branches
of insurance companies massively contributes to the rate of insurance penetration in the country,
as it serves as access points to make the public aware of what insurance entails, and from these
results, the number of branches from life down to reinsurance brokers are very limited, and this
contributes to the low insurance rate in the country.
Specifically, for non-life insurance companies, more than 50% is owned by foreigners and about
42.9% owned by citizens of the country. 4.8% of Life companies in the country are state owned.
Most of these companies have more than 81 employees working with their organization. For life
companies, bancassurance is also growing and is somehow an effective way for selling insurance
products. This mode of selling insurance is likely to develop because it has the potential of
marketing insurance products, making it accessible and convenient.

ix
With non-life companies, the number of branches dominating in the system currently, is between
1-5 branches and 11-15 branches. Most of them have about 1-20 employees working with their
organization. All the reinsurance companies have just between 1-5 branches. Reinsurers consider
fire insurance to be the least profitable because most household fire insurance policies are not
reinsured with them.
Brokers, according to the results, are recorded as the highest type of insurance activity in the
country, with a percentage of 52.3%. This comes as no surprise as this result is in line with results
from the NIC annual report, with 83 broking companies (they have the highest number of
insurance companies recorded in Ghana). For brokers, the methods used the most for marketing
insurance is other Broking Firms (Brokers) and also followed by the use of direct sales.
Generally, most of the insurance company argue that the competition between the Private foreign
firms and the private local firms is not favorable at all. This is because most of the private foreign
firms tend to get aid and financial support from their other branches abroad, so settling claims are
quite easy for them even if they are not earning much return from their premiums. This can’t be
said for private local firms hence creating much competition between them because consumers
tend to patronize from the private foreign firms. Also most insurance companies complain that
they are being sabotaged by their fellow insurance companies and when this happens they tend
to lose most of their customers.
According to the results, full time agents, brokers and direct sales came out as the most used
modes for selling insurance for life and Non-life companies. These channels are the most effective
means for selling insurance products. Reinsurers made use of both brokers and direct sales as
their mode of selling insurance. Brokers are the fastest growing distribution channels for Life and
Non-life companies, because most clients see brokers as highly trained and as experts in
insurance who would recommend the right insurance package or policy for clients. This tends to
make the work of these insurance companies easier and this increases the amount of profit made;
which leads to an increase in insurance penetration. The fastest growing distribution channels for
brokers are part time agents. Reinsurers claimed full time agents as their fastest growing
distribution channel.
Most of the insurance companies attested to the fact that, if about four to five of them come
together to form a consortium or syndicate in order to be able to insure bigger risk, it will improve
the marketing and selling of insurance products.

x
In the rural areas, Life and Non-life insurance companies mostly use Individual/Tied Agents as
their mode of selling insurance since most insurance products do not sell in rural areas. They tend
to sell their policies through individual/tied agents which also helps with insurance penetration in
the rural areas, but at a lower rate because using agents alone won’t be sufficient enough to reach
out to all those in the rural areas to market insurance products. Also, brokers make use of direct
businesses the most to sell insurance products, followed by individual /tied agents and brokers.
In urban areas, life companies sell insurance mostly through individual/tied agents followed by
bancassurance, brokers and direct businesses whilst Non-life companies sell insurance products
mostly through brokers followed by direct business and individual/tied agents. All the other modes
of selling insurance are not really effective because the system in place for such modes of selling
them is not fully developed like other corporate agents and Telcos. Brokers mostly sell insurance
in urban areas through direct businesses and between themselves (other brokers). Some brokers
deal with individual /tied agents. All the other modes of selling insurance can be looked into since
they all show potentials of being the best mode of selling insurance. This can lead to an increase
in the rate of insurance penetration.
Most insurance companies agree that comparing insurance premiums this year to insurance
premiums over the years, insurance premiums hasn’t been low. This is true because total gross
premium income grew by a decent 21% from GHS2.4 billion in 2017 to GHS 2.9 billion in 2018.
Most insurance companies agree that insurance premiums are likely to be stable or better still
increase over the next 12 months, but not optimistic about insurance profitability remaining stable
or better still increasing. To increase insurance profitability, one main insurance product worthy
of consideration is marine insurance.
1
SECTION 1: INTRODUCTION AND BACKGROUND
1.1 Introduction
This research seeks to find out the challenges of insurance marketing especially to potential
insurance customers and users of insurance who fall outside the mandatory insurance such as
the compulsory commercial building, fire insurance and motor insurance. Further to this, the
views of industry players on the strategies and actions to be taken to increase penetration were
taken into consideration.
1.2 Background
The insurance market of Ghana is relatively stable with more prospects and opportunities to
explore. About 30% of the Ghanaian population is covered by insurance. The total profit that was
declared by the insurance industry by the end of 2018 was GHS 202 million and that of total
corporate tax was GHS 36 million. Total premium for 2018 in the insurance industry was given as
GHS 2,937,534,716. The market is young with 29 non-life insurance companies, 24 life insurance
companies, 3 reinsurance companies, 82 Brokerage companies, 4 Reinsurance Brokerage firms
and 3 insurance loss adjusters competing in the industry as at December, 2018.1 Insurance
penetration as a percentage to GDP in Ghana was below 1.85% at the end of first quarter of 2016
and 1.2% in the last quarter of 2017, there is a general consensus that, the sector is
underperforming. A key reason for this is that, majority of the country's workforce - the informal
sector, is put off by expensive premiums and complex underwriting processes.
According to the NIC 2018 annual report, the total assets of the insurance industry was
GHS6.2billion. It was made up of GHS3.1billion coming from the Life sector, GHS2.4billion from
the Non-Life sector and GHS0.7billion from reinsurance. The average Life daily benefit paid by
life insurers is GHS1.9 million and daily claims incurred by Non-Life companies is GHS1.1 million.
The total reinsurance premium for 2018 was stated to be GHS 255million.2
A recent Lloyds 360 risk insight study "Exploring opportunities in micro insurance" identified the
low-income segment as a potential market of effective consumers for financial services, as long
as appropriate products, processes and education are provided. It went on to note that the
simplicity of said products, procedures and policies, low premiums, efficient administration and
1 NIC 2018 Annual Report 2 NIC 2018 Annual Report

2
innovative distribution channels, render micro insurance effective even in markets with little to no
insurance experience.
Data from the World Map of Micro insurance indicates that over 7.6 million lives are now covered
by at least one micro insurance policy, however, coverage to poor farmers, traders, casual
workers in rural areas has proven difficult in urban-centric Ghana. The excessive reliance on
intermediary brokers and traditional sales agents has severely limited this delivery to rural areas.
It is against this background that, the NIC seeks to explore the challenges and strategies for
increasing insurance penetration in line with the objective of the Commission.
1.3The objectives of the research
The main objective of this research is to assess the challenges and strategies to increase
insurance penetration in Ghana. Specifically, this is achieved through
Assessing the challenges faced by insurance stakeholders in the sale and marketing of
insurance products
Assessing the antecedents of low insurance penetration
Identifying strategies and recommendations from insurance stakeholders to increase the
coverage of insurance especially to low income earners
1.4 Methodology
This section of the research presents the methodology and work plan used in the collection and
analysis of data. A descriptive research design is adopted to understand the views of industry
players. Below is the design of the research

3
Figure 1: Design of the research
Research Activities
Determination of sample size
Design of questionnaire
Review of questionanire by
other relevant department
Information to target
respondent
Data collection
Data analysis and report
Tools for data analysis
Survey instruments
SPSS
MS Excel
Data analysis
Deliverables-Research outcomes
Identification of key challenges
Strategies to implement
Recomendations to increase insurance
penetration

4
SECTION 2: SUMMARY REVIEW ON INSURANCE IN GHANA
2.1 Introduction
This section of the report reviews the concept of insurance in the context of Ghana, challenges
facing the insurance industry of Ghana, and issues relating to insurance penetration.
2.2 Brief overview of the Ghanaian insurance industry
The National Insurance Commission as the regulator is given a broad consumer protection and
prudential regulation mandate by Section 2(3) of the Act, which states that in performing its
functions under the Act, the Commission shall have regard to the protection of the public against
financial loss arising out of the dishonesty, incompetence, malpractice or insolvency of insurers
or insurance intermediaries. The Act, among other things, prohibits composite insurance
companies. All composite insurance companies, therefore, had to separate their life and non-life
operations into different companies.
Over the past few years, the National Insurance Commission (NIC) has made progress in
improving the legal and regulatory framework of the insurance industry in Ghana. Key initiatives
aimed at achieving these objectives by the NIC in recent periods include:
1. Insurance Industry Publicity Activities: The Commission has continued to maintain as one
of its objectives, the promotion of public education on insurance in general, and motor
insurance in particular. It has carried out public education programmes in a number of
cities and towns across Ghana including Kumasi, Agona Swedru, Cape Coast, Takoradi,
Tamale, Bolgatanga, Koforidua, Somanya, Kumasi, Offinso and Ejura. Major areas of
public education include: the role and functions of the NIC, Complaints & Settlement
Bureau, Motor Compensation Fund, Motor Insurance, Life Insurance, The Compulsory
Fire Insurance for Private Commercial Buildings and Buildings under Construction and
Micro Insurance.
The NIC in collaboration with the Ghana Insurance College, conducted a five (5)-day intensive
insurance agency training for ten-thousand (10,000) youth nationwide for free. The objective of
the training was to instill the necessary knowledge and background of insurance operations and
equip participants with the required basic regulatory tools.3 (The objective of this is to create jobs
by training the youth in insurance and how to sell insurance so insurance companies can recruit
3 Daily Graphic: February 15 2019

5
from this pool and in turn train them in their products to be sold). The above initiatives aim at
increasing public awareness of insurance
2. The NIC has also undertaken a number of regulatory and supervisory initiatives which
aimed at improving public confidence in the insurance industry through robust supervision
and strict legal and regulatory framework. These initiatives include:
Issuance of the Corporate Governance and Risk Management Framework in 2015.
Issuance of the Claims Management Guidelines detailing specific timelines for the
settlement and payment of Non-Life Claims.
Issuance of Market Conduct Rules on Insurance Premium Collection – “No Premium
No Cover”
Development of the framework for Group-Wide Supervision which seeks to support;
Group Wide Supervision, Macro Prudential Surveillance and Insurance Supervision
and Cross Boarder Collaboration of the Supervision of Insurance Groups that are in
more than one country.
Adoption of Risk Based Capital Requirement which seeks to ensure that the capital
requirement of an insurer commensurates with the risks the insurer faces. This will
encourage robust risk management practices in (re) insurance companies in Ghana,
as firms with robust risk management framework will hold less capital. The introduction
of the Risk Based Capital requirements is to ensure that the regulation of insurance in
Ghana is in line with international best practices.
The Commission has also issued guidelines on Know Your Customer (KYC),
Customer Due Diligence (CDD), Enhanced Due Diligence (EDD), Beneficial
Ownership, Independent Audit Assessment, Suspicious Transaction Reports, Record
Keeping and Monitoring of Employee Conduct. This is to ensure the implementation
and compliance with the Anti-Money Laundering and Countering the Financing of
Terrorism (AML/CFT) Act.
Enforcement of compulsory fire insurance of private commercial buildings.
Implementation of Solvency Framework: The New Solvency Frameworks for Life and
Non- Life insurers were issued to be used as a risk-sensitive approach to determine
the solvency of insurance companies.
Implementation of Governance and Risk Management Framework: The NIC as part of
measures to adopt the Risk-Based approach to Supervision of Insurers, developed a
Governance and Risk Management Framework to guide the operational activities of

6
insurers as well as enhance the effective supervision of the Insurance and
Reinsurance Companies.
New Insurance Act: The NIC is in the process of reviewing the Insurance Act to make
it more appropriate, given the changes witnessed in the insurance landscape. The new
Insurance bill, if passed into an Act, will be compliant with the most recent Insurance
Core Principles (ICPs) of the International Association of Insurance Supervisors (IAIS).
The frameworks, directives and guidelines that the NIC has issued in the recent past
will be included in the new Insurance Act.
3. The NIC in June 2019 announced new minimum capital requirements for the various
classes of insurance industry operators, all of whom have up to June 30, 2021 to comply,
although new entrants seeking operating licenses are required to meet the new
requirements prior to start-up. The new minimum capital requirement for insurance
companies is GHS50 million; for reinsurance companies, GHS125 million; and for
brokerages and loss adjusters, GHS500,000. Reinsurance broking firm’s minimum capital
remains at GHS1 million.
4. An Education Fund has been set up by the NIC in collaboration with stakeholders of the
insurance industry to assist the Ghana Insurance College (GIC) train industry personnel.
In line with this, the Commission provides free seminars for the industry and is training
10,000 Ghanaian youth as insurance agents nationwide.
5. The NIC with Ghana Insurers Association (GIA), Ghana Insurance Brokers Association
(GIBA) and GIZ is currently undertaking a sensitization programme on over 200 radio
stations in Ghana. This will help increase knowledge and awareness of insurance
products, claims procedures and complaints handling. This sensitization programme is
part of the activities of the Insurance Awareness Coordinators Group (IACG) which
comprises the four bodies afore-mentioned.
6. The NIC has developed a Motor Insurance Database (MID) that will be a central database
to hold the information on every insured vehicle in Ghana. The purpose of the MID is to
reduce the number of uninsured vehicles on the road, tackle the menace of fake motor
insurance, and provide a central source of information for all vehicles.
7. The NIC is currently working on a new Insurance Bill to help the growth of the industry,
bridge the gap in legislation and also be consistent with international practices. Areas to

7
be incorporated in the new Bill include the domain of Compulsory Insurance. These are
Group Life, Workmen’s Compensation, Professional Indemnity, Marine, Commercial
Buildings, and Public Liability Insurance.
8. The new Insurance Bill will also provide a comprehensive regulatory framework for micro-
insurance and for agricultural insurance. The Commission has also set up a Research
Unit to help undertake various empirical and market researches aimed at increasing
insurance penetration in Ghana.
9. In terms of international practices, the NIC has successfully implemented the International
Public Sector Accounting Standards (IPSAS) reporting framework as the basis of financial
reporting of the Commission. The Commission was recommended by the Public Accounts
Committee of Parliament at its last sitting that, other public institutions should emulate the
efficient and effective financial management practices of the Commission. The
Commission has also prepared and submitted its financial statements to the Auditor
General in line with the timeline set in the Public Financial Management Act, 2016 (Act
921). The Commission has also implemented the Risk Based Supervision (RBS) aimed
at assessing the effectiveness of controls in reducing the probability of risk events
occurring or the severity if they do occur.
10. Since 2010, local capacity and retention regarding oil and gas insurance business have
been a big challenge for the Ghanaian insurance market. In order to increase local
retention and also protect the image of the Ghana Oil and Gas Insurance Pool (GOGIP),
guidelines for placement of oil and gas insurance risks with non-life insurance and
reinsurance companies in Ghana have been issued to govern the operations of oil and
gas insurance business. This is envisioned to allow local Insurers to take on additional oil
and gas insurance risks in Ghana through a business sharing agreement.
11. At the start of 2019, the NIC presented new guidelines for running GOGIP, which
addresses key concerns from the Pool’s members which have threatened its existence.
Under the guidelines, members will be assigned a portion of a business brought to the
pool based on their role in generating that business – albeit subject to limitations based
on financial capacity - not just their relative size as hitherto had been the only

8
consideration. The new guidelines also addresses the tenors of treaties, the size of
placement commissions and reinsurance of business taken on by GOGIP.
12. Following the amendment of the Anti-Money Laundering Act in 2017 and the revision of
the Financial Action Task Force (FATF) recommendations on AML/CFT, the Financial
Intelligence Centre requested all stakeholders in the financial sector to revise their
AML/CFT Guidelines to reflect the changes thereof. Accordingly, the NIC revised its
AML/CFT Guidelines to reflect the changes made to the AML Act and FATF
recommendations. The revision was to enable the NIC enforce compliance among
regulated institutions. These guidelines will ensure that regulated entities do not allow their
institutions to be used as a conduit in engaging in Money Laundering or Terrorist Financing
activities (ML/TF). These guidelines will ultimately strengthen the fight against ML/TF, the
integrity of the financial system in Ghana and forestall any terrorist activity.
13. The NIC in collaboration with the International Monetary Fund (IMF) developed a
Supervision Manual for AML/CFT. The manual aims at enhancing the supervisory
processes of the NIC toward regulated entities.
14. In addition, several tools such as risk analysis matrix, control questionnaires, data capture
template and onsite supervision tools were developed to enable the NIC adequately
assess AML/CFT risk exposures of regulated entities. It also helps with the efficient use
of scarce regulatory resources
2.2.2 Current development in the insurance industry of Ghana
The gross premium for life insurance was GHS1.3billion in 2018 from GHS1,08billion in 2017
representing a growth rate of 20.1%. Also, for non-life insurance, there was a total gross premium
increase from GHs1.19billion in 2017 to GHs1.3billion in 2018. This represents a yearly average
growth rate of 9.3% 4. However, over the years the industry has witnessed very vigorous activity
and tremendous growth.
4 NIC 2017 Annual Report

9
For instance, total gross premium has increased from GH¢2,271,368,033 in 2017 to
GH¢2,937,534,716 in 2018. This represents a yearly average growth rate of 29%. The
contribution of gross premium to GDP, which measures insurance penetration or demand, even
though lower than the 2% benchmark, the industry seems to be doing well. The insurance
penetration was 1.12% in 2017 but reduced to 1% in 2018, the NIC asserts that, in the
computation of the level of insurance, the Commission takes into consideration only premiums
received by insurers domiciled in Ghana. Also, health insurance and contributions of pension
schemes are not included in the computation unlike some other countries with higher levels of
insurance penetration. Although the gross premium has been rising as shown in Table 1, its
growth is at reducing rate.
The industry has also recorded growth in industry total assets from GHS5.4 billion in 2017 to
GHS6.2 billion in 2018. Figures from NIC (2018) annual report also revealed that, the industry
also recorded an increase in the number of insurance entities. The number of non-life insurance
companies increased from 27 to 28, brokerage firms increased from 78 to 81. In total, the number
of regulated entities increased from 133 in 2016 to 139 in 2017.
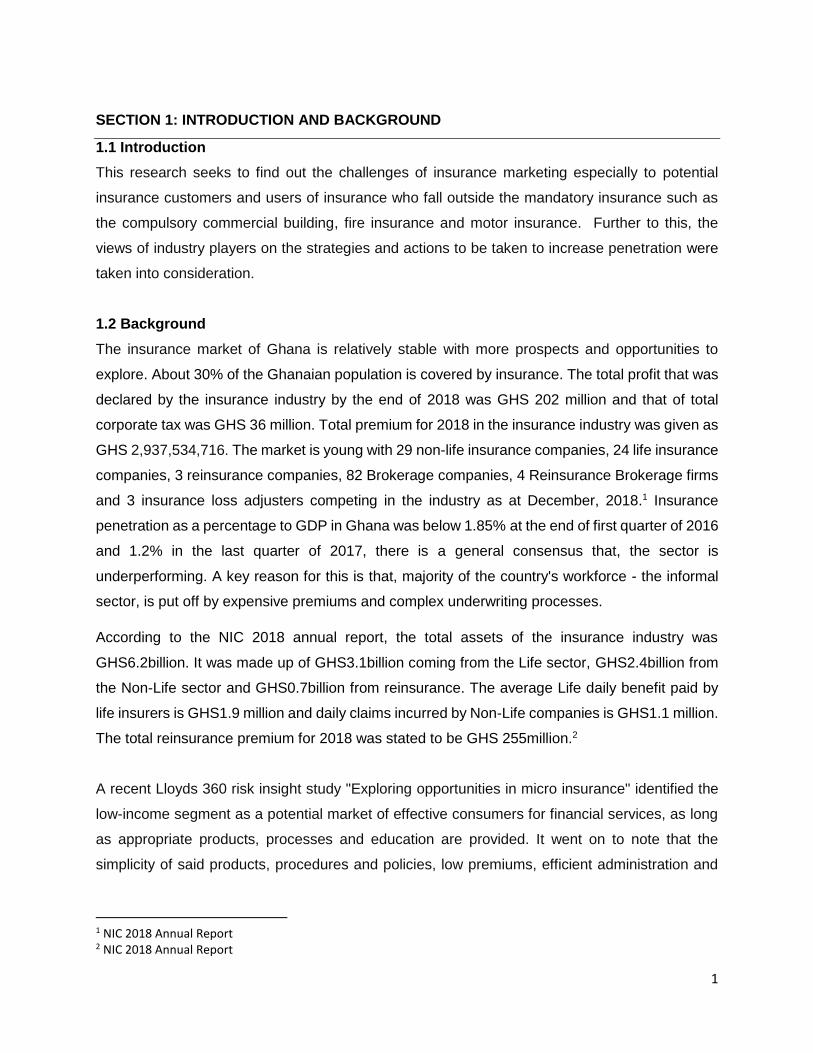
Table 1: Insurance growth from 2013 to 2018
Year Premium income (GHS) Growth rate (%)
2013 1,052,090,981 24
2014 1,239,853,442 18
2015 1,560,679,185 26
2016 1,928,838,573 24
2017 2,400,000,000 18
2018 2,937,534,716 29
The above table is depicted below in Figure 2
10
Figure 2: Year-Premium in the Ghanaian insurance industry from 2013 to 2018
The year premium in the Ghanaian insurance industry from 2013 to 2018 is shown above.
2.3 Stakeholders in the Ghanaian insurance industry
There are two basic types of insurance companies: direct and reinsurance. Direct companies are
responsible for the initial underwriting of insurance policies (Non-Life and Life), while reinsurance
companies act as insurers to the primary insurers. Non-life policy products range from Liability
Policies, Engineering Policies, Marine Policies, Fire Insurance Policy or Property Insurance, Motor
Insurance Policy and Miscellaneous Insurance Policies such as Travel Insurance Policy etc. Life
policy products are Without Profit Conventional Products (e.g. Funeral Policy), With Profit
Conventional Products, Unit – Linked Products, Pensions, and Annuities Products as well as
Index – Linked or Inflation Protection Products.
While insurance companies provide insurance and assume the risks covered by the policy,
insurance intermediaries sell insurance policies for the companies. Some of these intermediaries
are directly affiliated with particular insurers and sell only the companies’ policies, others are
independent and are free to market the policies of a variety of insurance companies. In addition
to supporting these two primary components, the insurance industry includes establishments that
1,052,090,9811,239,853,442
1,560,679,185
1,928,838,573
2,271,368,033
2,937,534,716
2013 2014 2015 2016 2017 2018
YEAR-INSURANCE PREMIUMS

11
provide other insurance-related services, such as claims adjustment or third-party administration
of insurance and pension funds. As at December 2018, the insurance industry was made up of
24 Life companies, 29 Non-Life companies, 82 Broking companies, 3 Reinsurance companies, 4
Reinsurance Brokers and 3 Loss adjusters5.
The industry has seen a relatively stable growth in the number of firms entering the market. The
number of insurance companies and intermediaries from 2010 to 2018 is presented in table 2.
Table 2: Number of insurance companies and intermediaries
Year No. of Non-
life
Companies
No. of Life
Companies
No, of
Reinsurance
Companies
No. of
Insurance
Brokers
No. of
Reinsurance
Broker
No. of
Loss
Adjuster
2018 29 24 3 82 4 3
2017 28 24 3 80 2 3
2016 27 24 3 78 1 2
2015 27 24 5 74 1 1
2014 25 20 3 68 1 1
2013 25 18 3 57 1 1
2012 25 18 2 55 1 1
2011 24 18 2 51 1 1
2010 23 17 2 46 1 1
Source: NIC Annual Report( 2010- 2018)
Non life insurance companies increased from twenty-Eight(28) in 2017 to twenty-nine (29), given
an average growth of 3.6%. Broking companies had a growth of 2.5%, increasing from Eighty
(80) companies to Eighty-Two(82), Reinsurance Brokers experienced the most significant growth
of 100% increasing from 2 companies to 4 companies as at the end of 2018 reporting date.
5 National Insurance Commission, http://nicgh.org

12
2.4 Insurance penetration in Ghana
2.4.1 Current coverage and penetration
There is a difference between household penetration figures and individual uptake figures. Based
on data from the Ghana Living Standards Survey (Round 6), household penetration of insurance
has not been as plain as the reported data on individual uptake. More 60% of urban households
have short-term insurance policies. Almost 90% of urban households have people who hold a
commercial or business policy, 83.3% hold property policy and 77.4% hold vehicle or motor policy.
Medical (38.1%), funeral (25.7%) and vehicle or motor (22.6%). These are the main insurance
policies held by rural households. The proportion of household members with long term insurance
policies follow the same pattern for short-term holders, with more than 70% holding a long-term
policy. In the urban areas, 78.6% of households have at least one member who has a retirement
plan; 70.6% have an education policy while 74.4% have an insurance policy paid for by the
employer. A higher proportion of household members in urban areas do not have a policy (60.5%)
compared to the rural areas (39.5%) (GLSS, 2014)6.
The NIC’s 2014 Annual Report indicates decreasing trends of insurance penetration rate (the
contribution of total insurance premiums to Gross Domestic Product) from 1.8% in 2010 to 1.18%
in 2014, and an average decline rate of 38%. The penetration marginally increased to 2% at the
end of 2017 reporting period. The NIC is making conscious efforts to improve the penetration
through the encouragement and development of micro insurance as well as the enforcement of
compulsory insurance in the country.
2.4.2 Current insurance penetration
According to the Africa Insurance Organization statistics from 2014, there is a consensus that the
insurance industry in the country is not performing as expected with its insurance penetration as
a percentage to GDP. According to the National Insurance Commission annual report in 2018,
insurance penetration was very low and this was nothing to write home about. Insurance
penetration which is defined as the contribution of total insurance premiums to Gross Domestic
Products was 1.14% which is still less than 2%.7 Conscious efforts were then made by the
commission to improve the penetration through the encouragement and development of micro
insurance in the country. Despite the 21% growth in the industry’s Gross written Premiums, the
6 Ghana Living Standard Survey Report, Ghana Statistical Service, 2014 7 NIC 2018 ANNUAL REPORT

13
insurance penetration rate reduced from 1.12% to 1%.8 The reduction in the penetration rate can
be attributed to the rebasing of the Ghanaian economy in 2018. It is important to note that this
rate excludes pension and health insurance which are not regulated by the National insurance
commission. The industry made some growth in 2017, according to the 2018 NIC annual report.
The nation’s total assets grew from GHS 5.4 billion in 2017 to GHS6.2 billion in 2018.The
Ghanaian economy grew by 8.5% in 2017, being the fastest growth rate achieved by the country
in five years as against 3.7% recorded in 2016. With the low levels of insurance penetration, the
NIC (National Insurance Commission) is hoping to boost public education in order to reach out to
both the formal and the informal sector in the country.
An evaluation of data from the Ghana Living Standards Survey (6th Round) was made by the
Ghana Statistical Service in 2014, and it showed that household penetration of insurance was
nothing like the reported data on individual uptake. 9 The report showed that almost 90% of urban
households had people who held a commercial or business policy, 83.3% held property policy
and 77.4 % held vehicle or motor policies. Medical (38.1%), funeral (25.7%) and vehicle or motor
(22.6%) were the main insurance policies that were held by rural households, but a higher
proportion of household members in urban areas did not have a policy, that is 60.5% as compared
to the rural areas (39.5%).10 The difference between the household penetration figures and the
individual uptake figures highlights the fact that awareness of insurance was fairly good, but
issues underlying the understanding of insurance covers and the affordability of insurance
products were rather endemic. In fact, according to the same report, members of households
gave a common reason as to their failure in purchasing insurance covers, and affordability of
insurance covers was one of them (48.5% of households). The case was almost the same in both
the urban and rural localities (49.1% for urban and 48.0% for rural).11The report highlighted that
in the rural areas, about one-third of the households (32.5%), which is more than twice the
proportion in urban areas (14.7%) did not have an insurance policy because they were clueless
as to how insurance worked. More than half of households in rural coastal (52.5%) and (56.9 %)
in rural forest also did not have insurance cover because they could not afford it. Very small
proportions of households also indicated that the insurance companies were deceptive and hence
8 NIC 2018 ANNUAL REPORT 9 https://thebftonline.com/2018/features/achieving-insurance-penetration-in-ghana-time-to-go-back-to-the-basics/ 10 https://thebftonline.com/2018/features/achieving-insurance-penetration-in-ghana-time-to-go-back-to-the-basics/ 11

14
their apathy in taking up an insurance policy.12 In 2019, a pilot survey was conducted by the NIC
with the support of the GIZ. Their main objective was to conduct a public assessment on the
perception and awareness of insurance in Ghana and also to look into the low rate of insurance
penetration in the country.
According to the pilot study, 98% of the respondents responded in the affirmative when they were
asked if they had heard about the concept of insurance. Following their response on awareness
of insurance, interviewees were asked further about their knowledge in the concept of insurance.
30% (urban dwellers) and 25% (rural dwellers) of the respondents had good knowledge about the
concept of insurance whilst 22 %( urban dwellers) and 5 %( rural dwellers) had no knowledge on
insurance. 29% (urban dwellers) and 17% (rural dwellers) had little knowledge. Their knowledge
on insurance products was also tested. Majority of the respondents mentioned motor/car
insurance, health insurance and life/funeral insurance. Non-clients of insurance firms had no
knowledge on micro insurance and agriculture insurance. Not even one urban dweller had
knowledge whatsoever about agricultural insurance.
Current clients were found to possess the highest knowledge level of insurance (0.64) relative to
previous clients (0.60) and non-clients (0.49). This explained why non-clients did not hold any
insurance policy and had never held a policy. The perception of insurance was also addressed
and the respondents cited reasons such as mistrust of insurers, limited information on insurance
facilities, complex underwriting processes and the high cost of premiums as the reasons for not
signing up and these were the same problems people were facing back in 2014. Looking at the
growth of insurance from 2014 to 2019, nothing has changed. The results are very similar: the
wrong perceptions about insurance has encroached the minds of people and hence, the low rate
of insurance in the country and this all tapers down to marketing as a major challenge in the
insurance industry. However, although a fair number of people have an idea about insurance, the
channeling of the information is a dire problem.
According to the pilot survey, although people knew about insurance, just a few people had a
good knowledge in insurance and that was very disappointing. Again, some people knew nothing
about the agriculture and micro insurance and this implies that certain products are ignored when
these insurance agents go out sell insurance products and this must be worked on. Majority of
12 https://thebftonline.com/2018/features/achieving-insurance-penetration-in-ghana-time-to-go-back-to-the-basics/

15
the respondents that had good knowledge in insurance were clients themselves, and this all bores
down to the fact that insurance agents are not doing their work as required.
Trained staff must be employed to sell and market insurance products accordingly, especially the
insurance agents, since they are extremely important. Also, there must be certain strategies
insurance companies can adopt in order to boost the penetration rate in the country. One of the
strategies that was looked into was to increase the marketing of micro insurance products in the
country. Micro insurance has a potential market, as it is a low income division that can attract
effective consumers for financial services. It will be successful as long as the apt products and
policies, low claims, efficient management and effective distribution channels are put in place,
even in markets with minute to no experience or knowledge at all. Exposure to poor farmers,
traders and casual workers in rural areas has proven difficult in the urban-centric part of Ghana.
There is extreme dependence on liaison brokers and traditional sales agents, and this has brutally
limited the delivery of micro insurance products to the rural areas in the country. Ghanaian
insurers need to reassess distribution and device-innovative models to ensure the needed
expansion. 13
The NIC’s focus, according to the 2018 annual report, going forward, is to raise or increase the
penetration rate since the insurance penetration in the country is very low and must be looked
into. It is going to be the main objective of the NIC to look into that. The level of insurance
penetration in Ghana is gauged to reach five percent by the year 2020, as National Insurance
Commission (NIC) executes the necessary and rational procedures to develop the growth in the
insurance penetration of the country.
13 https://microinsurance network.org
16
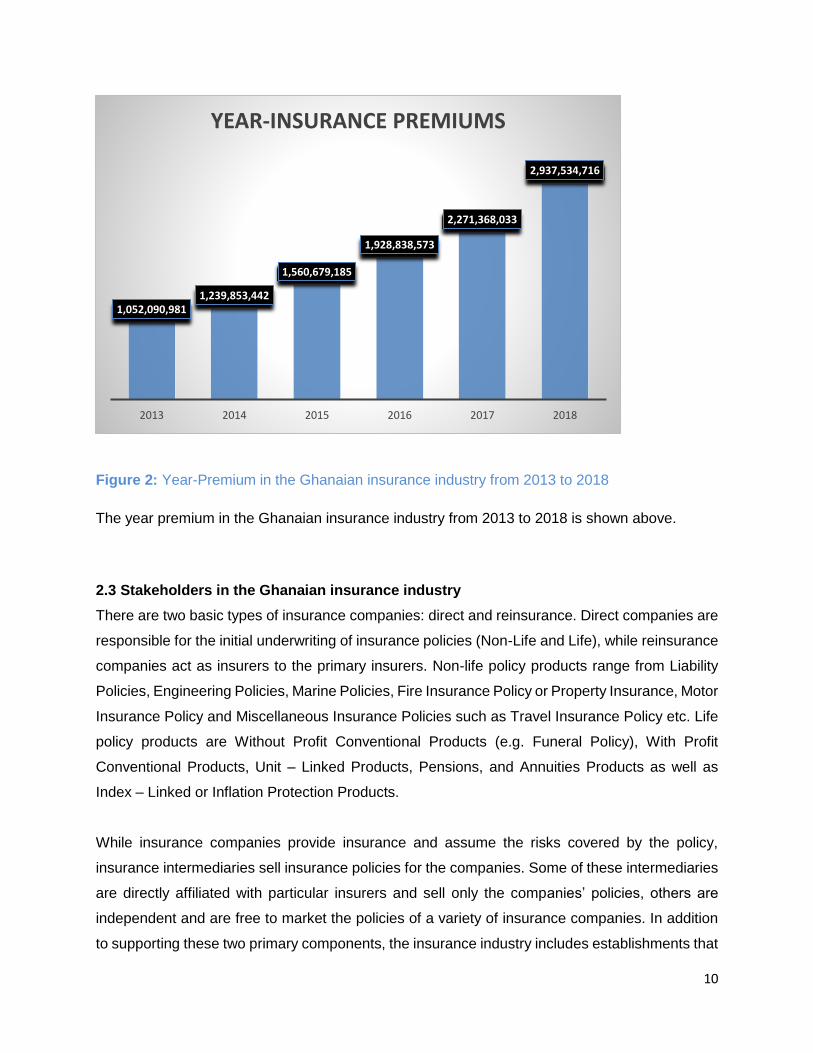
2.4.3 Industry total asset and growth
As at 31st December 2018, the Industry gross premium amounted to GH¢ 2.9 billion representing
an annual growth rate of 21% from GH¢ 2.4 billion in 2017 as presented in table 3.
Table 3: Premium income growth
Year Premium income (GH¢ Billions) Growth rate
2018 2.90 21%
2017 2.40 24.4%
2016 1.93 24%
2015 1.56 26%
2014 1.24 17.8%
2013 1.05 23.6%
Source: NIC 2018 Annual Report and Financial Statement
The aggregate assets of the insurance industry at the end of 2018 stood at GH¢ 6.2billion
compared to GH¢ 5.45billion in 2017. This represents a 15% growth in the assets of the insurance
industry. The Life sector recorded a growth in assets of 8% (from GH¢ 2.89billion in 2017 to GH¢
3.12billion in 2018), the Non-Life sector grew by 28% from a 2017 figure of GH¢ 1.86billion to
GH¢ 2.38billion in 2018. The reinsurance sector grew by 6% from a GH¢ 0.69billion in 2017
compared to GH¢ 0.73billion in 2018. Table 4 presents the growth rate in assets for the insurance
industry as of 201814.
Table 4: Growth rate in assets as of 2018
Source: NIC 2018 Annual Report and Financial Statement
14 NIC 2017 Annual Report and Financial Statement
Total assets (In GH¢ Billions) Growth rate
(%) 2017 2018
LIFE 2.89 3.12 8%
NON-LIFE 1.86 2.38 28%
REINSURANCE 0.69 0.73 6%
TOTAL ASSETS 5.45 6.2 15%

17
2.5 Challenges facing the Insurance Industry
Insurance plays different roles in economic development based on the degree of insurance
market development. Previous studies have suggested that the lack of knowledge about
insurance products, and to an extent misunderstanding of the concept of insurance account for
the low uptake of insurance among the low-income population in Ghana. There was a slowdown,
mostly as a result of energy crisis experienced during the year. Even though growth trends in the
insurance industry have been positive, there are striking challenges in the marketing and
specifically for the insured public, the firms and other players in the sector, and the industry
regulator - the National Insurance Commission.
2.5.1 Challenges in marketing
Some of the major targets involved are elevating customers’ perception concerning insurance,
successful distribution of insurance products and improving customer service. Here are a few
reasons why marketing is a major challenge:
Inadequate promotion: Promotion communicates with the potential market so as to
persuade the prospective customers to try new insurance products.15 But this is and has
been inefficient over the previous years, because according to the 2013 NIC report, the
rate of insurance penetration is very low. This may be due to the pocket-sized attention
given in selecting promotional tools for agents, rural career agents, branch managers and
the front line staff. The agents and rural career agents especially play a very important
role and should be given the required attention.
Choice of marketing channels: Distribution is one of the major factors that controls
marketing progress when the insurance industry is taken into consideration. Insurance
companies need to assess the media through which they market their products. They need
to manage physical evidences such as brochures, policy documents and other visible cues
carefully, as they can have an earnest impact on the impression of the customers.
Mistrust in insurance relationships: According to various studies, the confidence in
insurance relationships has drastically declined over the years. This has occurred due to
the lack of clarity about insurance documents and policies, high expectations of potential
policyholders and bad claim experiences encountered by policyholders. Another reason
also lingers around the perception of insurance companies in general. Stephen Oduro, the
Managing Director of SIC Insurance Company, clarified that there is low public confidence
15 Wanjiru, M. C. (2013). Challenges affecting marketing of insurance services by insurance Agencies in Nairobi
Kenya. Unpublished MBA project, University of Nairobi.

18
coupled with a deep seated mistrust in insurance companies. And this is a major reason
for the mistrust in insurance relationships.
Lack of trained staff: Due to the practical intricacies of the insurance products, it is highly
necessary that the agents selling insurance understand the contracts they are supposed
to sell. Understanding the customer better allows the designing of appropriate products
and hence increasing the need for trained staff to work at the various insurance centers.
According to Gnyawali and Madhavan in 2001, the training of employees and the use of
IT for efficiency is one of the essential quarters when the marketing of insurance services
is taken into consideration.
2.5.2 Challenges facing the insured public and stakeholders in the insurance industry
1. For the insured public, the common challenge facing the industry is low public confidence
coupled with a deep-seated mistrust of insurance companies. Some of the reasons for these
issues can mainly be attributed to:
the very high expectations of insuring public;
greater awareness of how insurance operates elsewhere in the world;
the increasing level of education with its associated awareness of legal rights;
bad claims experience encountered by policyholders; and
Lack of clarity and understanding of insurance policy documents.16
2. For insurance brokers, due to the low penetration of insurance, selling the importance of life
insurance in the lives of individuals and families is usually not an easy task. Low local
insurance penetration in the insurance market can be attributed to factors such as:
poor agent comprehension skills;
poor agent motivation;
the bad image of the industry;
Fraudulent claims attributed to poor customer data.
16 Kwadwo Duodu, F., & Amankwah, T. (2012). An analysis and assessment of customer satisfaction with service quality in insurance industry in Ghana. Gobah, F. K., & Zhang, L. (2011). The National Health Insurance Scheme in Ghana: prospects and challenges: a cross-sectional evidence. Global Journal of Health Science, 3(2), 90.
19
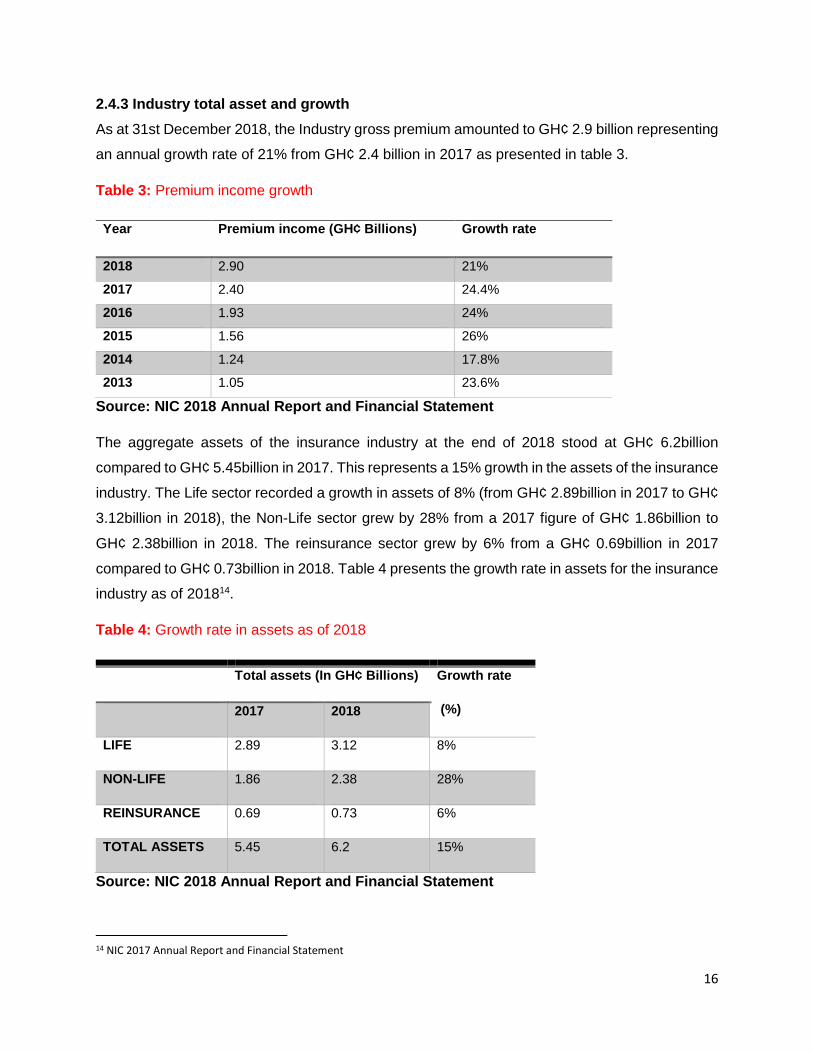
3. For the firms, due to the increasing competition in the sector, the market shares of many of
them have declined in recent times, forcing them to resort to unhealthy practices in their
struggle for survival. One of those unhealthy practices is premium undercutting, which
continues to top the list of challenges stifling the growth of the insurance sector. From life to
non-life through to reinsurance premium undercutting, otherwise called underpricing,
continues to deny well-meaning companies of quality premium charges.17
4. There is also the challenge of distribution or lack of proper channels through which the industry
can distribute its products to potential clients. Online channels to allow users to register an
insurance policy without meeting the agent in person is very low. This channel may also be
appropriate for most of the consumers at the bottom of the pyramid, who are mostly low
income, illiterate and informal.
5. Similarly, there is the challenge of the poor use of ICT among insurance firms and brokers18
17 Oscar Akotey, J., Sackey, F. G., Amoah, L., & Frimpong Manso, R. (2013). The financial performance of life insurance companies in Ghana. The Journal of Risk Finance, 14(3), 286-302. 18 Honyenuga, B. Q., Tuninga, R. S., & Ghijsen, P. W. T. (2014). High performance organizations framework as a predictor of firm performance in the insurance industry in Ghana. Journal of Transnational Management, 19(4), 261-278.

20
SECTION 3.0: PRELIMINARY FINDINGS
3.1 Introduction
This section of the report presents preliminary results and findings based on data collected
quantitatively from insurance companies in Ghana. The findings include the views expressed by
companies relating to the scope of activities that can enhance insurance penetration; the
marketing strategies used by insurance providers in the marketing and sale of insurance;
challenges facing insurance companies; ways of increasing the marketing and sale of insurance
and recommendations made by industry players on how to increase insurance penetration in
Ghana.
The section contains diagrams, charts and tables clearly presenting the findings with various
narratives explaining information from the quantitative study. The study sought for the views of
life insurance companies, non-life insurance companies, brokers, reinsurers and other
intermediaries. The Head Offices of the various insurance companies and related parties were
used with each company assigning an expert to respond to the questionnaire.
3.2 General background and characteristics of insurance companies
Respondents were selected from all insurance companies in Ghana with focus on the head offices
instead of branches. The reason for this is that, major organizational and strategic decisions are
taken in the Head offices and communicated to the branches (if any). Among the respondents
are Chief Executive Officers, Heads of Department and Heads of units. In this section, we focus
on finding out the descriptives about the sample organizations as well as issues relating to the
research objectives.

21
3.2.1 Information on Insurer
Table 5:Number of branches in rural areas
BRANCHES LIFE NON-LIFE BROKER REINSURER REINSURER BROKER
1-5 branches 9.52% 28.57% 16.13% 100% 0%
6-10 branches 0% 0% 0% 0% 0%
11-15 branches 0% 0% 0% 0% 0%
16-20 branches 0% 0% 0% 0% 0%
21-25 branches 0% 0% 0% 0% 0%
More than 25
branches
0% 0% 0% 0% 0%
From the table above, we can tell that most of the insurance companies have less branches in
the rural areas, Life companies, Non-Life companies, Broking Firms and Reinsurance Brokers all
have less than 50% of say 1-5 branches in the rural areas. All Reinsurers have about 1-5 branches
in the rural areas. From this table we can conclude that most of the insurance companies don’t
have branches in the rural areas, this tends to make insurance penetration low.
Table 6: Number of branches in Urban Areas
Branches LIFE NON-LIFE BROKER REINSURER REINSURER
BROKER
1-5 branches 14.30% 44.40% 94.40% 100.0% 100%
6-10 branches 38.1% 29.6% 1.90% 0.00% 0.00%
11-15 branches 4.80% 22.20% 3.70% 0.00% 0.00%
16-20 branches 9.50% 0.00% 0.00% 0.00% 0.00%
21-25 branches 23.80% 0.00% 0.00% 0.00% 0.00%
More than 25
branches
9.50% 3.70% 0.00% 0.00% 0.00%
From the above table, about 94% of broking firms have about 1-5 branches in the urban areas
and just about 2% of them have about 11-15 branches in this area. With Non-Life companies,
44% of them own about 1-5 branches in the urban areas and 30% own 6-10 branches in the same
area. From the analysis, 22% of the Non-Life companies have 11-15 branches in the urban areas

22
and just 4% have more than 25 branches. Looking at that of life companies just about 10% of
them own more than 25 branches in urban areas and the same percentage of this population own
about 16-20 branches in the urban area. 38% own about 6-10 branches and 24% own 21-25
branches in the urban area. For Reinsurers, all of them have 1-5 branches in the urban areas,
likewise the Reinsurance Broking firms.
Figure 3: Total number of branches for insurance companies in Ghana
From figure 3, all the reinsurance companies and reinsurance brokers have 1-5 branches in
Ghana. This was in contrast to 45% of life companies with 6-10 branches in Ghana and just a
few of them, that is about 10% with more than 25 branches in Ghana. Also about 3.6% of the non-
life companies have more than 25 branches in Ghana and the same percentage of non-life
companies have about 21-25 branches. About 98.3% of brokers have 1-5 branches in Ghana.
LIFE NON-LIFE BROKERS REINSURER REINSURERBROKER
10.0%32.1%
98.3% 100.0% 100.0%
45.0%
32.1%
1.7% 0.0% 0.0%
28.6%
10.0%
0.0% 0.0%
25.0%
3.6%0.0% 0.0%
10.0% 3.6% 0.0% 0.0%
1-5 branches 6-10 branches 11-15 branches
16-20 branches 21-25 branches More than 25 branches
23
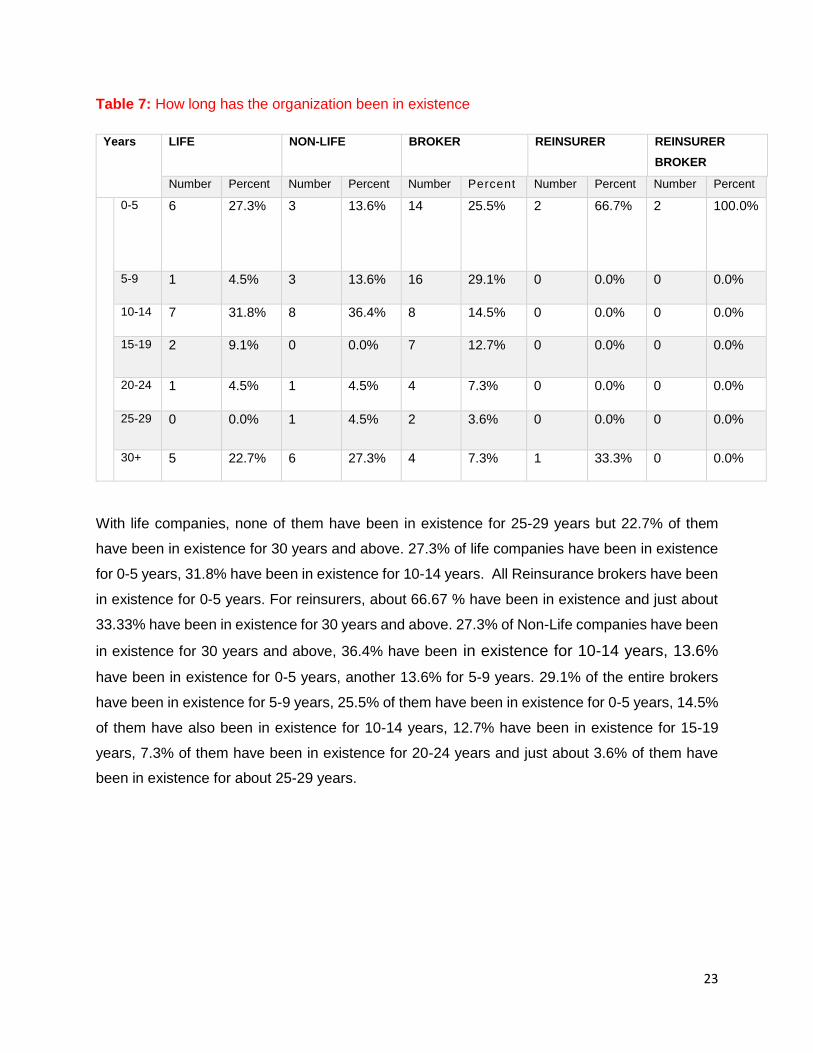
Table 7: How long has the organization been in existence
Years LIFE NON-LIFE BROKER REINSURER REINSURER
BROKER
Number Percent Number Percent Number Percent Number Percent Number Percent
0-5 6 27.3% 3 13.6% 14 25.5% 2 66.7% 2 100.0%
5-9 1 4.5% 3 13.6% 16 29.1% 0 0.0% 0 0.0%
10-14 7 31.8% 8 36.4% 8 14.5% 0 0.0% 0 0.0%
15-19 2 9.1% 0 0.0% 7 12.7% 0 0.0% 0 0.0%
20-24 1 4.5% 1 4.5% 4 7.3% 0 0.0% 0 0.0%
25-29 0 0.0% 1 4.5% 2 3.6% 0 0.0% 0 0.0%
30+ 5 22.7% 6 27.3% 4 7.3% 1 33.3% 0 0.0%
With life companies, none of them have been in existence for 25-29 years but 22.7% of them
have been in existence for 30 years and above. 27.3% of life companies have been in existence
for 0-5 years, 31.8% have been in existence for 10-14 years. All Reinsurance brokers have been
in existence for 0-5 years. For reinsurers, about 66.67 % have been in existence and just about
33.33% have been in existence for 30 years and above. 27.3% of Non-Life companies have been
in existence for 30 years and above, 36.4% have been in existence for 10-14 years, 13.6%
have been in existence for 0-5 years, another 13.6% for 5-9 years. 29.1% of the entire brokers
have been in existence for 5-9 years, 25.5% of them have been in existence for 0-5 years, 14.5%
of them have also been in existence for 10-14 years, 12.7% have been in existence for 15-19
years, 7.3% of them have been in existence for 20-24 years and just about 3.6% of them have
been in existence for about 25-29 years.
24
3.2.2 Insurance Activities
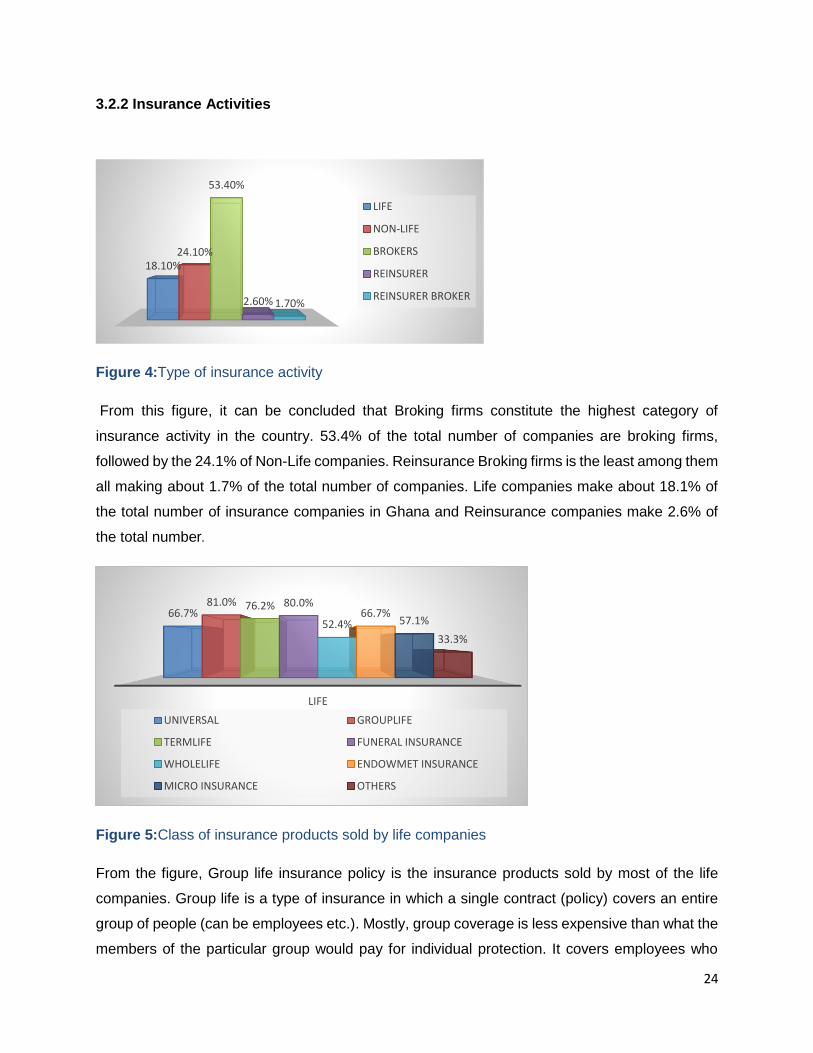
Figure 4:Type of insurance activity
From this figure, it can be concluded that Broking firms constitute the highest category of
insurance activity in the country. 53.4% of the total number of companies are broking firms,
followed by the 24.1% of Non-Life companies. Reinsurance Broking firms is the least among them
all making about 1.7% of the total number of companies. Life companies make about 18.1% of
the total number of insurance companies in Ghana and Reinsurance companies make 2.6% of
the total number.
Figure 5:Class of insurance products sold by life companies
From the figure, Group life insurance policy is the insurance products sold by most of the life
companies. Group life is a type of insurance in which a single contract (policy) covers an entire
group of people (can be employees etc.). Mostly, group coverage is less expensive than what the
members of the particular group would pay for individual protection. It covers employees who
18.10%24.10%
53.40%
2.60% 1.70%
LIFE
NON-LIFE
BROKERS
REINSURER
REINSURER BROKER
LIFE
66.7%81.0% 76.2% 80.0%
52.4%66.7%
57.1%
33.3%
UNIVERSAL GROUPLIFE
TERMLIFE FUNERAL INSURANCE
WHOLELIFE ENDOWMET INSURANCE
MICRO INSURANCE OTHERS
25
otherwise would not be able to afford individual life insurance policies and this seems to be very
beneficial to a lot of people. It is easy to qualify for a group life coverage and group life products
are also inexpensive as compared to buying individual policies. This is followed by Funeral
insurance, about 80% of the total number of life companies sell this product. Funeral Insurance
is one of the most affordable and expedient options available to protect your family from the
saddling cost of an unanticipated passing. It can be tailored to suit your particular need, since
funerals vary. The level and type of cover can be customized to ensure that the policy suits your
budget. Final expenses can be discussed over the phone and these are the benefits of purchasing
funeral insurance products. 76.2% of the total life companies sell Term Life. Term life insurance
guarantees payment of a stated death benefit during a specified period of time. Once the term
expires, the insured can either renew it for another term, alter the policy to permanent coverage,
or allow the policy to expire. 63.6% of the total life companies also sell Endowment insurance
and Universal insurance. 57.1% sell Micro insurance and 52.4% of the total number sell whole
life. 33.3% of the total number sell other products.
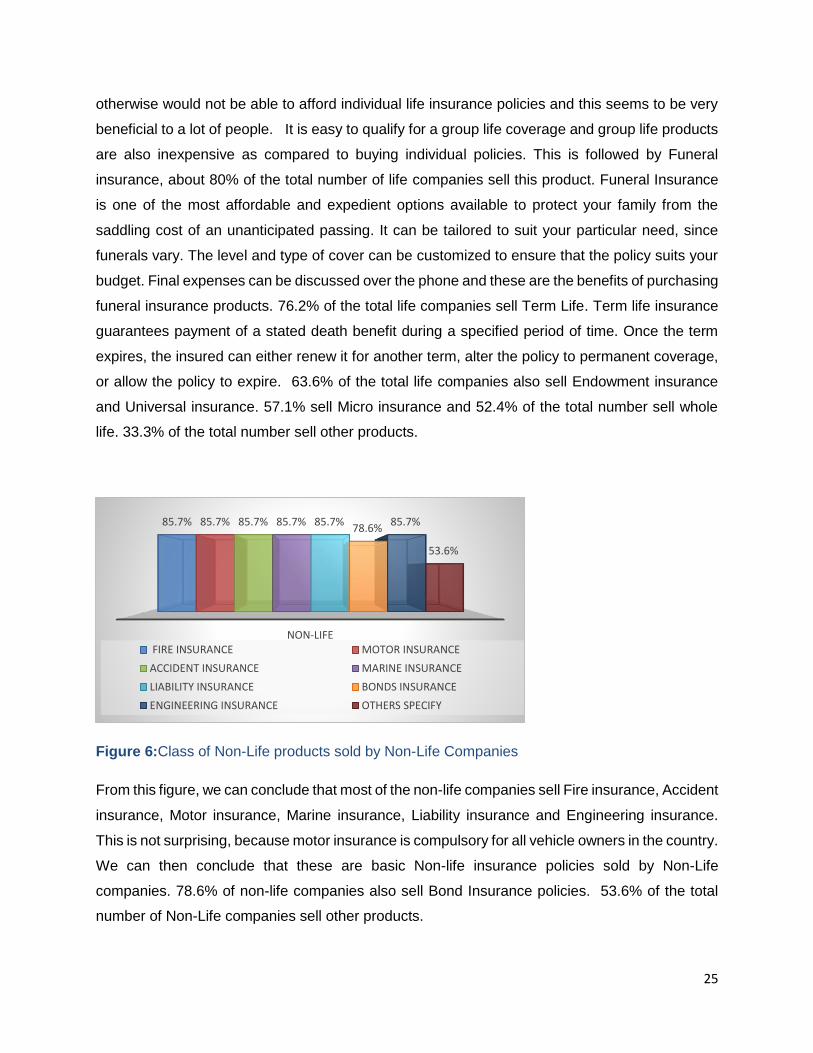
Figure 6:Class of Non-Life products sold by Non-Life Companies
From this figure, we can conclude that most of the non-life companies sell Fire insurance, Accident
insurance, Motor insurance, Marine insurance, Liability insurance and Engineering insurance.
This is not surprising, because motor insurance is compulsory for all vehicle owners in the country.
We can then conclude that these are basic Non-life insurance policies sold by Non-Life
companies. 78.6% of non-life companies also sell Bond Insurance policies. 53.6% of the total
number of Non-Life companies sell other products.
NON-LIFE
85.7% 85.7% 85.7% 85.7% 85.7%78.6%
85.7%
53.6%
FIRE INSURANCE MOTOR INSURANCE
ACCIDENT INSURANCE MARINE INSURANCE
LIABILITY INSURANCE BONDS INSURANCE
ENGINEERING INSURANCE OTHERS SPECIFY
26
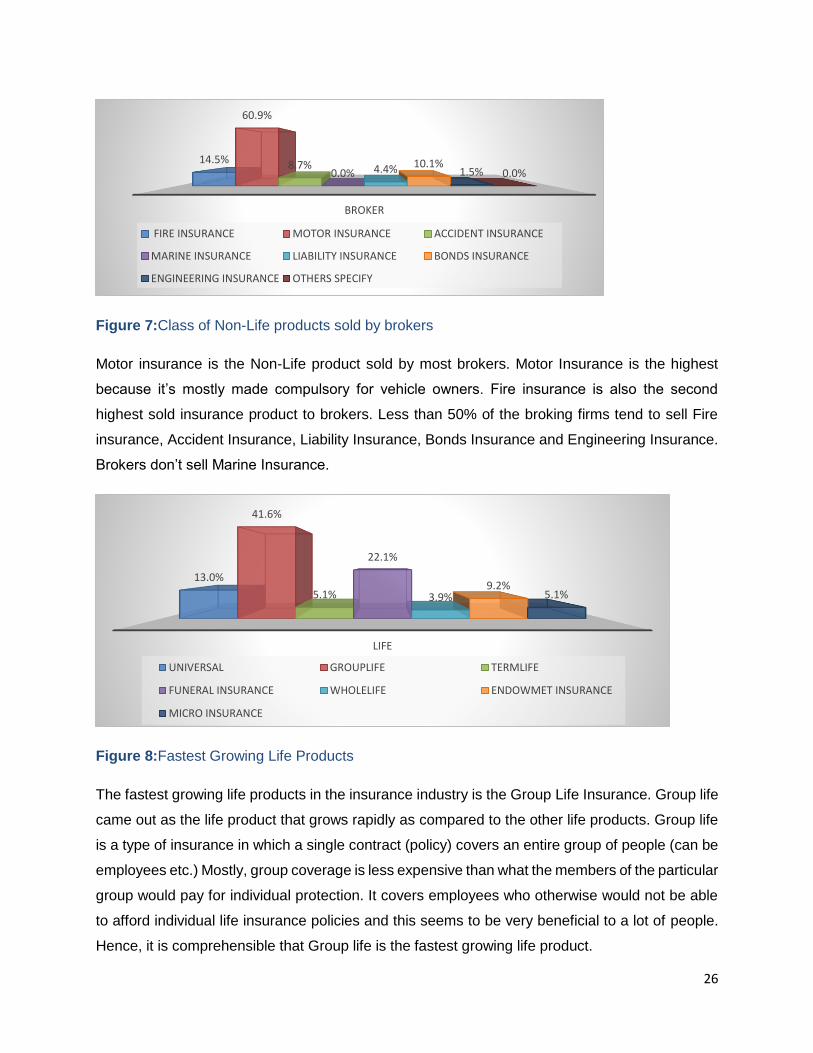
Figure 7:Class of Non-Life products sold by brokers
Motor insurance is the Non-Life product sold by most brokers. Motor Insurance is the highest
because it’s mostly made compulsory for vehicle owners. Fire insurance is also the second
highest sold insurance product to brokers. Less than 50% of the broking firms tend to sell Fire
insurance, Accident Insurance, Liability Insurance, Bonds Insurance and Engineering Insurance.
Brokers don’t sell Marine Insurance.
Figure 8:Fastest Growing Life Products
The fastest growing life products in the insurance industry is the Group Life Insurance. Group life
came out as the life product that grows rapidly as compared to the other life products. Group life
is a type of insurance in which a single contract (policy) covers an entire group of people (can be
employees etc.) Mostly, group coverage is less expensive than what the members of the particular
group would pay for individual protection. It covers employees who otherwise would not be able
to afford individual life insurance policies and this seems to be very beneficial to a lot of people.
Hence, it is comprehensible that Group life is the fastest growing life product.
BROKER
14.5%
60.9%
8.7%0.0% 4.4% 10.1%
1.5% 0.0%
FIRE INSURANCE MOTOR INSURANCE ACCIDENT INSURANCE
MARINE INSURANCE LIABILITY INSURANCE BONDS INSURANCE
ENGINEERING INSURANCE OTHERS SPECIFY
LIFE
13.0%
41.6%
5.1%
22.1%
3.9%9.2%
5.1%
UNIVERSAL GROUPLIFE TERMLIFE
FUNERAL INSURANCE WHOLELIFE ENDOWMET INSURANCE
MICRO INSURANCE

27
The least among these products is the whole Life insurance. Less than 50% of Life companies
stated that Universal insurance, Term Life insurance, Funeral Insurance, Whole Life insurance,
Endowment Insurance and Micro Insurance are their fastest growing Life products.
Figure 9:Fastest growing Non-Life Products for Non-Life companies
The fastest growing product among Non-Life insurance companies is the Motor insurance, this is
not surprising because motor insurance especially those of vehicles has been made compulsory
so most vehicle users have no choice but to purchase such product. For Non-Life companies,
Accident insurance and Marine Insurance is both growing at a rate of 3.30%. This is very
inefficient because marine insurance is equally as important but a lot of people are unaware of its
benefits. Fire insurance is growing at rate of 10.0% and that of Liability insurance and Engineering
insurance is not growing at all.
NON-LIFE
10%
66.67%
3.30% 3.30% 0.00%
13.30%
0.00% 3.30%
FIRE INSURANCE MOTOR INSURANCE
ACCIDENT INSURANCE MARINE INSURANCE
LIABILITY INSURANCE BONDS INSURANCE
ENGINEERING INSURANCE OTHERS SPECIFY

28
Figure 10:Fastest growing Non-Life Products for Brokers
The fastest growing product among Broking firms is the Motor insurance, this is not surprising
because motor insurance especially those of vehicles has been made compulsory so most vehicle
users have no choice but to purchase such product. With Brokers, 15.52% of them say Fire
insurance is their fastest growing product. 6.90% say Bonds insurance and Accident Insurance is
their fastest growing product, 3.45%, Liability insurance but none claimed Marine insurance and
Engineering Insurance to be part of their fastest growing product.
Figure 11:Fastest growing Non-Life Products for Reinsurers
BROKERS
15.52%
67.24%
6.90%0.00%
3.45%6.90%
0.00% 0.00%
FIRE INSURANCE MOTOR INSURANCE ACCIDENT INSURANCE
MARINE INSURANCE LIABILITY INSURANCE BONDS INSURANCE
ENGINEERING INSURANCE OTHERS SPECIFY
REINSURER
50.00%
0.00% 0.00% 0.00% 0.00%
50.00%
0.00% 0.00%
FIRE INSURANCE MOTOR INSURANCE
ACCIDENT INSURANCE MARINE INSURANCE
LIABILITY INSURANCE BONDS INSURANCE

29
For Reinsurers, the fastest growing product is the Fire insurance and Bonds insurance, motor
insurance, accident insurance, marine insurance, liability insurance and engineering insurance
are not growing products for Reinsurers at all. We can then conclude that Liability insurance is
not growing in any of the companies be it Non-Life, Broking firms and Reinsurance companies.
Figure 12:Slowest Life Product
From this figure we can tell that Endowment insurance and Group life insurance is not the slowest
life product with all life companies. The slowest product among life companies is the Term Life
Insurance. Term life was the slowest life product, with the highest percentage at 40%. Term life
is a life product that is designed to provide affordable death protection for the short term and pays
benefit only if you die. The policyholder is no longer covered after the set period expires.
According to past study by LIMRA and LIFE foundation in 201319, so many people thought term
life insurance would cost them more than their budgets could handle; they did not buy term life
products because they thought it was costly. The study also found out that those people believed life
insurance cost twice as much as it actually does. The setback is that there are a lot of misconceptions
about term life insurance, such as the cost involved and because of this, people do not buy their
products as much and hence, causing it to be the slowest growing life product on the market. This is
followed by the Universal life insurance. 13.3% of Life companies have Funeral insurance as their
slowest life product, likewise another 13.3% who have whole life insurance policy as their slowest
life product. Only 6.67 % of life companies have Micro insurance as their slowest life product.
19 https://www.dol.gov/sites/dolgov/files/EBSA/about-ebsa/about-us/erisa-advisory-council/2017-mandated-disclosure-for-retirement-plans-salka-written-statement-06-07.pdf
LIFE
26.67%
0.00%
40%
13.30% 13.30%
0.00%6.67%
UNIVERSAL LIFE GROUP LIFE TERM LIFE
FUNERAL INSURANCE WHOLE LIFE ENDOMENT INSURANCE
MICROINSURANCE
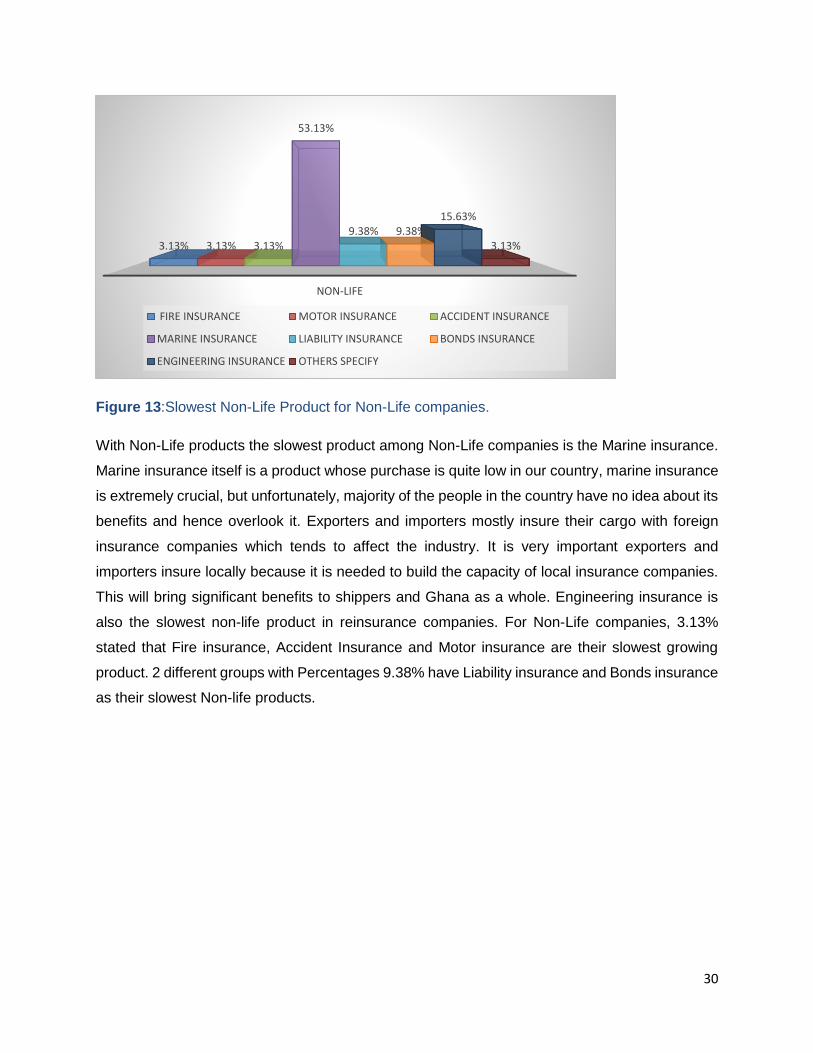
30
Figure 13:Slowest Non-Life Product for Non-Life companies.
With Non-Life products the slowest product among Non-Life companies is the Marine insurance.
Marine insurance itself is a product whose purchase is quite low in our country, marine insurance
is extremely crucial, but unfortunately, majority of the people in the country have no idea about its
benefits and hence overlook it. Exporters and importers mostly insure their cargo with foreign
insurance companies which tends to affect the industry. It is very important exporters and
importers insure locally because it is needed to build the capacity of local insurance companies.
This will bring significant benefits to shippers and Ghana as a whole. Engineering insurance is
also the slowest non-life product in reinsurance companies. For Non-Life companies, 3.13%
stated that Fire insurance, Accident Insurance and Motor insurance are their slowest growing
product. 2 different groups with Percentages 9.38% have Liability insurance and Bonds insurance
as their slowest Non-life products.
NON-LIFE
3.13% 3.13% 3.13%
53.13%
9.38% 9.38%15.63%
3.13%
FIRE INSURANCE MOTOR INSURANCE ACCIDENT INSURANCE
MARINE INSURANCE LIABILITY INSURANCE BONDS INSURANCE
ENGINEERING INSURANCE OTHERS SPECIFY

31
Figure 14:Slowest Non-Life Product for Broking firms.
With Non-Life products the slowest product among Broking firms is the Marine insurance.
Marine insurance itself is a product whose purchase is quite low in our country. Exporters and
importers mostly insure their cargo with foreign insurance companies. For Broking firms,
17.14% of them have Engineering insurance as their slowest selling Non-life product, 12.86% of
them also have Bonds insurance and Fire insurance as their slowest selling Non- Life product.
Figure 15:Slowest Non-Life Product for Reinsurers.
With Non-Life products the slowest product among Reinsurance companies is the Marine
insurance. Marine insurance itself is a product whose purchase is quite low in our country.
Exporters and importers mostly insure their cargo with foreign insurance companies. For
BROKERS
12.86%
4.29%7.14%
32.86%
11.43% 12.86%
17.14%
1.43%
FIRE INSURANCE MOTOR INSURANCE ACCIDENT INSURANCE
MARINE INSURANCE LIABILITY INSURANCE BONDS INSURANCE
ENGINEERING INSURANCE OTHERS SPECIFY
REINSURERS
0.00% 0.00% 0.00%
50.00%
0.00% 0.00% 0.00%
50.00%
FIRE INSURANCE MOTOR INSURANCE ACCIDENT INSURANCE
MARINE INSURANCE LIABILITY INSURANCE BONDS INSURANCE
ENGINEERING INSURANCE OTHERS SPECIFY

32
Reinsurers, Engineering insurance is also a slowest Non-Life product, Fire insurance, Motor
Insurance, Accident Insurance, Liability insurance and Bonds insurance are not slow selling
products at all.
Figure 16:Most profitable life product
Group Life insurance is the most profitable life product among life companies, it is easy to qualify
for a group life coverage and group life products are also inexpensive as compared to buying
individual policies. This is followed by Funeral insurance. Funeral insurance is becoming popular
in Ghana by the minute; according to various sources, and it is by no means astonishing. Hence,
from the results, it is comprehensible that it is the most profitable life products. None of the life
companies stated that Micro Insurance is their most profitable life products. 7.94% stated that
their most profitable life product is that of the Term life insurance, 6.35% has that of the Term Life
insurance and Universal insurance as their most profitable life product and just about 3.17% have
Endowment Insurance as their most profitable product.
LIFE
6.35%
49.21%
7.94%
26.98%
6.35%3.17%
0.00%
UNIVERSAL GROUPLIFE TERMLIFE
FUNERAL INSURANCE WHOLELIFE ENDOWMENT INSURANCE
MICRO INSURANCE

33
Figure 17:Most profitable Non-Life product for Non-life companies
For Non-Life companies, the most profitable Non-Life product is the Motor insurance, followed by
that of Fire insurance. 17.86% of Non-Life companies stated that Accident insurance is their most
profitable Non-Life product, 14.29% stated that Engineering insurance was their most profitable
Non-Life product,10.71% also stated that Liability insurance is their most profitable product and
3.75% stated that Marine Insurance.
Figure 18:Most profitable Non-Life product for Brokers.
For Broking Firms, 33.33% of them stated that Fire insurance was their most profitable Non-Life
product due to how scarce fire outbreaks occur. It makes it one of the non-life products brokers
NON-LIFE
21.43%
32.14%
17.86%
3.57%
10.71%
0.00%
14.29%
0.00%
FIRE INSURANCE MOTOR INSURANCE ACCIDENT INSURANCE
MARINE INSURANCE LIABILITY INSURANCE BONDS INSURANCE
ENGINEERING INSURANCE OTHERS SPECIFY
BROKERS
33.33%30.33%
10.61%7.58%
12.12%
1.52%4.55%
0.00%
FIRE INSURANCE MOTOR INSURANCE ACCIDENT INSURANCE
MARINE INSURANCE LIABILITY INSURANCE BONDS INSURANCE
ENGINEERING INSURANCE OTHERS SPECIFY

34
tend to profit from. 30.33% said theirs was that of Motor insurance, 12.12% stated that liability
insurance is their most profitable Non-Life product. 1.52% stated that bonds insurance is that of
their most profitable non-life product, 10.61% also stated that Accident insurance is their most
profitable Non-Life product, 7.58% stated Marine insurance as their most profitable product,
4.55% stated that Engineering insurance is their most profitable selling product.
Figure 19:Most profitable Non-Life product Reinsurers
For Reinsurance companies, Liability insurance is the most profitable Non-Life product and about
66.66% of the total number of Reinsurance companies stated this. 33.33% of Reinsurers have
Fire insurance as their most profitable Non-life product. None of the Reinsurance companies have
Motor insurance, Accident insurance, Marine Insurance, Bonds insurance and Engineering
insurance to be their most profitable Non-Life product.
REINSURERS
33.33%
0.00% 0.00% 0.00%
66.66%
0.00% 0.00% 0.00%
FIRE INSURANCE MOTOR INSURANCE
ACCIDENT INSURANCE MARINE INSURANCE
LIABILITY INSURANCE BONDS INSURANCE
ENGINEERING INSURANCE OTHERS SPECIFY

35
Figure 20:Least Profitable Life Product
The least profitable life product among life companies is the Micro insurance due to its structure
(micro-insurance is an insurance structure laid down for low income earners). Life insurance
companies do not tend to profit much from it. 24.19% of the life companies stated this and that
happened to be the highest percentage, this was followed Universal Insurance, 19. 35% of the
total life companies stated that this was their least profitable product. 17.74% of life companies
also stated that Funeral insurance is their least profitable life product, 17.29% stated that their
least profitable was Endowment insurance, this form of insurance is the least because it is a
form of savings which has a policy attached to it but most clients fail to see the need to save.
They do not see the need to save in an insurance company, so they rather save in banks and
this leads to higher returns. 11.29% stated that Term Life is their least profitable life product,
6.45% stated that Group Life insurance was their least profitable product and just about 3.23%
said theirs was that of Whole Life insurance.
LIFE
19.35%
6.45%
11.29%
17.74%
3.23%
17.29%
24.19%
UNIVERSAL GROUPLIFE
TERMLIFE FUNERAL INSURANCE
WHOLELIFE ENDOWMENT INSURANCE
MICRO INSURANCE

36
Figure 21:Least profitable Non-Life products for Broking Firms (Brokers)
For Broking Firms (Brokers) the least profitable Non-Life Product is the Motor Insurance. For
Broking firms (Brokers), 24.14% had Bonds insurance as their least profitable product, 17.24%
had Marine insurance as their least profitable product, 8.62% had Accident insurance as their
least profitable, 2 groups with percentages 6.90% had Fire Insurance and Engineering insurance
as their least profitable products, 3.45% also had liability insurance and just about 1.72% said
some other products are their least profitable products
Figure 22: Least profitable Non-Life products for Non- Life companies
BROKERS
6.90%
31.03%
8.62%
17.24%
3.45%
24.14%
6.90%
1.72%
FIRE INSURANCE MOTOR INSURANCE ACCIDENT INSURANCE
MARINE INSURANCE LIABILITY INSURANCE BONDS INSURANCE
ENGINEERING INSURANCE OTHERS SPECIFY
NON-LIFE
0.00%
38.46%
7.69%
15.38% 15.38% 15.38%
7.69%
0.00%
FIRE INSURANCE MOTOR INSURANCE ACCIDENT INSURANCE
MARINE INSURANCE LIABILITY INSURANCE BONDS INSURANCE
ENGINEERING INSURANCE OTHERS SPECIFY

37
For Non- Life companies the least profitable Non-Life Product is the Motor Insurance. 3 different
groups of Non-Life companies with percentages 15.38% had Marine Insurance, Liability
Insurance and Bonds Insurance to be their least profitable product, 7.69% had Engineering
insurance and Accident insurance as their least profitable product and none of the Non-Life
companies had Fire insurance as their least profitable product.
Figure 23:Least profitable Non-Life products- Non-life, Brokers and Reinsurers
For Reinsurance companies, it is that of Fire insurance. 33.34% of Reinsurers also stated that
Motor Insurance is their least profitable Non-Life product. None of the Reinsurers stated that
Accident Insurance, Marine Insurance, Liability Insurance, Bonds Insurance and Engineering
Insurance to be their least profitable products.
Figure 24:Mode of selling insurance
LIFE
NON-LIFE
BROKER
REINSURER
33.3%
67.9%
19.7%
95.2%
92.9%
21.3%
81.0%
92.9%
50.8%
66.7%
81.0%
92.9%
41.0%
66.7%
23.8%
42.9%
11.5%
66.7%
35.7%0.0%
0.0%
0.0%
3.6%
3.2%
Part time agents Full time agents Brokers Direct sales
Mass marketing Bancassurance Others
REINSURERS
66.67%
33.34%
0.00% 0.00% 0.00% 0.00% 0.00% 0.00%
FIRE INSURANCE MOTOR INSURANCE ACCIDENT INSURANCE
MARINE INSURANCE LIABILITY INSURANCE BONDS INSURANCE
ENGINEERING INSURANCE OTHERS SPECIFY

38
From Figure 24 we can tell that most Non-Life companies, Brokers and Reinsurance companies
sell their insurance products through Broking firms but with Life companies most of them sell their
products through Full Time Agents and about 92% of Non-Life companies also sell their insurance
products through Full Time Agents. 2 groups of Life companies with percentages 81.8% sell their
insurance products through Broking Firms (Brokers) and Direct Sales. Also, 2 groups of
Reinsurance companies with percentages 66.70% stated that they sell their insurance products
through Broking Firms (Brokers) and Direct Sales. Reinsurance companies don’t sell their
products through Part time agents, Full time agents, Mass marketing and Bancassurance. 39.30%
of Broking Firms(Brokers) sell their products through Direct Sales, 12.5% sell through Mass
marketing, 14.0% sell through Full Time Agents and 19.60% sell through Part Time Agents. 92.0%
of Non-Life companies also sell their insurance products through Direct sales, 64.0% sell through
Part Time Agents, 40.0% sell through Mass marketing and 28.0% sell through Bancassurance.
72.7% of Life companies sell their insurance products through Bancassurance, 40.9% sell through
Part time agents and 31.8% sell through Mass marketing.
Figure 25:Fastest growing distribution channel
The fastest growing distribution channel among life companies is that of the Individual/Tied
Agents. About 76.2% of life companies believe that selling their products through Individual/Tied
Agents is their fastest way of distributing their insurance products, about 60.7% of Non-Life
companies agree to this which seems to be the highest among other options but Broking Firms
(Brokers) don’t really think selling through other Individual/Tied Agents is the fastest way of
distributing their products. Broking Firms think selling their products through Direct Businesses is
the fastest way of distributing their products because 37.70% agree to this which is the highest
percentage among the other options, 31.10% went in for Individual/Tied Agents,1.60%
LIFE
NON-LIFE
BROKER
REINSURER
33.3%
50.0%
37.7%
0.0%
23.8%
42.9%
31.1%
66.7%
76.2%
60.7%
18.0%
0.0%
38.1%
17.9%
1.6%
0.0%
9.5%
7.1%
3.3%
0.0%
1.6%
0.0%
0.0%3.2%
Direct businesses Brokers Individaul/tied agents Bancassurances
Other corporate agents Telcos Others

39
Bancassurance, 3.3% other corporate agents, 1.60% Telecommunication Networks (Telcos) and
3.20% use other means to sell their products and think it’s also the fastest growing distribution
channel. 66.7% of Reinsurance companies say that selling their insurance products through
Broking Firms (Brokers) is the fastest distributing channel of selling their products 50% of Non-
Life companies believe that selling their products through Direct Businesses is their fastest
distribution channel, 42.9% said using Broking Firms(Brokers) is their fastest distribution channel,
17.9% say Bancassurance is their fastest growing distribution channel and 7.1% say is their
fastest growing distribution channel is Telecommunication Networks (Telcos). With Life
companies, 33.3% of them believe selling their products through Direct Business is their fastest
distribution channel, 38.1% say selling through Bancassurance help them sell their products
faster, 23.8% also say they sell their product faster through Broking Firms and 9.5% of them
believe that selling their products through other Telecommunication Networks (Telcos) is the
fastest way of distributing their insurance products.
Figure 26: Mode of selling insurance products in rural areas(Life companies)
With Life companies, their main mode of selling insurance in the rural areas is through
Individual/Tied Agents. For life companies, 47.1% sell their insurance products in rural areas
using Individual/Tied Agents. 2 groups of Life companies with percentages 8.8% sell their
insurance products using Direct Businesses and Bancassurance, 14.7% of them use
Telecommunication Networks (Telcos), 11.7% sell through Brokers, 5.9% sell through other
corporate agents and 2.9%of them sell through other means such as (Business to Business)
LIFE
8.8% 11.7%
47.1%
8.8% 5.9%
14.7%
2.9%
Direct businesses Brokers Individaul/tied agents
Bancassurances Other corporate agents Telcos
Others

40
Figure 27: Mode of selling insurance products in rural areas(Non-Life companies)
With Non-Life companies, their main mode of selling insurance in the rural areas is through
Individual/Tied Agents ,19.5% of Non-Life companies sell their insurance products through Direct
Businesses. Non-Life companies don’t sell their insurance products in rural areas through
Telecommunication networks (Telcos) any other means. 14.6% of Non-Life companies sell their
products through Brokers,4.9% sell through Bancassurance and 2.5% of them sell through other
corporate agents.
Figure 28:Mode of selling insurance products in rural areas (Broking Firms)
NON-LIFE
19.5%14.6%
58.5%
4.9% 2.5% 0.0% 0.0%
Direct businesses Brokers Individaul/tied agents
Bancassurances Other corporate agents Telcos
Others
BROKER
36.1%
25.1% 25.1%
0.0%2.9% 2.7%
8.14%
Direct businesses Brokers Individaul/tied agents
Bancassurances Other corporate agents Telcos
Others

41
About 36.1% of Broking Firms (which is the highest percentage) sell their products through this
medium. Broking Firms employ other Broking Firms to help them sell their insurance products in
rural areas, this is just about 25.1% of them who do that. 25.1% of Broking Firms (Brokers) also
sell their products individual agents. with percentages 2.86% sell their products through
Telecommunication networks (Telcos) and other corporate agents. None of the Broking Firms
(Brokers) sell their insurance products through Bancassurance.
Figure 29:Mode of selling insurance products in urban areas(Life companies)
In urban areas, Life companies mostly sell their insurance products using Individual /Tied Agents,
2 group of Life companies with percentages 21.4% sell their products through Broking Firms
(Brokers) and Direct Businesses. 20.20% sell their products through Bancassurance, 7.1%% sell
through Other corporate agents and 2 groups of life companies with percentages 1.40% each sell
their products through Telecommunication Networks(Telcos) and other means such as (Business
to Business).
LIFE
21.4% 21.4%
27.1%
20.0%
7.1%
1.4% 1.4%
Direct businesses Brokers Individaul/tied agents
Bancassurances Other corporate agents Telcos
Others
42
Figure 30:Mode of selling insurance products in urban areas(Non-Life companies)
In urban areas, 28.7% of Non-Life companies sell their insurance products through Broking Firms
(Brokers), 2 groups of Non-Life companies with percentages 27.8% and 27.7% sell their products
through Direct Businesses and Individual/Tied Agents respectively. 9.6% of them sell their
products through Bancassurance, 5.3% sell their insurance products through other corporate
Agents and 2 groups of Non-Life companies with percentages 1.1% also sell their insurance
products using Telecommunication Networks(Telcos) and other means like the LEAD.
Figure 31:Mode of selling insurance products in urban areas(Broking firm)
NON-LIFE
27.8% 28.7% 27.7%
9.6%5.3%
1.1% 1.1%
Direct businesses Brokers Individaul/tied agents
Bancassurances Other corporate agents Telcos
Others
BROKER
40.7%
29.6%
18.5%
1.2%4.9% 2.5% 2.47%
Direct businesses Brokers Individaul/tied agents
Bancassurances Other corporate agents Telcos
Others

43
With Broking firms(Brokers) about 40.7% of them sell insurance products through Direct
Businesses, 29.6% of them sell through other Broking Firms (Brokers), 18.5% sell through
Individual/Tied Agents, 4.9% sell through other corporate agents, 2.5% of Broking Firms sell
through Telecommunication Networks(Telcos), 2.47% sell through other means and just about
1.2% sell through Bancassurance.
Figure 32:Language used in Selling Insurance
In general, Life companies, Non-Life companies and broking firms use both English language and
local language in selling their insurance products taking both rural and urban areas into
consideration. Reinsurers and Reinsurance brokers use only English in selling their insurance
products.
Figure 33:Language used in selling insurance in Rural Areas
In Rural areas, although all Reinsurance companies use English in selling their insurance
products, it is a very poor marketing strategy to increase the rate of insurance penetration,
0.0% 0.0%5.4%
100.0% 100.0%
19.0% 20.8% 16.2%
0.0% 0.0%
81.0% 79.2% 78.4%
0.0% 0.0%
LIFE NON-LIFE BROKER REINSURER REINSURERBROKER
ENGLISH LOCAL LANGUAGE BOTH ENGLISH AND LOCAL LANGUAGE
4.5% 0.0%
21.2%
100.0% 100.0%95.5% 100.0%
78.8%
0.0% 0.0%
Life Non-life Broker Reinsurer Reinsurer brokerENGLISH LOCAL LANGUAGE BOTH ENGLISH AND LOCAL LANGUAGE

44
communication is quite key in this exercise. Sellers must be able to communicate in a common
language to customers. Take for instance a remote area in the central region where there are no
schools, habitants won’t be conversant with the English language. Reinsurance Brokers sell their
product in rural areas using only English. Looking at Life Companies, Non-Life Companies and
Broking firms, most of them use both English and any of the local language to sell their insurance
product which is very vital and quite necessary. They hardly use only english Language to sell
their insurance products in these areas.
Figure 34:Language used in selling insurance in Urban areas
In urban areas, both Reinsurers and Reinsurer brokers use only English language to sell their
insurance products. This is not surprising because in the urban areas such as Accra, English is a
common language and majority of the habitants can understand English when is being
communicated to them hence the reason why all the type of insurance companies don’t use only
local language to sell their products. For Life Companies, Non-Life Companies and Broking firms,
they mostly use both English and any of the local language (Twi, Ga, Ewe) to sell their products.
The few companies who sell their products in English doesn’t even make up to 25% of the total
number of companies for each. Only 9.1% of Life companies sell their products in English,8.0%
of Non-Life companies and 19.6% of Broking firms.
3.2.3 Insurance Outlook
This section of the research was to give the overall insurance outlook as perceived by players the
industry. Insurance companies were asked to respond to statement made relating to the outlook
of insurance in Ghana and were asked to express their level of agreement or disagreement to
those statements.
Life Non-life Broker Reinsurer Reinsurerbroker
9.1% 8.0%19.6%
100.0% 100.0%
0.0% 0.0% 0.0% 0.0% 0.0%
90.9% 92.0%80.4%
0.0% 0.0%
ENGLISH LOCAL LANGUAGE BOTH ENGLISH AND LOCAL LANGUAGE
45
Figure 35:Compared to previous years, insurance premiums are currently low
In figure 35 above, insurance companies were assessed on their thoughts about the state of
insurance premiums currently, as compared to previous years; whether they were high or low
premium rates. Majority of the insurance companies disagreed to the fact that the insurance
premiums are currently low as compared to the previous years, with a percentage of 65.2% whiles
27.5% agreed to it and this indicates that more insurance companies agreed to the statement that
there has been an increase in premium cost compared to previous years.
Figure 36:Over the next 12 months, insurance prices are likely to remain stable or increase
In figure 36, an assessment was made on whether the insurance prices were likely to remain
stable or increase. Majority of insurance companies representing 57.8% agreed that in the next
12 months, there will be an increase in insurance prices. This response outnumbered the number
of insurance companies who disagreed, with their percentage lagging behind at 17.5%. 24.8%
were indecisive as to whether insurance prices would remain stable or increase.
Strongly agree
Agree
Undecided
Disagree
Strongly disagree
22%
5.50%
7.30%
62.40%
2.80%
Strongly agree
Agree
Undecided
Disagree
Strongly disagree
46.20%
11.60%
24.80%
13.80%
3.70%

46
Figure 37:Insurance profitability is currently low
Figure 37 was based on perception of respondents about the profitability in the insurance
business. This was done to confirm if the insurance profitability is currently low. From the above,
74.10% of insurance companies agreed that profitability in the insurance business is currently
low. Out of the 74.10% that agreed, majority (59.3%) strongly agreeed to the statement posed
and this showed the intensity of low profitability in the insurance business. A contrary view was
also shared by 22.2% of the respondents who disagreed that insurance profitabilty was currently
low. 3.7% of the insurance companies were indecisive.
Figure 38:Over the next 12 months, insurance profitability is likely to remain stable or increase
Figure 38 explains if the profitability of insurance is likely to increase or remain stable over the
next 12 months and 36.4% agreed there will be a positive change in profitability of insurance
business whiles 28.40% were unable to tell if there will be any change and 34.9% disagreed to
the fact that profit will increase nor remain the same over the next 12 months.
Strongly agree
Agree
Undecided
Disagree
Strongly disagree
59.30%
14.80%
3.70%
17.60%
4.60%
Strongly agree
Agree
Undecided
Disagree
Strongly…
29.10%
7.30%
28.40%
30.30%
4.60%

47
Figure 39: Over the next 12 months, my organization intends to increase the number of
branches for selling insurance
Figure 39 assessed if insurance companies intend to increase the number of branches to sell
insurance. This statement helped in finding out whether insurance companies had plans of
opening more branches in different parts of the country or will maintain their existing branches.
From the results obtained, majority (42%) disagreed, and asserted that in the next 12 months,
there were no plans for their organization to increase the total number of branches. This was in
contrast to 31.9% of them who were of the view that their organizations had plans to expand the
number of branches in parts of the country.
Figure 40:Over the next 12 months, my organization intends to introduce new products to the
Ghanaian insurance market
Figure 40 depicts the percentage of insurance companies who intend to introduce new insurance
product to the Ghanaian market in the next 12 months. 44% of the total number of companies
intend to introduce a new product to the market in the next 12 months, 18.30% are indecisive as
to whether they will introduce a new product or not but 37.60% were sure they were not going to
introduce a new product in the next 12 months.
Strongly agree
Agree
Undecided
Disagree
Strongly…
27.10%
6.80%
23.90%
25.70%
16.50%
Strongly agree
Agree
Undecided
Disagree
Strongly disagree
35.20%
8.80%
18.30%
12.80%
24.80%

48
Figure 41:Over the next 12 months, my organization will increase the number of staff
The above figure shows the number of companies who will increase their number of staff in the
next 12 months, 33.90% were indecisive as to whether they will make this decision or not, but
38.50% were certain they will increase the number of their staff in the next 12 months and 27.50%
were certain they were not going to increase the number of their staff.
Strongly agree
Agree
Undecided
Disagree
Strongly disagree
30.80%
7.70%
33.90%
22.90%
4.60%

49
3.2.4 Challenges in Insurance Marketing and Selling of insurance products
Table 8:Challenges in insurance marketing and selling
ID Insurance outlook
statement
Very
adequate
Adequate Undecided Inadequate Very
Inadequate
Total
D1 State of insurance
regulation
38.9 9.7 5.5 43.1 2.8 100.0
D2 Protection against
natural catastrophe
14.6 3.7 14.7 61.5 5.5 100.0
D3 State of local
technical skills
23.5 5.9 11.0 55.0 4.6 100.0
D4 Capital to develop
more products and
write additional
businesses
19.1 4.8 8.3 62.3 5.5 100.0
D5 Level of insurance 5.1 1.3 0.9 89.0 3.7 100.0
Strongly
agree
Agree Undecided Disagree Strongly
disagree
Total
D6 Culture of the
people in buying
insurance
60.2 15.0 7.3 11.0 6.4 100.0
D7 Poor regulation and
laws
37.4 9.4 6.4 41.3 5.5 100.0
D8 The prevalence of
low incomes in the
country
63.1 15.8 2.8 14.7 3.7 100.0
D9 Poor intermediation
in the insurance
industry
44.0 11.0 9.2 29.4 6.4 100.0
D10 Negative perception
about insurance in
the country
74.2 18.5 0.9 2.8 3.7 100.0
Lack of innovative
products to meet the
needs of customers
49.92 12.48 3.7 28.4 5.5 100.0
Similar products on
the Ghanaian
insurance market
44.8 11.2 6.4 30.3 7.3 100.0

50
3.2.5 Supervisory Challenges
Table 9:Supervisory challenges
ID Supervisory challenge
statement
Very
great
extent
Great
extent
Moderate
extent
Low
extent
Extremely
low extent
Total
F1 There is inadequate maturity
of the laws that governs
insurance in Ghana
14.2 29.2 38.7 10.4 7.5 100.0
F2 Ghana has an outdated laws
and regulations which do not
spur growth in the insurance
industry
9.4 31.1 26.4 28.3 4.7 100.0
F3 In Ghana, the independent
and supervisory capabilities
of the regulator has not been
strengthened enough
28.7 20.4 24.1 17.6 9.3 100.0
F4 The comprehensiveness and
effectiveness of regulatory
processes in Ghana is
inadequate and it inhibits
penetration
21.7 23.6 24.5 20.8 9.4 100.0
F5 The insurance market of
Ghana is generally not
competitive which fails to spur
penetration
14.8 14.8 27.8 25.0 17.6 100.0
F6 Insurance companies in
Ghana are not well
capitalized which lowers their
ability to serve competently in
the market
10.7 10.7 36.9 26.2 15.5 100.0
F7 The insurance sector is
characterized by a shortage
of skills particularly product
19.3 21.1 28.4 17.4 13.8 100.0
51
development, underwriting
and actuarial skills which
hinders growth
F8 There are few market led
initiatives that seeks to
develop the sector as a whole
30.6 23.1 31.5 13.9 0.9 100.0
F9 There are limited, if any,
programs aimed at raising the
profile of the insurance
industry, and attracting
graduates and other
professionals
22.2 29.6 22.2 16.7 9.3 100.0
F10 The insurance industry is
poor on raising awareness
level in the insuring public
37.6 33.9 16.5 8.3 3.7 100.0
F11 The products offered in the
market are not well situated to
the local market and thus
leads to low demand
15.7 14.8 31.5 21.3 16.7 100.0
F12 Insurance in Ghana is not
meant for the poor, but to the
rich and the middle income
earners
23.1 21.3 24.1 15.7 15.7 100.0
F13 Innovation and product
development is poor among
Ghanaian insurers
26.2 37.4 24.3 1.3 1.9 100.0
F14 The poverty levels in the
country is high thus leading to
low demand for insurance
48.6 28.4 11.9 8.3 2.8 100.0
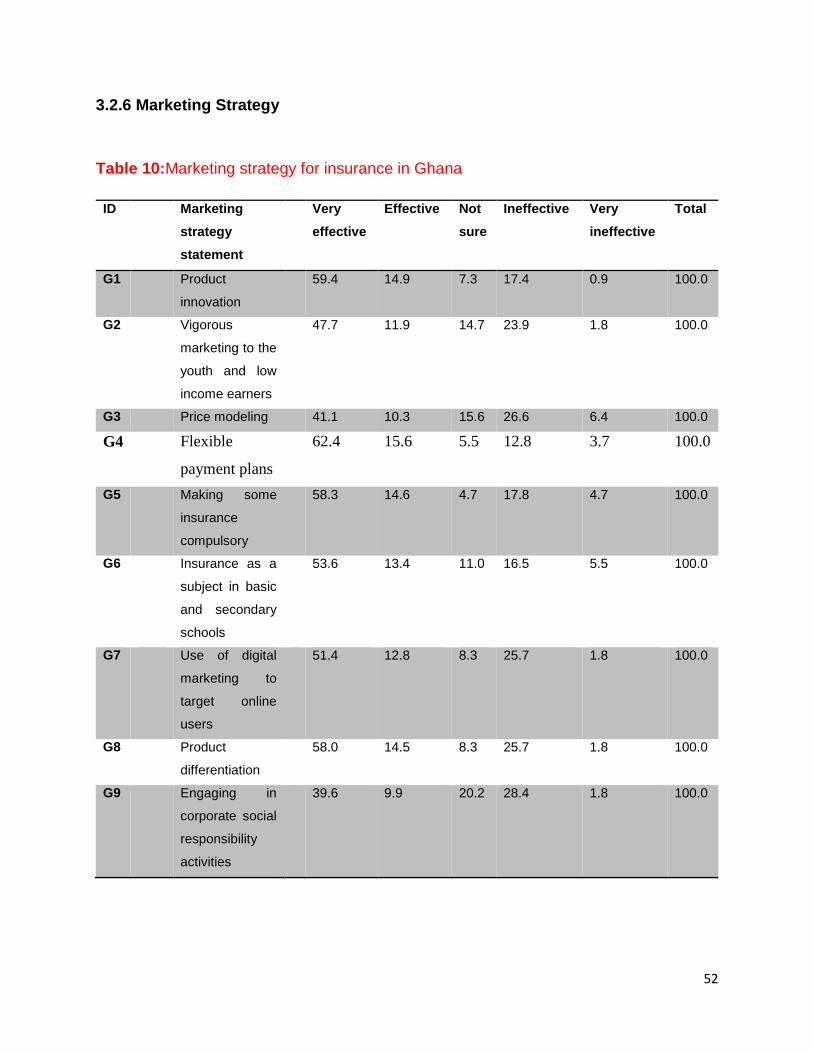
52
3.2.6 Marketing Strategy
Table 10:Marketing strategy for insurance in Ghana
ID Marketing
strategy
statement
Very
effective
Effective Not
sure
Ineffective Very
ineffective
Total
G1 Product
innovation
59.4 14.9 7.3 17.4 0.9 100.0
G2 Vigorous
marketing to the
youth and low
income earners
47.7 11.9 14.7 23.9 1.8 100.0
G3 Price modeling 41.1 10.3 15.6 26.6 6.4 100.0
G4 Flexible
payment plans
62.4 15.6 5.5 12.8 3.7 100.0
G5 Making some
insurance
compulsory
58.3 14.6 4.7 17.8 4.7 100.0
G6 Insurance as a
subject in basic
and secondary
schools
53.6 13.4 11.0 16.5 5.5 100.0
G7 Use of digital
marketing to
target online
users
51.4 12.8 8.3 25.7 1.8 100.0
G8 Product
differentiation
58.0 14.5 8.3 25.7 1.8 100.0
G9 Engaging in
corporate social
responsibility
activities
39.6 9.9 20.2 28.4 1.8 100.0
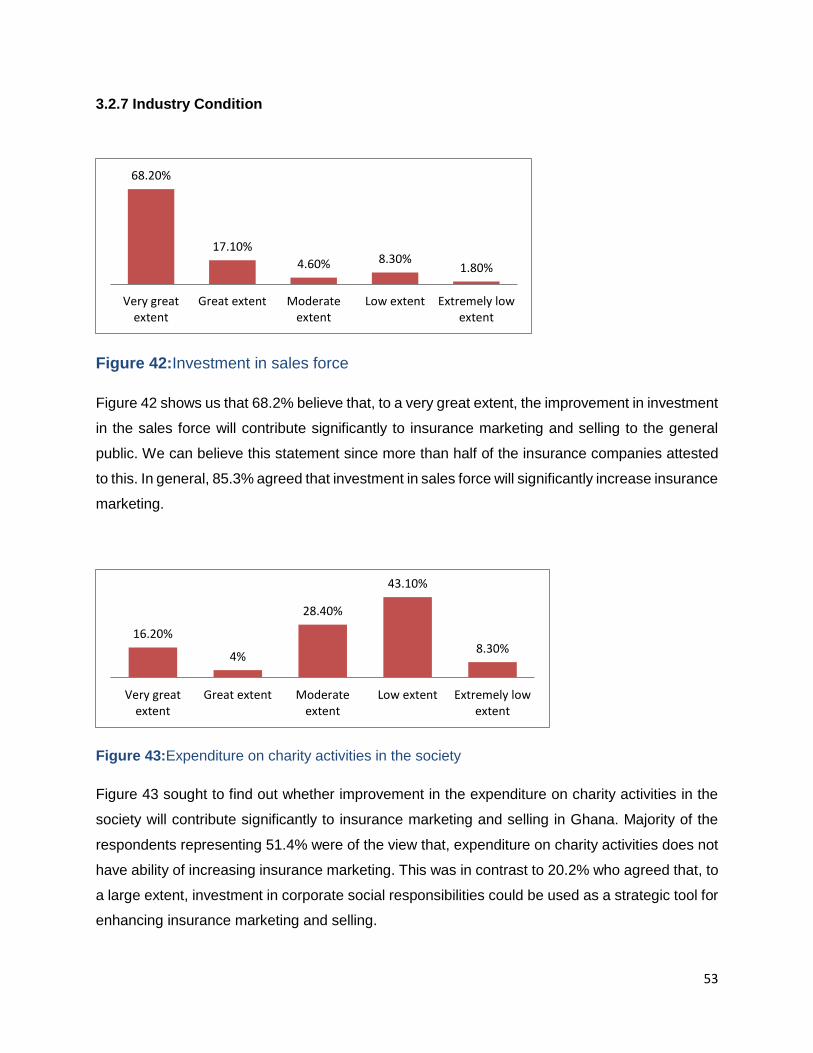
53
3.2.7 Industry Condition
Figure 42:Investment in sales force
Figure 42 shows us that 68.2% believe that, to a very great extent, the improvement in investment
in the sales force will contribute significantly to insurance marketing and selling to the general
public. We can believe this statement since more than half of the insurance companies attested
to this. In general, 85.3% agreed that investment in sales force will significantly increase insurance
marketing.
Figure 43:Expenditure on charity activities in the society
Figure 43 sought to find out whether improvement in the expenditure on charity activities in the
society will contribute significantly to insurance marketing and selling in Ghana. Majority of the
respondents representing 51.4% were of the view that, expenditure on charity activities does not
have ability of increasing insurance marketing. This was in contrast to 20.2% who agreed that, to
a large extent, investment in corporate social responsibilities could be used as a strategic tool for
enhancing insurance marketing and selling.
68.20%
17.10%
4.60% 8.30%1.80%
Very greatextent
Great extent Moderateextent
Low extent Extremely lowextent
16.20%
4%
28.40%
43.10%
8.30%
Very greatextent
Great extent Moderateextent
Low extent Extremely lowextent

54
Figure 44:Maintenance of higher quality standards for reputation purposes
From the above figure, majority of the respondents agreed that, to a very great extent the
maintenance of higher quality standards for reputational purpose has the ability of enhancing
insurance marketing and selling.
Figure 45:Budgetary allocation for sales and marketing department
71.3% of insurance companies say that, the extent to which the improvement in the budgetary
allocation for sales and marketing department contributes to insurance marketing and selling to
the general public is very great.
Figure 46:Reputation for quick claims settlement
97.2% of the insurance companies agreed that the improvement in the reputation of quick claims
settlement will extremely contribute to insurance marketing and selling to the general public.
64.60%
16.10%7.30% 8.30% 3.70%
Very greatextent
Great extent Moderateextent
Low extent Extremely lowextent
57%
14.30%6.50%
20.40%
1.90%
Very greatextent
Great extent Moderateextent
Low extent Extremely lowextent
77.80%
19.40%0% 1.80% 1%
Very greatextent
Great extent Moderateextent
Low extent Extremelylow extent

55
Figure 47:Use the media as a marketing tool
Majority of the insurance companies, with a total percentage of 75.20% were positive that the use
of the media as a marketing tool will immensely contribute significantly to insurance marketing
and selling to the general public.
Figure 48:Online selling
20.1% of the insurance companies opposed to the idea that online selling will contribute positively
to insurance marketing and selling whilst an overwhelming number of the companies, with a
percentage of 67.9% totally agreed to the idea.
Figure 49:Syndication of insurance to handle bigger risks
60.20%
15%3.70%
19.30%1.80%
Very great extent Great extent Moderate extent Low extent Extremely lowextent
54.30%
13.60% 11.90%18.30%
1.80%
Very greatextent
Great extent Moderateextent
Low extent Extremely lowextent
31.80%
8%
25%30.60%
4.60%
Very greatextent
Great extent Moderateextent
Low extent Extremelylow extent

56
The gap between the companies that agreed and disagreed to the improvement of the syndication
of insurance to handle bigger risks as a measure to contribute to insurance selling and marketing
was awfully close; with percentages of 39.8% and 35.2% respectively. However, the companies
that agreed were more than those that disagreed.
3.2.8 Insurance Sustainability
Figure 50:Rate of return on insurance product to other investment is low
68.5% of insurance companies in Ghana agreed that, the rate of return on insurance products to
other investments is low. In turn, it means that there could be preference for other investment with
higher rate of return than investment in insurance.
Figure 51: There is low levels of market research in the insurance industry
From the survey results, it was revealed that, 76.9% of insurance companies in Ghana agreed
that the level of market research in the insurance industry was low calling for more market
research to understand the market and bring out challenges to be addressed.
55%
13.50%
7.40%
15.70%
8.30%
Strongly agree
Agree
Not sure
Disagree
Strongly Disagree
61.50%
15.40%
5.60%
13%
4.60%
Strongly agree
Agree
Not sure
Disagree
Strongly Disagree

57
Figure 52:There is the existence of premium undercutting
Most of the companies, at a percentage of 78.7%, agreed that, currently the insurance industry is
facing the issue of premium undercutting and this is inimical to the sustainability of the insurance
business. Most insurance companies made it clear that quite a number of their fellow insurance
companies understate their premiums. This makes it difficult for some of the insurance companies
to sell their products because their prices will now be termed expensive since there has been
undercutting in some insurance companies.
Figure 53:There is increasing levels of direct sabotage, industrial espionage and poaching of
customers by competitors
Exactly half of the insurance companies in Ghana say that increasing levels of direct sabotage,
industrial espionage and poaching of customers by competitors will contribute significantly to
insurance sustainability.
Figure 54:There is frequent occurrence of fraud in the insurance industry
63%
15.70%
3.70%
12%
5.60%
Strongly agree
Agree
Not sure
Disagree
Strongly Disagree
40%
10%
20.40%
25%
4.60%
Strongly agree
Agree
Not sure
Disagree
Strongly Disagree
39.30%
9.80%
26.90%
20.40%
3.70%
Strongly agree
Agree
Not sure
Disagree
Strongly Disagree

58
Issues of fraud is an important indicator of insurance business sustainability in Ghana. Most
insurance companies stated that issues of fraud are on the rise in the insurance industry. This
has contributed to the unfavorable perception most Ghanaians have about insurance
The survey revealed that 49.1 of insurance companies agreed that there is frequent occurrence
in fraud in the industry and to a large extent impact on the sustainability of insurance in the country
but 24.1% disputed to this fact. They were of the view that, fraud in the industry cannot have
significant impact on the insurance business sustainability.
Figure 55:There is unfavorable competition between local and foreign insurance companies
45.5% of insurance companies believe that unfavorable competition between local and foreign
insurance companies affect the sustainability of insurance especially to local firms with
inadequate capital to take on bigger risks.
3.2.9 Organizational Information
Figure 56:Ownership structure of Insurance Companies
36.40%
9.10%
25.90%
21.30%
7.40%
Strongly agree
Agree
Not sure
Disagree
Strongly Disagree
42.9%52.4%
4.8%
63.6%
31.8% 4.5%
92.6%
7.4%
66.7%33.3%
100.0%
PRIVATE LOCAL PRIVATE FOREIGN STATE MIX OF PRIVATELOCAL AND STATE
MIX OF PRIVATEFOREIGN AND
STATE
OTHERS
Life Non-life Broker Reinsurer Reinsurer broker

59
All Reinsurance broking firms (reinsurer brokers) have a private local structure and 92.6% of
Broking firms (brokers) have a private local structure. 66.7% of Reinsurance companies
(reinsurers) ,63.6% of Non-life companies and 42.9% of Life companies all have private local
structures. With private foreign structures, about 52.4% of Life companies have this as their
ownership structure. 31.8% of non-life companies and 7.4% of broking firms(brokers) also have
private foreign structures. Only 33.3% of Reinsurance companies (reinsurers) have state
ownership structures and none of the other type of insurance companies have this type of
ownership structure. No insurance company has a mix of private local and state ownership
structure and a mix of private foreign and state ownership structure. 4.5% of non-life companies
have other ownership structures.
Figure 57:How long has your organization been in existence
Most of the Life companies have been in existence for about 10-14 years. 28.6% of life
companies have been in existence for about 4 years, 23.8% have been in existence for about
30 years and above.
0-4 5-9 10-14 15-19 20-24 25-29 30 ANDABOVE
28.6%
0.0%
38.1%
9.5%
0.0% 0.0%
23.8%
LIFE

60
Figure 58:How long has your organization been in existence
Most of the Non-Life companies have been in existence for about 10-14 years.24% of Non-Life
companies have been in existence for about 30 years and above, 12% of them for about 4
years, 16% for about 5-9 years and 2 different groups of 8%have been in existence for about
20-24 years and 25-29 years
Figure 59: How long has your organization been in existence
Most of the Broking companies have been in existence for about 5-9 years and 25% of Broking
firms have been in existence for about 4 years, 13.3% have been in existence for about 10-14
years, another 13.3% have been in existence for about 15-19 years, 6.7% have been in existence
for about 20-24 years, likewise another 6.7% have been in existence for about 30 years and above
and just about 5% have been in existence for about 25-29 years.
0-4 5-9 10-14 15-19 20-24 25-29 30 ANDABOVE
25.0%
30.0%
13.3% 13.3%
6.7% 5.0% 6.7%
BROKERS
0-4 5-9 10-14 15-19 20-24 25-29 30 ANDABOVE
12.0%16.0%
32.0%
0.0%
8.0% 8.0%
24.0%
NON-LIFE

61
Figure 60: Staff strength of Life Companies
Most life companies have about 81 and above employees in their organization. Just a few of them
that is about 9.1% have 41- 60 employees. No Life company has about 1-20 employees but
instead 2 different groups with percentages 13.6% each have 21-40 employees and 61-80
employees.
.
Figure 61:Staff strength for Non-Life companies
About 90.7% of Non-Life companies have about 1-20 employees in their organizations which
seems to be the result of most non-life companies. 5.6% have about 21-40 employees in their
organization. 1.9% of them have about 1-20 employees and the same percentage of Non-Life
companies have 81 and above employees.
0.0%
13.6%9.1%
13.6%
63.6%
1-20EMPLOYEES
21-40EMPLOYEES
41-60EMPLOYEES
61-80EMPLOYEES
81 ANDABOVE
1-20EMPLOYEES
21-40EMPLOYEES
41-60EMPLOYEES
61-80EMPLOYEES
81 ANDABOVE
90.7%
5.6% 1.9% 0.0% 1.9%

62
Figure 62:Staff strength for Broking firms
About 88.1% of most broking firms have about 1-20 employees in their organization. 5.1% of
broking firms have about 21-40 employees, 3.4% have about 41-60 employees and 2 groups of
1.7% have 61-80 employees and 81 and above employees.
Figure 63:Staff strength for Reinsurance Companies
Reinsurers mostly have about 1-20 employees. None of the reinsurance companies have about
21-40 employees, 41-60 employees and 81 and above employees but instead about 33.3% of
them have 61-80 employees.
1-20EMPLOYEES
21-40 41-60 61-80 81 ANDABOVE
88.1%
5.1% 3.4% 1.7% 1.7%
1-20EMPLOYEES
21-40EMPLOYEES
41-60EMPLOYEES
61-80EMPLOYEES
81 ANDABOVE
66.7%
0.0% 0.0%
33.3%
0.0%

63
Figure 64:Staff strength for Reinsurance Brokers
All reinsurance brokers have about 1-20 employees in their organization.
100.0%
0.0% 0.0% 0.0% 0.0%

64
SECTION 4.0: RECOMMENDATIONS
Based on the results presented, the following recommendations were deduced:
Life companies focus on promoting whole life insurance to individuals by engaging in
rigorous education.
To enhance insurance penetration, the insurance industry has to come up with effective
and efficient marketing strategies. To come up with this, more investment has to be done
in the sales and marketing sector of each company, hence not quite surprising most
insurance companies attested to the fact that when the budgetary allocation for the sales
and marketing department is improved, it will contribute immensely to the marketing and
selling of insurance products.
The research recommends that market research must be improved. Market niche is a
good marketing strategy, because with that, the market is well surveyed and makes it easy
to know the type of products going to sell in such areas and which people to sell it to.
There is the need for greater investment in agents/ salesforce in marketing and selling to
people in the rural areas. Since use of phones has become very common, insurance
agencies should consider collaborating more with telecommunication providers to sell
insurance to the wider population. The products should be tailored to meet the needs of
the ordinary person.
The traditional marketing avenues should be relooked at. Firms should focus on the use
of the media as a major way of educating the public, both mass media and social media.
In order to enhance the uptake of insurance, rigorous supervision must be conducted and
strict rules established in order to check and reduce the issues of fraud in the country.
The research further recommends that insurance companies should do more by entering
into rural areas and not focusing on competing in the urban areas for customers. There
are greater potentials in the rural areas if they understand insurance and recognize the
benefits that comes with it.
Insurance language should be simplified in the local language for people to understand
policies sold to them and the terms and conditions which comes with it. There should be
emphasis on the local languages when marketing and selling insurance products
especially to the informal sector.
Use of bancassurance and online platforms should be regularly utilized in promoting
insurance products.

65
Public perception of insurance is improving, the image of the insurance industry to the
ordinary Ghanaian is not very favorable. So most insurance companies agree that
maintaining a high quality standard for reputation purposes will really improve the
marketing and selling of insurance products and this will enhance insurance penetration