increasing chemist productivity in an open-access … chemist productivity in an open-access...
TRANSCRIPT

Increasing Chemist Productivity in an Open-Access Environment
Steve Hayward, Ryan Sasaki, Graham A. McGibbon Advanced Chemistry Development, Inc.
Toronto, ON, Canada www.acdlabs.com
Introduction
Historically, organizations have employed analytical chemistry groups to handle the acquisition, processing, and interpretation of routine analytical data generated in support of synthetic chemistry efforts. Now, however, thanks in large part to advancements in “Open-Access” or “Walk-up” analytical instrumentation, many routine experiments are elicited by the synthetic chemists themselves. The advantage of this approach is twofold: 1) It reduces the sample burden placed upon the analytical support group and thus the turn-around time associated with their activities; and 2) It places well-defined results or data into the hands of the individuals most familiar with the chemistry of their samples. Unfortunately, the evolution of open-access data handling creates its own set of issues for chemists. The drawback of waiting for results has been replaced with the burden of processing, analysis, and interpretation of their own analytical data, typically within different software applications. This added workload has changed the priorities of synthetic chemists, requiring them to spend more time interrogating analytical data, which can have a negative impact on their overall productivity.
This application note will highlight the benefits of having good software tools for analytical data viewing and processing, which chemists can access on computers in their own labs or offices. In addition, it will address how simple, yet sophisticated software tools can even aid chemists in their interpretation of analytical data, thus accelerating the decision-making process.
What Can an Offline Desktop Processing Tool Provide for a Chemist?
Depending on the environment, accessing raw and pre-processed analytical data from a synthetic chemist’s perspective can range from simplistic to cumbersome. In some open-access environments, the chemists are responsible for processing their raw data and analyzing their spectra via one shared computer in the instrument room. When more than a few chemists must frequently access a single computer it becomes cumbersome and inefficient to get results. Other environments may have a few satellite stations where chemists can access and process their data. In many cases, the setup on the instrument system can be forced to automate some or all of the processing steps to limit the amount of time a chemist needs to spend using the analysis software.
Examples of more simplistic environments often involve the automated delivery of analytical data plots or reports generated directly by software from a walk-up system. While these reports can provide a simple way to check if the desired compound is present on a routine basis, the reality is that not all reactions proceed as planned. Reports like the ones showed in Figure 1 are static and, as a result, don’t always lend themselves well for closer inspection, and certainly not for deeper analysis of “live” data.

2
Figure 1: Examples of analytical data reports generated from walk-up NMR and LC/UV/MS systems.
ACD/Spectrus Processor gives groups with open-access bottlenecks an inexpensive and easy way to provide each chemist with access to all their analytical data on their desktops in their own lab or office. This avoids queues in the instrument room and allows chemists to focus on their data at their own pace. With improved accessibility, synthetic chemists can inspect live data easily using a variety of beneficial features:
Support of All Techniques and Instrument Formats in one Application
Having one software package that can access different types of analytical data is desirable. However, such a software package falls short if it cannot deal with the variety of disparate data formats from different instrumentation in the analytical chemistry department at your organization now and in the foreseeable future. While standardizing on one instrument type (and format) may be an alternative, it represents an unrealistic compromise in today’s analytical environment. This is especially so when data from diverse techniques such as NMR, chromatography, mass spectrometry, and spectroscopy are all of interest and relevant to confirming compounds.
Whether your open-access instruments are Agilent (Varian), Bruker, Waters, or more likely a combination of different instruments, ACD/Labs supports import of data from these vendor formats and allows the user to easily view and process this data. The ability to support a variety of formats allows organizations to use whichever instruments can provide them with the most convenience and most desired results.
Fast and Efficient Manual or Automated Processing
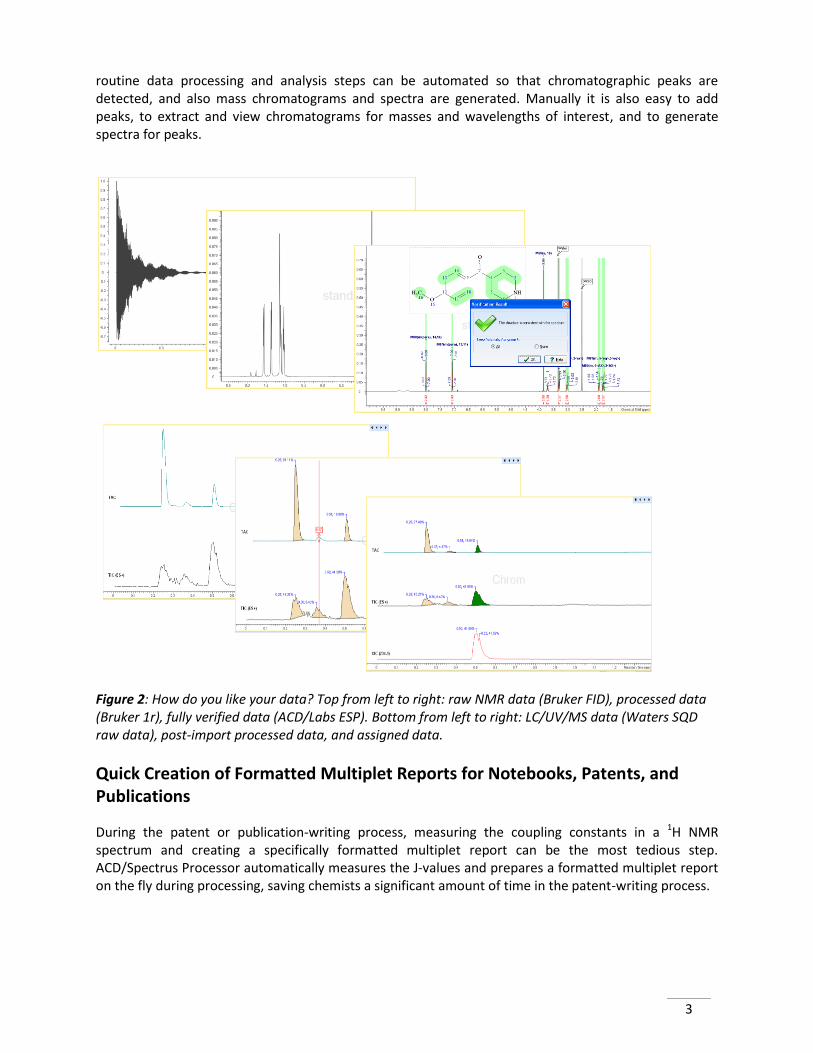
How the data looks when a chemist opens it for the first time is very important. Some organizations or chemists prefer to just receive the raw data, some prefer pre-processed data, while others choose to automate the process as much as possible to save time. For those who prefer the manual process, Figure 2 shows that ACD/Spectrus Processor includes a variety of routines and features for fast and efficient data processing. Data that is automatically processed from the instrument (i.e., Bruker 1r and 2rr files) can be imported directly as-is. Finally, routine data processing and analysis steps can be automated so that chemists can make decisions as quickly as possible following file import. LC/UV/MS raw unprocessed data, including most additional analog channels, will be imported but additional
3
routine data processing and analysis steps can be automated so that chromatographic peaks are detected, and also mass chromatograms and spectra are generated. Manually it is also easy to add peaks, to extract and view chromatograms for masses and wavelengths of interest, and to generate spectra for peaks.
Figure 2: How do you like your data? Top from left to right: raw NMR data (Bruker FID), processed data (Bruker 1r), fully verified data (ACD/Labs ESP). Bottom from left to right: LC/UV/MS data (Waters SQD raw data), post-import processed data, and assigned data.
Quick Creation of Formatted Multiplet Reports for Notebooks, Patents, and Publications
During the patent or publication-writing process, measuring the coupling constants in a 1H NMR spectrum and creating a specifically formatted multiplet report can be the most tedious step. ACD/Spectrus Processor automatically measures the J-values and prepares a formatted multiplet report on the fly during processing, saving chemists a significant amount of time in the patent-writing process.

4
Figure 3: Using ACD/Spectrus Processor, a chemist can quickly prepare a formatted multiplet report for their patents and publications like the one above in under 1 minute.
The Ability to Add Chemical Structures and Assign/Annotate Spectra
One of the unique features that you will find in ACD/Spectrus Processor is the ability to assign peaks/multiplets/bands in a spectrum to chemical structures/atoms/functional groups. This can be done by simple click-and-drag motions in the processing window, and the electronic assignments can then be stored within the data file, providing chemists with more meaningful electronic data.
Assigning NMR Data Electronically
Users can assign multiplets to atoms in a chemical structure or vice versa. In addition, the software suggests potential assignments (green) for interpretation assistance:
Figure 4: Using ACD/Spectrus Processor to assign a multiplet in a 1H NMR spectrum.
5
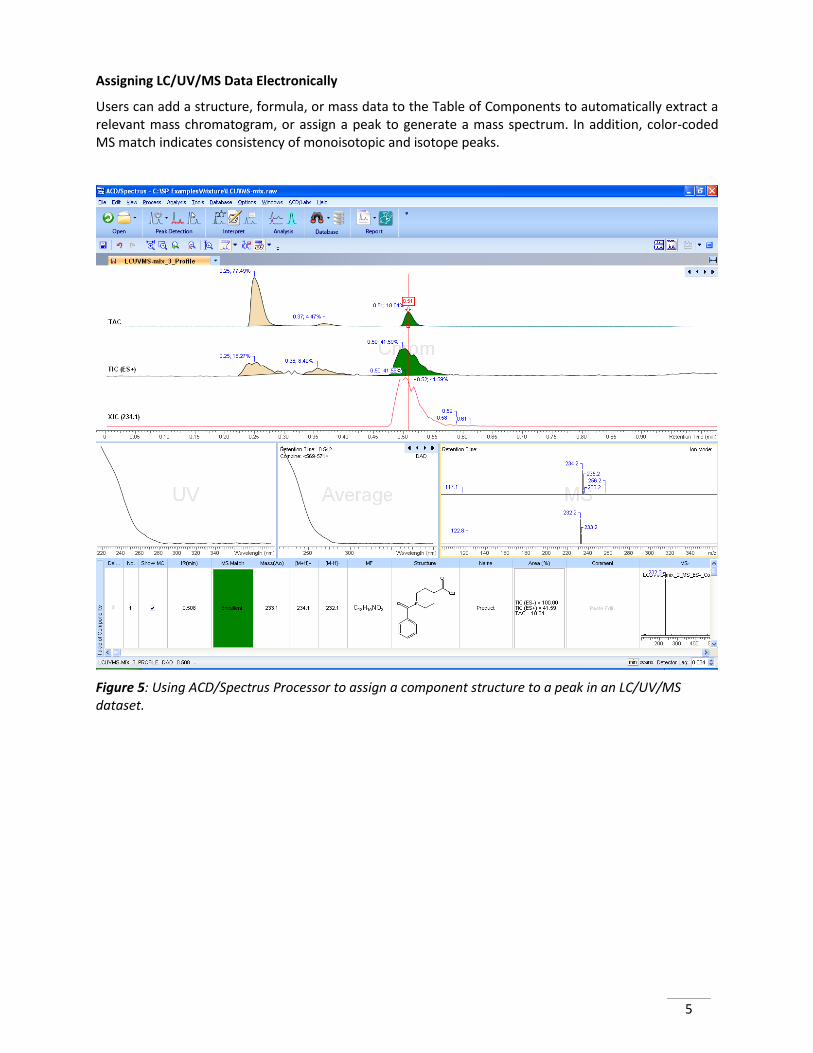
Assigning LC/UV/MS Data Electronically
Users can add a structure, formula, or mass data to the Table of Components to automatically extract a relevant mass chromatogram, or assign a peak to generate a mass spectrum. In addition, color-coded MS match indicates consistency of monoisotopic and isotope peaks.
Figure 5: Using ACD/Spectrus Processor to assign a component structure to a peak in an LC/UV/MS dataset.

6
Assigning IR and Raman Data Electronically
Users can make spectrum/structure assignments in IR and Raman spectra.
Figure 6: Using ACD/Spectrus Processor to compare an experimental IR spectrum with a match from a database search to reveal which structural group (red CH3) could rationalize particular peaks (green highlighted).
How Can Software Accelerate a Chemist’s Decision-making Process?
In general, a synthetic chemist will acquire 1H NMR and MS or LC/UV/MS data once a reaction is complete. They are then faced with two fundamental questions regarding this data:
• Did I make what I thought I made? • Is it pure?
Glancing at the mass spectrum and chromatograms of an LC/UV/MS dataset can provide the chemist with some confidence in their success of having obtained the desired product with fair purity. Mass spectrum interpretation is not always straightforward, however. More sophisticated software can help the synthetic chemist reliably interpret the mass spectrum and identify the [M+H]+ or [M-H]- to help reduce false-positive product confirmations. Moreover, 1D 1H NMR experiments allow chemists to verify the chemical structure of a compound. A chemist will often be able to confirm a successful reaction from this spectrum. When the interpretation poses more of a challenge, however, ACD/Spectrus Processor can be used to provide immediate feedback on the level of correspondence between a proposed structure and an experimental spectrum. Armed with this information, the chemist now has

7
an increased level of confidence to either go along with their intuition, or question the outcome of their reaction. This allows the chemist to make faster, more informed decisions about the relationship between a chemical structure and an NMR spectrum. With the click of a button, a user can receive immediate feedback on the consistency between the structure and the spectrum, as shown in Figure 7.
Figure 7: The verification output is a simple statement that the structure is (or is not) consistent with the spectrum. The user also has the option here to keep the automatic assignments or not.
When there is an inconsistency between the spectrum and structure, the user is informed of exactly what the inconsistency is, and where it is located on the structure, as shown in Figure 8. Whether a chemist is 99% sure that they indeed made the correct structure, or whether they are unsure, the software can provide an invaluable resource to help them in the interpretation process.
Figure 8: The verification output when there is an inconsistency between the spectrum and structure. In this example, the predicted shift does not match well with the experimental for atom 5 in the chemical structure.

8
Create Custom Reports That Can Be Attached or Pasted To Notebooks
Traditionally, once structure confirmation is complete, a chemist would tape or glue a copy of their spectrum into their paper lab notebook. With the emergence of electronic laboratory notebooks (ELNs) chemists now have the ability to link to electronic data files from their ELN, export spectrum reports as PDFs, or paste images of spectra into their ELN interface. ACD/Spectrus Processor helps an organization support all of these options in addition to providing a wealth of information about the spectrum in electronic form (i.e., experimental parameters, chemical structures, data tables, etc.). Furthermore, all reports created in ACD/Spectrus Processor are searchable by structure for easy report retrieval.
Figure 9: Examples of reports created by ACD/ Spectrus Processor.
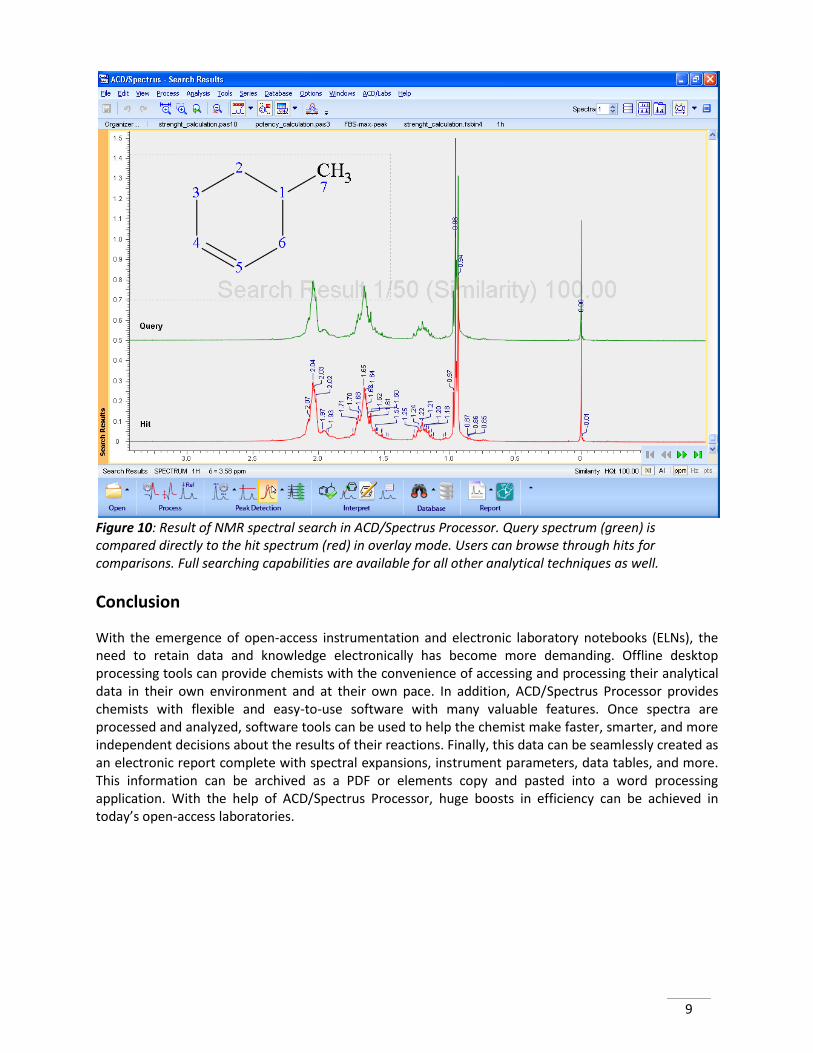
Verify Starting Material or Quickly Identify Unknown Elements with Database Searching Capabilities
Prior to running a chemical reaction, chemists will often verify the starting materials for their reaction to ensure no issues are present. ACD/Spectrus Processor supports this exercise by offering the synthetic chemists access to analytical data stored in an organization’s corporate analytical database. In effect, the software serves as the gateway to an analytical data repository. For example, the Aldrich NMR Library of FT Spectra is available in ACD/Labs database format. With this, chemists can perform a variety of peak, spectrum similarity, structure, substructure, or metadata searches to verify the identity of their starting materials, identify known impurities, contaminants, or other databased components, as depicted in Figure 10.
9
Figure 10: Result of NMR spectral search in ACD/Spectrus Processor. Query spectrum (green) is compared directly to the hit spectrum (red) in overlay mode. Users can browse through hits for comparisons. Full searching capabilities are available for all other analytical techniques as well.
Conclusion
With the emergence of open-access instrumentation and electronic laboratory notebooks (ELNs), the need to retain data and knowledge electronically has become more demanding. Offline desktop processing tools can provide chemists with the convenience of accessing and processing their analytical data in their own environment and at their own pace. In addition, ACD/Spectrus Processor provides chemists with flexible and easy-to-use software with many valuable features. Once spectra are processed and analyzed, software tools can be used to help the chemist make faster, smarter, and more independent decisions about the results of their reactions. Finally, this data can be seamlessly created as an electronic report complete with spectral expansions, instrument parameters, data tables, and more. This information can be archived as a PDF or elements copy and pasted into a word processing application. With the help of ACD/Spectrus Processor, huge boosts in efficiency can be achieved in today’s open-access laboratories.