increased tree densities in south african savannas · pdf fileincreased tree densities in...
TRANSCRIPT

Increased tree densities in South African savannas
>50 years of data suggests CO2 as a driver
Robert Buitenwerf1, William J. Bond2, Nicola Stevens3 and Winston S. W. Trollope4
1. UCT Botany, Goethe University Frankfurt 2. UCT Botany
3. CSIR NRE, Wits University, UCT Botany 4. Working on Fire International

Long-term fire experiments: the best we have
The usual suspects for driving tree cover, both grassland/savanna/forest transitions and woody thickening within savannas, are:
1. Land use: fire regime, grazing pressure, wood harvesting (e.g.
Staver et al. 2011)
2. Climate: rainfall (e.g. Sankaran et al. 2005)
Detecting effects from global drivers such as CO2 is difficult as they are usually confounded by ever-changing land use
Except in long-term fire experiments…

Kruger Experimental Burn Plots
Sampling scheme:
1950s: Diagonal transects
1970s: Survey of ½ Ha plots on 1 m2 grid
1990s: Diagonal transects
2000s: Partial repeat of 1970s plots
Variables:
• Species ID of each individual (Density)
• Tree height (1970s, 1990s, 2000s)
Pretoriuskop
Satara
Adapted from Biggs et al. 2003, Koedoe
MAP (mm)
500 - 550
550 - 600
600 - 650
650 - 700
700 - 750

Tree density over time
Semi-arid Mesic
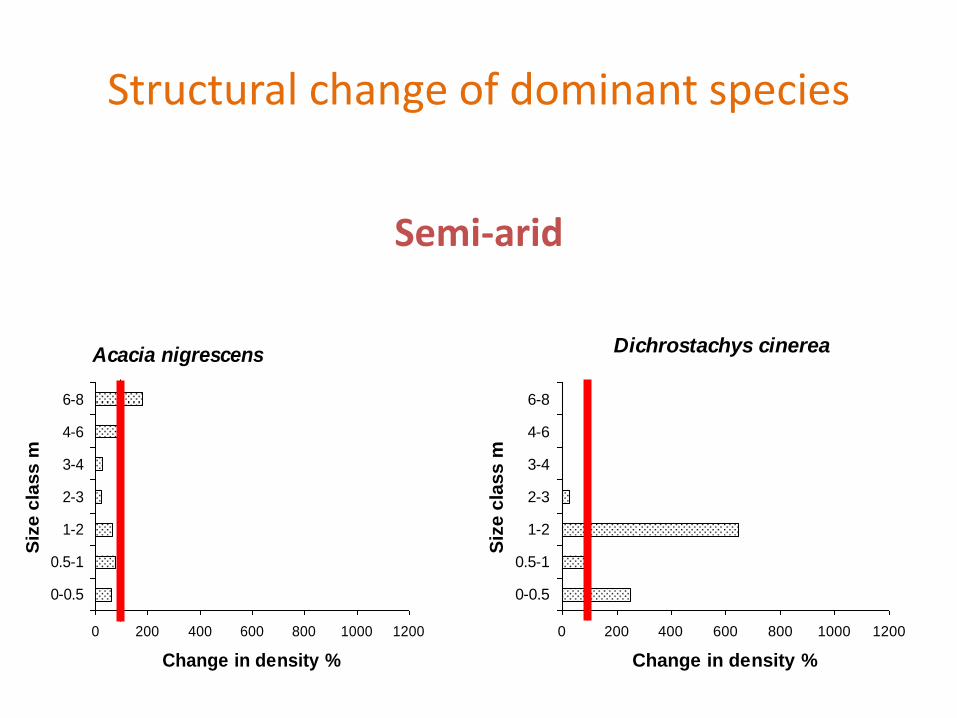
Structural change of dominant species
Semi-arid
Acacia nigrescens
0 200 400 600 800 1000 1200
0-0.5
0.5-1
1-2
2-3
3-4
4-6
6-8
Siz
e c
lass m
Change in density %
Dichrostachys cinerea
0 200 400 600 800 1000 1200
0-0.5
0.5-1
1-2
2-3
3-4
4-6
6-8
Siz
e c
lass m
Change in density %

Structural change of dominant species
Terminalia sericea
0 200 400 600 800 1000 1200
0-0.25 m
0.25-0.5 m
0.5-1 m
1-2 m
2-3 m
3-4 m
4-6 m
6-8 m
> 8m
Siz
e c
las
s
Change in density, %
Dichrostachys cinerea
0 200 400 600 800 1000 1200
0-0.25 m
0.25-0.5 m
0.5-1 m
1-2 m
2-3 m
3-4 m
4-6 m
6-8 m
> 8m
Change in density, %
B.A.
Mesic

Eastern Cape Burn Plots
Albany thicket
Grassland
Savanna
University of Fort Hare Experimental Farm

Eastern Cape Burn Plots
• Started in 1980 by Winston Trollope
• Plots cleared of all trees at the start
• 6 treatments (1, 2, 3, 4, 6 yr, no burn )
• 2 replicate ½ Ha plots per treatment
• Analysed every 4th annual survey
• Variables: tree density and height

Eastern Cape tree density and structure
All burn treatments pooled except for fire exclusion

Increased tree cover in Eastern Cape
1973 2007
1 % tree cover 50 % tree cover

Eastern Cape 1925 Thanks to Timm Hoffmann, James Puttick PCU, UCT

Eastern Cape 1993 Thanks to Timm Hoffmann, James Puttick PCU, UCT

Eastern Cape 2011 Thanks to Timm Hoffmann, James Puttick PCU, UCT

Photo: William Bond
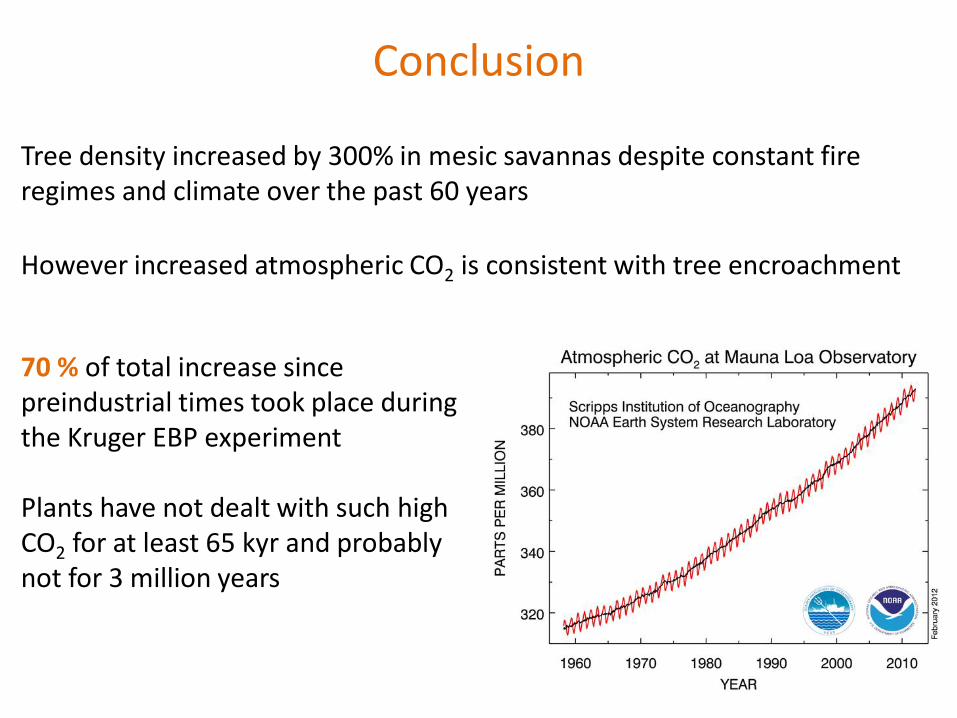
Conclusion
Tree density increased by 300% in mesic savannas despite constant fire regimes and climate over the past 60 years
However increased atmospheric CO2 is consistent with tree encroachment
70 % of total increase since preindustrial times took place during the Kruger EBP experiment Plants have not dealt with such high CO2 for at least 65 kyr and probably not for 3 million years

Acacia karroo
0
20
40
60
80
100
120
140
180 280 370
CO2, ppm
Dry
ma
ss
, g
resprout
shoot
root
Growth response to experimentally elevated CO2
See: Kgope et al. 2010, Austral Ecology Bond and Midgley 2012, Phil Trans Roy Soc. B.
Terminalia sericea
0
50
100
150
200
250
180 215 260 310 375 450
CO2 ppm
Dry
ma
ss
, g
resprout
shoot
root

Growth response in real life…
LGM 180 ppm
Pre-industrial 260 ppm
Ambient 375 ppm
Above-ambient 450 ppm

Thanks To everyone who has helped establish and maintain the
KNP Experimental Burn Plots over many decades and spent countless hours collecting data, particularly
Andre Potgieter and his team (1970s) and Doug Euston-Brown (2000s).
Wellington Shabangu helped collect immaculate data on the EC Burn Plots for 30 years.

Why only in mesic systems? Some speculations:
1. Dominant species in dryer, less fire impacted systems, have smaller carbon sinks than dominant species in wetter, fire dominated systems
2. High grazing pressure in dryer areas prevents seedling recruitment
3. Grasses are superior competitors for the additional soil moisture
4. Trees compete worse in clayey soils