incorporation of capillary-channeled polymer (c-cp) fibers
TRANSCRIPT

Clemson UniversityTigerPrints
All Theses Theses
12-2006
Incorporation of Capillary-Channeled Polymer (C-CP) Fibers Into Micropipette Tips For Solid PhaseExtraction With Applications in BioanalysisDonald ForneaClemson University, [email protected]
Follow this and additional works at: https://tigerprints.clemson.edu/all_theses
Part of the Analytical Chemistry Commons
This Thesis is brought to you for free and open access by the Theses at TigerPrints. It has been accepted for inclusion in All Theses by an authorizedadministrator of TigerPrints. For more information, please contact [email protected].
Recommended CitationFornea, Donald, "Incorporation of Capillary-Channeled Polymer (C-CP) Fibers Into Micropipette Tips For Solid Phase ExtractionWith Applications in Bioanalysis" (2006). All Theses. 298.https://tigerprints.clemson.edu/all_theses/298
INCORPORATION OF CAPILLARY-CHANNELED POLYMER (C-CP) FIBERS INTO MICROPIPETTE TIPS FOR SOLID PHASE EXTRACTION WITH
APPLICATIONS IN BIOANALYSIS
A Thesis
Presented to the Graduate School of
Clemson University
In Partial Fulfillment
of the Requirements for the Degree Master of Science
Chemistry
by
Donald Seth Fornea December 2006
Accepted by:
Dr. R. Kenneth Marcus, Committee Chair Dr. Kenneth Christensen
Dr. Sarah Harcum

ABSTRACT
Solid phase extraction (SPE), is a widely used sample preparation method
that is currently experiencing a surge in research interest, clever
architecture/format development, and stationary phase characterization.1-3 SPE
devices commonly exist in syringe, cartridge, disk, and micropipette tip formats.4
Micropipette tip SPE has enhanced the determination of proteins by electrospray
ionization (ESI) and matrix assisted laser desorption ionization (MALDI) mass
spectrometry (MS) by handling micro-liter volumes of sample and buffer
removal/solvent exchange.5-7 Buffers have deleterious effects on ionization
taking place in MS sources due to preferential ionization, ion suppression effects,
and the formation of adduct species competing for ionization in MS.8 Using
micropipette tip SPE, proteins can be selectively extracted from biological buffers
and exchanged into a solvent more conducive to MS; thereby improving signal
and sensitivity. Capillary channel polymer (C-CP) fibers have been used for
reversed phase separations of proteins with a number of positive attributes
realized.9 The highly efficient fluid transport, low material cost, wide range of
chemical diversity, and robust fiber materials make the C-CP fibers excellent
candidates for various separation formats. Presented here is the introduction of
polypropylene (PP) and polyester (PET) C-CP fibers as a stationary/support
phases for the SPE of proteins from defined buffered solutions prior to ESI-MS10

iii
and MALDI-MS analysis. Using two benchmark proteins, lysozyme in phosphate
buffered saline (PBS) and myoglobin in tris buffer, it was demonstrated by ESI-
MS and MALDI-MS that PP C-CP fiber-extracted protein samples exhibited more
efficient protein ionization, higher signal-to-noise ratios, and more precise
molecular weight determinations when compared to buffered protein samples of
the same concentration. The extraction efficiencies of PET and PP fibers have
been compared for both lysozyme and bovine serum albumin from PBS.
Quantitative as well as qualitative data obtained using ESI-MS, MALDI-MS, and
UV-VIS demonstrates the capabilities of C-CP fibers as SPE sorbents in
bioanalysis.

iv
DEDICATION
I am dedicating this work to my loved ones. It is through their support,
attention, and dedication that I gathered strength and motivation to complete my
graduate work at Clemson University.
To my family, thank you for lending a phone call, a letter, a watermelon, or
fruitcake in the mail just to remind me that I have unconditional love and support.
To my friends from NSU, thank you for the fond memories and laughter
that made the bleak times at Clemson seem short and passable.
To Sebastian, thank you for the future. Often I look ahead to the life and
adventure we will experience in the many roads and places we may travel
together.

ACKNOWLEDGMENTS
I thank Dr. R. Kenneth Marcus for his dedication and demand for
excellence among his students. Dr. Marcus has continually asked for the best of
my abilities in terms of scientific research and guided me through until the very
end. I thank Dr. Marcus for dedicating himself to meticulously read my papers,
abstracts, and posters.
I thank Dr. Yonnie Wu for his hours of work teaching me how to run the
ESI and talking with me about his and my research. His support, guidance, and
friendship will be remembered.
I thank Dr. Ken Christensen for the use of his laboratory equipment. He
was always willing to let me use anything I needed to complete experiments.
I thank the entire Marcus Research Group both past and present for their
continued support and friendship throughout my graduate career. Our teamwork
and group ethics are important and vital to the success of a graduate student.
Each person in the Marcus Research Group has lent a supportive and enduring
friendship that facilitated my work. I also thank Adrianna Chaurra for her
friendship and support.
I extend my gratitude to Dr. Gillian Rudd, Dr. Darrell Fry, Dr. Elizabeth
Bede-Guin, Mr. Ken Daughdrill, and Dr. Mary Striegel for my education and
laboratory skills.

vi
TABLE OF CONTENTS
Page
TITLE PAGE.............................................................................................. i ABSTRACT ............................................................................................... ii DEDICATION ............................................................................................ iv ACKNOWLEDGEMENTS.......................................................................... v LIST OF TABLES ...................................................................................... ix LIST OF FIGURES .................................................................................... x CHAPTER 1. INTRODUCTION.......................................................................... 1 1.1 Brief History ...................................................................... 2 1.2 Basic Mechanisms in Solid Phase Extraction ................... 6 1.2.1 Retention/Adsorption ................................................ 8 1.2.2 Sample Purification-Rinsing/Washing ...................... 13 1.2.3 Elution...................................................................... 13 1.3 Objectives......................................................................... 15 1.3.1 Concentration of Analyte.......................................... 15 1.3.2 Interference Removal/Solvent Exchange................. 16 1.4 Column Technology.......................................................... 17 1.4.1 Architecture.............................................................. 18 1.5 Interactions ....................................................................... 21 1.5.1 Non-Polar................................................................. 21 1.5.2 Polar ........................................................................ 23 1.5.3 Ion-Exchange........................................................... 24 1.6 Polymer Phases................................................................ 27 1.7 Applications of Solid Phase Extraction ............................. 32 1.8 Summary .......................................................................... 38

vii
2. CAPILLARY CHANNELED POLYMER (C-CP) FIBERS AS STATIONARY PHASE FOR DESALTING OF PROTEIN SOLUTIONS PRIOR TO ELECTROSPRAY IONIZATION MASS SPECTROMETRY ANALYSIS.......................................... 42
Abstract................................................................................... 42 2.1 Introduction ....................................................................... 43 2.2 Experimental Section ........................................................ 45 2.2.1 Reagents and Chemicals ......................................... 45 2.2.2 Fiber Tip Construction .............................................. 45 2.2.3 Protein Loading Washing and Elution....................... 47 2.2.4 Mass Spectrometry................................................... 48 2.3 Results and Discussion..................................................... 49 2.3.1 Electrospray Ionization of Extracted Lysozyme ........ 49 2.3.2 Electrospray Ionization of Extracted Myoglobin........ 51 2.4 Conclusions ...................................................................... 53 3. SOLID PHASE EXTRACTION OF PROTEINS FROM
BUFFERED SOLUTIONS USING CAPILLARY CHANNELED POLYMER (C-CP) FIBERS: MASS BALANCE, RECOVERY, AND EXTRACTION CHARACTERISTICS ................................................................... 55
Abstract................................................................................... 55 3.1 Introduction ....................................................................... 56 3.2 Experimental Section ........................................................ 62 3.2.1 Reagents and Chemicals ......................................... 62 3.2.2 Fiber Tip Construction .............................................. 62
3.2.3 C-CP™ Fiber Protein SPE Using Centrifugation to Induce Fluid Movement ................................................. 64 3.2.4 Comparison of Aspiration and Centrifugation as Fluid Movement Methods in C-CP Fiber SPE ................... 65 3.2.5 Quantification of Lysozyme and BSA in Effluent, Rinse and Eluted Fractions ................................. 66 3.2.6 Instrumentation and Data Analysis ........................... 67
3.3 Results and Discussion..................................................... 68 3.3.1 Comparison of Aspiration and Centrifugation as Loading Methods in C-CP™ Fiber SPE............................. 68 3.3.2 Protein Quantification Throughout C-CP Fiber SPE .......................................................................... 71 3.4 Conclusions ...................................................................... 78

viii
4. CAPILLARY CHANNELED POLYMER (C-CP) FIBERS AS STATIONARY PHASE FOR DESALTING PROTEIN SOLUTIONS FOR MATRIX ASSISTED LASER DESORPTION IONIZATION MASS SPECTROMETRY ANALYSIS ...................................................................................... 81
Abstract................................................................................... 81 4.1 Introduction ....................................................................... 82 4.2 Experimental Section ........................................................ 85 4.2.1 Reagents and Chemicals ......................................... 85 4.2.2 Fiber Tip Construction .............................................. 85 4.2.3 Adaptation to the Centrifugation Format................... 86 4.2.4 Protein Loading, Washing, and Elution..................... 87 4.2.5 Mass Spectrometry................................................... 88 4.3 Results and Discussion..................................................... 88
4.3.1 Matrix Assisted Laser Desorption Ionization of Extracted Lysozyme ...................................................... 88 4.3.2 Matrix Assisted Laser Desorption Ionization of Extracted Myoglobin ...................................................... 91 4.4 Conclusions................................................................. 92
5. CONCLUSIONS........................................................................... 94 5.1 Summary .......................................................................... 94 5.1 Future Work ...................................................................... 96 APPENDIX ................................................................................................ 98 REFERENCES.......................................................................................... 99

LIST OF FIGURES
Figure Page 1.1 Isolate, sorbent, and matrix interaction triangle ........................... 7 1.2 Complete solid phase extraction experiment ............................... 15 1.3 The solid phase extraction cartridge ............................................ 19 1.4 Non-selective retention vs. selective retention............................. 23 1.5 SEM image of a single polyester fiber.......................................... 29 2.1 C-CP™ fiber micropipette tip assembly procedure ...................... 47 2.2 Electrospray ionization mass spectra of lysozyme pre and post-extraction ............................................................................ 50 2.3 Electrospray ionization mass spectra of myoglobin pre and
post-extraction ............................................................................. 52 3.1 Adaptation of the C-CP™ fiber-packed tips to the centrifugation format........................................................................................... 65
3.2 Comparison of Centrifugation to Aspiration as Loading Methods ....................................................................................... 69
3.3 Extraction of lysozyme from PBS using polypropylene fibers ...... 76 3.4 Extraction of lysozyme from PBS using polyester fibers.............. 77 4.1 Matrix assisted laser desorption ionization mass spectra of lysozyme pre and post extraction from phosphate buffered saline ........................................................................................... 89 4.2 Matrix assisted laser desorption ionization mass spectra of myoglobin pre and post extraction from tris buffer....................... 91

LIST OF TABLES
Table Page 3.1 Protein Quantification During C-CP Fiber SPE ............................ 72

CHAPTER 1
INTRODUCTION
The task of sample preparation has challenged analytical laboratories by
demanding more reproducible results, accommodating lower technical skills,
decreasing the use of organic solvents while providing cleaner extracts, and
making the process quicker and more cost effective.4 It has been previously
shown that more than 60% of analysis time was spent on preparing the sample
as opposed to only 7% on data acquisition or the actual measurement.11 Many
techniques exist for sample preparation such as liquid-liquid extraction (LLE) and
solid phase extraction (SPE). As a sample preparation technique, LLE has
enjoyed popularity, but suffers due to its slow labor-intensive nature and
environmental hazards of disposing large amounts of organic solvents.4
However, SPE is more easily automated, faster, and generally more efficient
than LLE. SPE is a field of methods employed for sample preparation, isolation,
concentration, and purification of analytes in complex matrices, defined, and
undefined solutions. The technique has become a popular and powerful
technique for both chemical isolation and purification.12 The mechanism of SPE
involves the adsorption of analyte from a liquid or gaseous solution to a solid
phase, washing or rinsing to remove interferences, and finally elution in a solvent
suitable for further instrumental analysis. The chemistry of the solid phases are

2
continually developed to meet the needs and applications of SPE in
pharmaceutical, fine chemical, biomedical, food analysis, organic synthesis, and
environmental laboratories.12, 13 The development of SPE sorbent types and
architecture formats has experienced considerable growth in the last decade.
For example, between 1994 and 1998, manufacturers introduced 84 new SPE
products with various designs, applications, and stationary phase formats.14
1.1 Brief History of Solid Phase Extraction
SPE was not recognized as a scientific technique until the 1970s.
Considering the three objectives of SPE: 1) concentration, 2) removal of
unwanted molecules from the sample (commonly referred to as sample clean-
up), and 3) removal of the sample matrix and/or solvent exchange, it is
somewhat surprising that the technique did not gain momentum earlier.15 The
advent of disposable sorbent cartridges, containing porous particles to allow
sample preparation and processing by gentle suction, contributed to the initial
popularity of SPE devices in the 1970s.16 However, prior to the 1970s, solid
phases or particles such as carbon and porous polymeric resins were simply
known as “sorbents” and were used to removed trace organic solutes from
aqueous samples.4 Columns filled with this type of solid sorbent were sometimes
referred to as “accumulation columns”. As an example, in 1971 the American
Public Health Association became quite concerned about the wide variety of
chemical pollutants found in water supplies. Of primary concern were organics,
more specifically pesticides that had found their way to municipal water

3
supplies.17 In 1972, using Rohm and Haas XAD-2, a polymeric resin, Burnham
et al. completed a study that demonstrated the need for sample pre-
concentration in order to determine pollutants in water samples.18 The study
analyzed pollutants in the water supply of Ames, Iowa which had been noted to
have an unpleasant taste and aroma. Preliminary data had identified the
contaminants as phenols and cresols. However, a pre-concentration step was
necessary to allow analytical detection and identification of the contaminants. To
accomplish this, Burnham et al. extracted the unwanted organics by passing 150
liters of water through a polymer resin column (1.5 X 7.0 cm) at 50 mL/min. The
adsorbed organics were eluted by passing 15 mL of ethyl ether through the
column. The ethyl ether was evaporated into a smaller volume and smaller
portions were analyzed by gas chromatography-mass spectrometry (GC-MS).
Interestingly, the identified contaminants were related to an abandoned coal gas
plant, operated in the 1920s, near the city of Ames. The residues were buried in
a pit and had found a way to the water supply.18 This is an example of how SPE
can be used to extract, concentrate, and re-introduce analytes into a solvent
ready for instrumental analysis, making analytical detection and identification
possible.
Several years prior to 1970 and the work of Burnham et al., activated
carbon had been used as an absorptive material for concentrating organics in
water.4 Carbon was used as an adsorbent material because of its high surface
area and high affinity for organic isolates in water. The method was called the
carbon adsorption method (CAM). Junk et al. studied and reported the recovery

4
of 58 various compounds ranging from alcohols, alkanes, aromatics, PCB, and
phenols. The average percent recovery reported using carbon as a sorbent was
22%, conversely the average percent recovery using the XAD-2 resin for the 58
compounds was 59%.19 They found that activated carbon suffered low recoveries
due to irreversible adsorption when compared to organic polymer resins for
isolating organic pollutants from water.
After the 1970s stationary phase development in SPE followed closely
with that of high performance chromatography (HPLC).20, 21 In both techniques,
bonded-phase silica, more specifically C18, dominates the field. Early literature
using SPE on bonded phase silica was published in 1978 and described the use
of the Sep PakTM C18, a trademark of Waters Corporation, Milford, MA., for the
cleanup of histamines from wines and musts.22 As a stationary phase C18, due
to it carbonaceous character, is well suited for non-polar interaction HPLC or
SPE. Currently, SPE sorbent types in use are of the bead shape and are
commonly packed into a cartridge or a column.21, 23 Also of current development
and use is the incorporation of sorbent particles into disk formats.24-28 The disk
format has allowed good extraction recoveries at relatively high flow rates due to
the use of small porous particles and the rapid mass transport they afford.
Early in the 1990s, rigid porous monoliths made from organic polymers
were introduced as alternative stationary phases for liquid chromatography.29-31
Shortly after, monolithic polymer stationary phases made their way into the field
of SPE. The first monolithic polymer incorporated into a SPE device was
poly(styrene-co-divinylbenzene) (PS-DVB).32 Huck et al. investigated the

5
recovery of 13 pesticides, using both PS-BVD and octadecyl silica (ODS)
phases.33 It was found that PS-DVB was able to achieve and average recovery
of 77% for all thirteen compounds in comparison to 69% achieved by ODS. PS-
DVD copolymers proved very effective for the recovery of non-polar compounds
due to their inherent hydrophobicity. Monolithic sorbents were also found to be
excellent materials for high flow rate SPE experiments. The advantages of
monolithic SPE sorbent are the highly interconnected pores, excellent
permeability, and enhanced mass transfer due to enabled convectional flow
through the channels. Though PS-DVB copolymers were highly effective for
extraction of non-polar analytes, polar analytes were most often less well
retained.34, 35 In an effort to expand polymer-based sorbents to achieve
hydrophilic interactions, a variety of functionalized polymer beads were
introduced to enhance polar analyte retention.23, 33
In addition to aiding the analysis of analytes in environmental samples,
SPE has also found a niche in the area of proteomics, most notably the
extraction of proteins and peptides.8 New format types, including sorbent phase-
packed micropipette tips, have permitted the handling of micro-liter amounts of
samples. This has proven especially important in bio-analysis where the
quantitative transfer of small amounts of sample is sometimes a necessity.
The evolution of SPE sorbents, formats, and architecture, often parallel
and compliment those in HPLC. While an appreciation of historical milestones is
equally important in understanding the impact SPE has had on sample

6
preparation, it is even more important to understand the mechanisms, chemistry,
and driving forces that make the technique such as success.
1.2 Basic of Mechanisms of Solid-Phase Extraction
SPE can be well related to LLE, and comparing the two is an exceptional
means of understanding SPE.33 In a LLE experiment, the analyte and sample
matrix is agitated with an extracting solvent, which is not miscible with the sample
matrix. After agitation is complete, the sample matrix and the extracting solvent
will form two layers with the analyte being partitioned between the layers. The
equilibrium formed is governed by the partition coefficient for the analyte, which
is the ratio of the concentration of the analyte in the extracting solvent to the
concentration in the sample matrix.13 A high partition coefficient would indicate
that most of the analyte has migrated to the extracting solvent, which is desirable
and often the goal of any LLE and also indicates that the extraction solvent
provides a more favorable environment for the analyte.15 However, LLE suffers
many drawbacks as presented in section 1.1. One other difficulty, substances
with similar distribution coefficients (KD) require multiple extractions because the
number of theoretical plates is low.14, 36, 37 All things being considered, SPE can
provide fewer steps, less solvent consumption, reduced labor, increased
efficiency, and allow easy sample collection and automation.
SPE involves the partition of an analyte between a solvent and a solid
phase, with the solid phase having a greater attraction for the analyte than the
solvent in which the analyte is dissolved.12 As the sample solution passes over a
7
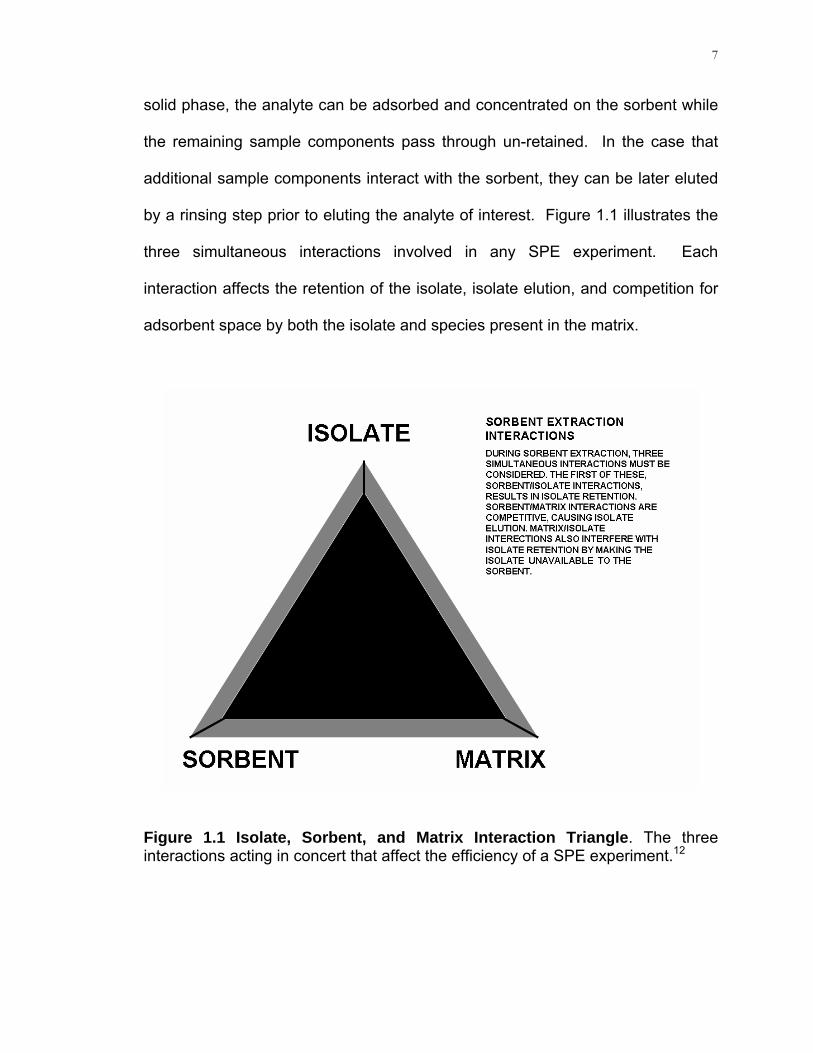
solid phase, the analyte can be adsorbed and concentrated on the sorbent while
the remaining sample components pass through un-retained. In the case that
additional sample components interact with the sorbent, they can be later eluted
by a rinsing step prior to eluting the analyte of interest. Figure 1.1 illustrates the
three simultaneous interactions involved in any SPE experiment. Each
interaction affects the retention of the isolate, isolate elution, and competition for
adsorbent space by both the isolate and species present in the matrix.
Figure 1.1 Isolate, Sorbent, and Matrix Interaction Triangle. The three interactions acting in concert that affect the efficiency of a SPE experiment.12

8
1.2.1 Retention/Adsorption
Retention or adsorption can be applied to most natural physical, biological,
and chemical systems. Adsorption in SPE occurs when a substance moves from
one phase and accumulates on another. The adsorbing phase is commonly
referred to as the sorbent, adsorbent, solid surface, or stationary phase. The
adsorbing species (analyte) is referred to as the adsorbate, isolate, or solute.38 In
the case of SPE, an equilibrium concentration of the analyte develops between
the matrix solution and the solid surface. This equilibrium can be described as
the distribution of the adsorbate between the solid and liquid phase at the point
when no additional net adsorption occurs.38 The equilibrium can be
thermodynamically defined by the distribution coefficient KD. KD is a measure of
the amount of analyte that has adsorbed on, interacted with, or the amount that
has penetrated the solid phase versus the amount that remains in the sample
matrix solution.15 KD can be visualized by the following equation:
KD=[analyte]sorbent/[analyte]sample Eq. 1
A KD>1 would indicate that the analyte has a stronger affinity or interaction with
the sorbent than the sample matrix solution. Whereas a KD<1 would indicate that
a greater fraction of the adsorbate remains in the sample solution, thus indicating
the sample solution provides an energetically more stable environment for the
adsorbate.39

9
The retention behavior of a given analyte, or the KD, is a function of three
factors: the analyte, the solvent, and the sorbent. For the analyte, molecular
weight, molecular size, molecular structure, molecular polarity, steric form or
configuration, and if present, the nature of competitive analytes present in
solution all play important roles affecting the extent of retention.38 With any
analyte, the solvent and sorbent can be altered and thus the retention factor, or
the KD, can be manipulated for a specific purpose. For the sorbent, surface
area, physicochemical nature of the surface, availability of that surface to the
analyte, physical size, morphology, and form all play crucial roles affecting
adsorption.
As an example, organic compounds of a particular class become
increasingly insoluble in water as molecular weight and size increase. Therefore,
as organic compounds in aqueous solution become increasingly insoluble, their
respective degree of expulsion from solution onto a non-polar stationary phase
increases.12 As with high performance liquid chromatography, the molecular size
of the adsorbate can affect retention where mass transport into porous phases is
of concern. Small and large molecules of a given chemical class may have
different rates of diffusion or mass transport within porous sorbents.38 Equally
important for the adsorption process are both the pH and temperature of a given
system. The pH of a given system can effect the degree of ionization or charge
of a given adsorbate and/or adsorbent, thus affecting the types of
adsorbate/adsorbent interactions possible. Temperature can affect the
equilibrium capacity or sorbent saturation and the rate of adsorption.

10
Thermodynamically, adsorption processes are, on average, exothermic. The
enthalpy change can be expected to be on the same order of magnitude as for
condensation and/or crystallization reactions. Also, the capacity of a given
system is expected to increase with decreasing temperature; conversely, the rate
at which a given system reaches equilibrium capacity is expected to increase
with increasing temperature.38
Retention can also be affected by the pretreatment of the sorbent bed.
Solvation, a process of “prewetting” the sorbent bed, is a common practice of
preparing the sorbent to receive the analyte. It is achieved by passing several
bed volumes (volume of liquid phase required to fill the fraction of SPE device not
occupied by sorbent) of the sample/matrix solvent through the sorbent bed
before introducing the analyte. Solvation has been shown to create an
environment that allows analytes to interact more reproducibly with sorbents.12
The reproducibility of adsorption of any SPE experiment benefits from the
homogenous treatment of the sorbent, thus the goal of solvating the sorbent bed.
However, even though routine treatment of the sorbent increases the likely
precision, behavior of adsorbates at the solid-liquid interface is of even greater
complexity, especially when macromolecules are of concern.
The retention of macromolecules, such as proteins, often differs drastically
from that of small molecules. The difference in retention characteristics is
attributed to the conformational changes that macromolecules can attain both in
the sample solution and at the sorbent interface.39 Three areas of classification
exist to describe adsorption characteristics of proteins and related
11
macromolecule species. They are: 1) protein characteristics, including protein
conformational variability, geography and nature of hydrophobic sites, three-
dimensional structure in solution, net charge and charge variance, and isoelectric
point; 2) surface characteristics, including heterogeneity and nature of
topography, electrical potential, hydrophobicity, water binding, and composition;
and 3) medium conditions, including buffer type, pH, flow characteristics,
equilibrium concentration, ionic strength, and temperature.40
The adsorption of molecules at the solid-liquid interface is the result of
electromagnetic interactions between the individual atoms, ions, molecules, or
molecular regions of the adsorbate and the surface.38 The binding forces can be
as weak as van der Waals to as strong as covalent bonds in chemisorption.40 In
principle, adsorption can be categorized into four regimes; exchange, physical,
chemical, and specific. Exchange adsorption, also called ion exchange, is
described by the electrostatic interaction of an ionic species with an opposite
charge on the surface of a sorbent. Physical adsorption is comprised of van der
Waals forces resulting from London dispersion forces and electrostatic forces.
Chemical adsorption results in a change in the chemical form of the adsorbate
due to the reaction with the adsorbent resulting in a chemisorptive bond. The
chemisorptive bond is notably stronger than the adsorbate/adsorbent interaction
resulting from physical adsorption. Specific adsorption is a hybrid between both
physical and chemical adsorption. It involves the specific attachment of an
adsorbate to a functional group present in an adsorbent surface that does not
result in transformation of the adsorbate. Specific adsorptions can have a wide

12
range of binding energies, ranging between the low binding energies of physical
adsorptions to the higher energies associated with chemisorption. In most
cases, the total net adsorption describing the affinity of an adsorbate for an
adsorbent is the combination of all four adsorption regimes.38
The solvent in which the adsorbate is solvated plays a key role in the
extent of adsorption. Key attributes of the solution phase that affect adsorption
are both the surface tension and solubility. Solvophobicity, related to solubility,
describes the insolubility of a substance in the solvent phase. For any given
solid phase extraction experiment, it is desirable for an adsorbate to have a
relatively high solvophobicity for the initial sample matrix. In that way, the
adsorbate can partition from that solvent at interfaces with other phases.38 In
other words, the bonding that occurs between an adsorbate and the solvent must
be broken to allow adsorption from that solvent to the adsorbent. The more
soluble an adsorbate is in a given solvent, the smaller the extent of adsorption.
Equally important for adsorption to occur is the particular affinity an adsorbate
may have for a particular adsorbent. Therefore, two of the primary forces
affecting the degree of adsorption are both the solvophobicity of the adsorbate in
a given solvent and the affinity of the adsorbate for the given adsorbent. These
forces are continually acting in concert and in many ways dictate how effective a
SPE experiment can be. The types of interactions will be discussed later in
detail.

13
1.2.2 Sample Purification-Rinsing/Washing
The desired result of retention is to extract the analyte of interest from the
sample matrix solution. However, at times, species from the sample matrix can
be co-retained with the analyte of interest on the solid phase. To eliminate
interferences from the co-retained species during the analysis stage a rinsing or
washing step is employed. Wash conditions can be carefully controlled to
preserve maximum analyte retention and co-retained species elution. The
addition of a rinsing step involves another distribution between the analyte and
the interfering species, the sorbent and the liquid wash phase passing over the
sorbent.15 However, retention must be strong enough such that after passing
~20 bed volumes of wash solvent through the SPE apparatus, elution will not
occur.12 As an example, when analyzing proteins by electrospray ionization
mass spectrometry (ESI-MS), it has been shown advantageous to perform a
wash step to removed any residual buffering species that could compete for
ionization during analysis.8
1.2.3 Elution
When an analyte is retained on a solid phase, a more desirable
environment must be provided to remove or elute the analyte from the solid
phase. In most cases, a liquid is employed to elute or desorb the analyte from
the stationary phase. If the liquid provides a more desirable environment for the
analyte, the analyte will desorb from the sorbent and exist in the liquid, which can
be collected.15 The distinction between traditional chromatography and SPE,

14
where retention and elution are concerned, is that in SPE the goal is to
immobilize the analyte until movement is facilitated by the elution solvent. In
some cases, it is desirable for the elution solvent to completely desorb the
analyte in the smallest possible volume, thereby concentrating the analyte; in
some cases this is not an issue. For example, an adsorbate can be
concentrated by carefully selecting extracting conditions such that the adsorbate
is retained in a narrow band and then eluted using a smaller volume than it was
originally contained. These near perfect conditions are the result of a well
understood extraction process where careful attention has been placed on the
aforementioned conditions (temperature, pH, sorbent type, etc.) affecting
retention and elution.
A complete solid phase extraction involves the careful manipulation,
selection, and control of all parameters. Sorbent type, solvent (both wash and
elution), and solution matrix can all be manipulated to enhance analyte retention
and reintroduce the analyte into a solvent more conducive to further analysis.15
Figure 2 is an example of what a complete solid phase extraction can resemble.
The effective isolation, recovery, and purification of a particular analyte has been
achieved.

15
Figure 1.2. A complete solid phase extraction experiment. All the necessary steps to ensure sample elution, purification, and isolation are included, adapted from reference (12).
1.3 Objectives of SPE
1.3.1 Concentration of Analyte
Limits of detection, signal to noise ratios, and sensitivity all play an
important role in most analyses. 15 SPE can assist chemical analysis by
concentrating the analyte in the following ways: 1) A large volume of the sample
can be passed through a minimized volume of sorbent that is optimized to elicit
maximum retention of that analyte, 2) Minimization of elution volume. 3) Elution
into volatile solvents which can be easily evaporated, further concentrating the
16
analyte. In the case of analyte concentration, sorbents that have a high capacity
for a particular analyte, thus minimizing the amount of sorbent needed or the
sorbent bed volume and concentrating the analyte in a smaller volume can be
chosen. By changing the elution solvent to provide a more desirable
environment for the analyte, the elution volume can be minimized, thus placing
the same number of moles of analyte (assuming a highly efficient recovery) in a
smaller volume. Also, by elution into volatile solvents the volume of that eluent
can be reduced by evaporating the volatile solvent.
1.3.2 Interference Removal/Solvent Exchange
Assuming a successful concentration of analyte is achieved by SPE,
analysis can still be quite complex if sufficient sample clean up is not reached.
Interfering compounds or matrix effects can co-elute and mask or suppress the
signal from the analyte. In a complete and optimized SPE experiment, sorbent
type, wash phase, and elution phase are chosen to selectively bind analyte,
wash interfering compounds away, and elute the analyte free of interference and
suppression. This is the goal of sample clean-up.15 For example, proteins and
peptides often exist in biological buffers of high salt concentration. These small
inorganic salts can compete for ionization when the in solution with proteins
during mass spectrometry (MS) analysis. It is often necessary to perform SPE
on protein samples to allow protein retention, buffer removal, followed by protein
elution/ solvent exchange prior to MS analysis.8

17
In keeping with the theme of SPE objectives, it would be unjust not to
discuss the benefits of sample matrix removal/solvent exchange. Instruments
such as mass spectrometers, gas chromatographs, and nuclear magnetic
resonance elicit the need for the analyte to be housed or contained in a specific
solvent or solution. SPE can readily achieve solvent exchange by eluting the
target analyte in a mobile phase favorable to the instrumental technique being
employed. Sorbent type, and elution conditions can be chosen and optimized so
that the eluted analyte can be directly analyzed on the instrument of choice with
no further sample preparation or pre-analysis treatment.15 As an example, gas
chromatography mass spectrometry (GC-MS) is a common analytical technique
employed for samples analysis. However, it requires that analytes be introduced
in volatile solvents to permit entrance to the gas phase. This would indicate the
careful selection needed for the SPE methodology to allow sample elution by a
solvent conducive to the respective GC-MS requirements.
1.4 Column Technology
In addition to SPE being an exceptional methodology for sample
preparation, it also offers a multiplicity of architectures and sorbent types. The
apparatus technology and sorbent type can be fabricated to fit the specific needs
of a particular setting, instrument, or application. SPE architecture and sorbent
types will be discussed in detail so that the diversity of available formats is
realized.

18
1.4.1 Architecture
The four basic formats for SPE are cartridges, disks, syringe barrels, and
micropipette tips.8, 13, 15 Each type offers its own set of advantages and has
particular applications and settings best suited for its size, shape, and form.
A standard SPE cartridge can be made or formatted into a typical syringe barrel
or some variation. In most cases, the stationary phase occupies approximately
one-third of the volume of the SPE apparatus.15 Sorbent bed masses in
cartridges can range from as little as 10 mg to as much as 10 g. Judgment and
selection of cartridge volume and bed mass is dependent on the limit of
detection, desired sensitivity, and sample size. Most cartridges consist of a
polyethylene body and allow positive pressure as well introduction to a vacuum
manifold.13 The packing material is compressed with frits to hold it in place and
improve cartridge flow characteristics. A SPE cartridge in its most simplistic form
is illustrated in Figure 3.
Chromatographic media formatted into small objects resembling coins or
resembling a very thin, wide SPE cartridge are referred to as disks. Three types
of disks are employed as commercial products. The sorbent can be 1)
enmeshed into an inert polymer or 2) trapped in a glass fiber or 3) paper filter.15
Because sorbent material can be trapped or contained by another size/shape
retaining compound or material, the same sorbent types found in cartridges are
also found in disks. The disk format results in a SPE device much like a
cartridge and is commonly housed in a syringe barrel and used in the same
manner as a cartridge.

19
Sorbent
Sample Reservoir
Figure 1.3 The SPE cartridge. The SPE cartridge can take various forms, but always contains an area for sample introduction or sample reservoir, and an area filled with sorbent material.4
Driving the development of the disk format was the need to process
sample volumes in less time than the cartridge architecture permitted. Because
total length of the sorbent bed traveled by an analyte solution is usually shorter in
the disk format, faster flow rates are not as pressure limited as with the cartridge
format. The small volume of the disk also allows smaller conditioning, washing,
and elution volumes to be used in extraction.13
Syringe barrels are usually the largest of the four types and can have
packing volumes and packing masses of 1 to 25 mL and 50 mg to 10 g,
respectively. Typically syringe barrels are made of polypropylene. Sample
reservoirs come in a range of sizes and are more commonly 50 to 100 mL and

20
are used for the processing of larger sample volumes such as environmental
samples.13
New formats for sample preparation have been developed due to the push
for miniaturization and the need to handle microliter and sub-microliter amounts
of analyte. In the micropipette SPE devices, the stationary phase is packed,
embedded or coated on the walls of the pipette tip. Micropipette SPE devices
are especially beneficial when dealing with samples such as biological fluids,
when purification and concentration are strategic to instrumental analysis.
Micropipette SPE devices are heavily involved in the sample preparation
techniques in genomics, proteomics, and metabolomics, where quantitative
handling and transfer of micro-volumes of sample is crucial.8 Matrix assisted
laser desorption ionization mass spectrometry (MALDI-MS) and Electrospray
ionization mass spectrometry (ESI-MS), two techniques for bioanalysis, both
require microliters of sample and thus benefit from analytical SPE on the micro-
scale.41, 42 In the 1990’s, the first commercially available micro-SPE devices
were sold as micropipette tips with C18 chromatographic media incorporated into
the tip. The tips were developed by the Millipore Corporation (Bedford, MA)
under the trade name of ZipTipsTM. Present day micro-SPE tips are available
from a number of manufacturers, offering a wide range of stationary phase
chemistries that may be used in different types of applications.

21
1.5 Interactions
The sorbents employed in SPE often are parallel to those used in liquid
chromatography.13 Sorbent/support phases can include, but are not limited to,
reversed phase, ion exchange, normal phase, hydrophobic interaction,
immobilized metal affinity, affinity chromatography sorbents, and polymer-based
phases.
1.5.1 Non-polar Interactions
In this type of separation, a non-polar, relatively hydrophobic stationary
phase is employed to extract non-polar analytes from polar, often aqueous,
sample matrices. In some cases, an aqueous wash is applied to the SPE device
prior to elution by an organic solvent as a means of sample clean-up and a
matrix removal. The mechanisms for interaction are van der Waal’s forces as
well as secondary interactions that can aid in extraction such as hydrogen
bonding and dipole-dipole interactions.4, 8, 13 More specifically, the mode of
adsorption for reversed-phase are the interactions between the carbon-hydrogen
bonds of the adsorbate and the carbon-hydrogen bonds of the adsorbent.12
Unbonded silica does not yield non-polar interactions alone, it is only when
sorbent functional groups such as C18, C8 or CH are added that non-polar
interaction arise. C18 is the most commonly used chemically bonded silica
exhibiting non-polar interactions. However, because many adsorbates that are
or have non-polar sites can be retained on C18, it is considered a non-selective
sorbent.

22
As a general rule, non-polar extractions are not as selective as ion-
exchange or even polar extractions. As such, reversed-phase SPE might not
prove highly successful in an attempt to selectively extract an adsorbate from
other samples matrix components that are similar in structure. However, in some
cases, usually environmental, it is desirable to extract groups of compounds that
are dissimilar in structure, but collectively non-polar. Figure 4 demonstrates the
problem associated with a non-selective stationary phase when several analytes
of similar structure or chemistry are present. In some cases, non-selective
sorbents can simultaneously retain unwanted compounds from the sample matrix
along with the analyte. Non-selective retention is demonstrated in by the
adsorption of all the species present in the solution. Selective retention is
demonstrated by the selective adsorption of the analyte and the flow through of
the other species present in the solution.
Reversed-phase interactions are usually aided by having the analyte in a
very polar, often aqueous, solvent environment. In this way, the polar solvent
can help to facilitate the retention of the non-polar analytes. Following retention
the adsorbate can then be eluted by a solvent having some degree of non-polar
nature strong enough to overcome the adsorbate/sorbent interactions.
Depending on the strength of the adsorbate/sorbent interaction, the non-polar
character of the eluent can be adjusted to facilitate elution.12

23
Figure 1.4 Non-selective retention vs. Selective retention. In the SPE experiment on the left non-selective retention of several isolates has occurred due to the extraction chemistry employed. On the right, selective retention of the isolate had be attained extraction chemistries with a strong affinity for that particular isolate.12
1.5.2 Polar Interactions
Opposite to reversed-phase, normal-phase chromatography consist of
sorbents constructed of materials more polar than either the solvent and/or the
sample matrix being applied to the sorbent.13 The primary mechanisms for
analyte retention in the case of polar interactions are hydrogen bonding, dipole-
dipole interactions, induced dipole-dipole, π-π, and a variety of others involving
the unequal distribution of electrons12. In the case of normal-phase SPE, the
more polar analyte is extracted from the organic sample matrix due to retention
onto the more polar stationary phase followed by elution by a more polar solvent.
4, 13 Polar interactions can be exhibited by groups such as hydroxyls, amines,

24
carbonyls, aromatic rings, sulfhydryls, double bonds, and any groups containing
heteroatoms such as oxygen, nitrogen, sulfur, and phosphorus.12
One of the more significant types of polar interactions, hydrogen bonding,
affects retention when hydrogen bonded to an electronegative atom (oxygen or
nitrogen) interacts with another surface bearing a relatively electronegative atom.
The interactions that affect polar retention are facilitated by the adsorbate
existing in a non-polar solvent, the opposite of non-polar retention. The stronger
polar interactions that can occur between the polar adsorbate and the adsorbent
cannot be easily overcome by the weaker, non-polar interactions (van der Waals)
the adsorbate may have with a non-polar solvent. Polar interactions can be
disrupted by the introduction of a polar solvent due to the competition or partition
of the polar analyte between the adsorbent and the polar solvent
1.5.3 Ion-Exchange
SPE extraction applications involving ion exchange sorbents isolate
analyte based on the charge of the molecule.13 For example, the charge on a
protein can be manipulated by changing the pH, thus allowing the use of ion-
exchange sorbent formats for extraction.8 The ion-exchange interaction can
occur when a charged adsorbate in the presence of an oppositely charged
adsorbent results in the immobilization of that adsorbate onto the adsorbent due
to their attractive forces. Ion-exchange interactions are divided into two
categories, cation exchange and anion exchange. Cation exchange refers to
positively charged adsorbates while anion exchange refers to negatively charged

25
adsorbates. Effective ion exchange interactions have two requirements that
must be met in order to ensure proper retention. First, the pH of the system must
be such that both the adsorbate and the adsorbent are charged. Second, it is not
desirable for the matrix/solvent containing the adsorbate to have a charged
species that competes with the adsorbate for retention on the oppositely charged
adsorbent such as salts and buffers.12
Knowledge of the pKa and pI values of each group present in the system
(both for the adsorbate and adsorbent), is required to manipulate the interactions.
The pI of a particular functional group or molecule is the pH at which an equal
distribution of charged and uncharged groups/molecules exists resulting in an
overall net charge of zero.43 At pH values below the pI, the net charge on the
molecule is positive,conversely, at pH values above the pI the net charge is
negative. The pKa of a molecule is the pH at which 50% of the groups carry a
charge.43
For ion exchange, it is also important to have the pH two units below or
above the pKa value of the group or molecule so that 99% of all groups present
are carry a charge. The greater percentage of adsorbate molecules carrying the
same charge, more reproducible retention can be expected.
The ionic strength of the solvent/matrix in which the adsorbate is in also
plays a crucial role in adsorbate retention. Ionic strength, a reflection of the total
ion concentration in the solution, can affect retention by the ionic species present
competing with the adsorbate for interaction space with the adsorbent. Thus, it
can be said that solutions of low ionic strength may promote retention of the

26
adsorbate, while solutions of high ionic strength may disrupt adsorbate retention
through competitive mechanisms occurring in concert for oppositely charged
sites on the adsorbent.
As an example of selectivity and ionic strength competition, a strong
anion-exchange adsorbent such as a quaternary amine will exhibit a 250-fold
interaction preference with a citrate anion over an acetate anion. Therefore, the
addition of an adsorbate in a citrate anion solution would not be a good example
of a well executed ion-exchange SPE experiment, due to the competition
between the citrate anion and the adsorbate for the sorbent. However, an elution
solvent containing the citrate anion would provide excellent elution conditions in
the same experiment because of the displacement of the adsorbate anions with
the citrate anions, thus facilitating adsorbate elution.12
It is important to note that the three types of interactions previously
discussed can coexist in one sorbent format and act in concert to affect analyte
retention and elution. In fact, most available adsorbates will exhibit one or more
of the three types of interaction mechanisms at any given time. The types of
interactions displayed by any given adsorbent at any given time are a function of
the system environment that facilitates the dominance of one type of interaction
over another. Because of the variability in system conditions required to
manipulate retention/elution mechanisms, the search for, development, and
characterization of robust sorbent materials continually expands to meet the
needs of sample preparation.

27
1.6 Polymer Stationary/Support Phases
Polymeric materials are employed as sorbent media because of their
resistance to pH extremes. Where silica based sorbents degrade when exposed
to pH extremes, polymer based sorbents are stable. The range and types of
base polymer sorbents are being expanded to functionalized polymer sorbent
materials which are increasing the range of applications.15 PS-DVB-based were
the first polymer phases employed for SPE.44 Polymer based sorbents
containing aromatic groups have proven very selective for analytes with
aromatic rings due to π-π interactions.45, 46 Extensive reviews on polymeric
phases with an emphasis on organic micro-pollutant extractions have been
published.33, 47, 48 Polymer phases in the form of beads have been the most
widely used polymer phase in the last decade.49 A high number of available
modifications exist that affect selectivity, retention, and elution.50 Hundreds of
papers were published in the 1970’s and 1980’s describing the use of polymer
resins in SPE applications.51, 52
The standardization of analytical procedures employing polymeric resins
loss momentum due to their major drawback: the necessity of a successful resin
cleaning scheme to remove artifact compounds.52, 53 The aspect of resin
cleaning and resin standardization slowed the immediate analytical use of
polymer resins as phases in SPE.54 More recently, hollow polymer fibers have
been introduced as solid phases. Organic modifiers have been impregnated in
the pores along the inner walls of the polymer fiber to provide chromatographic
interaction. Hollow polymer fiber phases have been used for the separation of

28
proteins and lanthanides.55-57 Additionaly, polymer fibers serving as both the
support and stationary phase have been used for
HPLC separations. The available interactions on the surface of the fiber act as
the stationary phase, while the fiber itself acts as the support.58-60 Similiar to the
types of interactions provided by polymer beads, polymer fibers have found their
way into chromatography applications involving large biomolecules as well.
Capillary channeled polymer (C-CP) fibers were first introduced as a
support and stationary phase for liquid chromatography separations in 2003 by
Marcus et al.50 Polypropylene and polyester fibers were introduced as stationary
phase media for the separation of polyaromatic hydrocarbons, organic and
inorganic lead compounds, amino acids, and a lipid standard of triglycerides.50
Initial success and separation of the various analytes prompted further
investigations of the C-CP fibers as stationary phases in reversed-phase LC.
Unique to C-CP fibers, as the name implies, are the eight capillary channels
surrounding the periphery that run along the fiber axis. As can be seen in
Figure 1.5, the eight capillaries can act as channels that facilitate fluid motion
through fiber columns. The fibers, created by a spin-melt process, have nominal
diameters of around ~50 μm and have eight capillaries that can range from ~5 to
20 μm in diameter. The physical characteristics of the eight channels on the
periphery of the fibers allow for the spontaneous wicking along the length of the
channels, indicating high efficiency fluid transport. Initially the fibers were
manufactured for textile products, where in some cases, the high fluid transport
provided by the capillaries was desirable.50

29
Figure 1.5 SEM image of a single polyester fiber. The eight capillaries surrounding the periphery of the fiber also run along the fiber axis.
The simplistic manufacturing process of the C-CP fibers is applicable to
virtually all spin melt polymer systems such as polypropylene, polyester, nylon,
and polylactic acid. Chromatographic columns are prepared by pulling a
predetermined number of fibers collinearly through stainless steel columns. The
non-polar characteristic of the polymer surface and elution order of analytes from
polar to non-polar indicated that C-CP fibers could be employed in analytical
reversed phase liquid chromatography separations.50 It was also envisioned that
the C-CP fibers would prove applicable in preparatory-scale separations such as
SPE.
Since the introduction of the C-CP fibers as stationary phase for analytical
separations, the hydrodynamic flow with the C-CP fiber columns have been
investigated61, C-CP fibers columns have been employed as microbore high-
performance liquid chromatography columns62, and the C-CP fibers have been

30
employed for HPLC separations of proteins.9, 63, 64 It was found that C-CP fibers
facilitated efficient fluid transport in concert with high specific permeability, i.e.
low resistance to fluid flow. Additionally, as packing density increased, peak
width and distortions also increased, most likely due to the stagnant and
restricted zones created by fibers in close proximity, thus suggesting the
existence of an optimal packing density for C-CP fiber columns. Peak profiles
were also found to be a function of column diameter.61 The aforementioned
hydrodynamic qualities exhibited by the C-CP fibers were realized by employing
an un-retained test compound (uracil). Characterization of fluid flow in C-CP
fiber columns employing retained compounds were suggested to determine the
complete function of packing density and column diameter on chromatographic
quality.61
C-CP fibers employed as microbore HPLC columns, were successful in
separating a mixture of uracil, ethylparaben, and propylparaben.62 Microbore
columns were constructed in varying lengths ranging from 500 to 1000 mm, with
the 1000 mm columns consistently outperforming the columns of lesser length.
Additionally, it was found that radial compression decreased plate height while
maintaining relatively constant specific permeability. Radial compression is a
process of applying controlled pressure or mechanical compression to reduce the
radius of the column and compress the bed to a controlled volume. Radial
compression reduces the void space near the interface between the C-CP fibers
and the column walls.62

31
In addition to chromatographic success and treatment of small molecules,
C-CP fibers have also been employed to separate biomolecules, more
specifically proteins, under gradient elution conditions. The separation of a four
protein mixture (superoxidase, hemoglobin, hemocyanin, and myoglobin) was
achieved employing a polypropylene (PP) C-CP fiber column.63 Advantages of
using C-CP fibers as stationary phase for protein separations were suggested
due to a range of characteristics. Base polymer materials during the
manufacturing/ spin-melt process can be varied, thus changing the chemistry and
types of interactions available to C-CP fiber column protein separations. In
contrast to derivatized silica beads, the surface of the base fiber materials acts
as the stationary phase in C-CP fiber columns, which could indicate enhanced
column stability. Derivatization of C-CP fiber surfaces can be employed to
achieve varyious modes of separation mechanisms. The eight capillaries on the
periphery of the fiber surface facilitate directed fluid flow, thus reducing system
backpressures in comparison to traditional packed bead columns, which should
from a hardware standpoint present the possibility of increased flow rate
separations. Lastly, the low cost of base fiber materials make C-CP fiber
columns a more inexpensive alternative to commercial packed bead
technologies. A further study indicated the potential for using the C-CP fiber
column format for rapid protein separations.64
The aforementioned studies employing C-CP fiber columns in high
performance liquid chromatography applications also allude to the fact that the
fibers could be used in preparatory scale chromatography.9, 50 The relative ease
32
of fiber handling and column construction would make incorporating C-CP fibers
into SPE applications and technologies promising. The hydrodynamic
capabilities of the fiber geometry could prove advantageous when used on the
preparatory scale. Success demonstrated in synthetic protein separations
indicate that C-CP fiber formats could be applied to analytical SPE of proteins.
As protein analysis by mass spectrometry (MS) continues to gain importance, the
need for efficient buffer removal/solvent exchange technologies will follow suit. It
is envisioned that chromatographic qualities proven advantageous to HPLC
separations of proteins could also apply to SPE of proteins.
Recently capillary-channeled polymers have been introduced as stationary
phase in SPE of proteins. Polypropylene fibers have been shown to successfully
extracted lysozyme from phosphate buffered saline solutions and myoglobin from
tris-buffered solutions.10 The initial use of C-CP fibers as protein desalting media
will be discussed in great detail in the chapters to follow.
1.7 Applications of Solid Phase Extraction
Because a wide range of sorbent chemistries, conditioning solvents,
elution solvents, and sample application methodologies exist, a wide range of
applications for SPE and thousands of publications vouch for the success of
SPE.14 In addition, the true evaluation of an analytical method is how well it
performs for practical day-to-day analysis, where samples can often be quite
complex when compared to the clean, defined samples used for initial
development. However, the importance of sample preparation has been

33
recognized and the following sections demonstrate research and areas of
development that have realized the benefits of SPE as a technique.4
The Environmental Protection Agency (EPA) has adopted many SPE
techniques and devices to perform drinking water analysis replacing former LLE
approaches. For example, the standard extraction procedure used by the EPA to
extract carbonyl compounds, chlorinated acids, pesticides, herbicides, and
organohalides all employ the use of C18 SPE stationary phase device. Initially,
the EPA had used LLE to extract oil and grease from water (EPA Method 413.1),
but because the process involved Freon (CFC-113), it was banned due to
deleterious effects on the ozone layer. EPA Method 1664 is rapidly becoming
the dominant method for this extraction and employs SPE.14 Environmental
applications extend to the analysis of natural water, seawater, wastewater, soil
samples, agricultural samples, and countless others.
SPE also plays a vital role in the analysis of food and beverage samples,
such as the extraction of caffeine from soft drinks65, isolation of carotenoids from
orange juice66, extraction of synthetic colors in beverage alcohol products67,
extraction and isolation of lysinoalanine from mozzarella cheese68, and the
determination of organic acids from honey.69 Even more prevalent are
applications in the arena of biological analyses. Common biological matrices
encountered include plasma, serum, lysed blood, urine, and sputum (saliva).13
SPE has recently gained popularity for the extraction and isolation of drugs and
substances from bio-samples.4

34
MS analysis of proteins has increased over the last decade as a result of
the valuable structural informational realized and determined by MS. In addition,
the use of MS to analyze proteins has also created challenges and opportunities
in analytical and bioanalytical chemistry. The Human Proteome Project, related
to the Genome Project, inherently has more complexity and challenges due to
variable protein structure and modifications (post-translational).8 While MS
provides structural information and detection sensitivity, proteins are often in
complex biological buffers and matrices that interfere with MS analysis.
Electrospray ionization (ESI) and matrix assisted laser desorption –ionization
(MALDI) are two existing MS techniques for the analysis of proteins.70-72 ESI
ionizes protein molecules that are in solution, and is commonly used following
chromatographic separation. Ions are formed in ESI from solutions flowing
through a hollow charged needle at 5-10 kV cm-1. Two concentric flows exist in
the hollow needle; the innermost flow is the sample, while the outer flow can be a
liquid that lends itself to modify the ion content and proper electrical contact with
the metal tip. Some ESI designs also incorporate the outermost flow of a carrier
gas to assist in droplet formation. The nebulized flow from the needle breaks into
droplets ~1μm in diameter. The net charge on the droplets attracts them to an
electrode some distance from the needle. As solvent continues to evaporate as
the charged droplets move across the open volume, ions on the surface are
forced into closer proximity, and at some point the repulsion of the ions overcome
the surface tension holding the droplet together. At that point, called the
Rayleigh limit, small droplets (~2% of the original mass) break from the surface.

35
These newly formed droplets, which maintain ~15% of the original charge,
continue to experience solvent evaporation and breakup until the gas phase ions
are generated. The ions in ESI contain little energy, thus little fragmentation
occurs. This property makes ESI the softest of the soft ionization techniques.73
ESI gas phase ions are unique in that that favor the formation of multiply charged
peaks. Generally these ions are described by the following nomenclature,
(M+nH)n+, which would indicate a parent molecule with mass M, carrying “n”
conjugated protons, with a net charge of “+n” if analyzed in the positive ion mode.
An advantage of multiply charged gas phase ions is that the resulting mass
spectra of high-molecular weight molecules can be detected using analyzers with
a weak nominal mass limit.42 For example, a molecule having a mass of 20,000
carrying a charge of 20 as a gas phase ion in ESI would appear at m/z=1000.
The resulting mass spectra of a pure compound in ESI are readily interpreted as
well. In addition to being a soft ionization technique and favoring multiply
charged peaks, ionization in ESI is at or near atmospheric pressure.73
Though ESI is popular for analysis of proteins and peptides, it is also
plagued by low concentrations often found in biological samples and the
contaminants found in biological solutions which include buffers, non-volatile
salts, and detergents.42 Common biological buffers are composed of a
multiplicity of ionic species and can include sulphates, phosphates, chlorides, as
well as cations such as sodium, potassium, and ammonia.74 Ions from
contaminants can reduce the abundance of ions from the analyte of interest and
in come cases totally suppress them.42 Often, contaminant ionic species results

36
in the formation of adduct ions which further distribute the available ion current,
reducing sensitivity. In addition, molecular weight determinations are
complicated by the presence of adduct ions.42 For example, the presence of
sodium and potassium found in the biological buffer phosphate buffered saline
(PBS) could result in the formation of adducts such as [M+nH+mNa](n)+,
[M+nH+mK](n)+, and [M+nH+mNa+mK](n)+.41 The formation of these adduct
species create additional m/z peaks due to the increased adduct mass, thus
increasing spectral complexity.41 The added complexity afforded by adduct ion
formation create complex spectra and sometimes impede molecular weight
determinations.10
MALDI is used to sublime and ionize a solid sample that has been co-
crystallized with a MALDI matrix. A MALDI matrix, is a small organic molecule
having a strong absorption at the wavelength of the laser.42 Analyte solutions
and matrix solution are intimately mixed and ~1µL of the resultant solution is
spotted onto a target plate. The solvent evaporates and the result is a dried
“solid solution” of analyte/matrix crystals. The energy source for MALDI is a
laser, for example a nitrogen laser (337 nm), which is pulsed directly onto the
sample/matrix crystal. Ion formation is facilitated by the absorption of energy
from the laser by the matrix. The rapid heating of matrix crystals causes them to
sublime carrying intact analyte molecules in the matrix plume. Very little energy
is transferred to the analyte molecule during the expansion process, in fact the
analyte may be cooled during the expansion of the matrix plume.42 The
ionization of analyte molecules can happen at any time during the expansion of

37
the matrix plume.42 The most widely accepted theory involves the gas-phase
proton transfer from matrix to analyte in the expanding matrix plume.42 The
matrix in MALDI serves to absorb the majority of the energy from the laser, thus
minimizing analyte molecule damage. Also, one laser wavelength can be used
for a number of different analytes because the matrix is absorbing the energy
directly not the analyte, making MALDI more universal than other laser ionization
techniques.42 In contrast to ions formed in ESI, MALDI favors the mono-charged
species of the [M+H]+ nomenclature.
MALDI is generally more tolerant to contaminants such as buffers and
salts that ESI.41, 42 This can be due to the separation of analyte and contaminant
molecules during the crystallization process with the matrix. However, adduct
ions may not be resolved from the molecular ions with higher molecular weight
analytes, thus the mass accuracy and molecular weigh determinations
deteriorates in the presence of contaminants during MALDI analysis.41
Both ESI and MALDI are considered soft ionization techniques. Accurate
molecular weights and amino acid sequences can be realized by ESI and MALDI
analysis of proteins, upon interpretation of the mass spectra.8, 75-77 The
sensitivity of both ESI and MALDI is high, at the pico-femtomole level for both
techniques. Little or no fragmentation is observed for both. Background signal is
usually low providing pure de-contaminated samples for ESI, where background
levels are inherently high for MALDI due to the matrix. However, most MALDI
spectrometers are equipped with deflection and gating operations that allow the
suppression of all molecular ions below a specified region. ESI and MALDI are

38
well suited for biological samples, having detected biomolecules up to 200,000
and 300,000 Da respectively.78 Samples for ESI are in aqueous solution while
MALDI samples are in the solid crystalline form. The ionization process for ESI
is continuous while for MALDI it occurs in short pulses.
SPE of proteins and peptides from buffered solutions can dramatically
benefit both ESI and MALDI analysis.8 The removal of salts and buffers allows
more complete protein/peptide ionization, increased protein/peptide signals,
reduction of adduct ion formation, and more accurate molecular weight
determinations.8, 79, 80 Presented here, is both the introduction of C-CP fibers as
stationary phase for desalting protein solutions, and initial characterization of C-
CP fibers, specifically polypropylene (PP) and polyester (PET) for desalting
protein solutions. C-CP fibers were evaluated based on recovery, throughput,
affect on signal to noise ratios and adduct formation of protein mass spectra,
incorporation into micropipette SPE formats, and overall applicability to SPE of
proteins. Benchmark proteins, lysozyme, myoglobin, and bovine serum albumin
(BSA), were used in the evaluation of C-CP fiber SPE micropipette tips. ESI-MS,
MALDI-MS, as well as UV-Vis were used to quantitatively and qualitatively
evaluate C-CP fiber protein SPE from buffered solutions.
1.8 Summary
The previous sections described the historical developments of solid
phase extraction methodologies, sorbents, and formats. Attention was placed on
previous work employing SPE as an analytical preparatory technique for the

39
isolation, purification, and concentration of analytes. Interaction types,
architecture formats, and applications were discussed and related to current
sample preparations regimes. Capillary-channeled fibers were discussed which
have been shown to have excellent characteristics for chromatographic
applications. The research presented here is aimed at introducing capillary-
channeled fibers as stationary phases for SPE applications in bio-analysis,
related to efficiency and applications.
Chapter 2 describes the initial corporation of C-CP fibers as sorbent
material for desalting protein solutions prior to ESI-MS analysis. ESI mass
spectra from lysozyme and myoglobin proteins post-extraction using PP fiber-
packed micropipette tips exhibited higher signal-to-noise ratios and more spectral
clarity that proteins in the original buffer solution. PP fibers were shown to
selectively adsorb both myoglobin and lysozyme from tris-buffer and phosphate
buffered saline (PBS) respectively.
Chapter 3 describes characterization of PP and PET fiber-packed
micropipette tips based on mass balance, recovery, and extraction
characteristics. Simple, adaptors were made to allow coupling of fiber-packed
micropipette tips to typical 15 mL centrifuge tubs. In this way, protein extractions
could be carried out using centrifugal force. Centrifugation allowed more control
of flow rate during loading, rinsing, and eluting the protein test solutions. PP and
PET fiber tips were compared for the extraction of lysozyme and bovine serum
albumin (BSA) from PBS. Both fiber types facilitated protein adsorption from the
original buffer solution and elution in a solvent that benefited ESI-MS analysis.

40
Adsorption of the test protein solutions were similar for both fiber types based on
total fiber surface area. Recovery of lysozyme was higher using PP, while
recovery for BSA was higher using PET. ESI spectral clarity was compared for
post-extraction protein solutions from both fiber types based on signal intensity,
signal-to-noise, and signal-to-background ratios.
Chapter 4 describes the use C-CP fibers as sorbent material for desalting
protein solutions prior to MALDI-MS analysis. MALDI mass spectra from
lysozyme and myoglobin proteins post-extraction using PP fiber-packed
micropipette tips exhibited higher signal-to-noise ratios and more spectral clarity
that proteins in the original buffer solution. PP fibers were shown to selectively
adsorb both myoglobin and lysozyme from tris-buffer and phosphate buffered
saline (PBS) respectively. MALDI mass spectra from myoglobin in tris-buffer
resulted in low intensity molecular ions and higher intensity adduct species as a
result of the tris-buffer. Post-extraction myoglobin MALDI mass spectra were
free of adduct peaks and exhibited a high intensity molecular ion peak for
myoglobin. The ionization of lysozyme was suppressed due to the presence of
low molecular weight inorganic salts in the PBS buffer. MALDI mass spectra of
lysozyme post-extraction exhibited a high intensity, accurate molecular ion peak.
Chapter 5 summarizes all experiments employing C-CP fibers as
stationary/support phase in micropipette tips. PP and PET fibers have been
incorporated in to micropipette tips and shown to desalt and de-contaminate
several proteins prior to MALDI and ESI mass spectrometry analysis. It is
envisioned that C-CP fibers due to their resistance to pH extremes, low cost of

41
fiber materials, relative hydrophobicity, and hydrodynamic characteristics could
be an attractive alternative to commercial phases for protein sample preparation.
The length and diameter of fiber-packed tips has yet to be optimized and could
provide higher recoveries than presently attainable under current elution
conditions. Spontaneous wicking, a characteristic of the fibers, has yet to be
investigated as a means of loading protein solutions. Wicking could prove as an
excellent means of quantitatively loading protein solutions. In addition,
experiments to extend the work to other benchmark proteins and buffer systems
needs to be accomplished to fully realized the potential of the fibers for used in
protein sample preparation.

42
CHAPTER 2
CAPILLARY CHANNELED POLYMER (C-CP) FIBERS AS A STATIONARY
PHASE FOR DESALTING OF PROTEIN SOLUTIONS FOR ELECTROSPRAY
IONIZATION MASS SPECTROMETRY ANALYSIS
Abstract
Micropipette solid phase extraction (SPE) tips have been used to desalt
and purify proteins and peptides from mixtures of buffers and biological solutions.
Removing salts and buffers prior to ESI mass spectrometry characterization
improves the detection limits and the sensitivity of the protein analyses.
Recently, capillary-channeled polymer (C-CP) fibers have been investigated as
stationary phases for high performance liquid chromatography (HPLC)
separations of proteins. Polypropylene (PP) C-CP fibers incorporated as sorbent
materials in micro SPE tips are shown to effectively remove both inorganic and
organic buffers from proteins in defined solutions. The architecture of the fibers
provides large surface areas in comparison to conventional round fibers and is
readily packed into capillaries that can be affixed to micropipette tips. Desalting
of protein solutions is demonstrated for electrospray ionization mass
spectrometry (ESI-MS) analysis through increased signal to noise ratios and
reduced spectral complexity.

43
2.1 Introduction
Evolving trends toward sample miniaturization in proteomics have driven
the need for the development of new sample preparation techniques and
methodologies. Various forms of sample preparation are employed for enriching
analytes (i.e., proteins and peptides) and increasing sensitivity for minor (but
potent) proteins in biological samples.81 Sample preparation for
biocharacterization includes a multiplicity of procedures such as solid phase
extraction, dialysis and filtration, selective precipitation and centrifugation, as well
as ion-exchange, reverse-phase and normal phase, and affinity
chromatographies. All of these methodologies are employed to remove matrix
interferences, reduce sample complexity and increase analyte concentration.
Efficient combination of these techniques can greatly affect the selectivity and
sensitivity of protein detection, particularly by mass spectrometry (MS).
Electrospray ionization (ESI) and matrix-assisted laser desorption-ionization
(MALDI) are the most common soft ionization sources suitable for protein
analysis. Typically, proteins exist in buffer solutions containing salts, small
molecular weight organics, and even urea and detergent, depending on the
extraction procedures. These buffer solutions could have deleterious effects on
ionization taking place in sources due to preferential ionization, ion suppression
effects, and the formation of adducts species.82, 83 In addition, the presence of
abundant buffer species can contribute substantial amounts of spectral
complexity.
44
Solid phase extraction (SPE) techniques using hydrophilic, affinity, ion
exchange, and hydrophobic interactions, as well as metal chelatation, have all
been used effectively to desalt, purify, and concentrate proteins prior to MS
analysis.2, 5, 7, 8, 84-88 In the 1990’s the first commercially available micro-SPE
devices were sold as micropipette tips with C18 chromatographic media
incorporated into the tip. The tips were developed by the Millipore Corporation
(Bedford, MA) under the trade name of ZipTipsTM. Present day micro-SPE tips
are available from a number of manufacturers, offering a wide range of stationary
phase chemistries that may be used in different types of applications.8
Our laboratory has introduced capillary-channeled polymer (C-CP) fibers
as stationary phases for the HPLC separation of proteins and peptides.9, 63, 64
Some of the advantages to using C-CP fibers as a stationary phase are the wide
range of polymer/surface chemistries, robustness of the materials, increased
surface area compared to standard-circular cross-section fibers, low back
pressure, inexpensive base fiber materials, and the possible application of single
fibers on the micro-analytical scale.9 Of particular interest to our laboratory is the
incorporation of the C-CP fibers as a sorbent in micropipette tip applications. In
addition to the above-cited characteristics, the relative ease of fiber packing and
the possible use of controlled wicking (as opposed to aspiration) as the loading
process are among the useful features. These attributes suggest that the fibers
might be an excellent alternative to stationary phases currently in use in
commercial micro-SPE devices. We report our initial efforts in the
implementation of polypropylene (PP) C-CP fibers as sorbent media for the solid

45
phase extraction of proteins from inorganic and low molecular weight organic
buffers prior to ESI mass spectrometry analysis.
2.2 Experimental Section
2.2.1 Reagents and Chemicals.
Lysozyme, from chicken egg white and myoglobin from equine skeletal
muscle, sodium chloride (NaCl), sodium phosphate dibasic (Na2HPO4),
potassium phosphate monobasic (KH2PO4), Sigma 7-9® (tris base), and trizma®
hydrochloride (tris acid) were obtained from Sigma-Aldrich (Milwaukee, WI).
Potassium chloride (KCl) and formic acid were obtained from Fisher Chemicals
(Pittsburgh, PA). ACS grade acetonitrile (ACN) was obtained from Mallinckrodt
Baker Inc. (Phillipsburg, N.J.) and used as an organic mobile phase. Nanopure
Diamond® water (18.2 MΩ/cm) from Barnstead/Thermolyne Water Wystem
(Dubuque, IA) was used in solution preparation for buffers and proteins and
aqueous mobile phases.
2.2.2 Fiber-Tip Construction.
The C-CP SPE tips were assembled (Fig. 2.1) by a procedure very similar
to that employed previously to pack standard format and microbore C-CP fiber
chromatography columns.62, 89 As in the case of microbore columns, the fibers
were pulled through a 0.8 mm i.d. fluorinated ethylene polypropylene (FEP)
capillary tubing (Cole Parmer, Vernon Hills, IL). In the studies described here, a
fiber loop corresponding to a total of 658, 55 μm diameter PP fibers was pulled

46
collinearly through a ~300 mm length of the FEP tubing, from which the individual
tip structures would be cut. This number of fibers represents an 0.60 interstitial
(void) fraction within the capillary.62 Compression fittings were placed on the
tubing ends, the assembly placed on a high performance liquid chromatography
(HPLC) system (Shimadzu LC-10AT, Tokyo, Japan) and the fibers conditioned
alternating with acetonitrile and water (twice) for a period of 30 min. at a flow rate
of 1 mL/min.
Compression fittings were removed from the conditioned fiber-packed
FEP tubing. The tubing was then stretched manually, in the direction of the
fiber/capillary axis, past the fiber ends to create ~6 mm of open tubing beyond
the end of the fibers to accommodate the micropipette tip. The open end of the
tube was slipped over the tip of 1 mL micropipette tip (Redi-TipTM, Fisher
Scientific, Pittsburgh, PA) and was simply held in place by the compression of
the tubing around the tip. The opposite end of the tubing was then cut so that 1
cm of fiber-packed tubing was attached to the micropipette tip. Each
micropipette tip assembly underwent a final wash step by passing 200 μL of
water through the tip prior to use.

47
Figure 2.1 C-CP fiber micropipette tip assembly procedure. Seven rotations of polypropylene fiber are placed on the circular frame to accumulate 658 fibers that are pulled collinearly through the 0.8 mm i.d. FEP capillary tubing with a monofilament. Pressure is applied in the direction of the fiber/capillary axis to stretch the tubing so that a small amount of depth is created to accommodate the micropipette tip. The capillary is press-fit to the end of the commercial micropipette tip and is ready for use. 2.2.3 Protein Loading Washing and Elution
To reference with existing desalting methods, the same sorts of test
solutions and extraction methods were employed in this initial evaluation of the
C-CP fiber method. A 40 μg/mL (2.8 μM) lysozyme solution was made in a
phosphate-buffered saline (PBS) consisting of 140 mM NaCl, 10 mM Na2HPO4,
1.8 mM KH2PO4 and 2.7 mM KCl @ pH 7.3. A 50 µl aliquot was aspirated onto

48
the 1 cm fiber tips by drawing up the volume and pushing the volume off five
times. The same loading procedure was also performed for myoglobin at 40
μg/mL (2.4 μM) in 100 mM Tris (tris(hydroxymethyl)aminoethane) buffer
containing 84 mM tris acid and 15 mM tris base @ pH 7.5.
Protein-loaded tips were washed with a single 100 μL volume of Nanopure
water to remove the ionic (salt) species. The proteins (lysozyme and myoglobin)
were eluted with a single 100 µL aliquot of 100% ACN through the tip and
collecting the eluent in a centrifuge tube. The eluent is diluted to 200 μL with
Nanopure water and pH-adjusted with formic acid to a final concentration 0.1%
prior to ESI-MS analysis.
2.2.4 Mass Spectrometry
A Waters (Milford, MA) quadrupole-time of flight (Q-ToF micro) mass
spectrometer with an ESI source was used for the protein determinations. The
protein-containing solutions were injected directly to the ESI source through a
Waters (Milford, MA) capillary liquid chromatograph (Cap LC). The flow rate was
set at 2 μL/min. The ion source potential was set at 3000 volts in the positive ion
mode, with the quadrupole mass filter scanned from 500 to 2500 m/z in 2
seconds. Methanol was injected in between runs to prevent carryover from
previous runs. The ESI mass spectra for the proteins in the original buffer media
and post-extraction were compared on both a qualitative and quantitative basis.
Equal amounts of the proteins were injected throughout the experiment to ensure
a non-biased comparison of spectral quality, signal to noise ratios, etc.

49
2.3 Results and Discussion
2.3.1 Electrospray Ionization of PBS-Extracted Lysozyme
. The initial metrics in assessing the ability of the C-CP fiber method for
desalting protein solutions include the production of well-distinguished multiply-
charged ion species, with high intensities and the ability to deconvolute those
spectra to yield high fidelity molecular weights. Shown in Figure 2.2 are the ESI
mass spectra obtained from the lysozyme (a fairly hydrophobic protein which
should have a high affinity for the polypropylene surface) in the initial PBS matrix
and that eluted from the fiber-filled micropipette tip. The mass spectrum of the
protein in the buffer solution (top) shows a continuum of signals across the mass
range, with only two discernable peaks that can be attributed to ionized proteins.
On the other hand, the mass spectrum of the protein post C-CP fiber extraction
(bottom) is composed solely of protein related species across mass range. This
demonstrates the fact that salts compete for protein ionization and that desalted
lysozyme ionizes significantly better. Although the integrated total ion
chromatograms for the two solutions are virtually identical, the signal-to-noise
ratios of multiply-charged lysozyme ions at m/z = 1590 Da are ~2.5 (TIC) for the
buffer solution and ~125 (TIC) for the buffer removed one.
From the raw ESI spectra of the protein solutions, the molecular weight of
the protein was deconvoluted using the MaxENTTM 1 algorithim (Waters®). The
resultant molecular ion spectra are presented in the inserts. In the case of the
buffer solution, a large number of possible molecular ions are identified, including
one near the presumed molecular weight. This is a reflection of the weak

50
lysozyme ionization. As a result, the assignment of this peak as an unique
molecular mass unreliable. The spectral purity of the C-CP fiber extracted
lysozyme yields an unambiguous deconvoluted spectrum with the identified
molecular weight being accurate to that of the neat protein in acidified can, at 35
ppm delta mass from the manufacturer’s certificate.
Figure 2.2 Electrospray ionization mass spectra of lysozyme pre and post-extraction. Lysozyme (40 ppm) from chicken egg white (top) in PBS (140 mM NaCl, 2.7 mM KCl, 10mM Na2HPO4, and 1.8 mM KH2PO4 @ pH 7.3) and in PBS-removed solution (bottom) via desalting on PP C-CP fibers mounted in a micropipette tip. Spectral insets are the deconvoluted ESI spectra revealing the corresponding molecular ion.

51
2.3.2 Electrospray Ionization of Tris-Extracted Myoglobin.
Tris (tris(hydroxymethyl)aminoethane) is a commonly used buffer to
stabilize proteins in solution. Different from the case of the PBS matrix, tris is an
organic buffer that has a modest amount of alkyl character that may have an
affinity to the PP fiber surface. In addition, the hydroxide moiety might also have
some propensity for hydrogen bonding with the stationary phase. The mass
spectra presented in Figure 3 are derived for myoglobin (equine skeletal muscle)
at a concentration of 40 μg/ml (2.4 μM) in 100 mM tris, before and after the solid
phase extraction on the C-CP fiber phase. The most noticeable feature of the
mass spectrum of myoglobin in the buffer-matrix (top) is the presence of multiple
cluster peaks that display a mass unit difference of 157 Da between the major
peaks; equal to the monoisotopic mass of tris-acid (C4H11NO3HCl). This
demonstrates the fact that tris-buffer ionizes readily and forms clusters in the ESI
source. Abundant tris species compete for availability of protons, and their
ionization limits protein ionization. In fact, myoglobin, with a pI = ~7.0 would be
expected to be in a predominately anionic form in this pH = 7.5 buffer media.90
The addition of the 0.1% formic acid to the extract lowers the pH to ~3.5, and so
the myoglobin would be predominately in the cationic stage. The tris present in
excess here effectively competes for the available charge, suppressing the
protein response. As a result, none of the peaks otherwise present in the fiber-
extracted protein spectrum (bottom) appear is the spectrum of the protein-buffer
solution. In the tris solution, deconvolution produces no discernable protein
information.

52
Figure 2.3 Electrospray ionization mass spectra of myoglobin pre and post extraction. Myoglobin (40 ppm) from equine skeletal muscle (top) in 100 mM tris buffer and in tris-extracted solution (bottom) via desalting on PP C-CP fibers mounted in a micropipette tip. Spectral inset is the deconvoluted ESI spectrum revealing the corresponding molecular ion.
In the case of the fiber-extracted myoglobin spectrum, the MaxENTTM 1
deconvolution revealed the molecular weight spectrum shown in the inset at
16,951 Da, identical to that obtained for a neat (i.e., without buffer and
subsequent extractions), acidified myoglobin solution. A comparison of the ion
yields reveals an ~75 % reduction in the case of the buffer extract. This level of
recovery (25 %) is encouraging given the fact that detailed optimization of the
procedure has yet to be performed.

53
2.4 Conclusions
The results from these experiments reveal the potential of polypropylene
C-CP fibers as a SPE media for desalting proteins from organic and inorganic
buffers. The hydrophobic nature of the fibers binds the protein selectively and
allows salts and weakly bound organics to be washed from the fiber tips with
aqueous mobile phase. The bound proteins can be eluted with a non-polar
solvent such as acetonitrile. This procedure cleans up the protein solutions and
improves analyte signal responses in the ESI-TOF-MS spectra in terms of
intensity, signal-to-noise ratio and spectral clarity, all of which are critical for
characterization of minor protein species in biological samples.
While a number of commercially available SPE media have been adapted
to micropipette tip geometries, the C-CP fibers present several unique features.
The architecture of the fibers provides enhanced surface area for SPE relative to
circular cross section fibers and can be easily fabricated into SPE tips. Different
from the case of porous SPE media where voids must be wetted by multiple
aspiration steps, the polymer fiber surfaces are amorphous, so there more direct
access for binding interactions and likely greater recoveries. The robustness of
fiber materials allows for the use of more versatile (and harsher) digestion,
extraction, and elution conditions. The inexpensive base fiber materials (e.g.,
polyester and nylon) provide a wide range of polymer/surface interactions. Fairly
straightforward derivatization of the C-CP fiber surfaces opens up a great deal of
diversity for different solute-surface interactions. For example, polyester
54
surfaces treated with simple akali solutions (e.g., 2 M NaOH), yields a
carboxylated surface that can be used for cation exchange extraction.
More rigorous evaluation of the C-CP fibers is currently underway
involving other benchmark proteins and peptides, ultimately extending to extracts
from biological fluids. The roles of buffer identity, pH, and sample
(loading/elution) conditions are being evaluated in a detailed mass balance
approach. Accordingly, more direct comparisons with commercially-available
phases are in order, including the use of exhaustive wicking as a means of
quantitatively exposing test solutions to the fibers as opposed to the use of
repetitive aspiration steps. Fiber loading capacity and analytical quantification
will be key attributes to be compared. Previous loading studies directed at
protein chromatography on C-CP fiber phases, suggest an ~3% (wt protein/wt
fiber) capacity. As such, the ~2.3 mg of fibers here should permit extraction of
>50 μg of protein. Extension of this present application to the use of C-CP fibers
to desalt proteins for analysis by matrix-assisted laser desorption ionization
(MALDI) is also in process.

55
CHAPTER 3
CHAPTER 3
SOLID PHASE EXTRACTION OF PROTEINS FROM BUFFERED SOLUTIONS
USING CAPILLARY CHANNELED POLYMER (C-CP) FIBERS: MASS BALANCE,
RECOVERY, AND EXTRACTION CHARACTERISTICS.
Abstract
Micropipette solid phase extraction (SPE) tips have been used to desalt
and purify proteins and peptides from mixtures of buffers and biological solutions.
The presence of residual buffering species can reduce or even sometimes
completely suppress protein ionization in the case of electrospray ionization
mass spectrometry (ESI-MS) analysis and result in greater complexity in the
derived mass spectra. The formation of adduct species can hinder accurate
molecular weight determinations. Recently, capillary-channeled polymer (C-CP)
fibers have been introduced as stationary/support phases for the SPE of proteins
from buffered solutions. In this study polypropylene (PP) and polyester (PET) C-
CP fibers were incorporated as sorbent materials in micropipette SPE tips and
evaluated in terms of mass balance, recovery, and extraction characteristics.
Centrifugation was found to be a viable alternative to aspiration as a means
moving fluid and facilitating protein SPE from buffered solutions. Protein
quantification in selected fractions for the extraction of lysozyme and bovine

56
serum albumin (BSA) from phosphate buffered saline (PBS) solutions using both
PP and PET fiber-packed tips was performed using UV-VIS absorbance
spectrophotometry. ESI mass spectra for the extraction of lysozyme from
phosphate-buffered saline (PBS) using both PP and PET fiber-packed tips were
compared in terms of the quality of the mass spectra, the signal to noise ratios,
and the extraction yields.
3.1 Introduction
It has been shown that ~60% of analysis time is spent on sample
preparation as opposed to only ~7% for the actual measurement of sample
components 11. Analytical laboratories are under increasing pressure to provide
sample analysis more rapidly and at lower costs 4. Improvements of existing and
exploration of new sample preparation techniques, are aimed at providing more
reproducible results, decreasing the use of organic solvents, providing purer
extracts for instrumental analysis, and decreasing analysis time, and cost.4 In
the past, liquid-liquid extraction (LLE) played a prominent role in sample
preparation. However, LLE suffers from low recovery, labor-intensive
procedures, and the use of large amounts of organic solvents 4, 12, 15. In solid
phase extraction (SPE), analytes are adsorbed from a liquid phase by passing
the test solution over a sorbent bed. Analytes can then be desorbed by passing
an appropriate liquid solvent through the sorbent bed. Judicious selection of the
sorbent type and eluting solvent allow for the subsequent instrumental analysis of
instrument friendly solutions following SPE 4.

57
SPE sorbents also fall into the similar classifications as those employed as
stationary phases in high performance liquid chromatography (HPLC).
Specifically, sorbents used in reversed-phase, ion exchange, and affinity
chromatography are used in protein extractions. Effective SPE sorbents have a
variety of desirable properties including reversible adsorption, chemical stability,
large surface areas, surface contact with the analyte, and high-percentage
recoveries 4. Large surface areas can affect the uptake of analytes by shifting
the distribution of analytes from the liquid phase to the sorbent via large phase
ratios. On the other hand, large surface areas are only advantageous when the
sample solution achieves effective surface contact with the sorbent. Poor
solution contact with sorbent surfaces is often the case when hydrophobic
sorbents are employed with aqueous solutions. Good surface contact increases
the probability that effective interactions between analyte and sorbent affecting
adsorption will occur 12. Successful SPE not only requires the efficient and
reproducible adsorption of analytes; reversible adsorption is necessary to recover
analytes. While high recoveries are required when high sensitivity
determinations are necessary, precision and accuracy are usually optimum
when the recovery is high 4. Traditionally, bonded-phase silica-type sorbents
have been relatively easy to adapt as sorbents for SPE 4, 23. However, due to pH
limitations, the presence of silanol groups, and irreversible adsorption, other
sorbent types, particularly polymeric sorbents, are often employed for protein
extractions 23, 91.

58
The chemical stability of the sorbent is of special consideration when pH
conditions are extreme. Chemically bonded silica sorbents are not stable above
pH 8 or in highly acidic solutions. In contrast, polymer resins are chemically
stable in extreme pH conditions 4. While proteins are generally processed at
neutral pH conditions, greater range could permit conditions where the extraction
process could be enhanced. Polymer resins employed for SPE during the 1970’s
and 1980’s suffered from the presence of leachable impurities trapped in the
resin during the polymerization step, which can co-elute with analytes species 4,
54. However, in most cases, pre-rinsing with organic solvents reduces leachable
impurities to an acceptable level. High extraction efficiencies for compounds
containing aromatic functionality (such as the amino acids tryptophan and
tyrosine) are promoted using aromatic polymer sorbents due to π-π interactions
between the sorbate and sorbent 45, 46. Chemical modification of base polymer
supports can provide a variety of interactions and extend applications to more
diverse set of analytes than is possible with silica supports. Polystyrene-
divinylbenzene (PS-DVB) materials with particle sizes ranging from 10-160 μm
have been employed most extensively as SPE sorbents 4, 92. SPE formats
packed with particle sizes smaller than 10 μm have to withstand the higher
backpressures associated with smaller particle size, which is still a major
challenge for polymer phases. To this end, crosslinked polystyrene resins have
been the most successful polymer resins for non-polar SPE.
Most sorbent materials exist in the bead shape and are packed into
cartridges or columns 14, 23. The intrinsic problem with particulate matter is the

59
remaining void spaces and the inability to fill the total available volume. This
leads to intra-particle channeling and reduced extraction efficiency 23. The
development of new SPE formats such as a disk with embedded sorbent
particles has enabled good extraction recoveries at relatively high flow rates 4.
This is most likely attributed to reduced channeling along the flow axis. This in
turn allows for the faster mass transfer and greater specific surface areas
afforded by using smaller particles 24, 26-28.
From an application standpoint, SPE has been employed for water samples,
pesticides, oil and grease, metal ions, soil samples, agricultural samples, food
and beverage, forensic, paper and pulp, and in organic synthesis 4. More
recently, SPE has taken an important position in the sample pretreatment of
biological samples prior to mass spectrometry (MS) analysis 8. The specific
challenges in the field of proteomics, are due to the complexity of the starting
sample matrices, requiring extensive extraction, separation, and purification of
proteins prior to instrumental analysis 8. The two techniques used most often for
the MS analysis of proteins, electrospray ionization (ESI) and matrix-assisted
desorption-ionization (MALDI), both require that protein isolates be free of salts,
buffers, and detergents 2, 5, 7, 8, 41, 42. SPE can be particularly useful by providing
the adsorption of proteins from buffered solutions, followed by elution in a solvent
favorable for either MALDI or ESI. The application of SPE for protein purification
has been the subject of numerous publications 4, 5, 8, 84, 88. Fundamental studies
of protein adsorption onto SPE sorbents has also been the subject of recent
publications 93, 94.

60
The adsorptive properties of a protein on a specific sorbent are a function of
chemical and physical characteristics of the protein, the sorbent surface
properties, and medium conditions 40. For example, the net charge and charge
distribution and hydrophobicity of the protein, the topography, heterogeneity, and
surface chemistry of the sorbent, and the pH, temperature, and hydrodynamics of
the mobile phase all affect protein adsorption and desorption 40. In most SPE of
proteins on hydrophobic surfaces, the free energy difference between the
protein in an aqueous solution and on a hydrophobic sorbent is generally
entropically favorable 40. When hydrophobic regions of a protein interact with
hydrophobic sorbents, the free energy of the system is minimized by reducing the
contact area between the hydrophobic regions of the protein and the aqueous
liquid phase. Adsorptive processes are desirable only to the extent that
reversible adsorption or elution is possible under conditions that 64 either
preserve the integrity of the analyte and or permit instrumental analysis with the
least amount of matrix interference.
This laboratory has introduced capillary-channeled polymer (C-CP) fibers
as effective stationary phases for the chromatographic separation of proteins 9, 63,
64. These fibers have a unique shape in which eight channels run along the axis
such that individual fibers are capable of spontaneous movement of fluids. In a
column format, the channels of adjacent fibers interdigitate to allow close-packing
and very efficient fluid transport. Fibers have been extruded from polypropylene,
polyester, and nylon base polymers to provide a diversity of potential surface
interactions and modes of separations. While the amorphous fiber surfaces yield

61
much lower specific surface areas in comparison to porous silica phases,
improved mass transfer, greater chemical stability, and lower costs are seen as
potential advantages. Extension of that work to sample preparation application
has recently been demonstrated in the SPE of proteins from biological buffers
prior to ESI-MS analysis 10. It has been shown that polypropylene (PP) C-CP
fibers can effectively bind lysozyme and myoglobin from phosphate buffered
saline (PBS) and tris-buffer solutions, respectively 10. It has also been shown
that mass spectra from fiber-extracted protein solutions exhibit higher signal to
noise and signal to background ratios; as well as reduce the ESI spectral
complexity 10.
Presented here are the mass balance and recovery characteristics of PP
and polyester (PET) C-CP fibers used as sorbent media in micropipette tips to
extract and recover lysozyme and bovine serum albumin (BSA) from PBS
solutions. The two proteins and fiber types are employed here to illustrate the
interplay of surface chemistries that exist in this approach (which are analogous
to other SPE sorbents). The C-CP fiber-tip extraction process has been adapted
to a centrifugation format, as employed in some commercial SPE cartridge
devices 95, in order to provide greater control of the extraction procedure and
more reproducible results than is found in the typical aspiration procedures used
in conventional SPE applications as well as the previously described studies 10.
The relative efficiencies of the sequential steps in the protein extraction process
were determined using UV-VIS absorbance spectrophotometry. ESI mass
spectra of eluted protein solutions were compared to those of the proteins in the

62
initial buffer media and neat solutions on the basis of analtye signal intensities,
signal-to-noise and signal-to-background ratios. It is believed that the C-CP
fiber format, incorporating centrifugal loading and elution, holds a number of very
promising characteristics for their use in the field of proteomics.
3.2 Experimental Section
3.2.1 Reagents and Chemicals.
Lysozyme (mw=14.3 kDa), from chicken egg white, bovine serum albumin
(BSA) (mw ≈ 66 kDa) , sodium chloride (NaCl), sodium phosphate dibasic
(Na2HPO4), and potassium phosphate monobasic (KH2PO4) were obtained from
Sigma-Aldrich (Milwaukee, WI). Potassium chloride (KCl) and formic acid were
obtained from Fisher Chemicals (Pittsburgh, PA). ACS grade acetonitrile (ACN)
was obtained from Mallinckrodt Baker Inc. (Phillipsburg, N.J.) and used as an
organic mobile phase. De-ionized (DI) water (18.2 MΩ/cm) purified by a
Nanopure Diamond® Barnstead/Thermolyne Water System (Dubuque, IA) was
used in solution preparation for buffers, proteins, and aqueous mobile phases.
3.2.2 Fiber-Tip Construction.
The construction of fiber-packed micropipette tips is still in the evolution
stage. In most manufacturing processes, it is desirable to produce the maximum
amount of final product from the minimum amount of starting materials. The
number of manufactured tips per ~ 300 mm of fiber packed tubing from the
previous method, was limited due to the ability of the FEP tubing to continually

63
stretch along the fiber axis to create the dead space needed for micropipette
insertion 10. Also, by stretching the FEP tubing along the fiber axis, it is possible
that the interstitial fraction (packing density) of the tips changes through radial
compression as each tip is formed. Subsequent stretching of FEP tubing to
construct the fiber packed tips increased the time and pressure required (an
indication that packing density had been increased) for the aspiration of protein
solutions when compared to fiber-packed tips made from the first stretch.
The C-CP fiber-packed SPE tips were assembled here using a slightly
different methodology than previously described 10. In the studies described
here, fiber loops corresponding to a total of 658 polypropylene (PP) fibers of 55
μm diameter and 320 polyester (PET) fibers of 60 μm diameter were pulled
collinearly through ~300 mm lengths of the 0.8 mm i.d. fluorinated ethylene
polypropylene (FEP) tubing (Cole Parmer, Vernon Hills, IL). A small portion (~5
mm) at one end of the fiber packed tubing was cut with a surgical grade scalpel
(Personna, Mansfield, UK) so the tubing and fiber ends were flush. Different
from the previous studies 10, the fibers from the opposite end were pulled to
create ~6 mm of space between the tubing end and the fiber end to
accommodate the micropipette tip. The end of the tubing with the void space
was then slipped over 1 mL micropipette tip (Redi-TipTM, Fisher Scientific,
Pittsburgh, PA). The tubing was cut so that 1 cm of fiber packed tubing was
attached to each tip. The process was repeated across the entire length of the
~300 mm fiber packed tubing producing ~15 tips. The new process of fiber-

64
packed tip construction increases the number of tips made per unit length of
fiber-packed FEP tubing and eliminates radial compression.
3.2.3 C-CP™ Fiber Protein SPE Using Centrifugation to Induce Fluid Movement
Previously, a Transferpette® (Brand Tech, Essex, CT) pipette was used to
facilitate the aspiration of the protein solutions through the fiber packed tips 10.
This is the most common approach to SPE extractions, but because it is a
manual procedure it is fraught with potential sources of imprecision and is time
consuming. Therefore, a new procedure was developed whereby the fluid flow
across the sorbent medium was better-controlled and samples could be
processed in a parallel fashion. A fiber-packed pipette tip adapter was created to
allow the fiber-packed tips to be placed into an accuSPIN™ 1R analytical
centrifuge (Fisher Scientific, Pittsburgh, PA). As shown in Fig. 3.1, the conical
portion ( ~10 mm) of a 1.7 mL microtube (Genesse Scientific, San Diego, CA)
was cut perpendicular to the microtube axis so that it resembled a hollow
cylinder. The fiber-packed micropipette tip (fiber end first) was pressed inside
the top of the microtube. The fiber-packed micropipette tip was held in place as
the outer wall diameter of the tip approached the inner wall diameter of the
microtube. The microtube containing the fiber packed tip was placed into a 15
mL conical centrifuge tube (Nalge Nunc International, Rochester, NY) and held in
place by the attached lid of the microtube extending past the outer rim of the
conical centrifuge tube. In this manner, the fiber packed tips could be mounted in

65
the analytical centrifuge by placing the 15 mL conical centrifuge tubes in typical
swinging centrifuge buckets.
Figure 3.1 Adaptation of C-CP fiber-packed tips to the centrifugation format.
The lower ~10 mm of the microtube is removed, the C-CP fiber-packed tip is
inserted and held in place. The microtube is then inserted into the 15 mL
centrifuge tube that can be placed in the centrifuge device. Fractions from
protein extractions are collected in separate centrifuge tubes.
3.2.4 Comparison of Centrifugation and Aspiration as Fluid Movement Methods
in C-CP™ Fiber-Packed Tips.
Lysozyme (40 ppm) was made in a phosphate buffered saline (PBS)
matrix consisting of 140 mM NaCl, 10 mM Na2HPO4, 1.8 mM KH2PO4 and 2.7

66
mM KCl at pH=7.3. A PP fiber-packed tip was attached to a Transferpette® and
a 50 μl aliquot of protein solution was manually aspirated five times for a five
minute total aspiration time. A rinsing step, consisting of 100 μL of DI-H2O was
passed through the fiber-packed tip using positive pressure from the
Transferpette® to remove any residual buffering species. Adsorbed protein was
eluted and collected in a 1.7 mL microtube, by passing 100 μL of a 50:50
ACN:H2O solution through the tip. In the case of the centrifugation method, a 50
μL aliquot of protein solution was centrifuged through the fiber-packed tip at a
rotation rate equating to 300 x G for five minutes total centrifugation time. (This
is the time to completely move the solvent through the sorbent phase.) To
remove residual buffering salts, 100 μL of water was centrifuged through the tip
at 300 x G for 10 minutes. Finally, 100 μL of an 50:50 ACN:H2O solution was
centrifuged through the fiber-packed tip at 300 x G for 10 minutes to elute
adsorbed lysozyme. The eluted fractions were collected in the 15 mL conical
centrifuge tube. Each of the described experiments was performed in triplicate
and the results presented as the average values. The eluted fraction was
conditioned to 0.1% formic acid and analyzed for lysozyme content using ESI-
MS.
3.2.5 Quantification of Lysozyme and BSA in Effluent, Rinse, and Eluted
Fractions
The amounts of lysozyme and BSA were determined for the effluent,
rinse, and eluted fractions using UV-VIS absorbance at a wavelength of 210 nm

67
(corresponding to the peptide bonds in the amino acids). Proteins were loaded
onto fiber-packed tips, rinsed, and eluted as described in section 2.4 using the
centrifugation method. Additionally, a second, third, and fourth elution was
performed by passing 100 μL volumes of the eluting solvent through the fiber-
packed tip and collecting each elution in a separate 15 mL centrifuge tube. A
total of 24 fiber-tip extractions were performed for each fiber type and protein, 12
fiber-tip extractions employing protein in buffered solution and 12 fiber-tip
extractions employing the blank buffer solution. Extraction volumes were
combined into sets of three containing a total of 400 μL of eluted protein and/or
blank solutions. A total of 400 μL was needed so that the level of solution in the
quartz cuvette would encompass the incident light source in the
spectrophotometer. In the case of ESI-MS analysis of the lysozyme eluents, the
fractions were conditioned to 0.1% formic acid and the quantification was
performed using the 9+ and 10+ psuedomolecular ion signals.
3.2.6 Instrumentation and Data Analysis.
A Waters (Milford, MA,) quadropole-time of flight (Q-ToF micro) mass
spectrometer equipped with an ESI source was used to obtain mass spectra for
eluted protein. For ESI analysis, protein-containing solutions were injected
directly to the ESI source through a Waters capillary liquid chromatograph at a
solution flow rate of 2 μL/min. The ion source potential was set at 3000 volts in
the positive ion mode, with the quadrupole mass filter scanned from 500 to 2500
m/z in 2 seconds. A Genesys 10 (Thermo Electron Corp, Waltham, MA) split
beam, dual detector UV-VIS spectrophotometer equipped with a xenon lamp was

68
used for protein quantification. Absorbance measurements were taken at 210
nm in a 10 mm path length quartz spectrophotometer cell (Starna Cells, Inc.,
Atascadero, CA). Analytical data from both types of experiments was processed
using Microsoft Excel (Seattle, WA).
3.3 Results and Discussion
3.3.1 Comparison of Centrifugation and Aspiration as loading Methods in C-CP
Fiber SPE.
In this study, centrifugation was compared to aspiration as the means to
move protein solutions through the fiber-packed tips. Polypropylene (PP) fiber-
packed tips were used to extract lysozyme (40 ppm) from phosphate buffered
saline (PBS) employing both the method of aspirating the solutions using a
Transferpette® 10 and by centrifugation. The final eluted fractions from both
methods were analyzed using ESI-MS The speed of centrifugation (300 x G)
was experimentally chosen to keep the amount of time required for both loading
methods relatively constant at ~5 minutes for loading the 50 μL test solutions.
ESI mass spectra can be seen for eluted lysozyme in Fig. 3.2a for the aspiration
and Fig. 3.2b for the centrifugation method.

69
Figure 3.2 Electrospray ionization mass spectrometry comparison of
centrifugation and aspiration loading methods. ESI mass spectra obtained from
eluted fractions following a) aspiration with a Transferpette® and b)
centrifugation. Lysozyme (40 µg/mL) in PBS (140 mM NaCl, 2.7 mM KCl, 10mM
Na2HPO4, and 1.8 mM KH2PO4 @ pH 7.3), after extraction by polypropylene C-
CP fiber-packed tips and elution in ACN:H2O.
Significantly higher ion counts, approximately two orders of magnitude,
can be seen for the lysozyme spectra obtained from the centrifuged sample. The
peak intensity for the ~1590 Da (9+) lysozyme psuedomolecular ion peak was
used for the quantitative comparisons, with the region from ~1450 to 1550 Da
used to evaluate the spectral background. The signal-to-noise and signal-to-
background ratios were ~37 and ~16 respectively for the lysozyme ESI mass
70
spectra obtained from the aspiration method. For the centrifugation method, the
signal-to-noise and signal-to-background ratios were ~118 and ~50 respectively.
Among triplicate extractions, the signal-to-noise and signal-to-background ratios
in the ESI lysozyme mass spectra were on average 3.6 and 5.4 times greater for
the centrifugation method. Additionally, better precision (14% RSD) for the
characteristic peak intensities was afforded by the centrifugation method, in
comparison to 106% RSD for the aspiration method among triplicate extractions.
For protein samples centrifuged through the PP fiber-packed tips,
directed flow starts in the solvent reservoir (the micropipette tip) and continues in
one direction through the fiber-packed portion and is collected in the 15 mL
centrifuge tube. In this way, buffered protein solutions are forced through PP
fiber-packed tips and allowed to continually interact with “fresh” fiber stationary
phase until reaching the end of the tip. Protein solutions traveling through the
fiber-packed tip by centrifugal force have a total travel distance of 1 cm, the
length of the fiber-packed portion of the tip. However, when protein solutions are
aspirated (in and out) of the fiber-packed tips for a total of five times, protein
solutions traverse 10 lengths for a total of 10 cm. Linear velocities are an order
of magnitude slower for centrifuged samples when total loading time for the two
methods is kept relatively constant. The increased ESI peak intensities (i.e.,
recovery) for centrifugal flow is a function of the relative solution linear velocities
for the two methods. By the same token the ESI-MS data clearly show that the
centrifugation process is far more controllable/reproducible than manual

71
aspiration. Finally, the throughput of the centrifugation method has the potential
for far greater throughput than manual aspiration.
3.3.2 Protein Quantification Throughout the C-CP Fiber SPE
During the course of a fiber-packed tip protein extraction, the protein has
the potential to be found in four well defined areas; 1) the collected fraction from
the initial pass through of the test solution (effluent), 2) the aqueous rinse
fraction, 3) the mixed-phase elution fraction, and 4) any protein remaining on the
fiber/pipette tip surfaces. Analysis of each collected fraction during the protein
extraction process can describe the nature of the extraction process in terms of
the contributions to the overall efficiency and reproducibility. Polyester (PET)
and PP fibers were compared for the extraction of the two proteins, lysozyme
and BSA. The two fiber types, PP and PET, offer different interactions based on
their base polymer structure. Lysozyme and BSA are used extensively in the
characterization of chromatographic stationary phases and have been used
previously in this laboratory in reversed-phase separations on C-CP fiber
columns 96.
In each of the following experiments, the test solution contained 2.00 μg of
the respective proteins. The amount of protein recovered in each of the solutions
was determined through UV-VIS analytical response curves for the proteins
performed in the respective solvent systems: PBS (test solution), H2O (rinse),
and 50:50 ACN:H2O (elution). Results for both lysozyme and BSA content are
presented in Table 3.1 for triplicate extractions. The amount of protein initially

72
adsorbed was defined as the mass in the influent (2.00 μg) minus the mass in the
effluent.
For the extraction of lysozyme using PP fiber-packed tips, an average of
0.43 μg of lysozyme was determined in the effluent, translating to an average of
1.57 μg of lysozyme adsorbed in the PP fiber-packed tip. For PET fiber-packed
tips, an average of 0.96 μg of lysozyme was determined in the effluent,
translating to an average of 1.04 μg was adsorbed in the PET fiber-packed tips.
The fiber surface area of the PP and PET fiber-packed tips are ~11.02 cm2 and
~6.58 cm2 respectively.

73
Comparing the adsorption of lysozyme on the basis of total fiber surface
area, and assuming adsorption on the surface of the micropipette tip and the
FEP tubing are negligible, an average of 0.14 μg/cm2 and 0.16 μg/cm2 were
adsorbed on PP and PET fibers respectively. As such, the extent of the
adsorptive surface interactions for lysozyme is not significantly different between
the two polymer types. The lysozyme concentrations in the aqueous rinse
fractions were below the limit of detection for the UV-VIS assay. The average
percent recoveries for lysozyme were 44 and 22% from PP and PET fiber-
packed tips, respectively. The increased recovery of lysozyme for the PP fiber-
packed tips is attributed to the limited types of interaction forces
(hydrophobic/London) available for protein adsorption at the PP fiber surface.
On the other hand, the PET fiber surface lends itself to additional dipole-induced
dipole, hydrogen bonding, and π-π interactions, resulting in stronger adsorption,
possibly resulting in lower recoveries under these particular elution conditions.
This fact was borne out in chromatographic studies where elution of lysozyme
from PP C-CP fiber columns took ~30% ACN:H2O, while 37% was required to
elute from PET 96. Lysozyme was also determined in subsequent elution
fractions (2-4); however the concentration was either negligible or below the limit
of detection for UV-VIS analysis. This suggests that the 100 μL used for the
elution volume could be reduced thereby concentrating the protein in the elution
step.
For the extraction of BSA using PP fiber-packed tips, an average of 0.61
μg was determined in the effluent, translating to an average of 1.39 μg of BSA

74
adsorbed in the PP fiber-packed tip. For PET fiber-packed tips, an average of
1.17 μg was determined in the effluent, translating to an average of 0.83 μg
adsorbed in the PET fiber-packed tips. Again, when comparing the adsorption of
BSA based on surface area on both PP and PET fibers, an average of 0.13
μg/cm2 was adsorbed. BSA concentrations in the aqueous rinse fractions were
also below the limits of detection. The recoveries of BSA from the fiber-packed
tips were low in comparison to lysozyme, with values of 12 and 23% from PP and
PET fibers, respectively. This is not surprising given the previous
chromatographic separations on PP and PET C-CP fiber columns 96, where
greater amounts of organic modifier are required for elution of BSA than
lysozyme. Low recoveries (24%) for BSA have also been reported from
monolithic bonded-phase silica packed tips 2. In contrast, high recoveries (90%)
have been reported for lysozyme from bonded-phase silica packed tips.2
Because proteins have a specific window of organic composition in which they
elute from non-polar surfaces, direct comparison to recoveries of different
proteins on different phases and under different eluting solvent conditions are
quite tenuous at best. By the same token, optimization of elution phase
composition could likely result in higher recoveries of proteins from both the C-
CP fiber surfaces 43.
In order to gain a better sense of the elution efficiencies for the proteins,
ESI mass spectra were obtained for lysozyme for the four elution fractions from
both PP and PET fiber-packed tips. ESI mass spectra for BSA were not obtained
for any of the elution fractions because the concentrations were below the limit of

75
detection for this ESI-MS instrument. ESI mass spectra for lysozyme elutions 1-
4 from PP fiber-packed tips are shown in Figs. 3.3 a-d. Figure 3.3 a (elution 1),
exhibited the highest signal intensity for the multiply charged lysozyme peaks
among the four elutions.
The peak counts for the ~1590 Da lysozyme 9+ psuedomolecular ion and
the background from ~1450 to ~1550 Da were used for signal-to-noise and
signal-to-background ratio calculations. The signal-to-noise and signal-to-
background ratios for Fig. 3a are 276 and 196 respectively. The ESI mass
spectra in Fig. 3.3 show that a majority (~90%) of lysozyme is indeed found in the
first elution fraction. Among triplicate extractions of lysozyme from PP fiber-
packed tips, the signal-to-noise and signal-to-background ratios for the first
elution averaged 228 and 124 respectively, with the peak heights varying by 24%
RSD. ESI mass spectra for lysozyme elutions 1-4 from PET fiber-packed tips
are shown in Figs. 3.4a-d.

76
Figu
re 3
.3
Ext
ract
ion
of ly
sozy
me
usin
g po
lypr
opyl
ene
fiber
s.
Ele
ctro
spra
y io
niza
tion
mas
s sp
ectra
of
elut
ed fr
actio
ns fr
om th
e ex
tract
ion
of ly
sozy
me
(40
µg/m
L) fr
om P
BS
usi
ng P
P C
-CP
fibe
r-pac
ked
tips
in
AC
N:H
2O 0
.1 %
form
ic a
cid.
Spe
ctra
labe
led
a-d
corre
spon
d to
elu
tions
1-4
resp
ectiv
ely.
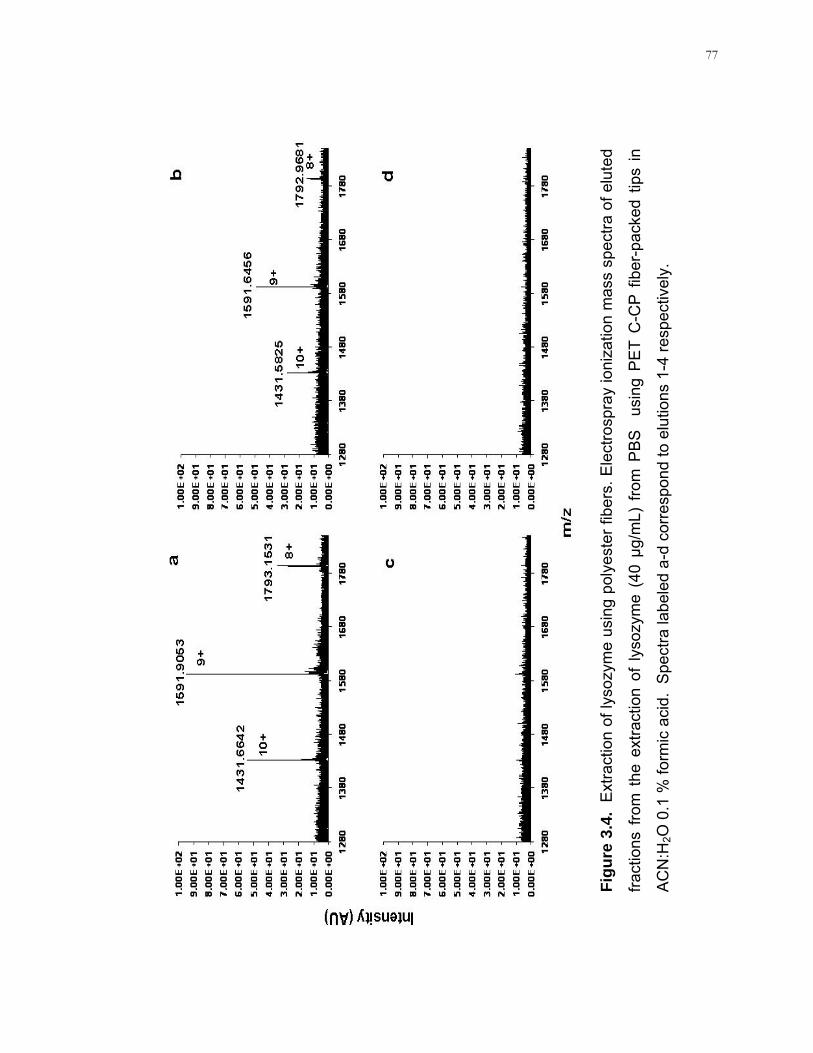
77
Figu
re 3
.4.
Ext
ract
ion
of ly
sozy
me
usin
g po
lyes
ter f
iber
s. E
lect
rosp
ray
ioni
zatio
n m
ass
spec
tra o
f elu
ted
fract
ions
fro
m t
he e
xtra
ctio
n of
lyso
zym
e (4
0 µg
/mL)
fro
m P
BS
us
ing
PE
T C
-CP
fib
er-p
acke
d tip
s in
AC
N:H
2O 0
.1 %
form
ic a
cid.
Spe
ctra
labe
led
a-d
corre
spon
d to
elu
tions
1-4
resp
ectiv
ely.

78
Figure 3.4a (elution 1), exhibited the highest intensity for multiply charged
lysozyme peaks among the four elutions. The signal-to-noise and signal-to-
background ratios were calculated in the same way as with the PP extraction.
The signal-to-noise and signal-to-background ratios for Fig. 3.4a are 200 and 136
respectively. Among triplicate extractions of lysozyme from the PET fibers, the
signal-to-noise and signal-to-background ratios were on average 115 and 78.8
respectively, with the respective peak heights varying by 89 % RSD due to the
much lower recoveries. ESI mass spectra for both the extraction of lysozyme
from PP and PET fiber-packed tips qualitatively support the data from the UV-VIS
analysis of the eluted fractions.
3.4 Conclusions
Centrifugation has been investigated as an alternative approach for SPE
processing of proteins from buffered solutions using C-CP fiber-packed tips.
Adaptation of the C-CP fiber-packed tips to the centrifugation format has
increased throughput, improved precision, provided better control of extraction
processes, and allowed for greater extraction efficiencies for tips of the same
surface area when compared to aspiration. Future work will include the
investigation of centrifugation speed on protein adsorption SPE using C-CP fiber-
packed tips as well as wicking as a means of loading protein solutions. It is
envisioned that an optimum time frame and centrifugation speed will exist for
protein-fiber interactions to provide maximum protein adsorption and recovery.

79
The protein extraction process has been evaluated in terms of protein
mass balance using both PP and PET C-CP fiber-packed tips. It has been
demonstrated that under the current methodology and conditions, PP and PET
fiber-packed tips exhibit lower recoveries than typical bonded-phase silica type
tips 2, 8. Currently, recovery of adsorbed protein from C-CP fiber-packed tips is
≤44 %, while recovery of protein from bonded-phase silica tips can be nearly
100% 8. This is not discouraging given that the use of C-CP fibers in
micropipette tips for SPE of proteins from buffered solutions is relatively new <1
year 10, in comparison to bonded-phase silica in micropipette tips which were
introduced in the 1990s 8.
Protein mass balance experiments have given insight to protein allocation
within an extraction experiment. PP and PET fiber-packed tips have similar
performance when compared based on surface areas for the adsorption of
lysozyme and BSA from PBS. PP was more efficient (2x) for the recovery of
lysozyme from PBS, however PET was more efficient (2x) for the recovery of
BSA from PBS. A number of experiments are underway to improve the
extraction efficiency of C-CP fiber-packed tips. At present, only one architectural
type of C-CP fiber-packed tips has been used for protein SPE, an optimization of
fiber shape, fiber-tip length, diameter, and packing density could improve
recoveries. Aspiration and centrifugation have been investigated as loading
methods, but wicking has yet to be employed for protein loading in C-CP fiber
SPE. The geometry of the C-CP fibers with the eight channels running the entire
fiber length spontaneously wick fluid. It is envisioned that wicking could provide

80
an additional quantitative means of loading protein solutions without the need for
an external force driving fluid movement. The extension of C-CP fibers to the
extraction of peptides from buffered solutions is also underway. Also, C-CP fiber
tips are being investigated for applications with matrix assisted laser desorption
ionization (MALDI) mass spectrometry analysis of proteins.

81
CHAPTER 4
CAPILLARY CHANNELED POLYMER (C-CP) FIBERS AS A STATIONARY
PHASE FOR DESALTING PROTEIN SOLUTIONS FOR MATRIX ASSISTED
LASER DESORPTION IONIZATION MASS SPECTROMETRY ANALYSIS
Abstract
Solid phase extraction (SPE) approaches using micropipette tips have
been used to extract, concentrate, and purify proteins from buffered solutions.
Desalting of protein extracts improves the signal and sensitivity in both
electrospray ionization (ESI) and matrix-assisted laser desorption ionization
(MALDI) mass spectrometry (MS). Recently, capillary-channeled polymer (C-
CP) fibers have been incorporated as a stationary/support phase in micropipette
tips for the extraction of proteins from buffered solutions prior to ESI-MS analysis.
The analogous SPE approach is presented here to demonstrate the applicability
of using polypropylene (PP) C-CP fibers as a platform for desalting protein
solutions prior to analysis by MALDI-MS. A new method of solvent transport
using centrifugal force is employed to yield greater sensitivity and precision than
conventional solution aspiration methods. Lysozyme and myoglobin are
extracted from representative buffer media, phosphate-buffer saline and Tris,
respectively. The MALDI mass spectra from desalted lysozyme and myoglobin

82
solutions demonstrate that this SPE approach provides enhancement of the
signal-to-noise and background ratios, the reduction of spectral complexity, and
precise molecular weight determinations.
4.1 Introduction
The characterization of proteins from typical cellular extracts often
involves several processes that can complicate further instrumental analysis.
The method of removing a protein from a cell depends on the location of the
protein within the cell as well as the mechanical characteristics of the source
tissue 97. Proteins located in the cytosol of the cell may be liberated by breaking
open the cell (i.e., lysis) by chemical or mechanical means90. For example,
enzymes can be used to chemically disrupt the cell to free the protein of interest
90. Mechanical disruption of the cell such as through grinding, the use of a high-
speed blender, a French press, or sonication can be used to free proteins from
cellular material. In any case, once a protein has been removed from its natural
environment it can be damaged by exposure to harmful solvent conditions. The
structural integrity of proteins are sensitive to pH, thus cell digestions are
routinely performed in buffered solutions at pH ranges for which the protein is
stable 97. Protein-containing buffer solutions can consist of salts, small molecular
weight organics, and even urea and detergent, depending on the digestion
procedures 8.
Mass spectrometry is particularly powerful for the identification and
characterization of proteins 8, 78. Soft ionization techniques such as matrix
assisted laser desorption ionization (MALDI) and electrospray ionization (ESI)

83
mass spectrometry provide intact gas-phase protein ions with little or no
fragmentation 41, 42. MALDI is a soft ionization technique because the matrix
absorbs most of the incident energy from the laser, thus minimizing damage (I.e.
fragmentation) of the protein analytes. MALDI favors the formation of singly
charged molecular ions and has proven effective for protein identification and
characterization 8, 41, 42, 78. MALDI is a fairly universal protein analysis tool
because the matrix absorbs the laser pulse, thus eliminating the need to adjust
the laser wavelength to match the absorption frequency of each analyte.
However, direct analysis of proteins from cellular extracts is usually not feasible,
because proteins are in buffers that are not compatible with MALDI and ESI
mass spectrometry 98. These buffer solutions can have deleterious effects on the
ionization taking place in both MALDI and ESI sources due to preferential
ionization, ion suppression effects, and the formation of adduct species 82, 83. In
addition, the presence of abundant buffer species can contribute substantial
amounts of spectral complexity, inhibiting protein identification and
characterization 82. With these difficulties noted, MALDI is generally thought to
be more tolerant of buffers than ESI, due to the separation that occurs during
crystallization of the protein with the matrix 42.
Solid phase extraction (SPE) is a popular technique for the extraction, pre-
concentration, and clean-up of various kinds of analytical samples 33, 54. SPE has
been applied to selectively adsorb proteins from buffered solutions and allow
elution in solvents conducive to MALDI and ESI-MS analysis of proteins and
peptides 5, 7, 8, 98-102. More recently, micropipette tip-based SPE approaches have

84
been used for protein desalting prior to MS analysis 5, 7, 8. Incorporating sorbents
into the micropipette tip format, enables the efficient handling of micro-liter
volumes of protein extracts, which is often needed in bioanalysis where low
concentrations and volumes are commonplace 8. Historically, polymer phases
have proven advantageous due to the chemical robustness of the base polymer
material and the resistance to pH extremes 3, 14, 21. While proteins exist in
cells/extracts under relatively neutral pH conditions, there may be some
advantages to working outside of the range suitable for silica phases.
Our laboratory has recently introduced capillary channeled polymer (C-
CP) fibers as a stationary/support phase for the reversed-phase separation of
proteins, with a number of positive attributes realized 9, 63, 64, 96. C-CP polymer
fibers posses a unique geometry with eight capillary channels extending the
entire fiber length that permits very efficient fluid flow and mass transfer, while
providing greater surface are than available from circular cross section fibers 103.
The highly efficient fluid transport, low material cost, wide range of chemical
diversity, and robust fiber materials make the C-CP fibers excellent candidates
for various separation formats 9. More recently, Marcus and c-workers have
introduced the concept of mounting C-CP fibers within micropipette tips to affect
desalting of protein solutions prior to ESI-MS analysis 10. We report here initial
efforts in the implementation of polypropylene (PP) C-CP™ fibers as sorbent
media for the solid phase extraction of proteins from inorganic and low molecular
weight organic buffers prior to MALDI-MS analysis. Also described is a new fluid
handling approach that employs centrifugation, yielding greater recoveries and

85
better precision than afforded by conventional aspiration methods. It is believed
that the basic characteristics displayed here warrant further developments of this
approach to protein sample preparation.
4.2 Experimental Section
4.2.1 Reagents and Chemicals
Lysozyme (chicken egg white), myoglobin (equine skeletal muscle),
sodium chloride (NaCl), sodium phosphate dibasic (Na2HPO4), potassium
phosphate monobasic (KH2PO4), Sigma 7-9® (tris base), trizma® hydrochloride
(tris acid), sinapinic acid (SA), and trifluoracetic acid (TFA) were all obtained from
Sigma-Aldrich (Milwaukee, WI). Potassium chloride (KCl) and formic acid were
obtained from Fisher Chemicals (Pittsburgh, PA). ACS grade acetonitrile (ACN)
was obtained from Mallinckrodt Baker Inc. (Phillipsburg, N.J.) for use as an
organic mobile phase. De-ionized (DI) water (18.2 MΩ/cm) from a Nanopure
Diamond® Barnstead/Thermolyne Water System (Dubuque, IA) was used in
solution preparation of buffers, proteins, and aqueous mobile phases.
4.2.2 Fiber Tip Construction
The fiber tip construction process differs slightly from that previously
described in section 2.2.2.10 In the studies described here, fiber loops
corresponding to a total of 658 PP fibers of 55 μm diameter were pulled
collinearly through ~300 mm lengths of 0.8 mm i.d. fluorinated ethylene
polypropylene (FEP) tubing from Cole Parmer (Vernon Hills, IL). A small portion

86
~5 mm at one end of the fiber packed tubing was cut with a surgical grade
scalpel from Personna (Mansfield, NG, U.K.) so that the tubing and the fiber
ends were flush. Fibers from the opposite end were pulled to create ~6 mm of
space between the tubing and the fiber end to accommodate the micropipette tip.
The end of the tubing with the ~6 mm of dead space was then slipped over a 1
mL micropipette tip (Redi-TipTM) from Fisher Scientific (Pittsburgh, PA). The
tubing was cut so that 1 cm of fiber-packed tubing was attached to each tip. The
process was repeated across the entire length of the ~300 mm fiber packed
tubing producing ~15 tips.
4.2.3 Adaptation to the Centrifugation Format
Previously, a Transferpette® (Brand Tech, Essex, CT) pipette was used
to move (aspirate) the protein solutions through the fiber packed tips.10
Aspiration, a manual process, allowed little control of flow rate and residence
time of protein solutions within the fiber-packed tips. The process of aspiration
also has limited throughput as only one sample can be processed at a time. By
moving protein samples through fiber-packed tips by centrifugal force, more
control of fluid movement can be attained and throughput can be increased to 12
or 24 samples at a time, depending on the capacity of the centrifuge. A pipette
tip adapter was created to allow the fiber-packed tips to be placed into an
accuSPIN™ 1R analytical centrifuge from Fisher Scientific (Pittsburgh, PA). As
shown in Fig. 3.1, the conical portion (~10 mm) of a 1.7 mL microtube from
Genesse Scientific (San Diego, CA) was cut perpendicular to the microtube axis

87
so that it resembled a hollow cylinder. The fiber-packed micropipette tip (fiber
end first) was placed inside the top of the microtube. The fiber-packed
micropipette tip was held in place as the outer wall diameter of the tip
approached the inner wall diameter of the microtube. The microtube containing
the fiber-packed tip was placed into a 15 mL conical centrifuge tube from Nalge
Nunc International (Rochester, NY) and held in place by the attached lid of the
microtube extending past the outer rim of the conical centrifuge tube. The fiber-
packed tips are adapted to a typical analytical centrifuge by placing the 15 mL
conical tubes in the swinging centrifuge buckets.
4.2.4 Protein Loading, Washing, and Elution
A 40 μg mL-1 (2.8 μM) lysozyme solution was made in phosphate-
buffered saline (PBS) consisting of 140 mM NaCl, 10 mM Na2HPO4, 1.8 mM
KH2PO4 and 2.7 mM KCl @ pH 7.3. A 50 µL aliquot was centrifuged through the
1 cm fiber tips at 300 x G for 5 minutes. The same loading procedure was also
performed for myoglobin at 40 μg mL-1 (2.4 μM) in 100 mM Tris
(tris(hydroxymethyl)aminoethane) buffer containing 84 mM tris acid and 15 mM
tris base @ pH 7.5. A single 100 μL volume of Nanopure water was centrifuged
through the 1 cm tips at 300 x G for 10 minutes to remove the buffer species.
The proteins (lysozyme and myoglobin) were eluted from the fiber surfaces by
centrifuging a single 100 µL aliquot of 50:50 ACN:H2O through the tips at 300 x G
for 10 minutes and the eluent was collected in the centrifuge tube.

88
4.2.5 Mass Spectrometry
A Bruker Daltonics Ultraflex II time-of-flight/time-of-flight (ToF/ToF) mass
spectrometer (Billerica, MA), with a MALDI source equipped with a Nd: YAG
laser (355 nm) was used for protein determinations. The accelerating voltages, 1
and 2, were set at 25.00 and 23.45 kV respectively. The focusing lens voltage
used to collimate the ion beam going to the detector was set at 6.00 kV, and the
pulsed ion extraction (PIE) delay was set at 100 ns. A 20 mg mL-1 solution of
sinapinic acid in 50:50 ACN:H2O 0.1% TFA was used as the matrix solution. The
MALDI target was prepared by spotting 1 μL of matrix solution on the target
followed by 1 μL of protein solution. The spot was allowed to dry before
introducing the target into the mass spectrometer. MALDI mass spectra for the
proteins in the original buffer media and post-extraction were compared on both
a qualitative and quantitative basis. No specific effort was made to optimize the
number of laser shots within a data acquisition cycle.
4.3 Results and Discussion
4.3.1 Matrix Assisted Laser Desorption Ionization of Lysozyme Extracted from
PBS
The C-CP fiber method for desalting protein solutions was evaluated
based on the intensity of the molecular ion species, the precision of protein
molecular weight, the signal-to-noise and signal-to-background ratios, and
spectral clarity. Shown in Figure 4.1, are the MALDI mass spectra obtained from
lysozyme in the initial PBS matrix (top) and post-extraction from the C-CP fiber

89
tip (bottom). The mass spectrum of lysozyme in the buffer solution shows a
continuum of signals across the mass range with no discernable lysozyme
molecular ion peak observed after 800 shots of the laser. The absence of a
protein-specific spectral signature is likely the result of ion suppression by the
small inorganic species in the PBS buffer.
Figure 4.1. Matrix assisted laser desorption ionization spectra of lysozyme pre and post-extraction from phosphate buffered saline. 40 μg mL-1 (2.8 μM) lysozyme from chicken egg white in PBS (140 mM NaCl, 2.7 mM KCl, 10mM Na2HPO4, and 1.8 mM KH2PO4 at pH 7.3) (top), and in PBS-removed solution (bottom) via desalting on PP C-CP fibers mounted in a micropipette tip.
Ionized species from the buffer would show up at much lower mass
ranges <300 Da, however when analyzing high molecular weight compounds
such as proteins it is common to deflect ions lower than ~2000 Da from reaching
the detector. The mass spectrum of lysozyme eluted from the C-CP fiber-

90
packed tip is composed of a high intensity lysozyme psuedomolecular ion peak
at 14309 Da and an adduct peak from the matrix at 14527 Da. The average
value and standard deviation of the background was assessed across the mass
range of 12000 - 12500 Da. The signal-to-noise and signal-to-background ratios
of lysozyme post-extraction are 554 and 186, respectively. Interestingly, the
average background signal intensity for the lysozyme in the PBS solution across
the same mass range was very similar; with 800 laser firings used in both
acquisitions. This reflects the fact that the buffer components, having high proton
affinities, compete with protein molecules for ionization in the MALDI process; as
such the desalted lysozyme ionizes significantly better. The C-CP fiber-extracted
lysozyme sample yielded only a 2 Da (0.01%) difference in the mass-to-charge
ratio of the molecular ion compared with the MALDI mass spectrum of a neat (20
μg mL-1 in 50:50 ACN:H2O) solution of lysozyme. This concentration was chosen
for the neat lysozyme sample because it would represent 100% efficiency of the
C-CP fiber SPE process. A typical measurement error of ~0.01% can be
routinely expected using MALDI-MS.42 While comparisons of ion intensities in
MALDI analysis are complicated by issues related to hitting ‘sweet spots’ within
matrix crystals, the signals of the psuedomeolcular ions for the neat and post-
extraction lysozyme spectra differed by less than 10%. This suggests that the C-
CP extraction of lysozyme from PBS was quite efficient.

91
4.3.2 Matrix Assisted Laser Desorption Ionization of Myoglobin Extracted from
Tris Buffer
The use of a hydrophobic surface to immobilize proteins from inorganic
buffers such as PBS is far less challenging than the case with the buffer
constituents have non-polar character. The mass spectra presented in Fig. 4.2
are for myoglobin in 100 mM tris buffer (top), and after elution from the C-CP
fiber phase (bottom).
Figure 4.2. Matrix assisted laser desorption ionization mass spectra of myoglobin pre and post-extraction. 40 μg mL-1 (2.4 μM) myoglobin from equine skeletal muscle in 100 mM tris buffer (top) and in tris-extracted solution (bottom) via desalting on PP C-CP fibers mounted in a micropipette tip.
The most noticeable feature of the mass spectrum of myoglobin in the buffer-
matrix is the high intensity envelope of peaks at masses between ~16950 and
17600 Da. A peak at 16959 Da representing the myoglobin psuedomolecular ion

92
can be seen, but higher intensity peaks at masses between 17009 and 17574 Da
dominate the mass spectrum. The mass difference between the adduct peaks
are on average ~56 Da, most likely representing portions of the tris buffer forming
multiple adducts with the protein. The mass spectrum of myoglobin after C-CP
fiber extraction yields a high intensity peak for the myoglobin psuedomolecular
ion at a mass of 16964 Da and a matrix adduct at 17165 Da. The mass
observed for myoglobin post-extraction was within 5 Da (0.03%) of a neat
solution of myoglobin (20 μg mL-1 in 50:50 ACN:H2O).
The average and standard deviation of the spectral background were
derived between 16000 and 16500 Da. The signal-to-noise and signal-to-
background ratio for the myoglobin molecular ion peak in the mass spectra
before extraction was 89 and 86 respectively, while the post-extraction signal-to-
noise and signal-to-background ratios were 97 and 12 respectively. The
diminished signal-to-background ratio for the mass spectra of the post-extraction
myoglobin is likely due to the lower concentration of myoglobin found in the
eluted solution and the increased number of laser shots (6400 vs 3000), yielding
larger noises levels. However, the spectral clarity of myoglobin post-extraction
outweighs the loss in signal-to-background ratio.
4.4 Conclusions
Previously, PP C-CP fibers were used to desalt proteins prior to ESI-MS
analysis 10. The results from these experiments extend the potential of PP C-CP
fibers as a SPE media for desalting proteins prior to MALDI-MS analysis. PP C-

93
CP fibers bind protein and allow salts and weakly bound organics to be washed
from the fiber tips with aqueous mobile phases. Adsorbed proteins can be eluted
from the fiber phase with an organic modifier such as acetonitrile. This procedure
purifies protein solutions and improves analyte signal responses in the MALDI
mass spectra in terms of reduced ion suppression from buffer species, reduced
adduct formation, higher signal-to-noise ratios, and precise molecular weight
determinations; all of which are critical for the characterization of biologically
active molecules.
Though a number of commercially available SPE media have been
adapted to micropipette tip geometries 8, the C-CP fibers present several unique
features that could prove advantageous. The robustness of polymer fiber
materials allows for the use of more diverse solvent conditions. The wide range
of base polymer materials provides several polymer/surface interactions ranging
from London dispersion forces, to π-π interactions and hydrogen bonding. In
addition, the eight capillary channels running the entire fiber length facilitate fluid
transport, allowing different means of loading, washing, and elution. Optimization
of several parameters including: packing density, fiber-packed tip length, and the
linear velocity of fluid flow within fiber-packed tips are underway to improve the
efficiency of C-CP fiber extractions. Additionally, the use of wicking as a means
of loading protein solutions onto fibers is under investigation. Fiber loading
capacity and analytical quantification will be key attributes to be compared with
commercial micropipette SPE tips.

94
CHAPTER 5
CONCLUSIONS
5.1 Summary
In Chapter 1, solid phase extraction (SPE) was discussed as an analytical
technique for the isolation, purification, and concentration of analytes. Interaction
types, architecture formats, and applications have been discussed and related to
current sample preparation regimes. The benefits of SPE related to the
purification of proteins prior to mass spectrometry analysis have been outlined.
The research presented here is aimed at introducing capillary-channeled polymer
(C-CP) fibers as stationary phases for SPE of proteins from buffered solutions.
Chapter 2 described the incorporation of C-CP fibers as sorbent material for
desalting protein solutions prior to ESI-MS analysis. It was shown that both
phosphate buffered saline (PBS) at154 mM and tris buffer in 100 mM suppressed
the formation of multiply charged lysozyme and myoglobin species respectively.
ESI mass spectra of lysozyme and myoglobin proteins post-extraction using PP
fiber-packed micropipette tips exhibited higher signal-to-noise and signal-to-
background ratios and more precise molecular weight determinations compared
to the proteins in the original buffer solution.
Chapter 3 described the characterization of PP and PET fiber-packed
micropipette tips based on mass balance, recovery, and extraction
95
characteristics as well as a comparison of two loading methods, centrifugation
and aspiration. Aspiration and centrifugation were used to move protein
solutions through fiber-packed micropipette tips and compared based on
resulting ESI mass spectra quality from eluted fractions and throughput. Simple
adaptors have been made to allow coupling of fiber-packed micropipette tips to
typical 15 mL centrifuge tubes. Centrifugation of test protein solutions through
fiber-packed micropipette tips allowed more control of flow rate, increased
throughput, and resulted in extracted samples that exhibited more reproducible
ESI mass spectra.
PP and PET fiber tips were compared for the extraction of lysozyme and
bovine serum albumin (BSA) from PBS. Adsorption of lysozyme and BSA were
similar for both fiber types based on total fiber surface area within the fiber-
packed tip. The recovery of lysozyme was higher using PP, likely due to the
weaker interactions on the PP fiber surface allowing a greater degree of
reversible adsorption under these elution conditions. However, recovery for
BSA was higher using PET indicating that recovery of protein from C-CP fiber is
both a function of polymer type and protein species. ESI spectral clarity was
compared for post-extraction protein solutions from both fiber types based on
signal intensity, signal-to-noise, and signal-to-background ratios. ESI mass
spectra from lysozyme extracted by PP exhibited more desirable spectral
characteristics, most likely due to the increased fiber surface area within the tip
allowing for more adsorption and subsequent elution of lysozyme.

96
Chapter 4 described the use of C-CP fibers as sorbent material for desalting
protein solutions prior to MALDI-MS analysis. Parallel experiments initially
performed and described in chapter 2 for desalting proteins prior to ESI-MS were
completed prior to MALDI-MS. MALDI mass spectra from lysozyme and
myoglobin post-extraction using PP fiber-packed micropipette tips exhibited more
spectral clarity through reduced ion suppression, reduced adduct formation, and
higher signal-to-noise and signal-to-background ratios than proteins in the
original buffer solution. PP fibers were shown to adsorb both myoglobin and
lysozyme from tris-buffer and phosphate buffered saline (PBS) respectively.
MALDI mass spectra from myoglobin in tris-buffer resulted in low intensity
molecular ions and higher intensity adduct species as shown previously with ESI-
MS. Post-extraction myoglobin MALDI mass spectra were free of tris adduct
peaks and exhibited a molecular ion peak for myoglobin precise to ~ 5 Da
(0.03%) of a neat sample of myoglobin. The ionization of lysozyme in the MALDI
source was suppressed due to the presence of low molecular weight inorganic
salts in the PBS buffer. MALDI mass spectra of lysozyme post-extraction
exhibited a high intensity molecular ion peak precise to ~2 Da (0.01%) of a neat
lysozyme sample.
5.2 Future Work
It is envisioned that C-CP fibers due to their resistance to pH extremes,
low cost of fiber materials, relative hydrophobicity, and hydrodynamic
characteristics could be an attractive alternative to commercial phases for protein

97
sample preparation. At present, the use of 1 cm of 0.8 mm I.D. fiber-packed
tips has been employed for the removal of proteins from buffering species. An
optimization of the length and diameter of the fiber-packed tip could increase
protein recoveries. In addition the optimization of fiber packing density
(interstitial fraction) needs to be accomplished as done previously with C-CP fiber
HPLC columns.61 Also, spontaneous wicking, a characteristic of the fibers, has
yet to be investigated as a means of loading protein solutions. Wicking could
prove as an excellent means of efficiently loading protein solutions. In addition,
experiments to extend the work to other benchmark proteins and buffer systems
are in order to fully realize the potential of the fibers for use in protein sample
preparation.

98
APPENDIX
Chapter 2 reproduced with permission from:
Capillary-Channeled Polymer Fibers as a Stationary Phase for Desalting Protein Solutions for Electrospray Ionization Mass Spectrometry Analysis, Fornea, D. S., Wu, Y., Marcus, R. K., Analytical Chemistry; (Small Correspondence); 2006; 78 (15); 5617-5621. Copyright 2006 American Chemical Society.

99
REFERENCES
(1) Bakry, R.; Gjerde, D.; Bonn, G. K. Journal of Proteome Research 2006, 5, 1321-
1331.
(2) Miyazaki, S.; Morisato, K.; Ishizuka, N.; Minakuchi, H.; Shintani, Y.; Furuno,
M.; Nakanishi, K. Journal of Chromatography A. 2004, 1043, 19-25.
(3) Pyrzynska, K. Chemia Analityczna 2003, 48, 781-795.
(4) Fritz, J. S. Analytical Solid-Phase Extraction; John Wiley & Sons, Inc.: New
York, 1999.
(5) Baczek, T. Journal of Pharmaceutical and Biomedical Analysis 2004, 34, 851-
860.
(6) Li, K. M., Rivory, L. P., Clarke, S. J. Current Pharmaceutical Analysis 2006, 2,
95-102.
(7) Salplachta, J.; Rehulka, P.; Chmelik, J. Journal of Mass Spectrometry 2004, 39,
1395-1401.
(8) Shukla, A.; Majors, R. E. LCGC 2005, 23, 646-660.
(9) Nelson, D. M.; Stanelle, R. D.; Brown, P.; Marcus, R. K. American Laboratory
2005, 28-31.
(10) Fornea, D. S., Wu, Y., Marcus, R. K. Analytical Chemistry 2006, 78, 5617-5621.
(11) Pipkin, W. American Laboratory 1990, 40D.

100
(12) Simpson, N., Van Horne, K. C. Sorbent Extraction Technology Handbook; Varian
Sample Preparation Products: Harbor City, 1993.
(13) Thurman, E. M. Solid-Phase Extraction: Principles and Practice; John Wiley &
Sons, Inc.: New York, 1998.
(14) Majors, R. E. LC-GC 1998, S8-S15.
(15) Simpson, N. J. K. Solid-Phase Extraction: Principles, Techniques, and
Applications; Marcel Dekker, Inc.: New York, 2000.
(16) Poole, C. F., Gunatilleka, A.D., Revathy, S. Journal of Chromatography A 2000,
885, 17-39.
(17) Burnham, A. K., Calder, G. V., Fritz, J. S., Junk, G. A., Svec, H. J., Vick, R. J.
Am. Waterworks Assoc. 1973, 65, 722.
(18) Burnham, S. K., Calder, G. V., Fritz, J. S., Junk, G. A., Svec, H. J., Willis, R.
Analytical Chemistry 1972, 44, 139.
(19) Junk, G. A., Chriswell, C. D., Chang, R. C., Kissinger, L. D., Richard, J. J., Fritz,
J. S., Svec, H. J. Analytical Chemistry 1976, 282, 331.
(20) Majors, R. E. LC-GC 1996, 14, 754-766.
(21) Majors, R. E. LC-GC 1997, 15, 1008-1015.
(22) Subden, R. E., Brown, R. G., and Noble, A.C. Journal of Chromatography A
1978, 166, 310-312.
(23) Xie, S., Jiang T., Svec, F., Allington, R. W. Monolithic Materials; Elsevier:
Amsterdam, 2003.
(24) Barcelo D., D., B., Bouvot, V., Neilen, M. Environmental Science Technology
1993, 27, 271-277.

101
(25) Dombrowski, T. R., Wilson, G. S., Thurman, E. M. Analytical Chemistry 1998,
70, 1969.
(26) Pichon, V., Charpak, M., Hennion, M. C., Journal of Chromatography A 1998,
795, 83-92.
(27) Urbe, I., Ruana, J. Journal of chromatography A 1998, 778, 337-345.
(28) Viana, E., Redond, M. J., Font, G. Molto, J. C. Journal of Chromatography A
1996, 733, 267-274.
(29) Svec, F., Frechet, J. M. J. Science 1996, 273, 205.
(30) Svec, R., Frechet, J. M. J. Analytical Chemistry 1992, 54, 820.
(31) Tennikova, T. B., Bleha, M., Svec, F., Almazova, T. V., Belenkii, B. G. Journal
of Chromatography 1991, 555, 97.
(32) Xie, S., Svec, F., Frechet, J. M. J. Chem. Mater. 1998, 10, 4072.
(33) Huck, C. W., Bonn, G. K. Journal of Chromatography A. 2000, 885, 51-72.
(34) Mussman, P., Levsen, K., Radeck, W., Freseius J. Analytical Chemistry 1994,
348, 654.
(35) Schulein, J., Martens, D. Spitzauer, P., Kettrup, A., Fresenius J. Analytical
Chemistry 1995, 352, 565.
(36) Majors, R. E. LC-GC 1991, 4, 10.
(37) McDowall, R. D. Journal of Chromatography A 1989, 492, 3.
(38) Slejko, F. L. Adsorption Technology: A step-by-step approach to process
evalutation and application; Marcel Dekker Inc.: New York, 1985.
(39) Parfitt, G. D., Rochester, C. H. Adsorption from Solution at the Solid/Liquid
Interface; Academic Press Inc.: New York, 1983.

102
(40) Toth, J. Adsorptoin: Theory, Modeling, and Analysis; Marcel Dekker, Inc.: New
York, 2002.
(41) Chapman, J. R. Practical Organic Mass Spectrometry; John Wiley & Sons Ltd.:
Chichester, 1993.
(42) de Hoffmann, E., Stroobant, V. Mass Spectrometry Principles and Applications;
John Wiley & Sons Ltd.: Chichester, 1999.
(43) Cunico, R. L., Gooding, K. M., Wehr, T. Basic HPLC and CE of Biomolecules;
Bay Bioanalytical Laboratory, Inc.: Richmond, 1998.
(44) Riley, J. P., Taylor, D., Analytical Chimica Acta 1969, 46, 307.
(45) Masque, N., Galia M., Marce R., Borull F. Journal of Chromatography A 1998,
803, 147-155.
(46) Wissiach, R., Rosenberg E., Grasserbauer M. Journal of Chromatography A
2000, 816, 159-167.
(47) Kantipuly, C., Katragadda, S., Chow, A., Gesser, H. D., Talanta 1990, 37, 491.
(48) Masque, N., Marce, R. M., Borull, F. Trends in Analytical Chemistry 1998, 17,
384.
(49) Neue, U. D. HPLC Columns: Theory, Technology, and Practice; Wiley-VCH,
Inc.: New York, 1997.
(50) Marcus, R. K.; Davis, W. C.; Knippel, B. C.; LaMotte, L.; Hill, T. A.; Perahia, D.;
Jenkins, J. D. Journal of Chromatography A. 2003, 986, 17-31.
(51) Daignault, S. A., Noot, D. K., Williams, D. T., Huck, P. M. Wat. Res. 1988, 22,
803.

103
(52) Junk, G. A., Suffet, I. H., Malayiandi, M., Washington D.C. 1987; American
Chemical Society; 201.
(53) McNeil, E. E., Otson, R., Miles W. F., Rajabalee, F. J. M. Journal of
Chromatography 1977, 132, 277.
(54) Liska, I. Journal of Chromatography A 2000, 885, 3-16.
(55) Ding, H. B., Yang, M. C., Schisla, D., Cussler, E. L. AiChE J. 1989, 35, 814.
(56) Ding, H. B., Cussler, E. L. Biotechnol. Prog. 1990, 6, 472.
(57) Yang, W. J., Pin C., Fane, A. G. Analytical Chimica Acta 1998, 369, 17.
(58) Chen, L. Q., Zhang, W., Zhen, Z. Journal of Chromatography A 1996, 740, 195.
(59) Czok, M., Guichon, G. Journal of Chromatography 1990, 506, 303.
(60) Meyer, R. F., Champlin, P. B., Hartwick, R. A. Journal of Chromatographic
Science 1983, 21, 433.
(61) Stanelle, R. D. S., L. C., Marcus, R. K. J. Chromatogr. A 2005, 1100, 68-75.
(62) Stanelle, R. D., Mignanelli, M., Brown, P., Marcus, R. K. Anal. Bioanal. Chem
2006, 384, 250-258.
(63) Nelson, D. M., Marsuc, R. K. J. Chromatogr. Sci. 2003, 41, 475-479.
(64) Nelson, D. M., Marcus, R. K. Protein Peptide Letts. 2006, 13, 95-99.
(65) Daghbouche, Y., Garrigues, S., Vidal, M.T. Analytical Chemistry 1997, 69, 1086-
1091.
(66) Fisher, J. F., Rouseff, R. L. J. Agric. Food Chem. 1986, 34, 985.
(67) Dugar, S. M., Leibowitz, J. N., Dyer, R. H. J. AOAC Int. 1994, 77, 1335.
(68) Pellegrino, R. P., De Noni, I., Masotti, R. J. Dairy Sci., 79, 725-734.

104
(69) Cherchi, A., Spanedda, L., Tuberoso, C., Cabras, P. Journal of Chromatography
A 1994, 669, 59-64.
(70) Fenn, J. B., et al. Science 1989, 246, 64-71
(71) Karas, M. Analytical Chemistry 1988, 60, 2299-2301.
(72) Thomas, R. Spectroscopy 2001, 16, 28-37.
(73) Rubinson, K. A., Rubinson, Judith F. Contemporary Instrumental Analysis;
Prentice Hall: Upper Saddle River, 2000.
(74) Good, N. E., Winget, G. D., Winter, W. Connolly, T. N., Izawa, S., Singh, R. M.
M. Biochemistry 1966, 5, 467-477.
(75) Bakhtiar, R., Hofstadler, R., Smith, R. D. Journal of Chemicial Education 1996,
73, A118.
(76) Hofstadler, S. A., Bakhtiar, R., Smith, R. D., Journal of Chemicial Education
1996, 73, A82.
(77) Hop, C. E. C. A., Bakhtiar, R. Journal of Chemical Education 1996, 73, A162.
(78) Mikkelsen, S. R., Corton, E. Bioanalytical Chemistry; New Jersey: Hoboken,
2004.
(79) Beavis, R. C., Chait, B. T. Methods Enzymol. 1996, 270, 519-551.
(80) Xiang, F., Beavis, R. C. Rapid Comm. Mass Spectrom 1994, 8, 199-204.
(81) Wells, D. A. High Throughput Bioanalytical Samle Preparation; Elsevier
Science: Amsterdam, 2003.
(82) Xu, Y. D.; Bruening, M. L.; Watson, J. T. Mass Spectrom. Rev. 2003, 22, 429-
440.

105
(83) Pramanik, B. N.; Ganguly, A. K.; Gross, M. L. Applied Electrospray Mass
Spectrometry; Marcel Dekker: New York, 2002.
(84) Zheng, J. J.; Lynch, E. D.; Unger, S. E. Journal of Pharmaceutical and
Biomedical Analysis 2002, 28, 279-285.
(85) Terry, D. E.; Umstot, E.; Desiderio, D. M. Journal of the American Society for
Mass Spectrometry 2004, 15, 784-794.
(86) Dahlin, A. P.; Bergstrom, S. K.; Andren, P. E.; Markides, K. E.; Bergquist, J.
Analytical Chemistry 2005, 77, 5356-5363.
(87) Tan, A.; Benetton, S.; Henion, J. D. Analytical Chemistry 2003, 75, 5504-5511.
(88) Bagshaw, R. D.; Callahan, J. W.; Mahuran, D. J. Analytical Biochemistry 2000,
284, 432-435.
(89) Stanelle, R. D.; Sander, L. C.; Marcus, R. K. J. Chromatogr. A 2005, 1100, 68-75.
(90) Voet, D.; Voet, J. G.; Pratt, C. W. Fundamentals of Biochemistry; John Wiley &
Sons: New York, 2002.
(91) Junk, G. A., Svec, H. J., Vick, R. D., Avery, M. J. Environmental Science
Technology 1974, 8, 1100-1106.
(92) Luska, I., Krupcik, J., Leclercq, P. A. Journal of High Resolution
Chromatography 1989, 12, 577.
(93) Gao, D., Lin, D. Q., Yao, S. J. J. Chem. Eng. Data 2006, 51, 1205-1211.
(94) Rojas, E. E. G., dos Reis Coimbra, J. S., Minim, L. A., Saraiva, S. H., Sodre da
Silva, C. A. Journal of Chromatography B 2006, 840, 85-93.
(95) In Sigma-Aldrich Co.; 910, B., Ed., 1998, pp 10.
(96) Nelson, D. K.; Marcus, R. K. Anal. Chem., in press.
106
(97) Voet, D. V., J. G. Biochemistry; John Wiley & Sons Inc.: New York, 1990.
(98) Rappsilber, J., Ishihama, Y., Mann, M. Analytical Chemistry 2003, 75, 663-670.
(99) Callensen, A. K., Mohammed, S., Bunkenborg, J. Kruse, T. A., Cold, S.,
Mogensen, O., Christensen, R., Vach, W., Jorgensen, P. E., Jensen, O. N. Rapid
Comm. Mass Spectrom 2005, 19, 1578-1586.
(100) Chin, E. T., Papac, D. I> Analytical Biochemistry 1999, 273, 179-185.
(101) Fountaoulakis, M., Langen, H. Analytical Biochemistry 1997, 250, 153-156.
(102) Larsen, M. R., Cordwell, S. J., Roepstorff, P. Proteomics 2002, 2, 1277-1287.
(103) Haile, W. A., Phillips, B. M. Tappi J 1995, 78, 139-142.