income, standard of living and consumption patterns income ... · b 2218 2276 2291 2385 2488 2463...
TRANSCRIPT

European System of Social Indicators (EUSI), Social Indicators Department, ZUMA, Mannheim
Life Domain: Income, Standard of Living and Consumption Patterns Goal Dimension: Improvement of Objective Living Conditions Measurement Dimension: Income Level Subdimension: Indicator: I1111 Gross Domestic Product per Capita Definition: Gross domestic product at market prices in purchasing power standards (PPS) per capita
Population: Total
Country 1980 1981 1982 1983 1984 1985 1986 1987 1988 1989 1990 1991 1992 1993 1994 1995 1996 1997 1998 1999 2000 2001 EU-12 9039 9742 10446 11072 11632 12589 13642 14592 EU-15 15720 16300 16280 17010 17640 18470 19400 20270 21270 22570 23180 EU-25 A 10948 11551 12272 12667 13263 14285 15382 16647 17020 17680 18180 18940 19460 20640 21540 22290 23650 25710 26320 B 9558 10316 10886 11377 11869 12948 14092 15188 16840 17880 18500 19390 19860 20580 21630 22440 22650 24090 24690 D 16770 17740 17670 18730 19420 19910 20920 21520 22630 23800 24140 D-W 10611 11541 12397 13082 13579 14577 15720 17046 D-E DK 9816 10831 11826 12636 12964 13656 14431 15302 17350 17590 18410 19820 20840 22340 23300 23930 25390 26920 27530 E 6423 6855 7337 7796 8403 9190 10099 10936 12680 12840 12950 13220 13800 14650 15510 16070 17470 18460 19100 F 10399 11103 11800 12417 12946 13982 15191 16204 17290 17690 17370 17780 18320 18700 19210 20050 21200 22690 23620 FIN 10170 10813 11644 12193 13051 14187 15597 16203 15060 14230 14900 15530 17110 17900 19270 20520 21490 23500 24280 GB GR 5502 5944 6396 6690 6806 7390 8204 8433 9530 10150 10440 11040 11640 12310 12790 13560 14520 15310 15780 I 9211 9962 10682 11334 11947 12928 13967 14902 16590 17130 16660 17530 18250 19300 19800 20980 21980 23580 24270 IRL 5490 6007 6468 6918 7410 8055 9145 10401 12070 13040 13610 14940 16450 17290 20130 21520 23890 25990 27470 N-IRL L 10490 11536 13624 15248 15479 17259 19973 21624 25620 26540 28240 29560 30140 31180 33690 36250 39820 44510 45750 NL 9384 10159 10874 11467 11782 12547 13717 14824 16410 16980 17260 18050 19280 20160 21820 23380 24340 25560 26020 P 5146 5333 5732 6168 6676 7382 8233 8683 10210 10720 11090 11830 12310 12950 14240 14630 15310 16190 16920 S 11479 12404 13055 13652 14476 15309 16252 17011 16700 16370 16290 17080 18100 18920 19830 20580 21550 22790 23130 UK 8874 9573 10364 11134 11895 12984 13908 14565 15260 16010 16150 16810 17020 18550 19890 20970 21400 22540 23160 CY 15700 16600 17600 17100 17200 CZ 9900 10800 11600 12100 12200 12500 12700 13800 EE 5100 5200 5600 6100 7500 8000 8200 9100 9300 H 7100 7600 7800 8300 9100 9700 10400 11200 12300 LV 4000 4200 4300 4700 5300 5700 6100 7000 7800 LT 4800 5300 6900 7500 7300 8000 8900 MT 10600 11100 11700 PL 5300 5700 6200 6900 7300 7800 8300 9100 9400 SK 6400 6800 7400 8200 9600 10100 10500 10400 11000 SI 9900 10700 11300 12200 12800 13500 14500 15900 16800 CH 21020 21540 22040 22660 23280 23240 24830 25690 26460 27320 28030 N 17910 18330 20540 20530 21340 23710 25500 25140 27430 33090 33820 U.S. 19300 20332 22690 23660 23810 25340 26110 26720 27930 29960 30500 32270 32400 JAP 14367 16286 18740 19380 19860 20720 21280 22580 23090 23680 22890 24120 24290
Source: EU-15-countries, N, CH, U.S. Jap, 1991-2001: Eurostat, Statistical Yearbook 2003; EU-15-countries, N, CH, U.S. Jap, 1983-1990: Eurostat, Statistical Yearbook '95; countries acceding the EU on 1 May 2004, 1997-2001: Eurostat, Statistical Yearbook on Candidate Countries 2003; countries acceding the EU on 1 May 2004, 1993-1996: Eurostat, Statistical Yearbook on Central European Countries. Data 1993-97
Notes: EU-15-countries, N, CH, U.S. Jap: break in time series between 1983-1990 and 1991-2001 due to differing sources; countries acceding the EU on 1 May 2004: break in time series between 1993-1996 and 1997-2001 due to differing sources

European System of Social Indicators (EUSI), Social Indicators Department, ZUMA, Mannheim
Life Domain: Income, Standard of Living and Consumption Patterns Goal Dimension: Improvement of Objective Living Conditions Measurement Dimension: Income Level Subdimension: Indicator: I1112 Household Net Income Definition: Average monthly net income of private households in purchasing power standards (PPS)
Population: Total
Country 1980 1981 1982 1983 1984 1985 1986 1987 1988 1989 1990 1991 1992 1993 1994 1995 1996 1997 1998 1999 2000 2001 EU-12 EU-15 EU-25 A 1821 1823 1887 1933 2088 2206 2195 B 1633 1673 1756 1795 1844 1860 1978 2060 D 1630 1718 1763 D-W D-E DK 1485 1579 1709 1758 1904 2069 2120 2146 E 1506 1542 1679 1690 1714 1916 2021 2094 F FIN 1245 1353 1343 1387 1525 1582 GB GR 962,3 1056 1151 1218 1374 1478 1463 1449 I 1466 1461 1528 1546 1629 1718 1763 1798 IRL 1449 1658 1552 1755 1793 1873 1992 2227 N-IRL L 2946 2890 3134 NL 1495 1497 1593 1640 1722 1764 1755 1832 P 1041 1074 1182 1242 1319 1414 1698 1751 S UK 1681 1704 1867 CY CZ EE H LV LT MT PL SK SI CH N U.S. JAP
Source: European Community Household Panel

European System of Social Indicators (EUSI), Social Indicators Department, ZUMA, Mannheim
Life Domain: Income, Standard of Living and Consumption Patterns Goal Dimension: Improvement of Objective Living Conditions Measurement Dimension: Income Level Subdimension: Indicator: I1112 Household Net Income Definition: Average monthly net income of private households in purchasing power standards (PPS)
Population: 1-person households
Country 1980 1981 1982 1983 1984 1985 1986 1987 1988 1989 1990 1991 1992 1993 1994 1995 1996 1997 1998 1999 2000 2001 EU-12 EU-15 EU-25 A 1003 997 1049 1046 1129 1213 1217 B 964 975 1077 1097 1108 1095 1134 1218 D 1047 1081 1104 D-W D-E DK 837 865 930 908 945 1035 1086 1044 E 781 754 859 809 857 911 964 995 F FIN 719 770 737 765 826 863 GB GR 498 563 579 615 653 715 734 718 I 831 877 862 879 906 956 953 960 IRL 708 971 746 921 812 864 879 910 N-IRL L 1857 1884 2011 NL 944 986 1024 1104 1167 1198 1206 1294 P 475 421 484 471 534 548 592 665 S UK 923 899 953 CY CZ EE H LV LT MT PL SK SI CH N U.S. JAP
Source: European Community Household Panel
Notes:

European System of Social Indicators (EUSI), Social Indicators Department, ZUMA, Mannheim
Life Domain: Income, Standard of Living and Consumption Patterns Goal Dimension: Improvement of Objective Living Conditions Measurement Dimension: Income Level Subdimension: Indicator: I1112 Household Net Income Definition: Average monthly net income of private households in purchasing power standards (PPS)
Population: 2-person households
Country 1980 1981 1982 1983 1984 1985 1986 1987 1988 1989 1990 1991 1992 1993 1994 1995 1996 1997 1998 1999 2000 2001 EU-12 EU-15 EU-25 A 1792 1781 1805 1854 1991 2086 2086 B 1620 1626 1699 1741 1740 1749 1855 1887 D 1711 1803 1841 D-W D-E DK 1606 1627 1715 1789 1938 2067 2117 2172 E 1185 1193 1301 1286 1331 1469 1499 1576 F FIN 1331 1467 1487 1517 1650 1754 GB GR 767 862 900 950 1021 1084 1063 1093 I 1371 1345 1410 1451 1464 1538 1590 1608 IRL 1391 1601 1476 1583 1634 1648 1680 1788 N-IRL L 2987 2743 3026 NL 1696 1690 1810 1846 1948 1995 1977 2069 P 802 878 930 1009 1023 1095 1255 1281 S UK 1759 1761 1901 CY CZ EE H LV LT MT PL SK SI CH N U.S. JAP
Source: European Community Household Panel
Notes:

European System of Social Indicators (EUSI), Social Indicators Department, ZUMA, Mannheim
Life Domain: Income, Standard of Living and Consumption Patterns Goal Dimension: Improvement of Objective Living Conditions Measurement Dimension: Income Level Subdimension: Indicator: I1112 Household Net Income Definition: Average monthly net income of private households in purchasing power standards (PPS)
Population: 3-person households
Country 1980 1981 1982 1983 1984 1985 1986 1987 1988 1989 1990 1991 1992 1993 1994 1995 1996 1997 1998 1999 2000 2001 EU-12 EU-15 EU-25 A 2074 2209 2290 2245 2500 2604 2608 B 1877 2015 2045 2083 2120 2107 2194 2411 D 2035 2162 2223 D-W D-E DK 2113 2114 2276 2317 2499 2666 2681 2721 E 1563 1560 1695 1722 1698 1884 2013 2079 F FIN 1618 1797 1811 1950 2103 2240 GB GR 1122 1281 1421 1486 1727 1813 1737 1792 I 1667 1648 1807 1777 1936 2007 2071 2121 IRL 1637 1747 1805 1983 2067 2159 2299 2477 N-IRL L 3336 3388 3656 NL 1757 1747 1857 1896 2020 2037 2021 2061 P 1144 1159 1274 1283 1345 1458 1827 1837 S UK 2009 2243 2181 CY CZ EE H LV LT MT PL SK SI CH N U.S. JAP
Source: European Community Household Panel
Notes:
European System of Social Indicators (EUSI), Social Indicators Department, ZUMA, Mannheim
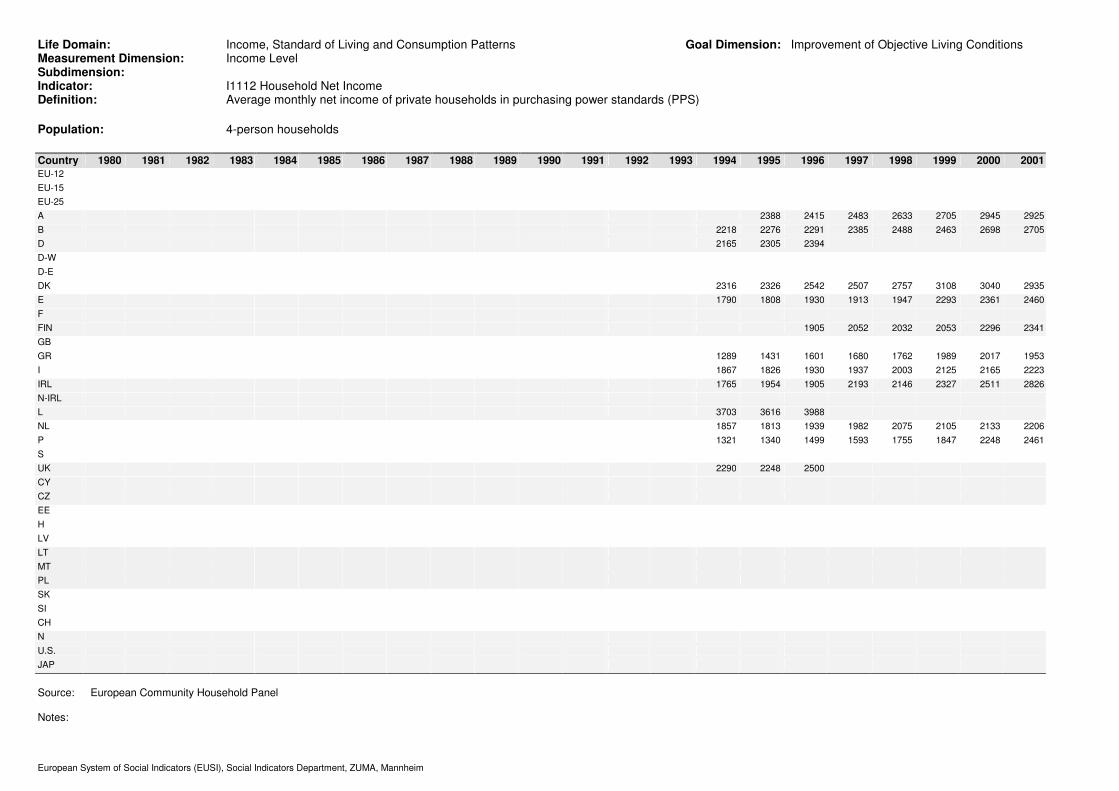
Life Domain: Income, Standard of Living and Consumption Patterns Goal Dimension: Improvement of Objective Living Conditions Measurement Dimension: Income Level Subdimension: Indicator: I1112 Household Net Income Definition: Average monthly net income of private households in purchasing power standards (PPS)
Population: 4-person households
Country 1980 1981 1982 1983 1984 1985 1986 1987 1988 1989 1990 1991 1992 1993 1994 1995 1996 1997 1998 1999 2000 2001 EU-12 EU-15 EU-25 A 2388 2415 2483 2633 2705 2945 2925 B 2218 2276 2291 2385 2488 2463 2698 2705 D 2165 2305 2394 D-W D-E DK 2316 2326 2542 2507 2757 3108 3040 2935 E 1790 1808 1930 1913 1947 2293 2361 2460 F FIN 1905 2052 2032 2053 2296 2341 GB GR 1289 1431 1601 1680 1762 1989 2017 1953 I 1867 1826 1930 1937 2003 2125 2165 2223 IRL 1765 1954 1905 2193 2146 2327 2511 2826 N-IRL L 3703 3616 3988 NL 1857 1813 1939 1982 2075 2105 2133 2206 P 1321 1340 1499 1593 1755 1847 2248 2461 S UK 2290 2248 2500 CY CZ EE H LV LT MT PL SK SI CH N U.S. JAP
Source: European Community Household Panel
Notes:

European System of Social Indicators (EUSI), Social Indicators Department, ZUMA, Mannheim
Life Domain: Income, Standard of Living and Consumption Patterns Goal Dimension: Improvement of Objective Living Conditions Measurement Dimension: Income Level Subdimension: Indicator: I1112 Household Net Income Definition: Average monthly net income of private households in purchasing power standards (PPS)
Population: households of 5 persons or more
Country 1980 1981 1982 1983 1984 1985 1986 1987 1988 1989 1990 1991 1992 1993 1994 1995 1996 1997 1998 1999 2000 2001 EU-12 EU-15 EU-25 A 2794 2857 2960 3168 3565 3656 3632 B 2394 2377 2545 2462 2600 2699 2793 2945 D 2399 2552 2683 D-W D-E DK 2264 2280 2426 2512 2699 2751 3000 3180 E 2047 2149 2322 2442 2509 2779 3055 3211 F FIN 1974 2054 2064 2099 2460 2374 GB GR 1220 1362 1493 1645 2041 1924 1940 1981 I 1742 1869 1963 1961 2070 2187 2235 2274 IRL 1808 2109 1959 2247 2422 2528 2739 3188 N-IRL L 3732 3789 4271 NL 1823 1770 1937 1934 2012 2194 2110 2166 P 1338 1495 1578 1618 1653 1813 2147 2052 S UK 2126 2096 2421 CY CZ EE H LV LT MT PL SK SI CH N U.S. JAP
Source: European Community Household Panel
Notes:
European System of Social Indicators (EUSI), Social Indicators Department, ZUMA, Mannheim
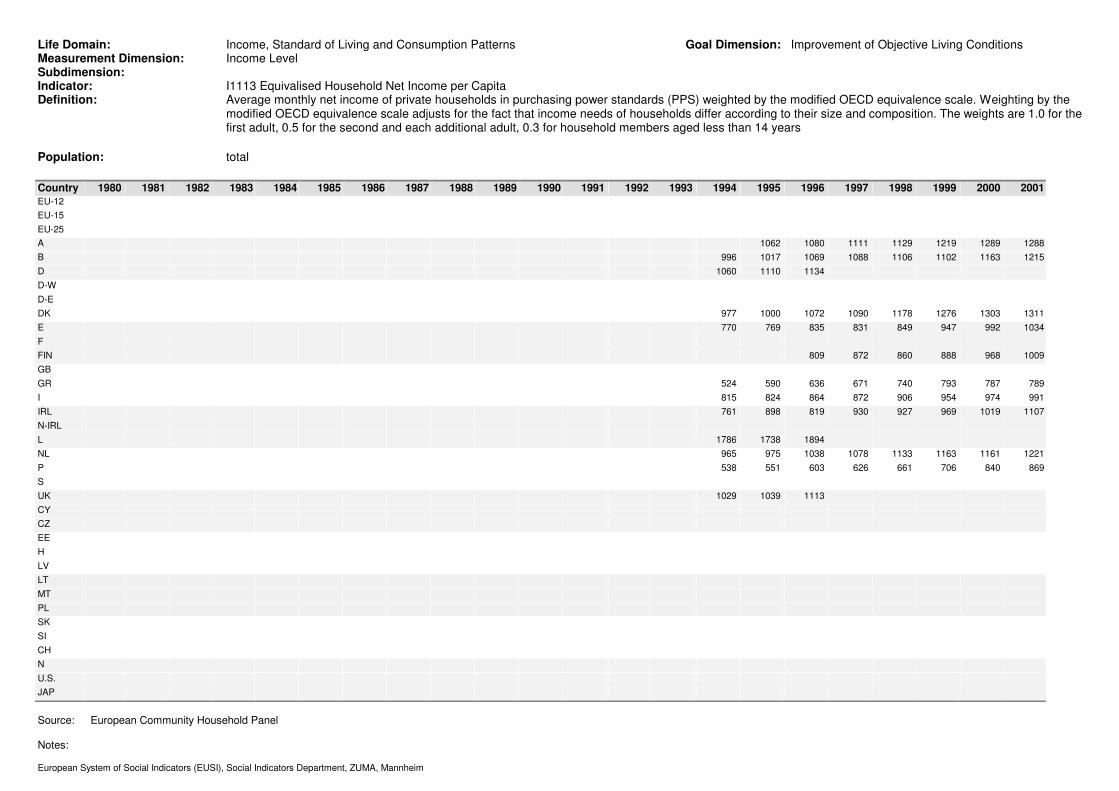
Life Domain: Income, Standard of Living and Consumption Patterns Goal Dimension: Improvement of Objective Living Conditions Measurement Dimension: Income Level Subdimension: Indicator: I1113 Equivalised Household Net Income per Capita Definition: Average monthly net income of private households in purchasing power standards (PPS) weighted by the modified OECD equivalence scale. Weighting by the
modified OECD equivalence scale adjusts for the fact that income needs of households differ according to their size and composition. The weights are 1.0 for the first adult, 0.5 for the second and each additional adult, 0.3 for household members aged less than 14 years
Population: total
Country 1980 1981 1982 1983 1984 1985 1986 1987 1988 1989 1990 1991 1992 1993 1994 1995 1996 1997 1998 1999 2000 2001 EU-12 EU-15 EU-25 A 1062 1080 1111 1129 1219 1289 1288 B 996 1017 1069 1088 1106 1102 1163 1215 D 1060 1110 1134 D-W D-E DK 977 1000 1072 1090 1178 1276 1303 1311 E 770 769 835 831 849 947 992 1034 F FIN 809 872 860 888 968 1009 GB GR 524 590 636 671 740 793 787 789 I 815 824 864 872 906 954 974 991 IRL 761 898 819 930 927 969 1019 1107 N-IRL L 1786 1738 1894 NL 965 975 1038 1078 1133 1163 1161 1221 P 538 551 603 626 661 706 840 869 S UK 1029 1039 1113 CY CZ EE H LV LT MT PL SK SI CH N U.S. JAP
Source: European Community Household Panel
Notes:

European System of Social Indicators (EUSI), Social Indicators Department, ZUMA, Mannheim
Life Domain: Income, Standard of Living and Consumption Patterns Goal Dimension: Improvement of Objective Living Conditions Measurement Dimension: Income Level Subdimension: Indicator: I1113 Equivalised Household Net Income per Capita Definition: Average monthly net income of private households in purchasing power standards (PPS) weighted by the modified OECD equivalence scale. Weighting by the
modified OECD equivalence scale adjusts for the fact that income needs of households differ according to their size and composition. The weights are 1.0 for the first adult, 0.5 for the second and each additional adult, 0.3 for household members aged less than 14 years
Population: households of persons aged 65 or more, living alone
Country 1980 1981 1982 1983 1984 1985 1986 1987 1988 1989 1990 1991 1992 1993 1994 1995 1996 1997 1998 1999 2000 2001 EU-12 EU-15 EU-25 A 867 858 915 913 990 1043 1027 B 860 886 949 977 988 993 1018 1063 D 920 988 1006 D-W D-E DK 687 711 778 749 789 863 896 876 E 593 591 642 607 620 649 712 711 F FIN 671 774 635 654 670 711 GB GR 348 436 415 456 494 518 551 541 I 681 750 706 719 762 834 831 824 IRL 504 673 518 600 572 590 632 632 N-IRL L 1611 1664 1755 NL 880 907 971 1009 1064 1083 1083 1148 P 405 327 391 379 414 430 513 538 S UK 672 696 741 CY CZ EE H LV LT MT PL SK SI CH N U.S. JAP
Source: European Community Household Panel
Notes:

European System of Social Indicators (EUSI), Social Indicators Department, ZUMA, Mannheim
Life Domain: Income, Standard of Living and Consumption Patterns Goal Dimension: Improvement of Objective Living Conditions Measurement Dimension: Income Level Subdimension: Indicator: I1113 Equivalised Household Net Income per Capita Definition: Average monthly net income of private households in purchasing power standards (PPS) weighted by the modified OECD equivalence scale. Weighting by the
modified OECD equivalence scale adjusts for the fact that income needs of households differ according to their size and composition. The weights are 1.0 for the first adult, 0.5 for the second and each additional adult, 0.3 for household members aged less than 14 years
Population: households of persons aged less than 30 years, living alone
Country 1980 1981 1982 1983 1984 1985 1986 1987 1988 1989 1990 1991 1992 1993 1994 1995 1996 1997 1998 1999 2000 2001 EU-12 EU-15 EU-25 A 964 972 973 979 1049 1189 1325 B 945 1027 1116 997 1237 D 904 912 905 D-W D-E DK 736 787 800 834 816 934 952 957 E 851 1090 989 1172 1190 F FIN 540 548 617 673 741 767 GB GR 587 631 694 669 800 1068 I 962 1200 942 957 808 847 887 934 IRL 1017 1384 1002 1533 1255 N-IRL L NL 695 781 792 869 938 1006 991 1069 P S UK 990 925 983 CY CZ EE H LV LT MT PL SK SI CH N U.S. JAP
Source: European Community Household Panel
Notes:

European System of Social Indicators (EUSI), Social Indicators Department, ZUMA, Mannheim
Life Domain: Income, Standard of Living and Consumption Patterns Goal Dimension: Improvement of Objective Living Conditions Measurement Dimension: Income Level Subdimension: Indicator: I1113 Equivalised Household Net Income per Capita Definition: Average monthly net income of private households in purchasing power standards (PPS) weighted by the modified OECD equivalence scale. Weighting by the
modified OECD equivalence scale adjusts for the fact that income needs of households differ according to their size and composition. The weights are 1.0 for the first adult, 0.5 for the second and each additional adult, 0.3 for household members aged less than 14 years
Population: households of single parents with children
Country 1980 1981 1982 1983 1984 1985 1986 1987 1988 1989 1990 1991 1992 1993 1994 1995 1996 1997 1998 1999 2000 2001 EU-12 EU-15 EU-25 A 1018 1005 1029 1077 1128 1184 1200 B 847 892 878 919 895 877 1011 963 D 882 909 934 D-W D-E DK 747 812 886 901 966 998 1012 1090 E 747 781 841 826 862 955 1007 1071 F FIN 707 693 700 744 857 867 GB GR 538 646 696 730 784 820 801 787 I 826 816 868 874 926 954 1002 1037 IRL 625 759 657 773 832 827 941 1060 N-IRL L NL 705 741 752 789 799 860 841 850 P 512 562 547 629 670 733 834 857 S UK 647 685 785 CY CZ EE H LV LT MT PL SK SI CH N U.S. JAP
Source: European Community Household Panel
Notes:

European System of Social Indicators (EUSI), Social Indicators Department, ZUMA, Mannheim
Life Domain: Income, Standard of Living and Consumption Patterns Goal Dimension: Improvement of Objective Living Conditions Measurement Dimension: Income Level Subdimension: Indicator: I1113 Equivalised Household Net Income per Capita Definition: Average monthly net income of private households in purchasing power standards (PPS) weighted by the modified OECD equivalence scale. Weighting by the
modified OECD equivalence scale adjusts for the fact that income needs of households differ according to their size and composition. The weights are 1.0 for the first adult, 0.5 for the second and each additional adult, 0.3 for household members aged less than 14 years
Population: households of couples without children, at least one person aged 65 or more
Country 1980 1981 1982 1983 1984 1985 1986 1987 1988 1989 1990 1991 1992 1993 1994 1995 1996 1997 1998 1999 2000 2001 EU-12 EU-15 EU-25 A 998 988 1044 1059 1110 1182 1168 B 927 937 999 1031 1002 1034 1082 1098 D 1026 1084 1107 D-W D-E DK 824 844 905 896 963 1113 1067 1041 E 617 633 685 680 716 782 778 805 F FIN 819 858 860 879 917 984 GB GR 382 459 492 499 523 579 575 594 I 798 755 832 868 877 927 977 952 IRL 700 776 764 795 859 941 905 981 N-IRL L 1547 1537 1688 NL 930 943 987 1052 1099 1115 1119 1216 P 427 459 509 557 551 574 627 675 S UK 865 851 912 CY CZ EE H LV LT MT PL SK SI CH N U.S. JAP
Source: European Community Household Panel
Notes:
European System of Social Indicators (EUSI), Social Indicators Department, ZUMA, Mannheim
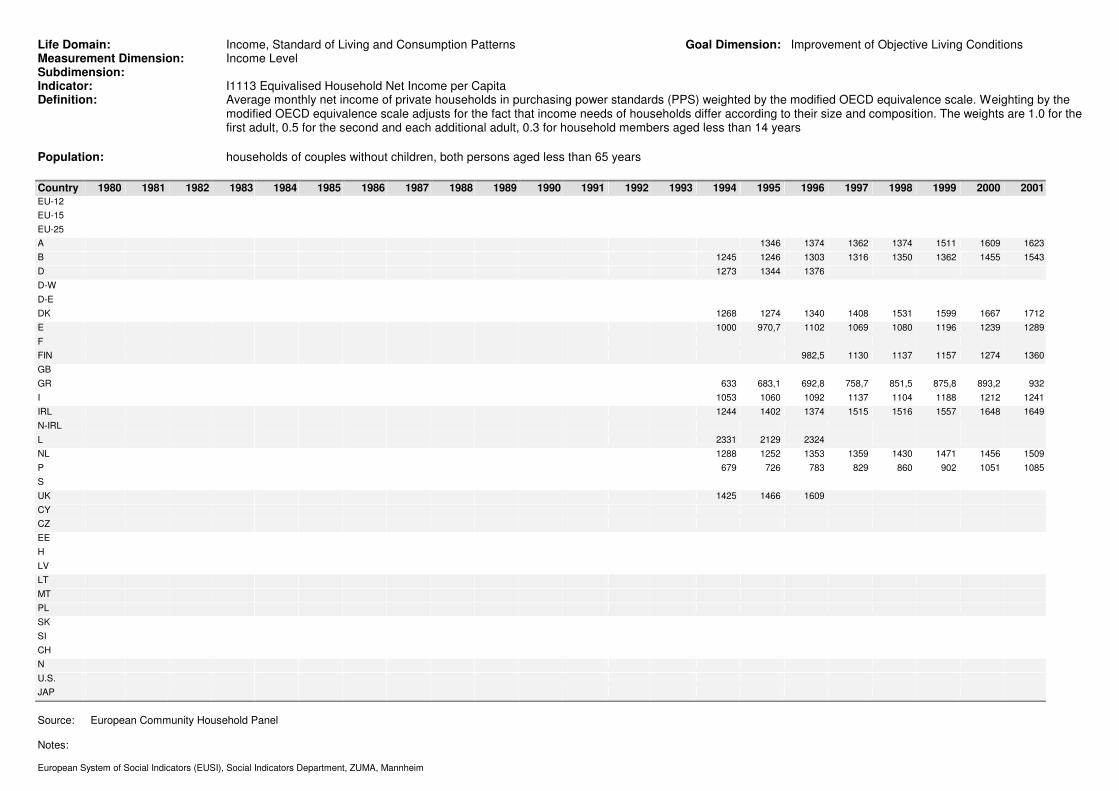
Life Domain: Income, Standard of Living and Consumption Patterns Goal Dimension: Improvement of Objective Living Conditions Measurement Dimension: Income Level Subdimension: Indicator: I1113 Equivalised Household Net Income per Capita Definition: Average monthly net income of private households in purchasing power standards (PPS) weighted by the modified OECD equivalence scale. Weighting by the
modified OECD equivalence scale adjusts for the fact that income needs of households differ according to their size and composition. The weights are 1.0 for the first adult, 0.5 for the second and each additional adult, 0.3 for household members aged less than 14 years
Population: households of couples without children, both persons aged less than 65 years
Country 1980 1981 1982 1983 1984 1985 1986 1987 1988 1989 1990 1991 1992 1993 1994 1995 1996 1997 1998 1999 2000 2001 EU-12 EU-15 EU-25 A 1346 1374 1362 1374 1511 1609 1623 B 1245 1246 1303 1316 1350 1362 1455 1543 D 1273 1344 1376 D-W D-E DK 1268 1274 1340 1408 1531 1599 1667 1712 E 1000 970,7 1102 1069 1080 1196 1239 1289 F FIN 982,5 1130 1137 1157 1274 1360 GB GR 633 683,1 692,8 758,7 851,5 875,8 893,2 932 I 1053 1060 1092 1137 1104 1188 1212 1241 IRL 1244 1402 1374 1515 1516 1557 1648 1649 N-IRL L 2331 2129 2324 NL 1288 1252 1353 1359 1430 1471 1456 1509 P 679 726 783 829 860 902 1051 1085 S UK 1425 1466 1609 CY CZ EE H LV LT MT PL SK SI CH N U.S. JAP
Source: European Community Household Panel
Notes:

European System of Social Indicators (EUSI), Social Indicators Department, ZUMA, Mannheim
Life Domain: Income, Standard of Living and Consumption Patterns Goal Dimension: Improvement of Objective Living Conditions Measurement Dimension: Income Level Subdimension: Indicator: I1113 Equivalised Household Net Income per Capita Definition: Average monthly net income of private households in purchasing power standards (PPS) weighted by the modified OECD equivalence scale. Weighting by the
modified OECD equivalence scale adjusts for the fact that income needs of households differ according to their size and composition. The weights are 1.0 for the first adult, 0.5 for the second and each additional adult, 0.3 for household members aged less than 14 years
Population: households of couples with children
Country 1980 1981 1982 1983 1984 1985 1986 1987 1988 1989 1990 1991 1992 1993 1994 1995 1996 1997 1998 1999 2000 2001 EU-12 EU-15 EU-25 A 1046 1088 1113 1128 1218 1288 1299 B 989 1028 1053 1065 1107 1101 1164 1219 D 1013 1075 1104 D-W D-E DK 1067 1060 1138 1169 1259 1360 1367 1366 E 779 783 839 847 851 971 1013 1055 F FIN 855 918 922 954 1056 1090 GB GR 561 628 705 744 838 882 870 872 I 780 772 833 830 883 931 950 978 IRL 742 830 812 915 943 1002 1057 1180 N-IRL L 1642 1635 1789 NL 844 835 897 911 963 986 992 1015 P 574 591 652 678 728 777 965 994 S UK 1020 1090 1125 CY CZ EE H LV LT MT PL SK SI CH N U.S. JAP
Source: European Community Household Panel
Notes:

European System of Social Indicators (EUSI), Social Indicators Department, ZUMA, Mannheim
Life Domain: Income, Standard of Living and Consumption Patterns Goal Dimension: Improvement of Objective Living Conditions Measurement Dimension: Standard of Living Subdimension: Level of Private Consumption Indicator: I1211 Household Final Consumption Expenditure per Capita Definition: Final consumption expenditure of private households per capita at the price levels and PPPs of 1995 (billions of US dollars) Population: total Country 1980 1981 1982 1983 1984 1985 1986 1987 1988 1989 1990 1991 1992 1993 1994 1995 1996 1997 1998 1999 2000 2001 2002 2003 EU-12 EU-15 11288 11481 11695 12048 12455 12789 12981 EU-25 A 9013 9117 9342 9818 9713 9871 10056 10300 10600 11000 11379 11532 11716 11708 11917 12348 12725 12978 13319 13622 14050 14211 14276 14414 B 9134 9165 9421 9672 9845 10143 10434 10740 11024 11187 11083 11309 11466 11578 11778 12127 12365 12753 12821 12797 D 11475 11686 11609 11688 11883 11954 11991 12196 12630 12856 13021 12850 12827 D-W D-E DK 9217 9054 9233 9301 9476 9792 10352 10165 10157 10138 10126 10256 10414 10427 11062 11160 11372 11655 11880 11920 11794 11721 11746 11846 E 7255 7137 7102 7096 7052 7187 7406 7827 8187 8609 8893 9129 9302 9092 9162 9305 9493 9777 10175 10603 10940 11158 11372 11635 F 9566 9656 9871 9869 9874 9982 10287 10532 10758 11014 11245 11264 11310 11196 11286 11384 11490 11466 11817 12147 12408 12666 12751 FIN 7569 7625 7936 8147 8373 8640 8907 9330 9818 10315 10139 9698 9235 8833 9022 9354 9665 9967 10358 10685 10995 11166 11310 11701 GB GR 9446 9608 9804 10094 10294 10471 10758 11043 11428 I 9016 9177 9276 9297 9577 9868 10266 10655 11081 11490 11723 12057 12267 11774 11924 12105 12233 12603 12988 13310 13647 13716 IRL 8145 8248 8404 8595 8923 9135 9687 10297 10975 11916 12798 13285 13384 N-IRL L 12091 12415 12883 13519 14004 14287 15075 14488 14543 14919 14959 15381 15761 16586 16747 17238 17873 18050 NL 9506 9515 9747 10049 10235 10206 10164 10248 10498 10871 11143 11614 12085 12388 12469 12491 P 7992 8046 8106 8125 8346 8597 9002 9431 9646 9702 S 9233 9144 9209 9002 9173 9460 9937 10434 10659 10714 10566 10597 10389 9954 10069 10136 10286 10561 10869 11312 11774 11789 11922 12117 UK 8508 8502 8574 8921 9096 9411 10003 10523 11296 11650 11709 11480 11513 11789 12106 12270 12707 13148 13618 14203 14794 15154 15619 CY CZ 5689 6022 6509 6673 6559 6692 6855 7147 7446 7847 EE H 4768 4596 4690 4911 5200 5501 5829 6450 6960 LV LT MT PL 4484 4866 5200 5448 5732 5892 6015 6285 SK 3964 3987 4173 4507 4758 5036 5170 5119 5368 5678 SI CH 15304 15391 15296 15097 15139 15150 15268 15495 15827 16115 16423 16612 16498 N 8772 8736 8776 8913 9180 10053 10518 10373 10090 9972 10002 10195 10356 10556 10853 11226 11933 12276 12537 12859 13292 13479 13866 14272 U.S. 13727 13773 13809 14431 15077 15683 16194 16583 17096 17387 17523 17267 17527 17880 18331 18658 19029 19473 20168 20924 21597 21920 22397 JAP 8245 8302 8609 8786 8937 9235 9479 9823 10257 10706 11160 11440 11690 11810 12100 12252 12521 12606 12533 12515 12631 12802 12890
Source: OECD: Statistics Portal, Annual National Accounts for OECD Member Countries, Comparative Tables Based on PPPs, http://www.oecd.org/document/28/0,2340,en_2825_495684_2750044_1_1_1_1,00.html

European System of Social Indicators (EUSI), Social Indicators Department, ZUMA, Mannheim
Life Domain: Income, Standard of Living and Consumption Patterns Goal Dimension: Improvement of Objective Living Conditions Measurement Dimension: Standard of Living Subdimension: Level of Private Consumption Indicator: I1212 Consumption Expenditure on Food and Non-alcoholic Beverages Definition: Expenditure on food and non-alcoholic beverages at current prices as a percentage of total household consumption expenditure Population: total Country 1980 1981 1982 1983 1984 1985 1986 1987 1988 1989 1990 1991 1992 1993 1994 1995 1996 1997 1998 1999 2000 2001 2002 2003 EU-12 EU-15 EU-25 A 14,9 14,7 14,5 14,0 13,4 13,1 13,2 13,1 12,7 12,2 12,3 12,1 B 14,5 14,1 14,0 13,7 13,0 12,6 12,9 13,6 D 14,0 13,5 13,1 12,7 12,5 12,3 12,2 12,1 11,9 11,9 12,2 12,1 D-W D-E DK 14,4 14,5 14,0 13,8 14,0 13,5 13,4 13,1 12,6 12,7 12,8 12,6 E 17,7 17,4 16,7 15,9 15,3 15,3 15,6 15,9 F 16,1 15,6 15,4 15,1 15,1 14,7 14,8 14,7 14,3 14,2 14,5 FIN 17,2 17,4 17,3 17,1 15,8 14,3 13,8 13,2 13,3 12,8 12,9 12,8 GB GR 18,0 17,7 17,2 16,8 16,6 16,3 15,9 15,8 I 18,8 18,5 18,1 17,4 16,8 16,4 15,8 15,3 14,7 14,4 14,4 14,6 IRL 17,7 18,0 17,5 16,5 15,6 15,0 13,7 12,7 11,5 10,9 10,7 N-IRL L NL 13,8 13,8 13,6 13,3 13,0 12,6 12,4 12,0 11,5 11,1 11,2 11,2 P 21,9 21,1 21,5 21,6 20,5 20,0 19,3 19,0 18,5 18,2 18,8 S 14,3 13,3 13,0 12,8 12,5 12,2 12,4 12,6 UK 12,4 12,1 11,8 11,4 11,2 11,2 10,7 10,3 10,0 9,7 9,7 CY 20,2 20,4 20,5 20,2 19,0 20,0 19,6 CZ 25,0 24,0 23,4 22,0 20,9 20,1 EE 38,3 38,1 35,1 34,1 30,4 29,8 26,8 25,4 25,5 24,1 22,9 H 24,2 22,6 22,2 21,8 20,0 19,4 19,4 LV 47,0 47,0 47,0 42,0 40,3 38,3 34,2 31,7 28,5 25,5 LT 48,8 45,4 41,9 37,9 37,2 35,4 32,9 32,4 31,3 MT 21,4 20,3 20,6 20,4 PL 29,2 27,7 25,9 23,7 21,8 21,3 21,2 SK 30,0 30,5 29,1 26,9 25,5 24,6 24,6 SI 21,9 23,0 21,2 21,3 20,9 20,3 20,3 20,1 18,9 16,9 17,1 CH N 17,2 17,3 16,7 16,6 16,2 15,4 15,3 15,4 15,3 15,0 U.S. 8,9 8,4 8,2 8,1 7,9 7,8 7,5 7,3 7,1 JAP 19,0 18,6 18,2 17,8 17,3 16,3 16,3 16,5
Source: Eurostat, Long-term Indicators, online

European System of Social Indicators (EUSI), Social Indicators Department, ZUMA, Mannheim
Life Domain: Income, Standard of Living and Consumption Patterns Goal Dimension: Improvement of Objective Living Conditions Measurement Dimension: Standard of Living Subdimension: Level of Private Consumption Indicator: I1213 Affordability of a Holiday Trip Definition: Percentage of households which can afford paying for a week's annual holiday away from home Population: total Country 1980 1981 1982 1983 1984 1985 1986 1987 1988 1989 1990 1991 1992 1993 1994 1995 1996 1997 1998 1999 2000 2001 2002 2003 EU-12 EU-15 EU-25 A 75,7 77,5 78,0 79,7 80,1 79,4 78,7 B 76,1 75,4 77,8 78,3 80,0 81,9 80,5 80,5 D 84,9 87,9 86,8 D-W D-E DK 79,1 85,1 86,5 87,4 87,2 87,9 88,6 88,9 E 47,3 50,1 49,8 51,9 54,6 56,0 59,2 62,7 F 64,8 65,7 66,4 68,7 71,6 73,6 74,8 76,4 FIN 56,2 60,2 64,6 68,6 70,9 74,1 GB GR 44,5 47,2 44,3 45,3 50,5 51,0 49,3 49,2 I 67,1 59,5 61,0 61,8 59,2 60,6 61,2 63,6 IRL 59,5 63,2 62,7 67,0 69,4 73,3 75,5 75,5 N-IRL L 83,8 86,4 84,4 NL 84,1 85,3 85,6 86,4 88,5 88,5 86,9 86,8 P 39,3 40,0 37,3 36,9 37,9 37,5 38,8 40,6 S UK 62,2 65,3 69,4 CY CZ EE H LV LT MT PL SK SI CH N U.S. JAP
Source: European Community Household Panel
European System of Social Indicators (EUSI), Social Indicators Department, ZUMA, Mannheim
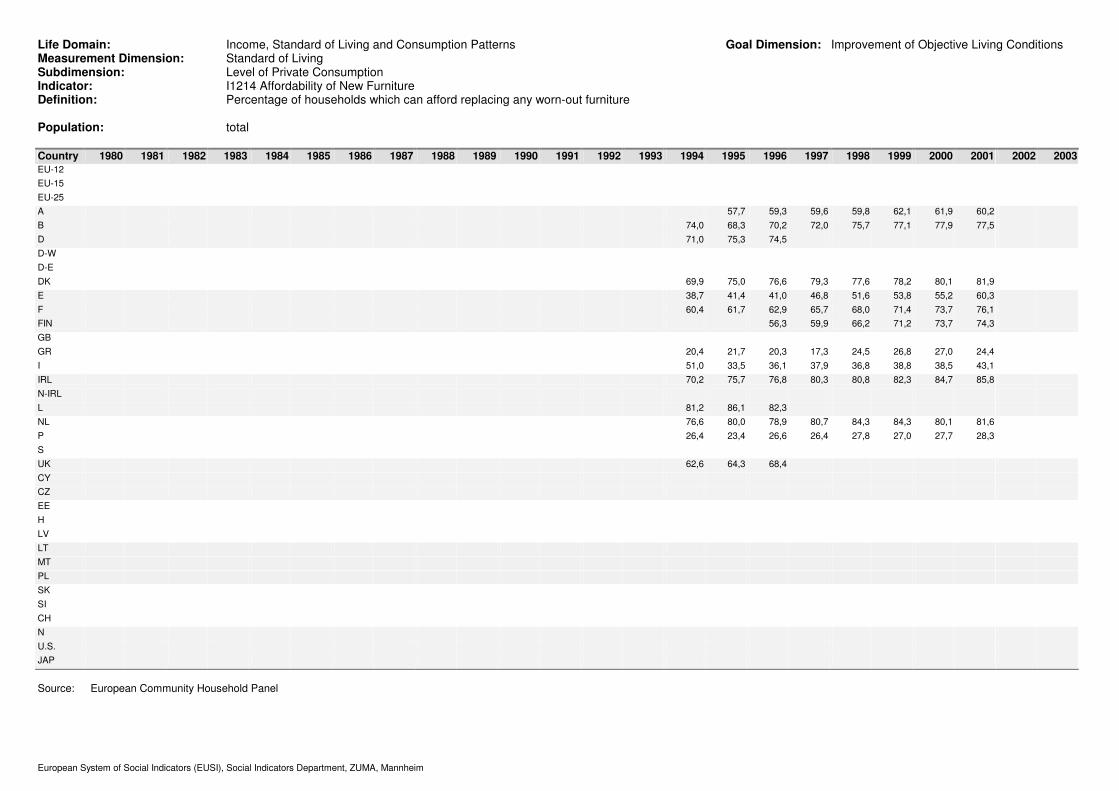
Life Domain: Income, Standard of Living and Consumption Patterns Goal Dimension: Improvement of Objective Living Conditions Measurement Dimension: Standard of Living Subdimension: Level of Private Consumption Indicator: I1214 Affordability of New Furniture Definition: Percentage of households which can afford replacing any worn-out furniture Population: total Country 1980 1981 1982 1983 1984 1985 1986 1987 1988 1989 1990 1991 1992 1993 1994 1995 1996 1997 1998 1999 2000 2001 2002 2003 EU-12 EU-15 EU-25 A 57,7 59,3 59,6 59,8 62,1 61,9 60,2 B 74,0 68,3 70,2 72,0 75,7 77,1 77,9 77,5 D 71,0 75,3 74,5 D-W D-E DK 69,9 75,0 76,6 79,3 77,6 78,2 80,1 81,9 E 38,7 41,4 41,0 46,8 51,6 53,8 55,2 60,3 F 60,4 61,7 62,9 65,7 68,0 71,4 73,7 76,1 FIN 56,3 59,9 66,2 71,2 73,7 74,3 GB GR 20,4 21,7 20,3 17,3 24,5 26,8 27,0 24,4 I 51,0 33,5 36,1 37,9 36,8 38,8 38,5 43,1 IRL 70,2 75,7 76,8 80,3 80,8 82,3 84,7 85,8 N-IRL L 81,2 86,1 82,3 NL 76,6 80,0 78,9 80,7 84,3 84,3 80,1 81,6 P 26,4 23,4 26,6 26,4 27,8 27,0 27,7 28,3 S UK 62,6 64,3 68,4 CY CZ EE H LV LT MT PL SK SI CH N U.S. JAP
Source: European Community Household Panel

European System of Social Indicators (EUSI), Social Indicators Department, ZUMA, Mannheim
Life Domain: Income, Standard of Living and Consumption Patterns Goal Dimension: Improvement of Objective Living Conditions Measurement Dimension: Standard of Living Subdimension: Possession of Consumer Durables Indicator: I1221 Motorisation Rate Definition: Number of passenger cars per 1000 inhabitants Population: total Country 1980 1981 1982 1983 1984 1985 1986 1987 1988 1989 1990 1991 1992 1993 1994 1995 1996 1997 1998 1999 2000 2001 2002 2003 EU-12 EU-15 393 401 408 415 422 425 434 441 450 461 469 EU-25 A 379 387 397 410 421 433 447 458 469 481 495 506 B 354 365 376 388 397 400 408 423 422 427 434 440 449 458 D 457 470 479 485 489 447 478 488 495 500 504 508 516 521 D-W D-E DK 310 311 311 309 309 310 312 310 319 331 337 343 346 347 E 265 279 296 309 322 336 344 351 362 376 389 408 427 442 F 394 401 408 415 417 419 423 430 422 428 436 446 456 463 FIN 385 389 384 384 370 368 372 379 379 392 403 413 GB GR 143 150 159 171 173 177 189 199 211 223 238 254 275 304 I 430 447 463 483 503 518 521 540 529 531 535 548 556 563 IRL 210 214 222 227 237 242 249 262 265 272 310 310 339 343 N-IRL L 453 474 485 503 519 532 523 540 559 558 562 594 609 623 NL 342 350 356 368 370 373 376 383 364 370 378 382 401 411 P 187 203 203 222 240 258 277 292 311 330 350 S 421 421 420 414 409 409 411 413 419 428 439 451 UK 332 340 359 375 383 382 371 376 374 388 398 403 414 419 CY 306 315 332 340 CZ 310 329 339 335 EE 278 294 312 319 H 223 227 220 225 LV 153 176 198 217 LT 212 238 265 295 MT 444 488 496 501 PL 208 221 230 240 SK 197 211 222 229 SI 373 392 411 427 CH 416 436 445 450 450 448 453 459 462 469 476 485 493 N 385 382 380 379 378 379 381 387 379 399 403 407 412 U.S. 733 739 750 747 752 762 771 JAP 313 327 341 356 375
Source: Eurostat, Statistical Yearbook, various years

European System of Social Indicators (EUSI), Social Indicators Department, ZUMA, Mannheim
Life Domain: Income, Standard of Living and Consumption Patterns Goal Dimension: Improvement of Objective Living Conditions Measurement Dimension: Standard of Living Subdimension: Possession of Consumer Durables Indicator: I1222 Possession of a Dishwasher Definition: Percentage of households which have a dishwasher Population: total Country 1980 1981 1982 1983 1984 1985 1986 1987 1988 1989 1990 1991 1992 1993 1994 1995 1996 1997 1998 1999 2000 2001 2002 2003 EU-12 EU-15 EU-25 A 41,4 45,0 48,5 50,8 52,5 56,5 59,5 B 29,0 30,4 33,3 34,0 35,9 37,2 40,6 42,8 D 34,6 37,3 41,4 D-W D-E DK 28,5 33,8 37,0 41,6 46,1 48,3 50,9 53,4 E 15,6 17,1 18,8 20,2 22,8 24,9 28,1 30,0 F 34,0 36,5 37,9 39,4 41,1 42,9 44,6 46,6 FIN 41,6 44,0 46,4 47,9 48,6 50,1 GB GR 16,9 18,8 20,4 20,8 23,4 25,4 25,3 26,3 I 24,6 23,0 26,5 27,5 27,1 28,5 30,2 32,4 IRL 17,8 20,4 22,6 26,4 30,2 32,9 34,6 39,0 N-IRL L 50,4 52,9 55,8 NL 16,2 19,5 21,5 24,9 29,4 32,2 35,3 39,0 P 17,3 17,2 17,8 20,2 22,4 23,6 27,8 30,8 S UK 18,9 20,9 24,2 CY CZ EE H LV LT MT PL SK SI CH N U.S. JAP
Source: European Community Household Panel

European System of Social Indicators (EUSI), Social Indicators Department, ZUMA, Mannheim
Life Domain: Income, Standard of Living and Consumption Patterns Goal Dimension: Improvement of Objective Living Conditions Measurement Dimension: Standard of Living Subdimension: Possession of Consumer Durables Indicator: I1223 Possession of a PC Definition: Percentage of households which have a home computer Population: total Country 1980 1981 1982 1983 1984 1985 1986 1987 1988 1989 1990 1991 1992 1993 1994 1995 1996 1997 1998 1999 2000 2001 2002 2003 EU-12 EU-15 EU-25 A 24,9 27,8 32,6 37,0 43,0 46,6 B 27,7 32,3 36,9 41,1 46,4 50,3 D 29,6 D-W D-E DK 38,6 46,2 55,3 61,4 66,3 71,2 E 20,2 23,7 26,5 30,2 33,1 37,8 F FIN 23,7 28,3 34,8 39,2 45,6 48,3 GB GR 8,0 9,8 14,3 16,2 16,4 18,8 I 16,7 20,3 23,0 25,4 30,7 36,1 IRL 15,6 20,1 23,8 30,5 35,6 40,0 N-IRL L 27,0 NL 44,0 48,9 55,6 59,4 64,1 68,4 P 15,4 17,8 20,8 22,5 26,5 30,8 S UK 28,2 CY CZ EE H LV LT MT PL SK SI CH N U.S. JAP
Source: European Community Household Panel

European System of Social Indicators (EUSI), Social Indicators Department, ZUMA, Mannheim
Life Domain: Income, Standard of Living and Consumption Patterns Goal Dimension: Improvement of Objective Living Conditions Measurement Dimension: Standard of Living Subdimension: Possession of Consumer Durables Indicator: I1224 Possession of a Telephone Definition: Percentage of households which have a telephone Population: total Country 1980 1981 1982 1983 1984 1985 1986 1987 1988 1989 1990 1991 1992 1993 1994 1995 1996 1997 1998 1999 2000 2001 2002 2003 EU-12 EU-15 EU-25 A 94,2 95,5 96,2 96,9 95,8 96,6 96,3 B 91,9 92,4 94,0 94,9 95,1 95,7 95,1 94,0 D 90,6 94,1 95,6 D-W D-E DK 95,8 97,5 98,4 98,7 98,6 99,0 99,7 99,7 E 84,4 85,5 88,1 89,8 90,8 91,0 95,9 96,7 F 95,6 96,4 96,8 97,2 97,4 97,4 97,7 97,3 FIN 94,2 95,8 97,3 97,9 98,8 99,2 GB GR 87,5 91,2 92,7 94,3 95,7 96,5 96,6 96,7 I 90,8 90,8 90,7 90,7 91,8 91,6 95,9 96,0 IRL 77,2 80,9 83,0 86,8 88,8 91,2 94,2 95,5 N-IRL L 98,0 97,7 98,2 NL 98,0 97,9 98,2 98,4 98,8 99,1 99,5 99,3 P 74,6 76,4 78,2 80,9 82,0 81,7 90,2 92,2 S UK 91,2 93,4 95,0 CY CZ EE H LV LT MT PL SK SI CH N U.S. JAP
Source: European Community Household Panel

European System of Social Indicators (EUSI), Social Indicators Department, ZUMA, Mannheim
Life Domain: Income, Standard of Living and Consumption Patterns Goal Dimension: Improvement of Objective Living Conditions Measurement Dimension: Standard of Living Subdimension: Possession of Consumer Durables Indicator: I1225 Possession of a Mobile Phone Definition: Percentage of the adult population which has a mobile phone available Population: total Country 1980 1981 1982 1983 1984 1985 1986 1987 1988 1989 1990 1991 1992 1993 1994 1995 1996 1997 1998 1999 2000 2001 2002 2003 EU-12 EU-15 79,1 EU-25 A 74,9 B 73,8 D 70,4 D-W 70,3 D-E 70,9 DK 83,0 E 80,6 F 76,4 FIN 89,8 GB GR 81,2 I 84,8 IRL 80,2 N-IRL L 84,0 NL 84,1 P 72,8 S 89,6 UK 85,6 CY CZ EE H LV LT MT PL SK SI CH N 89,5 U.S. JAP
Source: Eurobarometer 58.0, 2002
European System of Social Indicators (EUSI), Social Indicators Department, ZUMA, Mannheim
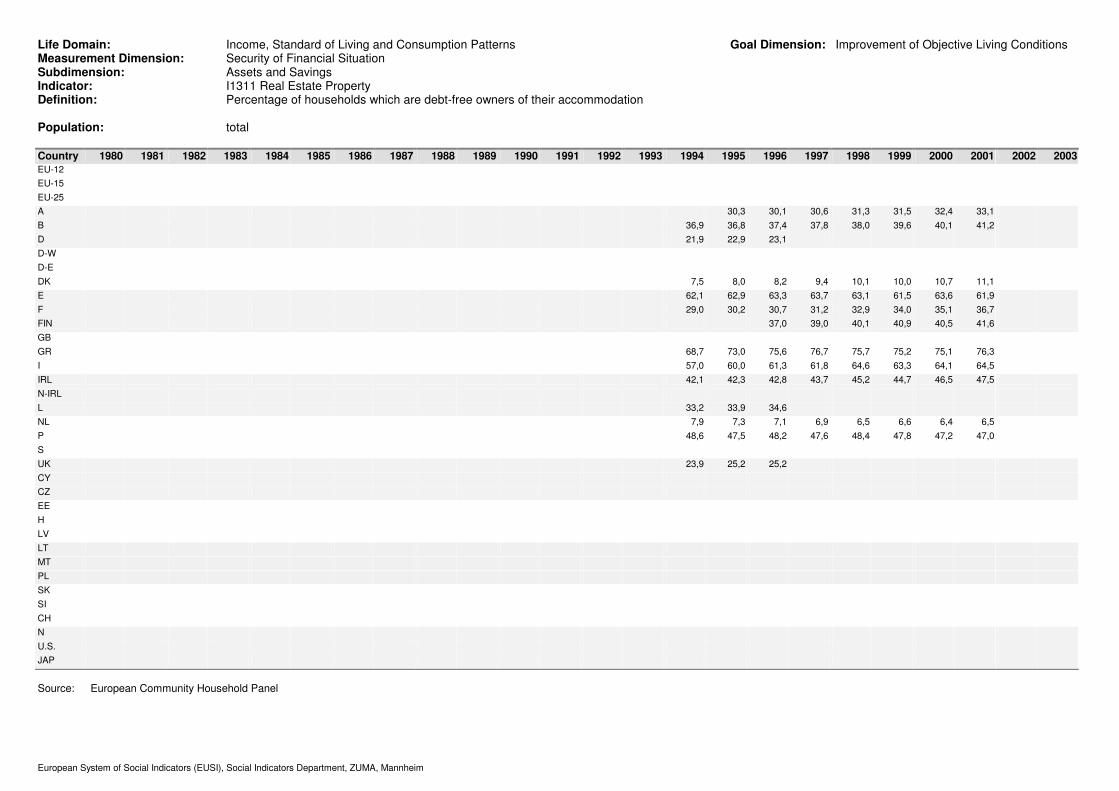
Life Domain: Income, Standard of Living and Consumption Patterns Goal Dimension: Improvement of Objective Living Conditions Measurement Dimension: Security of Financial Situation Subdimension: Assets and Savings Indicator: I1311 Real Estate Property Definition: Percentage of households which are debt-free owners of their accommodation Population: total Country 1980 1981 1982 1983 1984 1985 1986 1987 1988 1989 1990 1991 1992 1993 1994 1995 1996 1997 1998 1999 2000 2001 2002 2003 EU-12 EU-15 EU-25 A 30,3 30,1 30,6 31,3 31,5 32,4 33,1 B 36,9 36,8 37,4 37,8 38,0 39,6 40,1 41,2 D 21,9 22,9 23,1 D-W D-E DK 7,5 8,0 8,2 9,4 10,1 10,0 10,7 11,1 E 62,1 62,9 63,3 63,7 63,1 61,5 63,6 61,9 F 29,0 30,2 30,7 31,2 32,9 34,0 35,1 36,7 FIN 37,0 39,0 40,1 40,9 40,5 41,6 GB GR 68,7 73,0 75,6 76,7 75,7 75,2 75,1 76,3 I 57,0 60,0 61,3 61,8 64,6 63,3 64,1 64,5 IRL 42,1 42,3 42,8 43,7 45,2 44,7 46,5 47,5 N-IRL L 33,2 33,9 34,6 NL 7,9 7,3 7,1 6,9 6,5 6,6 6,4 6,5 P 48,6 47,5 48,2 47,6 48,4 47,8 47,2 47,0 S UK 23,9 25,2 25,2 CY CZ EE H LV LT MT PL SK SI CH N U.S. JAP
Source: European Community Household Panel

European System of Social Indicators (EUSI), Social Indicators Department, ZUMA, Mannheim
Life Domain: Income, Standard of Living and Consumption Patterns Goal Dimension: Improvement of Objective Living Conditions Measurement Dimension: Security of Financial Situation Subdimension: Assets and Savings Indicator: I1312 Property Income Definition: Percentage of households with income from renting property Population: total Country 1980 1981 1982 1983 1984 1985 1986 1987 1988 1989 1990 1991 1992 1993 1994 1995 1996 1997 1998 1999 2000 2001 2002 2003 EU-12 EU-15 EU-25 A 6,5 6,8 6,9 6,6 5,5 6,1 6,3 B 10,1 9,4 7,0 6,8 8,7 9,2 9,7 9,2 D 9,6 9,5 10,9 D-W D-E DK 4,1 4,4 4,9 4,6 4,2 5,1 5,3 4,8 E 3,8 5,4 5,2 5,1 5,6 5,9 5,4 4,8 F 11,2 8,4 8,8 9,2 7,6 6,9 6,6 7,3 FIN 7,9 8,1 7,6 8,0 8,2 7,4 GB GR 13,9 14,2 14,7 15,1 16,0 15,2 15,3 15,4 I 4,9 4,0 5,7 5,6 5,5 5,7 5,5 5,7 IRL 3,9 3,4 3,7 4,2 4,7 4,3 4,3 4,0 N-IRL L 10,7 9,9 9,9 NL 2,3 2,3 2,2 2,3 2,3 1,9 2,4 2,1 P 4,1 3,7 3,6 4,1 3,8 3,9 3,9 3,6 S UK 3,5 3,2 2,9 CY CZ EE H LV LT MT PL SK SI CH N U.S. JAP
Source: European Community Household Panel

European System of Social Indicators (EUSI), Social Indicators Department, ZUMA, Mannheim
Life Domain: Income, Standard of Living and Consumption Patterns Goal Dimension: Improvement of Objective Living Conditions Measurement Dimension: Security of Financial Situation Subdimension: Assets and Savings Indicator: I1313 Capital Income Definition: Percentage of households with income from investments, savings, insurance or property Population: total Country 1980 1981 1982 1983 1984 1985 1986 1987 1988 1989 1990 1991 1992 1993 1994 1995 1996 1997 1998 1999 2000 2001 2002 2003 EU-12 EU-15 EU-25 A 49,2 52,2 55,3 57,0 59,2 59,6 57,9 B 27,9 27,1 27,4 25,0 24,2 25,4 24,5 23,6 D D-W D-E DK 50,5 47,4 46,5 42,6 40,5 39,8 41,5 41,7 E 45,9 52,1 37,7 46,9 58,9 94,7 99,5 88,3 F 73,2 76,9 78,9 80,7 82,7 82,2 83,4 82,7 FIN 34,7 35,9 35,2 34,8 35,8 36,7 GB GR 11,5 11,2 11,4 13,6 10,1 9,9 7,8 7,8 I 10,7 14,3 18,7 17,5 16,5 16,5 14,6 15,1 IRL 29,7 31,1 33,0 36,6 39,9 36,0 38,2 41,1 N-IRL L 28,3 32,0 34,3 NL 44,4 43,6 43,8 43,8 42,9 41,3 43,4 43,9 P 11,4 14,1 14,8 12,3 12,3 11,1 10,7 12,1 S UK 38,9 40,4 41,1 CY CZ EE H LV LT MT PL SK SI CH N U.S. JAP
Source: European Community Household Panel

European System of Social Indicators (EUSI), Social Indicators Department, ZUMA, Mannheim
Life Domain: Income, Standard of Living and Consumption Patterns Goal Dimension: Improvement of Objective Living Conditions Measurement Dimension: Security of Financial Situation Subdimension: Assets and Savings Indicator: I1314 Possibility to Save Definition: Percentage of households which have normally some money left which they could save Population: total Country 1980 1981 1982 1983 1984 1985 1986 1987 1988 1989 1990 1991 1992 1993 1994 1995 1996 1997 1998 1999 2000 2001 2002 2003 EU-12 EU-15 EU-25 A 52,3 63,5 63,9 64,0 65,8 67,6 66,7 B 48,4 48,0 47,9 47,6 48,1 48,0 49,7 49,5 D 52,3 50,6 51,4 D-W D-E DK 45,8 47,6 51,6 51,5 54,8 53,0 51,8 54,1 E 23,7 34,4 36,9 39,0 39,2 36,5 44,4 45,9 F FIN 34,1 36,0 38,8 40,2 41,3 45,4 GB GR 8,3 10,1 10,8 9,8 13,9 11,8 12,6 12,0 I 25,7 33,4 27,0 26,7 26,5 24,9 24,2 27,6 IRL 28,8 33,0 32,7 39,5 38,6 42,1 43,1 45,4 N-IRL L 56,7 50,1 52,8 NL 53,9 56,6 54,1 55,1 60,1 60,7 63,1 65,2 P 16,8 15,4 14,2 17,3 16,4 17,3 18,2 18,2 S UK 53,4 51,4 54,9 CY CZ EE H LV LT MT PL SK SI CH N U.S. JAP
Source: European Community Household Panel

European System of Social Indicators (EUSI), Social Indicators Department, ZUMA, Mannheim
Life Domain: Income, Standard of Living and Consumption Patterns Goal Dimension: Improvement of Objective Living Conditions Measurement Dimension: Security of Financial Situation Subdimension: Debts and Financial Difficulties Indicator: I1321 Repayment of Debts Definition: Percentage of households which presently have to repay debts other than mortgage Population: total Country 1980 1981 1982 1983 1984 1985 1986 1987 1988 1989 1990 1991 1992 1993 1994 1995 1996 1997 1998 1999 2000 2001 2002 2003 EU-12 EU-15 EU-25 A 18,3 15,0 14,1 15,3 14,5 14,2 12,8 B 19,7 19,0 18,4 18,0 18,2 19,4 20,0 19,4 D 18,1 21,4 21,7 D-W D-E DK 39,9 43,7 43,4 44,0 45,9 45,7 44,9 42,9 E 21,8 19,9 19,2 19,5 19,2 19,8 19,5 23,0 F 33,2 32,0 32,7 33,7 33,9 34,6 34,2 34,3 FIN 29,8 32,7 33,2 34,3 36,3 34,9 GB GR 11,2 7,9 8,3 8,1 14,4 13,2 12,2 13,2 I 11,6 9,6 8,3 9,0 10,3 10,6 11,7 11,0 IRL 30,5 26,9 29,4 33,6 29,4 31,0 30,8 29,5 N-IRL L 36,2 35,0 36,0 NL 27,6 27,6 28,2 26,5 27,9 26,8 25,2 P 15,2 13,4 13,0 13,5 13,5 15,2 16,3 17,1 S UK 31,0 32,7 34,7 CY CZ EE H LV LT MT PL SK SI CH N U.S. JAP
Source: European Community Household Panel
European System of Social Indicators (EUSI), Social Indicators Department, ZUMA, Mannheim
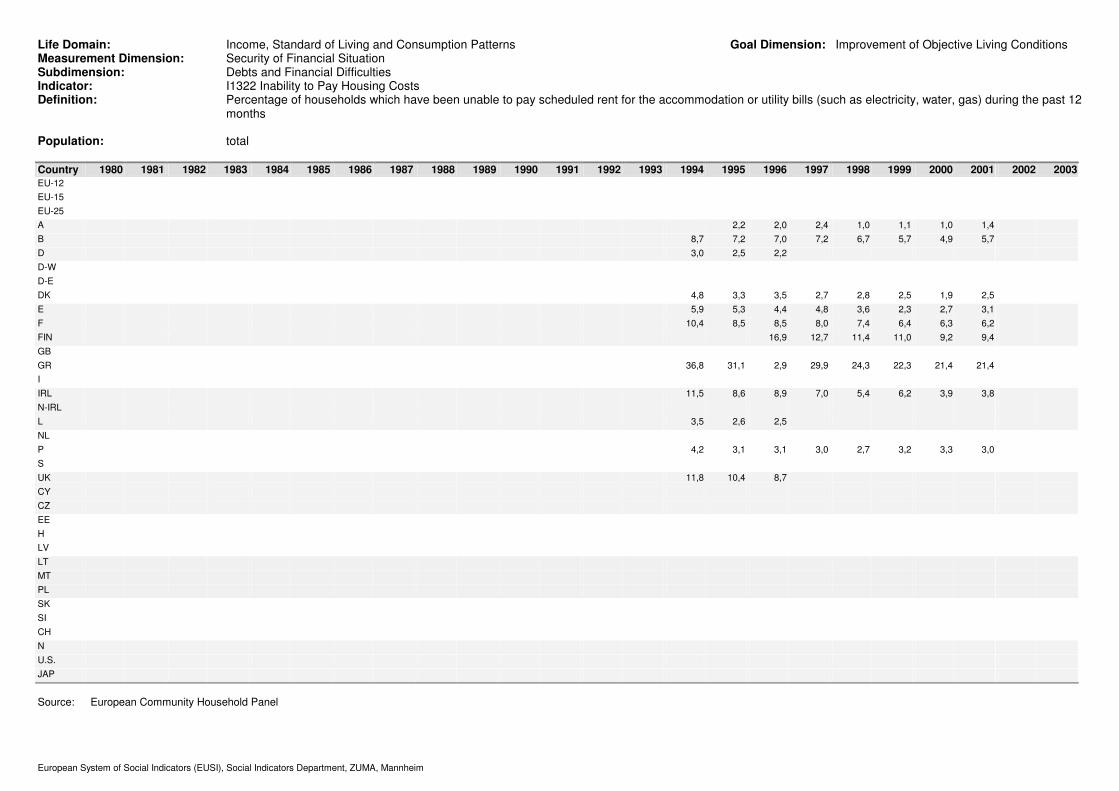
Life Domain: Income, Standard of Living and Consumption Patterns Goal Dimension: Improvement of Objective Living Conditions Measurement Dimension: Security of Financial Situation Subdimension: Debts and Financial Difficulties Indicator: I1322 Inability to Pay Housing Costs Definition: Percentage of households which have been unable to pay scheduled rent for the accommodation or utility bills (such as electricity, water, gas) during the past 12
months Population: total Country 1980 1981 1982 1983 1984 1985 1986 1987 1988 1989 1990 1991 1992 1993 1994 1995 1996 1997 1998 1999 2000 2001 2002 2003 EU-12 EU-15 EU-25 A 2,2 2,0 2,4 1,0 1,1 1,0 1,4 B 8,7 7,2 7,0 7,2 6,7 5,7 4,9 5,7 D 3,0 2,5 2,2 D-W D-E DK 4,8 3,3 3,5 2,7 2,8 2,5 1,9 2,5 E 5,9 5,3 4,4 4,8 3,6 2,3 2,7 3,1 F 10,4 8,5 8,5 8,0 7,4 6,4 6,3 6,2 FIN 16,9 12,7 11,4 11,0 9,2 9,4 GB GR 36,8 31,1 2,9 29,9 24,3 22,3 21,4 21,4 I IRL 11,5 8,6 8,9 7,0 5,4 6,2 3,9 3,8 N-IRL L 3,5 2,6 2,5 NL P 4,2 3,1 3,1 3,0 2,7 3,2 3,3 3,0 S UK 11,8 10,4 8,7 CY CZ EE H LV LT MT PL SK SI CH N U.S. JAP
Source: European Community Household Panel
European System of Social Indicators (EUSI), Social Indicators Department, ZUMA, Mannheim
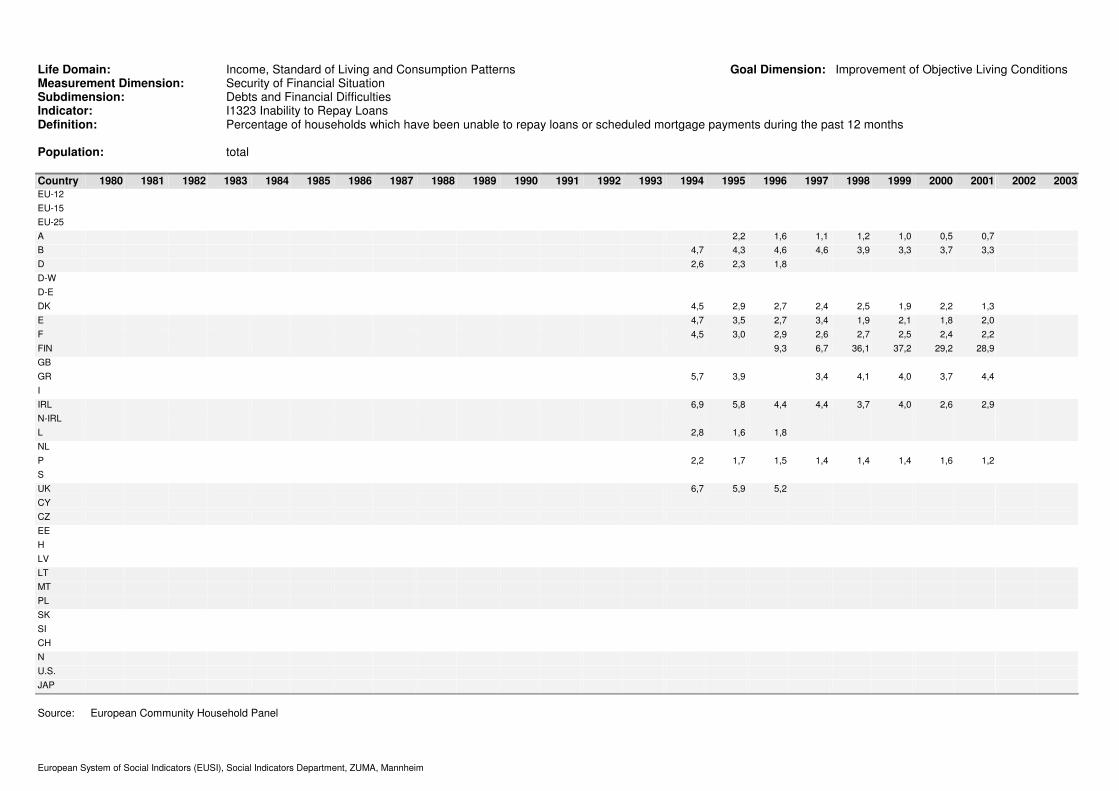
Life Domain: Income, Standard of Living and Consumption Patterns Goal Dimension: Improvement of Objective Living Conditions Measurement Dimension: Security of Financial Situation Subdimension: Debts and Financial Difficulties Indicator: I1323 Inability to Repay Loans Definition: Percentage of households which have been unable to repay loans or scheduled mortgage payments during the past 12 months Population: total Country 1980 1981 1982 1983 1984 1985 1986 1987 1988 1989 1990 1991 1992 1993 1994 1995 1996 1997 1998 1999 2000 2001 2002 2003 EU-12 EU-15 EU-25 A 2,2 1,6 1,1 1,2 1,0 0,5 0,7 B 4,7 4,3 4,6 4,6 3,9 3,3 3,7 3,3 D 2,6 2,3 1,8 D-W D-E DK 4,5 2,9 2,7 2,4 2,5 1,9 2,2 1,3 E 4,7 3,5 2,7 3,4 1,9 2,1 1,8 2,0 F 4,5 3,0 2,9 2,6 2,7 2,5 2,4 2,2 FIN 9,3 6,7 36,1 37,2 29,2 28,9 GB GR 5,7 3,9 3,4 4,1 4,0 3,7 4,4 I IRL 6,9 5,8 4,4 4,4 3,7 4,0 2,6 2,9 N-IRL L 2,8 1,6 1,8 NL P 2,2 1,7 1,5 1,4 1,4 1,4 1,6 1,2 S UK 6,7 5,9 5,2 CY CZ EE H LV LT MT PL SK SI CH N U.S. JAP
Source: European Community Household Panel

European System of Social Indicators (EUSI), Social Indicators Department, ZUMA, Mannheim
Life Domain: Income, Standard of Living and Consumption Patterns Goal Dimension: Improvement of Objective Living Conditions Measurement Dimension: Security of Financial Situation Subdimension: Debts and Financial Difficulties Indicator: I1324 Problems in Paying for Food Definition: Percentage of households which had "some problems", "a lot of problems" or "enormous problems" in paying for food during the last 12 months Population: total Country 1980 1981 1982 1983 1984 1985 1986 1987 1988 1989 1990 1991 1992 1993 1994 1995 1996 1997 1998 1999 2000 2001 2002 2003 EU-12 EU-15 11,1 EU-25 A 6,9 B 13,4 D 6,4 D-W 5,3 D-E 10,2 DK 3,5 E 6,5 F 17,8 FIN 15,0 GB GR 28,0 I 7,1 IRL 11,2 N-IRL L 4,1 NL 9,0 P 37,2 S 9,1 UK 12,6 CY CZ EE H LV LT MT PL SK SI CH N U.S. JAP
Source: European Community Household Panel