income inequality presentation 7-28full powerpoint - income inequality presentation 7-28full author:...
TRANSCRIPT

Economic Inequality
Enrique LamasTrudi Renwick
U.S. Census Bureau
1

No shortage of news coverage of inequality.
Just looking at a single week:

Couple of Quotes “Just about every high‐profile politician in the country today says income inequality is a problem.” New York Times, July 6, 2015.
“Most people — regardless of whether you ask about the poor or the rich, income or wealth, the shape of the income distribution or an individual's position in it — have a terrible sense of what inequality actually looks like.” Washington Post, May 18, 2015.
3

Outline Inequality concepts and measures Sources of data Analytical products and access to inequality data Proposed organization for dissemination
4

Economic inequality metrics1. Single index numbers to describe inequality (e.g., Gini
index) that allow comparisons across time and geography2. Descriptions of the income/wealth distribution Income amounts that define points in the income distribution,
e.g., the middle, the top 5%, the top 1% Share of wealth, income or income growth received by each
fifth of the population Ratios of the cutoffs for groups – e.g., Income amount that
defines the top quintile divided by the bottom quintile cutoff3. Poverty rates, poverty gaps, income to poverty ratios4. Size and/or well‐being of the middle class5. Mobility – likelihood of moving up or down the income
distribution
5

Income inequality indices GINI index (2013=0.476)
Most commonly used measure. Area between the Lorenz curve and hypothetical line of absolute equality. (0 perfect equality, 1 perfect inequality)
Other index numbers reported by the Census Bureau: Theil index (0.415) Mean logarithmic deviation of
income (.578) Atkinson measures (.100,
.196, .298)
6

Descriptions of the income distribution
Examine income cutoffs for each segment of the distribution: lowest quintile, median, highest quintile, 95thpercentile
Ratio of two cutoffs 90th/10th = 12.1 95th/20th = 9.38
7
Household Income: 2013
Source: 2014 CPS ASEC

Inequality measures based on shares
Shares of aggregate income received by each quintile
Some analyses look at the share of “growth” by quintile
3.28.4
14.4
23
51
0
10
20
30
40
50
60
Share of Income by Quintile: 2013
Source: CPS ASEC 2014
8

Poverty measures Poverty – official or supplemental
poverty measures Head count – how many people
have income below the poverty thresholds?
Poverty gap – what is the difference between the poverty thresholds and income for those in poverty
Income‐to‐poverty ratios – how many people have income below 50% of poverty thresholds; below 125% of poverty thresholds, etc.
Multi‐dimensional poverty – expand concept beyond income to include health, housing, neighborhoods, educational opportunities, employment, etc.
9

Other MeasuresMiddle Class Metrics No official definition of
the middle class Median household
income Size of the middle class
(given a definition) Income cutoffs for the
middle quintiles – since no official definition of middle class has been established
10
Earnings Ratios Men vs women White vs Black White vs Hispanic
Lifetime earnings
Economic mobility

11

How to measure resources? Income vs. wealth vs.
consumption vs. earnings Measurement concerns
After tax payments and tax credits
Include the value of noncash benefits – e.g., SNAP, housing assistance
Include value of health insurance?
Adjust for differences in family size – equivalence adjustment
Adjust for geographic differences in the cost of living
12
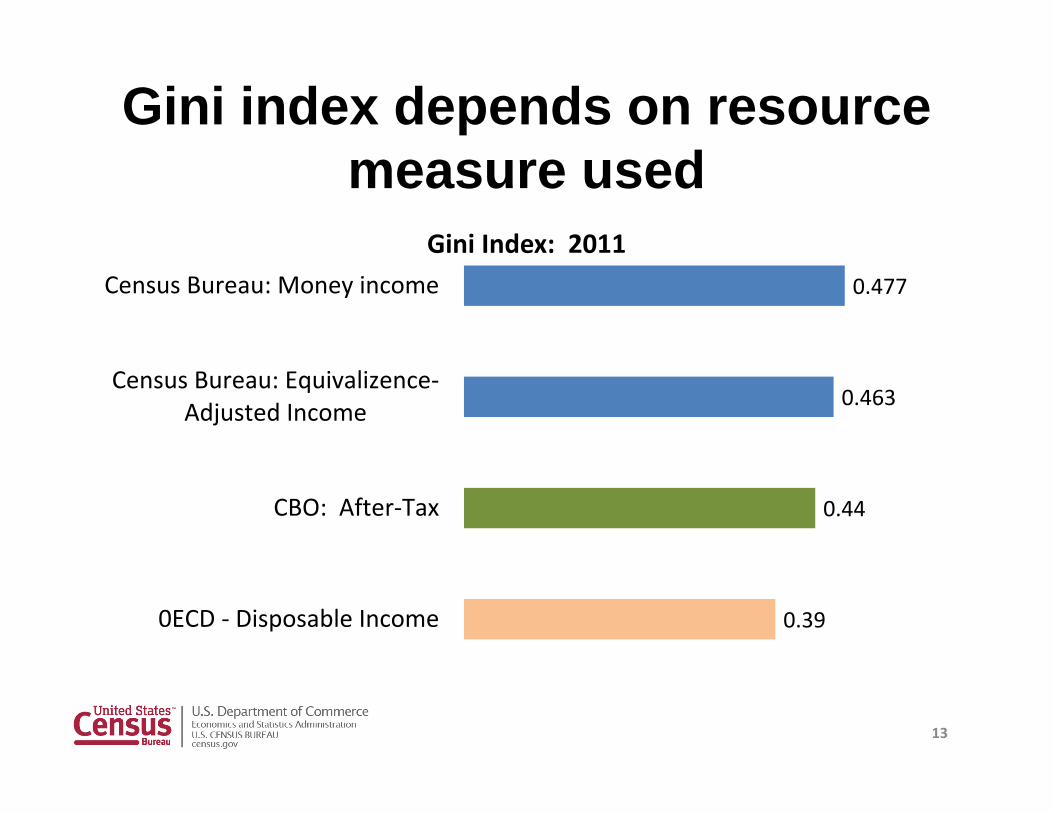
Gini index depends on resource measure used
0.477
0.463
0.44
0.39
Census Bureau: Money income
Census Bureau: Equivalizence‐Adjusted Income
CBO: After‐Tax
0ECD ‐ Disposable Income
Gini Index: 2011
13

Sources of Data Household surveys CPS ASEC – national data, long time series American Community Survey – smaller geographies Survey of Income and Program Participation – wealth and mobility over time
Consumer Expenditure Survey ‐ consumption Federal Reserve Survey of Consumer Finances ‐ wealth
Administrative Data IRS Statistics of Income – sample of tax returns
Bureau of Economic Analysis Per capita income Gross domestic product
14

How do we share data? Reports Tables Data tools Maps/mapping tools Infographics Web sites Apps
15

16
reports

17

18
Census Bureau
tables

19

20
data tools

American FactFinder – Gini Index
21
mapping tools
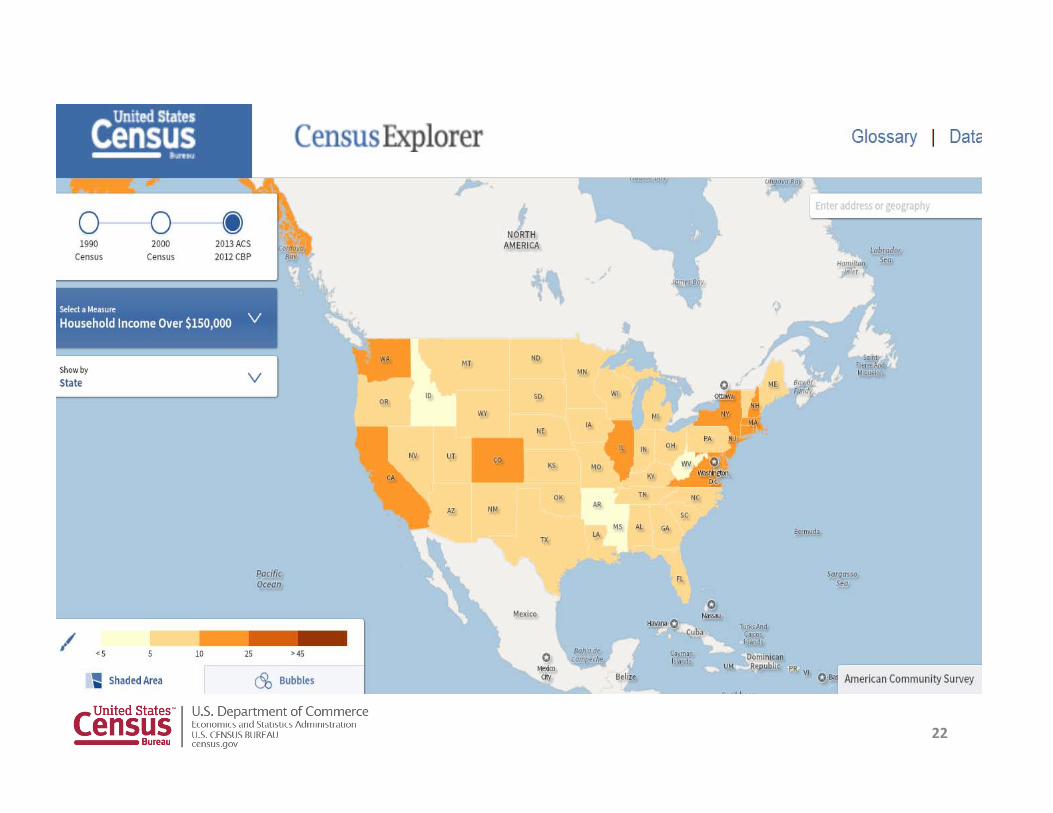
22

23

24

25
infographics

26
27
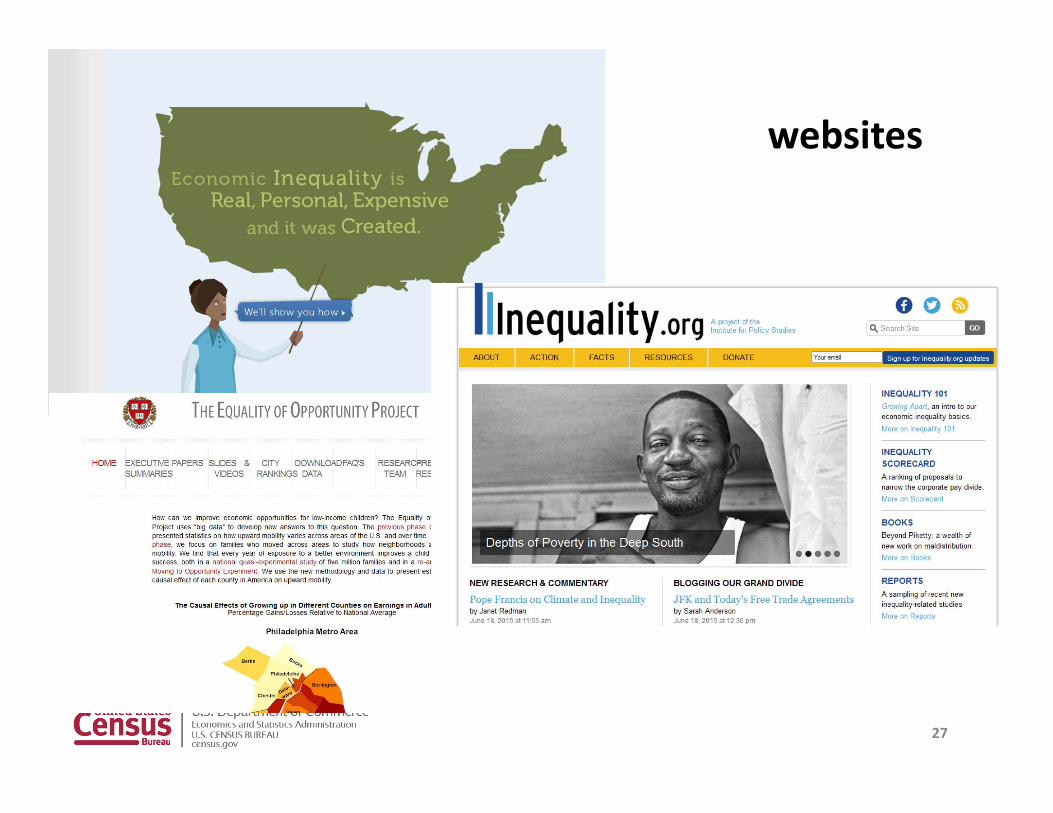
websites

apps
28

29

OUR CHALLENGE: Make our data and analytical assets more accessible to the public Link to other federal government resources on this topic Link to international and private sector resources Provide mechanisms to get user feedback
30

• Census Bureau: Income and Poverty in the United States (September 2013).http://www.census.gov/content/dam/Census/library/publications/2014/demo/p60‐249.pdf
• Congressional Budget Office: The Distribution of Household Income and Federal Taxes, 2011 (November 2014). Combines Census and SOI data.
http://www.cbo.gov/publication/49440
• Internal Revenue Service ‐ Individual Income Tax Return (Form 1040) Statistics. (Spring 2015). http://www.irs.gov/uac/SOI‐Tax‐Stats‐Individual‐Income‐Tax‐Returns
• Joint Economic Committee: Income Inequality in the United States (January 2014).http://www.jec.senate.gov/public/_cache/files/04a5e372‐05d5‐4f06‐a95e‐ede43027c6cd/inequality‐report‐‐‐01‐16‐2014.pdf
• U.S. Department of Commerce: Middle Class in America (January 2010).http://www.esa.doc.gov/sites/default/files/middleclassreport.pdf
• Board of Governors of the Federal Reserve System: Report on the Economic Well‐Being of U.S. Households in 2014 (May 2015).
http://www.federalreserve.gov/econresdata/2014‐report‐economic‐well‐being‐us‐households‐201505.pdf
• Bureau of Labor Statistics: A look at pay at the top, the bottom, and in between (May 2015).http://www.bls.gov/spotlight/2015/a‐look‐at‐pay‐at‐the‐top‐the‐bottom‐and‐in‐between/home.htm
31
Federal Government Reports

• Census Bureau – income and poverty websites. Include detailed tables for each year and historical tables
http://www.census.gov/topics/income.html
• Internal Revenue Service – Statistics of incomehttp://www.irs.gov/uac/SOI‐Tax‐Stats‐Individual‐Income‐Tax‐Returns
• Bureau of Economic Analysis – Personal incomehttp://www.bea.gov/itable/index.cfm
• Bureau of Labor Statistics – Consumer expenditureshttp://www.bls.gov/opub/reports/cex/consumer‐expenditures‐in‐2013.pdf
32
Tables

• American Factfinder – ACS Datahttp://factfinder.census.gov/faces/nav/jsf/pages/index.xhtml• Median household/family income• Poverty rates/Gini coefficients
• CPS ASEC Table Creatorhttp://www.census.gov/cps/data/cpstablecreator.html• Customize income definitions• Poverty rates/median income
• Small Area Income and Poverty Estimateshttp://www.census.gov/did/www/saipe/
• Data Ferretthttp://dataferrett.census.gov/
• Poverty rates by county 1959‐2010http://www.census.gov/hhes/www/poverty/data/census/Poverty‐Rates‐by‐County‐1960‐2010.xlsm
• Census Application Programming Interface (API) http://www.census.gov/developers/
33
Census Bureau Data Tools

• http://www.washingtonpost.com/blogs/wonkblog/wp/2013/09/19/watch‐the‐growth‐of‐u‐s‐income‐inequality‐with‐this‐animated‐map/
• http://www.reuters.com/subjects/income‐inequality
• http://www.bloomberg.com/infographics/2014‐05‐12/income‐inequality‐map.html
• http://www.movoto.com/blog/opinions/income‐inequality‐map/
• http://www.nytimes.com/2015/03/31/upshot/income‐inequality‐its‐also‐bad‐for‐your‐health.html?_r=0&abt=0002&abg=0
• http://www.citylab.com/work/2014/05/mapping‐three‐decades‐income‐inequality‐state‐state/9067/
34
Maps

• http://www.census.gov/library/infographics/poverty_measure‐how.html• https://www.cbo.gov/publication/42729• https://www.census.gov/dataviz/visualizations/019/• http://www.huffingtonpost.com/2013/06/12/inequality‐us‐_n_3421381.html• http://www.motherjones.com/politics/2011/02/income‐inequality‐in‐america‐chart‐graph• https://www.youtube.com/watch?v=QPKKQnijnsM• http://www.ibtimes.com/infographic‐data‐income‐inequality‐us‐do‐not‐paint‐pretty‐picture‐
1540868• http://budgetandpolicy.org/schmudget/infographic‐income‐inequality‐is‐pulling‐washington‐
state‐apart• http://randycoffeyillustration.com/wp‐content/uploads/the‐distribution‐of‐wealth‐in‐the‐
u.s.pdf• http://www.business2community.com/infographics/defining‐americas‐future‐rising‐
inequality‐01030632• http://visual.ly/inequality‐wealth
35
Infographics

Websites• http://www.census.gov/topics/income.html
• http://inequality.is/real
• http://inequality.org
• http://www.equality‐of‐opportunity.org/
• http://wealthinequality.org/
• http://www.oecd.org/inequality.htm
36