income inequality in ireland - tasc · pdf file · 2014-10-08 tax and transfers...
TRANSCRIPT
Budget 2015
A Chance to Address Ireland’s Inequality Problem

THE FIRST STEP IS TO ADMIT YOU HAVE A PROBLEM…
“[People] experience in a very personal way the relentless, decades-long trend that I want to spend some time talking about today. And that is a dangerous and growing inequality and lack of upward mobility that has jeopardized middle-class America’s basic bargain – that if you work hard, you have a chance to get ahead. I believe this is the defining challenge of our time,” Barack Obama, December 2013 http://www.whitehouse.gov/the-press-office/2013/12/04/remarks-president-economic-mobility “With technical progress raising the global demand for high-skilled workers, by 2060 average market earnings inequality (before tax and transfers) in the OECD area will reach the level of today’s most unequal OECD countries.” http://www.oecd.org/eco/growth/Shifting%20gear.pdf

www.tasc.ie
Ireland has the highest rate of pre-tax, pre-transfer income inequality in the OECD
0.30
0.35
0.40
0.45
0.50
0.55
0.60
http://stats.oecd.org/Index.aspx?DatasetCode=IDD

www.tasc.ie
Ireland’s income tax system is technically ‘progressive’ but only in some respects
0.0%
5.0%
10.0%
15.0%
20.0%
25.0%
30.0%
35.0%
40.0%
45.0%
50.0%
1,0
00
6,0
00
10
,03
5
14
,00
0
16
,49
9
18
,30
5
22
,00
0
27
,00
0
32
,00
0
35
,00
0
40
,00
0
45
,00
0
50
,00
0
55
,00
0
60
,00
0
65
,00
0
70
,00
0
75
,00
0
80
,00
0
85
,00
0
90
,00
0
95
,00
0
10
0,0
00
10
5,0
00
11
0,0
00
11
5,0
00
12
0,0
00
12
5,0
00
13
0,0
00
13
5,0
00
14
0,0
00
14
5,0
00
15
0,0
00
15
5,0
00
16
0,0
00
16
5,0
00
17
0,0
00
17
5,0
00
18
0,0
00
18
5,0
00
19
0,0
00
19
5,0
00
20
0,0
00
% o
f G
ross
inco
me
Theoretical Income Tax Level (Including USCand PRSI)
Theoretical Income tax level (not includingUSC or PRSI)
High progressivity from low to twice average incomes
Progressivity eases off at higher income levels

www.tasc.ie
Tax and Transfers Reduce Inequality
• Ireland still has the highest level of income inequality after tax but before social transfers (Eurostat)
http://epp.eurostat.ec.europa.eu/portal/page/portal/product_details/dataset?p_product_code=ILC_DI12C
• After both tax and transfers, Ireland moves from having the highest income inequality in the OECD to around the EU average for income inequality (Eurostat)
http://epp.eurostat.ec.europa.eu/portal/page/portal/product_details/dataset?p_product_code=TESSI190

www.tasc.ie
Source: World Top Incomes Database http://topincomes.g-mond.parisschoolofeconomics.eu/
Ireland’s Top 1% Mimics USA Inequality Trend

www.tasc.ie
Income Inequality in Ireland has grown dramatically since the 1980s
€0
€100,000
€200,000
€300,000
€400,000
€500,000
Year 1984 1994 2004
Top 1%
Top 10%
Average Incomes
2010 Euro values. Source: World Top Incomes Database http://topincomes.g-mond.parisschoolofeconomics.eu/

www.tasc.ie
The income share of the ‘Bottom 90%’ has declined from 71% to 64.5%
Source: World Top Incomes Database http://topincomes.g-mond.parisschoolofeconomics.eu/
www.tasc.ie
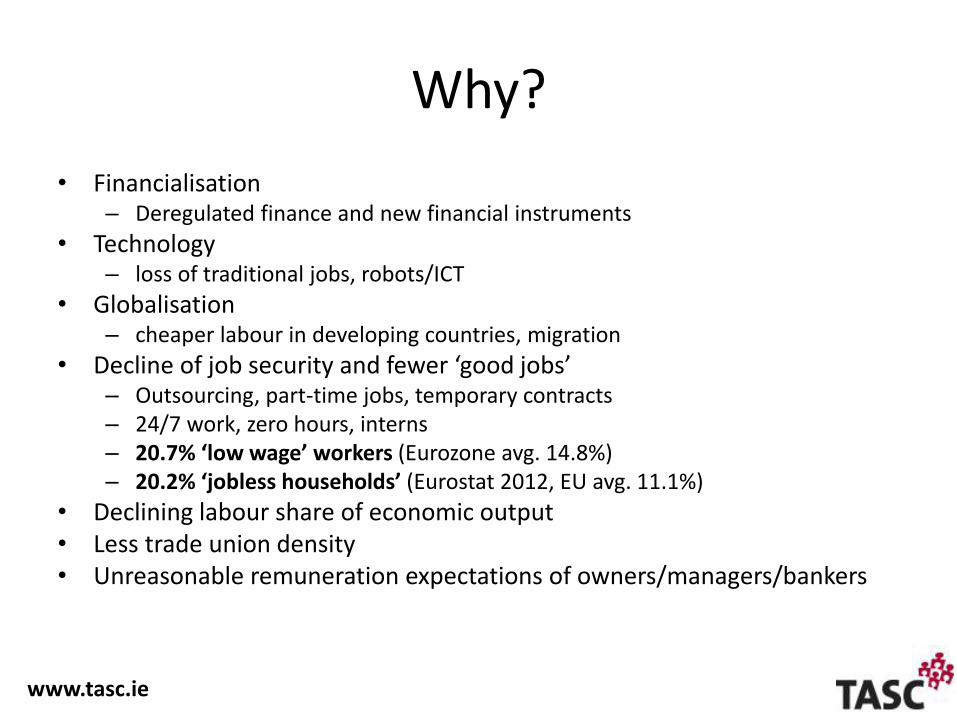
Why?
• Financialisation – Deregulated finance and new financial instruments
• Technology – loss of traditional jobs, robots/ICT
• Globalisation – cheaper labour in developing countries, migration
• Decline of job security and fewer ‘good jobs’ – Outsourcing, part-time jobs, temporary contracts – 24/7 work, zero hours, interns – 20.7% ‘low wage’ workers (Eurozone avg. 14.8%) – 20.2% ‘jobless households’ (Eurostat 2012, EU avg. 11.1%)
• Declining labour share of economic output • Less trade union density • Unreasonable remuneration expectations of owners/managers/bankers

www.tasc.ie
Ireland’s tax and social insurance take is low: ¾ of EU average

www.tasc.ie
Ireland’s retrenchment is focused on cuts over taxation
0
10
20
30
40
50
60
70
1996 1997 1998 1999 2000 2001 2002 2003 2004 2005 2006 2007 2008 2009 2010 2011 2012 2013 p 2014 p 2015 p 2016 p
Tax (blue) and Spending (red) as % GDP
Tax revenue collapsed and Ireland has rebuilt part of the lost tax base, but has not moved revenue closer to EU average levels.
www.tasc.ie
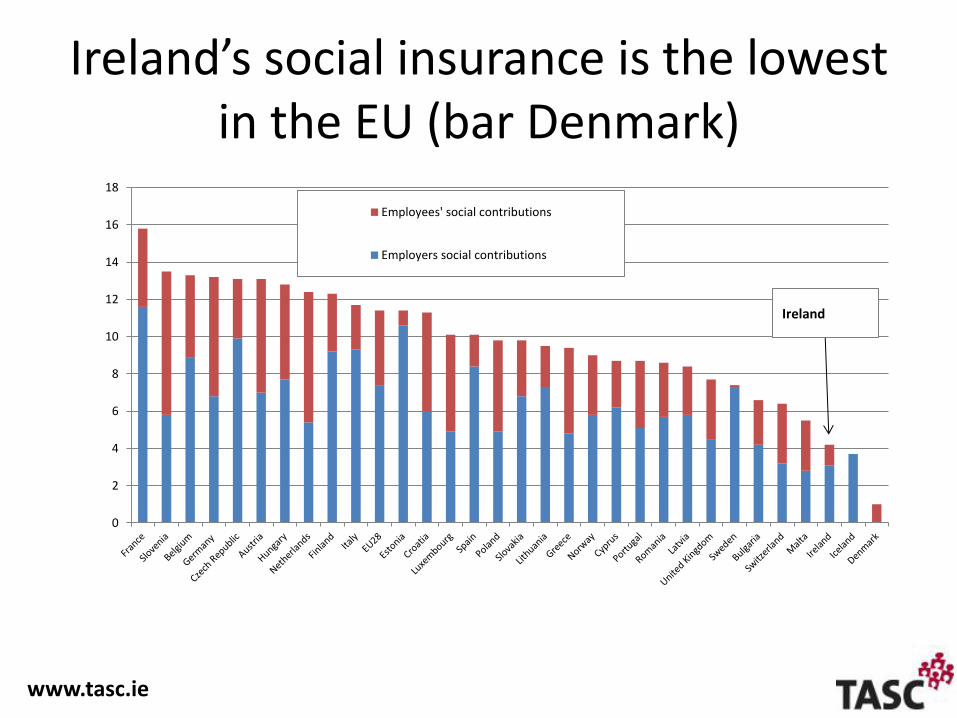
Ireland’s social insurance is the lowest in the EU (bar Denmark)
0
2
4
6
8
10
12
14
16
18
Employees' social contributions
Employers social contributions
Ireland

www.tasc.ie
Ireland’s low social contributions lowers labour costs
• Social contributions in Ireland are the second lowest in the EU at just 4.4% of GDP compared to an EU average of 11.1%
• They are also second lowest at 15.3% of total taxation compared to an EU average of 30.9%.
• Comparable OECD data shows that social security in the USA represents 5.4% of GDP and 22.3% of all taxation.
• Irish social security contribution levels are therefore not only less than half of EU average levels, but they are significantly lower than social security levels in the USA.
Sources: Tables 22 and 23, pp. 195-196, Tax Trends in the European Union http://ec.europa.eu/taxation_customs/resources/documents/taxation/gen_info/economic_analysis/tax_structures/2014/report.pdf OECD reference http://data.oecd.org/tax/social-security-contributions.htm

www.tasc.ie
Ireland has a low ‘tax wedge’ on most workers (OECD)
‘Tax wedge’ includes employer and employee social contributions as well as taxes. AW = Average Wage
http://www.compareyourcountry.org/taxing-wages?cr=oecd&lg=en

www.tasc.ie
Public pay more out-of-pocket for services and are sceptical of taxation (vicious cycle)
• People on average wages pay far less tax and social insurance than the EU average.
• BUT they receive fewer
subsidised or free-of-charge public services and weaker social insurance against risks (e.g. ill health, job loss).
• THUS they spend more on private
health insurance, education fees, health fees, etc. and are both sceptical of public services’ ability to deliver for them and unable/unwilling to pay more tax or PRSI.

TASC’S PROPOSALS
What does all this mean?
What can we do to reduce economic inequality in Ireland?

www.tasc.ie
TASC’s Analysis (1 of 2)
• Reducing economic inequality requires: – More ‘good jobs’ (investment needed)
– At least a Living Wage for full-time work
– Wider distribution of work (e.g. four-day week)
– Stronger trade unions and workers’ rights
– Stronger income supports for part-time workers
– Welfare rates at Living Income standards
– Regulated and reduced cost of living – e.g. housing
– Stronger public goods and services: higher taxes but lower out-of-pocket costs and less individualised risk

www.tasc.ie
TASC’s Analysis (2 of 2)
• Reducing economic inequality also requires: – Pay caps or company pay ratios – Higher rates of income tax for high incomes – Wealth taxes, including gift and inheritance tax – Strong re-regulation of banking and finance – Financial transaction tax (FTT) – Legislation for transparency in companies and trusts – Stronger white collar crime law and enforcement – Reformed tax breaks and corporate taxation – Non-financial rewards for investment, innovation, job
creation and philanthropy

www.tasc.ie
Ireland has had the EU’s lowest level of investment for some time
0
5
10
15
20
25
30
Eurostat: http://epp.eurostat.ec.europa.eu/statistics_explained/index.php/National_accounts_and_GDP
Fixed Capital Formation, Public and Private, % of GDP

www.tasc.ie
Ireland needs investment, not tax cuts
• Private investment has not manifested during the downturn (only partially due to high boom-time debt)
• An IMF staff paper, among other analysis, has shown that public investment has a higher multiplier effect in the economy than is achieved through tax cuts.
http://www.imf.org/external/pubs/ft/wp/2010/wp1073.pdf

www.tasc.ie
Policy Yield (€m)
Cost (€m)
Pensions-related tax reform 580 Abolish health insurance tax relief 400 Lower VAT by 1% - 350 Fix Step effect in PRSI - 25 Increase Personal Tax Credit by €200 - 260 48% tax on income above €100,000 365 Expenditure increases - 615 Water Charges 500 Water Credits - 100 Carryover (incl HRA) 300 IMF loan refinancing 375 Additional Tax Revenue 500 Total
3,020
- 1,350
Net Adjustment 1,675
Budget 2015

THE DEBATE ABOUT HIGHER RATE INCOME TAX
TASC’s response to business lobbyists

www.tasc.ie
Misinformation on Income Tax (1)
IBEC claim: “Ireland is not a low income tax country, particularly for middle and high earners: Since 2010, income tax as a percentage of national income has risen from 8.7% to 11.6%, well above the EU average of 9.5%. Ireland is now the fifth highest personal income tax jurisdiction in the EU.”
• A comparable indicator of taxes on employees is total implicit tax rate on labour.
• “The implicit tax rate on labour should be seen as a summary measure that approximates an average effective tax burden on labour income in the economy.” (Eurostat)
• Ireland ranks fifth lowest out of 28 EU countries, in 24th place overall.
http://epp.eurostat.ec.europa.eu/portal/page/portal/product_details/dataset?p_product_code=TEC00119

www.tasc.ie
Misinformation on Income Tax (2)
IBEC claim: “Over half of all taxpayers would benefit from a cut in the marginal rate”
• To fit the data into this argument, IBEC only count 1.2 million people as ‘tax payers’.
• IBEC’s 607,000 people only represents 25.3% of the 2.4 million people represented by Revenue's 2.1 million tax units in the relevant data. (Or 35% of all 1.9 million employed).
www.tasc.ie
Misinformation on Income Tax (3)
IBEC claim: The income tax system is the most progressive in the developed world and Ireland’s tax and transfers system is the most redistributive in Europe.
• Yes, but what does that mean?
• ‘Progressivity’ is a technical measure of only one thing (0.67 AW versus 1.67 AW)
• Ireland’s extreme pre-tax, pre-transfer inequality requires a strongly redistributive system

www.tasc.ie
Actual tax paid is lower than theoretical tax rates (including USC and PRSI), and progressivity
‘flattens out’ from twice average wages
0.0%
10.0%
20.0%
30.0%
40.0%
50.0%
60.0%
€0.00 €50,000.00 €100,000.00 €150,000.00 €200,000.00
Gross income
Theoretical Income Tax, USC and PRSI
Actual Tax USC and PRSI
Tax on a single person

www.tasc.ie
Misinformation on Income Tax (4)
IBEC claim: “Middle and high earners pay the vast majority of tax. At the average wage and above Irish tax rates are relatively high. Those earning €39,000 upwards are taxed higher than their OECD counterparts.” • IBEC ignore social insurance when making these claims, which
lowers tax on average wages to below average levels. • IBEC’s analysis ignores part-time work and low paid and/or insecure
work – e.g. 20.7% ‘low wage’ workers • Average Pay (nominally €35,800) is highly skewed, with higher
average levels of managerial/professional pay (€59,500) and low pay for over 1 million workers in clerical, service, production and other roles (averaging €24,600).
• Also, dual earner married couples do not pay higher rate until between €45,400 and €65,600.
www.tasc.ie
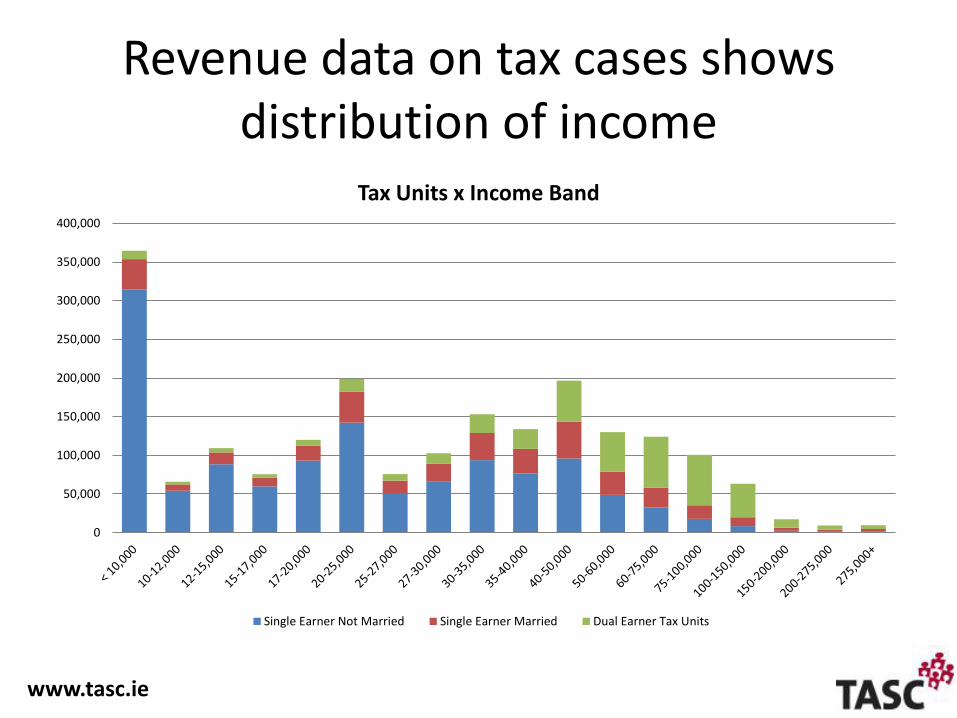
Revenue data on tax cases shows distribution of income
0
50,000
100,000
150,000
200,000
250,000
300,000
350,000
400,000
Tax Units x Income Band
Single Earner Not Married Single Earner Married Dual Earner Tax Units

www.tasc.ie
Misinformation on Income Tax (5)
IBEC claim that “The top 1% of all income tax cases in Ireland earn 9.1% of income and pay 30.4% of the taxation.” and “The top 5% pay almost 55% of all taxation from 22.7% of the income”. • Using Revenue data for 2011, the Top 1% pay 18.3 per cent of all
income tax. • The Top 5% pay 41.3 per cent of all income tax. • Yet the Top 5% have average taxable incomes of €171,663 each (net
of expenses, e.g. for self-employed) and average after-tax incomes of €120,011. In objective terms, they can afford to pay more in tax.
Revenue data on total taxable income paid by those with incomes over €200,000 (top 0.75%) and those with incomes over €100,000 (top 4.22%) from Table IDS16: http://www.revenue.ie/en/about/publications/statistical/2012/income-distribution-statistics.pdf

www.tasc.ie
Misinformation on Income Tax (6)
Chris Johns (Irish Times columnist, former Chief Investment Officer at State Street): Use of “the gross incomes of the self-employed, rather than net income (or profits), … [results in] spurious statistics on effective rates of tax.”
• TASC cites official Revenue data, which is the best (and often the only) source for analysis of actual incomes. But no available data splits self-employed and employed. TASC has analysed two datasets: gross income may include some self-employed, but taxable income includes greater distortion from tax breaks for pensions and other tax reliefs.
• The data TASC used does NOT include SMEs or individuals who operate as limited companies, but may include tax breaks for work expenses.
• TASC’s figure of a maximum of 30% income tax paid by higher earners comes from 2013 gross income tax given by Minister for Finance, with no taxable income data published.
• There is no major difference between the two datasets, as they both describe the same amount of tax paid, but fewer people in the dataset on taxable incomes remain in the group over €200,000, and the data shows they pay a slightly higher percentage of income tax.

www.tasc.ie
Income Tax Paid by Gross Income versus Taxable Income (2011)
Note: add PRSI up to 4% and USC up to 7% (PAYE) or 10% (self-employed)
The top 8.8% of income tax payers (singles or couples) have taxable incomes of €75,000+

www.tasc.ie
The Incentive-Investment Arguments about Higher Income Tax Rates
• IBEC: “Certain features to the Irish tax system are a major disincentive to work, especially the marginal rate at average earnings: A skilled graduate moving from gross pay of €20,000 to gross pay of €60,000 over the first ten years of their career will see an increase of annual net pay of just €22,888 in Ireland; the same person would see an equivalent increase of €30,287 in the UK; a difference of €7,399.”
• Irish Tax Institute: “a high personal tax rate is a disincentive to work generally. … To reach its full potential a business may need to engage experienced foreign expertise and, as tax equalisation agreements often form a part of wage packages, high marginal rates make this very costly.”
• American Chamber of Commerce: “The high marginal tax rate and the low entry point to that rate are major barriers to attracting and incentivising key talent”
www.tasc.ie
The Budget 2015 Choice
• Ireland can mimic the UK and USA and compete for foreign direct investment by cutting the higher rate of income tax. But these countries have much higher economic inequality and negative effects on health, crime and economic performance. Also, income tax cuts will benefit domestic professionals and managers who are not globally mobile. fails equality test
• Ireland can follow the successful North West European growth model based on quality public services and investment for job creation. These countries rival or outperform Ireland in productivity, innovation and competitiveness, despite – or because of – higher tax and social insurance levels. They also have great economic equality. passes equality test

www.tasc.ie
Keep up with TASC’s work on www.tasc.ie
Follow @TASCblog on Twitter
Support us or get involved www.tasc.ie/support