including carbon emissions in the planning of … · supply chain management at coppead ......
TRANSCRIPT

Int. J. Shipping and Transport Logistics, Vol. 7, No. 6, 2015 655
Copyright © 2015 Inderscience Enterprises Ltd.
Including carbon emissions in the planning of logistic networks: a Brazilian case
Peter Wanke* Center for Studies in Logistics, Infrastructure and Management, COPPEAD Graduate Business School, Federal University of Rio de Janeiro, Rio de Janeiro, Brazil Email: [email protected] *Corresponding author
Henrique Correa Rollins College, Crummer Graduate School of Management, Winter Park, Florida, USA Email: [email protected]
Juliana Jacob COPPEAD/UFRJ, Cidade Universitária – Ilha do Fundão, Rio de Janeiro, Brazil Email: [email protected]
Thauan Santos COPPE/UFRJ, Cidade Universitária – Ilha do Fundão, Rio de Janeiro, Brazil Email: [email protected]
Abstract: The issue of sustainability has gained increasing importance in the agenda of government leaders and business managers alike, all over the world. Companies have come to realise that on top of being beneficial for the planet, strategies for the reduction of greenhouse gas emissions and sustainability policies represent important opportunities for businesses growth. Many such strategies are related to the business supply chain, where most decisions that impact emissions and sustainability are made. Examples of such decisions can be found in supply chain logistic network design and management: facility location, definition of transportation modes, and distribution policies, including which facilities should serve what markets. In this work, a nonlinear mathematical model to support the planning of more sustainable logistic networks was developed using a plausible hypothetical logistic network located in Brazil as a case. One aspect of the developed model that sets it apart from others in the current literature is that in addition to traditional logistic costs, carbon emission costs resulting from transportation activities along the supply

656 P. Wanke et al.
chain were also taken into account in the analysis. Sensitivity analyses were conducted by using a computer simulation aimed at evaluating road and rail transportation modes, in terms of the impact that each has on the cost optimisation of the network configuration, especially in regard to the total cost of emissions and stocks held in the chain to ensure a desired level of customer service.
Keywords: carbon emissions; facility location; green supply chain; network planning; nonlinear programming.
Reference to this paper should be made as follows: Wanke, P., Correa, H., Jacob, J. and Santos, T. (2015) ‘Including carbon emissions in the planning of logistic networks: a Brazilian case’, Int. J. Shipping and Transport Logistics, Vol. 7, No. 6, pp.655–675.
Biographical notes: Peter Wanke is an Associate Professor of Logistics and Supply Chain Management at COPPEAD Graduate Business School and publishes regularly on related topics in international peer-reviewed journals.
Henrique Correa is an Associate Professor of Operations Management at Rollins College and publishes regularly on related topics in international peer-reviewed journals.
Juliana Jacob was a former graduate student of the full-time MBA in Business Administration at COPPEAD.
Thauan Santos is a doctoral candidate at the Energy Planning Program of COPPE Graduate School of Engineering – Federal University of Rio de Janeiro.
1 Introduction
Climate change and global-warming-related environmental concerns have been among the most pressing issues for society in recent years. According to the Intergovernmental Panel on Climate Change (IPCC) (http://www.ipcc.ch/), for instance, emission of greenhouse gases (GHG), particularly carbon dioxide (CO2), is among the main causes of global warming.
As environmental conditions change, regulatory mandates and demands regarding the environment increase. Examples include mandates defined by agreements such as the Kyoto Protocol and demands by NGOs, government agencies and legislation from different countries.
Such new demands place increasing pressure on companies to reduce their GHG emissions (Butner et al., 2008; Paksoy et al., 2011). Developed and some developing nations have established goals that aim to significantly cut GHG emissions. The European Union Energy Policy, for instance, targets a 20% reduction of GHG emissions by 2020. There also seems to be some level of convergence in the ongoing debate about a universal social cost/price for carbon (WEA – World Economic Forum, 2008). The idea here is to establish taxes to be charged on carbon emissions to incentivise companies to invest in initiatives aimed at emission reduction, thereby avoiding/reducing taxation.
Including carbon emissions in the planning of logistic networks 657
In this context, some level of environmental stewardship starts to emerge as an additional objective of organisations (Ferretti et al., 2007). As environment-related objectives grow in importance, so too grows the need for the development of better environmental strategies (Paksoy et al., 2011). In other words, if in the past the only goals of businesses were related to maximising profits and improving customer service (Shapiro, 2001), now environmental aspects of business operations also play an important role in companies’ objectives, strategies, policies and management (Ferretti et al., 2007).
For companies, there are two options: either they use the challenge of climate change as an opportunity to restructure their activities, or they delay the decision to do so. Companies that act now may obtain first mover advantages in their industries, which will possibly be denied to those who wait for laws and regulations – to which they will eventually have to comply. Among such opportunities are, for instance, gaining a share of the growing market of environmentally conscious consumers, attracting and retaining the best talent, and more sustainable global growth (Butner et al., 2008).
1.1 Logistics and the environment
In the USA in the ‘90s, the establishment of legal environment-related limits for logistics operations, such as maximum emissions for certain modes of transportation in some states, can be considered an important milestone in bringing the environment into the discussion about logistics. Bowman (1995) refers to large companies such as Du Pont and Santa Fe Railway as pioneers in the development of strategies and techniques for safety and environmental preservation in the transport of dangerous goods and in air emissions.
The Montreal Protocol in the ‘80s (http://www.epa.gov/ozone/intpol/) and Kyoto in the ‘90s (http://www.kyotoprotocol.com/) were instrumental in setting more comprehensive targets of limits for atmospheric emissions, including emissions related to logistic operations. Management goals were then established within organisations considering the need for reducing the emission of GHGs. Organisations from the signatory countries had to adapt by refocusing management goals and allocating/ managing resources in more environmentally efficient ways (Corrêa and Xavier, 2013).
It is now broadly recognised that the greatest opportunities to reduce carbon emissions lie in the firm’s supply chain. Concepts such as sustainable supply chains, the triple bottom line (3BL) (i.e., profit, people, planet), and green supply chain management have gained increasing interest in universities, governments, NGOs and the corporate world at large (Andersen and Skjoett-Larsen, 2009; Corrêa and Xavier, 2013).
Many authors in the literature suggest that reducing a firm’s overall carbon emission level requires a fundamental transformation in its supply chain practices (Beamon, 1999) and new approaches for the effective management of their emissions – from the purchasing of raw materials through production to the distribution and destination of products after use (Butner et al., 2008).
1.2 Objective
The purpose of this research is to contribute to the growing body of knowledge on green logistics by developing a mathematical programming model for the design of green(er)
658 P. Wanke et al.
logistic networks that considers, along with traditional logistic costs, the carbon emission costs resulting from transportation activities throughout the supply chain.
To achieve our objective, we will base the model development on a formulation that gauges logistics environmental impact by measuring CO2 (an important GHG) emissions proposed by Chaabane et al. (2008a) and on formulations that take into consideration the effect of stock centralisation (Wanke, 2009; Wanke and Saliby, 2009) on supply chain performance.
Chaabane et al. (2008a) present an integrated logistics model for environmentally conscious supply chain network design that considers the effects on the environment of supply chain decisions. Similarly, Zhang and Nian (2013), Loo and Li (2012), Pérez-López et al. (2013), and Kelly et al. (2009) also take environmental issues into consideration when evaluating the performance of transportation in different countries. A carbon market that is sensitive to green supply chain network design is presented by Chaabane et al. (2008b), Ramundhin et al. (2008), Fleishmann et al. (2001), Pati et al. (2013), and Wang et al. (2013), in line with the main concerns of Chaabane et al. (2008a).
Our formulation also takes into account the effect of stock centralisation/ decentralisation, which is proposed in Wanke (2009) and Wanke and Saliby (2009). In fact, what we propose in this paper is to extend these models. In this paper, inventory-related costs are still considered, but we add the consideration of environmental costs.
The total impact on the environment of product distribution in supply chains is positively correlated with the distance travelled (i.e., the longer the distance, the higher the impact); however, distance does not tell the whole story. The environmental impact will also depend on the mode of transportation employed. In this study, we will analyse the influence of different modes of transportation on carbon emissions and also on the total amount of stocks needed to be carried in the distribution network to ensure a certain customer service level. This should paint a richer and more accurate picture of the costs involved in designing and managing the supply chain logistic network.
We believe the proposed model contributes to a better understanding of the potential trade-off between environmental stewardship and supply chain costs when decision makers plan their supply chain design and operation.
More specifically, our goals for the model are twofold:
1 to allow for a better understanding of the way in which a possible taxation of carbon emissions may affect the decision to locate facilities in a distribution network
2 to allow for better-informed decisions about the adoption of alternative modes of transportation in supply chains considering carbon and other logistics costs.
The originality/contribution of this paper lays in the simultaneous analysis of both the cost of transportation and the cost of holding stocks in the network. It is important to note that we consider environment-related costs as components of both cost types (i.e., transportation and stocks), when measuring the emission of GHGs associated with the supply chain logistic network in our Brazilian case.
Including carbon emissions in the planning of logistic networks 659
2 Literature review
Chaabane et al. (2008a) propose a mathematical programming model for the design of more environmentally sound logistic networks, environmental impact in this case being measured by the cost of transportation-related carbon emissions in the supply chain.
Taking these costs into account along with more usually considered logistic costs, the problem is formulated by Chaabane et al. (op. cit.) as a single-objective optimisation problem. The authors use mixed integer linear programming to deal with different strategic decisions, including the selection of suppliers and contractors, product allocation, capacity utilisation and the attribution of transportation links necessary to meet market demand.
Traditionally, supply chain managers focus on measures of economic performance and service level in order to evaluate the effectiveness and efficiency of a logistic network (Beamon, 1999). The growing concern with environmental sustainability, however, has put forward the notion that the performance of a supply chain must consider not only profits but also the impact of their activities on the environment and on social systems (Gladwin et al., 1995; Starik and Rands, 1995; Jennings and Zandbergen, 1995).
The consideration of sustainability therefore broadens the traditional and more restrictive supply chain management approach by incorporating environmental dimensions into performance evaluation.
One closely related concept related to firm performance that has recently gained visibility is the so-called ‘3BL’ (Kleindorfer et al., 2005). The 3BL concept is a theoretical approach of performance evaluation that considers simultaneously goals related to economic prosperity (profit), social responsibility (people) and environmental sustainability (planet).
According to a number of authors (e.g., Carter and Rogers, 2008), although in some situations this may be the case, the 3BL does not necessarily mean that the three goals (profit, people, planet) conflict. Rather, there are activities that companies may engage in that not only positively affect the environment and society but also result in long-term economic benefits and competitive advantage. One simple example is the replacement of incandescent light bulbs with LED-type bulbs. Because LED bulbs can offer the same light with less energy, profit- and planet-related objectives can be obtained simultaneously: less energy costs benefit profits, and less energy spent means less emissions in generating and transmitting that energy.
Srivastava (2007) defines ‘green supply chain management’ as the integration of environmental concepts and supply chain management. The practical application of green supply chain management starts with the identification of the most relevant environmental impacts to consider. Examples are carbon emissions and use of energy, water and non-renewable natural resources that should be minimised in production and distribution activities (Butner et al., 2008).
To assess ‘how green’ a supply chain is, the so-called life-cycle approach is a useful methodology (Dyckhoff et al., 2003; Dekker et al., 2004). The life cycle of a product in this context encompasses the environmental impact of activities from product design through material selection, production processes, transportation, distribution, delivery to consumers, use by consumers and eventual destination of the product after its service life ends (examples of destination include re-use, re-furbish, re-manufacture, re-cycle, energy generation through burning and landfill) (Xavier and Correa, 2013). In this paper, we do

660 P. Wanke et al.
not analyse the environmental impacts of all activities in the product life cycle; rather, we focus on a very important part of it – transportation.
With the increased emphasis on the reduction of carbon emissions, the integration of carbon-related considerations in the supply chain logistic network design phase will better inform companies on how to design and manage efficient, effective and green chains (Chaabane et al., 2008a).
“With an economic damage estimated in around 85 USD for each ton of carbon dioxide (CO2) in emissions, limiting the emissions of greenhouse gases and putting a price on them will be unavoidable” [Butner et al., (2008), p.1]. Reducing the carbon ‘footprint’ will soon become a legal and economic obligation, and companies must expect to be charged for their emissions, which will necessarily force changes in the management of their supply chains (Butner et al., 2008).
Thus, a review of the logistic network of most supply chains is now in order so that the additional variable of carbon emissions (and respective costs) is taken into account. This includes the impact that carbon costs can have on decisions related to the location of facilities and to the distribution and transportation operations (e.g., choices regarding modes of transportation) and stock allocation policies (e.g., how much inventory to keep and where).
Probably most supply chains’ logistic networks will not be radically altered by such review, but the economies that traditional practices rely on will certainly change and will have more elements added to them. This means that the task of optimising the supply chain becomes even more complex (Butner et al., 2008).
On the demand side, consumers’ concern about the environment has also increased substantially. Research conducted with consumers from all over the world reveals that 85% of them are ‘extremely’ or ‘somewhat’ concerned about climate change, while 81% expect that their lives will be directly impacted by this phenomenon (WEA – World Economic Forum, 2008). This is bound to shift their purchasing behaviour towards favouring companies with more carbon-efficient supply chains.
The model proposed in this paper is intended to help companies in their effort to review their logistic networks by allowing the incorporation of carbon-related costs along with more traditional logistics costs when optimising their network design.
3 Method
3.1 Proposed model
This study utilised Advanced Integrated Multidimensional Modeling Software 3.10 (AIMMS), which allows advanced optimisation and supports the development of decision systems.
The AIMMS platform provides a programming language that allows the construction of interactive procedures in the execution of mathematical models. It also offers a complete, flexible and user-friendly modelling environment that allows for combinations of mathematical methods and interfacing with databases. The system has various types of solvers that help in solving different kinds of mathematical programming problems. For this research, the Lipschitz-continuous Global Optimizer (LGO) routine, developed by Pinter Consulting Services, was employed during sensitivity analyses in the optimisation of the simulated scenarios.
Including carbon emissions in the planning of logistic networks 661
To construct the model, we started by establishing the sets (that represent indices of problem entities), the parameters (that are indexed to the sets and represent the model input and output variables), and the decision variables and the variables involving summations which are calculated by the optimisation routines. Then, the problem’s constraints were defined. The mathematical programming model was then created as a nonlinear minimisation model.
After building the model, we imported all needed data and proceeded to generate random values and execute the optimisation routine aiming at minimising total costs considered. The results obtained were then collected in text files to facilitate statistical treatment.
For the purposes of this research, the logistic network total cost encompasses costs to resupply the warehouses (e.g., transportation from factory to warehouses), product distribution costs (e.g., transportation from warehouses to consumer markets), inventory holding costs (e.g., related to cycle, safety and in transit stocks), and costs related to GHG emissions resulting from transportation activities.
Our model is a non-capacitated location problem, as the capacity of warehouses does not appear to be a constraint in the mathematical formulation.
The solution of the problem is one that minimises the total cost of operating the network defined in our objective function, subject to the constraint of meeting the consumer market demand. Our objective function is in equation (1) below.
Resup / 2 Network Dist CS OPl SS SIT COTC TC TC TC TC TC TC= + + + + + (1)
where
TCNetwork total cost of operating the network
TCResup cost of resupplying warehouses
TCDist distribution cost
TCCS/OPl order placement and cycle stock-related cost
TCSS safety stock-related cost
TCSIT in transit stock-related cost
TCCO2 cost of carbon emissions in transportation.
For that purpose, the following premises are assumed:
1 the location of the factory is fixed and predetermined
2 the locations of the consumer markets are fixed and predetermined
3 the possible locations of the warehouses are finite and predetermined
4 the number of warehouses is finite and, at most, equal to the number of possible locations
5 there is only one product to be transported and stocked in the network
6 the demands of the markets are independent random variables, with non-null correlations and standard deviations
662 P. Wanke et al.
7 the resupply lead times between the factory and the warehouses are independent random variables, with non-null standard deviations
8 the distribution lead times between the warehouses and the markets are independent random variables
9 cross-filling is allowed; that is, markets may be served by more than one warehouse
10 cycle and safety stocks are considered in the warehouses
11 in-transit stocks are considered in resupply and distribution transportation
12 stocks are not considered at the factory or at the consumer market levels
13 the service levels required by each market are considered in the form of a predetermined safety factor (same for all warehouses) that guarantees a certain probability of product availability (or put another way, of stock-outs not happening)
14 the stock management model considered for the warehouses is reorder point (ROP) with economic order quantity (EOQ)
15 the unit resupply cost is determined as a function of the lead time between the factory and each warehouse, being measured in $/unit.day
16 the unit transportation cost between a certain warehouse and a certain market depends on the distance between them, being measured in $/unit
17 multimodal transportation is not allowed
18 only carbon emissions are considered in transportation activities
19 carbon emission factors are based on product weight and travelled distance, being measured in kgCO2/ton.kilometre
20 the unit cost of carbon emission is measured in $/kgCO2.
As previously explained in our ‘objective’ section, our mathematical formulation was developed by extending the one proposed by Wanke (2009) and Wanke and Saliby (2009): we included the consideration of costs of in-transit stock and costs of carbon emission in transportation. The latter is based on a proposition by Chaabane et al. (2008a) for determining the environmental impact of a logistic networks design. The following notations are utilised in the proposed model:
n set of consumer markets
m set of potential warehouses
i, l index of one market; i, l = {1, …, n}
j index of a possible warehouse in the network; j = {1, …, m}
Aj unit cost of placing an order in warehouse j
Cj unit stock holding cost in warehouse j
Di average demand for market i
ρil correlation between the average demands of markets i and l

Including carbon emissions in the planning of logistic networks 663
Lj average resupply lead time for warehouse j
Lij average of the lead time distribution from warehouse j to market i
σDi standard deviation of demand for market i
σLj standard deviation of resupply lead time for warehouse j
kj safety factor that reflects service level in warehouse j
Tij unit transportation cost in distribution between market i and warehouse j
dj distance between the factory and warehouse j
dij distance between market i and warehouse j
S daily unit resupply cost from factory to warehouses (same for all warehouses)
CE cost per kilogram of carbon emission
α factor that describes carbon emissions by weight and distance
δ product weight.
The decision variable of the proposed model is given by:
Wij percentage of the average demand of market i met by warehouse j, so that 0 ≤ Wij ≤ 1.
The objective function of our nonlinear programming problem is given by equation (2) below:
( )( )
Network 1 1 1 1
1 1
12 21 1 1
212
1
1 1 1 1
Minimise TC
2
2
m n m nj ij i ij ij ij i j i
m nj j ij ij i
n n ij ij ij il Di Diij Dim i i i
j jj nij iLj i
m n m nj j ij i j ij ij ij j j i
j ij ii
SL W D T W D
C A W D
L W σ W W ρ σ σk C
σ W D
C L W D C L W D
CEδ d W D
= = = =
= =
−
= = =
=
=
= = = =
= +
+
++
+
+ +
+
∑ ∑ ∑ ∑∑ ∑
∑ ∑ ∑∑
∑∑ ∑ ∑ ∑
α ( )1 1 1 1
m n m nij ij ij j i
d W D= = = =
+∑ ∑ ∑ ∑
(2)
subject to
1
1 ,m
ij ij
W=
= ∀∑
(This condition guarantees that the market demand is met) where
1 1,
m nj ij ij i
SL W D= =∑ ∑
664 P. Wanke et al.
is the resupply cost of the warehouses
1 1,
m nij ij ij i
T W D= =∑ ∑
is the distribution cost of the markets
1 12 ,
m nj j ij ij i
C A W D= =∑ ∑
is the cycle stock holding cost and the order placement cost
( )( )
12 21 1 1
213
1
2,
n n ij ij lj il Di Dlij Dim i i i
j jj nij iLj i
L W σ W W ρ σ σk C
σ W D
−
= = =
=
=
+
+
∑ ∑ ∑∑
∑
is the safety stock holding cost
1 1 1 1
,m n m n
j j ij i j ij ij ij i j i
C L W D C L W D= = = =
+∑∑ ∑∑
is the in-transit stock holding cost
( )1 1 1 1,
m n m nj ij i ij ij ij i j i
CEδ d W D d W D= = = =
+∑ ∑ ∑ ∑α
is the carbon emission cost in transportation. As noted before, by incorporating the holding costs – cycle, safety and in-transit –
into the planning of sustainable logistic networks, the proposed model differs from and extends upon others found in literature. These either do not take the aforementioned costs into account or consider them in an excessively simplified manner. Additionally, by including carbon emission costs in the objective function, this research contributes to a better understanding of the trade-offs that may exist between logistic costs and environmental impact.
Regarding environmental variables, the emission factors and carbon emission costs utilised in the calculation of the total cost of carbon emissions were chosen through the observation of their test values, as suggested by Chaabane et al. (2008a).
Product weight, in turn, was estimated based on information about cost of goods sold (CGS) and cost ‘density’ from six Brazilian industrial sectors, found in Wanke (2001a) and Pereira and Wanke (2004). Although we are using a hypothetical logistic network, all the conditions we took into account are absolutely plausible and typical of the Brazilian reality.
The model outputs also allow the assessment of inventory allocation policies – how markets are supplied from warehouses, as described in Wanke (2009) and Wanke and Saliby (2009). In general terms, inventory allocation policies may be characterised as being of three types: inventory centralisation, cross-filling (or regular transshipment), and independent systems.
With inventory centralisation, a single warehouse services all markets, while with cross-filling, a market can be supplied from a main warehouse and from secondary
Including carbon emissions in the planning of logistic networks 665
warehouses at farther locations. An independent system implies that markets are supplied exclusively from dedicated warehouses.
When the number of warehouses increases in the logistic network, hybrid policies such as mixed and sub-centralisation may emerge. With sub-centralisation for instance, inventory centralisation necessarily coexists with cross-filling and/or independent systems; that is, part of the markets are supplied from a single warehouse, while the remaining markets are either serviced by other primary and secondary warehouses or exclusively by one of them. Alternatively, a mixed inventory allocation policy accounts for any combination of inventory centralisation, cross-filling, and independent systems taken in two by two.
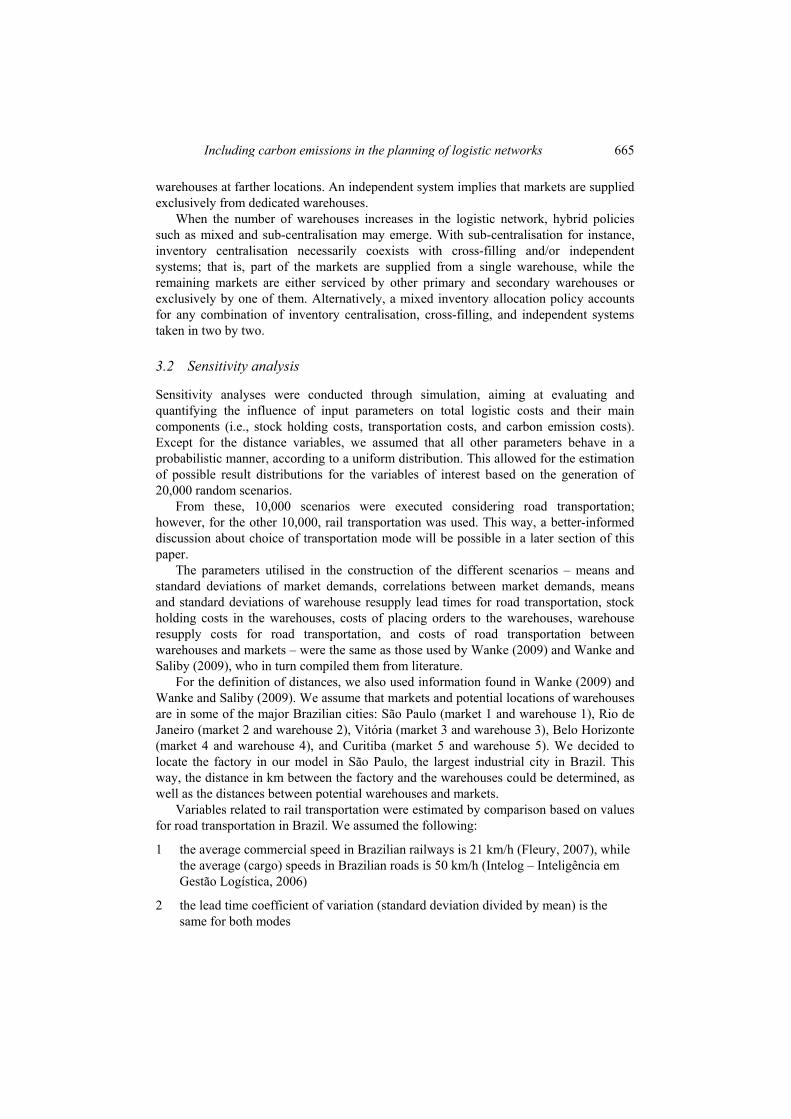
3.2 Sensitivity analysis
Sensitivity analyses were conducted through simulation, aiming at evaluating and quantifying the influence of input parameters on total logistic costs and their main components (i.e., stock holding costs, transportation costs, and carbon emission costs). Except for the distance variables, we assumed that all other parameters behave in a probabilistic manner, according to a uniform distribution. This allowed for the estimation of possible result distributions for the variables of interest based on the generation of 20,000 random scenarios.
From these, 10,000 scenarios were executed considering road transportation; however, for the other 10,000, rail transportation was used. This way, a better-informed discussion about choice of transportation mode will be possible in a later section of this paper.
The parameters utilised in the construction of the different scenarios – means and standard deviations of market demands, correlations between market demands, means and standard deviations of warehouse resupply lead times for road transportation, stock holding costs in the warehouses, costs of placing orders to the warehouses, warehouse resupply costs for road transportation, and costs of road transportation between warehouses and markets – were the same as those used by Wanke (2009) and Wanke and Saliby (2009), who in turn compiled them from literature.
For the definition of distances, we also used information found in Wanke (2009) and Wanke and Saliby (2009). We assume that markets and potential locations of warehouses are in some of the major Brazilian cities: São Paulo (market 1 and warehouse 1), Rio de Janeiro (market 2 and warehouse 2), Vitória (market 3 and warehouse 3), Belo Horizonte (market 4 and warehouse 4), and Curitiba (market 5 and warehouse 5). We decided to locate the factory in our model in São Paulo, the largest industrial city in Brazil. This way, the distance in km between the factory and the warehouses could be determined, as well as the distances between potential warehouses and markets.
Variables related to rail transportation were estimated by comparison based on values for road transportation in Brazil. We assumed the following:
1 the average commercial speed in Brazilian railways is 21 km/h (Fleury, 2007), while the average (cargo) speeds in Brazilian roads is 50 km/h (Intelog – Inteligência em Gestão Logística, 2006)
2 the lead time coefficient of variation (standard deviation divided by mean) is the same for both modes
666 P. Wanke et al.
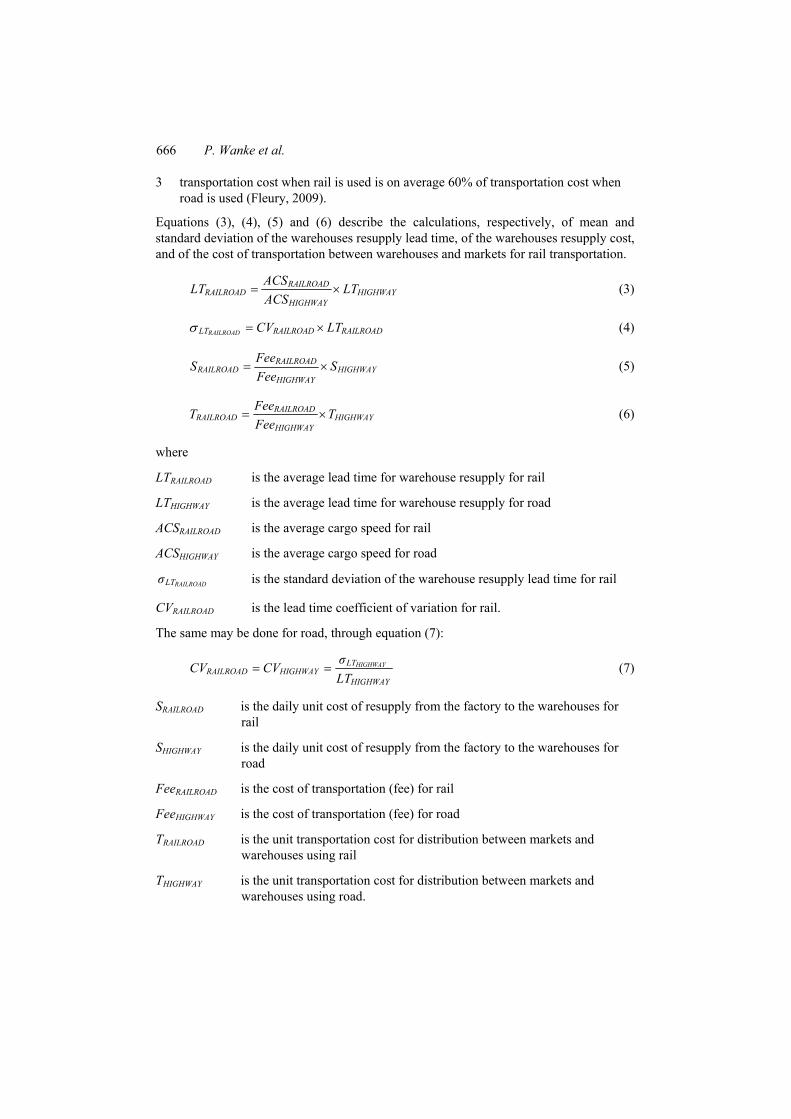
3 transportation cost when rail is used is on average 60% of transportation cost when road is used (Fleury, 2009).
Equations (3), (4), (5) and (6) describe the calculations, respectively, of mean and standard deviation of the warehouses resupply lead time, of the warehouses resupply cost, and of the cost of transportation between warehouses and markets for rail transportation.
RAILROADRAILROAD HIGHWAY
HIGHWAY
ACSLT LTACS
= × (3)
RAILROADLT RAILROAD RAILROADCV LT= ×σ (4)
RAILROADRAILROAD HIGHWAY
HIGHWAY
FeeS SFee
= × (5)
RAILROADRAILROAD HIGHWAY
HIGHWAY
FeeT TFee
= × (6)
where
LTRAILROAD is the average lead time for warehouse resupply for rail
LTHIGHWAY is the average lead time for warehouse resupply for road
ACSRAILROAD is the average cargo speed for rail
ACSHIGHWAY is the average cargo speed for road
RAILROADLTσ is the standard deviation of the warehouse resupply lead time for rail
CVRAILROAD is the lead time coefficient of variation for rail.
The same may be done for road, through equation (7):
HIGHWAYLTRAILROAD HIGHWAY
HIGHWAY
σCV CVLT
= = (7)
SRAILROAD is the daily unit cost of resupply from the factory to the warehouses for rail
SHIGHWAY is the daily unit cost of resupply from the factory to the warehouses for road
FeeRAILROAD is the cost of transportation (fee) for rail
FeeHIGHWAY is the cost of transportation (fee) for road
TRAILROAD is the unit transportation cost for distribution between markets and warehouses using rail
THIGHWAY is the unit transportation cost for distribution between markets and warehouses using road.
Including carbon emissions in the planning of logistic networks 667
Below are the questions the model intends to answer:
• Question 1: How many warehouses should be opened in the distribution network?
• Question 2: Where should the warehouses be located?
• Question 3: What proportion of each market should be allocated to be served by a certain warehouse?
• Question 4: What are the optimal levels of cycle and safety stocks to be held in each facility?
• Question 5: How likely is each of the stock allocation policies?
• Question 6: For each stock allocation policy, how do the transportation modes perform?
• Question 7: What is the influence of the environmental variables considered in the optimisation of the logistic network?
• Question 8: What is the impact of the different modes of transportation on the cost of the network?
For each scenario, the AIMMS software provided the number of warehouses opened in the network and respective locations, the proportion of allocation of markets to warehouses, and the optimal levels of cycle and safety stocks to be maintained in each facility. These answer questions 1 through 8 above.
Subsequently, non-parametric tests were conducted to explore the differences between the two transportation modes: road and rail. Not only were the input and output variables of the model tested, but also some secondary variables were calculated from them. The analysis was based on two considerations. The first consideration was the analysis of stock allocation policies – 20,000 scenarios were grouped according to the stock allocation policy adopted in the optimisation. For each policy, tests were conducted to verify how the modes of transportation performed according to the parameters utilised in the sensitivity analysis. The second consideration was a total cost analysis – 10,000 scenarios were generated for each mode and a case-by-case comparison of the total logistic cost of road versus rail was performed. In the 10,000 scenarios, the input parameters whose uniform distributions did not depend on the mode of transportation utilised were identical. For each scenario, the mode of transportation with the lowest total cost was selected. This allowed for an evaluation of the impact of each mode of transportation on the global cost of the logistic network.
We opted for non-parametric methods because they do not assume normal distribution for the analysed data (Ho, 2006). Specifically in this research, the Kruskal-Wallis and median tests were applied, with the aid of the IBM SPSS Statistics 20 software.
The Kruskal-Wallis test is the non-parametric alternate to analysis of variance (ANOVA) and its purpose is to compare more than two independent samples. It has to satisfy the following conditions (Ho, 2006): independence and randomness of data; ordinal scales; dataset containing at least five observations so that chi-square (χ2) can be used.
668 P. Wanke et al.
The null hypothesis tested is that the populations from which the samples originate have identical distribution functions. When the test leads to statistically significant results (p < 0.05), the null hypothesis is rejected and the conclusion is that at least one of the samples comes from a different population (Ho, 2006).
The Kruskal-Wallis test, however, only points to the existence of a statistically significant difference between the groups, without quantifying such difference. For that purpose, the median test was conducted, whose tested null hypothesis is that the medians of the populations from which the samples originate are identical.
4 Results
4.1 Stock allocation policy
For each of the 20,000 random scenarios generated, the AIMMS software satisfactorily found the optimal configuration of the network, guaranteeing the minimal global value of the network total cost. As previously described, the scenario analysis was split between different transportation modes – 10,000 scenarios for road and 10,000 for rail – to enable a better understanding of the impact that the use of alternate transportation types may have on the configuration and costs of the logistic network. For example, would the reduction in CO2 emissions obtained from the utilisation of the rail mode be enough to offset the increase in stocks resulting from its longer delivery lead times?
Based on the results, the model proposed in this study presents a tendency toward the decentralisation of stocks for both modes of transportation. In 6,296 of the 10,000 scenarios in which the road option was used, the optimal solution led to the adoption of mixed policy. In the same way, a mixed policy also was determined by the model to optimise network costs in 5,629 cases when rail was used.
For the other scenarios, the optimal solutions pointed to total centralisation (with 3,652 road cases and 4,370 rail cases). The independent systems policy totalled 52 road scenarios and 1 rail scenario.
The predominance of the mixed policy over total centralisation may indicate that the reduction in safety stock levels resulting from centralisation in one single location is not enough to offset the increase in expenses with transportation and higher levels of in-transit stock (Wanke, 2001a). To reduce such costs, maintaining multiple stock points along the distribution network becomes more interesting.
It is important to highlight, however, that sub-centralisation was observed in all mixed-policy scenarios for both road and rail. This supports Wanke’s (2009) and Wanke and Saliby’s (2009) statement that, in more complex networks, the reduction of uncertainties related to market demand and warehouses (resupply) lead times should be explored as much as possible.
The independent systems policy, characterised by the total absence of risk-pooling from centralisation (each market is exclusively served by one dedicated warehouse), was predominant in a few scenarios, although whenever the mixed policy was recommended a relevant level of decentralisation was frequently verified. According to Das and Tyagi (1997), this policy may be associated with the minimisation of distribution costs by each warehouse satisfying the geographically nearest consumer markets. As an extension, we could also hypothesise that the more decentralised system policies may also be associated with the attempt to minimise costs of stock in transit through the allocation of markets to
Including carbon emissions in the planning of logistic networks 669
warehouses that have lower distribution lead times, or, even, with the attempt to minimise carbon emission costs through the reduction of travelled distances.
The total cross-filling policy, in which all the markets are served by all the warehouses, did not occur in any of the randomly generated scenarios. Also, the occurrence of cross-filling associated with other stock allocation policies was not relevant for either mode of transportation. Most likely, the gains obtained from the reduction in safety stocks when employing this policy in more complex networks were not enough to offset an increase in the costs of cycle and in-transit stocks and in distribution costs. This is in line with what was suggested by Wanke (2009) and Wanke and Saliby (2009).
Another aspect that merits attention is the larger number of total centralisation occurrences in rail scenarios, in comparison with road scenarios. This may seem counterintuitive. This is because, according to Wanke (2001a), centralisation of stocks is more indicated for products with high value density, low turnover and low weight and volume – characteristics that better match the utilisation of the road mode (Wanke, 2010). Decentralisation, on the other hand, is favoured by products with low value density, high turnover and considerable weight or volume, attributes that better match the utilisation of the rail mode (Wanke, 2001b; Wanke, 2010).
One possible justification for the result we found might be the longer transit-time inherent to rail operations. CO2 emissions tend to grow proportionally with the distance and/or transit time, thus favouring the choice of less-polluting modes such as rail for long-haul transportation.
4.2 Total cost analysis
Only part of the story is told by the behaviour of performance variables related to stock allocation policy when we consider different stock allocation policies while the logistic network utilises different modes of transportation. If we want to find the optimal network configuration, we should also search for solutions that minimise the total network costs involved. Again, the scenario-by-scenario comparison of the road and rail cases allowed us to define which mode resulted in lowest total cost.
In 9,805 of the 10,000 simulated scenarios, the road mode resulted in the minimisation of total network costs. In the other 195 scenarios, total costs were minimised when rail was utilised. This result is in line with Pereira and Wanke’s (2004) conclusions. The authors analysed six major industrial sectors of the Brazilian economy and concluded that for those sectors the road mode is preferable to the rail mode in terms of total costs. Obviously, this is not a conclusion that can be generalised because of the specifics of the Brazilian transportation infrastructure and corresponding costs.
According to the literature (e.g., Wanke, 2010), the utilisation of the road mode is favoured in circumstances where the volume and/or total weight to be transported is small, the value density of the products is high, and the coefficient of variation of sales and supply (as in the case of unreliable suppliers, carriers and production processes) are high. Under these conditions, the higher level of responsiveness of the road mode seems to be more appropriate.
The rail mode, on the other hand, would be preferable in situations where the main goal is the exploration of economies of scale in transportation, where the volume and/or total weight to be transported is higher, the product has lower value density and the variability of sales and supply are low (Wanke, 2010).
670 P. Wanke et al.
Considering the environmental aspect, Chaabane et al. (2008a) point out that, in scenarios where carbon emission costs are low, the preferred mode of transportation should be the one with smallest total logistic cost. As emission costs increase, the preferred options start to tilt towards less-polluting modes.
In our research, for the road cases, the carbon emission cost and the total weight of the product transported in the optimised logistic network are both relatively low when compared to rail cases. The fact that there is a statistically significant difference between the medians of these variables indicates that environmental parameters affect the optimisation of the logistic network – and, consequently, the decision about transportation mode – although, maybe to a lesser extent than other variables of the model.
Finally, as expected, out of the cost components that displayed statistically significant differences between medians, distribution, transportation (resupply and distribution), cycle stock and carbon emission costs are higher in cases where road is utilised. Conversely, the safety stock and stock in transit costs are higher in the rail option.
All aspects considered, the road option resulted in lower total logistic network costs, at least for the cost elements and parameters considered in this study. Although transportation costs are higher in the road option, the inclusion of other costs in the analysis, such as stock and emissions, may paint a richer and different picture. The lack of a more comprehensive analysis of the total logistic network costs may lead to wrong or sub-optimal decisions regarding the choice of transportation mode to be utilised in the network.
For the situation analysed in this research, for instance, even with lower transportation costs, the rail mode results in higher total logistic network costs because of the high levels (and corresponding costs) of stocks held in the network to compensate for the long and sometimes uncertain transit times.
Our results provide important insights to decision makers and demonstrate the importance of robust logistic network planning in the current business environment.
From a managerial perspective, the proposed model provides a method through which strategies about facility location, stock allocation and transportation may be more comprehensively evaluated by a company.
The inclusion of carbon emission costs in the network optimisation strategy adds a new factor to the traditional challenge of balancing the trade-off between stocks and transportation in the supply chain. This model can also be useful for managers to evaluate the impact of carbon price variation on their supply chains.
Although the taxation of carbon emissions in transportation is not yet a reality in the Brazilian business environment, future regulations will most likely try to force emission reductions through tax penalties and charges, for example. Companies will then need to rethink their operations in order to meet new legal demands. In this context, non-parametric test results for the analysis of total costs may help managers to adjust their supply chains by revealing the characteristics of the products and of the operation that are more appropriate for the use of each mode of transportation.
5 Conclusions
Our results indicate that the inclusion of carbon emission costs in the planning of logistic networks is important for the Brazilian reality.
Including carbon emissions in the planning of logistic networks 671
Also, based on our sensitivity analyses, we confirmed some results that do not depend on the inventory policy adopted and that reflect the operation characteristics of the transportation options taken into account in this study. For instance, the resupply (explained when we presented the model details), the distribution lead times, and the standard deviation of the resupply lead time presented higher values with the rail option, whereas the unit distribution transportation costs, the unit resupply costs and the carbon emissions presented higher rates with the road transportation option. In fact, we realised that transportation costs and CO2 emissions ultimately overshadow the cost of inventory, and that due to the level of ‘inefficiency’ of Brazilian railroads (reflected in reduced average speeds), the Brazilian focus is still on transportation being done by road.
Discussing the simulation results more specifically, when a mixed-inventory allocation policy is adopted, the road option leads to lower stock holding costs in the warehouses and higher unit CO2 emission costs, product weight, resupply lead times and stock holding costs when compared to rail. On the other hand, in the total centralisation cases, the road option results in higher stock holding costs, lower unit carbon emission cost and product weight in relation to the rail mode. This happens because transit times are so much longer with the rail option when compared to road.
The analysis and optimisation of total logistic network costs allowed us to evaluate the impact of each mode of transportation on the global costs of the network. We found that, at least considering the parameters used in this research, the utilisation of the road option results in the minimisation of total costs in 98% of the simulated scenarios. Such finding supports the notion that the consideration of ‘total costs’ is of paramount importance for the design of logistic networks. Given the alternative transportation modes, the best choice will be the one that best combines the direct cost of utilising the specific mode and the indirect effect of such utilisation on the costs of stocks in the logistic distribution channel. Our results also demonstrate that when a company faces high stock holding costs associated with low weights and lower unit carbon emission costs, the road mode is preferable. As emission costs and weights of transported products increase, and as stock holding costs decrease, the use of the rail option becomes preferable.
However, in our sensitivity analysis, moderate increases in carbon emission cost did not prove to be sufficient to make the rail mode more attractive than the road mode in terms of total cost in almost all tested scenarios. Therefore we believe that it is unlikely that the imposition of carbon emissions-related taxation (at least within a plausible range) in the future will by itself be effective in causing the reduction of CO2 emissions. We believe that in order to cause a substantial reduction in companies’ supply chain carbon footprint without jeopardising their overall operations performance, it is necessary to incentivise technological innovation and progress in the transportation industry so that emissions levels of all transportation modes are reduced.
5.1 Limitations
Although this research advances the current knowledge about logistic network design by simultaneously considering stock and transportation (including carbon-related) costs as components of its objective function, our model has a limitation in terms of not suggesting the choice of the best transportation mode. Rather, it assumes the use of a certain transportation mode as a previous step to optimisation. In an attempt to overcome
672 P. Wanke et al.
this limitation while maintaining the ability to evaluate important trade-offs between different transportation modes, sensitivity analyses were conducted for two test groups, each one representing a transportation option: road and rail.
Another limitation refers to the modelled ‘reality’. We used Brazil as our hypothetical case with all its corresponding characteristics (e.g., continental distances between cities, low speeds for road and rail due to poor infrastructure). Although some of the findings may be generalisable to other ‘realities’, some probably may not. For instance, we are not confident that the same results would be obtained if we used the Western European reality, with urban centres located much closer to each other, shorter distances, faster transportation and much more density in the rail network.
It is important to be cautious when considering the generalisability of our model – after all, we modelled a Brazilian case with its particular characteristics. We recommend that other studies be performed where other conditions – representative of other environments and geographies – are modelled so that results can be compared and contrasted with those of our study.
It is also important to note that our model assumes that there is only one product being transported and stored in the network. This assumption is relevant because as a consequence of it in our model, the greater the safety stock in the network, the higher the level of service and thus the higher the sales. However, many real-life distributors, wholesalers and retailers may have cash and space limitations, which means that the higher the safety stock for a given product, the less cash and physical space will be available for other products, thereby potentially jeopardising their sales. In other words, increases in inventory levels could even reduce instead of increase sales.
Additionally, we modelled a product with long shelf life; however, products with short shelf life or life cycle could have their sales negatively affected by high stock levels. The relaxation of our assumptions regarding the distribution of just one product in the network and of having a product with long shelf life could lead to different results, as more frequent replenishments could allow not only lower inventory levels but also higher sales.
5.2 Opportunities for further research
We would recommend as possible future research that an extension to this model be built – one that is capable of including the decision about the transportation option to be utilised. This would be important to further our understanding about how to best balance the trade-offs between the various cost elements. Such extension would increase the practical applicability of the model by simplifying the analyses. It would eliminate the need for an additional round of tests for each evaluated transportation mode.
While incorporating the decision about mode choice into the model, it would be desirable to build more flexibility into it so that this decision could be made for each transportation segment in the supply chain.
This way, the model could suggest the utilisation of a certain mode in the transportation from the factory to the warehouse and another one from the warehouse to the market. Similarly, contemplating multimodal options of transportation would also be interesting as it would provide the model with greater capacity to reflect the reality of logistic operations in practice.

Including carbon emissions in the planning of logistic networks 673
Regarding the environmental aspect, the quantification of carbon emissions in this work was limited to transportation activities; however, emissions resulting from other pollution sources in the distribution network – such as factories and warehouses – could also be integrated into the proposed model, allowing for a broader evaluation of the role played by supply chains in environmental stewardship.
Finally, it would be interesting to apply this model to other ‘realities’ such West Europe to test the robustness of our conclusions.
Acknowledgements
We would like to acknowledge Vanderlei Affonso Martins, PhD student at COPPE/UFRJ, for his insightful comments during the paper.
References
Andersen, M. and Skjoett-Larsen, T. (2009) ‘Corporate social responsibility in global supply chains’, Supply Chain Management: An International Journal, Vol. 14, No. 2, pp.75–86.
Beamon, B.M. (1999) ‘Designing the green supply chain’, Logistics Information Management, Vol. 12, No. 4, pp.332–342.
Bowman, R.J. (1995) ‘Green logistics’, Distribution, Vol. 94, No. 6. Butner, K., Geuder, D. and Hittner, J. (2014) ‘Mastering carbon management: balancing tradeoffs
to optimize supply chain efficiencies’, IBM Global Business Services [online] http://www-935.ibm.com/services/uk/bcs/pdf/mastering_carbon_management.pdf (accessed 24 January 2014).
Carter, C.R. and Rogers, D.S. (2008) ‘A framework of sustainable supply chain management: moving toward new theory’, International Journal of Physical Distribution & Logistics Management, Vol. 38, No. 5, pp.360–387.
Chaabane, A., Benkaddour, M.A., Ramudhin, A. and Paquet, M. (2008a) ‘An integrated logistics model for environmentally conscious supply chain network design’, Proceeding of the Fourteenth Americas Conference on Information Systems, pp.1–13, Toronto.
Chaabane, A., Ramudhin, A., Kharoune, M. and Paquet, M. (2008b) ‘Trade-offs model for carbon market sensitive green supply chain network design’, Proceeding of the Sixth Annual International Symposium on Supply Chain Management, Calgary, Alberta, Canada, 15–17 October.
Corrêa, H.L. and Xavier, L.H. (2013) ‘Concepts, design and implementation of reverse logistics systems for sustainable supply chains in Brazil’, Journal of Operations and Supply Chain Management, Vol. 6, No. 1, pp.1–25.
Das, C. and Tyagi, R. (1997) ‘Role of inventory and transportation costs in determining the optimal degree of centralization’, Transportation Research Part E (Logistics and Transportation Review), Vol. 33, No. 3, pp.171–179.
Dekker, R., Fleischmann, M., Inderfurth, K. and van Wassenhove, L.N. (Eds.) (2004) Reverse Logistics: Quantitative Models for Closed-Loop Supply Chains, Springer, London.
Dyckhoff, H., Lackes, R. and Reese, J. (Eds.): Supply Chain Management and Reverse Logistics, Springer, London.
Ferretti, I. et al. (2007) ‘Greening the aluminium supply chain’, International Journal of Production Economics, Vol. 108, Nos. 1–2, pp.236–245.
674 P. Wanke et al.
Fleishmann, M., Beullens, P., Bloemhof-Ruwaards, J.M. and Van Vassenhove, L. (2001) ‘The impact of product recovery on logistics network design’, Production and Operations Management, Vol. 10, No. 2, pp.156–173.
Fleury, P.F. (2007) ‘Ferrovias brasileiras – dez anos de privatização’, Revista Tecnologística, abr, Vol. 20, No. 4, pp.68–71, São Paulo.
Fleury, P.F. (2009) ‘PAC e a infraestrutura brasileira’, Fórum Internacional de Logística, Vol. 15, Rio de Janeiro.
Gladwin, T.N., Kennelly, J.J. and Krause, T. (1995) ‘Shifting paradigms for sustainable development: implications for management theory and research’, Academy of Management Review, Vol. 20, No. 4, pp.874–907.
Ho, R. (2006) Handbook of Univariate and Multivariate Data Analysis and Interpretation with SPSS, Chapman & Hall/CRC, Boca Raton.
Intelog – Inteligência em Gestão Logística (2006) A velocidade média de um caminhão no Brasil é 60% menor do que nos EUA [online] http://www.intelog.net/site/default.asp (accessed 24 January 2014).
Jennings, P.D. and Zandbergen, P.A. (1995) ‘Ecologically sustainable organizations: an institutional approach’, Academy of Management Review, Vol. 20, No. 4, pp.1015–1052.
Kelly, J.A., Ryan, L., Casey, E. and O’Riordan, N. (2009) ‘Profiling road transport activity: emissions from 2000 to 2005 in Ireland using national car test data’, Transport Policy, August, Vol. 16, No. 4, pp.183–192.
Kleindorfer, P.R., Singhal, K. and Van Wassenhove, L.N. (2005) ‘Sustainable operations management’, Production and Operations Management, Vol. 14, No. 4, pp.482–492.
Loo, B.P. and Li, L. (2012) ‘Carbon dioxide emissions from passenger transport in China since 1949: implications for developing sustainable transport’, Energy Policy, November, Vol. 50, pp.464–476.
Paksoy, T., Özceylan, E. and Weber, G-H. (2011) ‘A multi objective model for optimization of a green supply chain network’, Global Journal of Technology & Optimization, Vol. 2, No. 1, pp.84–96.
Pati, R.K., Jans, R. and Tyagi, R.K. (2013) ‘Green logistics network design: a critical review’, 24th Annual Conference of the Production and Operations Management Society (POMS), Denver, USA, 3–6 May.
Pereira, L.A.P. and Wanke, P.F. (2004) ‘Shipexplorer: ferramenta de análise dos efeitos dos modais de transporte no dimensionamento do estoque de segurança e nos custos logísticos totais’, Encontro Nacional de Engenharia de Produção, Florianópolis. Anais, Vol. 24, pp.834-840, ABEPRO, Florianópolis.
Pérez-López, P., Gasol, C.M; Oliver-Solà, J., Huelin, S., Moreira, M.T. and Feijoo, G. (2013) ‘Greenhouse gas emissions from Spanish motorway transport: key aspects and mitigation solutions’, Energy Policy, September, Vol. 60, pp.705–771.
Ramundhin, A., Chaabnane, A., Kharoune, M. and Paquet, M. (2008) ‘Carbon market sensitive green supply chain network design, 2008’, Proceedings of the IEEE International Conference on Industrial Engineering and Engineering Management (IEEM), Singapore, 8–11 December.
Shapiro, J.F. (2001) Modeling the Supply Chain, 2nd ed., Duxbury Resource Center, USA. Srivastava, S.K. (2007) ‘Green supply-chain management: a state-of-the-art literature review’,
International Journal of Management Reviews, Vol. 9, No. 1, pp.53–80. Starik, M. and Rands, G.P. (1995) ‘Weaving an integrated web: multilevel and multisystem
perspective of ecologically sustainable organizations’, Academy of Management Review, Vol. 20, No. 4, pp.908–935.
Wang, Y., Zhu, X., Lu, T. and Jeeva, A.S. (2013) ‘Eco-efficient based logistics network design in hybrid manufacturing/ remanufacturing system in low-carbon economy’, Journal of Industrial Engineering and Management, Vol. 6, No. 1, pp.200–214.
Wanke, P.F. (2001a) ‘Estratégias para gerenciamento do risco de manter estoques’, Revista Tecnologística, abr, pp.62–68, São Paulo.
Including carbon emissions in the planning of logistic networks 675
Wanke, P.F. (2001b) ‘Estratégia de posicionamento logístico – conceitos, implicações e análise da realidade brasileira’, Revista Tecnologística, dez, pp.44–54, São Paulo.
Wanke, P.F. (2009) ‘Consolidation effects and inventory portfolio’, Transportation Research Part E (Logistics and Transportation Review), Vol. 45, No. 1, pp.107–124.
Wanke, P.F. (2010) Logística e Transporte de Carga no Brasil: Produtividade e Eficiência no Século XXI, Atlas, São Paulo.
Wanke, P.F. and Saliby, E. (2009) ‘Consolidation effects: whether and how inventories should be pooled’, Transportation Research Part E (Logistics and Transportation Review), Vol. 45, No. 5, pp.678–692.
WEA – World Economic Forum (2008) Supply Chain Decarbonization: The Role of Logistics and Transport in Reducing Supply Chain Carbon Emissions, Accenture [online] https://microsite.accenture.com/sustainability/Pages/supply_chain_decarbonization.aspx (accessed 24 January 2014).
Xavier, L.H. and Correa, H.L. (2013) Sistemas de Logística Reversa, Atlas, São Paulo. Zhang, C. and Nian, J. (2013) ‘Panel estimation for transport sector CO2 emissions and its affecting
factors – a regional analysis in China’, Energy Policy, Vol. 63, December, pp.918–926.