incision and channel morphology across active structures
TRANSCRIPT

1192
ABSTRACT
River morphology and dynamics are strongly infl uenced by active tectonics. We report channel dynamics for the Peikang River, which fl ows through the Hsuehshan Range in central Taiwan. Using a digital ele-vation model and fi eld surveys, we constrain channel morphology for an ~90 km stretch of river to calculate unit stream power and boundary shear stress along the river path. Incision rates are estimated with optically stimulated luminescence dating of sand de-posited on strath terraces. We fi nd a strong correlation between unit stream power/shear stress and incision rate, but only if variation in channel width is considered. A calibrated river incision rule implies river incision rates of ~9–13.5 mm/yr upstream of the Meiyuan and Tili faults and suggests that one or both of these structures are pres-ently active. Our results indicate that the Shuilikeng fault is also actively deforming, as incision rates increase to ~6–10 mm/yr across it, compared to 1–4 mm/yr in adja-cent reaches. Prominent narrowing across the Shuilikeng fault, and the absence of signifi cant gradient variation indicate that channel width is a fi rst-order morphologi-cal adjustment to differential incision. Only when the channel width-to-depth ratio reaches a minimum does the channel slope signifi cantly adjust to local changes in base level, as is the case upstream of the Meiyuan and Tili faults.
INTRODUCTION
Analysis of stream morphology has proven valuable for mapping differential rock uplift rela-tive to a fi xed datum such as the geoid (Pazzaglia and Brandon, 2001; Kirby and Whipple, 2001; Lave and Avouac, 2001; Whipple and Tucker, 1999; Wobus et al., 2006a). The approach builds upon the idea that channel morphology mirrors the erosion rate of the stream (Howard and Kerby, 1983). In areas where channel inci-sion roughly balances the rate of rock uplift, spatial variations in channel morphology (after properly accounting for factors such as drain-age area and lithology) indicate corresponding variations in rock-uplift rate. Full realization of the potential of this method requires a deeper understanding of how and why channels adjust to differential rock uplift. To help illuminate the dynamics of a channel fl owing over zones of differential rock uplift, we have documented channel morphology and incision rate for a river crossing a number of thrust faults in central Tai-wan. We focus on this region because it repre-sents a natural experiment in bedrock incision where differential rock uplift associated with active slip on an array of thrust faults occurs in response to ~40 mm/yr of crustal shortening (Simoes and Avouac, 2006). By quantifying the relationship between channel morphology and incision rate for a river crossing a number of these faults, we seek to add to the growing data set that characterizes patterns of Holocene strain in west-central Taiwan.
Rivers serve as effi cient conduits for water traversing a potential energy gradient. As water fl ows through these conduits, it loses potential energy. Most of a river’s potential energy is ex-pended as heat and work, and some of the latter
drives sediment transport and erosion of bed-rock. For example, energy can be transferred to saltating bed load, which can impact, fracture, and abrade exposed bedrock; it can be dissi-pated via turbulent eddies that can come in con-tact with bedrock and scour it with suspended particles; it can produce pressure fl uctuations that act to lift bedrock and sediment from the bed; or it can exert a shear traction that will slide blocks or pieces of bedrock out of the rock mass or rotate sediment out of place (Whipple et al., 2000). A growing body of literature uses unit stream power (or the rate of energy loss per unit area of the riverbed) and boundary shear stress as proxies for the rate of these erosion processes (Howard and Kerby, 1983; Hancock et al., 1998; Kirby et al., 2003; Lave and Avouac, 2001; Roe et al., 2006; Snyder et al., 2000; Tucker, 2004; Whipple, 2004; Whipple and Meade, 2006; Whipple and Tucker, 1999; Willett, 1999). The magnitude of these hydraulic metrics is a func-tion of two basic morphological parameters of the channel: (1) river slope, which controls the rate at which potential energy is lost, and (2) channel width, which can be considered as a focusing mechanism because it governs the area of bedrock over which the energy is dissipated. It follows that if unit stream power and shear stress are valid proxies for incision rate, and if river incision rate keeps pace with rock-uplift rate, then spatial variations in chan-nel width and slope can indicate where active deformation is occurring.
We mapped the channel morphology and esti-mated incision rates along the Peikang River in central Taiwan to answer the following set of questions: (1) What are the Holocene rates of incision, and how do they vary downstream? (2) Do along-stream variations in incision rate
For permission to copy, contact [email protected]© 2010 Geological Society of America
GSA Bulletin; July/August 2010; v. 122; no. 7/8; p. 1192–1208; doi: 10.1130/B30035.1; 11 fi gures; 2 tables; Data Repository item 2010054.
†E-mail: [email protected]
Incision and channel morphology across active structures along the Peikang River, central Taiwan: Implications for the importance of channel width
Brian J. Yanites1,†, Gregory E. Tucker2, Karl J. Mueller1, Yue-Gau Chen3, Tarka Wilcox1, Shao-Yi Huang3, and Kuo-Wei Shi3
1Department of Geological Sciences, University of Colorado, 2200 Colorado Avenue, Boulder, Colorado 80309, USA2Cooperative Institute for Research in Environmental Sciences and Department of Geological Sciences, University of Colorado, 2200 Colorado Avenue, Boulder, Colorado 80309, USA3Department of Geosciences, National Taiwan University, No. 1, Sec. 4th, Roosevelt Road, Taipei 106, Taiwan, Republic of China

Channel dynamics along the Peikang River, central Taiwan
Geological Society of America Bulletin, July/August 2010 1193
correlate with known faults? (3) Do the inci-sion rates vary systematically with unit stream power or shear stress? (4) Are there system-atic variations in lithology that might account for observed patterns? (5) To what degree are variations in unit stream power and/or shear stress linked to variations of width versus slope, and what does this reveal about mechanisms of channel adjustment?
BACKGROUND
Taiwan
The Island of Taiwan results from an arc-continent collision between the Philippine Sea and Eurasian plates (Fig. 1). The resulting thrust belt has evolved from a subaqueous accretion-ary wedge into a rapidly eroding pair of oppo-sitely verging thrust belts. Our study is limited to the frontal portion of the west-vergent part of the orogen, the so called “pro-wedge” (Willett
et al., 1993). The west-vergent thrust belt has been described as a quintessential example of a critical wedge (Suppe, 2007) in which tectonic and surfi cial processes are balanced to produce a steady-state system with respect to mass fl uxes and gross topographic morphology (Dahlen and Suppe, 1988; Willett and Brandon, 2002).
When only considering the mechanical strength of the deforming lithosphere, this bal-ance results in an analytically predictable criti-cal taper angle between the topographic slope and décollement, or main detachment fault. It has been proposed that in order to maintain the balance between mass coming into the orogen through tectonic processes and erosion export-ing mass out, the topographic slope on the west-ern side of the island is likely maintained by both tectonic underplating and a series of west-verging thrust sheets that accommodate horizon-tal shortening (Chen et al., 2007; Simoes et al., 2007b, 2007c; Yue et al., 2005). The mass added to a deforming wedge through these processes
also occurs partly in response to erosion, which produces sediment that leaves the orogen via river transport (Dahlen and Barr, 1989; Fuller et al., 2006; Simoes et al., 2007a). Although almost all of the proposed models account for material fl ux into the orogen through both fron-tal accretion and underplating, the magnitude and location of the latter process remain under debate (Fuller et al., 2006; Simoes and Avouac, 2006; Simoes et al., 2007a; Yue et al., 2005). A better understanding of the modern-day defor-mation fi eld will help guide the development of future kinematic and tectonic models for this compressive orogen.
Thrust faults on the western side of the island constitute a major piece of the tectonic framework across the collisional plate margin. The rates and styles of deformation along the two westernmost thrust faults, the Changhua and Chelungpu (Fig. 1), have been fairly well studied, and they (1) deform well-dated syn oro-genic strata, the age and stratigraphic growth
((((((((((((((((((((((((((
((((((((((((((((((((((((
((((((((((((((((((((((((
((((((((((((((((((((((((
((((((((((((((((((((((((((
((((
((((
(((((((((((((((((((( (((( (( ((
((((((((
((((((((
((((((((((((((
((((
((((((((((((
((((((((((((((((
((((((((((((((((
((((((((
((
((((((
((((((((((((((((((((((((((((((((((((((((((
((((((((((((((((((((((((
((((
((((((((((((((
200000 220000 240000 260000 2800002640
000
2660
000
2660
000
2680
000
2680
000±
0 7.5 15 22.5 303.75km
Peikang River
Puli Basin
1999 Chichi epicenter
A- ChanghuaB-ChelungpuC-ShuangtungD-ShuilikengE-TapingtingF-MeiyuanG-TiliH-Lishan
A B C D E F G H
Modern late qt. fillPliocene-Pleistocene synorogenic fill
Miocene metaseds
Oligocene metaseds
Oligocene/Eocene metasedsB
ElevationHigh : 3941
Low : 0
±0 25 50 75 10012.5
km
A
AA’
Figure 1. Overview of study area. (A) Hillshade overlaid with a digital elevation model (DEM) for the Island of Taiwan. Black box outlines extent of B. (B) Hillshade and basic geologic map of the study area. West-verging faults and geologic units are taken from Powell (2003). Lithologic boundaries at the top of B defi ne location of the boundaries along the top of the hillshade image. These boundaries follow the faults across the river. Location of cross-section A-A′ in Figure 11 is shown.
Yanites et al.
1194 Geological Society of America Bulletin, July/August 2010
architecture of which constrain fault kinematics (Simoes et al., 2007b); (2) have active deposi-tion in the footwall block (Chen et al., 2004; Lee et al., 2001); and (3) have been monitored by a network of continuous global positioning system (GPS) data (Johnson et al., 2001). Rela-tively less is known about potentially active thrust faults further east, such as the Shuang-tung, Shuilikeng, Meiyuan, and Tili faults (Fig. 1; Powell, 2003), in part because these faults (1) have less-well-preserved geomor-phic features across the structures, (2) are ac-tively eroding across both their footwall and hanging-wall blocks, and (3) are monitored by fewer permanent GPS base stations. These faults, however, likely play a fundamental role in maintaining wedge taper in this region and account for at least some of the horizontal shortening (Mueller et al., 2001; Powell, 2003; Wilcox et al., 2007). Our analysis of channel morphology thus helps to constrain the modern strain fi eld in the Hsuehshan Range by identify-ing active structures.
Peikang River
Located just to the north of the Puli Basin in western Taiwan (Fig. 1B), the Peikang River fl ows almost perpendicular to the structural trend on the island. Unlike other rivers that fl ow through the Puli Basin, the Peikang is bedrock-lined throughout (i.e., it has to erode bedrock to signifi cantly lower its bed elevation or to widen its banks) and is undammed, making it a suit-able river to investigate channel dynamics in response to active deformation in this region of Taiwan. The river headwaters are located in the Eocene-Oligocene metasedimentary rocks of the Lishan valley, formed by the east-verging Lishan thrust (Fig. 1). After fl owing ~20 km along the (longitudinal) Lishan Valley, the river valley narrows and sharply turns to the west, crossing the structural grain of the island and fl owing over Oligocene metasedimentary rocks. Almost immediately downstream of the Meiyuan fault (~44 km downstream of its headwaters), the river valley abruptly widens, and ubiquitous strath terraces line the valley bottoms. The straths are discontinuous but pres-ent throughout. Downstream of the Shuang-tung fault (~km 75), the underlying bedrock is composed of soft synorogenic fi ll, making this reach unsuitable for comparison with upstream reaches. Because the river terraces between the Meiyuan and Shuangtung faults are very discontinuous, often only extending for a few hundred meters along the fl ow path, we turn to channel morphology and dynamics to pinpoint in more detail whether and where deformation is occurring.
Channel Morphodynamics
Slope-Area AnalysisEmpirical evidence shows a strong relation-
ship between channel slope, S, and contrib-uting drainage area, A, for many river basins (Hack, 1957):
S = ksA−θ, (1)
where the concavity, θ, usually is around 0.5 (e.g., Flint, 1974; Tarboton et al., 1989; Tucker and Whipple, 2002). By plotting channel slope and drainage area in log-log space, values of ks (intercept) and θ (graph slope) can be found for the entire basin (Fig. 2A). If we divide local estimates of slope by the contributing drainage area raised to the –θ power, we fi nd a metric of relative channel steepness, ks. This factor, often referred to as a steepness index, can then be mapped along the channel fl ow path to search for strong spatial variations in channel steepness (relative to contributing drainage area). It has been suggested, on both empirical and theoreti-cal grounds, that these variations represent dif-ferences in rock-uplift rate for a steady-state river (one in which the vertical rate of incision equals the rate of rock uplift), assuming a uniform cli-mate and lithology (Whipple and Tucker, 1999). We point the reader to Wobus et al. (2006a) for a more thorough explanation of this method. In these approaches, it is often assumed that chan-nel width scales with contributing drainage area and is not considered as an independent variable that can infl uence the erosive potential of a river.
Unit Stream Power and Shear StressA more direct method of using channel
morphology as an indicator of active defor-mation is to explicitly calculate and map unit stream power and/or boundary shear stress. Since these hydraulic metrics are often used as proxies for incision rate, their variation should refl ect changes in relative rock-uplift rate in a steady-state river system. Further, calibration of the relationship between these metrics and the rate of incision allows one to quantitatively map rock-uplift rate where actual constraints are unavailable.
Since erosion driven by fl uvial processes is a threshold process (Snyder et al., 2003; Tucker, 2004), one can hypothesize that the rate of lowering, E, is proportional to the excess unit stream power, ω, such that
E =kω (ω − ωc ) ω > ωc
0 ω ≤ ω c
, (2)
or to the excess boundary shear stress, τb, such that
E =kτ (τb − τc ) τb > τc
0 τb ≤ τc
, (3)
where kω and kτ are scaling coeffi cients that cur-rently must be calibrated for specifi c climates and lithologies, and ωc and τc are the critical values for incision.
Unit stream power is defi ned as the rate at which energy is dissipated by the fl ow per unit area of the river bed. Assuming steady, uniform fl ow, unit stream power can be calculated from
ω = ρgQw
WS, (4)
where ρ is the density of water, g is the gravita-tional acceleration, Qw is water discharge, and W is channel width. It is often assumed that dis-charge is related to contributing drainage area through a runoff coeffi cient, R,
Qw = RAc. (5)
Shear stress, which for steady, uniform fl ow equals the slope-parallel weight of the fl owing water per unit area, is also a function of cross-section channel geometry. Assuming that chan-nel width is much greater than channel depth, then the shear stress can also be written in terms of discharge, width, and slope,
τb = ρgnQw
W
35
S7
10, (6)
where n is the Manning friction factor (dimen-sions [ = ] T/L1/3). Equations 4 and 6 indicate that hydraulic energy dissipation and stress de-pend on both the gradient and the width of the channel; variations in either or both of these can potentially infl uence the incision rate (Finnegan et al., 2005; Lave and Avouac, 2001; Whittaker et al., 2007).
The next section explains how we calculate channel slope, width, and water discharge for use in unit stream power and shear stress cal-culations. These values are then compared to incision rates to test whether either shear stress or unit stream power is an appropriate proxy for incision rate and to decipher the morphological variable (or combination of) that best correlates with observed variations in incision rate for the Peikang River in central Taiwan. Finally, these results are used to constrain rates of erosion in reaches with a paucity of strath terraces.
METHODS
Channel Morphology
We used a combination of digital elevation model (DEM) analysis and fi eld work to con-strain channel morphology. Slope was extracted

Channel dynamics along the Peikang River, central Taiwan
Geological Society of America Bulletin, July/August 2010 1195
from a 20 m DEM and smoothed over a 1 km window to reduce inherent noise. Channel width was measured perpendicular to the channel fl ow direction on a hillshade image of the 20 m DEM (Table DR11) and in the fi eld (Table DR2 [see footnote 1]). For the DEM analysis, the left and
right banks were delineated by hand along the edge of appropriate bounding terraces. Where no terraces were present, the bank location was estimated at an elevation comparable to bank-full fl ow depth, which was aided by fi eld ob-servations, and the pixel nearest that elevation was used as the bank. Measurements between the delineated banks, oriented perpendicular to the fl ow direction, were then made at an aver-age of every 100 m, adjusting the intervals to obtain representative values along a given reach
(for example, when width was changing rapidly, we increased the frequency of width estimates). Width was smoothed by averaging any measure-ments within 250 m upstream and downstream of the point. For areas in which channel width was less than three pixels wide (<60 m), we re-lied purely on fi eld measurements to estimate channel width. Indicators of recent high fl ow levels were frequently only 1 m or so below the inner terrace level. Given the rectangular geom-etry of the channel, it is clear that they represent
01020304050607080900
200
400
600
800
1000
1200
Distance downstream (km)
Ste
epne
ss in
dex
106 107 108 109
10–3
10–2
10–1
100
Drainage area (m2)
Slo
pe
A
S = 370 A–0.52
B
C
D E F GH
B
C
((((
((((((
((((
((((((
((((((((
((((
((((((
((((
((((
((((
((
((((
((((((
((((
((
((
((((
((((
((((
((((
((((
((((
((((((
((((
((((((((((((((((((240000
240000
260000
260000
2660
000
2660
000
2680
000
2680
000
±0 4 8 12 162
km
KS60–179180–250251–309310–366367–441442–540541–669670–833834–0111012–1232
C
Figure 2. Calculation of steepness indices for the Peikang River. (A) Channel slope and drainage area plotted in log-log space. Regression of data is shown with dotted line and equation. (B) Steepness index, ks, plotted along the river path. Faults are labeled as in Figure 1B. (C) Steepness indices plotted in map space. For both B and C, note the strong steepness contrast across the Meiyuan fault. The upstream extent of this signal is at river kilometer 28. Gray line in C denotes approximate location of a major physiographic transition in the region that corresponds with this strong steepness signal.
1GSA Data Repository item 2010054, details re-lated to channel morphology, optically stimulated luminescence (OSL) ages, and lithology, is available at http://www.geosociety.org/pubs/ft2010.htm or by request to [email protected].

Yanites et al.
1196 Geological Society of America Bulletin, July/August 2010
bankfull fl ow depth to within a meter. Examples of indictors of high fl ow include banks scoured of vegetation, freshly abraded bedrock, and dis-coloration of bedrock. These indicators were then used to measure channel depth at a particu-lar point. Channel cross-section profi les were measured with a handheld laser rangefi nder, and bankfull width was estimated at the fl ood depth elevation. Locations where the fi eld survey and DEM mapping overlapped allowed us to cross check the consistency of the methods, and the close correlation between fi eld and remotely mapped channel width gives us confi dence that our methods yield robust results.
Discharge
Estimating discharge, Qw, in Taiwan is facili tated by a dense network of river stage and precipitation monitoring stations. Daily records of precipitation and discharge ex-tend back to the 1930s for the Peikang River (http://gweb.wra.gov.tw/wrwebeng/). Addition-ally, hourly precipitation and discharge data for large events date back to the 1970s. One current and three former gauging stations lie within our study reach. To choose a baseline discharge, we analyzed daily and hourly records for large fl ood events in this river basin. In early July 2004, typhoon Mindulle struck the central part of Taiwan, producing intense rainfall in the Peikang River basin. Rainfall accumula-tion of over 1 m in a 3 d period produced very high discharges over these three days: aver-age daily discharge values for July 3, 4, and 5 were 1808, 1185, and 1376 m3/s, respectively (station 1430H032, Fig. 2). The maximum dis-charge recorded in 1 h intervals for this event was 3914 m3/s. The same stations recorded another event on 25 August of the same year with a daily discharge of 1295 m3/s. An event in 1976 produced a daily discharge of 1510 m3/s. Before 1976, a gauging station located 6.9 km upstream (1430H001) fi lls in the record back to 1958 and reveals another big event in 1966 that generated a mean daily discharge of 1290 m3/s. Since no major tributary exists between these stations, it is likely that station 1430H032 had only a slightly higher discharge. Analysis of maximum hourly discharge records over a 19 yr period suggests that the 10 yr fl ood at station 1430H032 is ~1000 m3/s. We therefore chose a discharge of 1000 m3/s at the drainage area of this gauging station as a representative fl ood. The specifi c value of discharge is not critical to our analysis because it will not signifi cantly infl uence the spatial pattern of shear stress and unit stream power. It simply provides the mag-nitude of shear stress and unit stream power for a 10 yr fl ood along this river.
Incision Rate
Numerous discontinuous terraces line the Peikang River downstream of the Meiyuan fault (Fig. 3A). These bedrock strath terraces are often capped with 2–5 m of imbricated gravel and conglomerate channel deposits. Unfortunately, soils are too poorly developed and inherently variable (with respect to grain size and outcrop access) to allow creation of a dependable soil chronosequence to correlate terraces upstream and downstream, but the rare sandy lenses within the coarse debris allowed the use of optically stimulated luminescence (OSL) dating techniques to constrain the age of former channel bed elevations. Samples were collected using basic OSL sampling pro-cedures: (1) to avoid bioturbation, only sandy, quartz-bearing units >1 m below the ground surface were sampled; (2) at least 10 cm (usu-ally much more) of the face of the outcrop were removed before sampling; (3) an ~5-cm-diameter polyvinyl chloride (PVC) tube was hammered into the middle of the sandy unit; and (4) the ends were capped and empty space fi lled with heavy plastic bags. Samples were prepared and run at the Oxford Luminescence Laboratory and the U.S. Geological Survey (USGS) Luminescence Dating Laboratory us-ing standard single aliquot regenerative dose methods (Murray and Wintle, 2000).
The potential for incomplete resetting of sand grains in fl uvial deposits requires an analysis of the individual aliquot ages to ap-propriately choose an age model. Because of the likelihood of incomplete resetting in fl uvial environments (Arnold et al., 2007; Wallinga , 2002), and because the distributions of the measured aliquot data met the criteria for partial bleaching suggested by Arnold et al. (2007), we calculated the sample age using the minimum age model for all samples (Galbraith et al., 1999). The minimum age model essentially assumes that some of the grains are not fully reset and others are reset and uses statistical techniques to “fi nd” the measurements from the fully reset grains and calculate an age from those grains and not the partially bleached grains. As an upper bound on the ages, we also calculated ages using the central age model, which assumes that the en-tire sample is reset.
The OSL samples come from fl uvial de-posits on top of the strath terraces, record-ing former channel positions; however, it is important to correct for the depth to bedrock below the sample to accurately record the ver-tical bedrock incision that occurred after the channel sediment was deposited (Fig. 3B). The depth of post-strath bedrock incision
was calculated as the difference between the height of the bedrock-alluvial contact on the terrace (at the sample location) and the estimated height of bedrock in the modern channel. Where bedrock was not visible in the modern channel fl oor due to the evacuation of sediment following the Chi-Chi earthquake, the depth to bedrock was determined using electrical resistivity surveys (Yanites et al., 2008). The corrections give us a bedrock-to-bedrock depth of incision since the sediments were deposited.
Lithologic Infl uence
The amount of erosion accomplished for a given unit stream power or shear stress can be infl uenced by lithology (in other words, lithol-ogy infl uences the value of k in Equations 2 and 3). Thus, it is important to assess the ex-tent to which spatial variations in unit stream power and shear stress might arise from varia-tions in lithology. Our study area is located mostly in the Eocene-Oligocene age metasedi-mentary rocks of the Hsuehshan Range. Three lithologic formations make up this section. The youngest, the Shuilchangliu Formation, is composed of thickly bedded shale and argil lite with thin sandstone beds. The Paileng Forma-tion is a quartzitic sandstone with interbedded argillite, and the oldest, the Chiayang Forma-tion, is mapped as a weakly metamorphosed slate with thin alternations of sandstone and siltstone (Powell, 2003). Toward the down-stream end, between the Shuilikeng and Shuang tung faults (Fig. 1), the river fl ows over Miocene metasedimentary rocks, which are mapped as interbedded shales and sandstones. Downstream of the Shuangtung fault, the river is set in Pliocene-Pleistocene synorogenic fi ll of the Toukoshan and Cholan Formations, which precludes us from comparing it to the hard bedrock reaches upstream. To test for potential lithology effects along the bedrock reach, we used a proxy for the compressive strength of the mapped units using a concrete test hammer (Schmidt hammer). We recorded more than 25 Schmidt hammer rebound val-ues, correcting for impact angle, at each of 49 locations along the fl ow path (Fig. 4). Where multiple interbedded lithologies were present, we performed separate tests on the different beds. The mean, median, and standard devia-tion at each location were calculated to test for major changes along the river path. Further, we estimated the spacing and width of joints, which could also infl uence the susceptibility to erosion as smaller spacing or wider joints will produce more easily removable blocks of rock (Selby, 1980).

Channel dynamics along the Peikang River, central Taiwan
Geological Society of America Bulletin, July/August 2010 1197
RESULTS
Channel Morphology
A regression between log-transformed slope and area yields a basinwide scaling between these parameters similar to many bedrock rivers around the world (Wobus et al., 2006) (Fig. 2A). The exponent on drainage area allows the calcu-lation of local steepness indices, ks, as shown in Equation 1. Values that lie above or below 370, the average for the entire basin, suggest a rela-tively low or high rock-uplift rate, respectively. A strong signal of high steepness index is asso-ciated with the river reaches immediately up-stream of the Meiyuan and Tili faults (Fig. 2B).
At the upstream end of this anomaly, ks values increase by threefold over only a few kilome-ters of river length. At the downstream end, ks values decrease by about the same amount, al-most exactly coincident with the Meiyuan fault. Downstream of this high-steepness region, no clear signal exists. Although modest variations do appear to correlate with some structures, such as the Shuilikeng fault (fault D in Fig. 2B), the relatively small magnitudes make it diffi cult to interpret beyond inherent DEM noise and natural variability.
Channel width increases systematically with drainage area over several orders of magnitude (Fig. 5). The scaling exponent, 0.54, agrees well with other studies examining channel width
(Montgomery and Gran, 2001). It should be noted, however, that signifi cant variability exists within individual decades. In fact, regressing the data within the 108–109 m2 drainage area decade alone gives an R2 of just 0.09, although the scal-ing parameters are similar, with a coeffi cient of 0.0013 and an exponent of 0.56. As shown in the following, this variability of the river along a reach with similar drainage areas is an important feature of the morphological system response to active deformation. As seen in Figure 6C, the channel is narrow upstream of the Meiyuan fault (located ~45 km downstream from headwaters). Immediately downstream of the Meiyuan fault (45–50 km), the river signifi cantly widens, reaching values of >300 m. The river narrows
40455055606570
250
300
350
400
450
500
550
600
Distance downstream (km)
Ele
vatio
n (m
)
Sample Name: PK-007
1.2 m
Terrace surface
1.7 m
2.5 m
25 m
Looking downstream
Bedrock to bedrock incision = 24.6 m(25 + 2.5 – 1.7 – 1.2)
PK-007
PK-003
PK-005PK-006
PK-010
PK-023
PK-022
PK-021PK-020
PK-019
PK-014PK-013PK-012
PK-011
Shui
liken
g fa
ult
Tapi
ngtin
g fa
ult
Mei
yuan
faul
t
River rightRiver left
River profile A
B
Strath terraces:
OSL location
Figure 3. Schematic overview of dated strath terraces in the study area. (A) Longitudinal profi le of river with schematic representation of dated ter-races to show the vertical rela-tionships between the terraces and modern river. (B) Sche-matic cross section of the strath terrace dated with sample PK-007. Shows how the depth of bedrock incision since the optically stimulated lumines-cence (OSL) date was calcu-lated. Depth to bedrock along the river was estimated from electrical resistivity surveys along the reach (Yanites et al., 2008).

Yanites et al.
1198 Geological Society of America Bulletin, July/August 2010
again over the next few kilometers. The width remains relatively constant until further narrow-ing occurs through the reach where the river crosses the Shuilikeng fault. Just downstream of this fault, the river widens again, and, in general, continues to do so in the downstream direction.
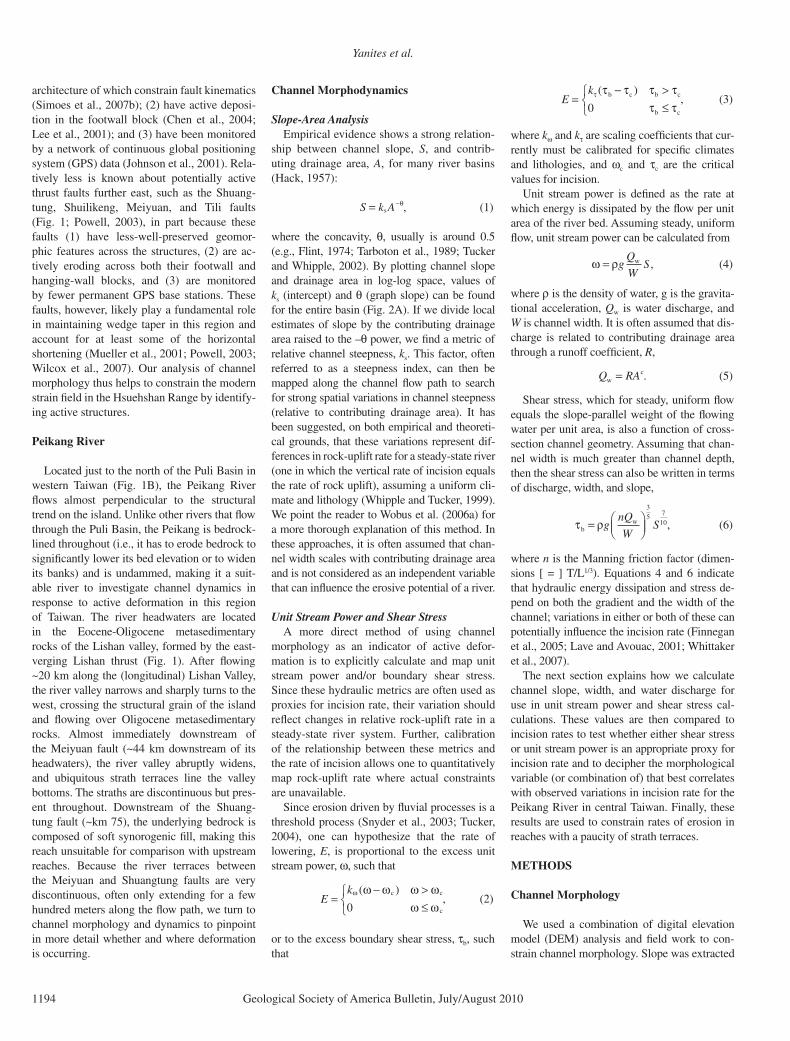
Unit stream power and shear stress along the Peikang River are plotted in Figures 6D–6E. Upstream of the bedrock-alluvial transition at about km 70, the stream-power and shear-stress patterns closely mimic the channel-width pat-tern. At the upstream end of the study reach (Fig. 6), 10 yr unit stream power and shear stress estimates from fi eld data are extremely high (~4000 W/m2 and ~600 Pa). Assuming a critical Shields stress of 0.05, we estimate that the shear stress is suffi cient to move boulders over 0.7 m in diameter. Downstream of the Mei-yuan fault, unit stream power and shear stress drop dramatically. The low values continue for a few kilometers before they begin increasing again. The unit stream power and shear stress increase over a section of about ~3–5 km. Al-though short-wavelength variability exists downstream of this point, unit stream power and shear stress are broadly constant to the point where the channel crosses the Shuilikeng fault. After the river passes downstream of this fault zone, unit stream power and shear stress again dramatically decline and level off as the river enters the valley immediately upstream of the Shuangtung fault. These low power and stress values continue across the Shuangtung and Chelungpu faults. The abrupt increase in unit stream power and shear stress at ~68 km is due to a large confl uence where drainage area doubles through the junction, but the measured effects of channel width are subdued due to our smoothing process.
Incision Rate
The majority of our OSL samples reveal Holo cene age terraces (Table 1; Table DR3 [see footnote 1]). Given the likelihood of partial resetting in these samples, we prefer the mini-mum age model (MAM) for terrace ages, but we also report central age model (CAM) ages as maximum ages (minimum incision rates). The MAM ages are on average 56% younger than CAM ages.
Incision rates mimic the pattern of both unit stream power and shear stress estimates (Fig. 6F). Late Quaternary to Holocene incision rates are relatively low in the 4 km downstream of the Meiyuan fault, documented by samples PK-005–PK-006 and PK-019–PK-023 (Table 1; Fig. 7). The samples suggest incision rates on the order of ~2–3 mm/yr for the last 3–12 k.y. in this reach. About 7 km downstream, incision
0204060800
10
20
30
40
50
60
70
80
Distance downstream (km)
Reb
ound
020406080
0
50
100
150
200
250
300
Distance downstream (km)
Dom
inan
t joi
nt s
paci
ng (
cm)
0
5
10
15
20
Dom
inan
t joi
nt w
idth
(m
m)
MedianMean
A
B
105 106 107 108 109 1010100
101
102
103
Drainage area (m2)
Cha
nnel
wid
th (
m)
W = 0.0023 A0.5378
r2 = 0.86
Figure 5. Log-log plot of fi eld-measured channel width versus drainage area collected from both digital elevation model (DEM) and fi eld analysis. The compression of data within drainage area decades 108–109 masks important variability in an area undergoing differential incision.
Figure 4. Results of lithology parameters. (A) Joint spacing and joint width versus distance downstream. (B) Schmidt hammer rebound values versus distance downstream. No distinct pattern in these parameters is seen along the stream path, lending support that there is no strong infl uence of lith ology on unit stream power or shear stress estimates.

Channel dynamics along the Peikang River, central Taiwan
Geological Society of America Bulletin, July/August 2010 1199
rates increase to ~9 mm/yr and reach a maxi-mum near the Shuilikeng fault at ~11 mm/yr. Immediately downstream of the Shuilikeng fault, a terrace capped by lateritic soil sits ~40–45 m above the river (Fig. 7). The time required for a similar lateritic soil to form in Taiwan is estimated to be around 20–30 k.y. (Tsai and Sung, 2003), suggesting a maximum incision rate of ~2 mm/yr over that time period. Further downstream, samples PK-016–PK-018 docu-ment incision rates of ~2–4 mm/yr just upstream of the Shuangtung fault. In all locations where multiple terrace levels were sampled, ages were stratigraphically appropriate (e.g., samples PK-005 and PK-006). Repeat samples ages within the same stratigraphic position are within error (PK-012–PK-013 and PK-017–PK-018).
Samples PK-030 to PK-033 were obtained from an alluvial layer blanketing an isolated
strath terrace upstream of the Meiyuan fault. Unfortunately, stratigraphic inversions of the dates (samples PK-032 and PK-033 were sampled next to each other) and fi eld evidence of recent debris-fl ow scour and fi ll on the ter-race surface from small, adjacent tributaries suggest that this terrace is ill suited for OSL dating methods. The transport distance of the particles is less than a kilometer (the length of the tributary basin), and the deposits may con-tain reworked terrace alluvium. Both of these factors likely contribute to the unreliability of these ages. It is possible that PK-030 and PK-031 are giving the correct age and inci-sion rates (on the order of 1–1.5 mm/yr), but based on the depositional environment and the unrepeatability of dates with samples PK-032 and PK-033, we question the robustness of the OSL dates. We report the ages in Table 1 but
refrain from using them in further analysis or interpreting these data points.
Linear regression between unit stream power and incision rate results in an r2 value of 0.58 when channel width is measured in the fi eld or from a DEM, compared to an r2 value of 0.05 when width is simply estimated from the tradi-tional scaling with discharge (Fig. 8). The slope of the regression can be interpreted as an erosion susceptibility coeffi cient, kω = 0.0069 (units of mm/yr times m2/W), and the intercept repre-sents the critical value of unit stream power, ωc = 43.2 W/m2, that must be surpassed to do work on the bedrock (Table 2). Regressions be-tween shear stress and incision rate give very similar results, with r2 = 0.58, kτ = 0.046 (units mm/yr Pa), and τc = 65.4 Pa. We omitted sample PK-003 because it is signifi cantly older than the other samples and thus represents a sampling of
0
0.01
0.02
0.03
0.04
0.05
Slo
pe
200
400
600
800
She
ar s
tres
s (P
a)
0
500
1000
1500
2000
2500
3000
Dis
char
ge (
m3 /
s)
304050607080900
400
800
1200
1600
Distance downstream (km)
Ban
kful
l wid
th (
m)
304050607080900
5
10
15
20
Distance downstream (km)
Inci
sion
rate
(mm
/yr)
MAMCAM
0
1000
2000
3000
4000
Uni
t str
eam
pow
er (
W/m
2 )
A
B
C
D
E
F
D E F GB C
0
Figure 6. Channel morphol-ogy and incision rate along the river path. For A–E, digital ele-va tion model (DEM)–derived values are denoted by gray line, the thickness of which denotes the error. Field values are the gray ‘X’s. (A) Channel slope. Discrepancy between fi eld measured slope and DEM slope arises because the fi eld data were measured only over ~100 m, whereas the DEM slope was smoothed over 1 km. (B) Contributing drainage area. (C) Channel width. The mis-match between fi eld data and DEM measurement at the downstream end of the river was due to the horizontal limit of the laser rangefi nder, which is on the order of 200–600 m, depending on the refl ective sur-face. (D) Unit stream power. (E) Shear stress. (F) Inci-sion rate estimates from opti-cally stimulated luminescence (OSL) samples of sandy units on strath terraces using both minimum age models (MAM) and central age models (CAM) for interpreting the dose dis-tributions for the samples. Dashed lines indicate, from left to right, the following struc-tures: Chelungpu, Shuangtung, Shuili keng, Tapingting, Mei-yuan, and Tili faults.

Yanites et al.
1200 Geological Society of America Bulletin, July/August 2010
a much broader time period and potentially dif-ferent climate; however, inclusion of this sample in the regressions does not signifi cantly change the outcome.
Visual and statistical inspection of esti-mated rock strength (Table DR4 [see footnote 1]) and its relationship with unit stream power and shear stress reveals no signifi cant variation in erosion susceptibility along the study reach except for downstream of the Shuangtung fault, where Schmidt hammer rebound values were consistently zero (Fig. 4). Regression between Schmidt hammer rebound and either unit stream power or shear stress results in r2 values of 0.034 and 0.032, respectively.
DISCUSSION
Calibrated River Incision Rule
Unit stream power and shear stress are ro-bust proxies for incision rate in the Hsuehshan Range in central Taiwan (Fig. 8). Unit stream power and shear stress are strongly controlled by reach-scale variations in channel width that deviate from estimates of width based on drainage area. It is interesting, however, that upstream of the Meiyuan fault, strong changes in steepness index suggest that slope is an im-portant morphological parameter for part of the landscape. We note that the steepness indices are variable in this reach. One possibility is that the variability results from propagating knick-points set off by earthquakes on the Meiyuan fault. This is certainly a possibility; however, we do not observe any preserved knickpoints in the fi eld. Instead, this variability is prob-ably a result of the channel and valley width approaching the pixel resolution of the DEM (20 m). This causes particularly narrow zones to be elevated on the DEM with respect to the real riverbed elevation because the pixel value includes signifi cant parts of the hillslopes. It is clear that the average of the steepness indices is still signifi cantly higher than downstream. Field observations indicate that channel width, although variable, tends to be very narrow com-pared to upstream reaches in this section of river, further enhancing unit stream power and shear stress. One question that is diffi cult to ad-dress with these data is: does the rate of river incision match the vertical rock-uplift rate rela-tive to the geoid? If we assume that it does, then channel dynamics can be used to map tectonic deformation in the Taiwan orogen. The correla-tive changes in unit stream power, shear stress, and incision rate, associated with mapped struc-tures, are consistent with the hypothesis that the river morphology has indeed adjusted to match rock uplift. Given the high rates and variability
TAB
LE 1
. OP
TIC
ALL
Y S
TIM
ULA
TED
LU
MIN
ES
CE
NC
E (O
SL)
AG
ES
AN
D IN
CIS
ION
RAT
ES
Age
(MA
M; k
a)1 σ
Age
(CA
M; k
a)1σ
Hei
ght*
+–
Inci
sion
rate
(MA
M; m
m/y
r)+
–In
cisi
on ra
te (C
AM
; mm
/yr)
+–
PK
003
42.1
14.
2549
.84
4.19
78.5
06.
6028
.40
1.86
0.51
0.89
1.58
0.40
0.74
PK
005
3.26
0.81
10.2
01.
938.
301.
100.
902.
541.
290.
780.
810.
320.
22P
K00
611
.66
1.90
21.1
83.
4525
.40
3.60
3.40
2.18
0.79
0.57
1.20
0.44
0.31
PK
007
3.93
0.55
5.28
0.81
24.6
00.
10–0
.10
6.26
1.05
0.79
4.66
0.87
0.64
PK
010
6.61
0.78
10.4
81.
6934
.50
1.10
0.90
5.22
0.89
0.70
3.29
0.76
0.55
PK
011
3.78
0.61
4.99
0.52
34.9
01.
100.
909.
242.
141.
546.
991.
050.
86P
K01
23.
000.
746.
030.
7928
.00
0.10
5.40
9.34
3.10
3.35
4.65
0.72
1.36
PK
013
2.90
0.42
4.90
0.74
29.5
00.
105.
4010
.18
1.79
2.99
6.02
1.09
1.78
PK
014
1.35
0.61
2.72
0.46
12.6
00.
10–0
.10
9.36
7.96
2.98
4.63
0.98
0.70
PK
016
5.36
1.27
30.3
57.
089.
805.
801.
201.
831.
990.
560.
320.
350.
10P
K01
72.
131.
0615
.32
4.02
8.10
1.10
1.90
3.80
4.77
1.92
0.53
0.29
0.22
PK
018
3.07
0.92
10.6
22.
698.
301.
101.
902.
701.
671.
150.
780.
400.
32P
K01
94.
661.
5916
.70
3.24
23.9
00.
10–0
.10
5.13
2.69
1.32
1.43
0.35
0.24
PK
020
8.18
2.03
27.6
75.
357.
000.
101.
900.
860.
300.
380.
250.
070.
10P
K02
13.
121.
4518
.14
4.36
7.00
0.10
1.90
2.25
2.02
1.17
0.39
0.13
0.17
PK
022
2.79
0.98
13.8
72.
669.
000.
101.
903.
221.
801.
390.
650.
160.
23P
K02
39.
101.
0717
.56
3.07
20.5
03.
103.
402.
250.
690.
591.
170.
460.
35P
K03
03.
450.
466.
180.
385.
40.
10.
11.
560.
030.
030.
870.
016
0.01
6P
K03
113
.79
1.06
26.8
1.87
42.2
44
3.06
0.29
0.29
1.57
0.15
0.15
PK
032
2.09
0.55
6.56
0.63
65
12.
872.
390.
480.
910.
760.
15P
K03
310
.04
1.26
20.5
1.49
65
10.
600.
500.
100.
290.
240.
049
Not
e: T
he +
refe
rs to
the
min
imum
thic
knes
s of
allu
vium
bet
wee
n th
e be
droc
k su
rface
and
the
obse
rved
allu
vium
, i.e
., th
e ob
serv
ed th
ickn
ess
of a
lluvi
um b
etw
een
the
OS
L sa
mpl
e lo
catio
n an
d th
e bo
ttom
of t
he
outc
rop.
If b
edro
ck is
exp
osed
, thi
s va
lue
is th
e m
easu
rem
ent e
rror
of t
he la
ser r
ange
fi nde
r tha
t was
use
d to
est
imat
e he
ight
abo
ve th
e m
oder
n riv
er. T
he –
refe
rs to
the
max
imum
allu
vium
est
imat
ed b
y th
e fi r
st
appe
aran
ce o
f bed
rock
foun
d be
low
the
outc
rop
of O
SL
sam
ple.
*Hei
ght r
efer
s to
the
best
est
imat
e of
bed
rock
-to-b
edro
ck in
cisi
on d
epth
.
Channel dynamics along the Peikang River, central Taiwan
Geological Society of America Bulletin, July/August 2010 1201
((((((((((((((((((((((((((
((((((
((((
((((((
((((((
((((((((
((((
((((
((((
((((
((((((((
((((
((((((
((((
((((
((((((
((((
((((
((((
((((
((((((
(( ((
GANK
DPIN
HUYS
!!!!!!!!!!!!!
!!!!!!!!!!!!!!!!!!!!!!!!!!!!!!!!!!!!!!!!!!!!!!!!!!!!!!!!!!!!!!!!!!!!!!!!!!!!!!!!!!!!!!!!
!!!!!!!!!!!!!!!!
!!!!!!!!!!!!!!!!!!!!!!!!!!!!!!!!!!!!!!!!!!!!!!!!
!!!!!!!!!!!!!!!!!!!!!!!!!!!!!!!!!!!!!!!!!!!!!!!!!!
!!!!!!!!!!!!!!!!!!!!!!!!!!!!!!
!!!!!!!!!!!!!!!!!!!!!!!!!!!!!!
!!!!!!!!!!!!!!!!!!!!!!!!!!
!!!!!!!!!!!!!!!!!!!!!!!!!!!!
D
DDDD
D
DD
DD
DDDDDD
D
DDDD
DDD
DDD
DDDDDD
DDDD
DDD
D
D
D
D
D
DDDDDDD
DDDDDDDDDDDDD
DDD
D
DDD
D
DDD
DD D
DDDD
DDDD
D
DDD
_̂
_̂̂_
_̂_̂̂_
_̂̂_ _̂
_̂̂_̂_
_̂̂_̂_̂_
_̂
240000
240000
2660
000
2660
000
±0 1 2 3 40.5
km
Legend
_̂ OSL locations
Shear stress (Pa)! 22–63! 63–85! 85–103! 103–125! 125–153! 153–187! 187–218! 218–252! 252–400! 400–672
PK-016
PK-017PK-018
PK-010PK-011
PK-012PK-013
PK-014
PK-019
PK-020PK-021
PK-022
PK-023
PK-007
PK-006
PK-005
PK-003
Laterized terrace
((((((((((((((((((((((((((
((((((
((((
((((((
((((((
((((((((
((((
((((((
((((
((((((((
((((((
((((
((((
((((
((((
((((
((((
((((
((((
((((((
(( (( (( ((
!!!!!!!!!!!!!
!!!!!!!!!!!!!!!!!!!!!!!!!!!!!!!!!!!!!!!!!!!!!!!!!!!!!!!!!!!!!!!!!!!!!!!!!!!!!!!!!!!!!!!!
!!!!!!!!!!!!!!!!
!!!!!!!!!!!!!!!!!!!!!!!!!!!!!!!!!!!!!!!!!!!!!!!!
!!!!!!!!!!!!!!!!!!!!!!!!!!!!!!!!!!!!!!!!!!!!!!!!!!
!!!!!!!!!!!!!!!!!!!!!!!!!!!!!!
!!!!!!!!!!!!!!!!!!!!!!!!!!!!!!
!!!!!!!!!!!!!!!!!!!!!!!!!!
!!!!!!!!!!!!!!!!!!!!!!!!!!!!
D
DDDD
D
DD
DD
DDDDDD
D
DDDD
DDD
DDD
DDDDDD
DDDD
DD
D
D
D
D
D
DDDDDDD
DDDDDDDDDDDDD
DDD
D
DDD
D
DDD
DD D
DDDD
DDDD
D
DDD
240000
240000
2660
000
2660
000
_̂
_̂̂_
_̂_̂̂_
_̂̂_ _̂
_̂̂_̂_
_̂̂_̂_̂_
_̂
±0 1 2 3 40.5
km
Legend
_̂ OSL locations
Unit streampower (W/m2)
! 26–138! 138–214! 214–297! 297–407! 407–565! 565–747! 747–944! 944–1207! 1207–2001! 2001–5070
PK-016
PK-017PK-018
PK-010PK-011
PK-012PK-013
PK-014
PK-019
PK-020PK-021
PK-022
PK-023
PK-007
PK-006
PK-005
PK-003
GANK
DPIN
HUYS
GPS locations
Laterized terrace
A
B
1430H032
1430H032
D E F
G
C
D E F
G
C
Crest of anticline
Crest of anticline
_̂̂_̂_
PK-030
PK-031 PK-032PK-033
_̂̂_̂_
PK-030
PK-031 PK-032PK-033
GPS locations
Figure 7. Shear stress (A) and unit stream power (B) values in map space. Circles are digital elevation model (DEM) data; ‘X’s are fi eld data. Stars are locations of optically stimulated luminescence (OSL) samples, and gray circles are the locations of the three global position-ing system (GPS) stations along the river path. Black box denotes the local river gauging station. Faults are labeled C–G (from Fig. 1B), representing, from left to right, the following structures: Shuangtung, Shuilikeng, Tapingting, Meiyuan, and Tili faults.

Yanites et al.
1202 Geological Society of America Bulletin, July/August 2010
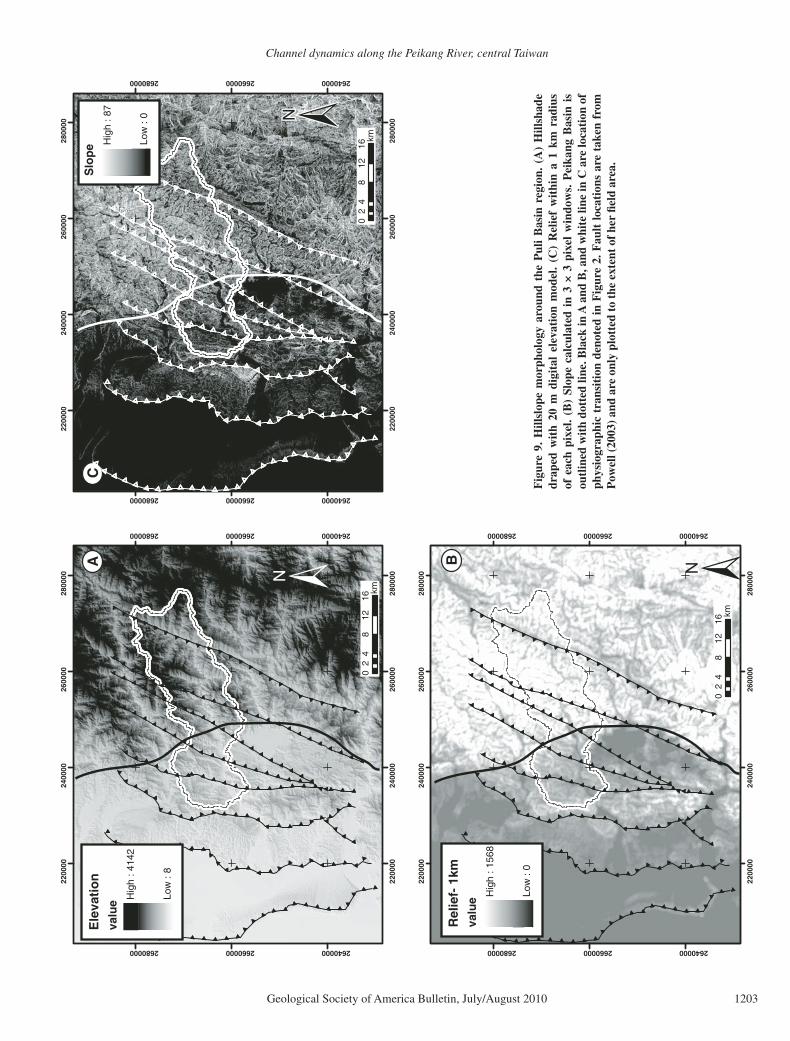
of erosion, if erosion rates did not match rock-uplift rates, it would not take long to produce slopes greater that what is observed. For ex-ample, a 4 mm/yr erosion difference over a dis-tance of 10 km would generate a 40% slope, if it were sustained for 1 m.y.; actual slopes along the study reach are on the order of 1%–2%. Further, qualitative analysis of hillslope and gross drainage basin morphology suggests a similar trend to the pattern of incision and unit stream power and shear stress (Fig. 9). Areas with the steepest slopes and highest local relief generally coincide with the most powerful river reaches, and vice versa. This indicates that the spatial variations in Holocene incision rate have been sustained for long enough to be refl ected in the regional topography. We do not know what this time scale is, but a reasonable guess
is that it is comparable to the ratio of hillslope relief (order hundreds of meters) to erosion rate (order millimeters per year), or roughly 105 yr.
A steady-state bedrock river results in a longi-tudinal profi le that does not change with time because any differential vertical motion along the river’s path is matched by correspond-
ing differential vertical incision. To date, the most common model of channel dynamics in a tectonically active region uses an approxima-tion of river dynamics, where drainage area, A, is used in place of both discharge and chan-nel width, to explore steady-state and transient river morphology. Because this approach scales
0 100 200 300 400 5000
5
10
15
20
25
Shear stress (Pa)
Inci
sion
rate
(mm
/yr)
MAMLinearPower
0 500 1000 1500 2000 2500 30000
5
10
15
20
25
Unit stream power (W/m2)
Inci
sion
rate
(mm
/yr)
CAMLinearPower
0 100 200 300 400 5000
5
10
15
20
25
Shear stress (Pa)
Inci
sion
rate
(mm
/yr)
CAMLinearPower
0 500 1000 1500 2000 2500 30000
5
10
15
20
25
Unit stream power (W/m2)
Inci
sion
rate
(mm
/yr)
MAMLinearPower
E = 0.0069(ω – 43.2)r2 = 0.58
E = 0.0055(ω – 312.1) r2 = 0.71
E = 0.046(τ – 65.4) r2 = 0.58
E = 0.036(τ – 104.8) r2 = 0.67
E = 0.0038ω1.06 r2 = 0.50
E = (2.02 × 10⁻⁶)ω2.07 r2 = 0.78
E = (4.60 × 10⁻⁷)τ2.93 r2 = 0.63
0 500 1000 1500 20000
5
10
15
20
25
Scaled unit stream power (W/m2)
Inci
sion
rate
(mm
/yr)
CAMLinear
0 100 200 300 4000
5
10
15
20
25
Scaled shear stress (Pa)
Inci
sion
rate
(mm
/yr)
CAMLinear
r2 = 0.050 r2 = 0.036
A
B
C
D
E
F
E = (6.66 × 10⁻⁴)τ1.70 r2 = 0.51E = (6.66 × 10⁻⁴)τ1.70 r2 = 0.51
Figure 8. Calibrated river inci-sion rules. Linear and power-law regressions were performed on unit stream power (A and B) and shear stress (D and E), and incision rates were esti-mated from both minimum age models (MAM) (A and D) and central age models (CAM) (B and E) ages. (C and F) Lin-ear regressions between unit stream power/shear stress and CAM incision rates using scaled channel width values rather than measured values as has been done in the past. The regression values are used to estimate incision rate upstream of the Meiyuan fault. Use of MAM incision rates does not change the regression sig-nifi cantly. Sample PK-003 is plotted in gray but was not in-cluded in the regression analy-ses because it is signifi cantly older than all other samples.
TABLE 2. REGRESSION RESULTS
MACMAM
p1 p2 R 2 p1 p2 R 2
Unit streampower
Linear 0.0069 43.2 0.58 0.0055 312.1 0.71
Power 1.06 .0038 0.50 2.07 2 × 10⁻⁶ 0.78Shear Linear 0.046 65.4 0.58 0.036 104.8 0.67
Power 1.70 6.7 × 10⁻⁴ 0.51 2.93 4.6 × 10⁻⁷ 0.63
Note: In the linear model, p1 is the slope and p2 is the intercept. In the power-law model, p1 is the exponent and p2 is the coeffi cient.
Channel dynamics along the Peikang River, central Taiwan
Geological Society of America Bulletin, July/August 2010 1203
2200
00
2200
00
2400
00
2400
00
2600
00
2600
00
2800
00
2800
00
2640000
2640000
2660000
2660000
2680000
2680000
±0
48
1216
2km
2200
00
2200
00
2400
00
2400
00
2600
00
2600
00
2800
00
2800
00
2640000
2640000
2660000
2660000
2680000
2680000
±0
48
1216
2km
2200
00
2200
00
2400
00
2400
00
2600
00
2600
00
2800
00
2800
00
2640000
2640000
2660000
2660000
2680000
2680000
04
812
162
km
A B
C
(( (( (( (( (( (( (( (( (( (( (( (( ((
(( (( (( (( (( (( (( (( (( (( (( (( ((
(( (( (( (( (( (( (( (( (( (( (( (( ((
(( (( (( (( (( (( (( (( (( (( (( (( ((
(( (( (( (( (( (( (( (( (( (( (( (( ((
(( (( ((((
(( (( (( (( (( ((
(( (( (( (( (( (( (( ((
(( ((
(((((((( ((
(( (( ((
(( (( (( ((
((
(( (( (( ((
(( (( (( ((
(( (( (( (( (( (( ((
(((( (( (( (( (( (( (( ((
(( (( (( (( (( (( (( ((
(( (( (( (( (( (( (( ((
(( (( (( (( (( (( (( ((
((((((((((((((((((
((((((((
((((((((((((((
((((((((
(((( (( (( (( (( (( (( (( (( (( (( (( (( ((
(( (((( (( (( (( (( (( (( ((
(( ((((
(( (( (( (( (( (( (( (( (( (( (( (( ((
(( (( (( (( (( (( (( (( (( (( (( (( ((
(( (( (( (( (( (( (( (( (( (( (( (( ((
(( (( (( (( (( (( (( (( (( (( (( (( ((
(( (( (( (( (( (( (( (( (( (( (( (( ((
(( (( ((((
(( (( (( (( (( ((
(( (( (( (( (( (( (( ((
(( ((
(((((((( ((
(( (( ((
(( (( (( ((
((
(( (( (( ((
(( (( (( ((
(( (( (( (( (( (( ((
(((( (( (( (( (( (( (( ((
(( (( (( (( (( (( (( ((
(( (( (( (( (( (( (( ((
(( (( (( (( (( (( (( ((
((((((((((((((((((
((((((((
((((((((((((((((
((((((
(((( (( (( (( (( (( (( (( (( (( (( (( (( ((
(( (((( (( (( (( (( (( (( ((
(( ((((
(( (( (( (( (( (( (( (( (( (( (( (( ((
(( (( (( (( (( (( (( (( (( (( (( (( ((
(( (( (( (( (( (( (( (( (( (( (( (( ((
(( (( (( (( (( (( (( (( (( (( (( (( ((
(( (( (( (( (( (( (( (( (( (( (( (( ((
(( (( ((((
(( (( (( (( (( ((
(( (( (( (( (( (( (( ((
(( ((
(((((((( ((
(( (( ((
(( (( (( ((
((
(( (( (( ((
(( (( (( ((
(( (( (( (( (( (( ((
(((( (( (( (( (( (( (( ((
(( (( (( (( (( (( (( ((
(( (( (( (( (( (( (( ((
(( (( (( (( (( (( (( ((
((((((((((((((((((
((((((((
((((((((((((((
((((((((
(((( (( (( (( (( (( (( (( (( (( (( (( (( ((
(( (((( (( (( (( (( (( (( ((
(( ((((
Ele
vatio
nva
lue H
igh
: 414
2
Low
: 8
Rel
ief-
1km
valu
e Hig
h : 1
568
Low
: 0
Slo
peH
igh
: 87
Low
: 0 ±±
Fig
ure
9. H
illsl
ope
mor
phol
ogy
arou
nd t
he P
uli
Bas
in r
egio
n. (
A)
Hill
shad
e dr
aped
wit
h 20
m d
igit
al e
leva
tion
mod
el.
(C)
Rel
ief
wit
hin
a 1
km r
adiu
s of
eac
h pi
xel.
(B)
Slop
e ca
lcul
ated
in
3 ×
3 pi
xel
win
dow
s. P
eika
ng B
asin
is
outl
ined
wit
h do
tted
line
. Bla
ck in
A a
nd B
, and
whi
te li
ne in
C a
re lo
cati
on o
f ph
ysio
grap
hic
tran
siti
on d
enot
ed in
Fig
ure
2. F
ault
loca
tion
s ar
e ta
ken
from
P
owel
l (20
03) a
nd a
re o
nly
plot
ted
to th
e ex
tent
of h
er fi
eld
area
.

Yanites et al.
1204 Geological Society of America Bulletin, July/August 2010
the cross-sectional geometry with contributing drainage area, a change in channel bed eleva-tion, and thus slope, is the only morphological parameter that is able to adjust the local chan-nel hydraulics and therefore change the incision rate to match rock-uplift rate. However, several recent studies have highlighted the importance of channel width as an additional control on (as well as a product of) the rate of channel incision into bedrock (Duval et al., 2004; Finnegan et al., 2005; Whittaker et al., 2007; Wobus et al., 2008). Along some rivers, including the Peikang, slope and drainage area alone do not provide a suffi -cient proxy for stream power or shear stress be-cause both quantities are strongly infl uenced by downstream variations in channel width.
To use channel morphology as a tool to map changes in rates of rock uplift, it is necessary to understand the feedbacks between morphology (chiefl y width and slope) and other potential in-fl uences (such as sediment cover and sediment supply). It is quite possible, and in fact likely, that the dynamics of the processes that widen a channel are different from those that lower the channel thalweg. Further, it is likely that the time scale for adjustment in width is generally much shorter than the time scale for gradient ad-justment. Based on the modeling work of Wobus et al. (2006b), we conjecture that width adjust-ment could occur over a time scale related to the water depth divided by incision rate. Establish-ing the controls on this time scale, and more generally unraveling the environmental controls on channel dynamics and morphology, will re-quire carefully mapping of channel geometry in regions undergoing differential incision.
Assuming the Peikang River is in steady state with the rock-uplift rate, we can calibrate a fl uvial incision rule based on estimates of unit stream power or shear stress. Using the regres-sion coeffi cients (Fig. 8; Table 2), we can calcu-late both an “erodibility” factor (kω and kτ) and a threshold term (ωc and τc) for Equations 2 and 3. It is of particular note that this calibration does not work if one simply scales channel width with drainage area. It is interesting to compare the estimated threshold values with motion thresholds associated with bed material in the Peikang. Using a critical Shields stress of 0.05 and a grain density of 2700 kg/m3, the thresh-old shear stress estimated from the regression in Figure 8 corresponds to a median bed grain size of 7.7 cm. The equivalent for ωc (using ωc = τcU*c = τc
3/2/ρ, where ρ is water density) is 14.4 cm. By comparison, point counts of grain size at 45 locations along the Peikang reveal a median grain size of ranging from ~5 to ~30 cm, with a mean of around ~15 cm, i.e., well within the expected range given ωc and τc, suggesting that these values are indeed set by the caliber of
sediment fed to the river system. In a subsequent section on tectonic implications, we use the cali-brated river incision rule to estimate differential rates of rock uplift in places where we do not have strong control on incision rate.
Implications for a Minimum Channel Width
The major morphological adjustment of the river reach to enhanced rock uplift just upstream of the Shuilikeng fault is channel narrowing. Up-stream of the Meiyuan and Tili faults, however, the morphological adjustment to enhanced rock uplift is both channel narrowing and steepening. One explanation for the different morphologi-cal adjustments between these areas calls upon the distribution of energy dissipation and shear stress in a bedrock channel. As implied by our calibrated incision rule, the unit stream power and shear stress proxies assume that erosion is primarily vertical. As a channel narrows while it erodes in response to downstream tilting or pas-sage of a fault-generated knickpoint, the chan-nel walls will account for a higher proportion of its wetted perimeter. If a channel becomes too narrow, then a signifi cant proportion of boundary stress and energy dissipation occurs on the channel walls, reducing the effi ciency of the channel’s vertical erosive potential (Wobus et al., 2008). Further narrowing will not in-crease vertical incision on the channel bed. At this point, the only parameter able to adjust to increase the erosive potential of the stream is the slope, and a knick zone will develop in response to further enhanced rock uplift.
If this conceptual model is correct, then temporal changes in channel width must occur faster than changes in slope. We propose two general time scales of dynamic channel adjust-ment to a perturbation in central Taiwan. We take the vertical drop between thrust faults as
the appropriate length scale that needs to be adjusted to change channel slope in response to a change in rock-uplift rate. Between the Meiyuan and Shuilikeng faults, the vertical drop is ~100 m (slope of 1% over a distance of 10 km). A rock-uplift rate of 10 mm/yr gives a time scale of ~10 k.y. for the adjustment of channel slope upstream of the Shuilikeng fault. Alternatively, we postulate that channel width can adjust over the time needed to vertically erode through one channel depth. Estimates of fl oodwater depth in this reach are on the order of 10 m. A 10 mm/yr incision rate gives a time scale of only ~1 k.y. to adjust channel width. Using these time scales as a guide, we posit that rivers in this region will fi rst narrow in response to enhanced rock uplift. If it can narrow enough to increase unit stream power and shear stress to a level that will bring the incision rate into balance with the relative rock-uplift rate, then no slope adjustment will take place; however, if the channel narrows to the point where bound-ary friction and energy dissipation on the walls become signifi cant, then the vertical adjustment of channel slope will occur, producing a zone of high steepness indices.
We calculated the width-to-depth ratio of the channel as a test of this hypothesis (Fig. 10). Wobus et al. (2008) suggested that a width-to-depth ratio on the order of 5–10 represents the point at which wall effects become important. We fi nd a minimum width-to-depth ratio of around 12 for both the reach upstream of the Meiyuan fault (F in Fig. 10) and for the reach just upstream of the Shuilikeng fault (D in Fig. 10). Our estimated incision rate upstream of the Meiyuan and Tili faults is higher than at the apex of the Shuilikeng fault. We suggest that the reaches upstream of the Meiyuan and Tili faults reached their minimum width but were unable to match the rock-uplift rate; therefore, a strong slope signal has developed to further
304050607080900
50
100
150
200
250
300
350
Distance downstream (km)
W/D
D E F GB C
Proposed minimum W/D ratio
Shui
liken
g fa
ult
Mei
yuan
faul
t
Figure 10. Width-to-depth ratio (W/D) as a function of distance downstream. The lowest values correlate with locations where we have either measured or in-ferred enhanced rates of river incision. Notice no values exist below a W/D of 10, denoted by gray line. We propose that when W/D ratios are <10, the only mechanism to increase unit stream power and/or shear stress is channel steepening.

Channel dynamics along the Peikang River, central Taiwan
Geological Society of America Bulletin, July/August 2010 1205
enhance unit stream power and shear stress. A very minor steep reach (ks ~ 500, compared to the average of 370) in the ~1 km upstream of the Shuilikeng fault suggests that this stretch of river has narrowed to the minimum width but remains near the threshold to develop a knick zone, or zone of relative channel steepening compared to the contributing drainage area.
The essence of our hypothesis for bedrock channel response is as follows. First, provided that the width-to-depth ratio is suffi ciently large (Fig. 10, just downstream of the Meiyuan fault), any steeping due to relative base-level fall along the river (for example, tilting above a fold limb or creation of a fault scarp across the channel) will increase the speed of the cur-rent and thereby decrease both the width and the cross-sectional area of the channel. All else being equal, this narrowing will tend to pro-duce a higher rate of incision (e.g., as the river approached the Shuilikeng fault), until a bal-ance is reached between the incision rate and the local rate of rock uplift relative to a base-level datum downstream (such as a coastline). Indeed, this mechanism has been reproduced in numerical models of channel cross-section hydraulics and erosion (Stark, 2006; Turowski et al., 2007; Wobus et al., 2006b). However, if the width-to-depth ratio becomes smaller than a critical value, further narrowing will tend to be counteracted by an increase in stress and erosion along the walls, and will therefore tend not to increase vertical incision rates. Consider a bed-rock channel above an active fold limb that has achieved a width-to-depth ratio that maximizes stress. If the incision rate is lower than the rate
of fold-limb growth, the channel will continue to steepen (but not widen) until the incision rate balances the rate of fold growth. In other words, according to this hypothesis, a wide channel is expected to respond to differential rock uplift with a combination of steepening and narrow-ing, while a narrow channel will only steepen (e.g., upstream of the Meiyuan fault; Fig. 10). This hypothesis suggests that both the reaches upstream of the Shuilikeng and the Meiyuan/Tili faults have reached the minimum width in response to enhanced rock-uplift rate; however, the much greater rock-uplift rates upstream of the Meiyuan and Tili faults have further caused the development of a knick zone, whereas the reach upstream of the Shuilikeng fault can ac-complish almost all of the work by simply narrowing.
Tectonic Implications
It is clear that changes in channel morphol-ogy and incision rate along the Peikang River in central Taiwan are associated with faults and/or folds. To the extent that these patterns refl ect differential rock motion, they reveal important information on the strain budget for the orogen upstream of the Shuangtung fault (Fig. 11). In our fi eld study, two distinct stretches of river appear to have similar lithologies but show dis-tinctly different geomorphic signals. The bound-ary between these two reaches appears to be the Meiyuan fault. We hypothesize that this bound-ary represents an important geologic structure within this part of the Hsuehshan Range, which we discuss in the following.
Upstream of the Meiyuan FaultUsing our calibrated incision model (Fig. 8),
we can estimate the incision rate along this reach from the linear unit stream power and shear stress models. Assuming the 10 yr mean unit stream power is around 2000 W/m2 and shear stress is 350 Pa (Fig. 6), the minimum incision rate using the linear CAM models is ~9 mm/yr. The maximum rate from linear MAM models is ~13.5 mm/yr. Our estimated incision rates are signifi cantly higher than previously proposed, e.g., ~1–6 mm/yr from thermo chronological and suspended sediment data (Dadson et al., 2003; Simoes et al., 2007a). One way to reconcile these estimates is to con-sider that our calibrated model is only valid over the Holocene and that discharge might have been lower during glacial periods. An-other study has found a late Holocene increase in incision rate for the Ehrjen River basin in southern Taiwan (Hsieh and Knuepfer, 2001). Another possibility is the observed variability in thrust activity in analog and numerical mod-els of critical wedges, which suggest short-term enhanced rates of rock uplift that “jump” around the orogen as thrusts turn on and off to maintain taper (Hoth et al., 2006; Naylor and Sinclair, 2007; Upton et al., 2009). Despite the potential temporal variability in incision rate, this area is clearly incising faster than else-where along the fl ow path. The strong change in hillslope morphology (Fig. 9) suggests that this erosion is long-live, and thus, this area is likely experiencing a signifi cantly higher rate of rock uplift than the foothills to the west and possibly the Central Range to the east.
5
Dep
th (k
m)
10
Ramp location?
Tili active?
α
Duplexing?
MeiyuanShuilikengShuangtung
Chelungpu blind?Tapingting
~40 mm/yr
Pl
Pl
Po
Po
M
EE
EE E
OO
O
DecollementSlip toChanghua thrust Pl:
Po:M:E:O:
PleistocenePliocene
MioceneEoceneOligocene
?
Vertical rock-uplift rate above ramp =slip rate on decollement * sin(α )
A A′
Figure 11. Schematic cross section through the fi eld area. Location is shown in Figure 1. Red faults highlight actively deforming structures. The Chelungpu was the location of the 1999 Chi-Chi earthquake. The other interpreted active faults result from our channel morphology and incision rate study. The exact cause of the high rates of rock uplift upstream of the Meiyuan and Tili faults is unknown, but we include diagrammatic sketches of a ramp in the décollement, which is required to bring up deeper structural levels in the orogen, and duplexing, both of which could potentially drive these high rates.

Yanites et al.
1206 Geological Society of America Bulletin, July/August 2010
Previous work on the structural (Yue et al., 2005) and tectonic framework (Fuller et al., 2006; Simoes et al., 2007a) of this area suggests that there is likely to be a zone of enhanced rock uplift that coincides roughly with the reach up-stream of the Meiyuan and Tili faults. Based on structural reconstructions, a stepping-down of the décollement is required to bring the older rocks of the Hsuehshan Range up to the sur-face (Powell, 2003). Yue et al. (2005) proposed that the location of this ramp is below the Tili fault; however, the exact location and dip of this ramp are poorly constrained (Fig. 11). This structural solution implies that any slip along a steeply dipping décollement will result in a zone of higher rock-uplift rate (relative to the foot-wall) above it. Assuming that the décollement is slipping at ~35 mm/yr (Yue et al., 2005), then our calibrated incision rates imply a ramp dip of ~15°–23° (calculated with the equation dip = sin–1[incision rate/décollement slip rate]). Alternatively, this region has been proposed to be a focus of tectonic underplating via duplex-ing (Fig. 11) as material is transported vertically from the subducting plate of the continental mar-gin into the overlying wedge (Fuller et al., 2006; Simoes and Avouac, 2006). This is supported by relatively young mineral cooling ages just to the north of the Peikang River and east of the Mei-yuan fault (Fuller et al., 2006; Liu et al., 2001; Simoes et al., 2007a). Simoes et al. (2007a) sug-gested that the underlying rocks are likely to be quite hot, and the exhumation rate in this area is likely to be relatively high. Thus, based on the various structural and tectonic frameworks proposed by others (Fuller et al., 2006; Simoes et al., 2007a; Yue et al., 2005), the region up-stream of the Meiyuan fault consistently stands out as a location of rapid and sustained rock up-lift. Our results support this assertion, although we cannot distinguish between a long-lived thrust ramp or underplating by duplexes.
River Reach between the Meiyuan and Shuangtung Faults
The segment that lies in the ~4-km-long stretch immediately downstream of the Mei-yuan fault is a zone of relatively low unit stream power, shear stress, and incision rate (Table 1; Fig. 7). Observations of regional structure, mor-phology, and ground motion associated with the Chi-Chi earthquake may help to interpret the signifi cance of this low-incision zone, although a defi nitive answer remains elusive. First, other rivers in this region, such as the Tachia and Cho Rivers, have similarly wide reaches im-mediately downstream of the physiographic transition denoted by the gray line in Figure 9. This physiographic transition is highlighted by greater local relief and hillslope gradients to the
east of this line. Another potentially important observation is that a continuous GPS station at the south end of the Puli Basin (almost due south of this reach) recorded downward mo-tion during the 1999 Chi-Chi earthquake (Yue et al., 2005). If that coseismic motion is not fully recoverable, this could explain the lower inci-sion rates (i.e., rock-uplift rates) in this segment, since the downstream end of the river would ex-perience reduced base-level lowering due to this gradient in rock uplift. Finally, if the Meiyuan fault marks the location of the main décolle-ment stepping down to deeper structural levels (Fig. 11), then this segment could correlate with the location where the décollement fl attens at higher levels to the west (i.e., the top of the ramp in the décollement), causing a distinct decrease in the local rock-uplift rate relative to upstream.
The downstream increase and then abrupt de-crease in incision rate, unit stream power, and shear stress across the Shuilikeng fault suggest that, at least over the Holocene, the fault is ac-tive (Fig. 11). Slip occurs along an east-to-west steepening thrust ramp that either offsets the ground surface or terminates within a broader sheared forelimb of a fault-propagation fold. Active shortening at the surface this far into the interior of a critical wedge is unusual, but not necessarily surprising. Backstepping of the deforming wedge can occur in cases of mass imbalance, and in this case, is most likely re-lated to rapid erosion in the Puli region (Powell, 2003; Upton et al., 2009). Evidence for active slip on the Shuilikeng fault was also suggested by Sung et al. (2000), who compared leveling surveys done in 1904 and 1985 and found sta-tistically signifi cant changes in channel slope immediately upstream of the Chelungpu and Shuilikeng faults. They interpreted this small change in steepness as indicating that these faults are active, although the change in slope was only ~10% of the actual slope and did not account for survey and co-registration errors. Fi-nally, deformation of late Pleistocene alluvium in the Puli Basin is also consistent with an active Shuilikeng fault (Powell, 2003).
Deformed terraces in the Puli Basin to the south support our assertion for active strain, as defi ned by geomorphic analysis, in the Peikang River valley. Figure 7 highlights an anticlinal axial surface that appears to correlate with a small spike in unit stream power and shear stress in the Peikang River. A syncline is mapped to the west (Powell, 2003) and appears to corre-late with a small drop in unit stream power and shear stress. The coincidence between mapped axial surfaces in folds that deform synorogenic and older strata in the Puli Basin and the relative magnitude of fl uvial erosion potential in the Pei-kang River lend further supports to our assess-
ment that the incision rate, rock-uplift rate, and channel morphology are in a state of equilib-rium. Dates on these fi ll terraces give ages of ca. 50 ka (Powell, 2003). Unfortunately the Pleistocene sediments are not preserved across the Shuilikeng fault and thus cannot be used to constrain the long-term strain there.
Comparison with Geodetic DataSince the 1999 Chi-Chi earthquake, the
number of GPS stations monitoring displace-ment has grown. Three stations can be found along the Peikang River (Fig. 7). Using publicly available rates (http://gps.earth.sinica.edu.tw), we derived the vertical displacement for these stations using a station (CIME) on the Penghu Islands west of Taiwan as the reference station. The station GANK is located in the valley im-mediately upstream of the Shuangtung fault and ~1.5 km upstream of OSL samples PK-016, –017, and –018. The station has recorded a ver-tical velocity of 1.3 ± 0.3 mm/yr between 2000 and 2006, as compared to our incision rate esti-mate of ~2–4 mm/yr. Station DPIN sits on a large folded terrace at the north end of the Puli Basin, just 2 km south of the Peikang River. It lies at the upstream end of the enhanced stream-power zone associated with the Shuilikeng fault. A vertical velocity of 5.8 ± 0.2 mm/yr between the years of 2002 and 2008 was recorded. This station lies close to the transition between the low-incision zone downstream of the Mei-yuan fault (~1–2 mm/yr) and the enhanced incision zone upstream of the Shuilikeng fault (~10 mm/yr). Finally, a station between the Meiyuan and Tili faults in the Hsuisan Forest was established in 2006. Since then, this sta-tion, HUYS, has recorded a vertical velocity of 7.6 ± 0.4 mm/yr, which is slightly below our lower bound estimate of 9 mm/yr. Thus, the GPS-derived vertical velocity pattern is broadly consistent with the terrace-derived incision-rate pattern. Although the time scales of these com-parisons differ by about three orders of magni-tude, we feel that the similar patterns are further support to our assertion that incision is keeping pace with rock-uplift rate relative to the geoid.
CONCLUSIONS
Channel morphology and dynamics are ideal tools for mapping differential rock uplift in the Taiwanese orogen, if carefully employed. As may be the case for many landscapes, it is im-portant to consider variation in channel width along with channel slope to properly calibrate and apply a river incision rule for a region. Two separate stretches of the Peikang River in cen-tral Taiwan respond to locally enhanced rock-uplift rates with different morphological signals.

Channel dynamics along the Peikang River, central Taiwan
Geological Society of America Bulletin, July/August 2010 1207
Upstream of the Meiyuan fault, the river is both steep and narrow compared to its drainage area. Given the calibrated river incision rule, we es-timate the stream incision rate in this reach to have been ~9–13.5 mm/yr over the Holocene. Downstream of the Meiyuan fault, an increase in incision rate, unit stream power, and shear stress across the Shuilikeng fault suggests it is currently active. Incision rate across this reach increases to ~10 mm/yr from a minimum of ~1 mm/yr. Finally, evidence from the Peikang River supports a model of river response in which a river will narrow to increase its erosive potential until a minimum width is reached, and only after this occurs will the river’s slope in-crease and develop a persistent knick zone.
ACKNOWLEDGMENTS
Funding was provided by National Science Foun-dation grant EAR-0510971 and a National Defense Science and Engineering Graduate Fellowship to Yanites. The manuscript benefi ted from thorough reviews from Mark Quigley, associate editor John Fletcher, and an anonymous reviewer.
REFERENCES CITED
Arnold, L.J., Balley, R.M., and Tucker, G.E., 2007, Sta-tistical treatment of fl uvial dose distributions from southern Colorado arroyo deposits: Quaternary Geo-chronology, v. 2, no. 1–4, p. 162–167, doi: 10.1016/j.quageo.2006.05.003.
Chen, W.S., Lee, K.J., Lee, L.S., Ponti, D.J., Prentice, C., Chen, Y.G., Chang, H.C., and Lee, Y.H., 2004, Paleo-seismology of the Chelungpu fault during the past 1900 years: Quaternary International, v. 115, p. 167–176, doi: 10.1016/S1040-6182(03)00105-8.
Chen, Y.G., Lai, K.Y., Lee, Y.H., Suppe, J., Chen, W.S., Lin, Y.N.N., Wang, Y., Hung, J.H., and Kuo, Y.T., 2007, Coseismic fold scarps and their kinematic behavior in the 1999 Chi-Chi earthquake Taiwan: Journal of Geo-physical Research–Solid Earth, v. 112, no. B3, p. 1–15.
Dadson, S.J., Hovius, N., Chen, H.G., Dade, W.B., Hsieh, M.L., Willett, S.D., Hu, J.C., Horng, M.J., Chen, M.C., Stark, C.P., Lague, D., and Lin, J.C., 2003, Links be-tween erosion, runoff variability and seismicity in the Taiwan orogen: Nature, v. 426, no. 6967, p. 648–651, doi: 10.1038/nature02150.
Dahlen, F.A., and Barr, T.D., 1989, Brittle frictional moun-tain building: 1. Deformation and mechanical energy budget: Journal of Geophysical Research–Solid Earth and Planets, v. 94, no. B4, p. 3906–3922, doi: 10.1029/JB094iB04p03906.
Dahlen, F.A., and Suppe, J., 1988, Mechanics, growth, and erosion of mountain belts in Clark, S.P., Burchfi el , B.C., and Suppe, J., eds., Processes in Continental Lithospheric Deformation: Geological Society of America Special Paper 218, p. 161–178.
Duval, A., Kirby, E., and Burbank, D., 2004, Tectonic and lithologic controls on bedrock channel profi les and processes in coastal California: Journal of Geophysical Research–Earth Surface, v. 109, no. F3, p. 1–18.
Finnegan, N.J., Roe, G., Montgomery, D.R., and Hallet, B., 2005, Controls on the channel width of rivers: Implica-tions for modeling fl uvial incision of bedrock: Geol-ogy, v. 33, no. 3, p. 229–232, doi: 10.1130/G21171.1.
Flint, J.J., 1974, Stream gradient as a function of order, magni-tude, and discharge: Water Resources Research, v. 10, no. 5, p. 969–973, doi: 10.1029/WR010i005p00969.
Fuller, C.W., Willett, S.D., Fisher, D., and Lu, C.Y., 2006, A thermomechanical wedge model of Taiwan constrained by fi ssion-track thermochronometry: Tectonophysics, v. 425, no. 1–4, p. 1–24, doi: 10.1016/j.tecto.2006.05.018.
Galbraith, R.F., Roberts, R.G., Laslett, G.M., Yoshida, H., and Olley, J.M., 1999, Optical dating of single and
multiple grains of quartz from Jinmium Rock Shelter, northern Australia: Part 1. Experimental design and statistical models: Archaeometry, v. 41, p. 339–364, doi: 10.1111/j.1475-4754.1999.tb00987.x.
Hack, J.T., 1957, Studies of Longitudinal Stream Profi les in Virginia and Maryland: U.S. Geological Survey Pro-fessional Paper 294-B, p. 45–97.
Hancock, G.S., Anderson, R.S., and Whipple, K.X., 1998, Beyond power: Bedrock river incision process and form, in Tinkler, K.J., and Wohl, E.E., eds., Rivers over Rock: Fluvial Processes in Bedrock Channels: Ameri-can Geophysical Union Geophysical Monograph 107, p. 35–60.
Hoth, S., Adam, J., Kukowski, N., and Oncken, O., 2006, Infl uence of erosion on the kinematics of bivergent orogens: Results from scaled sandbox simulations, in Willett, S.D., Hovius, N., Brandon, M.T., and Fisher, D.M., eds., Tectonics, Climate, and Landscape Evolu-tion: Penrose Conference Series: Geological Society of America Special Paper 398, p. 201–225.
Howard, A.D., and Kerby, G., 1983, Channel changes in badlands: Geological Society of America Bulletin, v. 94, no. 6, p. 739–752, doi: 10.1130/0016-7606(1983)94<739:CCIB>2.0.CO;2.
Hsieh, M.L., and Knuepfer, P.L.K., 2001, Middle-late Holocene river terraces in the Erhjen River Basin, southwestern Taiwan—Implications of river response to climate change and active tectonic uplift: Geomor-phology, v. 38, no. 3–4, p. 337–372, doi: 10.1016/S0169-555X(00)00105-7.
Johnson, K.M., Hsu, Y.J., Segall, P., and Yu, S.B., 2001, Fault geometry and slip distribution of the 1999 Chi-Chi, Taiwan earthquake imaged from inversion of GPS data: Geophysical Research Letters, v. 28, no. 11, p. 2285–2288, doi: 10.1029/2000GL012761.
Kirby, E., and Whipple, K., 2001, Quantifying differ-ential rock-uplift rates via stream profi le analysis: Geology, v. 29, no. 5, p. 415–418, doi: 10.1130/0091-7613(2001)029<0415:QDRURV>2.0.CO;2.
Kirby, E., Whipple, K.X., Tang, W.Q., and Chen, Z.L., 2003, Distribution of active rock uplift along the eastern mar-gin of the Tibetan Plateau: Inferences from bedrock channel longitudinal profi les: Journal of Geophysical Research–Solid Earth, v. 108, no. B4, p. 1–24.
Lave, J., and Avouac, J.P., 2001, Fluvial incision and tectonic uplift across the Himalayas of central Nepal: Journal of Geophysical Research–Solid Earth, v. 106, no. B11, p. 26,561–26,591, doi: 10.1029/2001JB000359.
Lee, J.C., Chen, Y.G., Sieh, K., Mueller, K., Chen, W.S., Chu, H.T., Chan, Y.C., Rubin, C., and Yeats, R., 2001, A vertical exposure of the 1999 surface rupture of the Chelungpu fault at Wufeng, western Taiwan: Structural and paleoseismic implications for an active thrust fault: Bulletin of the Seismological Society of America, v. 91, no. 5, p. 914–929, doi: 10.1785/0120000742.
Liu, T.K., Hsieh, S., Chen, Y.G., and Chen, W.S., 2001, Thermo-kinematic evolution of the Taiwan oblique-collision mountain belt as revealed by zircon fi ssion track dating: Earth and Planetary Science Letters, v. 186, no. 1, p. 45–56, doi: 10.1016/S0012-821X(01)00232-1.
Montgomery, D.R., and Gran, K.B., 2001, Downstream variations in the width of bedrock channels: Water Resources Research, v. 37, no. 6, p. 1841–1846, doi: 10.1029/2000WR900393.
Mueller, K.J., Chen, Y.G., and Keir, G., 2001, Erosion-induced backstepping and reaction of the Chelungpu thrust: Implications for the patterns of modern strain re-lease in west-central Taiwan: Eos (Transactions, Ameri-can Geophysical Union), v. 82, no. 47, T32A-0878, Fall meeting supplement, abstract.
Murray, A.S., and Wintle, A.G., 2000, Luminescence dating of quartz using an improved single-aliquot regenerative-dose protocol: Radiation Measurements, v. 32, no. 1, p. 57–73, doi: 10.1016/S1350-4487(99)00253-X.
Naylor, M., and Sinclair, H.D., 2007, Punctuated thrust deformation in the context of doubly vergent thrust wedges: Implications for the localization of up-lift and exhumation: Geology, v. 35, no. 6, p. 559–562, doi: 10.1130/G23448A.1.
Pazzaglia, F.J., and Brandon, M.T., 2001, A fl uvial record of long-term steady-state uplift and erosion across the Cascadia forearc high, western Washington State:
American Journal of Science, v. 301, no. 4–5, p. 385–431, doi: 10.2475/ajs.301.4-5.385.
Powell, L.K., 2003, Feedback between Erosion and Fault Reactivation in the Puli Basin: Hsüehshan Belt of Central Taiwan [Master’s thesis]: Boulder, Colorado, University of Colorado, 61 p.
Roe, G.H., Stolar, D.B., and Willett, S.D., 2006, Response of a steady-state critical wedge orogen to changes in climate and tectonic forcing, in Tectonics, Climate, and Landscape Evolution: Penrose Conference Taroko Gorge, Taiwan: Geological Society of America Special Paper 398, p. 227–239.
Selby, M.J., 1980, A rock mass strength classifi cation for geomorphic purposes: With tests from Antarctica and New Zealand: Zeitschrift für Geomorphologie, v. 24, no. 1, p. 31–51.
Simoes, M., and Avouac, J.P., 2006, Investigating the kine-matics of mountain building in Taiwan from the spatio-temporal evolution of the foreland basin and western foothills: Journal of Geophysical Research–Solid Earth, v. 111, no. B10, p. 1–25.
Simoes, M., Avouac, J.P., Beyssac, O., Goffe, B., Farley, K.A., and Chen, Y.G., 2007a, Mountain building in Tai-wan: A thermokinematic model: Journal of Geophysi-cal Research–Solid Earth, v. 112, no. B11, p. 1–25.
Simoes, M., Avouac, J.P., and Chen, Y.G., 2007b, Slip rates on the Chelungpu and Chushiang thrust faults inferred from a deformed strath terrace along the Dungpuna River, west central Taiwan: Journal of Geophysical Re-search–Solid Earth, v. 112, no. B3, p. 1–17.
Simoes, M., Avouac, J.P., Chen, Y.G., Singhvi, A.K., Wang, C.Y., Jaiswal, M., Chan, Y.C., and Bernard, S., 2007c, Kinematic analysis of the Pakuashan fault tip fold, west central Taiwan: Shortening rate and age of fold-ing inception: Journal of Geophysical Research–Solid Earth, v. 112, no. B3, p. 1–30.
Snyder, N.P., Whipple, K.X., Tucker, G.E., and Merritts, D.J., 2000, Landscape response to tectonic forcing: Digital elevation model analysis of stream profi les in the Mendocino triple junction region, northern California: Geological Society of America Bul-letin, v. 112, no. 8, p. 1250–1263, doi: 10.1130/0016-7606(2000)112<1250:LRTTFD>2.3.CO;2.
Snyder, N.P., Whipple, K.X., Tucker, G.E., and Merritts, D.J., 2003, Importance of a stochastic distribution of fl oods and erosion thresholds in the bedrock river inci-sion problem: Journal of Geophysical Research–Solid Earth, v. 108, no. B2, p. 1–15.
Stark, C.P., 2006, A self-regulating model of bedrock river channel geometry: Geophysical Research Letters, v. 33, no. 4, p. 1–5, doi: 10.1029/2005GL023193.
Sung, Q.C., Chen, Y.C., Tsai, H., Chen, Y.G., and Chen, W.S., 2000, Comparison study on the coseismic defor-mation of the 1999 Chi-Chi earthquake and long-term stream gradient changes along the Chelungpu fault in central Taiwan: Terrestrial Atmospheric and Oceanic Sciences, v. 11, no. 3, p. 735–750.
Suppe, J., 2007, Absolute fault and crustal strength from wedge tapers: Geology, v. 35, no. 12, p. 1127–1130, doi: 10.1130/G24053A.1.
Tarboton, D.G., Bras, R.L., and Rodrigueziturbe, I., 1989, Scaling and elevation in river networks: Water Re-sources Research, v. 25, no. 9, p. 2037–2051, doi: 10.1029/WR025i009p02037.
Tsai, H., and Sung, Q.C., 2003, Geomorphic evidence for an active pop-up zone associated with the Chelungpu fault in central Taiwan: Geomorphology, v. 56, no. 1–2, p. 31–47, doi: 10.1016/S0169-555X(03)00044-8.
Tucker, G.E., 2004, Drainage basin sensitivity to tectonic and climatic forcing: Implications of a stochastic model for the role of entrainment and erosion thresh-olds: Earth Surface Processes and Landforms, v. 29, no. 2, p. 185–205, doi: 10.1002/esp.1020.
Tucker, G.E., and Whipple, K.X., 2002, Topographic out-comes predicted by stream erosion models: Sensitivity analysis and intermodel comparison: Journal of Geo-physical Research–Solid Earth, v. 107, no. B9, p. 1–16.
Turowski, J.M., Lague, D., and Hovius, N., 2007, Cover effect in bedrock abrasion: A new derivation and its implications for the modeling of bedrock channel mor-phology: Journal of Geophysical Research–Earth Sur-face, v. 112, no. F4, p. 1–16.

Yanites et al.
1208 Geological Society of America Bulletin, July/August 2010
Upton, P., Mueller, K.J., and Chen, Y.G., 2009, Three di-mensional numerical models with varied material properties and erosion rates: Implications for the mechanics and kinematics of compressive wedges: Journal of Geophysical Research–Solid Earth, v. 114, no. B04408, p. 1–18.
Wallinga, J., 2002, Optically stimulated luminescence dat-ing of fl uvial deposits: A review: Boreas, v. 31, no. 4, p. 303–322, doi: 10.1080/030094802320942536.
Whipple, K.X., 2004, Bedrock rivers and the geomorphol-ogy of active orogens: Annual Review of Earth and Planetary Sciences, v. 32, p. 151–185, doi: 10.1146/annurev.earth.32.101802.120356.
Whipple, K.X., and Meade, B.J., 2006, Orogen response to changes in climatic and tectonic forcing: Earth and Planetary Science Letters, v. 243, no. 1–2, p. 218–228, doi: 10.1016/j.epsl.2005.12.022.
Whipple, K.X., and Tucker, G.E., 1999, Dynamics of the stream-power river incision model: Implications for height limits of mountain ranges, landscape response timescales, and research needs: Journal of Geophysi-cal Research–Solid Earth, v. 104, no. B8, p. 17,661–17,674, doi: 10.1029/1999JB900120.
Whipple, K.X., Hancock, G.S., and Anderson, R.S., 2000, River incision into bedrock: Mechanics and relative ef-fi cacy of plucking, abrasion, and cavitation: Geological Society of America Bulletin, v. 112, no. 3, p. 490–503, doi: 10.1130/0016-7606(2000)112<0490:RIIBMA>2.3.CO;2.
Whittaker, A.C., Cowie, P.A., Attal, M., Tucker, G.E., and Roberts, G.P., 2007, Bedrock channel adjustment to tectonic forcing: Implications for predicting river in-cision rates: Geology, v. 35, no. 2, p. 103–106, doi: 10.1130/G23106A.1.
Wilcox, T., Meuller, K.J., and Chen, Y.G., 2007, Sys tematic variations in synorogenic fi ll architecture and fault offsets along strike across the Puli topographic em-bayment: Quaternary strain gradients in the central Western Foothills and Taiwanese foreland basin, in Eos (Transactions, American Geophysical Union), v. 88, no. 52, Fall meeting supplement, abstract T32C–07.
Willett, S.D., 1999, Orogeny and orography: The effects of erosion on the structure of mountain belts: Journal of Geophysical Research–Solid Earth, v. 104, no. B12, p. 28,957–28,981, doi: 10.1029/1999JB900248.
Willett, S.D., and Brandon, M.T., 2002, On steady states in mountain belts: Geology, v. 30, no. 2, p. 175–178, doi: 10.1130/0091-7613(2002)030<0175:OSSIMB>2.0.CO;2.
Willett, S.D., Beaumont, C., and Fullsack, P., 1993, Mechanical model for the tectonics of doubly vergent compressional orogens: Geology, v. 21, no. 4, p. 371–374, doi: 10.1130/0091-7613(1993)021<0371:MMFTTO>2.3.CO;2.
Wobus, C., Whipple, K.X., Kirby, E., Snyder, N., Johnson, J., Spyropolou, K., Crosby, B., and Sheehan, D., 2006a, Tectonics from topography; procedures, promise, and pitfalls, in Tectonics, Climate, and Landscape Evolution:
Penrose Conference Taroko Gorge, Taiwan: Geological Society of America Special Paper 398, p. 55–74.
Wobus, C.W., Tucker, G.E., and Anderson, R.S., 2006b, Self-formed bedrock channels: Geophysical Research Let-ters, v. 33, no. 18, p. 1–5, doi: 10.1029/2006GL027182.
Wobus, C.W., Kean, J.W., Tucker, G.E., and Anderson, R.S., 2008, Modeling the evolution of channel shape: Bal-ancing computational effi ciency with hydraulic fi del-ity: Journal of Geophysical Research–Earth Surface, v. 113, no. F2, p. 1–17.
Yanites, B.J., Tucker, G.E., Hsu, H.L., Chen, C.C., Chen, Y.G., Mueller, K.J., and Wilcox, T., 2008, Variability in hillslope sediment fl ux modulates bedrock channel incision rates: Evidence from the Peikang River, cen-tral Taiwan: Eos (Transactions, American Geophysical Union), v. 89, no. 53, Fall meeting supplement, abstract H54D-06.
Yue, L.F., Suppe, J., and Hung, J.H., 2005, Structural geol-ogy of a classic thrust belt earthquake: The 1999 Chi-Chi earthquake Taiwan (Mw=7.6): Journal of Structural Geology, v. 27, no. 11, p. 2058–2083.
MANUSCRIPT RECEIVED16 FEBRUARY 2009REVISED MANUSCRIPT RECEIVED 31 AUGUST 2009MANUSCRIPT ACCEPTED 4 SEPTEMBER 2009
Printed in the USA