incinerator monitoring program 2013 ash characterization
TRANSCRIPT

Onondaga County Health Department
Division of Environmental Health
421 Montgomery Street
Syracuse, New York 13202
Incinerator Monitoring Program
2013 Ash Characterization Summary
April 1, 2014
Submitted To: Cynthia B. Morrow, M.D., M.P.H. Commissioner of Health Submitted By: Kevin L. Zimmerman Director, Division of Environmental Health

2
Contents:
I. Table of Abbreviations. II. Executive Summary. III. Introduction. IV. Element Specific Summary. V. Summary and Conclusions. VI. Wet Weight Ash Metal Analysis Data: Fall 1995 to Fall 2011. VI.A. Wet Weight Mean Values Ash Data Graph: As, Cd, Cr, Ni, V VI.B. Wet Weight Mean Values Ash Data Graph: Be, Hg, Se VI.C. Wet Weight Mean Values Ash Data Graph: Pb, Zn VII. Dry Weight Ash Metal Analysis Data: Fall 1998 to Fall 2011. VII.A. Dry Weight Mean Values Ash Data Graph: As, Cd. Cr, Ni, V VII.B. Dry Weight Mean Values Ash Data Graph:. Be, Hg, Se VII.C. Dry Weight Mean Values Ashe Data Graph: Pb, Zn VIII. NYSDEC Ash Residue Characterization Project, 1992, Summary of Ash Results.

3
I . Table of Abbreviations
The following abbreviations may be used throughout this report: As Arsenic. Be Beryllium. Cd Cadmium. CES Certified Environmental Services. Cr Chromium. CV Coefficient of Variation. ELAP Environmental Laboratory Approval Program. ELS Environmental Laboratory Services. Hg Mercury. LD Limit of Detection. Ni Nickel. NYSDEC New York State Department of Environmental Conservation. OCHD Onondaga County Health Department. Pb Lead. ppm parts per million. ug/g micrograms per gram ( = ppm). SD Standard Deviation. Se Selenium. V Vanadium. WTE Waste To Energy Facility. Zn Zinc. ~ approximately. < Less than. > Greater than. NA Not applicable. Note: Values <LD were not included in average, SD and CV calculations.

4
II. Executive Summary Sample analyses for the 2013 ash characterization study were conducted by Life Science’s Laboratories, Inc. (formerly O’Brien and Gere Laboratories, Inc.). As has been the format since the Fall 1998 reporting period, the year 2013 results have been reported on both a wet weight and dry weight basis. Results through the Spring 1998 reporting period were reported exclusively on a wet weight basis. Each of these reported values provides important information regarding ash metal data. Wet weight values will be used for historical comparison relative to the conditions of the ash as it leaves the WTE Facility. Dry weight values will allow for better comparison with future metal concentrations, removing the variability of ash moisture content. Dry weight values will tend to be higher than wet weight since the weight of the “inert” water is removed in the concentration calculations. This report uses the individual metal “mean plus three standard deviations” as a benchmark for consistent results. Calculations include all wet weight data through the Fall 2013 sampling period. This standard is supported by the NYSDEC data in which at least 95% of the individual metal results are within the “mean plus three standard deviations” for the respective metals. It is evident by looking at the data from this report and the NYSDEC data that there will be occasional results outside of this benchmark. Occasional outlying sample results are not considered to be of significance. Such results may be due to the fact that, while every effort is used to create a homogeneous combined ash sample, it is not feasible to obtain such a sample because of the presence of incombustible “chunks” in the bottom ash. Ash collection and compositing continues to be the responsibility of Covanta Energies Systems of Onondaga under NYSDEC protocols. The Health Department and Covanta Energies utilize split samples to ensure the most accurate results.

5
III. Introduction
The purpose of this study is to provide part of an ongoing evaluation of ash generated at the Onondaga County Resource Recovery Agency Waste-To-Energy facility. The results summarized in this report reflect analysis of combined fly and bottom ash samples from Fall 1995 through Fall 2013. The ash samples were analyzed for total metal concentration for arsenic, beryllium, cadmium, chromium, lead, mercury, nickel, selenium, vanadium and zinc.
In 2011, due to improvements in laboratory equipment, the detection limits for beryllium, cadmium, and selenium have been lowered. Therefore there are detectable levels of these metals in many of the ash samples starting in 2011 as compared to previous years. As part of our evaluation of the metals content of the ash samples, the average value concentrations from each semiannual sampling period are compared to the analogous values from the combined ash samples from the NYSDEC “Ash Residue Characterization Project” (1992). Average and standard deviation calculations do not include those results less than a limit of detection. The results in this report represent total metal content in the combined fly and bottom ash from the WTE Facility. The standard test for determining the leachability of constituents of combined ash is the TCLP protocol established by the USEPA and accepted by the NYSDEC. Total metal content is not necessarily indicative of the leachability of contaminants from the ash.

6
IV. Element Specific Summary Arsenic Ash sample values in the 2013 study varied from 24.0 ppm wet weight (32.0 ppm dry wt) to a high value of 77.0 ppm wet weight (98.0 ppm dry wt). There were no arsenic results above the mean + 3SD level of 86 ppm wet weight. The distribution and average for arsenic during the 2013 sampling period is consistent with the NYSDEC mean arsenic value of 19.1 ppm.
Beryllium Ash sample values in the 2013 study varied from 0.33 ppm wet weight (0.45 ppm dry wt) to a high value of 0.55 ppm wet weight (0.7 ppm dry wt). One ash sample had a beryllium value above the mean + 3SD level of 0.64 ppm wet weight. Beryllium was not evaluated in the DEC study. Cadmium Ash sample values in the 2013 study varied from 29.0 ppm wet weight (40.0 ppm dry wt) to a high value of 54.0 ppm wet weight (68.0 ppm dry wt). There were no cadmium results above the mean + 3SD level of 63.3 ppm wet weight. The distribution and average for cadmium during the 2013 sampling period is consistent with the NYSDEC mean cadmium value of 33.6 ppm.
Chromium
Ash sample values in the 2013 study varied from 48.0 ppm wet weight (59.0 ppm dry wt) to a high value of 130.0 ppm wet weight (160.0 ppm dry wt). One ash sample had a chromium value above the mean + 3SD level of 122.5 ppm wet weight. The distribution and average for chromium during the 2013 sampling period is very consistent with the NYSDEC mean chromium value of 259 ppm. The DEC average value of 259 ppm is skewed by a single outlying sample result. Lead Ash sample values in the 2013 study varied from 430 ppm wet weight (560 ppm dry wt) to a high value of 1,400 ppm wet weight (1,700 ppm dry wt). There were no lead results above the mean + 3SD level of 1651 ppm wet weight. The distribution and average for lead during the 2013 sampling period is consistent with the NYSDEC mean lead value of 1,558 ppm.

7
Mercury Ash sample values in the 2013 study varied from 1.8 ppm wet weight (2.3 ppm dry wt) to a high value of 6.5 ppm wet weight (9.0 ppm dry wt). There were no mercury results above the mean + 3SD level of 6.7 ppm wet weight. The distribution and average for mercury during the 2013 sampling period is very consistent with the NYSDEC mean mercury value of 10.9 ppm.
Nickel
Ash sample values in the 2013 study varied from 24.0 ppm wet weight (30.0 ppm dry wt) to a high value of 301.0 ppm wet weight (390.0 ppm dry wt). There was one nickel result above the mean + 3SD level of 300 ppm wet weight. The distribution and average for nickel during the 2013 sampling period is significantly lower than the NYSDEC mean nickel value of 658 ppm. Selenium Ash sample values in the 2013 study varied from 0.5 ppm wet weight (0.6 ppm dry wt) to a high value of 1.5 ppm wet weight (1.9 ppm dry wt). There were no selenium results above the mean + 3SD level of 1.9 ppm wet weight. The distribution and average for selenium during the 2013 sampling period is very consistent with the NYSDEC mean selenium value of 2.66 ppm.
Vanadium
Ash sample values in the 2013 study varied from 23.0 ppm wet weight (31.0 ppm dry wt) to a high value of 39.0 ppm wet weight (51.0 ppm dry wt). There were no vanadium results above the mean + 3SD level of 42.7 ppm wet weight. Vanadium was not evaluated in the DEC study.
Zinc
Ash sample values in the 2013 study varied from 2,900 ppm wet weight (3,800 ppm dry wt) to a high value of 4,700 ppm wet weight (6,100 ppm dry wt). One ash sample had a zinc value above the mean + 3SD level of 5,455 ppm wet weight. The distribution and average for zinc during the 2013 sampling period is consistent with the NYSDEC mean zinc value of 3,666 ppm.

8
V. Summary and Conclusions
The data contained in this report indicates consistent levels for all metals in the combined ash residue throughout the first nineteen years of operation. The samples from the Fall 1995 to Fall 2013 sampling periods are also consistent with those of the NYSDEC “Ash Residue Characterization Project”. The Health Department recognizes that there are inherent difficulties in using the NYSDEC study for comparison. The DEC study uses several different ash producing sources for their data. Also, the data is from a very specific time period. It does not take into account changes in the municipal solid waste stream due to time of year, increased recycling efforts, etc. However, results from the Health Department’s study have shown that these variables have little significant effect on the total metal concentration in the ash. This is apparent when looking at the individual results and the sampling period averages over time. Well over 95% of the individual results from the ash characterization studies to date are within the “mean plus three standard deviation” criteria. Additionally, average metal values for each of the sampling periods show little relative change throughout the time frame of this report.


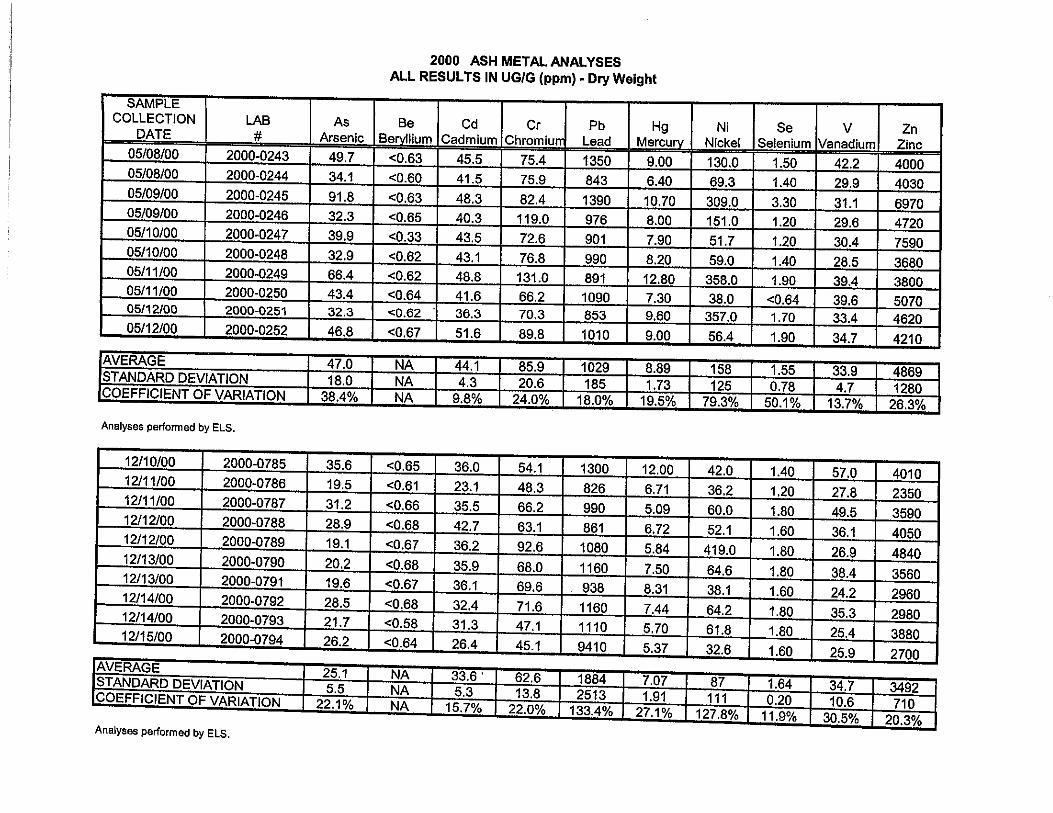
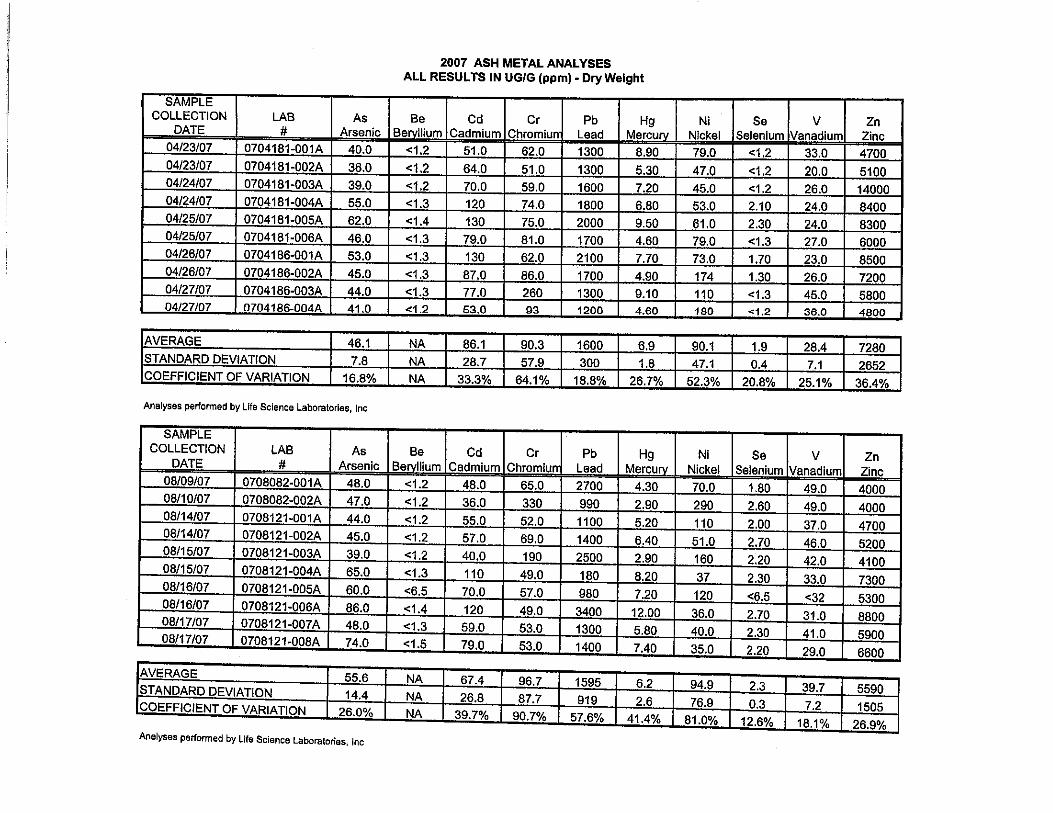
2013 ASH METAL ANALYSES
ALL RESULTS IN UG/G (ppm) - Wet Weight
Sample
Collection Lab As Be Cd Cr Pb Hg Ni Se V Zn
Date # Arsenic Beryllium Cadmium Chromium Lead Mercury Nickel Selenium Vanadium Zinc
6/11/2013 K1306243-001A 47 0.54 36 61 950 2.3 37 1.1 27 3500
6/12/2013 K1306243-002A 53 0.55 44 59 1300 3.7 27 1.4 26 4100
6/12/2013 K1306243-003A 44 0.48 33 59 610 2.5 25 0.68 24 3900
6/13/2013 K1306243-004A 42 0.55 30 74 430 1.8 37 0.5 39 3200
6/13/2013 K1306243-005A 51 0.45 40 59 610 2.2 31 1.1 24 4600
6/14/2013 K1306243-006A 54 0.43 37 52 610 3.3 24 1 25 3200
6/18/2013 K1306243-007A 59 0.36 49 52 600 2.5 24 1.4 25 3900
6/18/2013 K1306243-008A 48 0.48 38 67 630 2.5 58 1 32 3100
6/19/2013 K1306243-009A 77 0.36 42 82 820 3.4 51 0.65 29 3500
6/19/2013 K1306243-010A 69 0.46 54 130 1100 4.1 98 1.5 33 4200
Average 54.4 0.5 40.3 69.5 766.0 2.8 41.2 1.0 28.4 3720.0
Standard Deviation 11.1 0.1 7.3 23.2 271.9 0.7 23.1 0.3 4.9 498.4
Coefficient of variation 20.5% 15.0% 18.0% 33.4% 35.5% 26.3% 56.1% 33.1% 17.3% 13.4%
Sample
Collection Lab As Be Cd Cr Pb Hg Ni Se V Zn
Date # Arsenic Beryllium Cadmium Chromium Lead Mercury Nickel Selenium Vanadium Zinc
11/4/2013 K1311221-001A 42 0.36 42 51 1400 3.1 33 0.82 36 4200
11/4/2013 K1311221-002A 41 0.41 46 50 560 3.3 28 0.9 35 4600
11/5/2013 K1311221-003A 37 0.33 49 48 830 3.7 30 1.2 23 4200
11/5/2013 K1311221-004A 37 0.34 45 91 1200 2.7 301 1.1 26 4000
11/6/2013 K1311221-005A 24 0.37 31 60 550 3.3 120 0.5 28 2900
11/6/2013 K1311221-006A 41 0.37 50 72 560 3.1 79 1.1 29 4700
11/13/2013 K1311221-007A 25 0.36 32 48 860 3.3 260 0.73 28 3200
11/13/2013 K1311221-008A 36 0.45 44 50 910 5.8 40 1.3 27 4200
11/14/2013 K1311221-009A 28 0.45 28 53 450 3.2 50 0.59 30 3300
11/14/2013 K1311221-010A 26 0.42 29 66 420 6.5 50 0.63 35 3500
Average 33.7 0.45 39.6 58.9 774 3.8 99.1 0.9 29.7 3880
Standard Deviation 7.2 0.0 8.6 13.9 329.0 1.3 100.0 0.3 4.3 616.1
Coefficient of variation 21.3% 9.7% 21.8% 23.7% 42.5% 33.5% 100.9% 31.3% 14.6% 15.9%
Analysis performed by Life Science Laboratories, Inc.


2013 ASH METAL ANALYSIS
ALL RESULTS IN UG/G (ppm) - Dry Weight
Sample
Collection Lab As Be Cd Cr Pb Hg Ni Se V Zn
Date # Arsenic Beryllium Cadmium Chromium Lead Mercury Nickel Selenium Vanadium Zinc
6/11/2013 K1306243-011A 68.0 0.8 54.0 85.0 1300.0 3.1 52.0 1.6 38.0 4800
6/12/2013 K1306243-012A 68.0 0.7 56.0 76.0 1700.0 4.7 35.0 1.8 33.0 5200
6/12/2013 K1306243-013A 57.0 0.6 43.0 76.0 790.0 3.2 32.0 1.1 32.0 5100
6/13/2013 K1306243-014A 54.0 0.7 39.0 96.0 560.0 2.3 48.0 0.6 51.0 4100
6/13/2013 K1306243-015A 67.0 0.6 53.0 77.0 810.0 2.8 40.0 1.5 31.0 6100
6/14/2013 K1306243-016A 70.0 0.6 48.0 67.0 780.0 4.3 30.0 1.3 32.0 4100
6/18/2013 K1306243-017A 78.0 0.5 65.0 69.0 790.0 3.3 32.0 1.9 33.0 5200
6/18/2013 K1306243-018A 58.0 0.6 46.0 82.0 770.0 3.1 70.0 1.2 39.0 3800
6/19/2013 K1306243-019A 98.0 0.5 53.0 100.0 1000.0 4.3 65.0 0.8 37.0 4500
6/19/2013 K1306243-20A 87.0 0.6 68.0 160.0 1300.0 5.2 120.0 1.9 42.0 5400
Average 70.5 0.6 52.5 88.8 980.0 3.6 52.4 1.4 36.8 4830.0
Standard Deviation 13.8 0.1 9.1 27.2 347.2 0.9 27.6 0.4 6.2 708.8
Coefficient of variation 19.6% 16.2% 17.3% 30.6% 35.4% 25.7% 52.6% 32.0% 16.8% 14.7%
Sample
Collection Lab As Be Cd Cr Pb Hg Ni Se V Zn
Date # Arsenic Beryllium Cadmium Chromium Lead Mercury Nickel Selenium Vanadium Zinc
11/4/2013 K1311221-011A 53 0.45 53 64 1700 3.9 41 1 45 5300
11/4/2013 K1311221-012A 55 0.54 61 66 740 4.4 37 1.2 47 6100
11/5/2013 K1311221-013A 51 0.45 67 66 1100 5.1 41 1.7 31 5800
11/5/2013 K1311221-014A 46 0.43 55 110 1500 3.4 390 1.3 32 5000
11/6/2013 K1311221-015A 32 0.49 40 78 720 4.4 160 0.66 37 3800
11/6/2013 K1311221-016A 53 0.48 64 94 720 4 100 1.4 38 6100
11/13/2013 K1311221-017A 31 0.44 39 59 1100 4.1 330 0.9 35 4000
11/13/2013 K1311221-018A 45 0.57 56 63 1100 7.3 51 1.7 34 5300
11/14/2013 K1311221-019A 38 0.6 38 70 600 4.3 66 0.78 40 4400
11/14/2013 K1311221-020A 37 0.58 40 91 580 9 69 0.87 48 4800
Average 44.1 0.503 51.3 76.1 986 4.99 128.5 1.151 38.7 5060
Standard Deviation 9.0 0.1 11.2 16.8 384.3 1.8 128.2 0.4 6.1 819.5
Coefficient of variation 20.5% 12.7% 21.8% 22.1% 39.0% 35.4% 99.8% 32.2% 15.9% 16.2%
Analysis performed by Life Science Laboratories, Inc.


