inactivation credit of uv radiation for viruses, bacteria ...projects.itn.pt/luisa...
TRANSCRIPT

ARTICLE IN PRESS
Available at www.sciencedirect.com
WA T E R R E S E A R C H 4 0 ( 2 0 0 6 ) 3 – 2 2
0043-1354/$ - see frodoi:10.1016/j.watres
�Corresponding aE-mail address: w
journal homepage: www.elsevier.com/locate/watres
Review
Inactivation credit of UV radiation for viruses, bacteria andprotozoan (oo)cysts in water: A review
W.A.M. Hijnen�, E.F. Beerendonk, G.J. Medema
Kiwa Water Research Ltd., P.O. Box 1072, 3430 BB Nieuwegein, The Netherlands
a r t i c l e i n f o
Article history:
Received 30 November 2004
Received in revised form
24 October 2005
Accepted 26 October 2005
Keywords:
UV irradiation
Inactivation
Kinetics
k-value
Viruses
Protozoa
Bacteria
Drinking water treatment
nt matter & 2005 Elsevie.2005.10.030
uthor. Tel.: +31 [email protected] (W.A.
a b s t r a c t
UV disinfection technology is of growing interest in the water industry since it was
demonstrated that UV radiation is very effective against (oo)cysts of Cryptosporidium and
Giardia, two pathogenic micro-organisms of major importance for the safety of drinking
water. Quantitative Microbial Risk Assessment, the new concept for microbial safety of
drinking water and wastewater, requires quantitative data of the inactivation or removal of
pathogenic micro-organisms by water treatment processes. The objective of this study was
to review the literature on UV disinfection and extract quantitative information about the
relation between the inactivation of micro-organisms and the applied UV fluence. The
quality of the available studies was evaluated and only high-quality studies were
incorporated in the analysis of the inactivation kinetics.
The results show that UV is effective against all waterborne pathogens. The inactivation
of micro-organisms by UV could be described with first-order kinetics using fluence-
inactivation data from laboratory studies in collimated beam tests. No inactivation at low
fluences (offset) and/or no further increase of inactivation at higher fluences (tailing) was
observed for some micro-organisms. Where observed, these were included in the
description of the inactivation kinetics, even though the cause of tailing is still a matter
of debate. The parameters that were used to describe inactivation are the inactivation rate
constant k (cm2/mJ), the maximum inactivation demonstrated and (only for bacterial
spores and Acanthamoeba) the offset value. These parameters were the basis for the
calculation of the microbial inactivation credit (MIC ¼ ‘‘log-credits’’) that can be assigned to
a certain UV fluence. The most UV-resistant organisms are viruses, specifically Adeno-
viruses, and bacterial spores. The protozoon Acanthamoeba is also highly UV resistant.
Bacteria and (oo)cysts of Cryptosporidium and Giardia are more susceptible with a fluence
requirement of o20 mJ/cm2 for an MIC of 3 log.
Several studies have reported an increased UV resistance of environmental bacteria and
bacterial spores, compared to lab-grown strains. This means that higher UV fluences are
required to obtain the same level of inactivation. Hence, for bacteria and spores, a
correction factor of 2 and 4 was included in the MIC calculation, respectively, whereas some
wastewater studies suggest that a correction of a factor of 7 is needed under these
conditions. For phages and viruses this phenomenon appears to be of little significance and
for protozoan (oo)cysts this aspect needs further investigation. Correction of the required
fluence for DNA repair is considered unnecessary under the conditions of drinking water
practice (no photo-repair, dark repair insignificant, esp. at higher (60 mJ/cm2) fluences) and
r Ltd. All rights reserved.
6; fax: +31 306061165.M. Hijnen).
ARTICLE IN PRESS
WAT E R R E S E A R C H 4 0 ( 2 0 0 6 ) 3 – 2 24
probably also wastewater practice (photo-repair limited by light absorption). To enable
accurate assessment of the effective fluence in continuous flow UV systems in water
treatment practice, biodosimetry is still essential, although the use of computational fluid
dynamics (CFD) improves the description of reactor hydraulics and fluence distribution. For
UV systems that are primarily dedicated to inactivate the more sensitive pathogens
(Cryptosporidium, Giardia, pathogenic bacteria), additional model organisms are needed to
serve as biodosimeter.
& 2005 Elsevier Ltd. All rights reserved.
Contents
1. Introduction . . . . . . . . . . . . . . . . . . . . . . . . . . . . . . . . . . . . . . . . . . . . . . . . . . . . . . . . . . . . . . . . . . . . . . . . . . . 42. Materials and methods. . . . . . . . . . . . . . . . . . . . . . . . . . . . . . . . . . . . . . . . . . . . . . . . . . . . . . . . . . . . . . . . . . . 5
2.1. Selection of the reviewed literature . . . . . . . . . . . . . . . . . . . . . . . . . . . . . . . . . . . . . . . . . . . . . . . . . . . . 52.2. Experimental conditions . . . . . . . . . . . . . . . . . . . . . . . . . . . . . . . . . . . . . . . . . . . . . . . . . . . . . . . . . . . . . 52.3. Drinking water and wastewater studies . . . . . . . . . . . . . . . . . . . . . . . . . . . . . . . . . . . . . . . . . . . . . . . . . 52.4. UV fluence data . . . . . . . . . . . . . . . . . . . . . . . . . . . . . . . . . . . . . . . . . . . . . . . . . . . . . . . . . . . . . . . . . . . . 52.5. Inactivation kinetics of the micro-organisms . . . . . . . . . . . . . . . . . . . . . . . . . . . . . . . . . . . . . . . . . . . . . 52.6. Influence of process conditions . . . . . . . . . . . . . . . . . . . . . . . . . . . . . . . . . . . . . . . . . . . . . . . . . . . . . . . 6
3. Results and discussion . . . . . . . . . . . . . . . . . . . . . . . . . . . . . . . . . . . . . . . . . . . . . . . . . . . . . . . . . . . . . . . . . . . 63.1. UV sensitivity of micro-organisms . . . . . . . . . . . . . . . . . . . . . . . . . . . . . . . . . . . . . . . . . . . . . . . . . . . . . 6
3.1.1. Viruses and bacteriophages. . . . . . . . . . . . . . . . . . . . . . . . . . . . . . . . . . . . . . . . . . . . . . . . . . . . . 63.1.2. Bacteria and bacterial spores . . . . . . . . . . . . . . . . . . . . . . . . . . . . . . . . . . . . . . . . . . . . . . . . . . . 93.1.3. Pathogenic protozoa . . . . . . . . . . . . . . . . . . . . . . . . . . . . . . . . . . . . . . . . . . . . . . . . . . . . . . . . . . 9
3.2. Process conditions. . . . . . . . . . . . . . . . . . . . . . . . . . . . . . . . . . . . . . . . . . . . . . . . . . . . . . . . . . . . . . . . . 103.2.1. Micro-organism-related factors . . . . . . . . . . . . . . . . . . . . . . . . . . . . . . . . . . . . . . . . . . . . . . . . . 113.2.2. Fluence-related factors . . . . . . . . . . . . . . . . . . . . . . . . . . . . . . . . . . . . . . . . . . . . . . . . . . . . . . . 15
4. General discussion . . . . . . . . . . . . . . . . . . . . . . . . . . . . . . . . . . . . . . . . . . . . . . . . . . . . . . . . . . . . . . . . . . . . . 164.1. Kinetics of UV inactivation . . . . . . . . . . . . . . . . . . . . . . . . . . . . . . . . . . . . . . . . . . . . . . . . . . . . . . . . . . 164.2. Significance for water disinfection . . . . . . . . . . . . . . . . . . . . . . . . . . . . . . . . . . . . . . . . . . . . . . . . . . . . 164.3. Correction of the required fluence: micro-organism-related factors . . . . . . . . . . . . . . . . . . . . . . . . . . 174.4. Correction of the required fluence: fluence-related factors . . . . . . . . . . . . . . . . . . . . . . . . . . . . . . . . . 174.5. Required fluence table. . . . . . . . . . . . . . . . . . . . . . . . . . . . . . . . . . . . . . . . . . . . . . . . . . . . . . . . . . . . . . 184.6. Research items . . . . . . . . . . . . . . . . . . . . . . . . . . . . . . . . . . . . . . . . . . . . . . . . . . . . . . . . . . . . . . . . . . . 18
5. Conclusions . . . . . . . . . . . . . . . . . . . . . . . . . . . . . . . . . . . . . . . . . . . . . . . . . . . . . . . . . . . . . . . . . . . . . . . . . . 18Acknowledgements . . . . . . . . . . . . . . . . . . . . . . . . . . . . . . . . . . . . . . . . . . . . . . . . . . . . . . . . . . . . . . . . . . . . . . . . 19References . . . . . . . . . . . . . . . . . . . . . . . . . . . . . . . . . . . . . . . . . . . . . . . . . . . . . . . . . . . . . . . . . . . . . . . . . . . . . . . 19
1. Introduction
The first application of UV irradiation in drinking water as
disinfection process was in 1910 in Marseille (Henry et al.,
1910), after the development of the mercury vapour lamp and
the quartz tube and establishing the germicidal effect of UV
irradiation. According to Wolfe (1990) and Hoyer (2004),
general application was hampered because of high costs,
poor equipment reliability, maintenance problems and the
advent of chlorination (cheaper, more reliable and potential to
measure disinfectant residual). Due to the increased informa-
tion on the production of hazardous oxidation by-products
during chlorination and ozonation, UV irradiation gained
more attention; low-pressure UV produces almost no by-
products. Also, unlike chemical disinfectants, the biological
stability of the water is not affected by low-pressure lamps. In
Europe, UV has been widely applied for drinking water
disinfection since the 1980s, for the control of incidental
contamination of vulnerable groundwater and for reduction
of Heterotrophic Plate Counts (Kruithof et al., 1992). The
breakthrough of UV applicability as a primary disinfection
process in the US and Europe came after the discovery of
the high efficacy of UV irradiation against Cryptosporidium
(Clancy et al., 1998) and Giardia. Chemical disinfection with
chlorine is not effective against these pathogens and ozone
applied at low CT values to limit formation of bromate has
relatively little effect on the infectivity of the protozoan
(oo)cysts. In contrast, infectivity of these pathogens is
significantly reduced by UV fluences that can readily be
applied in drinking water treatment. UV is now regarded
as being broadly effective against all pathogens, bacteria,
protozoa and viruses that can be transmitted through
drinking water.
The introduction of the quantitative microbiological risk
assessment (QMRA) to define the microbiological safety of
drinking water (Haas, 1983; Regli et al., 1991; Teunis et al.,
1997; Medema et al., 2003) is a development of growing
interest. Besides knowledge about the presence of pathogenic

ARTICLE IN PRESS
WAT E R R E S EA R CH 40 (2006) 3– 22 5
micro-organisms in the source water, QMRA requires quanti-
tative knowledge about the capacity of water treatment
processes, including UV disinfection, to eliminate (remove
or inactivate) pathogenic micro-organisms.
The aim of this study was to evaluate available literature
data and create a well-defined database which enables
calculation of the microbial inactivation credit (MIC) of UV
disinfection for viruses, bacteria and protozoan (oo)cysts in
water. Most studies are lab-scale based. For full-scale
chemical disinfection processes with chlorine and ozone, it
was demonstrated that the MIC for Escherichia coli was lower
than expected from the applied CT values and the known
dose–response curves determined under laboratory condi-
tions (Hijnen et al., 2000, 2004a). Therefore, literature was
evaluated to verify the influence of process conditions on
the MIC of full-scale UV disinfection processes. The results
of this review were also used to identify further research
needs.
2. Materials and methods
2.1. Selection of the reviewed literature
Literature on the inactivation of viruses, bacteriophages,
bacteria, bacterial spores and protozoan (oo)cysts by UV
irradiation in water was collected and evaluated on technical
and microbiological aspects. In the review, only those studies
were used where inactivation was assessed using generally
accepted microbial culturing (solid media or tissues) or
animal infectivity methods. Similarly, only studies were
evaluated in which assessment of the UV fluence was clearly
described and based on either UV sensor measurements,
fluence calculations and/or reduction equivalent fluence (REF)
assessment with (bio)dosimetry. The description and quality
of the microbiological data, quality assurance and reproduci-
bility of the experimental data, as well as the availability and
quality of the technical and experimental conditions were
reviewed. Only those studies where process and experimental
conditions were well documented were used.
2.2. Experimental conditions
The inactivation of micro-organisms by UV irradiation has
been studied under different experimental conditions. Many
studies used a collimated beam apparatus (CB tests) under
bench-scale and well-defined laboratory conditions. A volume
of inoculated water is irradiated during varying periods
of time under a lamp emitting UV light. Other studies
used continuous flow systems (CF systems) in a laboratory,
in a pilot- or demonstration plant or under full-scale
conditions where the water passes a reactor with one or
more UV lamps and UV irradiation and contact time vary over
the reactor.
2.3. Drinking water and wastewater studies
UV disinfection is applied in the drinking water industry and
for disinfection of treated wastewater. Studies from both
applications were reviewed and identified as such. Papers on
wastewater studies (WWS) usually describe disinfection of
secondary effluent with or without an additional pre-treat-
ment. In the drinking water studies (DWS), water is generally
of much lower turbidity and higher UV transmission than in
wastewater. When relevant, the influence of these para-
meters is discussed.
2.4. UV fluence data
UV fluence cannot be measured directly, so it has to be
inferred from monitoring the UV irradiance with a UV sensor
and the time that the micro-organisms are exposed to UV. For
the collimated beam experiments, the average UV irradiance
and contact time are well-characterised and have small
confidence intervals. For CF systems, the average UV fluence
can be calculated from the same parameters. However, the
confidence intervals are much larger, due to the much larger
variation in contact time and in UV irradiation at different
points in the reactor, compared to the collimated beam
experiments. By modelling the hydraulic retention time in the
UV reactor, using computational fluid dynamics (CFD) accu-
racy of these calculations has increased the last few years.
Alternatively, the REF of CF systems can be determined with
biodosimetry (Qualls and Johnson, 1983a; Sommer et al., 1999;
Osterreichisches normungsinstitut, 1999; Hoyer, 2004; USEPA,
2003). Biodosimetry is performed by challenging the UV
reactor with a micro-organism with calibrated UV inactiva-
tion kinetics (biodosimeter) assessed with CB tests in the
test water. With the measured inactivation of the biodosi-
meter and the calibration curve, the REF (mJ/cm2) can be
calculated.
2.5. Inactivation kinetics of the micro-organisms
The inactivation kinetics of a large number of pathogenic
micro-organisms and indicator micro-organisms that are
significant to the microbial safety of water have been
calculated from studies where UV fluence has been deter-
mined under optimal conditions: CB tests with ‘‘drinking
water’’ (low turbidity and high UV transmission).
Inactivation by UV is based on the damage caused to the
nucleic acids (DNA/RNA) of the cell or virus. Primarily the
formation of pyrimidine dimers, but also of other photo-
products of nucleic acids and nucleic acid lesions (von
Sonntag et al., 2004), inhibit replication and transcription
and hence, prevent the cell or virus from multiplying. The UV
absorbance of DNA peaks around 260 nm; at lower and higher
wavelengths the absorbance decreases. Below 230 nm the
absorbance increases again. Most studies used low-pressure
mercury lamps with a major wavelength output (85%) at
254 nm (monochromatic (MC) UV radiation) but for some
micro-organisms the UV inactivation was (also) determined
with polychromatic (PC) UV radiation from medium pressure
(MP) lamps.
The UV sensitivity of the selected micro-organisms is
described by the parameters of the inactivation kinetics.
Inactivation is defined as the reduction of the concentration
of culturable micro-organisms N due to the exposure to a
concentration disinfectant C during a specific contact time t.
The inactivation kinetic for chemical disinfectants is most
ARTICLE IN PRESS
WAT E R R E S E A R C H 4 0 ( 2 0 0 6 ) 3 – 2 26
commonly described by the first-order disinfection model of
Chick (1908) and Watson (1908) and the same model can be
applied for UV disinfection. The inactivation of micro-
organisms is usually described by the log inactivation of N.
Based on the first-order model, the linear relationship
between log inactivation and the UV dose or fluence is
described by:
10 logNt
N
� �¼ �k� Fluence; (1)
where Nt is the microbial concentration after contact
time t. Fluence is the product of the UV fluence rate (mW/
cm2) and the exposure t (mWs/cm2¼mJ/cm2). In the
literature, two main deviations from first-order UV disinfec-
tion kinetics have been observed. Some authors (Knudson,
1985; Hoyer, 1998; Sommer et al., 1998; Mamane-Gravetz and
Linden, 2005) observed no inactivation of bacteria or bacterial
spores at low UV fluences followed by a normal log-linear
relationship at higher UV fluences. This can be described
by a shoulder model and is presented by the following
equation:
DI ¼ �k� Fluence� b, (2)
where DI is the decimal inactivation 10log(Nt/N), b is the y-
intercept, a negative value since the curve is crossing the
fluence axis at the UV fluence where log-linear relationship
starts (offset). The second deviation from the linear kinetics is
no further increase in inactivation at high fluences, called
tailing. Tailing is excluded in the k-value calculation in this
review, by excluding the inactivation data at higher fluences
in studies where tailing was observed (from the plots of
inactivation versus fluence).
2.6. Influence of process conditions
The inactivation kinetics can be used to determine the
disinfection efficacy or MIC (log) of full-scale UV systems
and to assess the fluence requirement to obtain a certain MIC.
However, for translation of CB results to full-scale UV systems
it is essential to know the effect of process conditions on the
efficiency of the radiation process. In contrast to oxidative
disinfection processes with chemicals like chlorine and
ozone, the efficacy of UV disinfection is not affected by
conditions like temperature, pH (Severin et al., 1983; USEPA,
2003) and reactive organic matter. UV absorbance by organic
and inorganic matter is included in the UV fluence calcula-
tion. But the following factors may affect the efficiency of UV
disinfection at full-scale:
�
Factors related to the micro-organisms: physiological state(pre-culturing, growth phase), strain diversity, repair
mechanisms and particle association;
�
Factors related to the fluence assessment: fluencedistribution due to the distribution of the hydraulic
retention time, adsorption, reflection and refraction of
UV light through the water and lamp intensity (aging and
fouling).
Several studies have addressed these aspects and are
discussed to determine whether adaptation of the required
fluence for a certain MIC, calculated by applying the UV
sensitivity data to full-scale UV systems, is required and, if
possible, to quantify to what extent.
3. Results and discussion
3.1. UV sensitivity of micro-organisms
The UV sensitivity or of the micro-organisms is described
with the inactivation rate constant k (cm2/mJ). A UV-sensitive
micro-organism has a high k-value and requires a low fluence
for inactivation according to Eq. (1).
3.1.1. Viruses and bacteriophagesThe number of studies where UV sensitivity of specific
pathogenic viruses and bacteriophages is determined under
well-defined laboratory conditions with collimated beam
apparatus (CB tests) ranged from 1 to 6. The total number of
data per virus or bacteriophage ranged from 3 up to 109
(Tables 1 and 2). The calculated k-value (no shoulder;
intercept ¼ 0) showed a narrow 95% confidence interval (CI)
and a high goodness-of-fit (13 out of 18 r240.85). The six
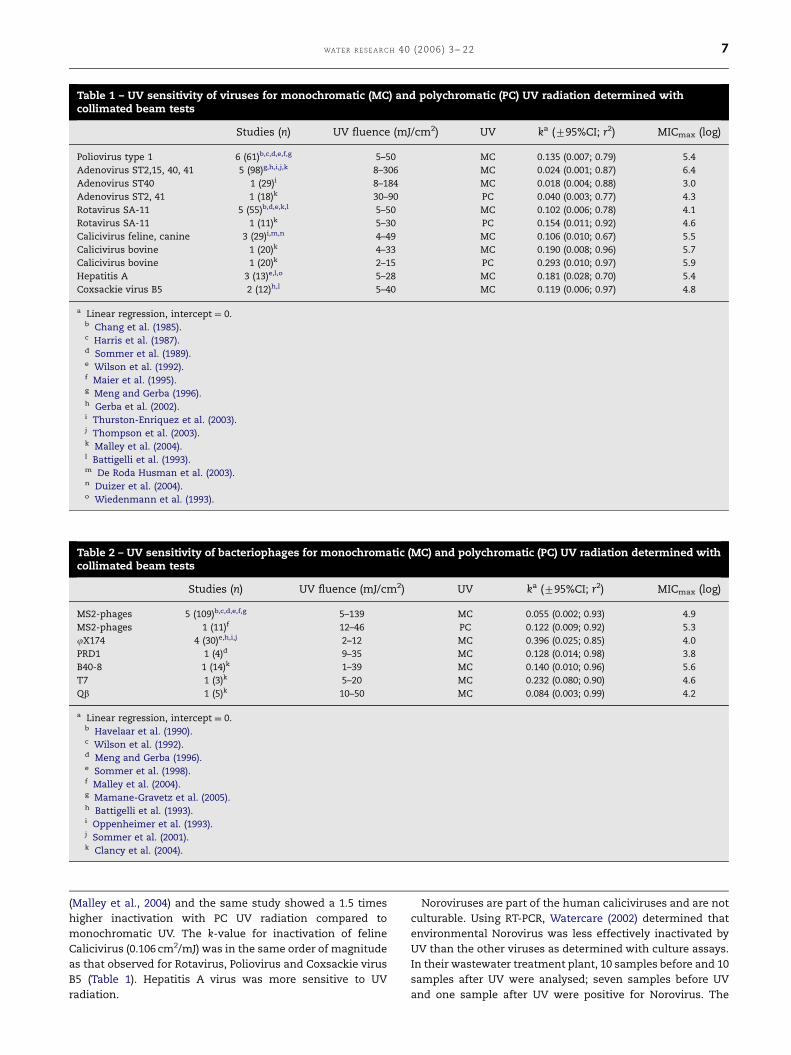
authors describing inactivation of seeded Poliovirus type 1
yielded a total of 61 data points presented in Fig. 1. The
inactivation rate constant k calculated for a UV fluence range
of 5–50 mJ/cm2 was 0.135 (95%-CI ¼ 0.007; r2¼ 0.79). Due to
the observed tailing by Sommer et al. (1989) and Maier et al.
(1995), MICmax (the maximum observed MIC) is set at
5.4 log (X50 mJ/cm2).
In Fig. 1, the fluence–response curves for Adenoviruses
serotypes (ST)2, 15, 40 and 41 are also presented. These data
demonstrate that the UV sensitivity of these serotypes for MC
UV radiation show small differences. Adenovirus is the most
persistent virus type presented in Table 1. This conclusion is
supported by the recently published study of Nwachuku et al.
(2005) who found k-values for serotypes 1 and 6 in the same
order of magnitude as for the types presented in Table 1.
Thurston-Enriquez et al. (2003) found the lowest k-value of
0.018 cm2/mJ with Adenovirus ST40. Malley et al. (2004)
determined the UV sensitivity of Adenovirus ST2 and ST41
for PC UV radiation (MP lamps). Up to a UV fluence of 90 mJ/
cm2, the UV sensitivity was a factor of 1.7 higher than that
observed for MC UV radiation (low pressure lamps) (Table 1),
but above this fluence they observed tailing (Fig. 1). By using
bandpass filters they distinguished the germicidal effect of
different wavelengths in the PC UV light at fluence ranges up
to 90 mJ/cm2 and showed that at wavelengths of 220 and
228 nm UV was significantly (a factor of 5–7) more effective in
inactivating Adenovirus ST2 than UV light with a wavelength
of 254 nm.
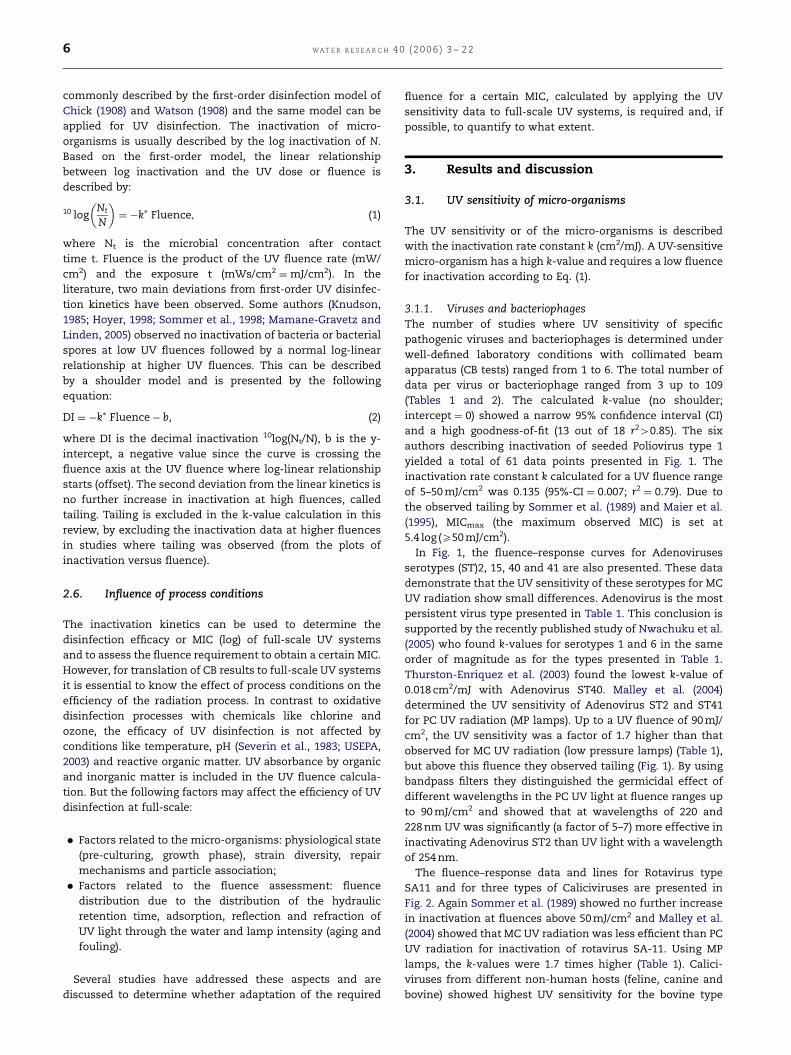
The fluence–response data and lines for Rotavirus type
SA11 and for three types of Caliciviruses are presented in
Fig. 2. Again Sommer et al. (1989) showed no further increase
in inactivation at fluences above 50 mJ/cm2 and Malley et al.
(2004) showed that MC UV radiation was less efficient than PC
UV radiation for inactivation of rotavirus SA-11. Using MP
lamps, the k-values were 1.7 times higher (Table 1). Calici-
viruses from different non-human hosts (feline, canine and
bovine) showed highest UV sensitivity for the bovine type
ARTICLE IN PRESS
Table 1 – UV sensitivity of viruses for monochromatic (MC) and polychromatic (PC) UV radiation determined withcollimated beam tests
Studies (n) UV fluence (mJ/cm2) UV ka (795%CI; r2) MICmax (log)
Poliovirus type 1 6 (61)b,c,d,e,f,g 5–50 MC 0.135 (0.007; 0.79) 5.4
Adenovirus ST2,15, 40, 41 5 (98)g,h,i,j,k 8–306 MC 0.024 (0.001; 0.87) 6.4
Adenovirus ST40 1 (29)i 8–184 MC 0.018 (0.004; 0.88) 3.0
Adenovirus ST2, 41 1 (18)k 30–90 PC 0.040 (0.003; 0.77) 4.3
Rotavirus SA-11 5 (55)b,d,e,k,l 5–50 MC 0.102 (0.006; 0.78) 4.1
Rotavirus SA-11 1 (11)k 5–30 PC 0.154 (0.011; 0.92) 4.6
Calicivirus feline, canine 3 (29)i,m,n 4–49 MC 0.106 (0.010; 0.67) 5.5
Calicivirus bovine 1 (20)k 4–33 MC 0.190 (0.008; 0.96) 5.7
Calicivirus bovine 1 (20)k 2–15 PC 0.293 (0.010; 0.97) 5.9
Hepatitis A 3 (13)e,l,o 5–28 MC 0.181 (0.028; 0.70) 5.4
Coxsackie virus B5 2 (12)h,l 5–40 MC 0.119 (0.006; 0.97) 4.8
a Linear regression, intercept ¼ 0.b Chang et al. (1985).c Harris et al. (1987).d Sommer et al. (1989).e Wilson et al. (1992).f Maier et al. (1995).g Meng and Gerba (1996).h Gerba et al. (2002).i Thurston-Enriquez et al. (2003).j Thompson et al. (2003).k Malley et al. (2004).l Battigelli et al. (1993).m De Roda Husman et al. (2003).n Duizer et al. (2004).o Wiedenmann et al. (1993).
Table 2 – UV sensitivity of bacteriophages for monochromatic (MC) and polychromatic (PC) UV radiation determined withcollimated beam tests
Studies (n) UV fluence (mJ/cm2) UV ka (795%CI; r2) MICmax (log)
MS2-phages 5 (109)b,c,d,e,f,g 5–139 MC 0.055 (0.002; 0.93) 4.9
MS2-phages 1 (11)f 12–46 PC 0.122 (0.009; 0.92) 5.3
jX174 4 (30)e,h,i,j 2–12 MC 0.396 (0.025; 0.85) 4.0
PRD1 1 (4)d 9–35 MC 0.128 (0.014; 0.98) 3.8
B40-8 1 (14)k 1–39 MC 0.140 (0.010; 0.96) 5.6
T7 1 (3)k 5–20 MC 0.232 (0.080; 0.90) 4.6
Qb 1 (5)k 10–50 MC 0.084 (0.003; 0.99) 4.2
a Linear regression, intercept ¼ 0.b Havelaar et al. (1990).c Wilson et al. (1992).d Meng and Gerba (1996).e Sommer et al. (1998).f Malley et al. (2004).g Mamane-Gravetz et al. (2005).h Battigelli et al. (1993).i Oppenheimer et al. (1993).j Sommer et al. (2001).k Clancy et al. (2004).
WAT E R R E S EA R CH 40 (2006) 3– 22 7
(Malley et al., 2004) and the same study showed a 1.5 times
higher inactivation with PC UV radiation compared to
monochromatic UV. The k-value for inactivation of feline
Calicivirus (0.106 cm2/mJ) was in the same order of magnitude
as that observed for Rotavirus, Poliovirus and Coxsackie virus
B5 (Table 1). Hepatitis A virus was more sensitive to UV
radiation.
Noroviruses are part of the human caliciviruses and are not
culturable. Using RT-PCR, Watercare (2002) determined that
environmental Norovirus was less effectively inactivated by
UV than the other viruses as determined with culture assays.
In their wastewater treatment plant, 10 samples before and 10
samples after UV were analysed; seven samples before UV
and one sample after UV were positive for Norovirus. The
ARTICLE IN PRESS
y= 0.102x; R2 = 0.78
0
1
2
3
4
5
6
0 50 100 150
UV fluence (mJ/cm2)
Inac
tivat
ion
(log)
Chang 1985Sommer 1989 Battigelli 1993Wilson 1992 Malley 2004 LPMalley 2004 MP
y = 0.293x
R2 = 0.96
y = 0.106x
R2 = 0.67
y = 0.190x
R2 = 0.96
0
1
2
3
4
5
6
0.02 0.04 0.06 0.0
UV fluence (mJ/cm2)
Thurston, 2003 feline 9Duizer 2004 canine 48Duizer 2004 feline 9de Roda 2003 feline 9Malley 2004 bovine MPMalley 2004 bovine LPde Roda 2003 canine 48
Rotavirus SA-11 Calicivirus
Fig. 2 – UV fluence–response curves for rotavirus and calicivirus.
Poliovirus type 1
Watercare, 2002y = 0.085x;R2 = 0.86
y = 0.135x;R2 = 0.79
0
1
2
3
4
5
6
7
8
0 50 100 150 200UV fluence (mJ/cm2)
Inac
tivat
ion
(log)
Meng 1996
Chang 1985
Sommer 1989
Harris 1987
Oppenheimer 1995
Oppenheimer 1995
Maier 1995
Wilson 1992
Thompson 2003
Watercare, 2002
Adenovirus type 2,15,40,41
y = 0.024x;R2 = 0.87
y = 0.018x;R2 = 0.88y = 0.040x;
R2 = 0.77
0
1
2
3
4
5
6
7
8
0 100 200 300 400UV fluence (mJ/cm2)
Meng 1996 ST40
Thompson 2003 ST2,15
Thurston 2003 ST40
Gerba 2002 ST2
Meng 1996 ST41
Malley 2004 ST41
Malley 2004 ST2,41 MP
Fig. 1 – UV fluence–response curves for Poliovirus and Adenovirus (regular font DWS, italic: WWS).
WAT E R R E S E A R C H 4 0 ( 2 0 0 6 ) 3 – 2 28
mean fluence was 23 mJ/cm2. From these (presence/absence)
data, a 0.8 log inactivation was estimated for a UV fluence of
20 mJ/cm2. At higher fluences (40 and 70 mJ/cm2) all samples
were negative. However, it is uncertain to which degree
inactivation assessed with RT-PCR is representative for
inactivation assessed with infectivity assays.
UV sensitivity of bacteriophages used or proposed as model
organisms for the assessment of the REF of a UV system on
full-scale is also presented in Table 2. MS2 phage is the most
persistent of the tested phages with a k-value of 0.055 cm2/mJ.
k-values of the other bacteriophages ranged from 0.128 cm2/
mJ for PRD1 up to 0.396 cm2/mJ for PhiX174. The fact that the
k-values of these micro-organisms are in the same order of
magnitude as observed for most pathogenic viruses (compare
Tables 1 and 2) supports the use of these micro-organisms as
surrogates for virus inactivation by UV. Only Adenoviruses are
more resistant to UV.
Recently, Mamane-Gravetz et al. (2005) demonstrated that
MS2 is more (three times) sensitive to low wavelengths near
214 nm emitted by MP lamps compared to 254 nm output of LP
lamps, an observation in line with those of Malley et al. (2004)
for Adenoviruses as described before. The k-values deter-
mined by Mamane-Gravetz et al. (2005) at wavelengths of 254
and 214 nm were 0.055 and 0.161 cm2/mJ, respectively. These
values are in the same order of magnitude as the k-values
calculated in this study for LP and MP lamps, respectively
(Table 2). The UV fluence of the MP lamp in the Malley study
was calculated based on the average irradiance measured by a
UV sensor and weighted by a germicidal factor at each
wavelength (based on the DNA absorbance, relative to
254 nm). Thus, the fluence of LP and MP lamps was
compensated for the wavelengths emitted by these lamps.
Malley et al. (2004) argued that this weighting may have been
biased for MP lamps. On the other hand, their results may
ARTICLE IN PRESS
WAT E R R E S EA R CH 40 (2006) 3– 22 9
indicate a higher inactivation efficiency of MP lamps com-
pared to LP lamps, a conclusion supported by the observa-
tions of Mamane-Gravetz et al. (2005).
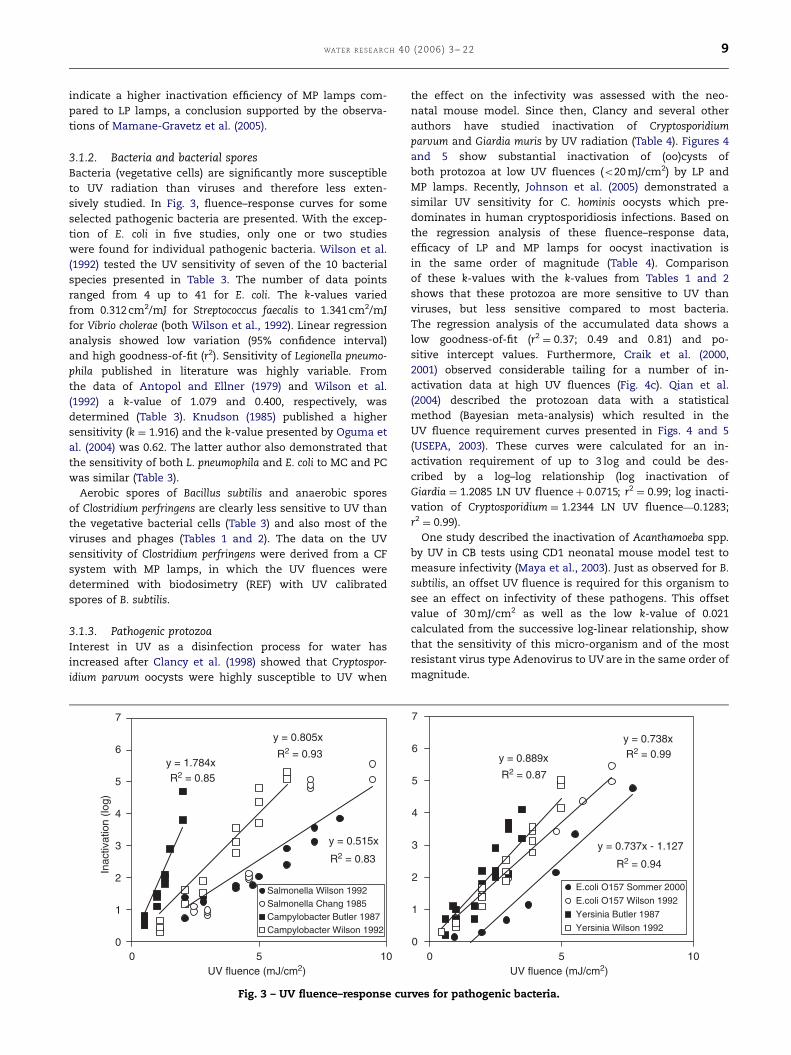
3.1.2. Bacteria and bacterial sporesBacteria (vegetative cells) are significantly more susceptible
to UV radiation than viruses and therefore less exten-
sively studied. In Fig. 3, fluence–response curves for some
selected pathogenic bacteria are presented. With the excep-
tion of E. coli in five studies, only one or two studies
were found for individual pathogenic bacteria. Wilson et al.
(1992) tested the UV sensitivity of seven of the 10 bacterial
species presented in Table 3. The number of data points
ranged from 4 up to 41 for E. coli. The k-values varied
from 0.312 cm2/mJ for Streptococcus faecalis to 1.341 cm2/mJ
for Vibrio cholerae (both Wilson et al., 1992). Linear regression
analysis showed low variation (95% confidence interval)
and high goodness-of-fit (r2). Sensitivity of Legionella pneumo-
phila published in literature was highly variable. From
the data of Antopol and Ellner (1979) and Wilson et al.
(1992) a k-value of 1.079 and 0.400, respectively, was
determined (Table 3). Knudson (1985) published a higher
sensitivity (k ¼ 1.916) and the k-value presented by Oguma et
al. (2004) was 0.62. The latter author also demonstrated that
the sensitivity of both L. pneumophila and E. coli to MC and PC
was similar (Table 3).
Aerobic spores of Bacillus subtilis and anaerobic spores
of Clostridium perfringens are clearly less sensitive to UV than
the vegetative bacterial cells (Table 3) and also most of the
viruses and phages (Tables 1 and 2). The data on the UV
sensitivity of Clostridium perfringens were derived from a CF
system with MP lamps, in which the UV fluences were
determined with biodosimetry (REF) with UV calibrated
spores of B. subtilis.
3.1.3. Pathogenic protozoaInterest in UV as a disinfection process for water has
increased after Clancy et al. (1998) showed that Cryptospor-
idium parvum oocysts were highly susceptible to UV when
y = 1.784xR2 = 0.85
y = 0.805x
R2 = 0.93
y = 0.515x
R2 = 0.83
0
1
2
3
4
5
6
7
0 10UV fluence (mJ/cm2)
Inac
tivat
ion
(log)
Salmonella Wilson 1992Salmonella Chang 1985 Campylobacter Butler 1987 Campylobacter Wilson 1992
5
Fig. 3 – UV fluence–response cu
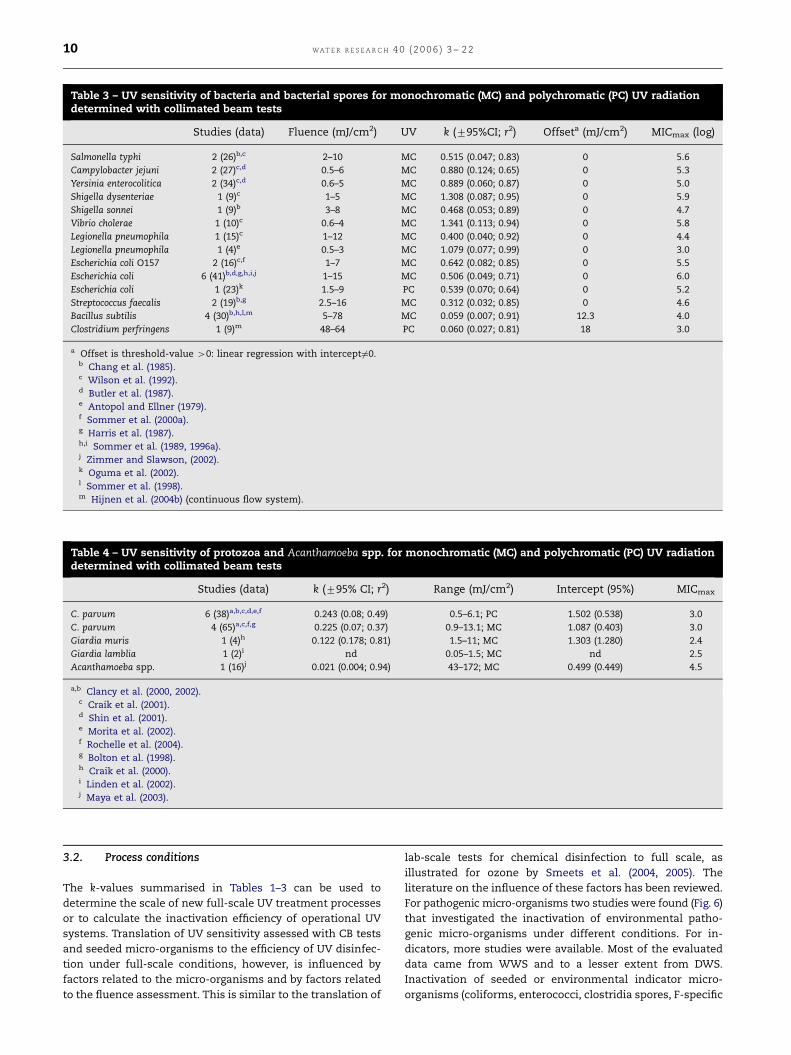
the effect on the infectivity was assessed with the neo-
natal mouse model. Since then, Clancy and several other
authors have studied inactivation of Cryptosporidium
parvum and Giardia muris by UV radiation (Table 4). Figures 4
and 5 show substantial inactivation of (oo)cysts of
both protozoa at low UV fluences (o20 mJ/cm2) by LP and
MP lamps. Recently, Johnson et al. (2005) demonstrated a
similar UV sensitivity for C. hominis oocysts which pre-
dominates in human cryptosporidiosis infections. Based on
the regression analysis of these fluence–response data,
efficacy of LP and MP lamps for oocyst inactivation is
in the same order of magnitude (Table 4). Comparison
of these k-values with the k-values from Tables 1 and 2
shows that these protozoa are more sensitive to UV than
viruses, but less sensitive compared to most bacteria.
The regression analysis of the accumulated data shows a
low goodness-of-fit (r2¼ 0.37; 0.49 and 0.81) and po-
sitive intercept values. Furthermore, Craik et al. (2000,
2001) observed considerable tailing for a number of in-
activation data at high UV fluences (Fig. 4c). Qian et al.
(2004) described the protozoan data with a statistical
method (Bayesian meta-analysis) which resulted in the
UV fluence requirement curves presented in Figs. 4 and 5
(USEPA, 2003). These curves were calculated for an in-
activation requirement of up to 3 log and could be des-
cribed by a log–log relationship (log inactivation of
Giardia ¼ 1.2085 LN UV fluenceþ 0:0715; r2¼ 0.99; log inacti-
vation of Cryptosporidium ¼ 1.2344 LN UV fluence—0.1283;
r2¼ 0.99).
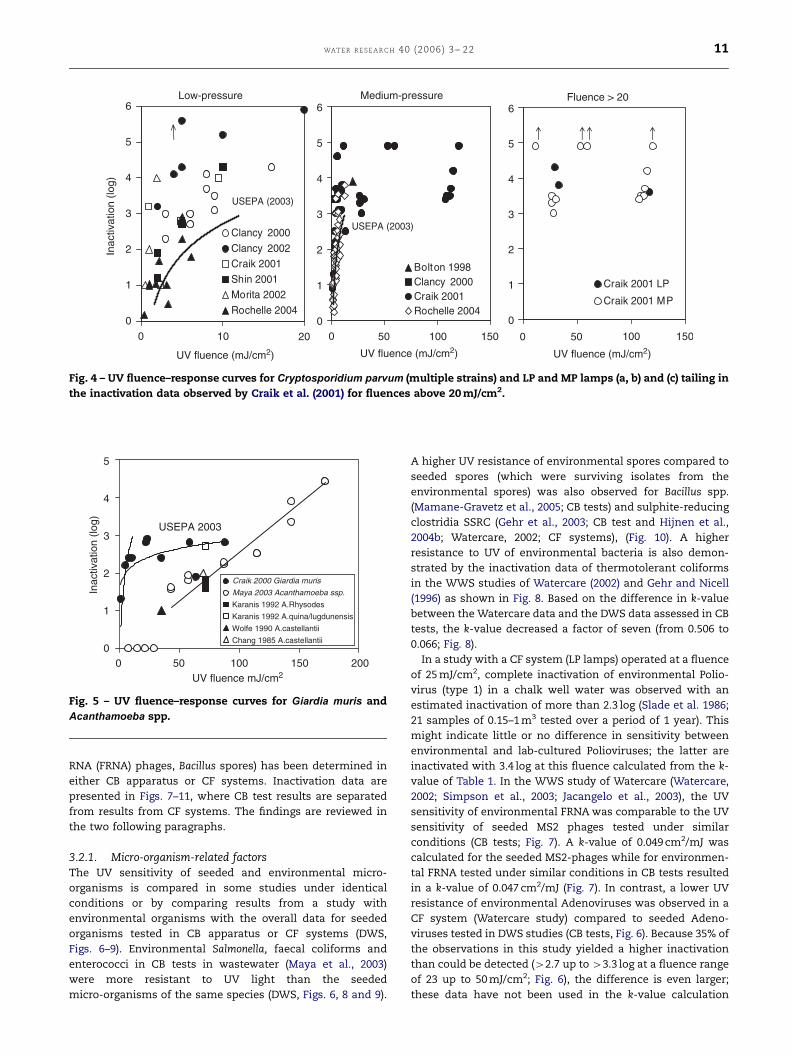
One study described the inactivation of Acanthamoeba spp.
by UV in CB tests using CD1 neonatal mouse model test to
measure infectivity (Maya et al., 2003). Just as observed for B.
subtilis, an offset UV fluence is required for this organism to
see an effect on infectivity of these pathogens. This offset
value of 30 mJ/cm2 as well as the low k-value of 0.021
calculated from the successive log-linear relationship, show
that the sensitivity of this micro-organism and of the most
resistant virus type Adenovirus to UV are in the same order of
magnitude.
y = 0.738xR2 = 0.99y = 0.889x
R2 = 0.87
y = 0.737x - 1.127
R2 = 0.94
0
1
2
3
4
5
6
7
0 10UV fluence (mJ/cm2)
E.coli O157 Sommer 2000
E.coli O157 Wilson 1992
Yersinia Butler 1987
Yersinia Wilson 1992
5
rves for pathogenic bacteria.
ARTICLE IN PRESS
Table 4 – UV sensitivity of protozoa and Acanthamoeba spp. for monochromatic (MC) and polychromatic (PC) UV radiationdetermined with collimated beam tests
Studies (data) k (795% CI; r2) Range (mJ/cm2) Intercept (95%) MICmax
C. parvum 6 (38)a,b,c,d,e,f 0.243 (0.08; 0.49) 0.5–6.1; PC 1.502 (0.538) 3.0
C. parvum 4 (65)a,c,f,g 0.225 (0.07; 0.37) 0.9–13.1; MC 1.087 (0.403) 3.0
Giardia muris 1 (4)h 0.122 (0.178; 0.81) 1.5–11; MC 1.303 (1.280) 2.4
Giardia lamblia 1 (2)i nd 0.05–1.5; MC nd 2.5
Acanthamoeba spp. 1 (16)j 0.021 (0.004; 0.94) 43–172; MC 0.499 (0.449) 4.5
a,b Clancy et al. (2000, 2002).c Craik et al. (2001).d Shin et al. (2001).e Morita et al. (2002).f Rochelle et al. (2004).g Bolton et al. (1998).h Craik et al. (2000).i Linden et al. (2002).j Maya et al. (2003).
Table 3 – UV sensitivity of bacteria and bacterial spores for monochromatic (MC) and polychromatic (PC) UV radiationdetermined with collimated beam tests
Studies (data) Fluence (mJ/cm2) UV k (795%CI; r2) Offseta (mJ/cm2) MICmax (log)
Salmonella typhi 2 (26)b,c 2–10 MC 0.515 (0.047; 0.83) 0 5.6
Campylobacter jejuni 2 (27)c,d 0.5–6 MC 0.880 (0.124; 0.65) 0 5.3
Yersinia enterocolitica 2 (34)c,d 0.6–5 MC 0.889 (0.060; 0.87) 0 5.0
Shigella dysenteriae 1 (9)c 1–5 MC 1.308 (0.087; 0.95) 0 5.9
Shigella sonnei 1 (9)b 3–8 MC 0.468 (0.053; 0.89) 0 4.7
Vibrio cholerae 1 (10)c 0.6–4 MC 1.341 (0.113; 0.94) 0 5.8
Legionella pneumophila 1 (15)c 1–12 MC 0.400 (0.040; 0.92) 0 4.4
Legionella pneumophila 1 (4)e 0.5–3 MC 1.079 (0.077; 0.99) 0 3.0
Escherichia coli O157 2 (16)c,f 1–7 MC 0.642 (0.082; 0.85) 0 5.5
Escherichia coli 6 (41)b,d,g,h,i,j 1–15 MC 0.506 (0.049; 0.71) 0 6.0
Escherichia coli 1 (23)k 1.5–9 PC 0.539 (0.070; 0.64) 0 5.2
Streptococcus faecalis 2 (19)b,g 2.5–16 MC 0.312 (0.032; 0.85) 0 4.6
Bacillus subtilis 4 (30)b,h,l,m 5–78 MC 0.059 (0.007; 0.91) 12.3 4.0
Clostridium perfringens 1 (9)m 48–64 PC 0.060 (0.027; 0.81) 18 3.0
a Offset is threshold-value 40: linear regression with intercept6¼0.b Chang et al. (1985).c Wilson et al. (1992).d Butler et al. (1987).e Antopol and Ellner (1979).f Sommer et al. (2000a).g Harris et al. (1987).h,i Sommer et al. (1989, 1996a).j Zimmer and Slawson, (2002).k Oguma et al. (2002).l Sommer et al. (1998).m Hijnen et al. (2004b) (continuous flow system).
WAT E R R E S E A R C H 4 0 ( 2 0 0 6 ) 3 – 2 210
3.2. Process conditions
The k-values summarised in Tables 1–3 can be used to
determine the scale of new full-scale UV treatment processes
or to calculate the inactivation efficiency of operational UV
systems. Translation of UV sensitivity assessed with CB tests
and seeded micro-organisms to the efficiency of UV disinfec-
tion under full-scale conditions, however, is influenced by
factors related to the micro-organisms and by factors related
to the fluence assessment. This is similar to the translation of
lab-scale tests for chemical disinfection to full scale, as
illustrated for ozone by Smeets et al. (2004, 2005). The
literature on the influence of these factors has been reviewed.
For pathogenic micro-organisms two studies were found (Fig. 6)
that investigated the inactivation of environmental patho-
genic micro-organisms under different conditions. For in-
dicators, more studies were available. Most of the evaluated
data came from WWS and to a lesser extent from DWS.
Inactivation of seeded or environmental indicator micro-
organisms (coliforms, enterococci, clostridia spores, F-specific
ARTICLE IN PRESS
0
1
2
3
4
5
6
0 50 100 150
Bolton 1998Clancy 2000Craik 2001Rochelle 2004
0
1
2
3
4
5
6
0
UV fluence (mJ/cm2) UV fluence (mJ/cm2) UV fluence (mJ/cm2)
Inac
tivat
ion
(log)
Clancy 2000
Clancy 2002Craik 2001
Shin 2001Morita 2002
Rochelle 2004
Low-pressure
USEPA (2003)
Medium-pressure
0
1
2
3
4
5
6
0 50 100 150
Craik 2001 LP
Craik 2001 MP
Fluence > 20
USEPA (2003)
2010
Fig. 4 – UV fluence–response curves for Cryptosporidium parvum (multiple strains) and LP and MP lamps (a, b) and (c) tailing in
the inactivation data observed by Craik et al. (2001) for fluences above 20 mJ/cm2.
0
1
2
3
4
5
0 50 100 150 200UV fluence mJ/cm2
Inac
tivat
ion
(log)
Craik 2000 Giardia muris
Maya 2003 Acanthamoeba ssp.
Karanis 1992 A.Rhysodes
Karanis 1992 A.quina/lugdunensis
Wolfe 1990 A.castellantii
Chang 1985 A.castellantii
USEPA 2003
Fig. 5 – UV fluence–response curves for Giardia muris and
Acanthamoeba spp.
WAT E R R E S EA R CH 40 (2006) 3– 22 11
RNA (FRNA) phages, Bacillus spores) has been determined in
either CB apparatus or CF systems. Inactivation data are
presented in Figs. 7–11, where CB test results are separated
from results from CF systems. The findings are reviewed in
the two following paragraphs.
3.2.1. Micro-organism-related factorsThe UV sensitivity of seeded and environmental micro-
organisms is compared in some studies under identical
conditions or by comparing results from a study with
environmental organisms with the overall data for seeded
organisms tested in CB apparatus or CF systems (DWS,
Figs. 6–9). Environmental Salmonella, faecal coliforms and
enterococci in CB tests in wastewater (Maya et al., 2003)
were more resistant to UV light than the seeded
micro-organisms of the same species (DWS, Figs. 6, 8 and 9).
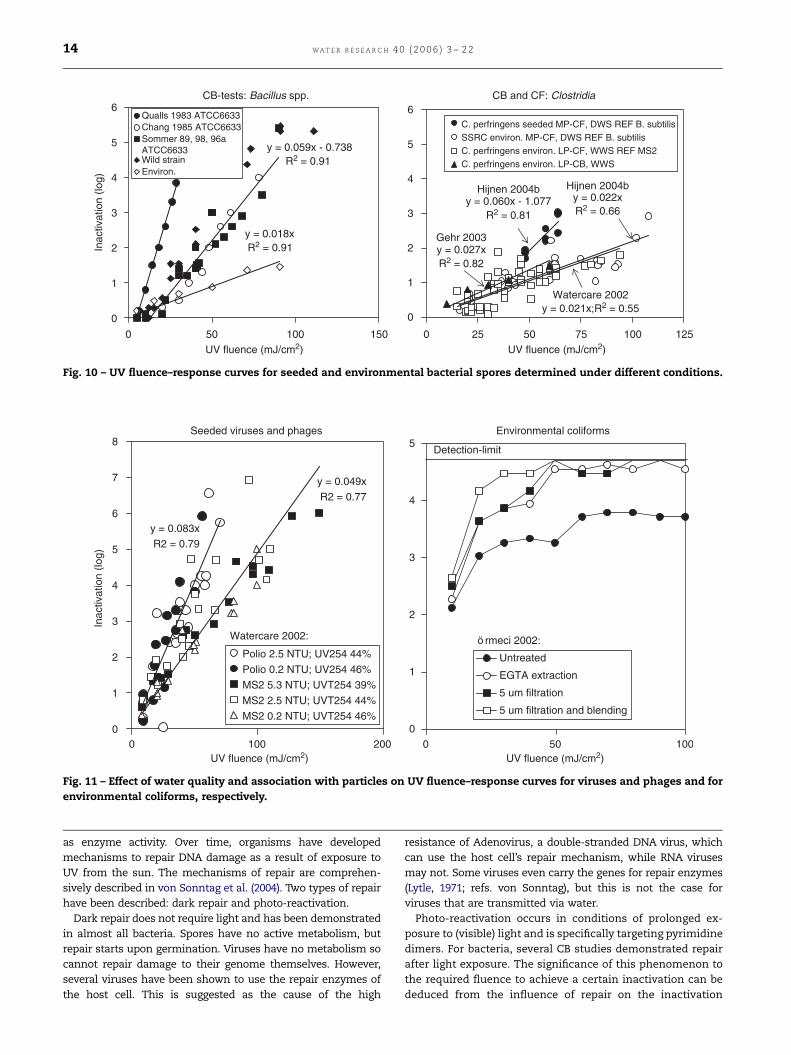
A higher UV resistance of environmental spores compared to
seeded spores (which were surviving isolates from the
environmental spores) was also observed for Bacillus spp.
(Mamane-Gravetz et al., 2005; CB tests) and sulphite-reducing
clostridia SSRC (Gehr et al., 2003; CB test and Hijnen et al.,
2004b; Watercare, 2002; CF systems), (Fig. 10). A higher
resistance to UV of environmental bacteria is also demon-
strated by the inactivation data of thermotolerant coliforms
in the WWS studies of Watercare (2002) and Gehr and Nicell
(1996) as shown in Fig. 8. Based on the difference in k-value
between the Watercare data and the DWS data assessed in CB
tests, the k-value decreased a factor of seven (from 0.506 to
0.066; Fig. 8).
In a study with a CF system (LP lamps) operated at a fluence
of 25 mJ/cm2, complete inactivation of environmental Polio-
virus (type 1) in a chalk well water was observed with an
estimated inactivation of more than 2.3 log (Slade et al. 1986;
21 samples of 0.15–1 m3 tested over a period of 1 year). This
might indicate little or no difference in sensitivity between
environmental and lab-cultured Polioviruses; the latter are
inactivated with 3.4 log at this fluence calculated from the k-
value of Table 1. In the WWS study of Watercare (Watercare,
2002; Simpson et al., 2003; Jacangelo et al., 2003), the UV
sensitivity of environmental FRNA was comparable to the UV
sensitivity of seeded MS2 phages tested under similar
conditions (CB tests; Fig. 7). A k-value of 0.049 cm2/mJ was
calculated for the seeded MS2-phages while for environmen-
tal FRNA tested under similar conditions in CB tests resulted
in a k-value of 0.047 cm2/mJ (Fig. 7). In contrast, a lower UV
resistance of environmental Adenoviruses was observed in a
CF system (Watercare study) compared to seeded Adeno-
viruses tested in DWS studies (CB tests, Fig. 6). Because 35% of
the observations in this study yielded a higher inactivation
than could be detected (42.7 up to 43.3 log at a fluence range
of 23 up to 50 mJ/cm2; Fig. 6), the difference is even larger;
these data have not been used in the k-value calculation

ARTICLE IN PRESS
y = 0.172x
R2 = 0.87
y = 0.038x + 2.067
R2 = 0.98
0
1
2
3
4
5
6
7
0 20
UV fluence (mJ/cm2)
Inac
tivat
ion
(log)
CB-test environ. WWS, Maya 2003
CB-test Seeded DWS, Ref. Table 3
y = 0.024x
R2 = 0.87
Watercare 2002y = 0.040x
R2 = 0.11
0
1
2
3
4
5
100
CF-system environ. WWS ST1,2,3,4,7 REF MS2CF-system envir on. WWS Non de tect REF MS2
CB tests, DW S stu dies (Fig . 1)
Salmonella Adenovirus
40 60 80 0 20
UV fluence (mJ/cm2)
40 60 80
Fig. 6 – Comparison of UV fluence–response curves for seeded and environmental Salmonella and Adenoviruses.
Ref.Table 2y = 0.055x;R2 = 0.93
Watercare 2002; MS2y = 0.049x;R2 = 0.79
Watercare 2002; FRNAy = 0.047x;R2 = 0.81
Gehr 2003y = 0.051xR2 = 0.99
0
1
2
3
4
5
6
0 50 100 150 200UV fluence (mJ/cm2)
Inac
tivat
ion
(log)
MS2 DWSMS2 WWS UVT 39-46%FRNA WWS UVT 39-46%MS2 WWS UVT ni
Havelaar 1987y = 0.092xR2 = 0.98
Watercare 2002y = 0.041xR2 = 0.40
Nieuwstad 1994y = 0.025x + 0.87
R2 = 0.94
0
1
2
3
4
5
6
0 50 100 150 200UV fluence (mJ/cm2)
MS2 WWS calc. FluenceFRNA WWS, calc. FluenceFRNA , WWS calc. Fluence
CB-tests Continuous flow
Fig. 7 – UV fluence–response curves for seeded MS2 FRNA phages and environmental FRNA phages determined under
different conditions (ni ¼ no information; Nieuwstad and Havelaar, 1994).
WAT E R R E S E A R C H 4 0 ( 2 0 0 6 ) 3 – 2 212
presented in Fig. 6. Predominant Adenovirus types in the
Watercare study were serotypes 1–4 and 7, with less
commonly serotypes 5, 8, 11, 13, 15, 19, 25 and 29. The higher
susceptibility of the environmental Adenovirus in this study
could be the result of the absence of Adenovirus, type 40, the
most persistent serotype.
Overall, increased UV resistance of environmental micro-
organisms was more explicit for the bacterial spores and
for vegetative bacteria, and was of less significance for
FRNA phages and viruses. To the authors knowledge, no
data have been published on the UV sensitivity of envi-
ronmental (oo)cysts of Cryptosporidium and Giardia. The
observed difference in UV sensitivity for bacteria and spores
may be attributable to the physiological state of the micro-
organisms, strain diversity, DNA-repair mechanisms and
particle association. These factors are discussed in more
detail below.
Physiological state
The physiological state of micro-organisms affects the
sensitivity to environmental stress factors such as UV
radiation. Martiny et al. (1990), Mofidi et al. (2002) and Malley
et al. (2004) showed that UV sensitivity was related to the
growth phase of the bacteria; with the highest sensitivity in
the active growth phase and lower sensitivity in the
stationary phase.
Strain variation
Different strains of one species may have different UV
sensitivity, as demonstrated for E. coli by Sommer et al.

ARTICLE IN PRESS
y = 0.187x - 1.154;
R2 = 0.98
y = 0.218x;
R2 = 0.95
y = 0.506x; R2 = 0.73
0
2
4
6
8
0 25 50 75 100 0 25 50 75 100UV fluence (mJ/cm2)
Inac
tivat
ion
(log)
E. coli seeded; DWS, ref.Table 3
E. coli sew. sludge isolate; DWS, Sommer 1998
Therm. coliforms; WWS, Maya 2003
Total coliforms; WWS, Chang 1985
y = 0.199x
R2 = 0.50 y = 0.168x;
R2 = 0.53
y = 0.066x;
R2 = 0.53
0
2
4
6
UV fluence (mJ/cm2)
E. coli seeded; DWS, CF-systems
E. coli environ.; WWS, calc. Fluence, Havelaar 1987
Therm. coliforms;WWS, REF MS2, Watercare 2002
Therm. coliforms;WWS, calc.fluence, Gehr 1996
Continuous flowCB-tests8
Fig. 8 – UV fluence–response curves for seeded and environmental coliforms (E. coli, thermotolerant coliforms and total
coliforms) determined under different conditions.
y = 0.312x; R2 = 0.85
y = 0.146x - 0.316 R2 = 0.99
0
1
2
3
4
5
6
0 20 40 60 80 0 20 40 60 80UV fluence (mJ/cm2)
Inac
tivat
ion
(log)
S. faecalis CB-test DWS, ref. Table 3
Enterococci CB-test WWS, Maya, 2003
CB-tests
y = 0.131xR2 = 0.83
y = 0.070x
R2 = 0.55
0
1
2
3
4
5
6
UV fluence (mJ/cm2)
Enterococci CF-system WWS, REF MS2,Watercare, 2002
Enterococci CF-system WWS, calc. Fluence,Havelaar 1987
Continuous flow
Fig. 9 – UV fluence–response curves for seeded and environmental enterococci determined under different conditions.
WAT E R R E S EA R CH 40 (2006) 3– 22 13
(1998, 2000a) (Fig. 8) and Malley et al. (2004). UV sensitivity of
different E. coli strains in these studies varied by a factor of 5.8
and 3.7, respectively. The latter study demonstrated a higher
sensitivity of E. coli O157:H7 compared to non-pathogenic/
toxic strains. In contrast, Clancy et al. (2002) and Rochelle et
al. (2004) showed that the high inactivation efficiency of UV
radiation for Cryptosporidium was observed in multiple strains
of Cryptosporidium parvum. The similar UV sensitivity ob-
served for C. hominis (Johnson et al., 2005) suggests that this
high sensitivity of Cryptosporidium oocysts is common for all
sub-species.
Repair
Exposure to UV results in damage to the nucleic acids of the cell.
Although also other components of the cell may be damaged by
UV, micro-organisms may still retain metabolic functions such
ARTICLE IN PRESS
y = 0.059x - 0.738R2 = 0.91
y = 0.018xR2 = 0.91
0
1
2
3
4
5
6
0 50 100 150UV fluence (mJ/cm2)
Inac
tivat
ion
(log)
Qualls 1983 ATCC6633Chang 1985 ATCC6633Sommer 89, 98, 96aATCC6633Wild strainEnviron.
CB-tests: Bacillus spp.
Hijnen 2004by = 0.060x - 1.077
R2 = 0.81
Watercare 2002y = 0.021x;R2 = 0.55
Gehr 2003y = 0.027xR2 = 0.82
Hijnen 2004by = 0.022xR2 = 0.66
0
1
2
3
4
5
6
0 25 50 75 100 125UV fluence (mJ/cm2)
C. perfringens seeded MP-CF, DWS REF B. subtilisSSRC environ. MP-CF, DWS REF B. subtilisC. perfringens environ. LP-CF, WWS REF MS2C. perfringens environ. LP-CB, WWS
CB and CF: Clostridia
Fig. 10 – UV fluence–response curves for seeded and environmental bacterial spores determined under different conditions.
y = 0.049x
R2 = 0.77
y = 0.083x
R2 = 0.79
0
1
2
3
4
5
6
7
8
0 100 200UV fluence (mJ/cm2)
Inac
tivat
ion
(log)
Polio 2.5 NTU; UV254 44%
Polio 0.2 NTU; UV254 46%
MS2 5.3 NTU; UVT254 39%
MS2 2.5 NTU; UVT254 44%
MS2 0.2 NTU; UVT254 46%
Seeded viruses and phages
0
1
2
3
4
5
0 50 100UV fluence (mJ/cm2)
Untreated
EGTA extraction
5 um filtration
5 um filtration and blending
Environmental coliforms
Detection-limit
Watercare 2002: ö rmeci 2002:
Fig. 11 – Effect of water quality and association with particles on UV fluence–response curves for viruses and phages and for
environmental coliforms, respectively.
WAT E R R E S E A R C H 4 0 ( 2 0 0 6 ) 3 – 2 214
as enzyme activity. Over time, organisms have developed
mechanisms to repair DNA damage as a result of exposure to
UV from the sun. The mechanisms of repair are comprehen-
sively described in von Sonntag et al. (2004). Two types of repair
have been described: dark repair and photo-reactivation.
Dark repair does not require light and has been demonstrated
in almost all bacteria. Spores have no active metabolism, but
repair starts upon germination. Viruses have no metabolism so
cannot repair damage to their genome themselves. However,
several viruses have been shown to use the repair enzymes of
the host cell. This is suggested as the cause of the high
resistance of Adenovirus, a double-stranded DNA virus, which
can use the host cell’s repair mechanism, while RNA viruses
may not. Some viruses even carry the genes for repair enzymes
(Lytle, 1971; refs. von Sonntag), but this is not the case for
viruses that are transmitted via water.
Photo-reactivation occurs in conditions of prolonged ex-
posure to (visible) light and is specifically targeting pyrimidine
dimers. For bacteria, several CB studies demonstrated repair
after light exposure. The significance of this phenomenon to
the required fluence to achieve a certain inactivation can be
deduced from the influence of repair on the inactivation
ARTICLE IN PRESS
WAT E R R E S EA R CH 40 (2006) 3– 22 15
kinetics (dose–response curves), but also from the occurrence
of these repair mechanisms under conditions of disinfection
practice.
Most photo-reactivation studies with CB tests used low
fluences and optimal conditions for light exposure for repair
(thin layer of fluid). The results show that under these
conditions fluence requirement increases with increasing
fluence (lower k-values). Quantitative data showed a 2.8–4.6
higher UV fluence requirement for 1–3 log inactivation of L.
pneumophila (Knudson, 1985); based on these data k-value
decreased a factor of 3.2. Oguma et al. (2004) observed a
comparable log repair at an initial inactivation of 3 log after
UV disinfection with LP and MP lamps and complete photo-
reactivation. For E. coli, Bernhardt (1994) showed an increased
offset value and decreased k-value. For several bacteria spp.
(E. coli, Yersinia enterocolitica, Salmonella typhi and Vibrio
cholerae), he calculated an increased fluence requirement for
a 4 log inactivation ranging from a factor of 1.8 up to 4.2 to
account for complete photo-reactivation. For E. coli similar
enhancement of fluence requirement was observed by Hoyer
(1998); 3.5 times for 4 log inactivation). Sommer et al. (2000a)
showed a decrease in k-value after photo-reactivation and
also demonstrated that dark repair is of less importance for E.
coli. The latter observation was confirmed by Zimmer and
Slawson, (2002), who demonstrated that photo-reactivation of
E. coli did not occur after MP lamps, an observation also
supported by Oguma et al. (2002, 2004).
Morita et al. (2002) demonstrated photo-reactivation and
dark repair of DNA in Cryptosporidium parvum with the
endonuclease-sensitivity site assay. The animal infecti-
vity, however, was not restored. Furthermore, they concluded
that UV radiated oocysts are able to excyst but have lost
their ability to infect host cells. Similar observations
were reported by Shin et al. (2001) and Zimmer et al. (2003).
Craik et al. (2000) and Linden et al. (2002) came to the same
conclusion for G. muris and Giardia lamblia cysts, respectively.
Belosevic et al. (2001), however, showed the ability of DNA
repair by some Giardia spp. after UV radiation with MP lamps.
This was also presented by Kruithof et al. (2005); in vivo
reactivation (dark repair) of G. muris cysts occurred at fluence
values as low as 25 mJ/cm2, but not at 60 mJ/cm2, after
prolonged time of incubation (3%, 14% and 20% reactivation
after 10, 20 and 30 days, respectively). Also, DNA repair of G.
lamblia cysts after exposure to MC UV irradiation is recently
reported (Shin et al., 2005). An extensive study was presented
on repair in Cryptosporidium parvum oocysts by Rochelle et al.
in 2004. Identification of possible DNA-repair genes in
Cryptosporidium parvum showed that the oocysts contain
all of the major genetic components of the nucleotide
excision repair complex. Nevertheless, inactivation displayed
by oocysts immediately after UV exposure or displayed
by oocysts after UV exposure followed by various repair
conditions were generally in the same order of magnitude.
This suggests that repair of UV induced damage in Cryptos-
poridium parvum after UV exposure in drinking water is not
likely to occur.
Particle association
Higher resistance of particle-associated faecal bacteria has
been observed in secondary effluents. This phenomenon
was demonstrated by Qualls et al. (1983b) and Havelaar et al.
(1987) for thermotolerant coliforms and the enterococci,
respectively. A lower inactivation rate was observed in non-
filtered effluent of sewage water plants compared to filtered
samples (pore size 8mm). Recently, Ormeci and Linden (2002)
applied different techniques (extraction with EGTA, filtra-
tion of 5mm filters with or without homogenisation by
blending) to separate particle- and non-particle associated
coliforms and showed an increased resistance of environ-
mental coliforms associated with particles to UV (Fig. 11).
Aggregates of B. subtilis spores were artificially made with
clay in a Jar Test apparatus by Mamane-Gravetz and Linden
(2004) and caused a reduction in inactivation efficiency. The k-
value decreased from 0.0617 for the suspended spore-clay
solution to 0.0579 cm2/mJ for the aggregated spore-clay sus-
pension. The same authors published a new study in 2005, in
which they found evidence for a correlation of hydrophobicity
of spores with aggregation. Aggregation may be a cause of
tailing (no further increase of inactivation at higher fluence)
observed in the kinetics. The k-values of isolated environ-
mental Bacillus strains in the tailing phase of the kinetics
were similar to the k-values of the original and natural
Bacillus spore population. This indicates that a shielding effect
of aggregation or particle association is a significant factor in
the low susceptibility of environmental Bacillus spores, and
also observed for the environmental clostridia spores as
presented in Fig. 10.
3.2.2. Fluence-related factorsVariability in fluence may be caused by water quality
(adsorption, reflection and refraction) and the distribution of
the hydraulic retention time in CF systems.
Water quality
The presence of UV absorbing organic and inorganic com-
pounds in water will reduce the UV fluence but results
showed that fluence values can easily be corrected for the UV
transmission of the water. Havelaar et al. (1990) placed
0.22mm membrane filtered secondary effluent (UV transmis-
sion of 40–60%) in the UV pathway of the collimated beam
apparatus and showed no decrease of the inactivation rate
constant for MS2 phages after correction of the fluence for the
transmittance. In studies with CF systems, both Schoenen et
al. (1995) and Sommer et al. (1997) showed that the inactiva-
tion efficiency assessed at similar sensor readings was more
sensitive for change in lamp intensity than for change in the
water transmittance.
The influence of water quality on the efficiency of UV
disinfection can be demonstrated by comparing results of
DWS with WWS conducted under similar conditions. CB tests
with seeded Polioviruses in secondary effluent with high
turbidity and low UV transmission were published by Oppen-
heimer et al. (1995), Watercare (2002) and Thompson et al. (2003)
(Fig. 1). In the first two studies, a lower inactivation was
observed in wastewater than in DWS. In the Watercare study,
the inactivation rate constant k of seeded Poliovirus in filtered
secondary effluent was a factor 1.6 lower than the k-value
calculated from the DWS (Fig. 1). The same study (Watercare,
2002) observed a slightly lower inactivation of MS2 in secondary
effluent compared to the inactivation of MS2 in drinking water

ARTICLE IN PRESS
Table 5 – Calculated UV fluence versus fluence assessed with biodosimetry (REF)
System Study Model organism n Ratio UVcalculated/REF (7SD)
Aa DWS B. subtilis 3 1.33 (0.07)
Ba DWS B. subtilis 3 0.81 (0.02)
Ca DWS B. subtilis 3 0.79 (0.10)
Da DWS B. subtilis 3 1.00 (0.28)
Ea DWS B. subtilis 3 0.73 (0.19)
Fa DWS B. subtilis 3 0.62 (0.14)
Gb DWS B. subtilis 9 0.59 (0.03)
Hc WWS MS2 phage 37 0.83 (0.25)
a Sommer et al. (2000b).b Hijnen et al. (2004b).c Watercare (2002).
WAT E R R E S E A R C H 4 0 ( 2 0 0 6 ) 3 – 2 216
at the same fluence (Fig. 7). CB tests were conducted with
secondary effluent with high and low turbidity (0.2–2.5 NTU and
UVTof 40–68%). They demonstrated that there was no impact of
turbidity on the inactivation of seeded Polioviruses and MS2
phages (Fig. 11). In addition, data from the WWS study of
Thompson et al. (2003) showed no decreased inactivation of
seeded Poliovirus and Adenovirus compared to inactivation of
these organisms tested in DWS studies (Fig. 1).
Fluence determination in CF systems
In the literature, only few DWS have been published where
fluence–response curves were determined with CF systems.
Results from the studies of Martiny et al. (1990), Schoenen
et al. (1991) and Bernhardt et al. (1992, 1994) showed lower
inactivation rate constants for E. coli (Fig. 8) when compared
to the k-value determined from CB tests. The fluence in the CF
systems in these studies was based on information of the
supplier of the UV equipment or on actinometry.
Information about the precision of fluence calculations can
be obtained with biodosimetry. Spores of Bacillus subtilis and
MS2 phages are used as model organisms in biodosimetry
assays to assess the REF of CF systems. Sommer et al. (2000b)
determined the REF with UV254 calibrated spores of B. subtilis
of more than 30 commercially available CF systems and
presented the results of six systems. In one system, the REF
was equal to the UV fluence calculated according to the
supplier’s instructions, four systems showed that that REF
was 19–38% lower than the calculated fluence and in one
system REF was 33% higher than the calculated fluence
(Table 5). The average ratio of the REF to the calculated fluence
was 0.83 with a relatively high standard deviation of 0.25
(Table 5). The overestimation of the effective fluence (REF) by
fluence calculation was supported by data presented by
Hijnen et al. (2004b). In conclusion, calculated fluence data
in CF systems frequently do not match those obtained by
biodosimetry. Biodosimetry is essential to determine the
efficacy of CF systems (DVGW, 1997; Sommer et al., 2000b;
USEPA, 2003). The introduction of CFD for fluence calculations
(no data presented) is improving the quality and precision of
fluence calculations.
Reflection
Reflection caused by the construction materials of the UV
reactor will have an influence on the inactivation efficiency
determined by biodosimetry (Sommer et al., 1996b). This factor
is of greater influence in single lamp systems than in multiple
lamp systems because of the higher surface–volume ratio.
4. General discussion
4.1. Kinetics of UV inactivation
Most of the inactivation data can be adequately described
with the first-order disinfection model, at least for a certain
fluence range. An offset UV fluence before inactivation starts,
i.e., a shoulder model, is observed for Bacillus spores and
Acanthamoeba spp. The simple inactivation model, where the
shoulder is given as an offset of the first-order model, is used
in this study.
Another deviation from first-order kinetics is the reduction of
inactivation rate at higher UV fluences (tailing). This is observed
in several DWS with CB tests (Polioviruses, rotaviruses, E. coli, C.
parvum and G. muris) and also for environmental bacteriophages
and bacteria in WWS in CF systems. Tailing normally starts
after at least 99% of the initial available micro-organisms are
inactivated and is observed to a larger extent in the more UV
susceptible micro-organisms. For the most resistant organisms
(Adenoviruses, MS2 phages, bacterial spores and Acanthamoeba
spp.), tailing was not observed. The cause of tailing is still under
debate. Several causes have been hypothesised, such as
experimental bias, hydraulics, aggregation of micro-organisms
or a resistant subpopulation, but no conclusive evidence is
available for any of these. For micro-organisms where tailing is
observed, we have used the first-order model only for the
fluence range that yielded a linear relation with the inactivation
in the experiments. Because of the observed tailing, extrapola-
tion of this inactivation rate to higher fluences is yielding
uncertain results. For use in QMRA, the higher fluences can be
assumed to yield (at least) the same inactivation credits as the
highest fluence in the linear relation.
4.2. Significance for water disinfection
This study provides an extensive overview of the efficacy of
UV disinfection for viruses, bacteria and bacterial spores and
protozoan (oo)cysts, obtained from the reviewed literature.
The k-values that were calculated from the reviewed studies
ARTICLE IN PRESS
WAT E R R E S EA R CH 40 (2006) 3– 22 17
can be used in QMRA and treatment design to determine the
efficacy of a UV fluence in the inactivation of the range of
reported bacterial and viral pathogens and indicator organ-
isms. For Cryptosporidium and Giardia, the logarithmic func-
tions given in USEPA (2003) were used for calculating the
inactivation efficacy.
Of the pathogens, viruses are generally more resistant than
Cryptosporidium, Giardia and the bacterial pathogens. Adeno-
virus 40 is the most UV-resistant waterborne pathogen
known. Acanthamoeba is also very resistant. Bacterial spores,
especially environmental spores of Clostridium are also
resistant to UV, with k-values that are comparable to the
Adenoviruses (Fig. 10).
4.3. Correction of the required fluence: micro-organism-related factors
Based on the increased UV resistance observed for environ-
mental Salmonella, enterococci, thermotolerant coliforms,
FRNA phages and spores of sulphite-reducing clostridia,
correction of the fluence requirement for inactivation of
bacteria and bacterial spores from the environment seems
appropriate. The evaluated studies suggest a two times
increased fluence requirement for bacteria and four times
for bacterial spores in drinking water. For wastewater this is
most likely not enough and based on Fig. 8 a factor of seven
seems more appropriate. The results of environmental
polioviruses (Slade et al., 1986) and FRNA phages and
Adenoviruses (Watercare, 2002) indicate that such a correc-
tion is not needed for phages and viruses. However, further
research is needed to support these findings. Similarly,
studies on the increased resistance of environmental proto-
zoan (oo)cysts to UV are appropriate.
Data from the evaluated studies indicated that photo-
reactivation can result in a significant increase of the required
fluence for bacteria to achieve the same level of inacti-
vation as without photo-reactivation. Dark repair does not
seem to be very significant for the UV disinfection practice
for most pathogens. Though for Giardia, dark repair was
observed in two studies at lower (5–25 mJ/cm2) fluences, but
not at higher fluences (60 mJ/cm2). Consequently, correc-
tion of the required fluence of full-scale UV disinfection
because of photo-reactivation of bacteria and in the case
of Giardia, also because of dark repair at low fluences, could
be necessary. For viruses, it is assumed that repair is inclu-
ded in the available fluence–response curves, as suggested
for the double-stranded DNA Adenoviruses. After UV disin-
fection of drinking water, photo-reactivation is not likely to
occur but in the case of wastewater disinfection light
exposure is likely. Translation of the presented photo-
reactivation data to full-scale conditions, however, is not
straight forward. These data have been observed under
conditions favouring the induction of photo-repair (low
fluence values, thin layer with optimal conditions for
reactivation). The conditions in wastewater practice will be
less favourable for exposure to light and hence for photo-
reactivation to occur. Furthermore, the applied UV fluences in
practice are usually higher than applied in the reviewed
studies. Lindenauer and Darby (1994) and Gehr and Nicell
(1996) showed a decrease in repair at higher fluences due to
tailing in the inactivation kinetics. The former author also
hypothesised that extended DNA damage at higher fluence
values will reduce the potential for photo-repair. From their
WWS and that of Whitby and Palmateer (1993), Gehr and
Nicell (1996) suggested that in practice the overall impact of
photo-repair might be negligible, because of the limited
exposure to light and therefore limited induction of photo-
repair. In conclusion this needs further verification, but we
assume that the necessity for a fluence correction as a result
of photo-reactivation in UV disinfection practice is less than
that suggested by the experimental data in the photo-
reactivation studies.
4.4. Correction of the required fluence: fluence-relatedfactors
Most of the studies that have been reviewed have been
executed under well-controlled laboratory conditions in
which UV fluence was assessed with sensors and seeded
micro-organisms. Information about the efficacy of UV
systems under full-scale conditions was limited and those
which have been evaluated, generally showed lower inactiva-
tion efficiency than in the laboratory. This reduced efficiency
may be caused by factors related to the micro-organisms as
described previously, but also by imperfections in the
calculation of the fluence to which the micro-organisms are
exposed in full-scale UV systems. The latter can be largely
overcome by applying biodosimetry to full-scale UV systems
to determine the REF. This is already enforced for the
application of UV systems in drinking water practice in
Austria (Osterreichisches normungsinstitut, 1999). In Ger-
many, a similar protocol is used as guideline (DVGW, 1997),
and in the USA, the draft EPA Ultraviolet Disinfec-
tion Guidance Manual also appoints credits for inactivation
of Cryptosporidium on the basis of biodosimetry (USEPA,
2003). Commonly used biodosimeters are spores of B. subtilis
or MS2 phages. Cabaj et al. (1996), however, demonstra-
ted that the REF decreases with increased broadening of
the fluence distribution and increased inactivation rate
constant of the used model organism. Consequently, suscep-
tible model organisms (high k-value) are more sensitive to a
broad fluence distribution, which will enlarge the gap
between the REF and the arithmetic mean fluence. MS2
phages and spores of B. subtilis are less sensitive to UV
than most other pathogenic micro-organisms (Tables 1–4).
The EPA manual (USEPA, 2003) introduced an REF bias based
on effects of fluence distribution and inactivation rate
constants to account for the difference in sensitivity between
model organism and target pathogens. Another approach is
the use of alternative model organisms. E. coli is suggested
and also this review indicates that it can be used as model for
the more susceptible bacteria and also Cryptosporidium
and Giardia. More recently, Clancy et al. (2004) suggested
two potential bacteriophages Qb and T7 as model organisms.
The use of T7 as UV dosimeter was previously proposed
by Ronto et al. (1992). The k-values of these organisms
(Table 2) are more in the range of the k-values calculated
for the more sensitive pathogens. For MP systems, the
germicidal fluence is usually obtained with the DNA absor-
bance spectrum to weigh the effectiveness of the different
ARTICLE IN PRESS
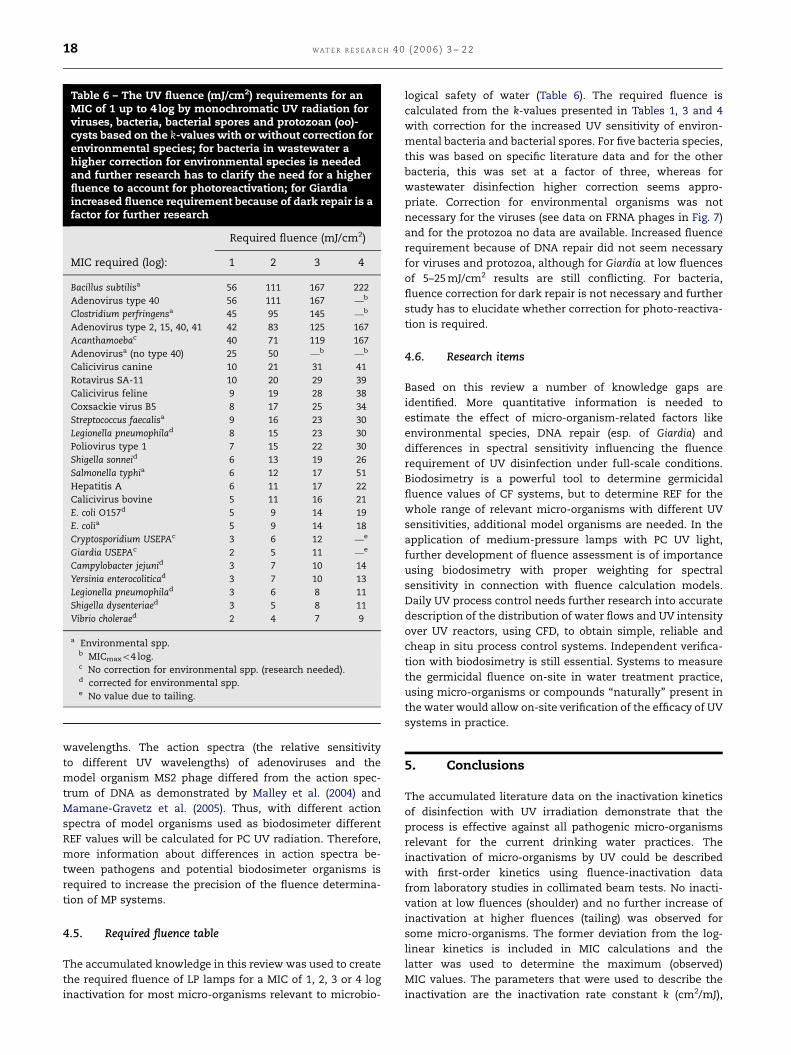
Table 6 – The UV fluence (mJ/cm2) requirements for anMIC of 1 up to 4 log by monochromatic UV radiation forviruses, bacteria, bacterial spores and protozoan (oo)-cysts based on the k-values with or without correction forenvironmental species; for bacteria in wastewater ahigher correction for environmental species is neededand further research has to clarify the need for a higherfluence to account for photoreactivation; for Giardiaincreased fluence requirement because of dark repair is afactor for further research
Required fluence (mJ/cm2)
MIC required (log): 1 2 3 4
Bacillus subtilisa 56 111 167 222
Adenovirus type 40 56 111 167 —b
Clostridium perfringensa 45 95 145 —b
Adenovirus type 2, 15, 40, 41 42 83 125 167
Acanthamoebac 40 71 119 167
Adenovirusa (no type 40) 25 50 —b —b
Calicivirus canine 10 21 31 41
Rotavirus SA-11 10 20 29 39
Calicivirus feline 9 19 28 38
Coxsackie virus B5 8 17 25 34
Streptococcus faecalisa 9 16 23 30
Legionella pneumophilad 8 15 23 30
Poliovirus type 1 7 15 22 30
Shigella sonneid 6 13 19 26
Salmonella typhia 6 12 17 51
Hepatitis A 6 11 17 22
Calicivirus bovine 5 11 16 21
E. coli O157d 5 9 14 19
E. colia 5 9 14 18
Cryptosporidium USEPAc 3 6 12 —e
Giardia USEPAc 2 5 11 —e
Campylobacter jejunid 3 7 10 14
Yersinia enterocoliticad 3 7 10 13
Legionella pneumophilad 3 6 8 11
Shigella dysenteriaed 3 5 8 11
Vibrio choleraed 2 4 7 9
a Environmental spp.b MICmaxo4 log.c No correction for environmental spp. (research needed).d corrected for environmental spp.e No value due to tailing.
WAT E R R E S E A R C H 4 0 ( 2 0 0 6 ) 3 – 2 218
wavelengths. The action spectra (the relative sensitivity
to different UV wavelengths) of adenoviruses and the
model organism MS2 phage differed from the action spec-
trum of DNA as demonstrated by Malley et al. (2004) and
Mamane-Gravetz et al. (2005). Thus, with different action
spectra of model organisms used as biodosimeter different
REF values will be calculated for PC UV radiation. Therefore,
more information about differences in action spectra be-
tween pathogens and potential biodosimeter organisms is
required to increase the precision of the fluence determina-
tion of MP systems.
4.5. Required fluence table
The accumulated knowledge in this review was used to create
the required fluence of LP lamps for a MIC of 1, 2, 3 or 4 log
inactivation for most micro-organisms relevant to microbio-
logical safety of water (Table 6). The required fluence is
calculated from the k-values presented in Tables 1, 3 and 4
with correction for the increased UV sensitivity of environ-
mental bacteria and bacterial spores. For five bacteria species,
this was based on specific literature data and for the other
bacteria, this was set at a factor of three, whereas for
wastewater disinfection higher correction seems appro-
priate. Correction for environmental organisms was not
necessary for the viruses (see data on FRNA phages in Fig. 7)
and for the protozoa no data are available. Increased fluence
requirement because of DNA repair did not seem necessary
for viruses and protozoa, although for Giardia at low fluences
of 5–25 mJ/cm2 results are still conflicting. For bacteria,
fluence correction for dark repair is not necessary and further
study has to elucidate whether correction for photo-reactiva-
tion is required.
4.6. Research items
Based on this review a number of knowledge gaps are
identified. More quantitative information is needed to
estimate the effect of micro-organism-related factors like
environmental species, DNA repair (esp. of Giardia) and
differences in spectral sensitivity influencing the fluence
requirement of UV disinfection under full-scale conditions.
Biodosimetry is a powerful tool to determine germicidal
fluence values of CF systems, but to determine REF for the
whole range of relevant micro-organisms with different UV
sensitivities, additional model organisms are needed. In the
application of medium-pressure lamps with PC UV light,
further development of fluence assessment is of importance
using biodosimetry with proper weighting for spectral
sensitivity in connection with fluence calculation models.
Daily UV process control needs further research into accurate
description of the distribution of water flows and UV intensity
over UV reactors, using CFD, to obtain simple, reliable and
cheap in situ process control systems. Independent verifica-
tion with biodosimetry is still essential. Systems to measure
the germicidal fluence on-site in water treatment practice,
using micro-organisms or compounds ‘‘naturally’’ present in
the water would allow on-site verification of the efficacy of UV
systems in practice.
5. Conclusions
The accumulated literature data on the inactivation kinetics
of disinfection with UV irradiation demonstrate that the
process is effective against all pathogenic micro-organisms
relevant for the current drinking water practices. The
inactivation of micro-organisms by UV could be described
with first-order kinetics using fluence-inactivation data
from laboratory studies in collimated beam tests. No inacti-
vation at low fluences (shoulder) and no further increase of
inactivation at higher fluences (tailing) was observed for
some micro-organisms. The former deviation from the log-
linear kinetics is included in MIC calculations and the
latter was used to determine the maximum (observed)
MIC values. The parameters that were used to describe the
inactivation are the inactivation rate constant k (cm2/mJ),

ARTICLE IN PRESS
WAT E R R E S EA R CH 40 (2006) 3– 22 19
the maximum inactivation demonstrated and (only for
bacterial spores and Acanthamoeba) the offset parameter.
The most persistent organisms known are viruses, specifi-
cally Adenoviruses, and bacterial spores. From the protozoa
Acanthamoeba was highly UV resistant. Bacteria and
(oo)cysts of Cryptosporidium and Giardia are more suscep-
tible with a fluence requirement of o20 mJ/cm2 for an MIC
of 3 log.
Several studies have reported an increased UV resistance of
environmental bacteria and bacterial spores, compared to lab-
cultured organisms. This means that higher UV fluences are
required to obtain inactivation. Hence, for bacteria and spores,
a correction factor of two and four was included in the MIC
calculation, respectively, and data from the WWS show that a
higher correction is required under these conditions. For
phages and viruses this phenomenon appears to be of little
significance and for protozoan (oo)cysts this aspect needs
further attention. For application in drinking water, no
correction for repair seems necessary for most pathogens.
The results on repair for Giardia are conflicting, but no repair
occurred at higher fluences (60 mJ/cm2). For application in
wastewater, the occurrence of photo-reactivation of bacteria is
a subject for further research. To enable accurate assessment
of the effective fluence in CF UV systems in water treatment
practice, biodosimetry is of great importance. In the case of
MP lamps, more information about differences in spectral
sensitivity between pathogens and potential biodosimeter
organisms is needed to increase the precision of the fluence
determination. For UV systems that are primarily dedicated
to inactivate the more sensitive pathogens (Cryptosporidium,
Giardia, pathogenic bacteria), additional model organisms are
needed to serve as biodosimeter.
Acknowledgements
The research was funded by the joint research program of the
Dutch water companies and the Microrisk project. The
Microrisk (www.microrisk.com) project is co-funded by the
European Commission under contract number EVK1-CT-2002-
00123. The reviewing of the manuscript by Cheryl M. Davies
(School of Civil and Environmental Engineering, University of
New South Wales, Sydney, NSW, Australia) is highly appre-
ciated.
r e f e r e n c e s
Antopol, S.C., Ellner, P.D., 1979. Susceptibility of Legionellapneumophila to ultraviolet radiation. Appl. Environ. Microbiol.38 (2), 347–348.
Battigelli, D.A., Sobsey, M.D., Lobe, D.C., 1993. The inactivation ofHepatitis A virus and other model viruses by UV irradiation.Water Sci. Technol. 27 (3-4), 339–342.
Belosevic, M., Craik, S.A., Stafford, J.L., Norman, N.F., Kruithof, J.C.,Smith, D., 2001. Studies on the resistance/reactivation ofGiardia muris cysts and Cryptosporidium parvum oocysts ex-posed to medium-pressure ultraviolet radiation. FEMS Micro-biol. Lett. 204, 197–203.
Bernhardt, H., 1994. Desinfektion aufbereiteter Oberflachenwas-sers mit UV Strahlen. GWF Wasser-Abwasser 135 (12),677–689.
Bernhardt, H., Hoyer, O., Hengesbach, B., Schoenen, D., Karanis, P.,Moriske, H., von Sonntag, C., 1992. Desinfektion aufbereiteterOberflachenwassers mit UV Strahlen—erste Ergebnisse desForschungsvorhabens. GWF Wasser-Abwasser 133 (12),632–643.
Bolton, J.R., Dussert, B., Bukhari, Z., Hargy, T., Clancy, J.L., 1998.Inactivation of Cryptosporidium parvum by medium-pressureUltraviolet light in finished drinking water. In: Proceed-ings of the American Water Works Association WaterQuality Technology Conference, November 1–5, San Diego,CA, US, 1998.
Butler, R.C., Lund, V., Carlson, D.A., 1987. Susceptibility ofCampylobacter jejuni and Yersinia enterocolitica to UV radiation.Appl. Environ. Microbiol. 53 (2), 375–378.
Cabaj, A., Sommer, R., Schoenen, D., 1996. Biodosimetry: modelcalculations for UV water disinfection devices with regard todose distributions. Water Res. 30 (4), 1003–1009.
Chang, J.C.H., Ossoff, S.F., Lobe, D.C., Dorfman, M.H., Dumais,C.M., Qualls, R.G., Johnson, J.D., 1985. UV inactivation ofpathogenic and indicator micro-organisms. Appl. Environ.Microbiol. 49 (6), 1361–1365.
Chick, H., 1908. An investigation of the laws of disinfection. J. Hyg.8, 92–158.
Clancy, J.L., Hargy, T.M., Marshall, M.M., Dyksen, J.E., 1998. UVlight inactivation of Cryptosporidium oocysts. J. Am. WaterWorks Assoc. 90 (9), 92–102.
Clancy, J.L., Bukhari, Z., Hargy, Th.M., Bolton, J.R., Dussert, B.W.,Marshall, M.M., 2000. Using UV to inactivate Cryptosporidium.J. Am. Water Works Assoc. 92 (9), 97–104.
Clancy, J.L., Hargy, T.M., Battigelli, D.A., Marshall, M.M., Korich, D.,Nicholson, W.L., 2002. Susceptibility of multiple strains of C.parvum to UV light. Final Report of American Water WorksAssociation Research Foundation, Denver, CO.
Clancy, J.L., Fallon, K., Hargy, T.M., Mackey, E., Wright, H., 2004.Development of non-pathogenic surrogates for large scale UVreactor validation. In: Proceedings of the American WaterWorks Association Water Quality Technology Conference,November 14–18, San Antonio USA, 2004.
Craik, S.A., Finch, G.R., Bolton, J.R., Belosevic, M., 2000. Inactiva-tion of Giardia muris cysts using medium-pressure ultravioletradiation in filtered drinking water. Water Res. 34 (18),4325–4332.
Craik, S.A., Weldon, D., Finch, G.R., Bolton, J.R., Belosevic, M., 2001.Inactivation of Cryptosporidium parvum oocysts using medium-and low-pressure ultraviolet radiation. Water Res. 35 (6),1387–1398.
De Roda Husman, A.M., Duizer, E., Lodder, W., Pribil, W., Cabaj, A.,Gehringer, P., Sommer, R., 2003. Calicivirus inactivation bynon-ionizing (UV 253.7 nm) and ionizing (gamma) radiation.In: Second International Congress on Ultraviolet Technologies,Vienna, Austria, July 9–11, 2003.
Duizer, E., Bijkerk, P., Rockx, B., de Groot, A., Twisk, F., Koopmans,M., 2004. Inactivation of caliciviruses. Appl. Environ. Microbiol.70 (8), 4538–4543.
DVGW, 1997. UV-Desinfektionsanlagen fur die Trinkwasserversor-gung—Anforderungen und Prufung, Technical StandardW294. Deutscher Verein des Gas- und Wasserfaches, Bonn,Germany.
Gehr, R., Nicell, J., 1996. Pilot studies and assessment of downstreameffects on UV and ozone disinfection of a physicochemicalwastewater. Water Qual. Res. J. Can. 31 (2), 263–281.
Gehr, R., Wagner, M., Veerasubramanian, P., Payment, P., 2003.Disinfection efficiency of peracetic acid, UV and ozone afterenhanced primary treatment of municipal wastewater. WaterRes. 37, 4573–4586.
ARTICLE IN PRESS
WAT E R R E S E A R C H 4 0 ( 2 0 0 6 ) 3 – 2 220
Gerba, C.P., Gramos, D.M., Nwachuku, N., 2002. Comparativeinactivation of enteroviruses and Adenovirus 2 by UV light.Appl. Environ. Microbiol. 68 (10), 5167–5169.
Haas, C.N., 1983. Estimation of risk due to low doses of micro-organisms: comparison of alternative methodologies. Am.J. Epidemiol. 118 (4), 573–582.
Harris, D.G., Dean Adams, V.D., Sorensen, D.L., Curtis, M.S.,1987. Ultraviolet inactivation of selected bacteria andviruses with photo-reactivation of bacteria. Water Res. 21 (6),687–692.
Havelaar, A.H., Pot-Hogeboom, W.M., Koot, W., Pot, R., 1987.F-specific bacteriophages as indicators of the disinfectionefficiency of secondary effluent with ultraviolet radiation.Ozone Sci. Eng. 9, 353–368.
Havelaar, A.H., Meulemans, C.C.E., Pot-Hogeboom, W.M., Koster,J., 1990. Inactivation of bacteriophage MS2 in wastewatereffluent with monochromatic and polychromatic ultravioletlight. Water Res. 24 (11), 1387–1393.
Henry, V., Helbronner, A., Recklinghausen, M., 1910. Nouvellesrecherches sur la sterilization de grandes quantited d’eaupar les rayons ultraviolets. Comp. Rend. Acad. Sci. 151,677–680.
Hijnen, W.A.M., Veenendaal, D., van der Speld, W.M.H., Visser, A.,Hoogenboezem, W., van der Kooij, D., 2000. Enumeration offaecal indicator bacteria in large water volumes using on sitemembrane filtration to assess water treatment efficiency.Water Res. 34 (5), 1659–1665.
Hijnen, W.A.M., Medema, G.J., van der Kooij, D., 2004a. Quantita-tive assessment of the removal of indicator bacteria infull-scale treatment plants. Water Sci. Technol.: Water Supply4 (2), 47–54.
Hijnen, W.A.M., van der Veer, A.J., Beerendonk, E.F., Medema, G.J.,2004b. Increased resistance of environmental anaerobicspores to inactivation by UV. Water Sci. Technol.: Water Supply4 (2), 54–61.
Hoyer, O., 1998. Testing performance and monitoring of UVsystems for drinking water disinfection. Water Supply 16 (1/2),424–429.
Hoyer, O., 2004. Water disinfection with UV radiation—require-ments and realization. In: Proceedings of the EuropeanConference UV Karlsruhe, UV radiation. Effects and Technol-ogies, September 22–24, 2003, Karlsruhe.
Jacangelo, J.G., Loughran, P., Petrik, B., Simpson, D., Mcllroy, C.,2003. Removal of enteric viruses and selected microbialindicators by UV irradiation of secondary effluent. Water Sci.Technol. 47 (9), 193–198.
Johnson, A.M., Linden, K., Ciociola, K.M., De Leon, R., Widmer, G.,Rochelle, P.A., 2005. UV inactivation of Cryptosporidium hominisas measured in cell culture. Appl. Environ. Microbiol. 71 (5),2800–2802.
Knudson, G.B., 1985. Photoreactivation of UV irradiated LegionellaPneumophila and other Legionella species. Appl. Environ.Microbiol. 49 (4), 975–980.
Kruithof, J.C., Van der Leer, R.C., Hijnen, W.A.M., 1992. Practicalexperiences with UV disinfection in The Netherlands. J WaterSRT-Aqua 41 (2), 88–94.
Kruithof, J.C., Kamp, P.C., Martijn, B.J., Belosevic, M., Williams, G.,2005. UV/H2O2 treatment for primary disinfection and organiccontaminant control at PWN’s water treatment plant Andijk.In: Proceedings of the Third International Congress onUltraviolet Technologies, May 24–27, Whistler, BC, Canada,2005.
Linden, K.G., Shin, G., Faubert, G., Cairns, W., Sobsey, M.D., 2002.UV Disinfection of Giardia lamblia cysts in water. Environ. Sci.Technol. 36 (11), 2519–2522.
Lindenauer, K.G., Darby, J.L., 1994. Ultraviolet disinfection ofwastewater: effect of dose on subsequent photoreactivation.Water Res. 28, 805–817.
Lytle, C.D., 1971. Host-cell reactivation in mammalian cells I.survival of ultra-violet-irradiated Herpes virus in differentcell-lines. Int. J. Radiat. Biol. 19 (4), 329–337.
Maier, A., Tougianidou, D., Wiedenmann, A., Botzenhart, K., 1995.Detection of Poliovirus by cell culture and by PCR after UVdisinfection. Water Sci. Technol. 31 (5-6), 141–145.
Malley, J.P., Ballester, N.A., Margolin, A.B., Linden, K.G., Mofidi, A.,Bolton, J.R., Crozes, G., Laine, J.M., Janex, M.L., 2004. Inactiva-tion of Pathogens with Innovative UV Technologies. AmericanResearch Foundation and American Water Works Association,2004.
Mamane-Gravetz, H., Linden, K.G., 2004. Impact of particleaggregated microbes on UV disinfection. In: Proceedingsof the American Water Works Association Water QualityTechnology Conference, November 14–18, San Antonio, USA,2004.
Mamane-Gravetz, H., Linden, K.G., 2005. Relationship betweenphysiochemical properties, aggregation and UV inactivation ofisolated environmental spores in water. J. Appl. Microbiol. 98,351–363.
Mamane-Gravetz, H., Linden, K.G., Cabaj, A., Sommer, R., 2005.Spectral sensitivity of Bacillus subtilis spores and MS2 coliph-age for validation testing of ultraviolet reactors for waterdisinfection. Environ. Sci. Technol. 39 (20), 7845–7852.
Martiny, H., Schubert, T., Ruden, H., 1990. Use of UV radiation forthe disinfection of water V. Communication: Microbiologicalinvestigations with bacteria of the exponential and thestationary phase in cold and in warm drinking water. Zbl. Hyg.190, 380–394.
Maya, C., Beltran, N., Jimenez, B., Bonilla, P., 2003. Evaluationof the UV disinfection process in bacteria and amphizoicamoeba inactivation. Water Sci. Technol.: Water Supply 3 (4),285–291.
Medema, G.J., Hoogenboezem, W., Van der Veer, A.J., Ketelaars,H.A.M., Hijnen, W.A.M., Nobel, P.J., 2003. Quantitative riskassessment of Cryptosporidium in surface water treatment.Water Sci. Technol. 47, 241–247.
Meng, Q.S., Gerba, C.P., 1996. Comparative inactivation of entericAdenoviruses, Poliovirus and coliphages by ultraviolet irra-diation. Water Res. 30 (11), 2665–2668.
Mofidi, A.A., Rochell, P.A., Chou, C.I., Mehta, H.M., Linden, K.G.,Malley, J.P., 2002. Bacterial survival after ultraviolet lightdisinfection: resistance, regrowth and repair. In: Proceedingsof the American Water Works Association Water QualityTechnology Conference, November 10–14, Seattle, USA,2002.
Morita, Sh., Namikoshi, A., Hirata, T., Oguma, K., Katayama, H.,Ohgaki, S., Motoyama, N., Fujiwara, M., 2002. Efficacy of UVirradiation in inactivating Cryptosporidium parvum oocysts.Appl. Environ. Microbiol. 68 (11), 5387–5393.
Nieuwstad, T.J., Havelaar, A.H., 1994. The kinetics of batchultraviolet inactivation of bacteriophage MS2 and microbiolo-gical calibration of a pilot plant. J. Environ. Sci. Health A 29 (9),1993–2007.
Nwachuku, N., Gerba, C.P., Oswald, A., Mashadi, F.D., 2005.Comparative inactivation of adenovirus serotypes by UV lightdisinfection. Appl. Environ. Microbiol. 71 (9), 5633–5636.
Oguma, K., Katayama, H., Ohgaki, S., 2002. Photoreactivation ofEscherichia coli after low- or medium-pressure UV disinfectiondetermined by an endonuclease sensitivity site assay. Appl.Environ. Microbiol. 68 (12), 6029–6035.
Oguma, K., Katayama, H., Ohgaki, S., 2004. Photoreactiva-tion of Legionella pneumophila after inactivation by low-or medium pressure ultraviolet lamp. Water Res. 38 (11),2757–2763.
Ormeci, B., Linden, K.G., 2002. Comparison of UV and chlorineinactivation of particle and non-particle associated coliforms.Water Sci. Technol.: Water Supply 2 (5-6), 403–410.

ARTICLE IN PRESS
WAT E R R E S EA R CH 40 (2006) 3– 22 21
Osterreichisches Normungsinstitut, 1999. Anlagen zur Desinfek-tion von Wasser mittels Ultraviolet-strahlen, Anforderungenund Prufung. Onorm M 5873-1, Wien.
Oppenheimer, J.A., Hoagland, J.E., Laine, J.-M., Jacangelo, J.G.,Bhamrah, A., 1993. Microbial inactivation and characterizationof toxicity and by-products occurring in reclaimed wastewaterdisinfected with UV radiation. In: WEF Speciality ConferenceSeries: Planning, Design and Operation of Effluent DisinfectionSystems. Water Environment Federation, Alexandria, VA(pp. 13–24).
Oppenheimer, J.A., Jacangelo, J.G., Laıne, J.M., Hoagland, J.E., 1995.Equivalency testing of ultraviolet disinfection for wastewaterreclamation. In: Proceedings of the American Water WorksAssociation Water Quality Technology Conference, November12–16, New Orleans, USA, 1995.
Qian, S.S., Donnelly, M., Schmelling, D.C., Messner, M., Linden,K.G., Cotton, C., 2004. Ultraviolet light inactivation of protozoain drinking water: a Bayesian meta-analysis. Water Res. 38 (2),317–326.
Qualls, R.G., Johnson, J.D., 1983a. Bioassay and dose measure-ment in UV disinfection. Appl. Environ. Microbiol. 45 (3),872–877.
Qualls, R.G., Flynn, M.P., Johnson, J.D., 1983b. The role ofsuspended particles in ultraviolet disinfection. J. WaterPollut. Control Fed. 55 (10), 1280–1285.
Regli, S., Rose, J.B., Haas, C.N., Gerba, C.P., 1991. Modelling the riskfrom Giardia and viruses in drinking water. J. Am. Water WorksAssoc. 83, 76–84.
Rochelle, P.A., Mofidi, A.A., Marshall, M.M., Upton, S.J., Montelone,B., Woods, K., Di Giovanni, G., 2004. An investigation of UVdisinfection and repair in Cryptosporidium parvum. Report ofthe American Water Works Association AWWA, 2004.
Ronto, G., Gaspar, S., Berces, A., 1992. Phage T7 in biological UVdose measurement. J. Photochem. Photobiol. B Biol. 12,285–294.
Schoenen, D., Zemke, V., Kolch, A., 1991. The influence ofreflection of the UV-rays on the disinfection of drinkingwater. Zbl. Hyg. 191, 396–405.
Schoenen, D., Kolch, A., Gebel, J., Hoyer, O., 1995. UV-Desinfektion vonTrinkwasser, Grundlagen und Anvorderungen fur die praktischeAnwendung. DVGW-Schriftenreihe Wasser 86, 303–350.
Severin, B.F., Suidan, M.T., Engelbrecht, R.S., 1983. Effects oftemperature on ultraviolet light disinfection. Environ. Sci.Technol. 17 (12), 717–721.
Shin, G., Linden, K.G., Arrowood, M.J., Sobsey, M.D., 2001. Low-pressure UV inactivation and DNA repair potential of Cryptos-poridium parvum oocysts. Appl. Environ. Microbiol. 67 (7),3029–3032.
Shin, G., Bohrerova, Z., Linden, K.G., Faubert, G., 2005. DNA repairof UV-irradiated Giardia lamblia cysts detected by bothinfectivity and molecular biological assays. In: Proceedings ofthe Third International Congress on Ultraviolet Technologies,May 24–27, Whistler, BC, Canada, 2005.
Simpson, D., Jacangelo, J., Loughran, P., Mcllroy, C., 2003.Investigation of potential surrogate organisms and publichealth risk in UV irradiated secondary effluent. Water Sci.Technol. 47 (9), 37–43.
Slade, J.S., Harris, N.R., Chisholm, R.G., 1986. Disinfection ofchlorine resistant enteroviruses in groundwater by ultravioletirradiation. Water Sci. Technol. 18 (10), 115–123.
Smeets, P.W.M.H., van der Helm, A.W.C., Dullemont, Y.J., Rietveld,L., van Dijk, J.C., Medema, G.J., 2004. E. coli inactivation byozone under bench-scale and full-scale hydraulic conditions.Water Res. (submitted for publication).
Smeets, P.W.M.H., Dullemont, Y., Medema, G.J., Van Dijk, J.C., 2005.E. coli as surrogate for Campylobacter inactivation at bench-scale and full-scale and high ozone resistance of environ-mental E. coli and Campylobacter. In: Proceedings of the 17th
Conference of International Ozone Association, August 22–26,Strasbourg, 2005.
Sommer, R., Weber, G., Cabaj, A., Wekerle, J., Keck, G., Schauber-ger, G., 1989. UV inactivation of micro-organisms in water. Zbl.Hyg. 189, 214–224.
Sommer, R., Haider, T., Cabaj, A., Heidenreich, E., Kundi, M., 1996a.Increased inactivation of Sacharomyces cerevisiae by protractionof UV irradiation. Appl. Environ. Microbiol. 62 (6), 1977–1983.
Sommer, R., Cabaj, A., Haider, T., 1996b. Microbiocidal effect ofreflected UV radiation in devices for water disinfection. WaterSci. Technol. 34 (7-8), 173–177.
Sommer, R., Cabaj, A., Pribil, W., Haider, T., 1997. Influence oflamp intensity and water transmittance on the UV disinfec-tion of water. Water Sci. Technol. 35 (11-12), 113–118.
Sommer, R., Haider, T., Cabaj, A., Pribil, W., Lhotsky, M., 1998. Timefluence reciprocity in UV disinfection of water. Water Sci.Technol. 38 (12), 145–150.
Sommer, R., Cabaj, A., Sandu, T., Lhotsky, M., 1999. Measurementof UV radiation using suspensions of micro-organisms. J.Photochem. Photobiol. B: Biol. 53, 1–6.
Sommer, R., Lhotsky, M., Hairder, T., Cabaj, A., 2000a. UVinactivation, liquid-holding recovery, and photoreaction of E.coli OH157 and other pathogenic E. coli strains in water. J. FoodProt. 63 (8), 1015–1020.
Sommer, R., Cabaj, A., Pribil, W., Haider, T., Hirschmann, G., 2000b.Differences between calculated and biodosimetrically mea-sured fluences in UV plants for drinking water disinfection—
practical experiences with the Austrian National Standard M5873-1. In: Proceedings of the IOA, European–African–Asia-n–Australasian Group, Wasser Berlin, October 23–26, 2000.
Sommer, R., Pribil, W., Appelt, S., Gehringer, P., Eschweiler, H.,Leth, H., Cabaj, A., Haider, T., 2001. Inactivation of bacter-iophages in water by means of non-ionizing (UV-253.7 nm) andionizing (gamma) radiation: a comparative approach. WaterRes. 35 (13), 3109–3116.
Teunis, P.F.M., Medema, G.J., Kruidenier, L., Havelaar, A.H., 1997.Assessment of the risk of infection by Cryptosporidium orGiardia in drinking water from a surface water source. WaterRes. 31 (16), 1333–1346.
Thompson, S.S., Jackson, J.L., Suva-Castillo, M., Yanko, W.A.,El jack, Z., Kuo, J., Chen, Ch., Williams, F.P., Schnurr, D.P., 2003.Detection of infectious human Adenoviruses in tertiary-treated and ultraviolet-disinfected wastewater. Water Environ.Res. 75 (2), 163–170.
Thurston-Enriquez, J.A., Haas, C.N., Jacangelo, J., Riley, K., Gerba,C.P., 2003. Inactivation of feline Calicivirus and AdenovirusType 40 by UV radiation. Appl. Environ. Microbiol. 69 (1),577–582.
USEPA, 2003. Ultraviolet disinfection guidance manual. EPA815-D-03-007, June 2003, EPA, Washington, DC, USA.
von Sonntag, C., Kolch, A., Gebel, J., Oguma, K., Sommer, R., 2004.The photochemical basis of UV disinfection. In: Proceedings ofthe European Conference UV Karlsruhe, UV Radiation. Effectsand Technologies, September 22–24, 2003, Karlsruhe.
Watercare, 2002. Pilot plant investigations, surrogate study,results and recommendations. Disinfection review groupreport Water Care Services Ltd., New Zealand, 2002.
Watson, H.E., 1908. A note on variation of the rate of disinfectionwith change in the concentration of the disinfectant. J. Hyg. 8,536–542.
Whitby, G.E., Palmateer, G., 1993. The effect of UV transmission,suspended solids, wastewater mixtures and photoreactivationon microorganisms in wastewater treated with UV light. WaterSci. Technol. 27, 379–386.
Wiedenmann, A., Fischer, B., Straub, U., Wang, C.H., Flehmig, B.,Schoenen, D., 1993. Disinfection of Hepatitis A virus and MS2coliphage in water by ultraviolet irradiation: comparison of UVsusceptibility. Water Sci. Technol. 27 (3-4), 335–338.
ARTICLE IN PRESS
WAT E R R E S E A R C H 4 0 ( 2 0 0 6 ) 3 – 2 222
Wilson, B.R., Roessler, P.F., van Dellen, E., Abbaszadegan, M.,Gerba, C.P., 1992. Coliphage MS2 as a UV water disinfectionefficacy test surrogate for bacterial and viral pathogens. In:Proceedings of the American Water Works Association WaterQuality Technology Conference, November 15–19, Toronto,Canada, 1992.
Wolfe, R.L., 1990. Ultraviolet disinfection of potable water.Environ. Sci. Technol. 24 (6), 768–773.
Zimmer, J.L., Slawson, R.M., 2002. Potential repair of Esherichiacoli DNA following exposure to UV radiation from bothmedium- and low-pressure UV sources used in drinking watertreatment. Appl. Environ. Microbiol. 68 (7), 3293–3299.
Zimmer, J.L., Slawson, R.M., Huck, P.M., 2003. Inactivation andpotential repair of Cryptosporidium parvum following low- andmedium-pressure ultraviolet irradiation. Water Res. 37 (14),3517–3523.