in vivo spectrophotometric evaluation of neoplastic and non-neoplastic skin pigmented lesions–i....
TRANSCRIPT

Phorochemirrry and Photobiology Vol. 53, No. 1. pp. 77-84, 1991 Printed in Great Britain. All rights reserved
003 1 -X655/9 1 $03.00 + 0.00 Copyright 0 1991 Pcrgamon Prcss plc
In vivo SPECTROPHOTOMETRIC EVALUATION OF NEOPLASTIC AND NON-NEOPLASTIC SKIN PIGMENTED LESIONS-I. REFLECTANCE
MEASUREMENTS RENATO MARCHESINI'*, MARCO BRAMBILLA' , CLAUDIO CLEMENTE', MASSIMO MANIEZZO.',
ADELE E. SICHIROLLO', ALESSANDRO TEST0RI3, DANIELE R. VENTUROLI' and NATALE CASCINELLI'
'Department of Health Physics, ZDepartment of Pathology and Cytopathology and 'Department of Clinical Oncology B, Istituto Nazionale per lo Studio e la Cura dei Tumori, Via Venezian 1.
1-20133 Milano, Italy
(Received 28 March 1990; accepted 3 July 1990)
Abstract-Reflectance spectrophotometry from 400 to 800 nm on different cutaneous pigmented lesions, including primary and metastatic malignant melanoma, pigmented nevi, lentigo and seborrhoeic keratosis, has been performed by using an external integrating sphere coupled to a spectrophotometer. Measurements show that reflectance spectra of the different lesions manifest dissimilar patterns, particularly in the near IR region. Comparison of reflectance of nevi with that of malignant melanomas results in a highly significant difference (P < lo-") between the two samples. Though interpretation of the specta remains difficult as a result of the complexity of the optical processes of scattering and absorption, our results suggest that a detailed analysis of the reflectance spectrum may give clinically useful information, and could be utilized as an aid in clinical diagnosis of cutaneous pigmented lesions, especially where malignant melanoma is concerned.
INTRODUCTION
Clinical diagnosis of malignant melanoma (m.m.)t is still a challenging problem outside a highly specialized center and the smaller the size of the lesion the greater the magnitude of the problem. There is no doubt that clinical diagnosis is still based on the personal experience of the physician who runs his own brain computer program with sub- jective input data.
The differential diagnosis between a benign pig- mented lesion and a cutaneous m.m. is based on the evaluation of four characteristics that were recently summarized in the formula "A, B, C, D", for Asym- metry, Border, Color and Dimension. This attempt toward an objective diagnosis is still difficult to transfer easily to non-highly specialized clinicians because the only reproducible diagnostic parameter is the maximum diameter. Malignant melanomas are usually larger than 6 8 mm. The remaining clini- cal criteria are still subjective; mainly the color and border, whose evaluations are of paramount importance when differentiating between m.m. and pigmented moles, congenital nevi, solar keratosis, or flat seborrhoeic keratosis, which may have irregu- lar shape and well defined margins.
'To whom correspondence should be addressed. trlbbreviations: BC, relative index of blood content; D,
difference reflectance; H, hemoglobin index; LIR. log- arithm of the inverse-of reflectance; M, melanin index; m.m., malignant melanoma; R, reflectance; SD, stan- dard deviation.
One possible way to carry out an objective evalu- ation of the colors of the moles and of the skin is to measure their reflectance by means of a spectrophotometer, thus overcoming the observer subjective perceptions which may induce misclassi- fication of skin color (Hertzman et al., 1987).
Experimental measurements of physical or physiological characteristics of skin lesions are scarcely reported. Srivastava et al. (1986) point out that blood flow detected by Doppler ultrasound probe is in general related to the tumor thickness and may have a prognostic importance with m.m. By using features of skin reflectance spectra, Daw- son et al. (1980), Kollias and Baqer (1986), and Feather et al. (1989) suggest a method to measure erythema and skin pigments (i.e. hemoglobin and melanin). If cutaneous blood content and pigmen- tation may be somehow considered characteristics of skin lesion, the study of the reflectance spectrum of m.m. and moles can be used as an aid for the clinical diagnosis of malignancy. In fact, if the pres- ence of malignant cells should somehow alter the optical characteristics of the epidermis, with respect to a healthy one, a different reflectance spectrum could appear. In addition, because melanin appears in many structural forms in the epidermis, i.e. mem- brane-limited small vesicles and melanosomes in different stages of development, it is not unlikely that the different scattering and absorption patterns of photons interacting with the different forms of melanin (Wolbarsht et al. 1981) could reveal some
71

78 RENATO MARCHESINI er al.
differences in benign and malignant cutaneous tumors.
In the present paper, we report the results obtained with the use of an optical guide connected to an integrating sphere coupled to a spectrophoto- meter to evaluate the reflectance features of skin and pigmented cutaneous lesions, and to establish whether the different spectral patterns that appear in the reflectance spectra might be exploited to discriminate between non-neoplastic, benign and malignant skin pigmented lesions.
It must be mentioned that, since light collection inside the integrating sphere is modified by the transmission efficiency of the optical coupler, the spectral data are not absolute; though results are not invalidated this might place limits on their interpretation.
MATERIALS AND METHODS
Patient. Reflectance measurements were performed on 26 skin lesions planned for surgery in 24 patients. These lesions were clinically suspected for malignancy and histo- logical evaluation of specimens diagnosed malignant mela- noma in 12 cases (4 of I1 level, 2 of 111 level, and 6 of IV level, following Clark's classification; thickness ranging from 0.3 to 4.6 mm), cutaneous metastasis of melanoma (7 cases in 5 patients), lentigo senile (2 cases), seborrhoeic keratosis ( 5 cases). Reflectance spectra of 12 clinically obviously benign pigmented nevi in 12 volunteers were also measured.
Other type of lesions that might be confused with m.m. (i.e. pigmented basal cell carcinoma, blue nevi, displastic nevi, Spitz nevi) were not found in the present study. The malignant and benign moles were randomly distributed over the bodies of the patients.
Informed consent was obtained before measurements were made.
Instrumenfarion. The main components of the instru- ment are a UVlVIS spectrophotometer (Lambda 5 , Perkin-Elmer, W. Germany) and an External Integrating Sphere (Perkin-Elmer). The integrating sphere (12 cm diam.) is connected to the spectrophotometer by two flex- ible fiber optic bundles, and was operated in comparison mode (Goebel, 1967). The reference beam is directed at the barium-sulfate-coated wall of the sphere, and the sam- ple beam is directed to the 1 cm diameter sample port. A truncated cone-shaped light guide made of perspex was inserted into the sample port. The cone is 2 cm long, the larger and smaller ends being 10 and 5 mm in diameter respectively. The angle of the conical element is 15.8". The wall of the cone was coated with a metallic reflecting layer (r = 0.92). During spectrophotometric setup, a back- ground correction was performed with a standard plate, made of barium sulfate, clamped over the cone. Reflec- tance of the standard was assumed to be 1 from 400 to 800 nm.
The use of a cone with 5 mm diameter tip allows precise placing of the integrating sphere over a relatively small lesion and, at the same time, minimizes losses of light intensity backscattered by the tissue. Mathematical details of the optical efficiency are given in the Appendix. Briefly, the conclusions of the calculation are the following: (i) light propagating through the cone and coming from the larger end will never undergo total reflection at the smaller end, and vice versa; (ii) light scattered by tissue and entering the cone will be collected inside the integrating sphere with a loss in intensity ranging approximately from 0.05 to 0.30, depending on the angle of refraction at the tissue-cone interface.
Reflectance measurements of the lesion, of healthy skin in the proximity of lesion, and of the right upper inner arm were performed by gently positioning the smaller end of the cone in contact with the area under investigation. Room lighting was maintained as dim as possible. Reflec- tance spectra, from 400 to 800 nm, were recorded at a scanning speed of 120 nmlmin, and stored in a Personal Computer connected to the spectrophotometer for sub- sequently handling the data.
RESULTS
Figures l(a)-l(e) show the reflectance spectra of the investigated lesions, each solid line being the mean of all the corresponding single measurements. Reflectance of the healthy skin (right upper inner arm) of patients bearing benign nevi or m.m. are reported in Figs. l(f) and l(g), respectively. Reflec- tance data R(A) reported in the figures have been obtained by using the following expression:
where &(A) is the reflectance reading with the cone and &(A) is the background reading due to light directly reflected into the integrating sphere by the cone. This spectrum [(&(A)] was determined by placing the optical probe in a light-tight box. Typical values of &(A) ranged between 0.1 and 0.15. To evaluate whether the insertion of the cone could affect reflected intensity with respect to that meas- ured without it, Ro(h), and to test the validity of the above expression, reflectance measurements of intensely colored surfaces were performed. The results obtained by the two different procedures agreed well, with 1.05 2 0.05 the ratio Ro(A)/R(A) between the intensity of the two reflectance spectra in the whole range of wavelengths.
Table 1 shows reflectance values at 420, 500, 650 and 780 nm for the different samples. Data have been averaged over an interval of 10 nm centered at the selected wavelengths. No major differences in reflectance at 420 nm were observed in our samples except when m.m. is compared to metastasis (P = 0.024), and if measurements on normal skin are neglected. A more apparent differentiation appears between m.m. and the remaining pig- mented lesions when results are observed at the greater wavelengths, especially in the near IR region. Reflectance greatly decreases in passing from benign nevi to m.m. Intermediate values were observed for lentigo, cutaneous metastasis, and seborrhoeic keratosis. Statistical analysis shows that reflectance of m.m. is significantly different from that of the other lesions, with a P value ranging from 0.048 (keratosis at 780 nm) to < lo-" (nevus at 780 nm).
Although all the patients were of fairly pale com- plexion, in order to put the various measurements on a common denominator, difference spectra between pigmented lesions and nearby normal skin were evaluated. For each lesion a difference

Reflectance spectrophotometry
4 0 H e l I 30-
79
( C )
Keratos i a -
1 60
( a )
4 0 R e t 1 3 0 - e C t a 2 0 -
Malignant melanoma R 40t I
-
60 I
4 0 R e
e f 30..
C
Lentigo 4 0 H
( d ) I Cutaneous metnmtasis -
/
" 400 4 6 0 600 660 600 660 700 760 800
Wawlengl h (nm)
- - I
400 4M) 600 660 600 860 7 0 0 760 800
Wcivelength (nm)
5o - 4 0 0 4 6 0 500 660 BOO em 700 760 ew
Wavelength (nm)
01 " " " ' 4 0 0 4 6 0 600 660 800 660 700 760 800
Wawlength (nm)
Normal skin (nev i )
l o t o-Ld 4 0 0 4 6 0 500 660 600 860 7 0 0 760 800
Wawlength (nm)
60
J n
Normal skin (m.m.)
0 1 " " " ' 4 0 0 4EO 600 660 BOO 060 700 760 800
Wavelength (nm)
Figure 1 . Reflectance spectra, mean value (-) k SD (-), of (a) malignant melanoma; (b) benign nevi; (c) keratosis; (d) cutaneous metastasis; (e) lentigo; ( f ) normal skin (inner arm) of nevi bearing patients; (g) normal skin
80 RENATO MARCHESINI et al.
1.2
Table 1 . Reflectance (%) mean values f SD of the different lesions at selected wavelengths. Data have been averaged over an interval of 10 nm centered at the indicated wavelengths
Wavelength (nm) 420 500 650 780
Normal skin' 23.21 f 3.70 33.19 t 3.67 40.01 f 3.26 38.48 f 3.01 Normal skint 20.44 f 6.35 30.78 t 6.60 40.18 f 5.36 39.62 2 4.77 Melanoma 4.78 f 4.17 5.60 f 3.84 9.54 f 3.20 16.01 f 4.50 Nevi 5.94 f 5.22 10.87 f 6.94f 23.50 f 6.888 31.60 f 4.501 Metastasis 9.97 f 4.13$ 12.55 f 4.198 16.84 * 4.786 21.65 f 5.91$ Keratosis 5.12 t 2.55 8.15 f 1.80 13.92 * 3.41$ 21.41 2 4.30$ Lentigo 6.63 f 0.07 8.04 f 1.58 16.70 2 5.67$ 27.71 f 5.58$
'Melanoma bearing patients. tBenign nevi bearing patients fP < 0.05 compared to m.m. $P < 0.01 compared to m.m.
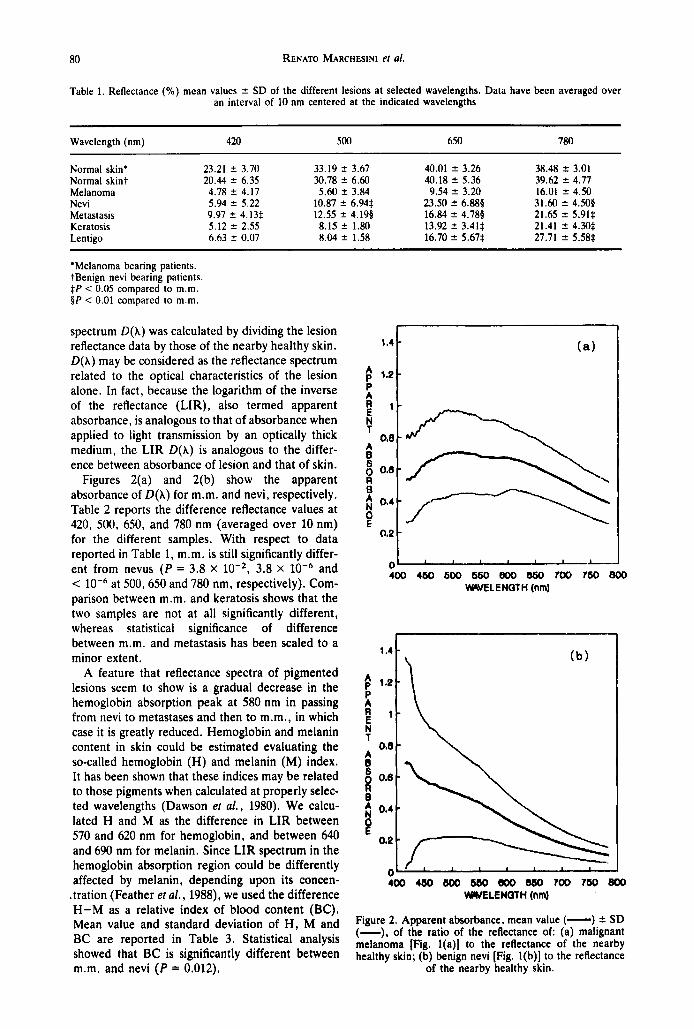
spectrum D(X) was calculated by dividing the lesion reflectance data by those of the nearby healthy skin. D(X) may be considered as the reflectance spectrum related to the optical characteristics of the lesion alone. In fact, because the logarithm of the inverse of the reflectance (LIR), also termed apparent absorbance, is analogous to that of absorbance when applied to light transmission by an optically thick medium, the LIR D(h) is analogous to the differ- ence between absorbance of lesion and that of skin.
Figures 2(a) and 2(b) show the apparent absorbance of D(A) for m.m. and nevi, respectively. Table 2 reports the difference reflectance values at 420, 500, 650, and 780 nm (averaged over 10 nm) for the different samples. With respect to data reported in Table 1, m.m. is still significantly differ- ent from nevus (P = 3.8 x lo-*, 3.8 x and < at 500,650 and 780 nm, respectively). Com- parison between m.m. and keratosis shows that the two samples are not at all significantly different, whereas statistical significance of difference between m.m. and metastasis has been scaled to a minor extent.
A feature that reflectance spectra of pigmented lesions seem to show is a gradual decrease in the hemoglobin absorption peak at 580 nm in passing from nevi to metastases and then to m.m., in which case it is greatly reduced. Hemoglobin and melanin content in skin could be estimated evaluating the so-called hemoglobin (H) and melanin (M) index. It has been shown that these indices may be related to those pigments when calculated at properly selec- ted wavelengths (Dawson er a l . , 1980). We calcu- lated H and M as the difference in LIR between 570 and 620 nm for hemoglobin, and between 640 and 690 nm for melanin. Since LIR spectrum in the hemoglobin absorption region could be differently affected by melanin, depending upon its concen-
.tration (Feather et al . , 1988), we used the difference H-M as a relative index of blood content (BC). Mean value and standard deviation of H , M and BC are reported in Table 3. Statistical analysis showed that BC is significantly different between m.m. and nevi (P = 0.012).
1.41
(b)
1 1 -
400 480 600 660 m 660 700 760 800 WELENQTH (nm)
Figure 2. Apparent absorbance, mean value (-) 2 SD (-), of the ratio of the reflectance of (a) malignant melanoma [Fig. l(a)] to the reflectance of the nearby healthy skin; (b) benign nevi [Fig. l(b)] to the reflectance
of the nearby healthy skin.

Reflectance spectrophotometry 81
Tablc 2. Diffcrcncc rcflcctancc mcan valucs ? SD of thc diffcrcnt lcsions at sclcctcd wavclcngths. Data have hccn avcragcd ovcr an interval of 10 nm ccntcrcd at thc indicatcd wavclcngths
Wavclcngth (nm) 420 5(K) 650 780
Melanoma Ncvi Metastasis Kcratosis Lentigo
0.28 t 0.24 0.21 t 0.14 0.26 ? 0.10 0.44 2 0.12 0.34 t 0.27 0.37 t 0.21* 0.58 ? 0.17: 0.79 2 0.10: 0.49 * 0.18 0.39 * O.lh* 0.41 t 0.10’ 0.53 2 0.10 0.40 t 0.30 0.34 t 0. 15 0.37 t 0.13 0.55 2 0.13 0.37 t 0.10 0.38 2 0.20 0.57 t 0.30* 0.77 ? 0.18’
‘ P < 0.05 comparcd to m.m. t P < 0.01 comparcd to m.m.
Tablc 3. Mcan valucs -t SD of hcmoglohin indcx (H). mclanin indcx (M). and rclativc indcx of hlood content (BC) for diffcrcnt lesions
H M BC
Mclanoma Ncvi Metastasis Kcratosis Lcntigo
0.123 ? 0.097 0.098 t 0.045 0.025 t 0.061 0.167 ? 0.074 0.081 t 0.043 0.086 t 0.(!47’ 0.082 n.(w 0.050 t 0.036* 0.032 ? 0.05s O.I30? 0.130 0.067 t o.015 0.062 2 0. I20 0. iw 5 0.007 0. I10 * 0.028 o.os0 2 0.099
*P < 0.05 comparcd to m.m
DISCUSSION
Results of the present study suggest that the use of a spectrophotometer coupled with an integrating sphere may give interesting information on the color of a given skin lesion.
Reflectance spectroscopy for measurements of skin pigments in vivo has been used by other authors (Dawson et al., 1980; Kollias and Baqer, 1985; Feather et al., 1988). Nevertheless, our experimen- tal method is unlike those described in the litera- ture. Theoretically, reflectance measurement of an object is accomplished by employing an integrating sphere that allows all the scattered and reflected light from the object to be collected (Grum and Becherer, 1979). Unfortunately, reflectance measurements can be carried out only for objects, i.e. lesions, with a diameter greater than the dimen- sion of the aperture in the sphere wall. Even though such a limitation might be overcome by using smaller apertures, it might be unreliable placing the aperture in proper position over the investigated area due to the relatively large diameter of the integrating sphere. The introduction of a light guide through the integrating sphere should improve the performance characteristics of the existing tech- niques. In fact, the optical probe can be precisely placed over a small lesion and specular reflection is minimized because refractive indices of perspex and skin almost match each other (1.49 vs 1.4). In addition, this arrangement ensures that the same area is both illuminated and viewed, and that a minimal loss of light intensity in passing through the light guide occurs. Finally, the integrating sphere
used in comparison mode makes reflectance measurements independent by variation in intensity of the light source and allows normalization “on line” to a standard diffusing surface. The drawback we found in our instrument was a poor reliability of measurements at wavelengths below 415 nm and above 785 nm. Below 415 n m the fiber optic bundles do not efficiently transmit the illuminating light, whereas above 785 nm the electronic noise of the photomultiplier tube does to a large extent decrease the signal to noise ratio. Thus, reflectance data were analyzed only between 415 and 785 nm.
It must be noted that the actual reflectance values should be somewhat greater than those shown in Figs. l(a)-l(g). In fact, as it has been described in the Appendix, the cone transmits light back- scattered by tissue with varying efficiency, depending upon the scattering and absorption pat- tern. To experimentally establish the wavelength dependence of the correction factor, reflectance measurements performed with the integrating sphere coupled with the cone were compared, wher- ever possible, to those obtained without the cone. Comparison was made possible in all the cases of healthy skin and for three cases involving m.m. where the extent of the lesion was greater than the 1 cm diameter hole of the integrating sphere. The correction factor. defined as the ratio between &)(A) and /?(A), resulted, on average, in a linear function of wavelength, slowly increasing from about 1.1 at 430 nm to about 1.30 at 800 nm both for healthy skin and m.m. (Fig. 3). The correction factor range within the values, estimated in the Appendix sec-

82 RENATO MARCHESINI ei al.
R 1.3' 9 1 I 9 0 1.1 t 6
0
R 6 I I 0 0.7
n
0.0 '
0.6 \ 400 460 Mx) 660 mo 660 700 760 800
Wawlength (nm)
Figure 3 . Ratio of reflectance values measured without and with the cone for normal skin (-) and malignant
melanoma (-).
tion, of the intensity of transmitted light through the cone, i.e. from 95 to 70%.
Another source of uncertainty that may influence the correction factor is related to the effective sam- pling depth of the 5 mm diameter of the cone light guide compared with the 10 mm aperture of inte- grating sphere. It is well known that light fluence in depth decreases as light beam diameter is reduced. Moreover, data reported by Flock el al. (1989) clear- ly indicate that the relationship between fluence profile in depth and beam diameter is strongly dependent on the optical characteristics, i.e. albedo and scattering phase function, of tissue. To investi- gate the effect that different apertures in the inte- grating sphere would have in reflectance spectrum, preliminary measurements were performed. Results showed that reflectance spectrum of normal skin was practically not affected by changing the diarn- eter hole of the integrating sphere from 5 to 10 mrn. Thus we are presuming that, in our case, effective sampling depth of 10 to 5 mm apertures is nearly equivalent, and the correction factor is mainly related to the transmission efficiency of the optical probe.
Although the correction factor showed, within the variability from subject to subject, the same trend for both healthy skin and rn.m., in the absorp- tion range of hemoglobin, i.e. for wavelengths less than 430 nm and from 500 to 600 nm, the linear relationship with wavelength breaks down, becorn- ing dependent on skin blood content. We have to point out that the wavelength dependence of R,,(h)lR(h) found in skin measurements is not in contrast to that previously reported for colored sur- faces since, in the latter case, absorption dominates over scattering in the whole range of wavelengths.
Although averaged spectra of pigmented lesions
tend to wash out the structures of hemoglobin peaks, the relative index of blood content (Table 3) is one of the characteristics that differentiates m.m. from nevi. Figure 3 clearly shows that the wave- length-dependence of the optical coupler does not allow a precise quantification of hemoglobin con- tent, especially when normal skin is concerned. In this case, reflectance ratio at 620 nm is about 1.26 times that of 570 nm. As a consequence, an appar- ent absorbance of 0.1 should be added to the H- index evaluated by the measurements performed with the light guide on normal skin. Since this cor- rective factor has the same order of magnitude of that calculated, any indication of the amount of hemoglobin content should be used very cautiously. Fortunately, the wavelength-dependence of R,,(A)IR(A) does not invalidate the probability fac- tors shown in Table 3; on the contrary, it provides an underestimation. In fact, if the reflectance ratio for nevi is equal to that of normal skin, this hypoth- esis being the worst case, it follows that an apparent absorbance up to 0.1 should be added to H-index of nevi with respect to that of m.m. Since evaluation of M-index is not greatly affected by the wavelength- depending correction factor, BC-index of nevi further increases with respect to that of m.m. Simi- lar considerations can be extended to the other lesions because it is reasonable to assume that their wavelength-depending correction factors lay between that of m.m. and that of normal skin.
The very mild presence of hemoglobin absorption band in m.m. is clearly shown in Fig. 2(a) where the apparent absorbance of difference spectra makes evident the lack of blood contribution in m.m. reflectance measurements. One possible expla- nation might be related to the different vascular structure that primary and metastatic m.m. present with respect to that of benign nevi. In fact, in pri- mary and metastatic m.m., blood vessels predomi- nantly surround a close-packed neoplastic prolifer- ation, whereas in nevi the vascular network is sometimes massive, often with telangiectases, and usually growing between small foci of nevus cells.
Since m.m. shows, on average, reflectance values lower than those of the other lesions one would expect that the melanin content of m.m. should be, on average, greater than that of the other lesions. Nevertheless Table 3 shows that the melanin index of rn.m. is not significantly different from that of the remaining pigmented lesions, except when met- astasis is concerned. As a consequence, an expla- nation of the different reflectance values cannot be carried out only on the basis of melanin content. It has been reported (Kollias and Baqer, 1987; Rosen et a/ . , 1990) that human melanin may exist in two distinct forms, at least, with different absorption properties in the visible range. One form shows an absorbance spectrum that decreases linearly by increasing the wavelength, whereas the other yields a spectrum that decreases exponentially with wave-

Reflectance spectrophotometry 83
length. Figure 2(b) shows that the average spectrum of apparent absorbance of nevi (middle curve) looks like the absorption spectrum of human melanin whereas m.m. (Fig. 2(a), middle curve) has a spec- trum with a much higher apparent absorbance and a different shape. These observations would indicate that: (1) melanin present in m.m. might have an absorbance spectrum different from melanin present in normal skin, and/or (2) backscattering from a dermal layer has been reduced, probably because it may have been altered to some extent.
Since the mechanisms of absorbance for melanin in the visible-near IR are not known beyond doubt , that leaves the possibility open that different mech- anisms of absorption and/or scattering may be active in lesions with different pigment distribution. Further investigation is needed to clarify this point. In m.m. melanin is present in relatively fine dust- like granules unevenly distributed within the tumor, whereas it is often homogeneously distributed in nevi particularly in the form of discrete refractive granules in the upper part of the dermis. Finally, microscopic observations show that the difference between nevi and m.m. is not only characterized by a different distribution and aggregation of melanin in the two lesions. but also by a different fine struc- ture of melanosomes that, in m.m., show a range
Figure 4. Light path within the conc by using the geometri- cal construction of successive images of the side of the cone. 11. half angle of the conical element (15.8"); r , radius of the circle approximating the polygon formed by the smaller end of the cone; R. radius of the circle approximat- ing the polygon formed by the larger end of the cone; 8;. angle of the refracted ray. with respect to the cone axis, propagating from the smaller to the larger end of the cone; e;,,,. angle of incidence at the n-th reflection of a ray propagating from the smaller to the larger end of the cone; q, angle of incidence at the larger end of the cone for a ray propagating from the smaller end; 0;. angle of the refracted ray. with respect to the cone axis, propagat- ing from the larger to the smaller end of the cone; e],,,,, angle of incidence at the m-th reflection for a ray propagat- ing from the larger to the smaller end of the cone; a], angle of incidence at the smaller end of the cone for a ray
propagating from the larger end.
PA) 53:l-6
of abnormalities (Takahashi er a/. , 1985). Interpretation of the reflectance spectra remains
difficult due to the complexity of the optical pro- cesses of scattering and absorption. and the few reported cases d o not permit stressing the validity of the hypotheses used to explain the observed dif- ferences between the different skin lesions. Never- theless, our results suggest that spectrophotometry may give clinically useful information and could be utilized as an aid in clinical diagnosis of cutaneous pigmented lesions, especially when malignant mela- noma is concerned. Further cases are being col- lected and a more detailed analysis of reflectance spectra will be reported in a subsequent communi- cation.
Ackrio~vledgement-This investigation was supported in part by PRESTCO.
REFERENCES
Dawson. J . B.. D. J . Barker. D. J . Ellis. E. Grassam, J . A. Cotteril. G W. Fisher and J . W. Feather (1080) A theoretical and experimental study of light absorption and scattering by in vivo skin. f h y s . Med. B i d . 25. 696-709.
Feather. J. W.. M. J . Ellis and G . Leslie (1988) A portable reflectometer for the rapid quantification of cutaneous haemoglobin and melanin. f h y s . Med. Biol. 33,
Feather, J . W.. M. Hajizadeh-Saffar. G. Leslie and J . B. Dawson ( 1989) A portable scanning spectrophotometer using visible wavelengths for the rapid measurement of skin pigments. fhys . Med. Bid . 34, 807-820.
Flock, S. T.. M. S. Patterson, B. C. Wilson and D. R. Wyman (1989) Monte Carlo modeling of light propa- gation in highly scattering tissues-I: model predictions and comparison with Diffusion Theory. IEEE Truns. Biomed. Eng. 36. 1162-1 167.
Goebel. D. G. (1967) Generalized integrating-sphere thc- ory. Appl. Opt. 6, 125-128.
Grum. F. and R. J. Becherer (1079) Oprical Radiarion Meusurernetit. Vol. I. Radiometry. pp. 292-293. Aca- demic Press. Orlando, FL.
Hertzman. C., S. D. Walter. L. From and A. Alison (1987) Observer perception of skin color in a study of malignant melanoma. Am. J. Epidemiol. 126. 901-91 I ,
Jacques. S. L.. C. A. Alter and S. A. Prahl(1987) Angular depcndence of He Ne laser light scattering by human dermis. Lasers Life Sci. 1. 3OY-333.
Kapany, N. S. (1967) Fiber Optics. Principles und Appli- cations. pp. 18-22. Academic Press, New York.
Kollias. N . and A. Baqer (1985) Spectroscopic character- istics of human melanin in vivo. J. Invest. Dermal. 85, 38-42.
Kollias. N. and A. Baqer (1986) On the asscssment of melanin in human skin in vivo. fhorochem. fhorobiol. 43. 49-57.
Kollias, N. and A. Baqer (1987) Absorption mechanisms of human melanin in the visible. 40(l-720 nm. J. Invest. Drrmur. 89. 384-388.
Rosen. C. F.. S. L. Jacques. M. E. Stuart and R. W. Gange (1900) Immediate pigment darkening: visual and reflectance spectrophotometric analysis of action spec- trum. fhorochem. fhorobiol. 51, 583-588.
Srivastava. A., L. E. Hughes, J. P. Woodcock and E. J . Shedden (1986) The significance of blood flow in cutaneous melanoma demonstrated by Doppler flow- metry. Eur. J. Surg. Oncol. 12. 13-18.
Takahashi. H., T. Horikoshi and K. Jimbow (1985) Fine
71 1-722.

84 RENATO MARCHESINI et al.
structural characterization of melanosomes in dysplastic nevi. Cancer 56, 111-123.
Wolbarsht, M. L., A. W. Walsh and G. George (1981) Melanin, a unique biological absorber. Appl. Opt. 20, 2184-2186.
APPENDIX
The geometrical optics related to the path of light within the cone can be easily understood by using the geometrical construction of the successive images of the side of the cone (Kapany, 1967). In this case, the incident ray inter- sects the polygon formed by successive reflections at the cone wall, and, due to the metallic reflective coating, neither refractions nor total internal reflections did occur. With reference to Fig. 4, it can be shown that the angle of incidence e,, at the n-th reflection of a ray propagating from the smaller to the larger end of the cone is given by the following expression:
e;," = 90" - 8: + (2n-1) (1) where 0; is the angle of the refracted ray with respect to the cone axis, and R is the half angle of the conical element. By approximating the polygons formed by the smaller and larger end by two circles with radius r and R, respectively, ray propagation can be described by evaluat- ing the position of the intersection between ray-path and those radii. It is easy to show that total reflection at the greater end of the cone will never occur. In fact, the angle of incidence at the larger end is given by:
sin = R sin (180"-&) (2)
and, to avoid total reflection occurring at the interface, it follows that sin 0; < 1/n2, where n, is the refractive index of the cone material (1.49). Then,
R 1 sin 0; < - - r n,'
and this inequality always holds, with the term on the right hand side equal to 1.34 in our conditions. It may be of interest to establish how many reflections the incoming ray undergoes before exiting from the larger end. After the N-reflection, the ray could be incident on the exit face and, in this case, at an angle given by:
0: = 90" - e;.N - s
with 0 s e s 2R, depending on the cone length. Thus, two inequalities must simultaneously hold. By substituting Eq. (3) in Eq. (1) one obtains:
e = Of - (2N-1) R - @ 3 0, and
(3)
e = 8:- (2N-1) - 0:s 2R. That is,
@; s 8: - (2N-1) R,and 9; 3 8: - (2N+1) R.
Thus, from Eq. (2) it follows that:
sin [& - (2N-1) R] 2 f sin OF, and
Finally, N must be an integer such that:
N s (8: + R - sin-' p)/2n
N P (e: - R - sin-' p)/2n
where p = - sin 8",. The worst condition
and
r R
& = 90". In this case, N = 4. Nevertheless, when the cone is positioned in contact with the skin, 8: will be less than 90". By considering a refractive index for skin close to 1.4 (Jacques er al.. 1987), a ray at grazing incidence will be refracted at an angle 8: of 70", and Eqs. (4a) and (4b) are satisfied for N = 3.
The geometrical optics related to the reverse path of light, i.e. propagating from the larger to the smaller end, can be evaluated on a similar basis. With reference to Fig. 4, it can be shown that:
el., = 90" - O! - (2m-1) R (5) The arguments have the same meaning as previously defined, with the superscript I referring to the ray propa- gating from the larger to the smaller end. After the M- reflection, the ray could be incident on the smaller end at an angle @! given by:
(6) @! = 900 - 81 r.M + c
Thus,
O: s @I - (2M-1) R and el 3 - ( 2 ~ + 1 ) R
Since @! can reach the critical value that determines total reflection at the smaller end, Eqs. ( 5 ) and (6) can be resolved with M as a function of @! rather than 8;. In this case, M must be an integer such that:
M s (@!+R- sin-%)12R. and M 3 (a!- sin-'6)/2R,
r . with 6 = - R sin 0:. For @! = sin-'(l/n2) = 42.15". M must be equal to 2, and 7" O S 21".
The smallest refractive angle O! must be such that:
sin (e:+n) = sin - l r - R n2 R '
and, in our case, O! s 12", which corresponds to an angle of incidence of 17" at the air-cone interface. The light beam exiting from the fiber bundle is partially collimated by a lens before entering the integrating sphere and has a divergence of about 7". Thus, no ray will undergo total reflection. Loss of light intensity in passing right through the cone
can be evaluated only on a rough basis. Reflectivity of the smaller end for light scattered by tissue produces, by using the Fresnel formulae, values less than 0.05 for incident angles less than 75". Then, light entering the cone at angles between 0" and R will never be reflected by the cone wall, whereas at angles between R and 65" up to three reflections will occur. In addition, reflectivity at the larger end is about 0.05 for rays incident at angles between 0" and 30" [i.e. the maximum evaluated by Eqs. (1) and (3)]. Because the metallic coating has reflectivity of 0.92, the intensity of transmitted light will be within 0.9 and 0.7 of that entering the cone, neglecting the fraction of light that enters at angles of incidence greater than 75".