in vitros-space.snu.ac.kr/bitstream/10371/82035/1/initial in vitro_.pdf · growth curve was...
TRANSCRIPT

1
[Title page]
Initial In vitro bacterial adhesion on dental restorative materials
Ha-Young Kim*1, DDS, MSD, Graduate Student
In-Sung Yeo*1, DDS, MSD, PhD, Assistant Professor
Jai-Bong Lee*, DDS, MSD, PhD, Professor
Sung-Hun Kim*, DDS, MSD, PhD, Associate Professor
Dae-Joon Kim†, Professor
Jung-Suk Han*, DDS, MS, PhD, Professor
* Department of Prosthodontics, School of Dentistry and Dental Re-
search Institute, Seoul National University, Seoul, Korea
† Department of Advanced Materials Engineering, Sejong University,
Seoul, Korea
1 These authors contributed equally to this work.
Correspondence to:
Jung-Suk Han, DDS, MS, PhD
Professor
Department of Prosthodontics
2
School of Dentistry and Dental Research Institute
Seoul National University
28, Yongon-dong, Jongno-gu
Seoul, 110-749, Korea
Tel: +82-2-2072-2661
Fax: +82-2-2072-3860
E-mail: [email protected]
Running title: Bacterial adhesion on dental materials
Key words: Zirconia, alumina-toughened zirconia, gold, titanium, bacteri-
al adhesion, surface roughness
3
Abstract
Objectives. The purpose of this study was to evaluate initial bacterial
adhesion on several restorative materials with similar roughness.
Materials and methods. Sixty cylindrical slabs were prepared from four
restorative materials: zirconia (Zr), alumina-toughened zirconia (Al-Zr),
type III gold alloy (Au), and cp-titanium (Ti). All the materials were pol-
ished until mirror-like shine was achieved. The average surface rough-
ness and topography were determined by atomic force microscopy. Con-
tact angles were measured to calculate surface free energy by the ses-
sile drop technique. After the formation of a salivary pellicle, S. sanguinis,
S. gordonii, and S. oralis were inoculated onto the specimens and incu-
bated for 4 h. Quantification of the adherent bacteria was performed by
crystal violet staining technique and resazurin reduction assay. One-way
ANOVA and Tukey’s post hoc test were adopted for statistical analysis.
The level of significance was 0.05.
Results. The Ra values determined with atomic force microscopy for all
specimens were lower than 5 nm. Surface free energy increased in the
order of Al-Zr, Zr, Ti, and Au. Differences were significant between the
investigated materials in both crystal violet absorbance and fluorescence

4
intensities. Gold alloy showed the highest values for all bacterial strains
(P < 0.05).
Conclusions. Zirconia and titanium may be more suitable than gold al-
loy as an abutment material with respect to the initial bacterial adhesion
and subsequent advance of periimplantitis.

5
Introduction
The use of endosseous dental implants has become a reliable treat-
ment option for restoring edentulous jaws (1). For long term success of
implant-supported restoration, the prevention of marginal bone loss
around the inserted implant is required. Aespecially, plaque manage-
ment on the surface of implants has become an important issue since
plaque accumulation on implant surfaces may cause inflammatory reac-
tions leading to peri-implant bone loss (2, 3).
Biofilm formation on the implant surface is similar to that of teeth (4).
Once the substratum is exposed to the saliva, acellular proteinaceous
film called the salivary pellicle is formed. Bacteria do not adhere to the
surfaces directly, but always adhere to the pellicle. Among over several
hundred species, the Streptococci are the dominant pioneer species (5).
These early colonizers prepare a favorable condition for the following
colonizers and provide a binding site preferred by the putative periodon-
tal pathogens (Fusobacterium, Porphyromonas species) (6). Reducing
the number of initially adhering bacteria is an important characteristic of
the implant surface. Various factors affect bacterial adhesion, such as
surface free energy (SFE), hydrophilicity, surface chemistry, surface
charge, roughness, and the presence of proteins (7). Many studies were

6
carried out on bacterial adhesion on biomaterials with various rough-
nesses and physicochemical properties. Based on the results of these
studies, it was determined that biofilm formation is facilitated by in-
creased surface roughness and SFE (8).
Titanium, zirconia, and gold can be considered as materials of choice
for transgingival abutment. Among them, the application of zirconia as
an abutment material has increased due to the recent trend of metal-free
dentistry. Even though the increased cost of gold alloy has resulted in
the use of cheaper materials, UCLA gold abutment has maintained its
position in the market due to its abilities to resolve several compromising
issues (9). Accrued studies so far have focused on the adherence of oral
bacteria on the surface of titanium or zirconia (10, 11). Several modified
versions of these studies have attempted to perform similar experiments
on surface-modified titanium (12, 13). When it comes to gold alloy, how-
ever, there is no plausible data involving the relative adherence of oral
bacteria on gold, titanium, and zirconia under controlled surface condi-
tions.
The objective of this study was to investigate the adhesion of three ini-
tial colonizers, S. sanguinis, S. oralis, and S. gordonii, to titanium, gold,
and two kinds of dental ceramic restoratives with similar surface rough-
ness values in the presence of an acquired pellicle. The null hypothesis

7
underlining this study was that there were no differences among the in-
vestigated transgingival abutment materials in the adhesion of the initial
colonizers.
Materials and methods
1. Specimens
Sixty cylindrical slabs (each with diameter of 5 mm, height of 1.1 mm,
surface area of 19.63 mm2) were prepared from zirconia (Zr), alumina
toughened zirconia (Al-Zr), type III gold alloy (Au), and titanium (Ti). The
surfaces were mechanically polished by wet grinding with abrasive paper
(400-4000 grit successively, Buehler) followed by a felt disc in conjunc-
tion with 1 ㎛ diamond slurry spray. Through this method, one side of the
specimens was polished to a mirror-like shine. After polishing, each
specimen was cleaned with acetone, 70% (v/v) ethanol, and then finally
rinsed with sterile distilled water and dried.
2. Determination of surface roughness and surface free energy
Several surface roughness parameters (Ra, Rq, Rz, Rpv) and topography
were determined at three specimens of each material using atomic force

8
microscopy (XE-100, Park Systems, Korea) in a contact mode of 5 5
㎛ 2. For the characterization of surface energy, the sessile drop method
was used. Contact angles were carried out using a video contact angle
analyzer (General type Phoenix 150, SEO, Korea). Three samples of
each group were used to determine the contact angle of deionized water
and formaldehyde. One drop of probe liquid was deposited on the sur-
face of the specimen. Contact angle (degree) was calculated with the
software provided with the equipment. The total SFE was calculated us-
ing the Owens-Wendt method (14).
3. Saliva preparation
Unstimulated human whole saliva was collected and frozen immediately
after collection. The samples were defrosted and sterilized immediately
before the experiments using single-use syringe filters (0.45 and 0.22㎛,
successively).
4. Bacteria preparation
The strains of S. oralis, S. gordonii, and S. sanguinis were grown in
sterile trypticase soy yeast extract medium [30 g tryptic soy broth (BD
diagnostics 211825) + 3 g yeast extract (sigma Y1625)] (Table 1). By

9
continuously controlling the optical density of the cell suspensions, a
growth curve was obtained, and cells in the exponential phase were
used for the experiments.
The optical density of bacterial suspension was adjusted to 0.004 at 550
nm (ND-1000, Thermo Scientific, Massachusetts, USA), which corre-
sponds to a microbial concentration of 4.9 X 10⁶ cells/ml.
5. Crystal violet staining
Thirty specimens were prepared for each material, using 10 specimens
per strain. The specimens were incubated with sterilized saliva for the
formation of an acquired salivary pellicle. After an incubation time of 2 hr
at 37℃, the specimens were carefully rinsed with PBS and incubated
with 1 ml of bacterial suspension at 37℃. After incubation for 4 hr, the
specimens were gently rinsed twice with PBS to remove non-adhered
bacteria, and the adhered bacteria were stained with 0.3% crystal violet
(CV) solution for 10 minutes. The specimens were then gently washed
twice with PBS, and 400 ㎕ destaining solution (80% EtOH + 20% ace-
tone) was applied. After 10 minutes, 200 ㎕ solution of each well was
transferred to a 96-well microplate, and the absorbance of CV was
10
measured using an ELISA Reader (Bio-Rad model 550, California, USA)
at 550 nm.
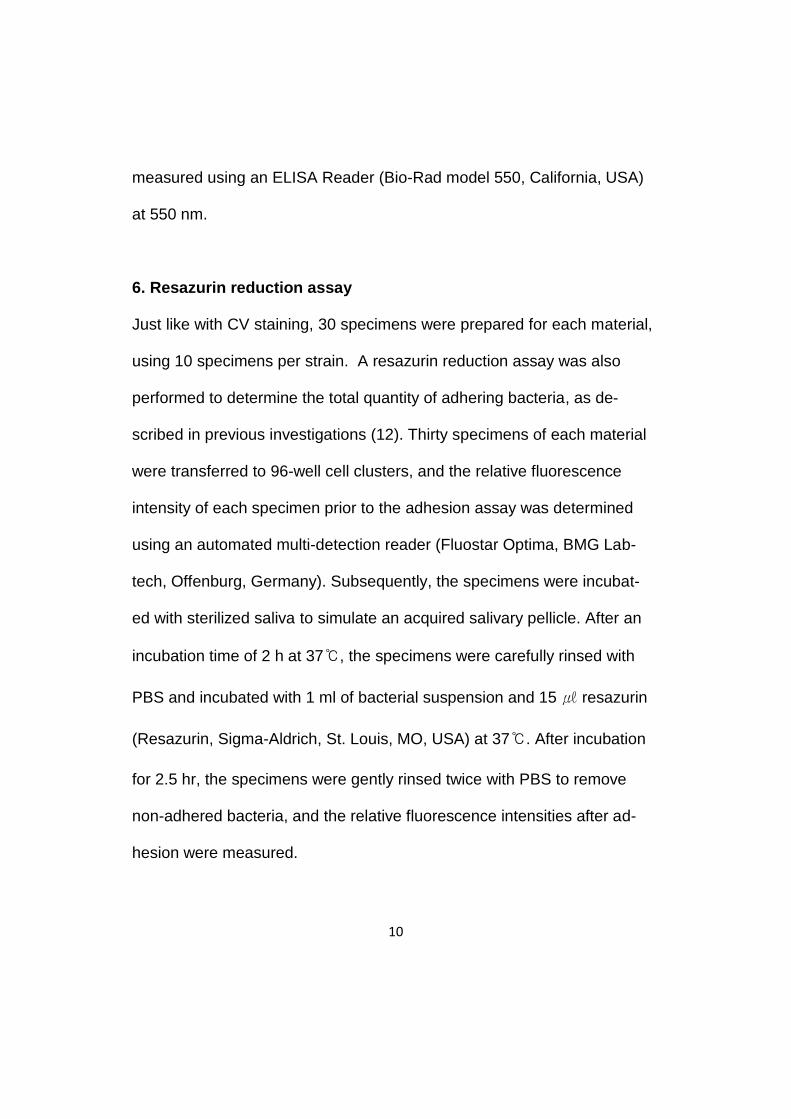
6. Resazurin reduction assay
Just like with CV staining, 30 specimens were prepared for each material,
using 10 specimens per strain. A resazurin reduction assay was also
performed to determine the total quantity of adhering bacteria, as de-
scribed in previous investigations (12). Thirty specimens of each material
were transferred to 96-well cell clusters, and the relative fluorescence
intensity of each specimen prior to the adhesion assay was determined
using an automated multi-detection reader (Fluostar Optima, BMG Lab-
tech, Offenburg, Germany). Subsequently, the specimens were incubat-
ed with sterilized saliva to simulate an acquired salivary pellicle. After an
incubation time of 2 h at 37℃, the specimens were carefully rinsed with
PBS and incubated with 1 ml of bacterial suspension and 15 ㎕ resazurin
(Resazurin, Sigma-Aldrich, St. Louis, MO, USA) at 37℃. After incubation
for 2.5 hr, the specimens were gently rinsed twice with PBS to remove
non-adhered bacteria, and the relative fluorescence intensities after ad-
hesion were measured.

11
7. Preparing for scanning electron microscopy
To observe the morphology of bacterial adhesion, the specimens were
prepared for scanning electron microscopy. The specimens were fixed in
2% glutaraldehyde for 24 hr at room temperature, washed three times
with phosphate buffer solution (pH 7.4), and dehydrated through a series
of graded ethanol solutions (20%, 40%, 60%, 80%, and 100%). The
samples were subsequently vacuum dried, sputter-coated with Au, and
observed using a field emission scanning electron microscope (S-4700,
HITACHI, Tokyo, Japan) with an accelerating voltage of 15 kV.
8. Statistics
Statistical analysis was carried out with PASW Statistics Ver. 18 (SPSS
Inc., Chicago, IL, USA). One-way ANOVA was adopted followed by the
Tukey’s post hoc test. The probability of type I error less than or equal to
0.05 was considered statistically significant.
Results
1. Surface roughness

12
The average surface roughness of each material is summarized in Table
2. All specimens yielded a Ra lower than 5 nm. Figure 1 shows the to-
pography of each polished surface.
2. Contact angle and surface free energy
The results of the sessile drop measurements on the test materials are
shown in Table 3. The total SFE values (γs) were 37.88, 33.89, 59.92,
and 47.67 mJ/m2 for Zr, Al-Zr, Au, and Ti, respectively.
3. Crystal violet assay
One-way ANOVA revealed significant differences in CV absorbance
among the investigated materials (Fig. 2). The post hoc analysis showed
that, for all bacterial strains, gold alloy revealed significantly higher val-
ues than the other materials (P < 0.001). Titanium demonstrated a high-
er value than Zr and Al-Zr for S. gordonii. In most specimens, there was
no difference in adhesion according to the bacterial strain except for Zr,
in which specimen S. sanguinis exhibited significantly lower values than
S. oralis.
4. Resazurin reduction assay

13
Significant differences were found in fluorescence intensities among the
investigated materials (Fig. 3). The intensities of gold alloy were found to
be the highest for all bacterial strains (P < 0.001), and these results are
similar to those of CV absorbance.
5. Scanning electron microscopy
Adhesion on the test substrates was confirmed through scanning elec-
tron micrographs of the initial biofilm. Three bacterial strains exhibited
similar adhesion patterns and S. oralis on 4 materials are represented in
Fig. 4. A monolayer of characteristic streptococcal chains evenly ad-
hered to the substrate.
Discussion
On the base of this study, gold may be carefully used as an abutment
material because of the easiness of adhesion on its polished surface.
The bacterial adhesion is important in the selection of the material used
in the transgingival portion, along with other physical properties. Gold
alloy exhibited the highest bacterial adhesion under similar roughness
while this study showed no significant difference between titanium and
zirconia. The results of titanium and zirconia resemble those in previous
14
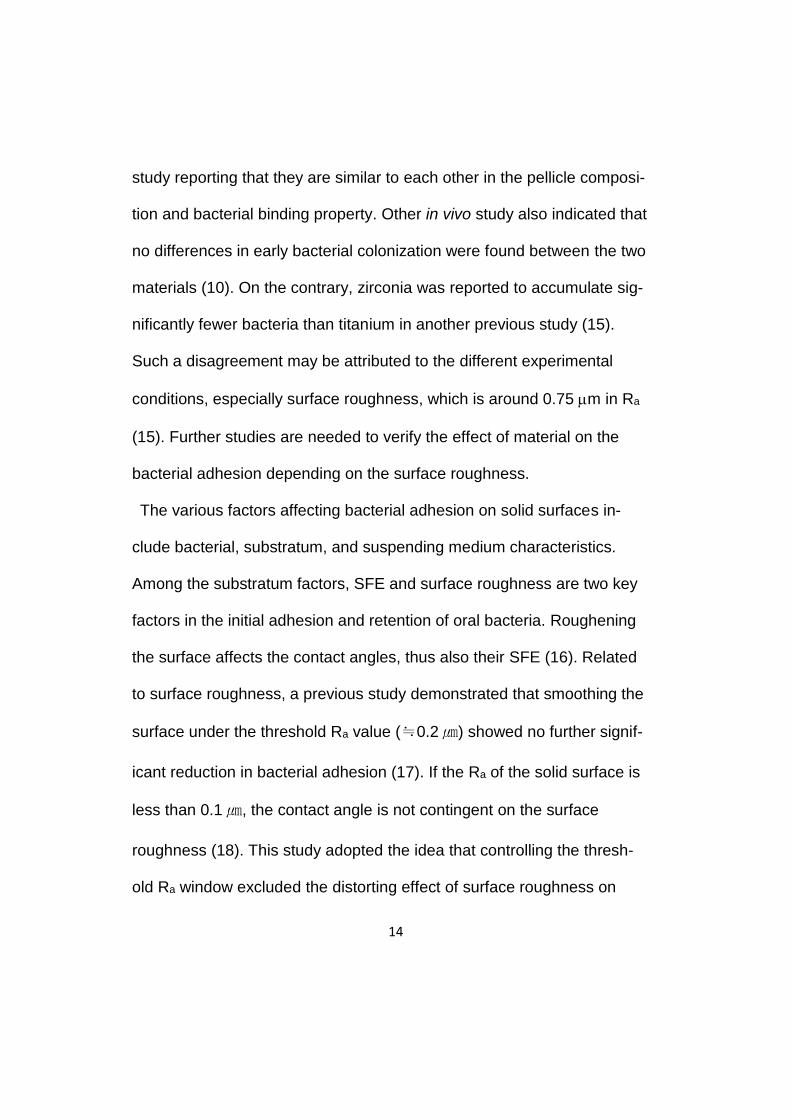
study reporting that they are similar to each other in the pellicle composi-
tion and bacterial binding property. Other in vivo study also indicated that
no differences in early bacterial colonization were found between the two
materials (10). On the contrary, zirconia was reported to accumulate sig-
nificantly fewer bacteria than titanium in another previous study (15).
Such a disagreement may be attributed to the different experimental
conditions, especially surface roughness, which is around 0.75 m in Ra
(15). Further studies are needed to verify the effect of material on the
bacterial adhesion depending on the surface roughness.
The various factors affecting bacterial adhesion on solid surfaces in-
clude bacterial, substratum, and suspending medium characteristics.
Among the substratum factors, SFE and surface roughness are two key
factors in the initial adhesion and retention of oral bacteria. Roughening
the surface affects the contact angles, thus also their SFE (16). Related
to surface roughness, a previous study demonstrated that smoothing the
surface under the threshold Ra value (≒0.2㎛) showed no further signif-
icant reduction in bacterial adhesion (17). If the Ra of the solid surface is
less than 0.1㎛, the contact angle is not contingent on the surface
roughness (18). This study adopted the idea that controlling the thresh-
old Ra window excluded the distorting effect of surface roughness on

15
bacterial adhesion and contact angle and, in doing so, focused on the
physicochemical properties of the material itself as a factor influencing
bacterial adhesion.
In the oral environment, the process of biofilm formation on solid sur-
faces involves several progressive stages. The initial stage is the for-
mation of a conditional film, coalesced entity of salivary proteins and cell-
free enzymes (19). Further adhesion of successive microbes follows bio-
film maturation. Therefore, to mimic the intraoral environment, the spec-
imen surfaces of the present study were inoculated with sterile saliva for
2 hr to obtain a coating on the salivary pellicle. Previous studies demon-
strate that pellicle coating does not completely nullify the inherent chemi-
cal characteristics of the surface even though it exhibits some homoge-
nizing effects on the SFE (20). This was also the case in this study, and
the aspects of initial bacterial adhesion varied according to the substrate
even under controlled surface roughness and with the same saliva coat-
ing.
The initial bacterial adhesion is governed by physicochemical interac-
tions (21). In the results of this study, gold specimens, which showed the
highest polar surface energy and the lowest nonpolar surface energy,
displayed the strongest bacterial adhesion. These findings contrast to
the results of Sardin et al. which reported that bacterial adherence is re-
16
lated to the nonpolar component of the SFE of the substrate (22). Such
contrast may be due to the large difference in total surface energy.
Quantification of biofilm formation can be carried out with various
techniques such as the determination of the colony-forming unit, high
resolution microscopic techniques, and staining techniques. From these
techniques, staining assays using CV and the subsequent measurement
of the absorbance is primarily used for monitoring biofilm in vitro (23). In
a recent study, a resazurin assay and a similar assay using fluorescein
diacetate were the best alternatives for microbial biofilm quantification
(24). The two experimental methods quantifying attached bacteria de-
rived a similar tendency in the result. Both of the techniques, staining
and fluorometric, can be considered reproducible in the quantification of
biofilm formation on several restorative materials. The results obtained
through the staining technique showed a statistically significant differ-
ence between zirconia and titanium in experiments with S. sanguinis and
S. gordonii. On the contrary, such differences were not detectable in the
results obtained by the resazurin assay. This leaves the need for further
investigation on whether the different result sets were driven by the in-
consistency between total bacterial amount and metabolically active cell
amount.
17
Despite the study’s effort to mimic the conditions of the oral environ-
ment, bacterial adherence in vitro may differ in some ways from in vivo
adherence. Even when surface roughness was set so low that it re-
mained similar in each case, the amount of attached bacteria varied ac-
cording to the materials in the in vitro study. To elucidate the relationship
between oral bacteria and restorative materials, further in vitro studies
are needed with a larger number of bacterial species, in addition to an
expansive in vivo study.
In conclusion, different materials with extremely low surface roughness
exhibit different amounts of bacterial adhesion. Zirconia and titanium
may be more suitable than gold alloy as an abutment material, consider-
ing that they decrease the initial bacterial attachment on their surfaces,
which clinically means that they lower the possibility of periimplantitis.
18
References
1. Lekholm U, Gröndahl K, Jemt T. Outcome of Oral Implant
Treatment in Partially Edentulous Jaws Followed 20 Years in
Clinical Function. Clinical Implant Dentistry and Related Research.
2006;8(4):178-186. doi: 10.1111/j.1708-8208.2006.00019.x.
2. Quirynen M, De Soete M, van Steenberghe D. Infectious risks for
oral implants: a review of the literature. Clin Oral Implants Res.
2002;13(1):1-19.
3. Grossner-Schreiber B, Teichmann J, Hannig M, Dorfer C,
Wenderoth DF, Ott SJ. Modified implant surfaces show different
biofilm compositions under in vivo conditions. Clin Oral Implants
Res. 2009;20(8):817-826. doi: 10.1111/j.1600-0501.2009.01729.x.
4. Tanner A, Maiden MF, Lee K, Shulman LB, Weber HP. Dental
implant infections. Clin Infect Dis. 1997;25 Suppl 2:S213-217.
5. Nakazato G, Tsuchiya H, Sato M, Yamauchi M. In vivo plaque
formation on implant materials. Int J Oral Maxillofac Implants.
1989;4(4):321-326.
6. Mombelli A, Lang NP. Microbial aspects of implant dentistry.
Periodontol 2000. 1994;4:74-80.
7. Teughels W, Van Assche N, Sliepen I, Quirynen M. Effect of
material characteristics and/or surface topography on biofilm

19
development. Clin Oral Implants Res. 2006;17 Suppl 2:68-81. doi:
10.1111/j.1600-0501.2006.01353.x.
8. Subramani K, Jung RE, Molenberg A, Hammerle CH. Biofilm on
dental implants: a review of the literature. Int J Oral Maxillofac
Implants. 2009;24(4):616-626.
9. Lewis SG, Llamas D, Avera S. The UCLA abutment: A four-year
review. The Journal of Prosthetic Dentistry. 1992;67(4):509-515.
doi: 10.1016/0022-3913(92)90082-l.
10. Salihoglu U, Boynuegri D, Engin D, Duman AN, Gokalp P, Balos
K. Bacterial adhesion and colonization differences between
zirconium oxide and titanium alloys: an in vivo human study. Int J
Oral Maxillofac Implants. 2011;26(1):101-107.
11. van Brakel R, Cune MS, van Winkelhoff AJ, de Putter C,
Verhoeven JW, van der Reijden W. Early bacterial colonization
and soft tissue health around zirconia and titanium abutments: an
in vivo study in man. Clin Oral Implants Res. 2011;22(6):571-577.
doi: 10.1111/j.1600-0501.2010.02005.x.
12. Bürgers R, Gerlach T, Hahnel S, Schwarz F, Handel G, Gosau M.
In vivo and in vitro biofilm formation on two different titanium
implant surfaces. Clinical Oral Implants Research.
2010;21(2):156-164. doi: 10.1111/j.1600-0501.2009.01815.x.

20
13. Almaguer-Flores A, Olivares-Navarrete R, Wieland M, Ximenez-
Fyvie LA, Schwartz Z, Boyan BD. Influence of topography and
hydrophilicity on initial oral biofilm formation on microstructured
titanium surfaces in vitro. Clin Oral Implants Res. 2011. doi:
10.1111/j.1600-0501.2011.02184.x.
14. Owens DK, Wendt RC. Estimation of Surface Free Energy of
Polymers. Journal of Applied Polymer Science. 1969;13(8):1741-
1747. doi: 10.1002/app.1969.070130815.
15. Scarano A, Piattelli M, Caputi S, Favero GA, Piattelli A. Bacterial
adhesion on commercially pure titanium and zirconium oxide
disks: an in vivo human study. J Periodontol. 2004;75(2):292-296.
doi: 10.1902/jop.2004.75.2.292.
16. Quirynen M, Bollen CM. The influence of surface roughness and
surface-free energy on supra- and subgingival plaque formation in
man. A review of the literature. J Clin Periodontol. 1995;22(1):1-
14.
17. Bollen CM, Papaioanno W, Van Eldere J, Schepers E, Quirynen
M, van Steenberghe D. The influence of abutment surface
roughness on plaque accumulation and peri-implant mucositis.
Clin Oral Implants Res. 1996;7(3):201-211.

21
18. Busscher HJ, van Pelt AWJ, de Boer P, de Jong HP, Arends J.
The effect of surface roughening of polymers on measured
contact angles of liquids. Colloids and Surfaces. 1984;9(4):319-
331. doi: 10.1016/0166-6622(84)80175-4.
19. Hannig C, Hannig M. The oral cavity--a key system to understand
substratum-dependent bioadhesion on solid surfaces in man. Clin
Oral Investig. 2009;13(2):123-139. doi: 10.1007/s00784-008-
0243-3.
20. Muller R, Groger G, Hiller KA, Schmalz G, Ruhl S. Fluorescence-
based bacterial overlay method for simultaneous in situ
quantification of surface-attached bacteria. Appl Environ Microbiol.
2007;73(8):2653-2660. doi: 10.1128/AEM.02884-06.
21. Pereni CI, Zhao Q, Liu Y, Abel E. Surface free energy effect on
bacterial retention. Colloids and Surfaces B: Biointerfaces.
2006;48(2):143-147. doi: 10.1016/j.colsurfb.2006.02.004.
22. Sardin S, Morrier JJ, Benay G, Barsotti O. In vitro streptococcal
adherence on prosthetic and implant materials. Interactions with
physicochemical surface properties. J Oral Rehabil.
2004;31(2):140-148.

22
23. Hannig C, Follo M, Hellwig E, Al-Ahmad A. Visualization of
adherent micro-organisms using different techniques. J Med
Microbiol. 2010;59(Pt 1):1-7. doi: 10.1099/jmm.0.015420-0.
24. Peeters E, Nelis HJ, Coenye T. Evaluation of the efficacy of
disinfection procedures against Burkholderia cenocepacia biofilms.
J Hosp Infect. 2008;70(4):361-368. doi:
10.1016/j.jhin.2008.08.015.

23
Figures
Fig. 1. Atomic force microscopic (AFM) images with average roughness
values (Ra) of the four different implant materials: Zr (A), Zr-Al (B), Au
(C), and Ti (D). Surface topography in nano-scale showed high frequen-
cy fine irregularities.

24
Fig. 2. Crystal violet absorbance for streptococcal adhesion. Zr, 3y-TZP;
Al-Zr, alumina-toughened zirconia; Au, gold alloy; Ti, titanium. Asterisk
indicates values that are significantly different ( p <.001)
Fig. 3. Relative fluorescence intensities. Abbreviations are as in Fig. 2.
Asterisk indicates values that are significantly different ( p <.001)

25
Fig. 4. Scanning electron microscopy of bacterial adhesion on the sur-
face of Zr (A), Zr-Al (B), Au (C), and Ti (D). Adhered S. oralis exhibited a
streptococcal chain. Scale bar represents 20㎛.

26
Tables
Table 1. Three early-colonizing streptococcal strains
Species Strain
Streptococcus oralis ATCC 9811
Streptococcus gordonii ATCC 10558
Streptococcus sanguinis NCTC 10904

27
Table 2. Mean values of parameters for surface roughness.
Material Ra(nm) Rq(nm) Rz(nm) Rpv(nm)
Zr 3.355 4.317 38.056 39.845
Al-Zr 2.460 3.190 28.638 30.206
Au 2.885 3.859 44.635 48.418
Ti 1.844 2.810 30.339 31.610

28
Table 3. Mean values and standard deviations of the contact angle
measurements, Lifshitz van der Waals (γs LW), polar (γs AB) surface ener-
gy components, and total surface energies (γs) of each substrate
(mJ/m2), calculated according to the Owens-Wendt method.
Material Zirconia Al-Zr Gold Titanium
Contact angle
Water 73.90(0.25) 73.32(0.71) 57.14(0.64) 65.53(1.15)
Formaldehyde 56.39(0.97) 44.94(2.02) 37.76(0.66) 45.81(1.56)
Energy (mJ/m2)
γs 37.88(0.87) 33.89(0.54) 59.92(1.08) 47.67(1.46)
γs LW 0.35(0.11) 1.92(0.22) 0.04(0.01) 0.24(0.05)
γs AB 37.53(0.98) 31.97(0.57) 59.88(1.09) 47.43(1.49)