in vitro cell migration quantification method for scratch ... publications/450.pdf ·...
TRANSCRIPT

royalsocietypublishing.org/journal/rsif
Research
Cite this article: Bobadilla AVP, Arevalo J,
Sarro E, Byrne HM, Maini PK, Carraro T, Balocco
S, Meseguer A, Alarcon T. 2019 In vitro cell
migration quantification method for scratch
assays. J. R. Soc. Interface 16: 20180709.
http://dx.doi.org/10.1098/rsif.2018.0709
Received: 21 September 2018
Accepted: 21 January 2019
Subject Category:Life Sciences – Mathematics interface
Subject Areas:biomathematics, bioinformatics, computational
biology
Keywords:scratch assays, migration quantification
methods, migration rates
Author for correspondence:Ana Victoria Ponce Bobadilla
e-mail: [email protected]
Electronic supplementary material is available
online at https://dx.doi.org/10.6084/m9.
figshare.c.4381946.
& 2019 The Author(s) Published by the Royal Society. All rights reserved.
In vitro cell migration quantificationmethod for scratch assays
Ana Victoria Ponce Bobadilla1,2, Jazmine Arevalo3, Eduard Sarro3,Helen M. Byrne4, Philip K. Maini4, Thomas Carraro1,2, Simone Balocco5,6,Anna Meseguer3,7,8 and Tomas Alarcon9,10,11,12
1Institute for Applied Mathematics, Heidelberg University, 69120 Heidelberg, Germany2Interdisciplinary Center for Scientific Computing (IWR), Heidelberg University, 69120 Heidelberg, Germany3Renal Physiopathology Group, CIBBIM-Nanomedicine, Vall d’Hebron Research Institute, Barcelona, Spain4Wolfson Centre for Mathematical Biology, Mathematical Institute, University of Oxford, Oxford OX2 6GG, UK5Department of Mathematics and Informatics, University of Barcelona, Gran Via 585, 08007 Barcelona, Spain6Computer Vision Center, 08193 Bellaterra, Spain7Departament de Bioquımica i Biologia Molecular, Unitat de Bioquımica de Medicina, Universitat Autonoma deBarcelona, Bellaterra, Spain8Red de Investigacion Renal (REDINREN), Instituto Carlos III-FEDER, Madrid, Spain9ICREA, Pg. Lluıs Companys 23, 08010 Barcelona, Spain10Centre de Recerca Matematica, Edifici C, Campus de Bellaterra, 08193 Bellaterra (Barcelona), Spain11Departament de Matematiques, Universitat Autonoma de Barcelona, 08193 Bellaterra (Barcelona), Spain12Barcelona Graduate School of Mathematics (BGSMath), Barcelona, Spain
AVPB, 0000-0002-0959-4058; JA, 0000-0002-8824-424X; ES, 0000-0001-7723-2916;HMB, 0000-0003-1771-5910; PKM, 0000-0002-0146-9164; TC, 0000-0002-0503-4555;SB, 0000-0002-7149-7806; TA, 0000-0002-8566-3676
The scratch assay is an in vitro technique used to assess the contribution of
molecular and cellular mechanisms to cell migration. The assay can also be
used to evaluate therapeutic compounds before clinical use. Current quanti-
fication methods of scratch assays deal poorly with irregular cell-free areas
and crooked leading edges which are features typically present in the exper-
imental data. We introduce a new migration quantification method, called
‘monolayer edge velocimetry’, that permits analysis of low-quality exper-
imental data and better statistical classification of migration rates than
standard quantification methods. The new method relies on quantifying the
horizontal component of the cell monolayer velocity across the leading
edge. By performing a classification test on in silico data, we show that the
method exhibits significantly lower statistical errors than standard methods.
When applied to in vitro data, our method outperforms standard methods
by detecting differences in the migration rates between different cell groups
that the other methods could not detect. Application of this new method
will enable quantification of migration rates from in vitro scratch assay data
that cannot be analysed using existing methods.
1. BackgroundCell migration plays a fundamental role in developing and maintaining the
organization of multicellular organisms, while aberrant cell migration is found
in many pathological disorders like cancer and atherosclerosis [1,2]. Cell
migration involves the movement of individual cells, cell sheets or cell clusters
from one location to another [3]. Two main types of migration can be distin-
guished: single cell migration and collective cell migration. During collective
cell migration multiple cells perform a coordinated movement regulated by
cell–cell adhesion, collective cell polarization, coordination of cytoskeletal
activity and chemical and mechanical cues [1]. In vitro assays are central to the
study of cell migration since they allow us to quantify cell migratory capacity
under controlled experimental conditions [3,4]. The scratch or wound healing
assay is the method of choice for studying cell migration due to the low cost
S6
S5
S4
S3
S2
S1
0 h
100 µm
4 h 8 h 12 h
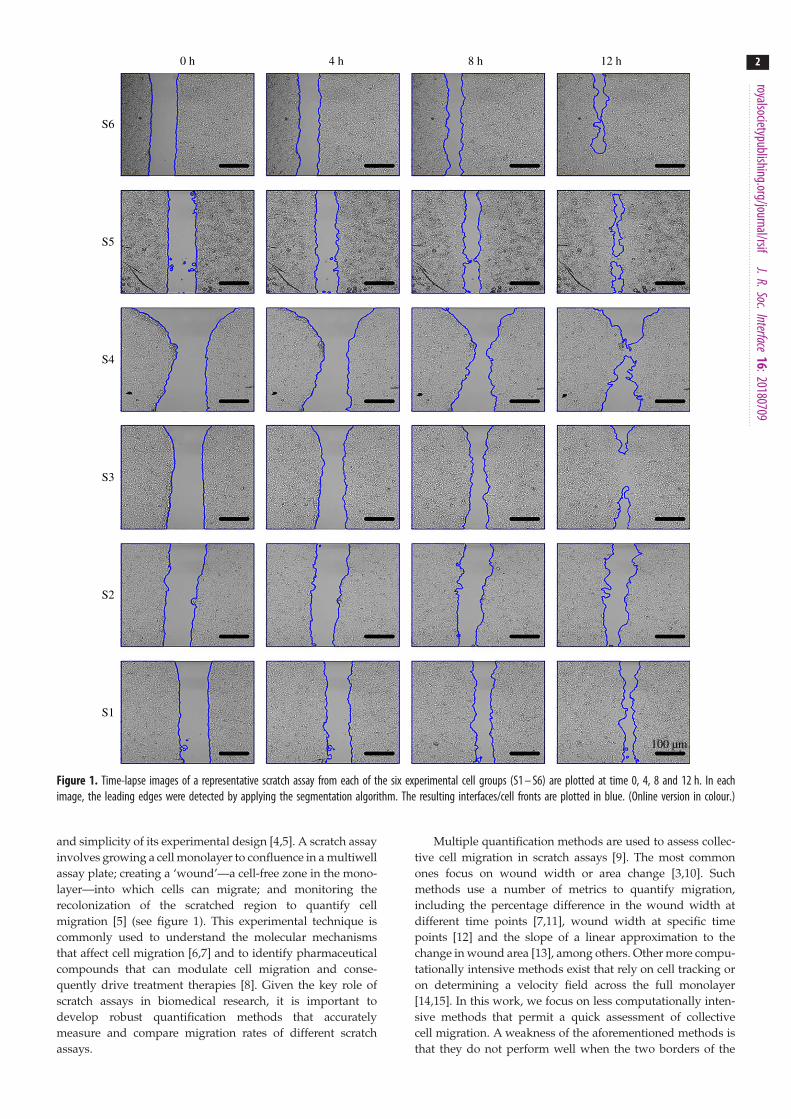
Figure 1. Time-lapse images of a representative scratch assay from each of the six experimental cell groups (S1 – S6) are plotted at time 0, 4, 8 and 12 h. In eachimage, the leading edges were detected by applying the segmentation algorithm. The resulting interfaces/cell fronts are plotted in blue. (Online version in colour.)
royalsocietypublishing.org/journal/rsifJ.R.Soc.Interface
16:20180709
2
and simplicity of its experimental design [4,5]. A scratch assay
involves growing a cell monolayer to confluence in a multiwell
assay plate; creating a ‘wound’—a cell-free zone in the mono-
layer—into which cells can migrate; and monitoring the
recolonization of the scratched region to quantify cell
migration [5] (see figure 1). This experimental technique is
commonly used to understand the molecular mechanisms
that affect cell migration [6,7] and to identify pharmaceutical
compounds that can modulate cell migration and conse-
quently drive treatment therapies [8]. Given the key role of
scratch assays in biomedical research, it is important to
develop robust quantification methods that accurately
measure and compare migration rates of different scratch
assays.
Multiple quantification methods are used to assess collec-
tive cell migration in scratch assays [9]. The most common
ones focus on wound width or area change [3,10]. Such
methods use a number of metrics to quantify migration,
including the percentage difference in the wound width at
different time points [7,11], wound width at specific time
points [12] and the slope of a linear approximation to the
change in wound area [13], among others. Other more compu-
tationally intensive methods exist that rely on cell tracking or
on determining a velocity field across the full monolayer
[14,15]. In this work, we focus on less computationally inten-
sive methods that permit a quick assessment of collective
cell migration. A weakness of the aforementioned methods is
that they do not perform well when the two borders of the

royalsocietypublishing.org/journal/rsifJ.R.Soc.Interface
16:20180709
3
scratch are not perfectly straight, a feature that is common inexperimental data [13,16]. The lack of a reproducible wound-
ing procedure results in non-uniform cell-free areas
with irregular leading edges, as can be seen in figure 1.
Furthermore, migration rate measurements have been shown
to be sensitive to the initial degree of confluence [17] and the
initial geometry of the wound [18]. Current quantification
methods require high-quality experimental data which are
difficult to obtain; therefore, frequently the experimental
data are discarded or need to be produced again.
Another issue with existing quantification methods is that
many of them use time-specific measurements to determine
differences in migration rates of cell samples. Typically, a
time point in the course of the experiment is considered at
which the wound area or width of each sample is measured.
Then, statistical tests are performed on these measurements
with the purpose of detecting significant differences [3].
The time points of comparison are not standardized and
vary across studies [7,19,20]. Differences in the time points
used for comparison may be due to differences in the prolifer-
ation rates of the cell types under consideration. The choices
are made to minimize the impact of cell proliferation on
migration quantification. However, there is no standard pro-
cedure for choosing the comparison time even though the
choice can affect the comparison and may render the results
from the analysis unreliable.
In this work, we introduce a new quantification method
that tackles these issues and can be used to analyse lower-
quality experimental data. Irregular leading edges are
accounted for by approximating the front by a piecewise con-
stant function, which is constant over windows with a fixed
size, w�. We assume that within each window, the contour
moves with constant speed in the perpendicular direction
until the left and right leading edges meet. The migration in
the scratch assay is characterized by a series of linear approxi-
mations to the interface’s position over time in these windows.
The paper is organized as follows: in §2.1, we describe our
experimental system and in §2.2, we present the agent-based
model that we use to simulate the in vitro process. In §2.4, we
introduce the new migration quantification method for scratch
assays and describe the two quantification methods to which
we compare it: the percentage wound area method, which is
widely used, and the closure rate method, reviewed in [13]. In
§3.1.1, we investigate how the velocity distribution, determined
by our quantification method, is affected by cell migration and
proliferation. In §3.1.2, we show that the method correctly
classifies cells with different migration and proliferation par-
ameters. In §3.1.3, we show the statistical comparison against
the other methods. In §3.2.3, we present the results of applying
the three methods to an experimental dataset. Finally in §4, we
discuss our results and present our conclusions.
2. System and methods2.1. Cell culture and wound healing assaySix site-specific mutations in a latent transcription factor that
regulate downstream genes involved in essential biological
processes, including migration, were generated. Mutants S1,
S2, S3, S4, S5 and S6 were then transduced into a human
renal carcinoma cell line, 769-P (ATCC CRL-1933), through len-
tiviral particles. The 769-P mutants were cultured in Dulbecco’s
modified Eagle’s medium (DMEM) (#42430, Gibco)
supplemented with 10% of fetal bovine serum (FBS) (#10270,
Gibco), 1% of sodium pyruvate solution 100 mM (#03-042-1B,
Biological Industries) and 1% of antibiotic–antimycotic
solution 100� (#15240, Gibco). Cells were maintained at 378Cin 5% CO2.
For the wound healing assay, the 769-P mutants (S1–S6)
were seeded at 0.025 � 106 cells per well in a two-well silicone
insert with a defined cell-free gap (Ibidi #81176, Germany),
incubated and allowed to grow for 48 h. Once the cells reached
100% confluence, the culture insert was removed and the area
that remained clear of cells was quantified for 24 h using the
Live Cell-R Station (Olympus). Digital images were obtained
every 30 min.
Data consisted of 24 wound healing assays: four replicates
for each of the six groups (S1–S6). Each assay consisted of 48
images. The imaged region size was 500� 500mm2.
2.2. Agent-based model of the scratch assayWe consider an agent-based model that has been previously
used to simulate in vitro cell cultures [21–23]. The simulation
domain is a two-dimensional square lattice, with the same
dimensions as the experimental images: [0, D] � [0, D]
where D ¼ 500 mm. The lattice spacing, D, which is inter-
preted as the average cell diameter, is set to 10 mm unless
otherwise specified.
In this model, each agent can either proliferate or move
within the simulation domain. We consider an end time of
T ¼ 24 h and an update time of t ¼ 0.1 h. We include crowd-
ing effects by assuming that each lattice site is occupied by at
most one cell. A cell with centre at (x, y) is said to be at (x, y).
Zero flux boundary conditions are imposed. At each update
time, agents move and/or proliferate with migration and
proliferation probabilities pm and pp, respectively. Since typi-
cal estimates of the cell doubling time are approximately
15–30 h [24,25], whereas the time required for a cell to move
a distance equal to its diameter is of the order of 10 min [26],
we consider migration and proliferation probabilities in the
ranges pm [ [0, 1] and pp [ [0, 0.01], respectively. The simu-
lation algorithm and typical parameter values are presented
in the electronic supplementary material, section S1. In
figure 2, we plot the evolution of a typical realization of the
agent-based model for which the migration and proliferation
parameters are given by pm ¼ 0.3 and pp ¼ 0.01.
2.3. Automatic contour segmentationThe leading edges of the cell monolayers from the experimen-
tal images are detected by applying a segmentation algorithm
based on the GrowCut method [27]. The method is a robust
technique, already employed in several computer vision
applications, that performs a binary image segmentation.
The GrowCut algorithm requires the initial specification of
a subset of pixels from each type of region: cell monolayer
and unoccupied space; these pixels are referred to as seeds.
The seeds should be located far from the leading edges,
where all the pixels of such an area belong to one of the two
classes. The algorithm evolves as follows: at each iteration,
the pixels surrounding the initial seeds are assigned to one
class or the other, adjusting the size of each region. The classi-
fication depends on the similarity of the pixel intensity with
respect to the pixel intensity of the seeds.
In our implementation, the seeds are chosen as follows:
for the cell region, the Canny and Roberts edge contour

500time: 4 h time: 8 htime: 0 h time: 16 h
400
300
200
100
1 100 200 300X
Y
500
400
300
200
100
Y
500
400
300
200
100
Y
500
400
300
200
100
Y
400 500 1 100 200 300X
400 500 1 100 200 300X
400 500 1 100 200 300X
400 500
Figure 2. Evolution of an agent-based simulation. We considered an idealized initial condition and fixed the migration and proliferation parameters so that pm ¼ 0.3and pp ¼ 0.01, respectively. The recolonization of the wounded region is shown at times t ¼ 0, 4, 8 and 16 h. For ease of visualization, the two cell monolayers (rightand left) are plotted with different colours (red and turquoise), while the area devoid of cells is coloured blue. The leading edges detected by the segmentation algorithmare plotted in yellow. (Online version in colour.)
royalsocietypublishing.org/journal/rsifJ.R.Soc.Interface
16:20180709
4
methods [28,29] are used to select the pixels with the highest
variability, corresponding to the cell contours. For the back-
ground region, the seeds are set in areas having a low
variability, defined as areas in which the pixel intensity has
a standard deviation less than 500.
After applying the detection algorithm to each image, we
have a record of the positions of the left and the right inter-
faces at each time where the image was taken. At each
vertical position, the interface is considered to be the closest
pixel to the wound.
2.4. Migration quantification methodsWe first introduce the two established quantification methods
for scratch assays. Then, we introduce a new method that
quantifies the x-component of the velocity of the leading
edge of the cell monolayer.
2.4.1. Area methodOne of the most widely used quantification methods, which
we term the area method, assesses the migration in an indirect
manner. During an experiment, the wound area percentage,
A(t), is tracked:
A(t) :¼ A(t)A(0)
� 100%,
where A(t) is the wound area at time t and A(0) is its initial
area. The migration rate is then indirectly evaluated as the
percentage wound area at a specific time point.
2.4.2. Closure rate methodIn [13], cell migration is quantified by assuming that the
wound area reduces linearly over time. We refer to this
method as the closure rate method. The change in wound
area A(t) is first approximated by a linear function:
A(t) � m� tþ b, (2:1)
where m and b are real scalars. The wound area is assumed to
be the length of the field-of-view (l) times the width of the gap
(W(t)). Since l is constant during the course of the experiment,
equation (2.1) becomes:
dAdt� l� dW
dt: (2:2)
The migration rate, Cr, is defined to be half of the width
closure rate
Cr :¼ 1
2
dWdt
: (2:3)
Combining equations (2.2) and (2.3), we have
Cr ¼jmj
2� l: (2:4)
2.5. Proposed quantification method: monolayer edgevelocimetry
We propose a new strategy for quantifying front migration in
a scratch assay using a set of representative velocities. We
denote by t0, . . ., tN, the times at which data are collected.
Let X � Y represent the square domain of the processed
image, X ¼ Y ¼ f1, . . ., Dg where D is the number of pixels.
For each j [ Y ¼ f1, . . ., Dg, we denote the interface position
in the horizontal direction, at the j 2th vertical position and
at time point tn, as ij(tn) where 1 � ij � D. See figure 3a for
a schematic representation.
To determine the velocities, we assume a linear approxi-
mation to the front position over time for a window size w.
The linear approximation is determined in two steps:
(1) First, the front position is approximated for the
window size, w. Y is divided into M ¼ D/w segments
denoted Ys, 1 � s �M, each of length w. The front
position is in each segment Ys is approximated by its
mean position,
is(tn) ¼ hi j(tn)ii j[Ys: (2:5)
This procedure is illustrated in figure 3b.
(2) The dynamics of the front position in each window is
approximated by linear regression, so that
is(tn) � mstn þ bs: (2:6)
In figure 3c, the dotted lines indicate how the actual front
position changes over time at selected y-coordinates;
the dashed lines represent the corresponding linear
approximations for a window of size w ¼ 16.
By performing this approximation for the left and right
interfaces, we obtain a set of velocities {jmsj}2Ms¼1 to which we
refer as the windowed velocities for window size w.
A necessary step in our method is determining the
window size to perform the linear approximation (2.6). We
observe that as the window size decreases, the fitness of the
linear approximation improves. This observation prompts
us to consider the smallest window size; however, for
window sizes smaller than the average cell size, the left
and right windowed velocity distributions are significantly
different. This is a finite-size sampling effect, since the scale

500
i400 (0)
i200
i400
i100
i300
i300 (0)
i200 (0)
i100 (0)
i300 (5)
i400 (5)
i200 (5)
i100 (5) i100 (10)
i200 (10)
i400 (10)
i300 (10)
t = 0 h t = 5 h t = 10 h t = 5 h
450
400
350
300
250Y Y
200
150
100
50
500230
220
210
200
190
inte
rfac
e po
sitio
n (µ
m)
180
170
160
450
400
350
300Ys }w
250
200
150
100
50
160 180X
front position atdifferent times
iˆs (tn) = ·ij (tn)Ò pj ŒYs iˆs (tn) ª mstn + bs
front approximation withrespect to window size w
linear approximation to thefront position over time
X time (h)200 220 160 180 200 2200 2 4 6 8 10 12
(b)(a) (c)
Figure 3. Linear approximation of the front position over time with respect to window size w for one of the scratch assays from the experimental cell groups. (a) Tointroduce the notation, the positions of the left front at times t ¼ 0, 5 and 10 h are plotted in blue. The solid line corresponds to t ¼ 0 h; the dashed line to 5 hand the dotted line to 10 h. The front positions at the 100, 200, 300 and 400 y-coordinates for these times are plotted: yellow, orange, purple and green, respect-ively. (b) The left front at t ¼ 5 h is approximated by a window size w. Y is partitioned into M segments denoted Ys, 1 � s � M, each with length w. A magentahorizontal line delimits each segment. The front position is plotted in blue and the approximated front position, taken as an average over each Ys, is plotted in red.(c) The time evolution of the interfaces at the 100, 200, 300 and 400 y-coordinates and the linear approximation with respect to the window size w ¼ 16 areplotted using dotted lines and dashed lines, respectively. The window size w ¼ 16 is the window size that maximizes the objective function (2.7). (Online versionin colour.)
royalsocietypublishing.org/journal/rsifJ.R.Soc.Interface
16:20180709
5
on which the velocities are quantified is much smaller than
the cell size scale. Therefore, the individual velocity of each
cell at the front is counted multiple times and its value is
over-represented, producing a bias in the overall windowed
velocity distribution. To deal with the finite-size sampling
effect, we choose a window size for which the left and
right windowed velocity distributions are similar. We note
that if two different cell types are seeded on either side
then the assumption of left and right similarity can no
longer be made. However, in the standard experimental
set-up of the scratch assay, the left and right interfaces are
from the same cell type. A more detailed explanation of
why the similarity of the left and right velocity distributions
should be considered is included in section S2.1 of the elec-
tronic supplementary material.
We use two criteria to select the optimal window size, w�:(i) fitness of the approximation, and (ii) similarity of the left
and right windowed velocity distributions. In more detail,
we introduce an objective function, F(w), that has three
terms and enables us to find the optimal window size with
respect to these two criteria:
F(w) ¼ Fitresid(w)þ FitRsquared(w)þ FitKSdistance(w): (2:7)
— Fitresid(w) measures the discrepancy between the inter-
face position over time and the linear approximation
(equation (2.6)).
— FitRsquared(w) considers the coefficient of determination,
R2, which describes how well the interface position’s
variance over time is explained by the linear approxi-
mation [30].
— FitKSdistance(w) is a distance function derived from the
Kolmogorov–Smirnov (K–S) statistic for the two-sample
K–S test [30]; it calculates the distance between the left
and right front windowed velocity distributions.
These terms are scaled such that the window size that
maximizes the objective function takes into account the
trade-off between giving the best fit and having the left and
right velocity distributions closest to each other.
The procedure used to determine the optimal window
size can be interpreted as a procedure that optimizes
the number of velocities needed to characterize the migration.
Detailed information about how to modify the objective func-
tion when multiple assays are considered can be found in
electronic supplementary material, section S2.
The procedure used to determine the set of representative
velocities is summarized in algorithm 1.
Algorithm 1. Monolayer edge velocimetry.
1 Determination of the optimal window size for the linear
approximation using the objective function (2.7)
w� ¼ max1�w�D
FðwÞ (2:8)
where F(w) is given by equation (2.7).
2. Linear approximation, with respect to the window size w�;
indicating how the positions of the left and right interfaces change
over time,
isðtnÞ � mstn þ bs
where is(tn) ¼ hi j (tn)ii j [Ys, Y ¼
SM
s¼1Ys in which jYsj ¼ w� and
M ¼ D=w�.
Output {jmsj}2Ms¼1 is the representative set of velocities that quantify
cell migration in the scratch assay.
royalsocietypublishing.org/journal/rsifJ.R.Soc.Interface
16:20180709
6
We refer to the ‘monolayer edge velocimetry method’ asthe MEV method in the rest of the paper.
2.6. Classification testIn order to assess the performance of the three quantification
methods in a controlled way, we use the agent-based model
to generate in silico scratch assays. In particular, we compare
the ability of the different methods to distinguish between
cell populations with different proliferation and migration
parameters. We consider the following classification test:
(1) We fix a focal parameter combination P ¼ (pm, p p) [
[0, 1]� [0, 0:01] and run n simulations of the agent-based
model using these parameter values.
(2) We decompose the parameter space of migration and
proliferation probabilities [0, 1] � [0, 0.01] into a regular
11 � 11 grid with 121 parameter pairs ( pm, pp). For each
parameter combination, we run n simulations of the
agent-based model.
(3) We calculate the cell migration rate in all simulations using
the three quantification methods. The migration measure-
ments are windowed velocities, closure rates or areas at
specific time points, depending on the quantification
method.
(4) For each quantification method, we determine whether
the migration measurements of each sampled parameter
combination ( pm, pp) are statistically significantly different
from those for the focal parameter pair P. We perform two
tests: the two-sample K–S test and the unpaired two-
sample t-test, which we refer to as the K–S test and t-test, respectively. We fix a p-value less than 0.05 to
define statistical significance.
We consider a K–S test and a t-test to test for differences
at the distribution level and in the mean. We test our data for
normality and in case the migration measurements are not
normally distributed, we consider a Wilcoxon rank-sum
test. We account for stochasticity of the agent-based model
by repeating this test 20 times and analyse the mean and var-
iance of the classification results.
When applying the classification test for the MEV
method, we consider a global optimal window size for deter-
mining the windowed velocities of the simulations. In this
way, we obtain the same number of windowed velocities
for each simulation. To determine this global optimal
window, we consider a weighted sum of the individual objec-
tive functions of each simulation (electronic supplementary
material, section S2). When applying the classification test
to the area method, we must specify the time point at
which the wound areas are measured and compared. We
fix the comparison time to be half the time it takes the leading
edges to touch each other in the first simulation, which is a
common choice in an experimental setting.
2.7. ImplementationThe segmentation algorithm and the data analysis are
implemented in MATLAB version: 9.3.0.713579 (R2017b). The
segmentation pipeline uses functions from Matlab’s Image Pro-
cessing Toolbox, the GrowCut algorithm implementation found
in http://freesourcecode.net/matlabprojects/56832/growcut-
image-segmentation-in-matlab and the normality tests
implemented by [31]. The agent-based model is implemented
in NetLogo [32]. We do not apply the segmentation algorithm
to the in silico images so the detection method does not affect
the migration rate measurements.
3. Results3.1. Exploration and validation of quantification method
via in silico dataWe first use the agent-based model to investigate how our
quantification method is affected by cell migration and
proliferation. Then, by applying the classification test, we
investigate how well the method classifies cell populations
with different migration and proliferation parameters in
comparison with the other quantification methods.
3.1.1. Sensitivity analysisWe investigate how the windowed velocities are affected by
the rates of cell migration and proliferation. We vary the
migration and proliferation probabilities for fixed initial con-
ditions. We decompose the parameter space of migration and
proliferation probabilities [0, 1] � [0, 0.01] into a regular 11 �11 grid with 121 parameter pairs ( pm, pp). For each parameter
combination, 150 simulations were performed and the wind-
owed velocities were calculated. The optimal window was
calculated with respect to all simulations for the same par-
ameter combination. In figure 4a we present a contour plot
of the mean windowed velocity which shows how, as the
probabilities increase, the mean velocity increases. A similar
trend is observed for the standard deviation (see figure 4b).
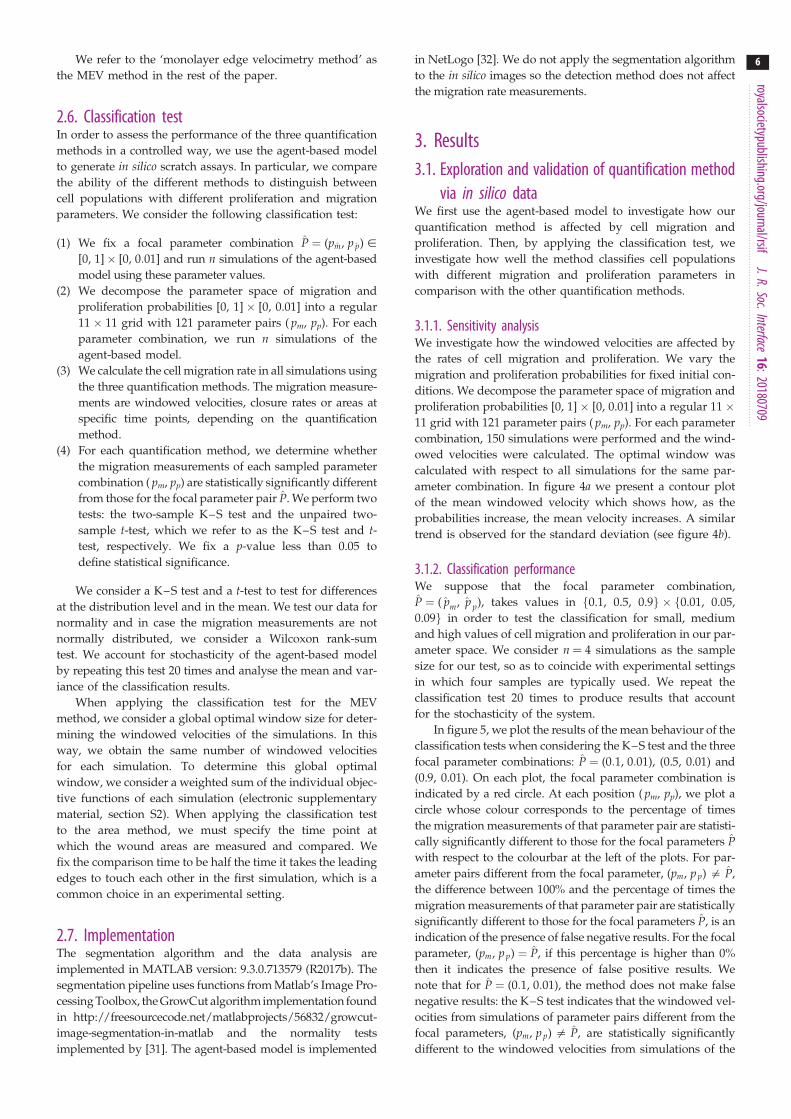
3.1.2. Classification performanceWe suppose that the focal parameter combination,
P ¼ ( pm, p p), takes values in f0.1, 0.5, 0.9g � f0.01, 0.05,
0.09g in order to test the classification for small, medium
and high values of cell migration and proliferation in our par-
ameter space. We consider n ¼ 4 simulations as the sample
size for our test, so as to coincide with experimental settings
in which four samples are typically used. We repeat the
classification test 20 times to produce results that account
for the stochasticity of the system.
In figure 5, we plot the results of the mean behaviour of the
classification tests when considering the K–S test and the three
focal parameter combinations: P ¼ (0:1, 0:01), (0.5, 0.01) and
(0.9, 0.01). On each plot, the focal parameter combination is
indicated by a red circle. At each position ( pm, pp), we plot a
circle whose colour corresponds to the percentage of times
the migration measurements of that parameter pair are statisti-
cally significantly different to those for the focal parameters Pwith respect to the colourbar at the left of the plots. For par-
ameter pairs different from the focal parameter, (pm, p p) = P,
the difference between 100% and the percentage of times the
migration measurements of that parameter pair are statistically
significantly different to those for the focal parameters P, is an
indication of the presence of false negative results. For the focal
parameter, (pm, p p) ¼ P, if this percentage is higher than 0%
then it indicates the presence of false positive results. We
note that for P ¼ (0:1, 0:01), the method does not make false
negative results: the K–S test indicates that the windowed vel-
ocities from simulations of parameter pairs different from the
focal parameters, (pm, p p) = P, are statistically significantly
different to the windowed velocities from simulations of the

0.10
0.08
0.06
0.04
0.02
0 0.2 0.4 0.6pm
0.8 1.0
p p
0.10
0.08
0.06
0.04
0.02
0 0.2 0.4 0.6pm
0.8 1.0
p p
0.10 100%
90%
80%
70%
60%
50%
40%
30%
20%
10%
0%
0.08
0.06
0.04
0.02
0 0.2 0.4 0.6pm
0.8 1.0
p p
(b)(a) (c)
Figure 5. Plots of the mean behaviour of the classification tests for the monolayer edge velocimetry method. The classification tests are performed by considering aK – S test, a sample set of n ¼ 4 simulations and the focal parameters (a) P ¼ (0:1, 0:01), (b) P ¼ (0:5, 0:01) and (c) P ¼ (0:9, 0:01). In each plot at eachparameter pair ( pm, pp), the colour of the circle denotes the percentage of times the migration measurements of that parameter pair are statistically significantlydifferent to those for the focal parameter P. We indicate the focal parameter pair with a red circle. The plots illustrate how the classification performance of themethod varies as the migration parameter varies. The method performs better when the migration parameter is small. (Online version in colour.)
0.1040
35
302520
15
105
00
0.02
0.04
0.06
0.08
0.107
6
5
4
3
2
1
0.08
0.06
0.04
0.02
0 0.2 0.4 0.6pm
p p p p
pm
0.8 1.0 0.2 0.4 0.6 0.8 1.0
(b)(a)
Figure 4. Sensitivity analysis of the agent-based model. We analyse the variability of the windowed velocities with respect to the proliferation and migrationprobabilities ( pm, pp) [ [0, 1] � [0, 0.1]. In (a) and (b), we plot the mean and the standard deviation of windowed velocities of 150 simulations undereach of these 121 parameter pairs. (Online version in colour.)
royalsocietypublishing.org/journal/rsifJ.R.Soc.Interface
16:20180709
7
focal parameter pair 100% of the time (figure 5a). For
P ¼ (0:5, 0:01), there are four parameter pairs for which the vel-
ocities were 80%, 85%, 85% and 95% times statistically
significantly different to those for the focal parameter (figure
5b). For P ¼ (0:9, 0:01), the number of parameter pairs for
which the percentage is not 100% increases (figure 5c). We
observe that as the migration rate increases, the classification
performance worsens. The intra-sample difference is
accounted for when considering the classification tests for the
parameter pair (pm, p p) ¼ P: We observe that the method
gives false positive results fewer than 34% of the time. This per-
centage decreases as the proliferation probability increases (see
electronic supplementary material, section S3).
3.1.3. Comparison with standard migrationquantification methods
We compare the classification performance of the MEV method
with the closure rate and the area methods [3,10]. As before, the
focal parameter combination, P, takes values in f0.1, 0.5, 0.9g �f0.01, 0.05, 0.09g. We consider n ¼ 4 simulations as the sample
size and repeat the classification test 20 times.
In figure 6, we plot the mean behaviour of the classification
tests for the three quantification methods by applying the K–S
test and the focal parameter combinations P ¼ (0:1, 0:01), (0.5,
0.01) and (0.9, 0.01). We observe that for a focal parameter
pair, the MEV method yields fewer incorrect classifications.
We also observe that as the proliferation rate increases, the
percentage number of incorrect classifications increases for
the three methods.
The results of the classification tests for all other focal
parameter combinations in f0.1, 0.5, 0.9g � f0.01, 0.05, 0.09gare presented in the electronic supplementary material,
section S3. Overall, we observe that our method outperforms
the closure rate and the area method. For all focal parameter
combinations tested, the MEV method yields a greater
percentage of correct classifications. The performance of the
area method is the worst while the performance of the closure
rate method is intermediate between our method and the
area method. The performance of all three methods declines
as the values of the migration and proliferation rates of the
focal parameters P increase. The optimal window sizes for
each classification test are of similar size as the cell diameter
(results not shown).
3.2. Application of the quantification methods toin vitro data
Having tested the quantification methods on in silico data, we
now use them to analyse experimental data. We first detect the
position of the leading edges from the wound healing images

0.10
0.08
mon
olay
er e
dge
velo
cim
etry
met
hod
clos
ure
rate
met
hod
area
met
hod
0.06
0.04
0.02
0 0.2 0.4 0.6 0.8 1.0 0 0.2 0.4 0.6 0.8 1.0 0 0.2 0.4 0.6 0.8 1.0
0 0.2 0.4 0.6 0.8 1.00 0.2 0.4 0.6 0.8 1.00 0.2 0.4 0.6 0.8 1.0
0 0.2 0.4 0.6 0.8 1.0 0 0.2 0.4 0.6 0.8 1.0 0 0.2 0.4 0.6 0.8 1.0
0.10
0.08
0.06
0.04
0.02
0.10 100%
90%
80%
70%
60%
50%
40%
30%
20%
10%
0%
0.08
0.06
0.04
0.02
0.10
0.08
0.06
0.04
0.02
0.10
0.08
0.06
0.04
0.02
0.10
0.08
0.06
0.04
0.02
0.10
0.08
0.06
0.04
0.02
0.10
0.08
0.06
0.04
0.02
0.10
0.08
0.06
0.04
0.02
P = (0.1, 0.01) P = (0.9, 0.01)P = (0.5, 0.01)
pm
p p
pm
p p
pm
p p
pm
p p
pm
p p
pm
p p
pm
p p
pm
p p
pm
p p
(e) ( f )
(b)(a) (c)
(d )
(i)(g) (h)
Figure 6. Series of plots showing how the performance of the three quantification methods changes as the migration rate of the focal parameters varies. In eachplot, the colour of the circle at each parameter pair ( pm, pp) indicates the percentage of times the migration measurements associated with the parameter pair arestatistically significantly different from those associated with the focal parameters P. The focal parameters P are indicated by a red circle. The results reveal that themonolayer edge velocimetry method yields a better statistical classification than the other methods. We note also the performance of all three methods declines asthe migration rate of the focal parameters P increases. (Online version in colour.)
royalsocietypublishing.org/journal/rsifJ.R.Soc.Interface
16:20180709
8
taken during the course of the experiments. We then quantify
the migration rates using the three quantification methods and
analyse the statistical classification.
3.2.1. Image segmentationAfter applying the segmentation algorithm, the front of the
cell monolayer is detected for each time-lapse image. In
figure 1, we present the time-lapse data of a representative
scratch from each cell group (S1–S6).
3.2.2. Quantification method resultsWe quantify the migration velocity of scratch assays for
the different cell types using the MEV method. We deter-
mine the global optimal window by calculating the
objective function for the 24 scratch assays. We vary the
window size w from 1 to 500 mm with a step size of
1 mm and use equation (2.7) to calculate the objective
function F(w). The objective function and the three fitness
functions that contribute to its calculation are shown in
the electronic supplementary material, section S4. The
maximum value is attained for a window size of 16 mm.
For a fixed window size (w ¼ 16 mm), we use a linear
approximation to describe the position over time of the
fronts and determine the 32 representative windowed vel-
ocities for each scratch assay and visualize their boxplots
in figure 7.
3.2.3. Statistical classification via the local quantification methodAfter grouping the velocities of scratch assays from the same
cell type, the migration rate of each cell group is represented
by 256 velocities. The boxplots associated with the velocity
distributions for the six groups are shown in figure 8a. To
determine how different the migration rate of cell group S1
is from the others, we perform a K–S test to test the null
hypothesis that the velocities from the two groups come
from the same distribution. The null hypothesis was rejected
for groups S2, S3 and S4 with statistical significance level of
pvalue � 0.0001. The null hypothesis was rejected for group
S6 with statistical significance level of pvalue � 0.05. For
group S5, the null hypothesis was not rejected. We performed
a t-test between S1 and each of the other groups to determine
whether the mean difference is statistically significant. The
mean difference between the velocities for cell groups S1
and S2, S3 and S4 is statistically significant at the 0.0001
level. There was statistical significance in the mean difference
with respect to S6 at the 0.05 significance level. The statistical
results for the K–S tests and t-tests are reported in figure 8a.

10
8
6
4
2
0
–2
1 2 3 4 5 6 7 8 9 10 11 12scratches
win
dow
ed v
eloc
ities
(µm
h–1
)
13 14 15 16 17 18 19 20 21 22 23 24
Figure 7. Boxplots of the windowed velocities with respect to the optimal window size of 16 mm for each experimental scratch assay. (Online version in colour.)
S1 S2 S3 S4cell groups
clos
ure
rate
(mm
h–1
)
win
dow
ed v
eloc
ities
(mm
h–1
)
S5 S6S1
12*
*
********
****
********
*
****
10
8
6
4
2
–2
–4
0
12
10
8
6
4
2
–2
–4
0
S2 S3 S4cell groups
S5 S6
(b)(a)
Figure 8. Statistical analysis of the experimental data using the velocity and the closure rate method. First, the migration measurements are grouped into the sixdifferent groups (S1 – S6). The windowed velocities and the closure rates for the cell groups are plotted in (a), (b). respectively. Above the data, in black, we havereported the statistical significance results from performing a K – S test with respect to the S1 group. Below the data, we have done the same for the t-tests.Considering the windowed velocities, with respect to the K – S test and t-test, the null hypothesis was rejected testing group S1 against groups S2, S3 andS4 at the 0.001 significance level. Performing the statistical tests with the closure rate measurements, the null hypothesis was rejected at the significancelevel of 0.05 between S1 and S3. The statistical significance level is decoded in the symbols: *pvalue � 0.05, **pvalue � 0.01, ***pvalue � 0.001 and ****pvalue -� 0.0001. (Online version in colour.)
royalsocietypublishing.org/journal/rsifJ.R.Soc.Interface
16:20180709
9
The exact value of the pvalue for each test is reported in the
electronic supplementary material, section S5.
3.2.4. Statistical comparison to standard migrationquantification methods
We now compare the statistical results of our quantification
method against those for the area and closure rate methods.
In figure 8b, we plot the closure rates of each group and
report the results from performing the K–S test and t-test
between S1 and the other groups. S3 was the only group for
which the null hypothesis of the K–S test and the t-test was
rejected at the 0.05 significance level. When we performed
the statistical tests for the percentage area measurements, no
significant difference was found. In section S5 of the electronic
supplementary material, we include the results of the K–S and
t-tests for the percentage wound area measurements.
4. Discussion and conclusionsIn this work, we have introduced a new migration quantifi-
cation method for scratch assays that characterizes the
horizontal component of the front velocity of cell monolayers.
The method involves three steps: (1) determination of an opti-
mal window w� with which to approximate the cell front by a
function which is piecewise constant in segments of length
w�; (2) approximation of the interface with respect to the
window size w� at each time point and (3) linear approxi-
mation of the position over time of the interface in each of
these windows. In this way, we characterize cell migration
in the scratch assay by the slopes of a series of linear approxi-
mations to the interface position over time in these windows.
The optimal window is chosen to be the one that best fits a
constant velocity profile and for which the left and right
front velocities can be considered to be samples of the same
distribution.
By considering an agent-based model that mimics the
scratch assay, we tested the ability of our quantification
method to distinguish between cell lines with known cell
migration and proliferation rates. As the migration and
proliferation rates increased, the mean and variance of the
windowed velocities increased. This was an expected behav-
iour since migration and proliferation promote the interface
velocity and the variance of the system increases as the
migration and proliferation rates increase. By comparing

royalsocietypublishing.org/journal/rsifJ.R.Soc.Interface
16:20180709
10
our quantification method with two existing methods, weobserved that our method outperforms both since it yielded
a greater percentage of correct classifications than the other
methods across a range of parameter values. We noticed that
our method made significantly fewer statistical errors than
the two other tested methods. Despite being widely used, the
performance of the area method was the worst, while the per-
formance of the closure rate method was intermediate between
our method and the area method. The poor performance of the
area method is due to the presence of irregular cell-free areas
and to the indirect quantification of migration by a single
time point measurement. The poor performance of the closure
rate method is also related to the irregularities in the data since
the closure rate method is equivalent to quantifying the
migration by the slope of the linear approximation to the
mean position of the interface over time.
After showing that our quantification method performed
better on in silico data, we then used it to analyse our exper-
imental dataset. We calculated an optimal window size of 16
mm, which is of the same order as the mean cell diameter
size, and then determined the corresponding windowed hori-
zontal velocities. By performing two-sample K–S and
unpaired two-sample t-tests, we identified a statistically sig-
nificant difference between the S1 group and groups S2–S4.
The K–S test also indicated statistically significant differences
with respect to group S6. We used these two tests as we
wanted to detect differences at the distribution level (through
the K–S test) and at the mean level (through the t-test). The
closure rate method only detected statistically significant
differences between S1 and S3. The closure rate data are of
poor quality: more samples or better quality ones are
needed to analyse the migration rate with this method. The
area method was unable to detect any statistically significant
differences in the dataset. Even when we tried different time
points, there was no significant difference. We observed that
the S1 cell group also exhibited the highest levels of
expression of target genes associated with malignancy and
poor prognosis, when analysed by qRT-PCR techniques
(data not shown) in agreement with the detected significant
differences in migration.
This study has some limitations which could be addressed
in future work. For the in vitro experiments, the scratch was
created by the removal of silicone inserts. It has been observed
that the removal of silicone inserts can damage the culture sur-
face coating and affect the cell migration rate [33]. We assume
this effect is present in all cell samples so the comparative
migration analysis performed by the quantification methods
is not affected. Using our quantification method, we would
be able to establish how the different procedures for creating
the scratch affect migration rates. The statistical performance
of our quantification method can be further validated on
publicly available wound healing experiment datasets such
as those in [34], which provide sets of assays and replicates
under different experimental conditions. Currently our
quantification method does not take into consideration the
intra-group and inter-sample variances of the windowed
velocities. In spite of that the classification performance of
our quantification method is superior to the area and the clo-
sure rate method. The intra-group and inter-sample variances
will be taken into consideration in the statistical assessment of
the method in a future work. In this study, the agent-based
model accounted solely for proliferation and migration
events. Additional interactions could be included to give a
more realistic description of the scratch assay and the impact
of how these factors affect the quantification method could
be assessed. The quantification algorithm assumes a linear
approximation of the horizontal cell monolayer displacement.
Our method could be adjusted to account for an initial phase
during which the cells react to the presence of the wound, so
the cell monolayer front position over time can be fitted to a
Richards function, a non-symmetrical sigmoid function, as
in [9]. Currently the method does not address image boundary
effects that could potentially affect the quantification. The
method could be improved to allow it to deal with the
image boundary in a more precise way. One of the drawbacks
of our quantification method is the uncertainty in the optimal
window size since it depends on the samples. However, in our
study, we found that the optimal window size is of the order of
the mean cell diameter and the statistical power and measure-
ments of the quantification method are the same for window
sizes of the same order (results not shown). If the mean cell
diameter is known, then the optimization procedure can be
omitted and the linear approximation can be performed
using the mean cell diameter as the window size. The frame-
work can also be extended to consider a time-dependent
velocity field across the full monolayer, such as cell
image velocimetry (CIV) [15]. The challenge in this case
would be to determine to which measurements we should
apply statistical tests to detect significant differences in
migration rates.
In summary, we have introduced a new method for
migration quantification of typical scratch assay data, which
can be of low quality. Many of the challenges we have over-
come with our method could be avoided through improved
experimental design. However, the latter would require:
repeating the experiment or using more sophisticated exper-
imental tools to create the same degree of confluence and
uniform ‘wounds’. These are costly solutions. We note that
our quantification method can be applied to the existing
data. Furthermore, through the classification test based on
in silico data, we show that even when the quality of the
scratches is ideal, our quantification method is better at
detecting differences in migration than the other standard
methods. While generalization to other nonlinear wound
models is not clear, e.g. circular model wounds, the proposed
method shows that determining the velocity field along the
cell front is sufficient to characterize the migration.
Data accessibility. The source code and the implementation of the algor-ithm as a GUI along with an example dataset and user instructions,are available at https://bitbucket.org/anavictoria-ponce/local_migration_quantification_scratch_assays/src/master/. The datasetsare available at https://ganymed.math.uni-heidelberg.de/victoria/supplementary_data_migration_quantification_scratch_assays.shtml.
Authors’ contributions. T.A., A.M. and S.B. designed and coordinated thestudy. A.V.P.B. developed the agent-based model and performedthe processing and analysis of the data. S.B. and A.V.P.B. designedand developed the image processing pipeline. A.M. designed theexperiments, while E.S. and J.A. performed them. H.M.B.,P.K.M., T.C. and T.A. contributed to the analysis and interpret-ation of results. A.V.P.B. wrote the paper, on which all otherauthors commented and made revisions. All authors gave finalapproval for publication.
Competing interests. We declare we have no competing interests.
Funding. This work was supported by the Heidelberg Graduate Schoolof Mathematical and Computational Methods for the Sciences [DFGgrant no. GSC 220 in the German Universities Excellence Initiative toA.V.P.B.]; Mathematics for Industry Network [COST Action TD1409short-term scientific missions grant to A.V.P.B.]; Consejo Nacional

royalsociety
11
de Ciencia y Tecnologıa [411678 to J.A.]; Ministerio de Ciencia eInnovacion [TIN2015-66951-C2-1-R and SGR 1742 to S.B., SAF2017-89989-R and SAF2014-59945-R to A.M.]; Red de Investigacion RenalREDinREN [12/0021/0013 to A.M.]; the CERCA Programme of theGeneralitat de Catalunya to T.A.; Ministerio de Economıa y Compe-titividad [MTM2015-71509-C2-1-R and MDM-2014-0445 to T.A.] and pAgencia de Gestio de Ajuts Universitaris i Recerca [2014SGR1307to T.A.].
Acknowledgements. A.V.P.B. would like to thank Isabel Serra Mochales,Matthew Simpson and Andreas Spitz for helpful discussions. Wewould like to thank Guillem Perez for being the initial promoter ofthis collaboration.
ublishing.org
References/journal/rsifJ.R.Soc.Interface
16:20180709
1. Friedl P, Gilmour D. 2009 Collective cell migration inmorphogenesis, regeneration and cancer. Nat. Rev.Mol. Cell Biol. 10, 445 – 457. (doi:10.1038/nrm2720)
2. Li L, He Y, Zhao M, Jiang J. 2013 Collective cellmigration: implications for wound healing andcancer invasion. Burns Trauma 1, 21. (doi:10.4103/2321-3868.113331)
3. Grada A, Otero-Vinas M, Prieto-Castrillo F, Obagi Z,Falanga V. 2017 Research techniques made simple:analysis of collective cell migration using the woundhealing assay. J. Investig. Dermatol. 137, e11 – e16.(doi:10.1016/j.jid.2016.11.020)
4. Kramer N, Walzl A, Unger C, Rosner M, Krupitza G,Hengstschlager M, Dolznig H. 2013 In vitro cellmigration and invasion assays. Mut. Res./Rev.Mut. Res. 752, 10 – 24. (doi:10.1016/j.mrrev.2012.08.001)
5. Liang C-C, Park AY, Guan J-L. 2007 In vitro scratchassay: a convenient and inexpensive method foranalysis of cell migration in vitro. Nat. Protoc. 2,329–333. (doi:10.1038/nprot.2007.30)
6. Simpson KJ, Selfors LM, Bui J, Reynolds A, Leake D,Khvorova A, Brugge JS. 2008 Identification of genesthat regulate epithelial cell migration using ansiRNA screening approach. Nat. Cell Biol. 10,1027–1038. (doi:10.1038/ncb1762)
7. Walter MNM, Wright KT, Fuller HR, MacNeil SM,Johnson WEB. 2010 Mesenchymal stem cell-conditioned medium accelerates skin woundhealing: an in vitro study of fibroblast andkeratinocyte scratch assays. Exp. Cell Res. 316,1271 – 1281. (doi:10.1016/j.yexcr.2010.02.026)
8. Decaestecker C, Debeir O, Van Ham P., Kiss R. 2007Can anti-migratory drugs be screened in vitro?A review of 2D and 3D assays for the quantitativeanalysis of cell migration. Med. Res. Rev. 27,149 – 176. (doi:10.1002/(ISSN)1098-1128)
9. Topman G, Sharabani-Yosef O, Gefen A. 2012A standardized objective method for continuouslymeasuring the kinematics of cultures covering amechanically damaged site. Med. Eng. Phys. 34,225 – 232. (doi:10.1016/j.medengphy.2011.07.014)
10. Masuzzo P, Van Troys M, Ampe C, Martens L. 2016Taking aim at moving targets in computational cellmigration. Trends Cell Biol. 26, 88 – 110. (doi:10.1016/j.tcb.2015.09.003)
11. Ranzato E, Martinotti S, Burlando B. 2011 Woundhealing properties of jojoba liquid wax: an in vitrostudy. J. Ethnopharmacol. 134, 443 – 449. (doi:10.1016/j.jep.2010.12.042)
12. Buth H, Buttigieg PL, Ostafe R, Rehders M,Dannenmann SR, Schaschke N, Stark H-J, BoukampP, Brix K. 2007 Cathepsin B is essential for
regeneration of scratch-wounded normal humanepidermal keratinocytes. Eur. J. Cell Biol. 86,747 – 761. (doi:10.1016/j.ejcb.2007.03.009)
13. Jonkman JEN, Cathcart JA, Xu F, Bartolini ME, AmonJE, Stevens KM, Colarusso P. 2014 An introductionto the wound healing assay using live-cellmicroscopy. Cell Adh. Migr. 8, 440 – 451. (doi:10.4161/cam.36224)
14. Maska M et al. 2014 A benchmark for comparisonof cell tracking algorithms. Bioinformatics 30,1609 – 1617. (doi:10.1093/bioinformatics/btu080)
15. Milde F, Franco D, Ferrari A, Kurtcuoglu V,Poulikakos D, Koumoutsakos P. 2012 Cell imagevelocimetry (CIV): boosting the automatedquantification of cell migration in wound healingassays. Integr. Biol. 4, 1437 – 1447. (doi:10.1039/c2ib20113e)
16. Ashby WJ, Zijlstra A. 2012 Established and novelmethods of interrogating two-dimensional cellmigration. Integr. Biol. 4, 1338 – 1350. (doi:10.1039/c2ib20154b)
17. Jin W, Shah ET, Penington CJ, McCue SW, ChopinLK, Simpson MJ. 2016 Reproducibility of scratchassays is affected by the initial degree ofconfluence: experiments, modelling and modelselection. J. Theor. Biol. 390, 136 – 145. (doi:10.1016/j.jtbi.2015.10.040)
18. Jin W, Lo K-Y, Chou S-E, McCue SW, Simpson MJ.2018 The role of initial geometry in experimentalmodels of wound closing. Chem. Eng. Sci. 179,221 – 226. (doi:10.1016/j.ces.2018.01.004)
19. Ruiz-Canada C, Bernabe-Garcıa A, Liarte S, InsaustiCL, Angosto D, Moraleda JM, Castellanos G, NicolasFJ. 2017 Amniotic membrane stimulates cellmigration by modulating transforming growthfactor-b signaling. J. Tissue Eng. Regen. Med. 12,808 – 820. (doi:10.1002/term.2501)
20. Gorshkova I et al. 2008 Protein kinase C-1 regulatessphingosine 1-phosphate-mediated migration ofhuman lung endothelial cells through activation ofphospholipase D2, protein kinase C-z, and Rac1.J. Biol. Chem. 283, 11794 – 11806. (doi:10.1074/jbc.M800250200)
21. Johnston ST, Ross JV, Binder BJ, McElwain DLS,Haridas P, Simpson MJ. 2016 Quantifying the effectof experimental design choices for in vitro scratchassays. J. Theor. Biol. 400, 19 – 31. (doi:10.1016/j.jtbi.2016.04.012)
22. Johnston ST, Simpson MJ, McElwain DLS. 2014 Howmuch information can be obtained from trackingthe position of the leading edge in a scratch assay?J. R. Soc. Interface 11, 20140325. (doi:10.1098/rsif.2014.0325)
23. Simpson MJ, Landman KA, Hughes BD. 2010 Cellinvasion with proliferation mechanisms motivatedby time-lapse data. Phys. A 389, 3779 – 3790.(doi:10.1016/j.physa.2010.05.020)
24. Maini PK, McElwain DLS, Leavesley DI. 2004Traveling wave model to interpret a wound-healingcell migration assay for human peritonealmesothelial cells. Tissue Eng. 10, 475 – 482. (doi:10.1089/107632704323061834)
25. Simpson MJ, Treloar KK, Binder BJ, Haridas P,Manton KJ, Leavesley DI, McElwain DLS, Baker RE.2013 Quantifying the roles of cell motility and cellproliferation in a circular barrier assay. J. R. Soc.Interface 10, 20130007. (doi:10.1098/rsif.2013.0007)
26. Khain E, Katakowski M, Hopkins S, Szalad A, ZhengX, Jiang F, Chopp M. 2011 Collective behavior ofbrain tumor cells: the role of hypoxia. Phys. Rev. E83, 031920. (doi:10.1103/PhysRevE.83.031920)
27. Vezhnevets V, Konouchine V. 2005 GrowCut—interactive multi-label N-D image segmentation bycellular automata. In Proc. Int. Conf .on ComputerGraphics and Vision (GRAPHICON) (2005), 20 – 24June, Akademgorodok, Novosibirsk, Russia,pp. 150 – 156. See http://www.graphicon.ru/oldgr/en/publications/text/gc2005vk.pdf.
28. Canny J. 1987 A computational approach to edgedetection. In Readings in Computer Vision, pp. 184 –203. Amsterdam, The Netherlands: Elsevier.
29. Shrivakshan GT, Chandrasekar C et al. 2012 Acomparison of various edge detection techniquesused in image processing. Int. J. Comput. Sci. Issues9, 272 – 276.
30. Heiberger RM, Holland B. 2015 Statistical analysisand data display: an intermediate course withexamples in R. Berlin, Germany: Springer.
31. Oner M, Kocakoc ID. 2017 A compilation of somepopular goodness of fit tests for normaldistribution: their algorithms and Matlab codes(Matlab). J. Mod. Appl. Stat. Methods 16, 30.
32. Tisue S, Wilensky U. 2004 NetLogo: a simpleenvironment for modeling complexity. In Int.Conf. on Complex Systems, Boston, MA, vol. 21,pp. 16 – 21. See http://www.ccl.sesp.northwestern.edu/papers/netlogo-iccs2004.pdf.
33. Liarte S, Bernabe-Garcıa A, Armero-Barranco D,Nicolas FJ. 2018 Microscopy based methodsfor the assessment of epithelial cell migrationduring in vitro wound healing. J. Vis. Exp. 131,e56799. (doi:10.3791/56799)
34. Zaritsky A, Natan S, Kaplan D, Ben-Jacob E, TsarfatyI. 2015 Live time-lapse dataset of in vitro woundhealing experiments. GigaScience 4, 8. (doi:10.1186/s13742-015-0049-6)