in vitro and ex vivo measurement of the biophysical
TRANSCRIPT

Analyst
CRITICAL REVIEW
Cite this: Analyst, 2018, 143, 2723
Received 6th February 2018,Accepted 11th April 2018
DOI: 10.1039/c8an00231b
rsc.li/analyst
In vitro and ex vivo measurement of thebiophysical properties of blood usingmicrofluidic platforms and animal models†
Yang Jun Kang a and Sang-Joon Lee *b
Haemorheologically impaired microcirculation, such as blood clotting or abnormal blood flow, causes
interrupted blood flows in vascular networks. The biophysical properties of blood, including blood
viscosity, blood viscoelasticity, haematocrit, red blood bell (RBC) aggregation, erythrocyte sedimentation
rate and RBC deformability, have been used to monitor haematological diseases. In this review, we
summarise several techniques for measuring haemorheological properties, such as blood viscosity, RBC
deformability and RBC aggregation, using in vitro microfluidic platforms. Several methodologies for the
measurement of haemorheological properties with the assistance of an extracorporeal rat bypass loop
are also presented. We briefly discuss several emerging technologies for continuous, long-term, multiple
measurements of haemorheological properties under in vitro or ex vivo conditions.
1. Introduction
Negative health behaviours (smoking, physical inactivity, poordiet and inappropriate weight) and factors (cholesterol, blood
pressure and glucose) increase the risk of cardiovascular dis-eases (CVDs).1 CVDs are the leading cause of death inadvanced countries, and they accounted for 31.5% of alldeaths worldwide in 2013.1 CVDs, including stroke, athero-sclerosis, coronary heart disease and myocardial infarction,suddenly occur without any noticeable symptoms and conse-quently lead to serious complications or unexpected deaths. Inparticular, haemorheologically impaired microcirculation(blood clotting or abnormal blood flow) interrupts blood flowsin vascular networks. Biochemical analyses are used to diag-nose CVDs by checking several parameters, including bio-markers, cholesterol, glucose or DNA. However, biochemical
Yang Jun Kang
Yang Jun Kang received his Ph.D.degree in 2011 from the Schoolof Mechatronics of Gwangju,Institute of Science andTechnology, South Korea. Since2014, he has been working asassistant professor in ChosunUniversity, South Korea. Beforehe joined this university, heworked as a research professor inthe Center for Biofluid andBiomimic Research in POSTECH,South Korea. His research inter-ests lie in hemorheological andhemodynamic analyses usingmicrofluidic devices.
Sang-Joon Lee
Sang-Joon Lee received his Ph.D.degree in 1986 from theDepartment of MechanicalEngineering from KAIST, Korea.He joined as a professor inthe Mechanical EngineeringDepartment of POSTECH in1987 and was a director of theCenter for Biofluid andBiomimic Research. He is nowa University Professor atPOSTECH. His research interestslie in biofluid flows, microflui-dics, flow visualization, bio-mimetics, and flow control.
†Electronic supplementary information (ESI) available. See DOI: 10.1039/c8an00231b
aDepartment of Mechanical Engineering, Chosun University, Gwangju, Republic of
KoreabDepartment of Mechanical Engineering, Pohang University of Science and
Technology (POSTECH), Pohang, Republic of Korea. E-mail: [email protected];
Fax: +82-54-279-3199
This journal is © The Royal Society of Chemistry 2018 Analyst, 2018, 143, 2723–2749 | 2723
Publ
ishe
d on
11
Apr
il 20
18. D
ownl
oade
d by
PO
STE
CH
Lib
rary
on
6/5/
2019
2:3
1:57
AM
.
View Article OnlineView Journal | View Issue

analyses do not provide sufficient diagnostic information onvascular blockage or blood clotting in advance. Thus, earlydetection of CVD remains difficult. On the basis of closerelationships between CVDs and haemorheological properties,several research groups recently demonstrated that the haemo-rheological characteristics of blood flows are significantlycorrelated with CVDs.2 Lowe et al.3 statistically reviewed thesignificant association between biophysical properties ofblood [haematocrit, plasma viscosity, blood viscosity anderythrocyte sedimentation rate (ESR)] and coronary heartdisease. Yayan4 reported that the specificity and sensitivity ofESR for coronary heart disease are 70.59% and 67.65%,respectively. Given that the biophysical properties of blood(haematocrit, blood viscosity, plasma viscosity, blood visco-elasticity, RBC aggregation, RBC deformability and ESR)provide valuable information on haematological disorders ordiseases, they have been recommended for use in monitoringor diagnosing patients with CVDs.
In 1952, Copley introduced the word ‘haemorheology’ anddefined it as the study of how blood and blood vessels functionand interact as parts of living organs.5 In other words, haemo-rheology deals with blood flow and deformation of blood cells,blood compositions and blood vessels. Blood is composed ofcell components [red blood cells (RBCs), white blood cells(WBCs), and platelets] and plasma. As shown in Fig. 1, haemo-rheological properties are represented by several factors,including haematocrit (Hct),6,7 cell components (RBCs, WBCsand platelets), cell-free layer,8,9 blood vessel diameter10,11 andplasma proteins. RBCs are strongly related to the biophysicalproperties of blood because they constitute approximately 45%of blood volume. Instead of counting the number of RBCs in aspecific volume, haematocrit, which is defined as the volumeratio of RBCs to the total volume, has been widely used.Secondly, the RBC membrane is made up of a lipid bilayer andhas several tiny gates for the transport of ions, molecules andsignals. This membrane behaves like a mechanical structure
under an external force or stimuli. An individual RBC iselongated and aligned with the shearing blood flow. RBCmembranes exhibit tank-treading or flexible motion.12 Thesurface properties of RBC membranes are crucial in blood vis-cosity determination and RBC aggregation. A high stiffness ofRBC membranes leads to increased blood viscosity ordecreased RBC aggregation. Thirdly, plasma proteins are com-posed of albumin, fibrinogen and immunoglobin. Amongthese plasma proteins, fibrinogen, which participates in clot-ting formation, contributes to RBC aggregation and blood vis-cosity significantly. Haemorheological properties depend onthe molecular weight and morphological structure of plasmaproteins. In addition, inflammations or tissue injuries contrib-ute to changes in plasma proteins.13
Microfluidic platforms possess several advantages, includ-ing small volume consumption, fast response, easy handlingand disposability. Compared with conventional methods, theypresent a strong potential for use in point-of-care testing.Thus, microfluidic platforms have been widely used in haemo-rheological studies on blood. Blood viscosity can be deter-mined by several factors, including haematocrit, plasma vis-cosity, RBC deformability and RBC aggregation. At high shearrates, blood viscosity is determined by the deformation andalignment of RBCs in blood flows. At low shear rates, RBCaggregation contributes to an increase in blood viscosity. In amicrofluidic platform, a blood sample is delivered to a micro-channel with the aid of a syringe pump. Blood viscosity ismeasured under stable flow conditions at shear rates higherthan 10 s−1.14,15 However, at shear rates lower than the saidvalue, a microfluidic viscometer does not provide consistentviscosity values because of unstable flow conditions. Unlikeblood viscosity, RBC aggregation is quantified under quasi-static flow conditions. Specific variations in blood cells orplasma proteins are rarely employed to measure blood vis-cosity because blood viscosity can be determined simul-taneously by several factors. Thus, the measurement of RBCdeformability is fundamentally required for evaluating themechanical properties of individual RBCs.
Three representative properties, namely, blood viscosity,RBC aggregation and RBC deformability, need to be evaluatedindependently when monitoring several haemorheologicalblood factors. In this review, several measurement techniquesfor haemorheological properties (blood viscosity, RBC deform-ability, and RBC aggregation) are categorised and discussedbased on the working principles of microfluidic platforms (i.e.in vitro) and the use of animal disease models (i.e. ex vivo).
2. In vitro haemorheological studyusing microfluidic devices2.1 Measurement of blood viscosity using a microfluidic device
Blood viscosity is the most important property for characteris-ing blood samples.16 As a representative biomarker, blood vis-cosity has been used to monitor haematological diseases effec-tively. It is also an essential parameter in the evaluation of wall
Fig. 1 Overview of quantitative measurements of haemorheologicalproperties using microfluidic platforms and disease animal models.Haemorheological properties are determined using several factors,including haematocrit, white blood cell rheology, platelet activation,cell-free layer, vessel diameter and plasma proteins. Among them, bloodviscosity, red blood cell (RBC) deformability and RBC aggregation aremainly used for the early detection of cardiovascular diseases. In thisreview, several measurement techniques based on microfluidic plat-forms (i.e. in vitro) or animal disease models (i.e. in vivo or ex vivo) usedfor quantifying haemorheological properties are categorised and dis-cussed based on their working principles.
Critical Review Analyst
2724 | Analyst, 2018, 143, 2723–2749 This journal is © The Royal Society of Chemistry 2018
Publ
ishe
d on
11
Apr
il 20
18. D
ownl
oade
d by
PO
STE
CH
Lib
rary
on
6/5/
2019
2:3
1:57
AM
. View Article Online

shear stress that acts on vascular endothelial cells.17 Dissolvedgases and nutrients are exchanged through microcirculationfrom narrow-sized capillary vessels to peripheral tissues andvice versa. Blood viscosity decreases at high shear rates due tothe elongation and alignment of RBCs along the flow direction.RBCs easily pass through narrow-sized capillary vessels becausethe high deformability of RBCs reduces hydraulic resistance inblood vessels. However, blood viscosity increases at low shearrates due to RBC aggregation, which is significantly enhancedby several factors, including surface property of the RBC mem-brane, plasma proteins and haematocrit. Blood behaves as ashear-thinning fluid because blood viscosity decreases with anincrease in shear rates. Haematocrit also contributes signifi-cantly to an increase in blood viscosity. Thus, blood viscosity ismeasured at a fixed haematocrit. Blood temperature andplasma proteins are also crucial in the measurement of bloodviscosity. Blood viscosity has been clinically used in the diagno-sis of haematological disorders or hyper-viscosity syndromes,including hypertension,18,19 diabetes,20 Alzheimer’s disease,21
stroke,22 coronary artery disease,23 atherosclerosis24,25 and myo-cardial infarction.26 In this section, several microfluidic-basedplatform techniques for evaluating fluid viscosity are reviewedand summarised in Table 1.
2.1.1 Microfluidic comparator with co-flowing streams.Quake et al.27 proposed a comparator channel to measure thepressure drop in a microfluidic nonlinear resistor. The micro-fluidic device possessed nonlinear and control channels. Both
channels were connected by a comparator channel. After sup-plying two fluids to the two side channels, the nonlinearrelationship between the flow rate and the pressure drop wasevaluated by monitoring the interface of the two fluids in thecomparator channel. Stone et al.28 proposed a differentialmanometer for measuring dynamic variations in pressuredrop in a microfluidic channel [Fig. 2A-(a)]. The microfluidicdevice was composed of twin channels (i.e. test and control)connected by a comparator channel. The twin channels hadrectangular cross sections (width = 5 µm and depth = 5 µm).The control fluid that flowed through the control channel wasdyed to visualise the interfacial location of the two fluids inthe comparator channel. A test fluid was prepared by addingRBCs to a specific solution. Using precise pressure controlunits, the test and control fluids were simultaneously suppliedto the test and control channels, respectively. The pressuredrop in the test channel changed the interfacial positionbetween the two fluids in the comparator channel. Thus, thepressure drop in the test channel was quantified by monitor-ing the interfacial location in the comparator channel. Thedifferential manometer was demonstrated to be effective inmeasuring the pressure drop related to the flow of RBCs, rigi-dified RBCs and haemolysis in the test channel.
Mugele et al.29 established a unique power-law scalingrelationship between interface displacement and pressuredrop in a microfluidic comparator. The scaling exponent wasincreased from 0.51 (for a square channel) to 0.93 (for a wide
Table 1 Summary of microfluidic-based techniques for measuring fluid viscosity
Principle Measurement quantity Test fluid Comment Ref.
Co-flowing streams Interfacial location Non-Newtonian (PEO,CpCl-NaSal)
Image processing 31 and 33Conductivity measurement
Interfacial location Non-Newtonian (PEO) Image processing 32Multiple shear rates
Interfacial location Non-Newtonian (PAA,PEO)
Image processing 35 and 36Three fluid streams
Flow rate for relocating the interface tothe centre channel
Newtonian (BSA) Flow rate control with asyringe pump
37
Microfluidic flowcompartment
Number of channels filled with testfluid in single microfluidic channelarray
Non-Newtonian (Blood) Digital counting 14 and 38Single microfluidic channelarrayTemperature control
Number of channels filled with testfluid in 10 microfluidic channel arrays
Non-Newtonian (Blood) Digital counting 39Multiple shear rates with10 microfluidic channel arrays
Reversal flow switchingmanipulation
Flow rate for inducing reversal flow inbridge channel
Non-Newtonian (Blood) Flow rate control with asyringe pump
15
Integrated sensor Pressure drop at constant flow ratewith a syringe pump
Non-Newtonian(Xanthan, PEO)
Bulk-sized pressure sensor 45, 47, 48 and 49MEMS pressure sensorLiquid metal-based sensor
Flow rate at constant pressure drop Newtonian(Monoclonal antibody)
Bulk-sized flow meter 46
Advancing meniscus Mean velocity Newtonian (Plasma) Image processing 50, 51, 53 and 54Non-Newtonian (Blood) Glass or PDMS channel
Self-calibration with DI waterFlow rate under pressure control Newtonian (BSA,
Glycerin)Smartphone-based imaging 55
Flow rate with a hand-held pipette Non-Newtonian (Blood) Smartphone-based imaging 56Film with scale
Electrical impedance Electric resistance Newtonian (Plasma) Electrical impedancemeasurement
57Non-Newtonian (Blood)
Analyst Critical Review
This journal is © The Royal Society of Chemistry 2018 Analyst, 2018, 143, 2723–2749 | 2725
Publ
ishe
d on
11
Apr
il 20
18. D
ownl
oade
d by
PO
STE
CH
Lib
rary
on
6/5/
2019
2:3
1:57
AM
. View Article Online

channel). They integrated the microfluidic comparator into aT-junction and measured the pressure drop resulting from theconfined movement of droplets in rectangular channels30
[Fig. 2A-(b)]. Using the microfluidic comparator channel, theyinvestigated the effects of drop size, droplet viscosity and capil-lary number on hydrodynamic flow resistance.
Colin et al.31 utilised a microfluidic comparator to measurefluid viscosity. Parallel co-flowing streams in the microfluidiccomparator (width = 200 μm and depth = 100 μm) were used[Fig. 2A-(c)]. The channel width occupied by each fluid streamdepends on flow rate and fluid viscosity. Thus, the fluid vis-cosity of a test fluid (unknown viscosity, μT) with respect to the
reference fluid (known viscosity, μR) was measured by monitor-ing the channel width occupied by each fluid with varying theflow rate ratio of the reference fluid to the test fluid (i.e.μT/μR = [WT/WR]·[QR/QT]). The researchers used this micro-fluidic platform to measure the viscosities of a Newtonianfluid (oil) and a non-Newtonian fluid (PEO) for a wide range ofshear rates. Compared with a conventional viscometer, themicrofluidic comparator enables the measurement of fluidviscosity with a measurement accuracy of 20% error. Vanapalliet al.32 proposed a multiplexed microfluidic comparator forthe simultaneous measurement of fluid viscosity at variousshear rates. The multiplexed microfluidic comparator was
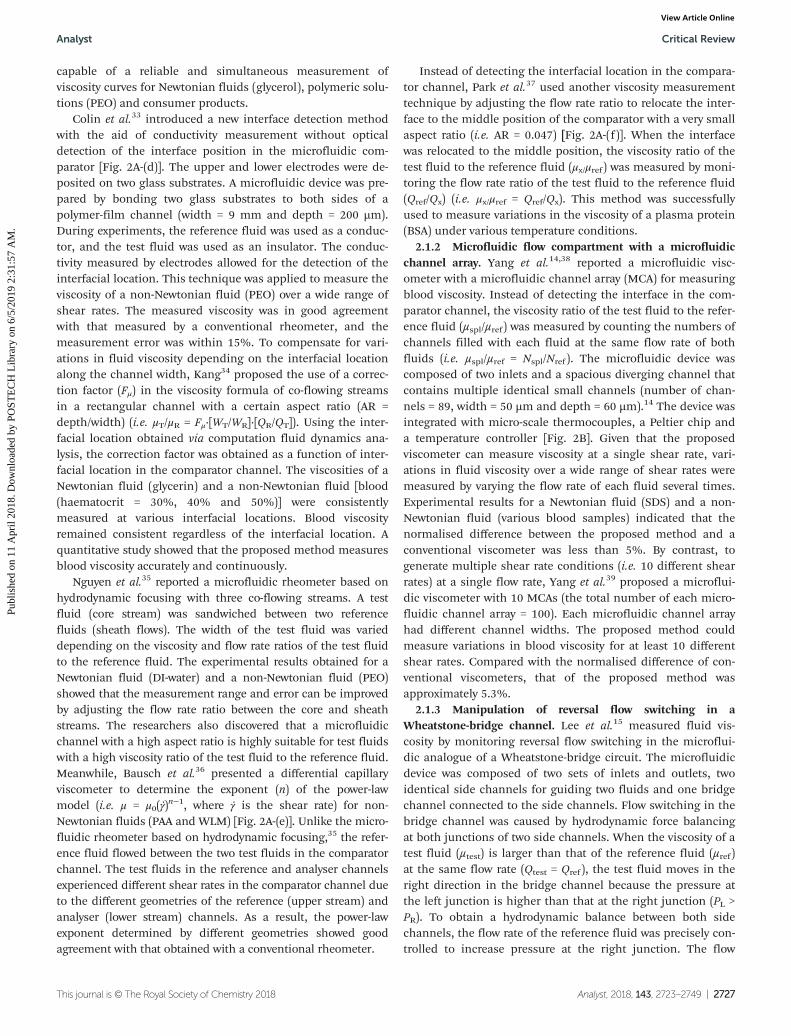
Fig. 2 Microfluidic-based viscosity measurement techniques that utilise the principles of a microfluidic comparator, a microfluidic flow compart-ment, and reversal flow switching manipulation. (A) A microfluidic comparator is used to measure the variations in pressure drop produced by (a) asingle RBC28 and (b) a single moving droplet.30 (c) The fluid viscosity ratio of a test fluid to a reference fluid is quantified by monitoring the channelwidth (WT, WR) occupied by each fluid stream in a single channel.32 (d) Interface detection by monitoring the conductivity of parallel flows betweenconductive and non-conductive fluids.33 (e) Measurement of the fluid viscosity of a non-Newtonian fluid using three flowing streams.36
(f ) Interfacial relocation to the centre line by controlling the flow rate of each fluid.37 (B) Measurement of blood viscosity by monitoring the numberof channels filled with two fluids in a single microfluidic channel array.14 (C) Measurement of blood viscosity using reversal flow switching manipu-lation in a Wheatstone-bridge channel.15 (a) Flow switching manipulation in the bridge channel with varying flow rates of the reference fluid.(b) Blood flow in the bridge channel is reversely moved at a specific flow rate ratio of Qs
ref/Qtest = 2.37. Reproduced from ref. 14, 15, 28, 30, 32, 33,36, and 37 with permission from Springer, AIP Publishing, National Academy of Sciences, Royal Society of Chemistry, and WILEY-VCH.
Critical Review Analyst
2726 | Analyst, 2018, 143, 2723–2749 This journal is © The Royal Society of Chemistry 2018
Publ
ishe
d on
11
Apr
il 20
18. D
ownl
oade
d by
PO
STE
CH
Lib
rary
on
6/5/
2019
2:3
1:57
AM
. View Article Online
capable of a reliable and simultaneous measurement ofviscosity curves for Newtonian fluids (glycerol), polymeric solu-tions (PEO) and consumer products.
Colin et al.33 introduced a new interface detection methodwith the aid of conductivity measurement without opticaldetection of the interface position in the microfluidic com-parator [Fig. 2A-(d)]. The upper and lower electrodes were de-posited on two glass substrates. A microfluidic device was pre-pared by bonding two glass substrates to both sides of apolymer-film channel (width = 9 mm and depth = 200 µm).During experiments, the reference fluid was used as a conduc-tor, and the test fluid was used as an insulator. The conduc-tivity measured by electrodes allowed for the detection of theinterfacial location. This technique was applied to measure theviscosity of a non-Newtonian fluid (PEO) over a wide range ofshear rates. The measured viscosity was in good agreementwith that measured by a conventional rheometer, and themeasurement error was within 15%. To compensate for vari-ations in fluid viscosity depending on the interfacial locationalong the channel width, Kang34 proposed the use of a correc-tion factor (Fμ) in the viscosity formula of co-flowing streamsin a rectangular channel with a certain aspect ratio (AR =depth/width) (i.e. μT/μR = Fμ·[WT/WR]·[QR/QT]). Using the inter-facial location obtained via computation fluid dynamics ana-lysis, the correction factor was obtained as a function of inter-facial location in the comparator channel. The viscosities of aNewtonian fluid (glycerin) and a non-Newtonian fluid [blood(haematocrit = 30%, 40% and 50%)] were consistentlymeasured at various interfacial locations. Blood viscosityremained consistent regardless of the interfacial location. Aquantitative study showed that the proposed method measuresblood viscosity accurately and continuously.
Nguyen et al.35 reported a microfluidic rheometer based onhydrodynamic focusing with three co-flowing streams. A testfluid (core stream) was sandwiched between two referencefluids (sheath flows). The width of the test fluid was varieddepending on the viscosity and flow rate ratios of the test fluidto the reference fluid. The experimental results obtained for aNewtonian fluid (DI-water) and a non-Newtonian fluid (PEO)showed that the measurement range and error can be improvedby adjusting the flow rate ratio between the core and sheathstreams. The researchers also discovered that a microfluidicchannel with a high aspect ratio is highly suitable for test fluidswith a high viscosity ratio of the test fluid to the reference fluid.Meanwhile, Bausch et al.36 presented a differential capillaryviscometer to determine the exponent (n) of the power-lawmodel (i.e. μ = μ0(γ̇)
n−1, where γ̇ is the shear rate) for non-Newtonian fluids (PAA and WLM) [Fig. 2A-(e)]. Unlike the micro-fluidic rheometer based on hydrodynamic focusing,35 the refer-ence fluid flowed between the two test fluids in the comparatorchannel. The test fluids in the reference and analyser channelsexperienced different shear rates in the comparator channel dueto the different geometries of the reference (upper stream) andanalyser (lower stream) channels. As a result, the power-lawexponent determined by different geometries showed goodagreement with that obtained with a conventional rheometer.
Instead of detecting the interfacial location in the compara-tor channel, Park et al.37 used another viscosity measurementtechnique by adjusting the flow rate ratio to relocate the inter-face to the middle position of the comparator with a very smallaspect ratio (i.e. AR = 0.047) [Fig. 2A-(f )]. When the interfacewas relocated to the middle position, the viscosity ratio of thetest fluid to the reference fluid (μx/μref ) was measured by moni-toring the flow rate ratio of the test fluid to the reference fluid(Qref/Qx) (i.e. μx/μref = Qref/Qx). This method was successfullyused to measure variations in the viscosity of a plasma protein(BSA) under various temperature conditions.
2.1.2 Microfluidic flow compartment with a microfluidicchannel array. Yang et al.14,38 reported a microfluidic visc-ometer with a microfluidic channel array (MCA) for measuringblood viscosity. Instead of detecting the interface in the com-parator channel, the viscosity ratio of the test fluid to the refer-ence fluid (µspl/µref ) was measured by counting the numbers ofchannels filled with each fluid at the same flow rate of bothfluids (i.e. µspl/µref = Nspl/Nref ). The microfluidic device wascomposed of two inlets and a spacious diverging channel thatcontains multiple identical small channels (number of chan-nels = 89, width = 50 µm and depth = 60 µm).14 The device wasintegrated with micro-scale thermocouples, a Peltier chip anda temperature controller [Fig. 2B]. Given that the proposedviscometer can measure viscosity at a single shear rate, vari-ations in fluid viscosity over a wide range of shear rates weremeasured by varying the flow rate of each fluid several times.Experimental results for a Newtonian fluid (SDS) and a non-Newtonian fluid (various blood samples) indicated that thenormalised difference between the proposed method and aconventional viscometer was less than 5%. By contrast, togenerate multiple shear rate conditions (i.e. 10 different shearrates) at a single flow rate, Yang et al.39 proposed a microflui-dic viscometer with 10 MCAs (the total number of each micro-fluidic channel array = 100). Each microfluidic channel arrayhad different channel widths. The proposed method couldmeasure variations in blood viscosity for at least 10 differentshear rates. Compared with the normalised difference of con-ventional viscometers, that of the proposed method wasapproximately 5.3%.
2.1.3 Manipulation of reversal flow switching in aWheatstone-bridge channel. Lee et al.15 measured fluid vis-cosity by monitoring reversal flow switching in the microflui-dic analogue of a Wheatstone-bridge circuit. The microfluidicdevice was composed of two sets of inlets and outlets, twoidentical side channels for guiding two fluids and one bridgechannel connected to the side channels. Flow switching in thebridge channel was caused by hydrodynamic force balancingat both junctions of two side channels. When the viscosity of atest fluid (µtest) is larger than that of the reference fluid (µref )at the same flow rate (Qtest = Qref ), the test fluid moves in theright direction in the bridge channel because the pressure atthe left junction is higher than that at the right junction (PL >PR). To obtain a hydrodynamic balance between both sidechannels, the flow rate of the reference fluid was precisely con-trolled to increase pressure at the right junction. The flow
Analyst Critical Review
This journal is © The Royal Society of Chemistry 2018 Analyst, 2018, 143, 2723–2749 | 2727
Publ
ishe
d on
11
Apr
il 20
18. D
ownl
oade
d by
PO
STE
CH
Lib
rary
on
6/5/
2019
2:3
1:57
AM
. View Article Online

direction of the reference fluid was reversed towards the leftdirection at a specific flow rate ratio (QS
ref /Qtest). Then, the vis-cosity ratio of the test fluid to the reference fluid was measuredby monitoring the specific flow rate ratio (i.e. µtest/µref = QS
ref /Qtest) [Fig. 2C-(a)]. To demonstrate the performance of the pro-posed method, blood with haematocrit = 50% (test fluid) and1× PBS (reference fluid) were simultaneously supplied to eachinlet of the microfluidic device by using two syringe pumps. Ata specific flow rate ratio of QS
ref /Qtest = 2.37, the test fluid rever-sely flowed from the right direction (i.e. Qtest = Qref ) to the leftdirection in the bridge channel. By monitoring the reversalflow switching in the bridge channel, the viscosity ratio of thetest blood to the reference fluid was quantified as µtest/µref =2.37 [Fig. 2C-(b)]. The proposed method was then employed tomeasure the viscosity of Newtonian fluids (glycerin and oil).The normalised difference in viscosity measured by the pro-posed method was 6.5% less than that obtained by a conven-tional method. In addition, blood viscosity was successfullymeasured for blood samples with different haematocrit, RBCmembrane fixation and channel width of both side channels.This reversal flow switching method was successfully utilisedto evaluate the relationship between velocity profile and bloodviscosity40 and measure the blood viscoelasticity41 and bloodviscosity of blood circulating in a rat bypass loop.42–44
2.1.4 Integrated sensor-based measurement of fluid vis-cosity. Using the pressure drop measured by a pressure trans-ducer installed in the microfluidic channel (width = 150 µmand depth = 150 µm),45 the fluid viscosity at a specific flowrate has been estimated using the Hagen–Poiseuille equation(i.e. pressure drop (ΔP) = fluidic resistance [Rf ]·flow rate [Q]).To evaluate polymer degradation, the viscosity of a PEO solu-tion as a non-Newtonian fluid was measured at a high shearrate of 106 s−1.
Migler et al.46 used a micro-capillary viscometer to charac-terise the kinematic behaviour of protein solutions. The visco-meter consisted of two pressure chambers connected by apolyethylene tube via an external flow rate meter. By measur-ing the flow rate under precise pressure-difference control, theviscosity of a test fluid was evaluated via an analytical formula.The micro-capillary viscometer was used to measure the vis-cosity of a monoclonal antibody as a function of the shearrate, protein concentration and temperature.
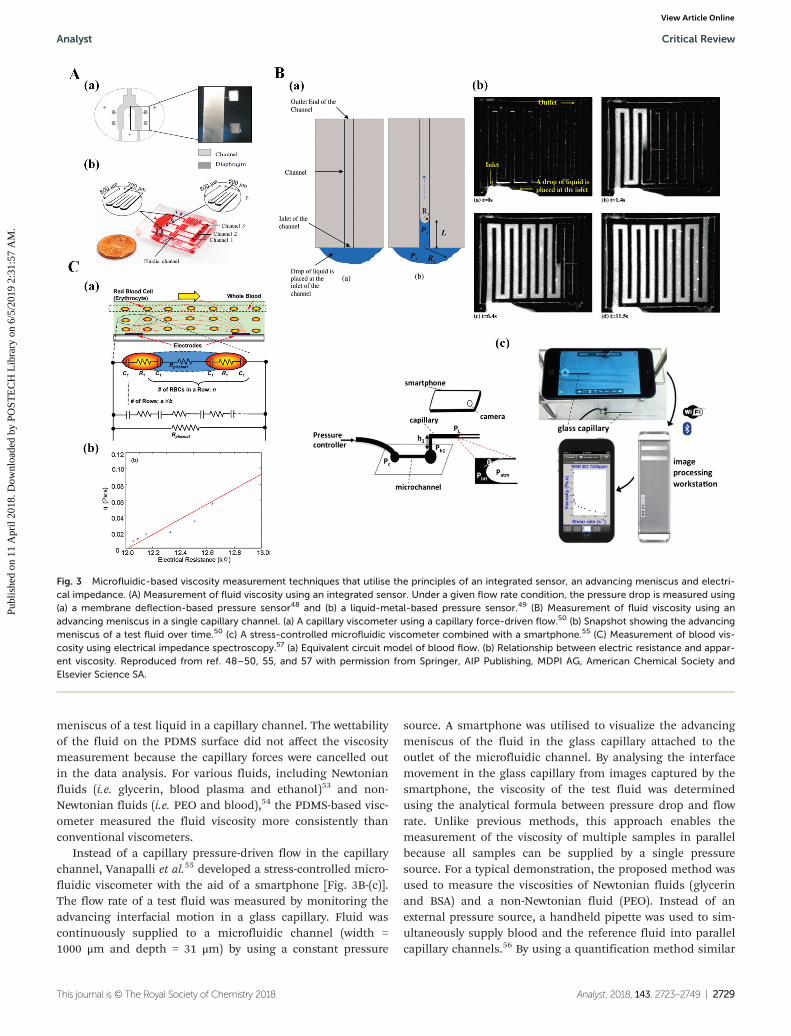
To measure the pressure drop in a microfluidic channelusing three integrated pressure sensors, McKinley et al.47 uti-lised a high-shear-rate viscometer to measure the viscosity ofcomplex fluids at a high shear rate of 80 000 s−1. The micro-fluidic device was fabricated from Pyrex mounted on a gold-coated silicon with MEMS-based pressure sensors (width =800 μm and depth = 800 µm). Similarly, Ayela et al.48 used acapillary rheometer to measure the viscosity of silicon oil overa broad range of shear rates. The viscometer was composed ofan anodic bonded silicon–Pyrex derivative microfluidicchannel equipped with local electrodes [Fig. 3A-(a)].
Yang et al.49 used a liquid metal-based pressure sensor[Fig. 3A-(b)]. The integrated pressure sensor in the microfluidicdevice was composed of three polydimethylsiloxane (PDMS)
layers, namely, a microfluidic channel for fluid flow (lowerlayer), a thin film (separation layer) and an electrical-resistancechannel (upper channel). The electrical-resistance channel wasfilled with Galinstan as a liquid metal. The pressure that devel-oped in the microfluidic channel decreased the cross-sectionalarea of the electrical-resistance channel, which in turn led toan increase in electrical resistance. The pressure at a specificposition in the microfluidic channel was evaluated by measur-ing the variations in electric resistance. The variations in elec-trical resistance were determined for given pressure conditionsby using an analogue circuit that included a Wheatstone-bridge circuit and an operational amplifier. To use the liquidmetal-based pressure sensor, its calibration curve was obtainedby varying the pressure from 0 kPa to 230 kPa for deionizedwater. The viscosity of a test fluid that flowed through a micro-fluidic channel with a rectangular shape was estimated byusing the Hagen–Poiseuille relation for a specific flow rate.The proposed method was applied to measure the viscositiesof a Newtonian fluid (SDS) and a non-Newtonian fluid (PEO).The normalised difference between the proposed method anda conventional viscometer was less than 7%.
2.1.5 Advancing meniscus in a single capillary channel.Burns et al.50,51 used a self-calibrated microfluidic capillaryviscometer to measure fluid viscosity with a capillary force-driven flow. The capillary viscometer was created by bonding aglass channel to a silicon substrate. The glass channel wasetched to have a rectangular cross-sectional shape (width =340 µm, depth = 35 µm) [Fig. 3B-(a)]. When a small drop ofliquid (0.6 µL) was placed at the inlet of the microfluidicchannel, the difference in the advancing meniscus (R2) andthe receding meniscus (R1) induced a capillary pressure differ-ence. This capillary pressure difference made the liquid moveas time elapsed [Fig. 3B-(b)]. An analytical study indicated thatfluid viscosity (µ) can be determined as functions of surfacetension, contact angle and channel geometry. In other words,prior knowledge of surface tension, contact angle and channelgeometry is required to evaluate fluid viscosity. In addition,variations in surface tension, contact angle and channel geo-metry can reduce measurement accuracy. To solve these pro-blems, a self-calibrated microfluidic viscometer comprisingtwo identical parallel channels was recommended. The rec-ommended viscometer could accurately measure the viscosityof test fluids by eliminating the effects of surface tension,contact angle and channel geometry on measurement accu-racy. In a demonstration, the viscosities of biofluids (urine andblood plasma) as Newtonian fluids were accurately measuredwith a 3% error compared with a conventional viscometer.50
The self-calibrating viscometer could also accurately measurethe viscosity of non-Newtonian fluids, including PEO, xanthangum and hydrolysed polyacrylamide.51 Furthermore, the vis-cosity of a test fluid was automatically measured by monitor-ing the advancing meniscus in the channel through the use ofthree droplet sensing techniques, namely, a digital electrode,an analogue electrode and a thermal electrode.52
To replace expensive silicon-glass devices, Zheng et al.53,54
introduced a PDMS viscometer for monitoring the advancing
Critical Review Analyst
2728 | Analyst, 2018, 143, 2723–2749 This journal is © The Royal Society of Chemistry 2018
Publ
ishe
d on
11
Apr
il 20
18. D
ownl
oade
d by
PO
STE
CH
Lib
rary
on
6/5/
2019
2:3
1:57
AM
. View Article Online
meniscus of a test liquid in a capillary channel. The wettabilityof the fluid on the PDMS surface did not affect the viscositymeasurement because the capillary forces were cancelled outin the data analysis. For various fluids, including Newtonianfluids (i.e. glycerin, blood plasma and ethanol)53 and non-Newtonian fluids (i.e. PEO and blood),54 the PDMS-based visc-ometer measured the fluid viscosity more consistently thanconventional viscometers.
Instead of a capillary pressure-driven flow in the capillarychannel, Vanapalli et al.55 developed a stress-controlled micro-fluidic viscometer with the aid of a smartphone [Fig. 3B-(c)].The flow rate of a test fluid was measured by monitoring theadvancing interfacial motion in a glass capillary. Fluid wascontinuously supplied to a microfluidic channel (width =1000 μm and depth = 31 μm) by using a constant pressure
source. A smartphone was utilised to visualize the advancingmeniscus of the fluid in the glass capillary attached to theoutlet of the microfluidic channel. By analysing the interfacemovement in the glass capillary from images captured by thesmartphone, the viscosity of the test fluid was determinedusing the analytical formula between pressure drop and flowrate. Unlike previous methods, this approach enables themeasurement of the viscosity of multiple samples in parallelbecause all samples can be supplied by a single pressuresource. For a typical demonstration, the proposed method wasused to measure the viscosities of Newtonian fluids (glycerinand BSA) and a non-Newtonian fluid (PEO). Instead of anexternal pressure source, a handheld pipette was used to sim-ultaneously supply blood and the reference fluid into parallelcapillary channels.56 By using a quantification method similar
Fig. 3 Microfluidic-based viscosity measurement techniques that utilise the principles of an integrated sensor, an advancing meniscus and electri-cal impedance. (A) Measurement of fluid viscosity using an integrated sensor. Under a given flow rate condition, the pressure drop is measured using(a) a membrane deflection-based pressure sensor48 and (b) a liquid-metal-based pressure sensor.49 (B) Measurement of fluid viscosity using anadvancing meniscus in a single capillary channel. (a) A capillary viscometer using a capillary force-driven flow.50 (b) Snapshot showing the advancingmeniscus of a test fluid over time.50 (c) A stress-controlled microfluidic viscometer combined with a smartphone.55 (C) Measurement of blood vis-cosity using electrical impedance spectroscopy.57 (a) Equivalent circuit model of blood flow. (b) Relationship between electric resistance and appar-ent viscosity. Reproduced from ref. 48–50, 55, and 57 with permission from Springer, AIP Publishing, MDPI AG, American Chemical Society andElsevier Science SA.
Analyst Critical Review
This journal is © The Royal Society of Chemistry 2018 Analyst, 2018, 143, 2723–2749 | 2729
Publ
ishe
d on
11
Apr
il 20
18. D
ownl
oade
d by
PO
STE
CH
Lib
rary
on
6/5/
2019
2:3
1:57
AM
. View Article Online

to that proposed by Vanapalli et al.,55 the researchersmeasured blood viscosity over various shear rates.
2.1.6 Electric impedance-based blood measurement. Zhaoet al.57 examined the rheological properties of blood in amicrofluidic channel. The rheological behaviour of blood wasevaluated by measuring electrical impedance (resistor andcapacitor) via electrical impedance spectroscopy. As illustratedin Fig. 3C-(a), blood was modelled as a discrete circuitnetwork. An individual RBC was represented by two capacitorsand one resistor connected in series.58 However, blood plasmawas only modelled as a resistor. Two microelectrodes (width =500 µm, thickness = 0.5 µm and interspace = 500 µm) were pat-terned on the bottom surface of the microchannel (width =500 µm and depth = 500 µm). The electrodes were extendedover the entire width of the microfluidic channels. The electri-cal impedance of blood flow was measured by sweeping the sti-mulating frequency in the range of 1 Hz to 100 kHz. The elec-trical resistance of blood plasma remained constant over awide range of shear rates. The electrical resistance varied byless than 2%. Fig. 3C-(b) shows the relationship between elec-trical resistance and fluid viscosity. Regression analysis of therelationship between blood viscosity and electrical resistancerevealed a high correlation coefficient (i.e., R2 = 0.935). Thus,the electrical impedance-based rheometer has potential foruse in determining the rheological properties of bloodsamples.
2.1.7 Discussion on blood viscosity techniques. As sum-marised in Table 1, several measurement techniques havebeen developed to measure the shearing viscosity of variousNewtonian or non-Newtonian fluids. The microfluidic flowcompartment method, the reversal flow switching manipu-lation method and the co-flowing stream method canmeasure the viscosity of various blood specimens over a widerange of shear rates. First, the microfluidic flow compartmentmethod can measure blood viscosity by counting the numberof channels filled with blood in a label-free and sensor-lessmanner. However, the measurement accuracy of the methoddecreases when many channels are filled with blood (i.e. highviscosity ratio of blood to the reference fluid). In addition,clogging of cells and bubbles (air or oxygen) hinders the accu-rate measurement of blood viscosity.59 Two precise syringepumps are required to control two fluids at constant flowrates. Image acquisition with a microscope or a high-speedcamera is also required to count the number of channelsfilled with blood.
Second, the reversal flow switching manipulation methodcan monitor the reversal of flow direction by varying the flowrate of the reference fluid using a syringe pump. Measurementaccuracy depends largely on the performance of the syringepump. An air compliance unit60 is adopted to consistentlydeliver blood and reference fluid at consistent flow rates.Critical issues, including clogging of cells and the presence ofbubbles, can be minimised using a simple H-shaped channel.Compared with the microfluidic flow compartment method,the reversal flow switching manipulation method can evaluateblood viscosity within a specific duration of time. However,
difficulties arise when this method is used to continuouslymeasure blood viscosity.
The co-flowing stream method can be considered a promis-ing alternative for measuring blood viscosity in a continuousand label-free manner. Given that this method adopts a widerectangular channel with a very small aspect ratio, criticalissues, including clogging of cells and the presence ofbubbles, can be resolved. Furthermore, when two syringepumps are removed using a hand-held pipette56 or an air-com-pressed syringe,61 the method might present a high potentialfor use in clinical settings. If the co-flowing stream methodincludes a correction factor (i.e. a modified parallel flowmethod),62 blood viscosity could be measured reliably and con-tinuously under ex vivo conditions.
2.2 Measurement of RBC deformability using a microfluidicdevice
Given that the characteristic length scale of a microfluidicchannel is similar to that of cells, a microfluidic device isconsidered a promising platform for probing mechanical bio-markers.63 Compared with conventional biochemical bio-markers, the mechanical biomarkers in a microfluidicdevice possess several advantages, including being label-free,high throughput and potential cost-effectiveness. Variousapproaches, including micropipette aspiration, cell transitanalysis, optical stretching and atomic force microscopy, havebeen recommended to measure the mechanical properties(i.e. viscoelasticity, Young’s modulus and viscosity) of individ-ual cells.64 Blood viscosity significantly varies depending onseveral factors, including haematocrit, plasma proteins, RBCdeformability and RBC aggregation. Therefore, changes inindividual RBCs are not effectively detected by measuringblood viscosity. RBC deformability has recently elicited con-siderable attention as an effective means of evaluating vari-ations in individual RBCs. RBC deformability is determinedby several factors, such as membrane cytoskeleton, membraneintegral proteins, cytoplasmic viscosity and the ratio ofsurface area to volume.65 Given their high deformability,normal RBCs easily pass through a narrow-sized capillary.However, the membrane flexibility of each RBC is reducedbecause of cytoskeleton disorders, invasion of cancer cellsand activation of antigens.64 A slight decrease in RBC deform-ability results in increased blood viscosity and fluidic resis-tance in the microvasculature. Thus, RBC deformability canbe utilised as a promising biomarker for detecting varioushaematological disorders, including malaria, sepsis, diabetesand sickle cell anaemia. In addition, it has a high potentialfor detecting biological heterogeneity and inherent variationsin cell populations. This section focuses on several tech-niques that can characterise RBC deformability by usingmicrofluidic platforms. Several methods for measuring RBCdeformability using microfluidic platforms are summarisedin Table 2.
2.2.1 Cell blockage in microfluidic channels. To character-ise the dynamic behaviours of individual cells, a microfluidicdevice was used in a previous study to examine multicellular
Critical Review Analyst
2730 | Analyst, 2018, 143, 2723–2749 This journal is © The Royal Society of Chemistry 2018
Publ
ishe
d on
11
Apr
il 20
18. D
ownl
oade
d by
PO
STE
CH
Lib
rary
on
6/5/
2019
2:3
1:57
AM
. View Article Online

capillary blockages.66 Fig. 4A-(a) shows the microfluidicchannel with a constricted segment. Normal RBCs passedthrough a 2 µm constriction. However, malaria-infected RBCs(i.e. schizont form) were blocked by a 6 µm constriction. Thisresult implies that a microfluidic device can be used as ananalytical tool to investigate the dynamic behaviours of RBCsunder capillary-flow conditions.
As illustrated in Fig. 4A-(b), RBCs with impaired deform-ability were blocked in capillaries. Wang et al.67 used a discretecircuit model to analyse variations in physical properties incapillaries caused by the clogging of RBCs. Experimental dem-onstrations and theoretical analysis demonstrated that themicrofluidic capillary network can effectively measure RBCdeformability.
Rathod et al.68 suggested the concept of minimum cylinderdiameter (MCD) for determining the filterability of individualRBCs in microfluidic channels. As shown in Fig. 4A-(c), indi-vidual RBCs were trapped in wedge-shaped microfluidic chan-nels. Then, MCD was calculated from the surface area andvolume of RBCs trapped in the channels. The histogram ofMCD measurement data indicated a distinctive differencebetween malaria-infected RBCs (i.e. MCD = 3.26 ± 0.32 µm)and normal RBCs (i.e. MCD = 2.64 ± 0.17 µm). The resultshowed that the MCD calculated from the surface area andvolume of the RBCs trapped in the microfluidic channels canbe effectively used to distinguish malaria-infected RBCs.
Theodoly et al.69 presented a microfluidic gradual filter forseparating cells by using cell deformability. As shown inFig. 4A-(d), the microfluidic filter was composed of twodifferent heights (i.e. blue for 14 µm and red for 4 µm). Thecross section of the filter channel was along the flow direction.When cells entered the gradual filter, the red-labelled rigidcells and green-labelled normal cells were distinctively separ-ated. The cells trapped in the gradual filter were clearly separ-ated by cell stiffness (or deformability) at a low throughput of100 cells per injection.
2.2.2 Cell aspiration in microfluidic channels. Yue et al.70
proposed the use of instantaneous Young’s modulus(Einstantaneous) for characterising single cells in suspension. Asshown in Fig. 4B-(a), a single cell was aspirated continuouslyin a straight constriction channel, and the cellular entryprocess was monitored with a high-speed camera. Microscopicimages showed the cellular entry process into the constrictionchannel, including (stage I) instantaneous jumping into thechannel that can be quantified by instantaneous aspirationlength (Linstantaneous), (stage II) a gradual increase in aspirationlength and (stage III) transitional position represented by tran-sitional aspiration length (Ltransitional). Numerical analysisshowed that the aspiration lengths (Linstantaneous andLtransitional) were reversely proportional to instantaneousYoung’s modulus. Using this method, the Einstantaneous of twolung tumour cells, A549 and 95C, was measured. As depicted
Table 2 Summary of microfluidic-based techniques for measuring RBC deformability
Principle Measurement quantity Test cell Comment Ref.
Cell blockage Minimum cylinder diameter (MCD) Malaria-infected RBCs Tapered channel 68Single cellLow throughput
Clogging Malaria-infected RBCs Single channel 66Hardened RBCs Capillary network 67Monocytic THP-1 Gradual filters 69
Low throughputCell aspiration Young’s modulus (aspiration length) Lung tumours (A549,
95C)Straight channel 70
Cortical tension Malaria-infected RBCs Funnel-shaped channel 71Cell transit Deformability index RBC, WBC Hyperbolic converging channel 73
Cell margination Malaria-infected RBCs Single channel 74Transit time RBC, neutrophil Parallel capillary network 75
HL60 myeloid leukemiaEntry time, flow speed and celldeformation
K562 leukemia Parallel micro-sized constriction 76 and 77
RBC velocity Hardened RBCs Capillary network 79RBC velocity Malaria-infected RBCs Triangular-shaped pillar channels 78Cell lysis Hardened RBCs Four filters with different orifice
lengths80
Deformability-based sorting Malaria-infected RBCs Microfluidic with tapered channels 55 and 81RBC, WBC, CTC High throughput
Blood velocity Malaria-infected RBCs Multiple micro pillars 62, 65 and83Image intensity Hardened RBCs High throughput
Constant or pulsatile blood flowOptical stretcher Cell elongation Malaria-infected RBCs Strain model with 84
Kelvin-Voigt modelLow throughput
Electricimpedance
Transit time RBC, WBC Single cell 86Impedance (magnitude, phase)Impedance (magnitude, phase) Malaria-infected RBCs Single cell 85
Low throughput
Analyst Critical Review
This journal is © The Royal Society of Chemistry 2018 Analyst, 2018, 143, 2723–2749 | 2731
Publ
ishe
d on
11
Apr
il 20
18. D
ownl
oade
d by
PO
STE
CH
Lib
rary
on
6/5/
2019
2:3
1:57
AM
. View Article Online
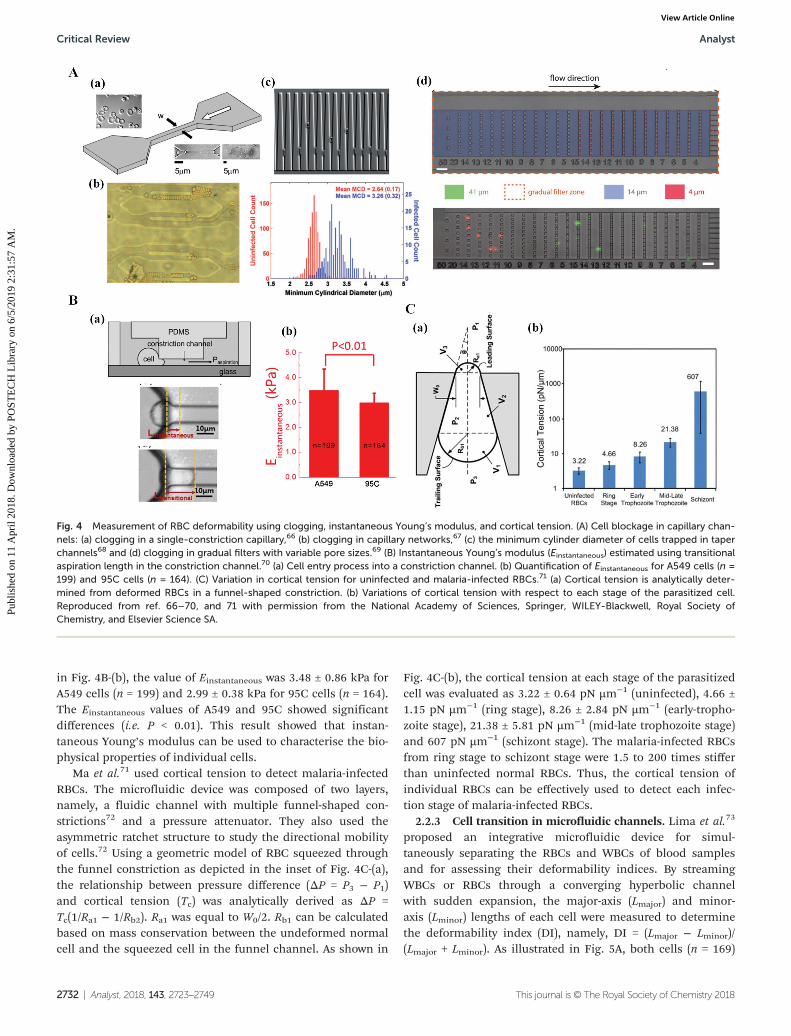
in Fig. 4B-(b), the value of Einstantaneous was 3.48 ± 0.86 kPa forA549 cells (n = 199) and 2.99 ± 0.38 kPa for 95C cells (n = 164).The Einstantaneous values of A549 and 95C showed significantdifferences (i.e. P < 0.01). This result showed that instan-taneous Young’s modulus can be used to characterise the bio-physical properties of individual cells.
Ma et al.71 used cortical tension to detect malaria-infectedRBCs. The microfluidic device was composed of two layers,namely, a fluidic channel with multiple funnel-shaped con-strictions72 and a pressure attenuator. They also used theasymmetric ratchet structure to study the directional mobilityof cells.72 Using a geometric model of RBC squeezed throughthe funnel constriction as depicted in the inset of Fig. 4C-(a),the relationship between pressure difference (ΔP = P3 − P1)and cortical tension (Tc) was analytically derived as ΔP =Tc(1/Ra1 − 1/Rb2). Ra1 was equal to W0/2. Rb1 can be calculatedbased on mass conservation between the undeformed normalcell and the squeezed cell in the funnel channel. As shown in
Fig. 4C-(b), the cortical tension at each stage of the parasitizedcell was evaluated as 3.22 ± 0.64 pN µm−1 (uninfected), 4.66 ±1.15 pN µm−1 (ring stage), 8.26 ± 2.84 pN µm−1 (early-tropho-zoite stage), 21.38 ± 5.81 pN µm−1 (mid-late trophozoite stage)and 607 pN µm−1 (schizont stage). The malaria-infected RBCsfrom ring stage to schizont stage were 1.5 to 200 times stifferthan uninfected normal RBCs. Thus, the cortical tension ofindividual RBCs can be effectively used to detect each infec-tion stage of malaria-infected RBCs.
2.2.3 Cell transition in microfluidic channels. Lima et al.73
proposed an integrative microfluidic device for simul-taneously separating the RBCs and WBCs of blood samplesand for assessing their deformability indices. By streamingWBCs or RBCs through a converging hyperbolic channelwith sudden expansion, the major-axis (Lmajor) and minor-axis (Lminor) lengths of each cell were measured to determinethe deformability index (DI), namely, DI = (Lmajor − Lminor)/(Lmajor + Lminor). As illustrated in Fig. 5A, both cells (n = 169)
Fig. 4 Measurement of RBC deformability using clogging, instantaneous Young’s modulus, and cortical tension. (A) Cell blockage in capillary chan-nels: (a) clogging in a single-constriction capillary,66 (b) clogging in capillary networks,67 (c) the minimum cylinder diameter of cells trapped in taperchannels68 and (d) clogging in gradual filters with variable pore sizes.69 (B) Instantaneous Young’s modulus (Einstantaneous) estimated using transitionalaspiration length in the constriction channel.70 (a) Cell entry process into a constriction channel. (b) Quantification of Einstantaneous for A549 cells (n =199) and 95C cells (n = 164). (C) Variation in cortical tension for uninfected and malaria-infected RBCs.71 (a) Cortical tension is analytically deter-mined from deformed RBCs in a funnel-shaped constriction. (b) Variations of cortical tension with respect to each stage of the parasitized cell.Reproduced from ref. 66–70, and 71 with permission from the National Academy of Sciences, Springer, WILEY-Blackwell, Royal Society ofChemistry, and Elsevier Science SA.
Critical Review Analyst
2732 | Analyst, 2018, 143, 2723–2749 This journal is © The Royal Society of Chemistry 2018
Publ
ishe
d on
11
Apr
il 20
18. D
ownl
oade
d by
PO
STE
CH
Lib
rary
on
6/5/
2019
2:3
1:57
AM
. View Article Online

had the maximum value of DI (DImax) at the axial positionof 100 µm in the converging channel (i.e. DImax = 0.10for WBCs and DImax = 0.44 for RBCs), where the averageshear rate had the maximum value of 1761.6 s−1. In addition,the deformability of RBCs was much higher than that ofWBCs. Thus, the proposed method can be used to simul-taneously separate blood cells and assess the deformability ofindividual cells.
Lim et al.74 used deformation-based cell margination forseparating malaria-infected RBCs from blood samples. Therandomly distributed malaria-infected RBCs (iRBCs) at theinlet channel move towards the sidewalls as blood passesthrough a long straight microfluidic channel (width = 15 µm,depth = 10 µm and length = 30 mm). For a demonstration,blood infected with ring and late trophozoite–schizont iRBCs(haematocrit = 40%) was supplied to the inlet channel at aflow rate of 5 µL min−1. The separation performance of thedevice was evaluated by conducting flow cytometry analysis atthe outlet channels. The experimental results indicated a high
filtration efficiency of 92% for late trophozoite–schizont iRBCsand 75% for early ring iRBCs. Thus, cell margination can beused to separate iRBCs based on the deformability of individ-ual RBCs.
To enhance the throughput of the flow cytometry tech-nique, Fletcher et al.75 utilised single-cell transit time elapsedfor passing through capillary networks. As shown in the insetof Fig. 5B-(a), the flow cytometry device was trifurcated intotwo wide bypass channels and a network of bifurcating chan-nels split into 64 parallel capillaries (width = 5.89 µm, depth =13.3 µm and length = 130 µm). To characterise biophysical pro-perties at different disease states, variations in single-celltransit times were measured using flow cytometry for bloodcells collected from an acute myeloid leukaemia (AML) patientwith leukostasis symptoms (AML2), an AML patient withoutleukostasis symptoms (AML1) and two ALL patients withoutleukostasis symptoms (ALL1 and ALL2). Neutrophils and RBCswere also collected from a healthy volunteer. As illustrated inFig. 5B-(a), the cell transit time and occlusion were signifi-
Fig. 5 Measurement of RBC deformability using the deformability index, transit time and velocity of individual RBCs. (A) Variations in the deform-ability index of RBC and WBC flowing along the axial position in a hyperbolic converging microchannel.73 (B) Transit time of individual RBCs passingthrough a capillary network. (a) Variation in single-cell transit time and occlusion at different disease states.75 (b) Measurement of cell fluidity (β) andstiffness (E) for quantifying the mechanical properties of cells in suspension: the microfluidic device (top), inverse relationship between stiffness (E)and power-law exponent (β) (lower left) and distribution of β for cell deformability (lower right).76 (C) Velocity measurement of individual RBCs fordetecting (a) malaria-infected RBCs78 and (b) impaired deformability of RBCs.79 Reproduced from ref. 73, 75, 76, 78, and 79 with permission fromSpringer, Royal Society of Chemistry, and Cell Press.
Analyst Critical Review
This journal is © The Royal Society of Chemistry 2018 Analyst, 2018, 143, 2723–2749 | 2733
Publ
ishe
d on
11
Apr
il 20
18. D
ownl
oade
d by
PO
STE
CH
Lib
rary
on
6/5/
2019
2:3
1:57
AM
. View Article Online
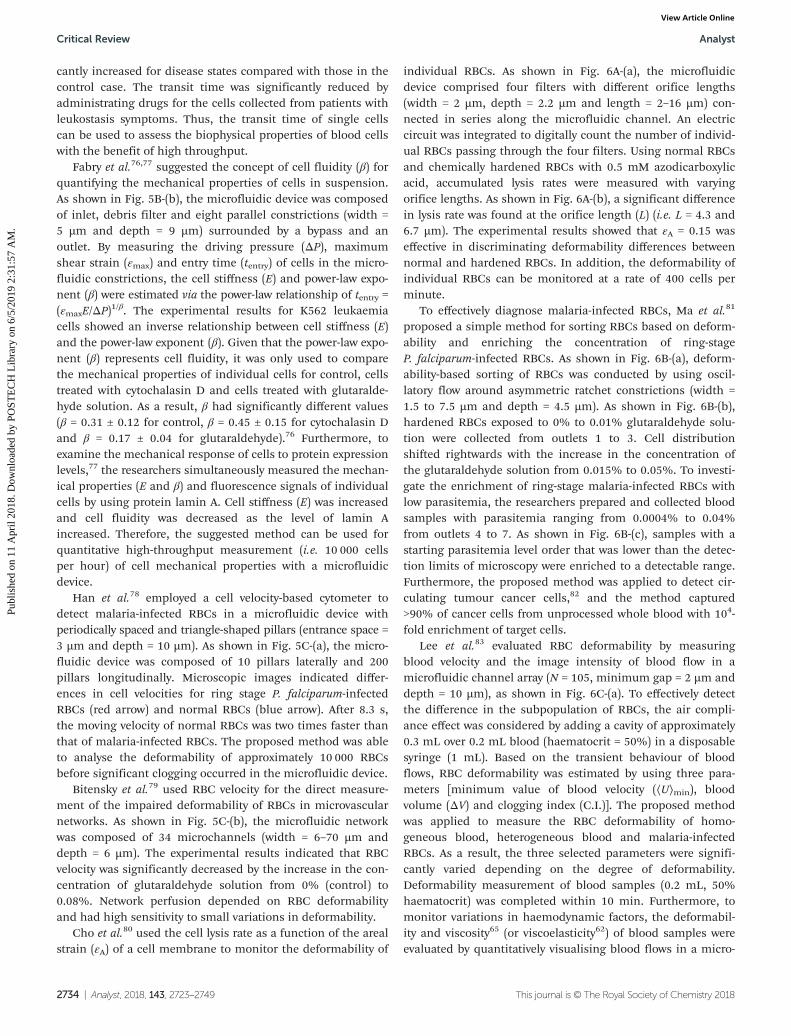
cantly increased for disease states compared with those in thecontrol case. The transit time was significantly reduced byadministrating drugs for the cells collected from patients withleukostasis symptoms. Thus, the transit time of single cellscan be used to assess the biophysical properties of blood cellswith the benefit of high throughput.
Fabry et al.76,77 suggested the concept of cell fluidity (β) forquantifying the mechanical properties of cells in suspension.As shown in Fig. 5B-(b), the microfluidic device was composedof inlet, debris filter and eight parallel constrictions (width =5 µm and depth = 9 µm) surrounded by a bypass and anoutlet. By measuring the driving pressure (ΔP), maximumshear strain (εmax) and entry time (tentry) of cells in the micro-fluidic constrictions, the cell stiffness (E) and power-law expo-nent (β) were estimated via the power-law relationship of tentry =(εmaxE/ΔP)1/β. The experimental results for K562 leukaemiacells showed an inverse relationship between cell stiffness (E)and the power-law exponent (β). Given that the power-law expo-nent (β) represents cell fluidity, it was only used to comparethe mechanical properties of individual cells for control, cellstreated with cytochalasin D and cells treated with glutaralde-hyde solution. As a result, β had significantly different values(β = 0.31 ± 0.12 for control, β = 0.45 ± 0.15 for cytochalasin Dand β = 0.17 ± 0.04 for glutaraldehyde).76 Furthermore, toexamine the mechanical response of cells to protein expressionlevels,77 the researchers simultaneously measured the mechan-ical properties (E and β) and fluorescence signals of individualcells by using protein lamin A. Cell stiffness (E) was increasedand cell fluidity was decreased as the level of lamin Aincreased. Therefore, the suggested method can be used forquantitative high-throughput measurement (i.e. 10 000 cellsper hour) of cell mechanical properties with a microfluidicdevice.
Han et al.78 employed a cell velocity-based cytometer todetect malaria-infected RBCs in a microfluidic device withperiodically spaced and triangle-shaped pillars (entrance space =3 µm and depth = 10 µm). As shown in Fig. 5C-(a), the micro-fluidic device was composed of 10 pillars laterally and 200pillars longitudinally. Microscopic images indicated differ-ences in cell velocities for ring stage P. falciparum-infectedRBCs (red arrow) and normal RBCs (blue arrow). After 8.3 s,the moving velocity of normal RBCs was two times faster thanthat of malaria-infected RBCs. The proposed method was ableto analyse the deformability of approximately 10 000 RBCsbefore significant clogging occurred in the microfluidic device.
Bitensky et al.79 used RBC velocity for the direct measure-ment of the impaired deformability of RBCs in microvascularnetworks. As shown in Fig. 5C-(b), the microfluidic networkwas composed of 34 microchannels (width = 6–70 µm anddepth = 6 µm). The experimental results indicated that RBCvelocity was significantly decreased by the increase in the con-centration of glutaraldehyde solution from 0% (control) to0.08%. Network perfusion depended on RBC deformabilityand had high sensitivity to small variations in deformability.
Cho et al.80 used the cell lysis rate as a function of the arealstrain (εA) of a cell membrane to monitor the deformability of
individual RBCs. As shown in Fig. 6A-(a), the microfluidicdevice comprised four filters with different orifice lengths(width = 2 µm, depth = 2.2 µm and length = 2–16 µm) con-nected in series along the microfluidic channel. An electriccircuit was integrated to digitally count the number of individ-ual RBCs passing through the four filters. Using normal RBCsand chemically hardened RBCs with 0.5 mM azodicarboxylicacid, accumulated lysis rates were measured with varyingorifice lengths. As shown in Fig. 6A-(b), a significant differencein lysis rate was found at the orifice length (L) (i.e. L = 4.3 and6.7 µm). The experimental results showed that εA = 0.15 waseffective in discriminating deformability differences betweennormal and hardened RBCs. In addition, the deformability ofindividual RBCs can be monitored at a rate of 400 cells perminute.
To effectively diagnose malaria-infected RBCs, Ma et al.81
proposed a simple method for sorting RBCs based on deform-ability and enriching the concentration of ring-stageP. falciparum-infected RBCs. As shown in Fig. 6B-(a), deform-ability-based sorting of RBCs was conducted by using oscil-latory flow around asymmetric ratchet constrictions (width =1.5 to 7.5 µm and depth = 4.5 µm). As shown in Fig. 6B-(b),hardened RBCs exposed to 0% to 0.01% glutaraldehyde solu-tion were collected from outlets 1 to 3. Cell distributionshifted rightwards with the increase in the concentration ofthe glutaraldehyde solution from 0.015% to 0.05%. To investi-gate the enrichment of ring-stage malaria-infected RBCs withlow parasitemia, the researchers prepared and collected bloodsamples with parasitemia ranging from 0.0004% to 0.04%from outlets 4 to 7. As shown in Fig. 6B-(c), samples with astarting parasitemia level order that was lower than the detec-tion limits of microscopy were enriched to a detectable range.Furthermore, the proposed method was applied to detect cir-culating tumour cancer cells,82 and the method captured>90% of cancer cells from unprocessed whole blood with 104-fold enrichment of target cells.
Lee et al.83 evaluated RBC deformability by measuringblood velocity and the image intensity of blood flow in amicrofluidic channel array (N = 105, minimum gap = 2 µm anddepth = 10 µm), as shown in Fig. 6C-(a). To effectively detectthe difference in the subpopulation of RBCs, the air compli-ance effect was considered by adding a cavity of approximately0.3 mL over 0.2 mL blood (haematocrit = 50%) in a disposablesyringe (1 mL). Based on the transient behaviour of bloodflows, RBC deformability was estimated by using three para-meters [minimum value of blood velocity (⟨U⟩min), bloodvolume (ΔV) and clogging index (C.I.)]. The proposed methodwas applied to measure the RBC deformability of homo-geneous blood, heterogeneous blood and malaria-infectedRBCs. As a result, the three selected parameters were signifi-cantly varied depending on the degree of deformability.Deformability measurement of blood samples (0.2 mL, 50%haematocrit) was completed within 10 min. Furthermore, tomonitor variations in haemodynamic factors, the deformabil-ity and viscosity65 (or viscoelasticity62) of blood samples wereevaluated by quantitatively visualising blood flows in a micro-
Critical Review Analyst
2734 | Analyst, 2018, 143, 2723–2749 This journal is © The Royal Society of Chemistry 2018
Publ
ishe
d on
11
Apr
il 20
18. D
ownl
oade
d by
PO
STE
CH
Lib
rary
on
6/5/
2019
2:3
1:57
AM
. View Article Online
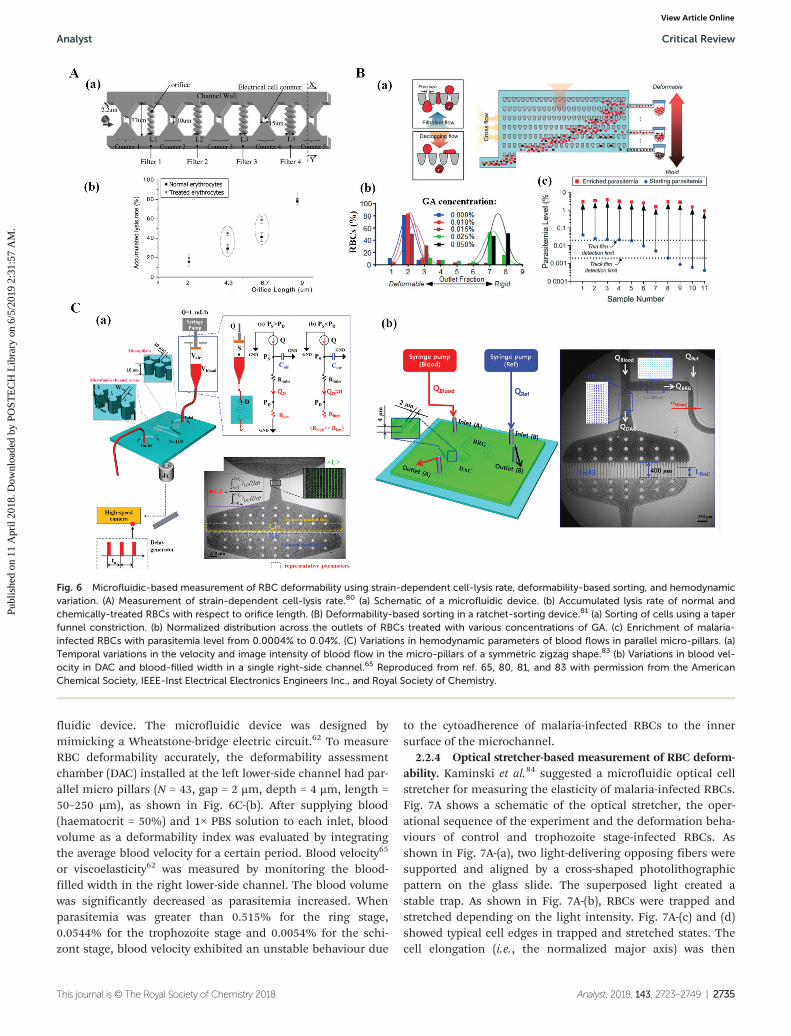
fluidic device. The microfluidic device was designed bymimicking a Wheatstone-bridge electric circuit.62 To measureRBC deformability accurately, the deformability assessmentchamber (DAC) installed at the left lower-side channel had par-allel micro pillars (N = 43, gap = 2 µm, depth = 4 µm, length =50–250 µm), as shown in Fig. 6C-(b). After supplying blood(haematocrit = 50%) and 1× PBS solution to each inlet, bloodvolume as a deformability index was evaluated by integratingthe average blood velocity for a certain period. Blood velocity65
or viscoelasticity62 was measured by monitoring the blood-filled width in the right lower-side channel. The blood volumewas significantly decreased as parasitemia increased. Whenparasitemia was greater than 0.515% for the ring stage,0.0544% for the trophozoite stage and 0.0054% for the schi-zont stage, blood velocity exhibited an unstable behaviour due
to the cytoadherence of malaria-infected RBCs to the innersurface of the microchannel.
2.2.4 Optical stretcher-based measurement of RBC deform-ability. Kaminski et al.84 suggested a microfluidic optical cellstretcher for measuring the elasticity of malaria-infected RBCs.Fig. 7A shows a schematic of the optical stretcher, the oper-ational sequence of the experiment and the deformation beha-viours of control and trophozoite stage-infected RBCs. Asshown in Fig. 7A-(a), two light-delivering opposing fibers weresupported and aligned by a cross-shaped photolithographicpattern on the glass slide. The superposed light created astable trap. As shown in Fig. 7A-(b), RBCs were trapped andstretched depending on the light intensity. Fig. 7A-(c) and (d)showed typical cell edges in trapped and stretched states. Thecell elongation (i.e., the normalized major axis) was then
Fig. 6 Microfluidic-based measurement of RBC deformability using strain-dependent cell-lysis rate, deformability-based sorting, and hemodynamicvariation. (A) Measurement of strain-dependent cell-lysis rate.80 (a) Schematic of a microfluidic device. (b) Accumulated lysis rate of normal andchemically-treated RBCs with respect to orifice length. (B) Deformability-based sorting in a ratchet-sorting device.81 (a) Sorting of cells using a taperfunnel constriction. (b) Normalized distribution across the outlets of RBCs treated with various concentrations of GA. (c) Enrichment of malaria-infected RBCs with parasitemia level from 0.0004% to 0.04%. (C) Variations in hemodynamic parameters of blood flows in parallel micro-pillars. (a)Temporal variations in the velocity and image intensity of blood flow in the micro-pillars of a symmetric zigzag shape.83 (b) Variations in blood vel-ocity in DAC and blood-filled width in a single right-side channel.65 Reproduced from ref. 65, 80, 81, and 83 with permission from the AmericanChemical Society, IEEE-Inst Electrical Electronics Engineers Inc., and Royal Society of Chemistry.
Analyst Critical Review
This journal is © The Royal Society of Chemistry 2018 Analyst, 2018, 143, 2723–2749 | 2735
Publ
ishe
d on
11
Apr
il 20
18. D
ownl
oade
d by
PO
STE
CH
Lib
rary
on
6/5/
2019
2:3
1:57
AM
. View Article Online

measured by conducting ellipse fitting on cell edge pixelsalong the axis of the optical fibers. Fig. 7A-(e) showed temporalvariations of the normalized major axis with respect to con-trols, cohorts, and malaria-infected RBCs. Cohorts (squares,n = 32) and controls (triangles, n = 46) exhibited very similarcompliance. But the compliance of malaria-infected RBCs(circle, n = 24) was greatly reduced compared with the control.According to the Kelvin–Voigt model, which assumes that vis-cosity (μ) and elasticity (E) are connected in series for each cell,the strain [ε(t )] under constant stress (σ) can be described asε(t ) = a[1 − exp(−λt )]. Here, λ = E·µ−1 represents the character-istic deformation rate. a = σ·E−1 denotes the relative amplitudeof the stretch. Both parameters (a and λ) were obtained by con-ducting a curve-fitting procedure from cell elongation infor-mation measured by using an optical fibre. The values of aand λ in the malaria-infected RBCs decreased by a factor of 2to 3 compared with those in the normal RBCs. Both para-meters (a, λ) were significantly varied due to the existence ofmalaria parasites in RBCs. Given that the technique wasimplemented in a non-contact manner, the results were freefrom artefacts induced by physical contact required in othersingle-cell measurement techniques.
2.2.5 Electrical impedance-based measurement of RBCdeformability. Chandrakasan et al.85 used electric impedance(EI) micro-flow cytometry to characterise the disease state ofsingle cells. The platform provided a label-free and non-inva-sive cell-counting assay with sensing electric impedance. Asshown in Fig. 7B-(a), the microfluidic device was composed ofa constriction channel (width = 30 µm and depth = 5 µm) andtwo electrodes (interspace = 20 µm, width = 20 µm and depth =0.1 µm). To check the pathological states of individual cells, adimensionless offset parameter (δ) was obtained by a linearcombination of phase and magnitude changes in electricimpedance. The experimental result indicated that the pro-posed method can effectively differentiate malaria-infectedRBCs from normal RBCs.
To achieve a high throughput in biophysical measurementsof RBCs (i.e. 100 cells per 1 s to 150 cells per 1 s), Sun et al.86
used multiple parameters, including mechanical properties(transit time) and electrical signals (impedance amplituderatio and impedance phase increase). As shown in Fig. 7B-(b),electrical impedance was measured as RBCs flowed through astraight constriction channel (width = 5 µm and depth =3 µm). The histograms obtained from the multiple parameters
Fig. 7 Microfluidic-based measurement of RBC deformability using optical stretching and electrical impedance. (A) Measurement of cell elongationusing an optical stretcher.84 (a) Schematic of the optical stretcher. (b) Sequence of operation. (c) Normal RBCs trapped at low light intensity. (d)Normal RBCs elongated at high light intensity. (e) Deformation comparison between normal RBCs and malaria-infected RBCs. (B) Variation in electricimpedance of individual RBCs flowing in a straight constriction channel. (a) Experiment setup for the measurement of the electrical impedance ofsingle RBCs using a microfluidic channel.85 (b) Simultaneous measurement of electrical impedance and transit time of individual RBCs in the con-striction channel.86 Reproduced from ref. 84, 85, and 86 with permission from the Royal Society of Chemistry and SPIE-Soc Photo-OpticalInstrumentation Engineers.
Critical Review Analyst
2736 | Analyst, 2018, 143, 2723–2749 This journal is © The Royal Society of Chemistry 2018
Publ
ishe
d on
11
Apr
il 20
18. D
ownl
oade
d by
PO
STE
CH
Lib
rary
on
6/5/
2019
2:3
1:57
AM
. View Article Online

for adult and neonatal RBCs showed distinctively different bio-physical properties.
2.2.6 Discussion on RBC deformability measurements. Assummarised in Table 2, several measurement techniques,including cell blockage, cell aspiration, cell transit, opticalstretcher and electrical impedance, have been developed tomeasure the deformability of individual RBCs using micro-fluidic devices. Clinical applications require the detection of alarge number of RBCs for high-throughput analysis.87 Inaddition, establishing a standard protocol for each measure-ment is essential because several factors, such as storage time,temperature and osmotic pressure, affect RBC deformability.Among the several techniques used for RBC deformability, thecell transit-based technique might have a strong potential foruse in high-throughput screening. By injecting individualRBCs into a microfluidic device with funnels or micropillars,RBC deformability was evaluated at a high throughput (i.e. 105
RBCs per 200 s) in a previous study.65 However, because thismethod utilises a high-speed camera and digital image proces-sing, it presents a technical bottleneck when applied in clini-cal settings. Thus, instead of the imaging-based analysis tech-nique, the analytical sensor-based technique could be alterna-tively adopted for clinical applications. It could be employed toeffectively monitor pathological changes in blood circulatingunder ex vivo conditions.
2.3 RBC aggregation measurement using microfluidicdevices
RBCs suspended in plasma aggregate and form rouleaux atstasis or under low shear rates. The aggregated RBCs are dis-persed at high shear rates. Thus, RBC aggregation is signifi-cantly varied by (i) intrinsic cellular properties (membranedeformability and surface charge density), (ii) suspendingmedium properties (fibrinogen concentration in plasma andaggregation-induced macromolecules) and (iii) shear rate ofblood flow in RBCs.88 RBC aggregation has been explainedusing cross-bridge89 and depletion-induced90,91 models. Thedepletion-mediated model is favoured over the cross-bridgemodel for understanding the interactions of RBCs.89 RBCaggregation is considered the determining parameter ofhaemorheological properties and exerts a direct influence onblood viscosity and microcirculation at low shear rates.Clinically, RBC aggregation is enhanced in various pathologi-cal diseases, including malaria, diabetes, hypertension, sepsisand microcirculatory disorders.
To quantify the RBC aggregation of blood samples in amicrofluidic platform, blood is supplied to a microfluidicchannel. Thereafter, to induce the aggregation or disaggrega-tion of RBCs, blood flow is agitated or stopped by using exter-nal devices, such as a syringe pump,34,92 a vacuum pump,93,94
a stirring system,95,96 a vibration system97 and a pinchvalve.61,88 A typical syllectogram is obtained as a function oftime by quantifying blood flows through several methods,including the measurement of photometric intensity (lighttransmission and light backscattering) and electrical impe-
dance and capturing of microscopic or speckle images. Asshown in Fig. 8A-(b), a typical aggregation index (AI) is evalu-ated with the ratio of the area under the curve (SA) to the totalarea of the curve (SA + SB) [i.e., AI = SA/(SA + SB)].
98 This sectionfocuses on several measurement techniques for characterisingRBC aggregation using microfluidic platforms. The techniquesare summarized in Table 3.
2.3.1 Photometric intensity-based measurement of RBCaggregation. Shin et al.93,94 proposed a microfluidic aggrego-meter for measuring RBC aggregation in a microfluidicchannel. As shown in Fig. 8A-(a), the aggregometer was com-posed of a microfluidic device (width = 4 mm, depth = 200 µmand length = 40 mm), a laser as a light source, a photodiodefor measuring light reflection, a pressure sensor and a vacuumpump. After dropping 0.5 mL of a blood sample into a samplechamber, the microfluidic channel was filled with blood byoperating the vacuum pump. The RBCs were aggregated or dis-persed depending on the flow rate. By measuring the lightintensity reflected from the blood sample with a photodiode,the RBC aggregation index was calculated by analysing tem-poral variations in backscattered light intensity. Fibrinogen inplasma was found to increase RBC aggregation. It alsoincreased critical shear stress by about 46% compared withRBCs suspended in PBS solution. The proposed method wasapplied to examine the effect of temperature on RBC aggrega-tion.94 Threshold shear stress was introduced to monitor theeffect of temperature on the RBC aggregation because the RBCaggregation index did not fully reflect the trends of RBC aggre-gation with respect to temperature. The threshold shear stressand blood viscosity exhibited similar trends with respect tofluid temperature. Furthermore, the microfluidic device wasused to compare the performance of light-transmission andback-scattering methods.95 Although both methods had agood relationship, they produced different values of the RBCaggregation index. However, when an orthogonal polarizationtechnique was applied, both methods resulted in the sameRBC aggregation index for various blood samples mixed withdifferent concentrations of dextran solution.
ESR is a simple clinical index for screening several inflam-matory diseases. To investigate the relationship between RBCaggregation and ESR, Elbuken et al.88 developed a microfluidicopto-electro-mechanical system.88 As shown in Fig. 8A-(b), themicrofluidic system was composed of a solenoid pinch valvefor disaggregating RBCs in whole blood, a photodetector fordetecting light intensity transmitted from a light-emittingdiode (LED), a microfluidic cartridge and an optical micro-scope equipped with a camera. The microfluidic cartridge hada deep channel (width = 1 mm and depth = 1 mm) for ESR anda shallow channel (width = 44.5 mm and depth = 150 µm) forRBC aggregation. A solenoid pinch valve was employed toprovide back-and-forth blood flow continuously in the car-tridge for 15 s. The principle of this measurement system wasbased on the analysis of optical light transmitted throughblood samples. An infrared light-emitted diode (LED) of830 nm in wavelength was placed at the top surface of the car-tridge, and illuminated the blood-filled channel. The light
Analyst Critical Review
This journal is © The Royal Society of Chemistry 2018 Analyst, 2018, 143, 2723–2749 | 2737
Publ
ishe
d on
11
Apr
il 20
18. D
ownl
oade
d by
PO
STE
CH
Lib
rary
on
6/5/
2019
2:3
1:57
AM
. View Article Online

passing through the channel was collected on the photo-detector located at the bottom of the cartridge. After supplyingthe blood sample into the cartridge, the test was started byfully disaggregating RBCs for 15 s with the aid of a pinchvalve. By turning off the pinch valve, RBCs were aggregatedimmediately. During the aggregation process, the bloodsample was illuminated with the LED. Using a photodetector,the transmitted light intensity was consecutively recorded for120 s. It was employed to calculate the aggregation index.Linear regression analysis showed that the conventional RBCaggregation index did not provide significant relationshipinformation on conventional Westergren ESR. To obtain asufficient relationship between microfluidic ESR andWestergren ESR, a microfluidic ESR index was proposed toexamine amplitude variations in light intensity (ΔI) at anelapsed time of t = 120 s [i.e., ΔI = I(t = 120 s) − I(t = 0)]. I(t =
120 s) and I(t = 0) denote the light intensity at t = 120 s and t =0, respectively. The proposed method quantified RBC aggrega-tion by analysing the transmitted light intensity obtained fromthe shallow channel of the microfluidic cartridge.
2.3.2 Electrical conductivity-based measurement of RBCaggregation. Temporal variations in blood conductivity can beused to estimate RBC aggregation. Antonova et al.99 presenteda Couette viscometric system composed of a rotational visc-ometer and a conductivity measurement device. Given that theelectrical properties of blood in a simple shear flow werevaried depending on the frequency and shear rate,100 conduc-tivity signals of 2 kHz were recorded under the condition of atransient shear rate ranging from 0.94 s−1 to 94.5 s−1. Bloodconductivity varied depending on several factors, including theshear rate, haematocrit, and temperature. As shown in Fig. 8B-(a), during RBC aggregation, blood conductivity was largely
Fig. 8 Microfluidic-based measurement of RBC aggregation by analysing photometric intensity and blood conductivity. (A) RBC aggregationmeasurement from the photometric intensity. (a) Microfluidic aggregometer including a vacuum pump, a pressure sensor, a microfluidic channeland a laser-photodetector.94 (b) The microfluidic system used for the measurement of the erythrocyte sedimentation rate (ESR) and erythrocyteaggregation.88 (B) The measurement system used for blood conductivity. (a) Variations of blood conductivity with respect to shear rate during aggre-gation.99 (b) Schematics of the electrical impedance measurement system.98 (c) A microfluidic device with a gold-plated electrode and an imped-ance analyser.101 Reproduced from ref. 88, 94, 98, 99, and 101 with permission from the Royal Society of Chemistry, Public Library Science, IOSPress, Elsevier Sci. Ltd, and IEEE – Institute of Electrical and Electronics Engineers.
Critical Review Analyst
2738 | Analyst, 2018, 143, 2723–2749 This journal is © The Royal Society of Chemistry 2018
Publ
ishe
d on
11
Apr
il 20
18. D
ownl
oade
d by
PO
STE
CH
Lib
rary
on
6/5/
2019
2:3
1:57
AM
. View Article Online

decreased depending on the shear rate. In addition, thesystem can provide valuable information on rouleaux for-mation or structural transformation of RBC aggregates duringthe aggregation–disaggregation process.
Meiselman et al.98 compared RBC aggregations by analysingthe transmitted light intensity and electrical impedancesignals as shown in Fig. 8B-(b). Electrical impedance of 100kHz and light transmittance were recorded under a high shearflow and for 120 s after abrupt stoppage of blood flow, duringwhich RBC aggregation occurs. RBC aggregation was thenquantified from capacitance values obtained from electricalimpedance data. The RBC aggregation parameters derivedfrom capacitance data were in good agreement with thoseobtained from light transmittance data.
Yang et al.101 established a microfluidic-based ESRmeasurement method by monitoring temporal variations inelectrical impedance signals of blood with various haemato-crits. As shown in Fig. 8B-(c), the microfluidic-based conduc-tivity measurement system was composed of a PDMS chamberwith a square cross section (width = 5 mm and depth = 5 mm)and two gold-deposited planar electrodes (thickness = 0.3 µmand width = 300 µm) that were 1200 µm apart. After a bloodsample was dropped into the PDMS chamber, the electric con-ductivity of the test blood was measured with an impedanceanalyser. The measured blood conductivity increased for thefirst 1 min and decreased thereafter. Theoretical analysisrevealed that the initial increase in blood conductivity wascaused by RBC aggregation, and the subsequent decreaseresulted from the deposition of RBCs. The ESR value obtainedfrom the electrical impedance signal showed a sufficient corre-lation with the standard Westergren ESR method.
2.3.3 Microscopic image-based measurement of RBCaggregation. Local RBC aggregation in micro-scale blood flowsor bifurcating microchannel flows is important because theblood flow and haematocrit are not uniform. For this reason,Balabani et al.102,103 investigated spatial distributions of RBCaggregation in a T-shaped bifurcation. Fig. 9A shows a sche-matic of the microfluidic system. A pressure control device wasemployed to supply blood from the parent conduit (P) (width =100 µm and depth = 40 µm) towards two daughter branches(L and R). The velocity field and streamlines of RBC aggregationat a flow rate of QD/QP = 0.13 are shown in the right panel of thefigure. QP and QD denote the flow rate of the parent and rightdaughter conduits, respectively. The size of RBC aggregation wasdetermined by adopting an image processing technique. Themean aggregated size was marginally increased in the daughterbranches mainly due to low shear rates. This result was attribu-ted to the depletion of RBC aggregation in certain regions of theparent conduit and to the change in the flow-split location in theT-junction with respect to the flow rate ratio.
Lee et al.104 conducted a microfluidic-based speckle ana-lysis for the sensitive measurement of RBC aggregation. Asshown in Fig. 9B, the microfluidic device had a single inlet, astraight channel (width = 1 mm, depth = 50 µm and length =10 mm) and a single outlet. After selecting a specific region ofinterest (ROI) of 128 × 128 pixels, the normalized autocorrela-tion function ( fauto) was calculated along the horizontal andvertical directions. The size of the speckle pattern (SH and SV)was estimated as the corresponding width at half of fauto ( fauto =0.5). Then, the average speckle area (ASpeckle) was evaluated bymultiplying the horizontal and vertical speckles (i.e. ASpeckle =SH·SV). As shown in the right figures, the speckle patterns
Table 3 Summary of microfluidic-based techniques for measuring RBC aggregation
Principle Measurement quantity Test cell Comment Ref.
Photometric method(transmission, scattering)
Light intensity and shearstress
RBC in fibrinogen suspension Scattered light (laser, photodiode) 93 and94
Light transmission orback scattering
Blood delivery with a vacuum pump
Light intensity andmicroscopic image
RBC in dextran suspension RBC disaggregation with a pinch valve 88Comparison of ESR and RBCaggregation
Electrical conductivity Conductivity RBC in plasma Comparison of ESR and conductivity 99 and101
Microscopic image Aggregation size Whole blood(haematocrit = 25%)
Image processing 102 and103Velocity field Partitioning of RBC aggregation in a
T-shaped bifurcation channelCell-depleted layerSpeckle size RBC in dextran suspension Single channel 104
Diabetic rat blood Comparison of ultrasonic, microscopicimage and ESR
Cluster size andoccurrence
RBC in dextran or fibrinogensuspension
In vivo or in-vitro 105
Image intensity Malaria-infected blood(haematocrit = 30%)
ESR measurement with a syringe pump 92
RBC in dextran suspensionRBC in dextran suspension Periodic on-off control of blood flow 34
Simultaneous measurementRBC in dextran suspension Periodic delivery with a disposable
pump61
RBC aggregation under continuoussedimentation
Analyst Critical Review
This journal is © The Royal Society of Chemistry 2018 Analyst, 2018, 143, 2723–2749 | 2739
Publ
ishe
d on
11
Apr
il 20
18. D
ownl
oade
d by
PO
STE
CH
Lib
rary
on
6/5/
2019
2:3
1:57
AM
. View Article Online

appeared over time. After the flow of blood (RBC suspended in0.06% dextran solution, haematocrit = 40%) was stopped,ASpeckle gradually increased. Through quantitative comparisonswith conventional measurement methods, including the con-ventional ESR method, microscopic observation and ultra-sound imaging, the speckle area (ASpeckle) can be used to evalu-ate RBC aggregation effectively.
Wagner et al.105 investigated the effects of dextran and fibri-nogen on RBC aggregation in micro-capillaries. Fig. 9C showsa cluster of RBCs passing through a capillary vessel of amouse, a microfluidic device (N = 30, width = 8.5 µm anddepth = 4.5 µm) and the numerical simulation result on theeffect of fibrinogen on two different channel widths (w) (w =4.5 and 12 µm). At high shear rates in the micro-capillaries orlow haematocrit of 1%, fibrinogen or dextran enhanced theformation of robust clusters of RBCs. This persistent RBCaggregation exerted an influence on the spatial distribution ofRBCs and blood perfusions in microvascular networks.
Lee et al.92 reported a microfluidic-based ESR measurementtechnique to detect malaria-infected RBCs collected from amouse. As shown in Fig. 9D, a disposable syringe filled withblood was turned upside down in the gravitational direction.When blood was supplied to a microfluidic device from thetop of the syringe, the haematocrit of the blood decreased dueto continuous ESR in the syringe. By assuming the imageintensity of blood flow as I(t ) = α + β exp(−t/λESR), the dynamicvariation in ESR was evaluated with two parameters, namely,the time constant (λESR) and ESR area (AESR). The two para-meters varied significantly when RBCs were suspended in adextran solution (haematocrit = 30%). The ESR and viscosity ofmalaria-infected RBCs increased significantly with respect tothe parasitemia level.
Kang61 proposed a microfluidic-based technique formeasuring RBC aggregation under haematocrit variation dueto continuous ESR in the tip of a conical pipette. As shown inFig. 9E, a conical pipette tip was tightly fitted into the inlet
Fig. 9 Microfluidic-based measurement of RBC aggregation by analysing microscopic images of aggregated RBCs in a microfluidic channel. (A)Spatial distributions of RBC aggregations in T-shaped bifurcation.102 (B) Analysis of speckle patterns in a straight microfluidic channel.104 (C) Clustersize and occurrence of RBCs in micro-capillary flows.105 (D) Microfluidic-based ESR measurement using a disposable syringe by analysing the imageintensity of blood flow in a microfluidic channel.92 (E) Variation in RBC aggregation owing to continuous ESR in a conical pipette tip under periodicon–off blood delivery by using a disposable suction pump.61 Reproduced from ref. 61, 92, 102, 104, and 105 with permission from MDPI AG, AIPPublishing, and Nature Publishing Group.
Critical Review Analyst
2740 | Analyst, 2018, 143, 2723–2749 This journal is © The Royal Society of Chemistry 2018
Publ
ishe
d on
11
Apr
il 20
18. D
ownl
oade
d by
PO
STE
CH
Lib
rary
on
6/5/
2019
2:3
1:57
AM
. View Article Online

port, and a disposable suction pump was connected to theoutlet. After dropping blood (∼0.2 mL) into the conicalpipette tip, blood flow was turned on and off by periodicallyoperating a pinch valve. To effectively evaluate variations inRBC aggregation due to continuous ESR, an erythrocyte sedi-mentation rate aggregation index (EAI) was newly definedfrom temporal variations in the image intensity of bloodflows in the microfluidic channel. EAI was more effectivethan the conventional AI in monitoring variations in RBCaggregation due to continuous ESR. In addition, the EAIgradually increased with the increase in the concentration ofthe dextran solution.
Kang34 suggested a simple method for the continuous andsimultaneous measurement of biophysical properties of blood,including viscosity, viscoelasticity and RBC aggregation. Theblood sample was precisely delivered into the inlet (A) underpulsatile flow rate conditions. However, PBS solution was sup-plied to the inlet (B) at a constant flow rate. By operating apinch valve connected to the outlet (A), blood flow wasstopped or allowed to pass through the lower left channel.Then, the biophysical properties of blood were quantified byanalysing the flow rate in the upper left channel (QµPIV), imageintensity in the lower left channel (⟨I⟩Blood) and blood-filledwidth in the lower right channel (αBlood). To consistentlymeasure RBC aggregation, the value of ⟨I⟩Blood was obtainedfrom the corresponding time of the minimal image intensity(⟨I⟩0) for 100 s. RBC aggregation was then evaluated in termsof the linear slope of the image intensity (⟨I⟩slope), the integralof the image intensity above the minimal image intensity for100 s (Aupp), the integral of the minimal image intensity for100 s (Alow), and the ratio of Aupp to Alow (i.e., Aratio = Aupp/Alow).Three parameters (⟨I⟩slope, Aratio and Aupp) defined from ⟨I⟩Bloodwere varied significantly depending on RBC aggregation. Theaddition of dextran solution increased blood viscosity and RBCaggregation. However, a glutaraldehyde solution did not con-tribute to varying RBC aggregation.
2.3.4 Discussion on RBC aggregation measurement tech-niques. As summarised in Table 3, several RBC aggregationmeasurement techniques, including photometric intensity,electric conductivity, and microscopic images, have been usedto quantify RBC aggregation flowing in a microfluidic device.By agitating RBCs with a disaggregation mechanism, RBCaggregation was quantified by analysing light intensity, electricconductivity and image intensity. Compared with measure-ments of blood viscosity and RBC deformability, RBC aggrega-tion has been widely adopted to detect various pathologicaldiseases in clinical settings. Using a microfluidic platform, theeffects of plasma protein (i.e. fibrinogen) or dextran solutionon RBC aggregation were examined by monitoring the size ofclusters or the cell-depleted layer of RBCs in microfluidic chan-nels or capillary networks.102,105 In addition, RBC aggregationand ESR were simultaneously measured by analysing lighttransmission intensity and microscopic images.88 Recently, anew RBC aggregation index (EAI) was proposed to monitorvariations in RBC aggregation due to continuous ESR in reser-voirs.61 However, because all methods were developed to
measure RBC aggregation under in vitro conditions, severalissues (blood collection, storage time, and hemodilution)hinder measuring the RBC aggregation of real blood circulat-ing in a closed ex vivo circuit. Thus, improving or modifyingthese methods is required for the measurement of RBC aggre-gation under ex vivo conditions.
3. Ex vivo blood physical analysis ofan animal model
To quantify various biophysical properties of blood circulatingin complex fluidic circuits, including hemodialysis106 and a car-diopulmonary-bypass procedure,107,108 blood samples havebeen collected from conduits. Then, the haemorheologicalproperties of the blood were measured under in vitroconditions.
Whittaker et al.109 reported that blood viscosity measuredwith an Oswald viscometer (in vitro conditions) is higher thanthat estimated based on the pressure and flow rate curve forthe hind limb of a dog (in vivo conditions). This result is attrib-uted to the much larger diameter of the Oswald viscometer(inner diameter = 930 µm) compared with that of real bloodvessels. The Fahraeus–Lindqvist effect,110 which depends onvessel diameter owing to the cell-free layer,111,112 endothelialglycocalyx113 and vasomotor control,114 contributes to thedifference in blood viscosities measured by in vivo and in vitroexperiments.43 Given the different geometries between bloodvessels and in vitro instruments, in vitro methodology cannotprovide consistent rheological properties of blood comparedwith in vivo measurement techniques, including electricalimpedance catheters,115,116 photo-acoustic and photo-thermalcytometry,117 cellular ultrasound imaging method118 andmicroscopic image-based velocimetry.119,120 In addition,haemorheological properties are significantly varied due to thepresence of artefact (blood–air interface)121 and storage con-ditions.122,123 During blood collection, haemodynamic pro-perties, including flow rates or pressures in the closedconduit, are not specified. For this reason, haemorheologicalproperties of blood have been measured over a wide range ofshear rates, rather than at a specific shear rate condition.Considering that blood collections decrease the blood volumein the closed loop, a lactated Ringer’s solution is applied tomaintain blood volume during cardiopulmonary bypass pro-cedures.107 However, this hemodilution causes to vary thehaemorheological properties significantly. To minimise orremove blood collection from the closed conduit, variousmethods have been suggested to quantify the biophysical pro-perties of real blood circulating under ex vivo conditions.124,125
The measurements of haemorheological properties underin vivo and ex vivo conditions are summarized in Table 4.
3.1 Microfluidic-based haemorheological measurementsunder ex vivo conditions
Lee et al.42–44,126–128 used an extracorporeal rat bypass loop tostudy microvascular haemodynamics. As shown in Fig. 10A-(a),
Analyst Critical Review
This journal is © The Royal Society of Chemistry 2018 Analyst, 2018, 143, 2723–2749 | 2741
Publ
ishe
d on
11
Apr
il 20
18. D
ownl
oade
d by
PO
STE
CH
Lib
rary
on
6/5/
2019
2:3
1:57
AM
. View Article Online

an extracorporeal rat bypass loop was constructed by connect-ing a fluorinated ethylene propylene (FEP) tube from thejugular vein to the femoral artery. Microscopic images of bloodcirculating in the loop were sequentially captured with a high-speed camera. The velocity profiles of blood flow in the bypassFEP tube were obtained by conducting the time-resolvedmicro-particle image velocimetry technique for microscopicimages of blood flows. As shown in Fig. 10A-(b), the centre ve-locity in the bypass FEP tube can be controlled by adjustingthe main tube with a pinch valve. The ratio of the systolicblood velocity to the diastolic blood velocity decreased withincreasing blood flow rate. The blood rate and amplitudes ofpulsatile blood flow can be easily controlled by adjusting thepinch valves installed in the arteriovenous shunt loop.Therefore, the proposed bypass loop had a strong potential forobtaining haemodynamic information on real blood flows.
Given that previous in vitro experiments measured bloodviscosity under a specific flow rate, their methods are lackingwhen used to evaluate blood viscosity at unspecified flowrates. For this reason, a flow rate sensor is installed in theclosed fluidic circuit to measure the blood flow rate. However,tedious cleaning or calibration is required after each experi-mental measurement. To resolve this problem, a twin-shapedmicrofluidic device was introduced in a previous study for thesimultaneous measurement of viscosity and flow rate of wholeblood circulating in a complex fluidic circuit that includes arat, a reservoir, a pinch valve and a peristaltic pump.42 Asshown in Fig. 10B-(a), rat blood was delivered to the bloodreservoir at an unknown flow rate (Qx) by adjusting the pinch
valve. The blood was supplied to the microfluidic device usinga peristaltic pump at a specific flow rate. The microfluidicdevice was composed of two half-circular chambers (diameter =22 mm and depth = 50 µm), two side channels with mul-tiple microchannels (N = 25, width = 300 µm and depth =50 µm) connected by a bridge channel. Firstly, by using rever-sal flow switching manipulation in the bridge channel,15
blood viscosity was measured under two different blood flowrate conditions [(a) specified flow rate via a syringe pump and(b) unspecified flow-rate via a peristaltic pump]. The bloodflow rate (QBlood) and blood viscosity (µBlood) were simul-taneously measured with good measurement accuracy andreliability. Then, the viscosity of rat blood flowing in thecomplex fluidic network was measured. The number of chan-nels filled with blood (NBlood) remained constant at NBlood =18–19, as shown in Fig. 10B-(b), due to the compliance effectof the half-circular chamber. By using two distinctive relation-ships (NBlood vs. QBlood, µBlood vs. QBlood) that were experi-mentally obtained, the viscosity of rat blood was evaluated as5.89 ± 0.08 cP at a flow rate of 3.8 mL h−1. Through experi-mental demonstrations, the proposed method was found tobe a promising technique for effectively evaluating the flowrate and viscosity of whole blood circulating in a complexfluid network without sensors and tedious labelling pro-cedures. In addition, it will be employed to measure temporalvariations of blood viscosity during a cardiopulmonary bypassprocedure or haemodialysis.
To monitor temporal variations in the biophysical pro-perties of rat blood, including viscosity, flow rate and pressure,
Table 4 Summary of haemorheological property measurement under in vivo and ex vivo conditions
Experimentalcondition
Measurementquantity Animal model Comment Ref.
In vivo RBC velocity Venule (rat) Effect of RBC aggregation on velocity profile invenule
120
Blood viscosity Right atrium (10patients)
Electrical impedance technique with central venouscatheter
115 and116
On-pump heart surgeryBlood velocity Nude mouse Photo-acoustic and photo-thermal flow cytometry 117HaematocritRBC aggregationBlood viscosityRBC aggregation Diabetic patients Ultrasound imaging (aggregation size) 118Flow rateBlood velocity LPS-stimulated
zebrafishDiscrete circuit model 119
Wall shear stressEx vivo Velocity profile Rat Micro-PIV technique 126
Three pinch valves for controlling bloodflowPulsatility index
Blood viscosity Rat Microfluidic device 42 and 43Flow rate Discrete circuit modelPressure Periodic blood collection (required)Blood viscosity Rat Hybrid system (microfluidic device and ultrasound
system)44
PressureRBC aggregation Discrete circuit modelVelocity profile Periodic blood collection (required)Image intensity Pig Shear gradient microfluidic
device125
Pressure dropClotting time Monitoring whole blood hemostasis and platelet
function
Critical Review Analyst
2742 | Analyst, 2018, 143, 2723–2749 This journal is © The Royal Society of Chemistry 2018
Publ
ishe
d on
11
Apr
il 20
18. D
ownl
oade
d by
PO
STE
CH
Lib
rary
on
6/5/
2019
2:3
1:57
AM
. View Article Online

a complex fluidic circuit was established in a study by connect-ing the abdominal aorta and jugular vein to an extracorporealbypass loop that includes a flow stabilizer59,60 and aWheatstone-bridge analogue microfluidic channel.15 Based ontwo consecutive controls for reversal flow switching in thebridge channel,15 blood viscosity and flow rate were simul-taneously measured at a specific duration of time. In addition,the pressure at the abdominal aorta was analytically estimatedusing a discrete fluidic circuit model. As shown in Fig. 11A-(a),the proposed method was employed to monitor temporal vari-ations in the biophysical properties of rat blood circulating inthe fluidic network, especially under a continuous hemodilu-tion condition. After 30 min elapsed, PBS solution was sup-plied to the inlet (B) at a flow rate of 3 mL h−1. To monitorreversal flow switching in the bridge channel,15 rat blood of1 mL h−1 was repeatedly collected at intervals of 20 min fromthe outlet (B) after the stoppage of the syringe pump for thePBS solution. Given that the supplied volume of PBS solutionfor 20 min (ΔVPBS = 1 mL) was equal to the collected rat blood(ΔVBlood = 1 mL), the overall volume of rat blood was main-
tained at a constant level under a continuous hemodilutioncondition (i.e. ΔVBlood = ΔVPBS = 1 mL for 20 min).Haematocrit [Fig. 11A-(b)], balancing pressure [Fig. 11A-(c)]and flow rate [Fig. 11A-(d)] gradually decreased due to the con-tinuous hemodilution. The balancing pressure at the left junc-tion (PX) in the microfluidic channel was estimated using adiscrete fluidic-circuit model. As shown in Fig. 11A-(c), the bal-ancing pressure was decreased gradually with the elapse oftime. In addition, the blood pressure in the abdominal aorta(Prat) was decreased due to a continuous hemodilution effect.The reduced flow rate contributed to increased blood viscosity[Fig. 11A-(e)]. The proposed method was applied to monitorvariations in biophysical properties and platelet aggregationdepending on the diabetic duration after streptozotocin treat-ment in a rat.127 After collecting blood from the ex vivo bypassloop, RBC aggregation was quantified through a modified ESRmethod.92,104 The haemorheological properties of the diabeticrat blood were significantly changed compared with those in anormal rat. Platelet adhesion was considerably increased withthe increase in diabetic duration. In addition, the proposed
Fig. 10 Microfluidic-based measurements of haemorheological properties under ex vivo conditions. (A) Extracorporeal rat bypass loop for hemo-dynamic analysis.126 (a) Schematic of an experimental setup including an extracorporeal bypass fluidic conduit, three pinch valves and a microscopicimage acquisition system. (b) Variations in centreline velocity and velocity profiles at systolic and diastolic phases. (B) Simultaneous measurement ofviscosity and flow rate of blood flow in a complex fluidic circuit.42 (a) Schematic of an experimental setup including a rat, a pinch valve, a reservoir, amicrofluidic device, a peristaltic pump and a syringe pump. (b) Temporal variation in the number of indicating channels filled with blood in the right-side channel. The inset shows two distinctive relationships (i.e. NBlood vs. QBlood and wBlood vs. QBlood). Reproduced from ref. 42 and 126 with per-mission from Academic Press Inc. and American Institute of Physics.
Analyst Critical Review
This journal is © The Royal Society of Chemistry 2018 Analyst, 2018, 143, 2723–2749 | 2743
Publ
ishe
d on
11
Apr
il 20
18. D
ownl
oade
d by
PO
STE
CH
Lib
rary
on
6/5/
2019
2:3
1:57
AM
. View Article Online

method was successfully employed to monitor variations inthe biophysical properties of a sepsis rat model established byinjection of lipopolysaccharide.128
An ultrasound imaging system was additionally employedto monitor RBC aggregation in a rat bypass loop because high
shear rates in the microfluidic channel hinder the quantifi-cation of RBC aggregation occurring at stasis.44 As shown inFig. 11B-(a), the extracorporeal ray bypass loop was constructedby connecting a rat, a pulse-free chamber (or fluidic stabil-izer59,60), a twin-shaped microfluidic device,15 a syringe pump
Fig. 11 Microfluidic-based measurements of haemorheological properties under ex vivo conditions. (A) Temporal variations in the biophysical pro-perties (viscosity, flow rate and pressure) of rat blood circulating through a complex fluidic network under continuous hemodilution.43 (a) Schematicof the experimental setup. (b) Temporal variations in switching flow rate of PBS (Qs
PBS) and haematocrit of blood (Hct). (c) Temporal variations inblood pressure at the abdominal aorta (P). (d) Temporal variations in flow rate (QRat) and blood viscosity (μRat). (e) Variations in blood viscosity withrespect to flow rate at a specific time of t = 130 min. (B) Hybrid system used for haemorheological and hemodynamic analysis composed of amicrofluidic platform and an ultrasonic imaging system.44 (a) Schematic of the experimental setup. (b) Temporal variations in switching flow rate(Qs
PBS) and blood flow rate (QBlood). (c) Temporal variations in temperature (T ) and heart rate (HR). (d) Temporal variations in blood viscosity (μ) andpressure at the abdominal aorta (P). (e) Temporal variations in echogenicity (E) and decorrelation (Ds). Reproduced from ref. 43 and 44 with per-mission from the American Chemical Society and Nature Publishing Group.
Critical Review Analyst
2744 | Analyst, 2018, 143, 2723–2749 This journal is © The Royal Society of Chemistry 2018
Publ
ishe
d on
11
Apr
il 20
18. D
ownl
oade
d by
PO
STE
CH
Lib
rary
on
6/5/
2019
2:3
1:57
AM
. View Article Online

and an ultrasonic imaging system. The biophysical propertiesof rat blood were measured at intervals of 20 min for 100 min.As shown in the experimental results [Fig. 11B-(b)–(e)], afterinjecting a specific concentration of dextran solution at50 min, the echogenicity (E) measured by the ultrasonicsystem and the blood viscosity (µ) measured by the micro-fluidic device increased over time due to the enhanced RBCaggregation by the dextran solution. In addition, the meanpressure at the abdominal aorta and flow rate graduallydecreased. Experimental demonstration showed that thehybrid system can be effectively used to measure temporal vari-ations in biophysical properties, including RBC aggregation,viscosity, flow rate and blood pressure.
3.2 Blood clotting and cell activation
Under ex vivo circulation, a polyethylene tube was used toconnect the microfluidic device with blood vessels. The innersurfaces of tubes and microfluidic channels are made to comeinto direct contact with blood cells. Blood cells adhered on theinner surface of the tubes or microfluidic channels becauseblood cells are in contact with the non-physiological surface,and this phenomenon could cause interruption in blood flows.When platelets were exposed to high shear stress, they adheredand aggregated to the surface, which hindered blood flows.127
The hydrophobic surface properties of silicon-basedmaterials can induce adsorption of plasma proteins, and acti-vate blood clotting sequentially.129 Due to blood clotting inmicrofluidic channels or tubes, the functionality of the micro-fluidic device decreased over time.59,130,131 By modifying thesurface properties of silicone-based materials with PMC poly-mers, unfavourable protein adsorptions were significantlyreduced, compared with uncoated surfaces.129,132 Since it isdifficult to recreate the endothelium in microfluidic channels,a nitric oxide donor or soluble thrombomodulin was added toreplace the endothelium.133 The non-physiological contactsurface could be reduced or eliminated by adopting elasto-meric blood vessels134,135 or implanted microfluidic devices.136,137
High shear stress and direct contact with sub-endothelialcollagen also contribute to activating platelets, and formulat-ing thrombus in microfluidic channels.130,138 When plateletsexposed to high shear stress for a short time were irreversiblyactivated and aggregated at high shear stress, blood flowwas stopped in a microfluidic channel. Thus, platelet aggre-gation was measured by monitoring the migration distanceuntil the blood flow was completely stopped.138 Platelet aggre-gation usually causes to decrease blood flow until it reachesocclusion time. The unstable thrombus detachment increasedblood flow suddenly.131 When blood viscosity was measuredby monitoring the interfacial line between two co-flowingstreams, platelets were activated and stacked in the interfacialline or surface of the channel. Thus, blood viscosity was inac-curately measured, and continuously varied over time.59,130
Several microfluidic devices were introduced to measurecoagulation or clotting of blood. Ingber et al.125 suggested ashear gradient-activated microfluidic device for automatic
monitoring of platelet function and thrombus formation.Using a microfluidic device mimicked from a network ofstenosed arteriolar vessels, blood clotting was evaluated with asmall volume of blood under pathophysiological flow con-ditions. By analyzing clotting time with a mathematical modelof thrombus formation, the coagulation and platelet functionscould be accurately evaluated through in vitro and ex vivoexperiments. Maddala et al.139 suggested a multi-bypass micro-fluidics ladder network mimicked from venules to study plate-let aggregation and fibrin formation under blood flows.Dynamic blood flow was used to predict the patterns of bloodclotting at specific locations in the device. This method pro-vided a correlation between microvascular geometry andthrombus formation under blood flow. Lee et al.130 suggesteda correlation mapping for estimating platelet adhesion in amicrofluidic channel. The platelet adhesion was evaluated byintegrating the area of adhered platelets (Aplatelet) for a specifictime. Under ex vivo conditions, they measured plateletadhesion and blood viscosity simultaneously over time.Through a comparative study, the blood viscosity and plateletadhesion of diabetic rats were found to be higher than thoseof normal rats.
For point-of-care testing, a miniaturized clot device wasdeveloped to measure the dynamic clot refraction forces usinga small volume of whole blood.140 In addition, a microfluidicdielectric sensor was introduced to measure multiple coagu-lation factors and platelet activity.141
3.3 Discussion on a haemorheological study under ex vivoconditions
Most previously developed techniques43,44 still present techni-cal limitations in continuous measurements of biophysicalproperties of blood. Firstly, after collecting blood samplesfrom the closed loop repeatedly, blood viscosity or RBC aggre-gation was measured under in vitro conditions. Given thatblood volume circulating in the closed loop decreased gradu-ally, the total monitoring time was relatively short (less than100–120 min). In addition, haemorheological properties,including viscosity and RBC aggregation, were repeatedlymonitored at specific intervals of time instead of a continuousmode. To resolve these problems, haemorheological propertiesin closed-loop circulation must be measured without the col-lection of blood from the closed loop. Secondly, conventionalmethods utilise bulk-sized instruments, such as a microscopeequipped with a high-speed camera for measuring fluid ve-locity or an ultrasonic imaging system for measuring RBCaggregation. Thus, they can be used only in laboratory environ-ments equipped with expensive instruments. Evidently, detect-ing haemorheological properties with simple analyticalsensors, including pressure sensors, flow rate sensors,vibrational spectroscopes and impedance analysers, isrequired. Lastly, previous methods focused on two haemorheo-logical properties, namely, blood viscosity and RBC aggrega-tion. Although RBC deformability or haematocrit is consideredan effective parameter for detecting cardiovascular diseases,
Analyst Critical Review
This journal is © The Royal Society of Chemistry 2018 Analyst, 2018, 143, 2723–2749 | 2745
Publ
ishe
d on
11
Apr
il 20
18. D
ownl
oade
d by
PO
STE
CH
Lib
rary
on
6/5/
2019
2:3
1:57
AM
. View Article Online

previous methods did not provide information on RBCdeformability under ex vivo conditions. Thus, multiple haemo-rheological properties, including blood viscosity, RBC aggre-gation and RBC deformability, need to be measured underex vivo conditions.
4. Conclusions and perspectives
Biophysical properties of blood, including blood viscosity, RBCaggregation and RBC deformability, have been independentlymeasured to monitor their variations in blood specimens col-lected from patients with haematological disorders. In thisreview, several techniques for measuring haemorheologicalproperties (blood viscosity, RBC deformability and RBC aggre-gation) based on microfluidic platforms (i.e. in vitro condition)and extracorporeal bypass loops of animal models (i.e. ex vivocondition) were discussed. New technologies that can effec-tively and consistently provide comprehensive information onbiophysical properties of blood circulating in the ex vivo closedloop are still needed. Firstly, commercialized products for theclinical measurement of haemorheological properties weresummarized in Fig. S1 (ESI†). Most techniques were focusedon a single property rather than multiple properties. Aneffective haemorheological index combined with several bio-physical properties has not been proposed to diagnosehaematological diseases under in vitro conditions. Thus, ablood-on-a-chip scheme needs to be developed for simul-taneous measurements of haemorheological properties from ablood sample with a small volume. Secondly, most previoustechniques are feasible under in vitro experimental conditionsonly. They require bulk-sized instruments, including a micro-scope for visualising blood flows and a high-speed camera forobserving flow images. In addition, when an in vitro method isemployed to measure haemorheological properties underex vivo conditions, initial hemodilution is basically required tocollect blood, and blood viscosity is then measured underin vitro conditions. However, hemodilution can alter the bio-physical properties of blood measured for a short-term periodof 100–130 min. To resolve these problems, a new analyticalmethod should be developed for long-term and continuousmeasurements of haemorheological properties without hemo-dilution and periodic blood collection. Lastly, long polyethyl-ene tubes are usually employed to connect a microfluidicdevice with blood vessels for establishing the extracorporealrat bypass loop. Given that blood cells are in direct contactwith a non-physiological surface, they adhere on the innersurface of the tube, which interrupts blood flows in a short-term period. To resolve this problem, the non-physiologicalsurface must be reduced or removed by using elastomericblood vessels134,135 or implanted microfluidic devices.136,137 Inthe near future, a new analytical methodology based on amicrofluidic platform will be employed to diagnose haemato-logical disorders and to screen effective treatment methods forcuring them.
Conflicts of interest
There are no conflicts of interest to declare.
Acknowledgements
This work was supported by a National Research Foundationof Korea grant funded by the Korean Government (MSIP) (no.2008-0061991). In addition, this work was supported by theBasic Science Research Program through NRF funded by theMinistry of Science, ICT and Future Planning(NRF-2018R1A1A1A05020389).
References
1 E. J. Benjamin, M. J. Blaha, S. E. Chiuve, M. Cushman,S. R. Das, R. Deo, S. D. d. Ferranti, J. Floyd, M. Fornage,C. Gillespie, et al., Circulation, 2017, 135, e146–e603.
2 P. C. Sousa, F. T. Pinho, M. A. Alves and M. S. N. Oliveira,Korea-Aust. Rheol. J., 2016, 28, 1–22.
3 J. Danesh, R. Collins, R. Peto and G. D. O. Lowe, Eur.Heart J., 2000, 21, 515–520.
4 J. Yayan, Vasc. Health Risk Manage., 2012, 8, 219–223.5 A. L. Copley and G. V. F. Seaman, Clin. Hemorheol., 1981,
1, 117–119.6 G. A. Pop, Z.-y. Chang, C. J. Slager, B.-J. Kooij,
E. D. v. Deel, L. Moraru, J. Quak, G. C. Meijer andD. J. Duncker, Biosens. Bioelectron., 2004, 19, 1685–1693.
7 H. Y. Lee, C. Barber, J. A. Rogers and A. R. Minerick,Electrophoresis, 2015, 36, 978–985.
8 S. Kim, R. L. Kong, A. S. Popel, M. Intaglietta andP. C. Johnson, Am. J. Physiol.: Heart Circ. Physiol., 2007,293, H1526–H1535.
9 D. A. Fedosov, B. Caswell, A. S. Popel andG. E. Karniadakis, Microcirculation, 2010, 17, 615–628.
10 R. Fahraeus and T. Lindqvist, Am. J. Physiol., 1931, 96,562–568.
11 J. H. Barbee and G. R. Cokelet, Microvasc. Res., 1971, 3, 6–16.
12 T. M. Fischer, M. Sthohr-Liesen and H. Schmid-Schonbein, Science, 1978, 202, 894–896.
13 G. Késmárky, P. Kenyeres, M. Rábai and K. Tóth, Clin.Hemorheol. Microcirc., 2008, 39, 243–246.
14 Y. J. Kang and S. Yang, Microfluid. Nanofluid., 2013, 14,657–668.
15 Y. J. Kang, J. Ryu and S.-J. Lee, Biomicrofluidics, 2013, 7,044106.
16 S. Gupta, W. S. Wang and S. A. Vanapalli, Biomicrofluidics,2016, 10, 043402.
17 B. J. Ballermann, A. Dardik, E. Eng and A. Liu, Kidney Int.,1998, 54, S-100–S-108.
18 C. Spencer and G. Lip, J. Hum. Hypertens., 2000, 14, 291–293.
Critical Review Analyst
2746 | Analyst, 2018, 143, 2723–2749 This journal is © The Royal Society of Chemistry 2018
Publ
ishe
d on
11
Apr
il 20
18. D
ownl
oade
d by
PO
STE
CH
Lib
rary
on
6/5/
2019
2:3
1:57
AM
. View Article Online

19 R. L. Letcher, S. Chien, T. G. Pickering, D. Phil, J. E. Sealeyand J. H. Laragh, Am. J. Med., 1981, 70, 1195–1202.
20 Y. I. Cho, M. P. Mooney and D. J. Cho, J. Diabetes Sci.Technol., 2008, 2, 1130–1138.
21 Z. Wen, J. Xie, Z. Guan, D. Sun, W. Yao, K. Chen, Z.-y. Yanand Q. Mu, Clin. Hemorheol. Microcirc., 2000, 22, 261–266.
22 S. H. Song, J. H. Kim, J. H. Lee, Y.-M. Yun, D.-H. Choi andH. Y. Kim, BMC Neurol., 2017, 17, 20.
23 G. Lowe, A. Rumley, J. Norrie, I. Ford, J. Shepherd,S. Cobbe, P. Macfarlane and C. Packard, Thromb.Haemostasis, 2000, 84, 553–558.
24 I. Velcheva, N. Antonova, E. Titianova, P. Damianov,N. Dimitrov and I. Ivanov, Clin. Hemorheol. Microcirc.,2006, 35, 195–198.
25 M. J. Santos, L. M. Pedro, H. Canhão, J. F. e. Fernandes,J. CanasdaSilva, J. E. Fonseca and C. Saldanha,Atherosclerosis, 2011, 219, 821–826.
26 J. Ditzel, H. O. Bang and N. Thorsen, J. Intern. Med., 1968,183, 577–579.
27 A. Groisman, M. Enzelberger and S. R. Quake, Science,2003, 300, 955–958.
28 M. Abkarian, M. Faivre and H. A. Stone, Proc. Natl. Acad.Sci. U. S. A., 2006, 103, 538–542.
29 S. A. Vanapalli, D. v. d. Ende, M. H. G. Duits andF. Mugele, Appl. Phys. Lett., 2007, 90, 114109.
30 S. A. Vanapalli, A. G. Banpurkar, D. v. d. Ende,M. H. G. Duits and F. Mugele, Lab Chip, 2009, 9, 982–990.
31 P. Guillot, T. Moulin, R. Kötitz, M. Guirardel, A. Dodge,M. Joanicot, A. Colin, C.-H. Bruneau and T. Colin,Microfluid. Nanofluid., 2008, 5, 619–630.
32 D. E. Solomon and S. A. Vanapalli, Microfluid. Nanofluid.,2014, 16, 677–690.
33 P. Guillot and A. Colin, Microfluid. Nanofluid., 2014, 17,605–611.
34 Y. J. Kang, Analyst, 2016, 141, 6583–6597.35 N.-T. Nguyen, Y.-F. Yap and A. Sumargo, Meas. Sci.
Technol., 2008, 19, 085405.36 B. K. Wunderlich and A. R. Bausch, RSC Adv., 2013, 3,
21730–21735.37 S. Choi and J.-K. Park, Small, 2010, 6, 1306–1310.38 Y. J. Kang, S. Y. Yoon, K.-H. Lee and S. Yang, Artif. Organs,
2010, 34, 944–949.39 B. J. Kim, S. Y. Lee, S. Jee, A. Atajanov and S. Yang,
Sensors, 2017, 17, 1442.40 E. Yeom, Y. J. Kang and S.-J. Lee, Biomicrofluidics, 2014, 8,
034110.41 Y. J. Kang and S.-J. Lee, Biomicrofluidics, 2013, 7, 054122.42 Y. J. Kang, E. Yeom and S.-J. Lee, Biomicrofluidics, 2013, 7,
054111.43 Y. J. Kang, E. Yeom and S.-J. Lee, Anal. Chem., 2013, 85,
10503–10511.44 E. Yeom, Y. J. Kang and S.-J. Lee, Sci. Rep., 2015, 5, 11064.45 K. Kang, L. J. Lee and K. W. Koelling, Exp. Fluids, 2005,
38, 222–232.46 S. D. Hudson, P. Sarangapani, J. A. Pathak and
K. B. Migler, J. Pharm. Sci., 2015, 104, 678–685.
47 C. J. Pipe, T. S. Majmudar and G. H. McKinley, Rheol. Acta,2008, 47, 621–642.
48 J. Chevalier and F. Ayela, Rev. Sci. Instrum., 2008, 79,076102.
49 T. Jung and S. Yang, Sensors, 2015, 15, 11823–11835.50 N. Srivastava, R. D. Davenport and M. A. Burns, Anal.
Chem., 2005, 77, 383–392.51 N. Srivastava and M. A. Burns, Anal. Chem., 2006, 78,
1690–1696.52 N. Srivastava and M. A. Burns, Lab Chip, 2006, 6, 744–751.53 Z. Han, X. Tang and B. Zheng, J. Micromech. Microeng.,
2007, 17, 1828–1834.54 Z. Han and B. Zheng, J. Micromech. Microeng., 2009, 19,
115005.55 D. E. Solomon, A. Abdel-Raziq and S. A. Vanapalli, Rheol.
Acta, 2016, 55, 727–738.56 S. Oh, B. Kim, J. K. Lee and S. Choi, Sens. Actuators, B,
2018, 259, 106–113.57 H. Zeng and Y. Zhao, Sens. Actuators, A, 2011, 166, 207–
213.58 M. Kim, A. Kim, S. Kim and S. Yang, Biosens. Bioelectron.,
2012, 35, 416–420.59 Y. J. Kang, E. Yeom, E. Seo and S.-J. Lee, Biomicrofluidics,
2014, 8, 014102.60 Y. J. Kang and S. Yang, Lab Chip, 2012, 12, 1881–1889.61 Y. J. Kang, Sensors, 2017, 17, 2037.62 Y. J. Kang, Biomicrofluidics, 2017, 11, 014102.63 X. Mao and T. J. Huang, Lab Chip, 2012, 12, 4006–4009.64 D. D. Carlo, JALA, 2012, 17, 32–42.65 Y. J. Kang, Y.-R. Ha and S.-J. Lee, Anal. Chem., 2016, 88,
2912–2922.66 J. P. Shelby, J. White, K. Ganesan, P. K. Rathod and
D. T. Chiu, Proc. Natl. Acad. Sci. U. S. A., 2003, 100, 14618–14622.
67 Y.-C. Chen, Y.-C. Lin, G.-Y. Chen and G.-J. Wang,Microfluid. Nanofluid., 2010, 9, 585–591.
68 T. Herricks, M. Antia and P. K. Rathod, Cell. Microbiol.,2009, 11, 1340–1353.
69 P. Preira, V. Grandne, J.-M. Forel, S. Gabriele, M. Camaraand O. Theodoly, Lab Chip, 2013, 13, 161–170.
70 Y. N. Luo, D. Y. Chen, Y. Zhao, C. Wei, X. T. Zhao,W. T. Yue, R. Long, J. B. Wang and J. Chen, Sens.Actuators, B, 2014, 202, 1183–1189.
71 Q. Guo, S. J. Reiling, P. Rohrbach and H. Ma, Lab Chip,2012, 12, 1143–1150.
72 G. Mahmud, C. J. Campbell, K. J. M. Bishop,Y. A. Komarova, O. Chaga, S. Soh, S. Huda, K. Kandere-Grzybowska and B. A. Grzybowski, Nat. Phys., 2009, 5,606–612.
73 R. O. Rodrigues, D. Pinho, V. Faustino and R. Lima,Biomed. Microdevices, 2015, 17, 108.
74 H. W. Hou, A. A. S. Bhagat, A. G. L. Chong, P. Mao,K. S. W. Tan, J. Han and C. T. Lim, Lab Chip, 2010, 10,2605–2613.
75 M. J. Rosenbluth, W. A. Lam and D. A. Fletcher, Lab Chip,2008, 8, 1062–1070.
Analyst Critical Review
This journal is © The Royal Society of Chemistry 2018 Analyst, 2018, 143, 2723–2749 | 2747
Publ
ishe
d on
11
Apr
il 20
18. D
ownl
oade
d by
PO
STE
CH
Lib
rary
on
6/5/
2019
2:3
1:57
AM
. View Article Online

76 J. R. Lange, J. Steinwachs, T. Kolb, L. A. Lautscham,I. Harder, G. Whyte and B. Fabry, Biophys. J., 2015, 109,26–34.
77 J. R. Lange, C. Metzner, S. Richter, W. Schneider,M. Spermann, T. Kolb, G. Whyte and B. Fabry, Biophys. J.,2017, 112, 1472–1480.
78 H. Bow, I. V. Pivkin, M. Diez-Silva, S. J. Goldfless, M. Dao,J. C. Niles, S. Suresh and J. Han, Lab Chip, 2011, 11, 1065–1073.
79 S. S. Shevkoplyas, T. Yoshida, S. C. Gifford andM. W. Bitensky, Lab Chip, 2006, 6, 914–920.
80 S. Youn, D. Lee and Y.-H. Cho, J. Microelectromech. Syst.,2008, 17, 302–308.
81 Q. Guo, S. P. Duffy, K. Matthews, X. Deng, A. T. Santoso,E. Islamzada and H. Ma, Lab Chip, 2016, 16, 645–654.
82 E. S. Park, C. Jin, Q. Guo, R. R. Ang, S. P. Duffy,K. Matthews, A. Azad, H. Abdi, T. Todenhöfer, J. Bazov,et al., Small, 2016, 12, 1909–1919.
83 Y. J. Kang, Y.-R. Ha and S.-J. Lee, Analyst, 2016, 141, 319–330.84 J. M. A. Mauritz, T. Tiffert, R. Seear, F. Lautenschläger,
A. Esposito, V. L. Lew, J. Guck and C. F. Kaminski,J. Biomed. Opt., 2010, 15, 030517.
85 E. Du, S. Ha, M. Diez-Silva, M. Dao, S. Suresh andA. P. Chandrakasan, Lab Chip, 2013, 13, 3903–3909.
86 Y. Zheng, E. Shojaei-Baghini, A. Azad, C. Wang andY. Sun, Lab Chip, 2012, 12, 2560–2567.
87 Y. Zheng, J. Nguyen, Y. Wei and Y. Sun, Lab Chip, 2013,13, 2464–2483.
88 Z. Isiksacan, O. Erel and C. Elbuken, Lab Chip, 2016, 16,4682–4690.
89 K. Lee, C. Wagner and A. V. Priezzhev, J. Biomed. Opt.,2017, 22, 091516.
90 B. Neu and H. J. Meiselman, Biophys. J., 2002, 83, 2482–2490.91 P. Steffen, C. Verdier and C. Wagner, Phys. Rev. Lett., 2013,
110, 018102.92 Y. J. Kang, Y.-R. Ha and S.-J. Lee, Biomicrofluidics, 2014, 8,
044114.93 J.-X. Hou and S. Shin, Korea-Aust. Rheol. J., 2008, 20, 253–
260.94 H.-J. Lim, Y.-J. Lee, J.-H. Nam, S. Chung and S. Shin,
J. Biomech., 2010, 43, 546–550.95 J.-H. Nam, Y. Yang, S. Chung and S. Shin, J. Biomed. Opt.,
2010, 15, 027003.96 S. Shin, Y. Yang and J.-S. Suh, Clin. Hemorheol. Microcirc.,
2009, 41, 197–207.97 S. Shin, J. H. Jang, M. S. Park, Y. H. Ku and J. S. Suh,
Korea-Aust. Rheol. J., 2005, 17, 9–13.98 O. K. Baskurt, M. Uyuklu and H. J. Meiselman, IEEE
Trans. Biomed. Eng., 2010, 57, 969–976.99 N. Antonova, P. Riha and I. Ivanov, Clin. Hemorheol.
Microcirc., 2008, 39, 69–78.100 C. Balan, C. Balut, L. Gheorghe, C. Gheorghe, E. Gheorghiu
and G. Ursu, Clin. Hemorheol. Microcirc., 2004, 30, 359–364.101 A. Zhbanov and S. Yang, PLoS One, 2015, 10, e0129337.102 E. Kaliviotis, J. M. Sherwood and S. Balabani, Sci. Rep.,
2017, 7, 44563.
103 J. M. Sherwood, J. Dusting, E. Kaliviotis and S. Balabani,Biomicrofluidics, 2012, 6, 024119.
104 E. Yeom and S.-J. Lee, Biomicrofluidics, 2015, 9, 024110.105 M. Brust, O. Aouane, M. Thie’baud, D. Flormann,
C. Verdier, L. Kaestner, M. W. Laschke, H. Selmi,A. Benyoussef, T. Podgorski, G. Coupier, C. Misbah andC. Wagner, Sci. Rep., 2014, 4, 4348.
106 G. Metry, M. Spittle, S. Rahmati, C. Giller, A. Giller,A. Kaufman, D. Schneditz, E. Manno, Z. Brener,I. Boniece, et al., Am. J. Kidney Dis., 2002, 40, 996–1004.
107 Y. J. Kang, M. G. Kim, K. H. Son, C. H. Lim, H. S. Son,S. Y. Yoon, H. S. Kwon and S. Yang, Artif. Organs, 2010, 34,E103–E109.
108 C. B. Ahn, Y. J. Kang, M. G. Kim, S. Yang, C. H. Lim,H. S. Son, J. S. Kim, S. Y. Lee, K. H. Son and K. Sun,Korean J. Thorac. Cardiovasc. Surg., 2016, 49, 145–150.
109 S. R. F. Whittaker and F. R. Winton, J. Physiol., 1933, 78,339–369.
110 R. Fahraeus and R. Lindqvist, Am. J. Physiol., 1931, 96,562–568.
111 S. Kim, R. L. Kong, A. S. Popel, M. Intaglietta andP. C. Johnson, Am. J. Physiol.: Heart Circ. Physiol., 2007,293, H1526–H1535.
112 J. Zhang, P. C. Johnson and A. S. Popel, Microvasc. Res.,2009, 77, 265–272.
113 A. R. Pries and T. W. Secomb, Am. J. Physiol.: Heart Circ.Physiol., 2005, 289, H2657–H2664.
114 O. K. Baskurt, Biorheology, 2008, 45, 629–638.115 G. A. M. Pop, L. L. A. Bisschops, B. Iliev, P. C. Struijk,
J. G. v. d. Hoeven and C. W. E. Hoedemaekers, Biosens.Bioelectron., 2013, 41, 595–601.
116 G. A. M. Pop, T. L. M. d. Backer, M. d. Jong, P. C. Struijk,L. Moraru, Z. Chang, H. G. Goovaerts, C. J. Slager andA. J. J. C. Bogers, Eur. Surg. Res., 2004, 36, 259–265.
117 E. I. Galanzha and V. P. Zharov, Cytometry, Part A, 2011,79A, 746–757.
118 J. Tripette, L.-C. Nguyen, L. Allard, P. Robillard, G. Soulezand G. Cloutier, PLoS One, 2015, 10, e0124712.
119 W. Choi, H. M. Kim, S. Park, E. Yeom, J. Doh and S. J. Lee,J. R. Soc., Interface, 2017, 14, 20160900.
120 J. J. Bishop, P. R. Nance, A. S. Popel, M. Intaglietta andP. C. Johnson, Am. J. Physiol.: Heart Circ. Physiol., 2001,280, H222–H236.
121 A. Jaishankar, V. Sharma and G. H. McKinley, Soft Matter,2011, 7, 7623–7634.
122 A. Daly, J. S. Raval, J. H. Waters, M. H. Yazer andM. V. Kameneva, Clin. Hemorheol. Microcirc., 2014, 56,337–345.
123 O. Yalcin, D. Ortiz, A. G. Tsai, P. C. Johnson andP. Cabrales, Transfusion, 2014, 54, 1015–1027.
124 A. Hafezi-Moghadam, K. L. Thomas and C. Cornelssen,Am. J. Physiol.: Cell Physiol., 2004, 286, C876–C892.
125 A. Jain, A. Graveline, A. Waterhouse, A. Vernet,R. Flaumenhaft and D. E. Ingber, Nat. Commun., 2016, 7,10176.
Critical Review Analyst
2748 | Analyst, 2018, 143, 2723–2749 This journal is © The Royal Society of Chemistry 2018
Publ
ishe
d on
11
Apr
il 20
18. D
ownl
oade
d by
PO
STE
CH
Lib
rary
on
6/5/
2019
2:3
1:57
AM
. View Article Online

126 K.-H. Nam, E. Yeom and S.-J. Lee, Microvasc. Res., 2012,83, 372–375.
127 E. Yeom, H. Byeon and S.-J. Lee, Sci. Rep., 2016, 6, 21913.128 E. Yeom, H. M. Kim, J. H. Park, W. Choi, J. Doh and
S.-J. Lee, Sci. Rep., 2017, 7, 1801.129 K. Nagahashi, Y. Teramura and M. Takai, Colloids Surf., B,
2015, 134, 384–391.130 E. Yeom, J. H. Park, Y. J. Kang and S. J. Lee, Sci. Rep.,
2016, 6, 24994.131 M. Li, N. A. Hotaling, D. N. Ku and C. R. Forest, PLoS One,
2014, 9, e82493.132 J. Sibarani, M. Takai and K. Ishihara, Colloids Surf., B,
2007, 54, 88–93.133 T. V. Colace, G. W. Tormoen, O. J. T. McCarty and
S. L. Diamond, Annu. Rev. Biomed. Eng., 2013, 15, 283–303.134 W. Zhang, Y. S. Zhang, S. M. Bakht, J. Aleman, S. Shin,
K. Yue, M. Sica, J. Ribas, M. Duchamp, J. Ju, et al., LabChip, 2016, 16, 1579–1586.
135 X.-Y. Wang, Y. Pei, M. Xie, Z.-H. Jin, Y.-S. Xiao, Y. Wang,L.-N. Zhang, Y. Lic and W.-H. Huang, Lab Chip, 2015, 15,1178–1187.
136 J. Kim, K. Yang, H.-J. Park, S. Han, Y. Shin, J. H. Lee,S. Chung and S.-W. Cho, Biotechnol. Bioprocess Eng., 2014,19, 379–385.
137 H. Takehara, A. Nagaoka, J. Noguchi, T. Akagi, H. Kasaiand T. Ichiki, Sci. Rep., 2014, 4, 6721.
138 H. Lee, G. Kim, C. Lim, B. Lee and S. Shin,Biomicrofluidics, 2016, 10, 064118.
139 J. Zilberman-Rudenko, J. L. Sylman, H. H. S. Lakshmanan,O. J. T. McCarty and J. Maddala, Cell. Mol. Bioeng., 2017,10, 16–29.
140 Z. Li, X. Li, B. McCracken, Y. Shao, K. Ward and J. Fu,Small, 2016, 12, 3926–3934.
141 E. X. Stavrou, M. A. Suster, D. Maji, E. Kucukl,U. D. S. Sekhon, A. H. Schmaier, A. S. Gupta, U. A. Gurkanand P. Mohseni, Blood, 2016, 128, 3754.
Analyst Critical Review
This journal is © The Royal Society of Chemistry 2018 Analyst, 2018, 143, 2723–2749 | 2749
Publ
ishe
d on
11
Apr
il 20
18. D
ownl
oade
d by
PO
STE
CH
Lib
rary
on
6/5/
2019
2:3
1:57
AM
. View Article Online