in uence of fake news in twitter during the 2016 us
TRANSCRIPT

Influence of fake news in Twitter during the 2016 US
presidential election
Alexandre Bovet1,2,3, Hernan A. Makse1,∗
1) Levich Institute and Physics Department, City College of New York, New York, New York 10031,
USA
2) ICTEAM, Universite Catholique de Louvain, Avenue George Lemaıtre 4, 1348 Louvain-la-Neuve,
Belgium
3) naXys and Department of Mathematics, Universite de Namur, Rempart de la Vierge 8, 5000
Namur, Belgium.
Abstract
The dynamics and influence of fake news on Twitter during the 2016 US presidential election
remains to be clarified. Here, we use a dataset of 171 million tweets in the five months preceding
the election day to identify 30 million tweets, from 2.2 million users, which contain a link to news
outlets. Based on a classification of news outlets curated by www.opensources.co, we find that
25% of these tweets spread either fake or extremely biased news. We characterize the networks
of these users to find the most influential spreaders of fake and traditional news and use causal
modelling to uncover how fake news influenced the presidential election. We find that, while top
influencers spreading traditional center and left leaning news largely influence the activity of Clinton
supporters, this causality is reversed for the fake news: the activity of Trump supporters influences
the dynamics of the top fake news spreaders.
1 Introduction
Recent social and political events, such as the 2016 US presidential election [1], have been marked
by a growing number of so-called “fake news”, i.e. fabricated information that disseminate deceptive
content, or grossly distort actual news reports, shared on social media platforms. While misinfor-
mation and propaganda have existed since ancient times [2], their importance and influence in the
age of social media is still not clear. Indeed, massive digital misinformation has been designated as
a major technological and geopolitical risk by the 2013 report of the World Economic Forum [3]. A
substantial number of studies have recently investigated the phenomena of misinformation in online
social networks such as Facebook [4–10] Twitter [10–13], YouTube [14] or Wikipedia [15]. These in-
vestigations, as well as theoretical modeling [16, 17], suggest that confirmation bias [18] and social
influence results in the emergence, in online social networks, of user communities that share similar
beliefs about specific topics, i.e. echo chambers, where unsubstantiated claims or true information,
aligned with these beliefs, are as likely to propagate virally [6, 19]. A comprehensive investigation of
the spread of true and false news in Twitter also showed that false news is characterized by a faster
and broader diffusion than true news mainly due to the attraction of the novelty of false news [12].
A polarization in communities is also observed in the consumption of news in general [20, 21] and
corresponds with political alignment [1]. Recent works also revealed the role of bots, i.e. automated
accounts, in the spread of misinformation [12, 23–25]. In particular, Shao et al. found that, during
the 2016 US presidential election on Twitter, bots were responsible for the early promotion of misin-
formation, that they targeted influential users through replies and mentions [26] and that the sharing
of fact-checking articles nearly disappears in the core of the network, while social bots proliferate [13].
These results have raised the question of whether such misinformation campaigns could alter public
1
arX
iv:1
803.
0849
1v2
[cs
.SI]
20
Mar
201
9

opinion and endanger the integrity of the presidential election [24].
Here, we use a dataset of 171 million tweets sent by 11 million users covering almost the whole activity
of users regarding the two main US presidential candidates, Hillary Clinton and Donald Trump, col-
lected during the five months preceding election day and used to extract and analyze Twitter opinion
trend in our previous work [27]. We compare the spread of news coming from websites that have been
described as displaying fake news with the spread of news coming from traditional, fact-based, news
outlets with different political orientations. We relied upon the opinion of communications scholars
(see Methods for details) who have classified websites as containing fake news or extremely biased
news. We investigate the diffusion in Twitter of each type of media to understand what is their rela-
tive importance, who are the top news spreaders and how they drive the dynamics of Twitter opinion.
We find that, among the 30.7 million tweets containing an URL directing to a news outlet website, 10%
point toward websites containing fake news or conspiracy theory and 15% point toward websites with
extremely biased news. When considering only tweets originating from non-official Twitter clients, we
see a tweeting rate for users tweeting links to websites containing news classified as fake more than four
times larger than for traditional media, suggesting a larger role of bots in the diffusion of fake news.
We separate traditional news outlets from the least biased to the most biased and reconstruct the
information flow networks by following retweets tree for each type of media. User diffusing fake news
form more connected networks with less heterogeneous connectivity than users in traditional center
and left leaning news diffusion networks. While top news spreaders of traditional news outlets are
journalists and public figures with verified Twitter accounts, we find that a large number of top fake
and extremely biased news spreaders are unknown users or users with deleted Twitter accounts. The
presence of two clusters of media sources and their relation with the supporters of each candidate is
revealed by the analysis of the correlation of their activity. Finally, we explore the dynamics between
the top news spreaders and the supporters’ activity with a multivariate causal network reconstruc-
tion [28]. We find two different mechanisms for the dynamics of fake news and traditional news. The
top spreaders of center and left leaning news outlets, who are mainly journalists, are the main drivers
of Twitter’s activity and in particular of Clinton supporters’ activity, who represent the majority in
Twitter [27]. For fake news, we find that it is the activity of Trump supporters that governs their
dynamics and top spreaders of fake news are merely following it.
2 Results
2.1 News spreading in Twitter
To characterize the spreading of news in Twitter we analyze all the tweets in our dataset that contained
at least one URL (Uniform Resource Locator, i.e. web address) linking to a website outside of Twitter.
We first separate URL in two main categories based on the websites they link to: websites containing
misinformation and traditional, fact-based, news outlets. We use the term traditional in the sense
that news outlets in this category follow the traditional rules of fact-based journalism and therefore
also include recently created news outlets (e.g. vox.com).
Classifying news outlets as spreading misinformation or real information is a matter of individual
judgment and opinion, and subject to imprecision and controversy. We include a finer classification
of news outlets spreading misinformation in two sub-categories: fake news and extremely biased news.
Fake news websites are websites that have been flagged as consistently spreading fabricated news or
conspiracy theories by several fact-checking groups. Extremely biased websites include more contro-
versial websites that not necessarily publish fabricated information but distort facts and may rely on
propaganda, decontextualized information, or opinions distorted as facts. We base our classification
2
of misinformation websites on a curated list of websites which, in the judgment of a media and com-
munication research team headed by a researcher of Merrimack College, USA, are either fake, false,
conspiratorial or misleading (see Methods). They classify websites by analyzing several aspects, such
as if they try to imitate existing reliable websites, if they were flagged by fact-checking groups (e.g.
snopes.com, hoax-slayer.com and factcheck.org), or by analyzing the sources cited in articles (the
full explanation of their methods is available at www.opensources.co). We discard insignificant out-
lets accumulating less then one percent of the total number of tweets in their category. We classify the
remaining websites in the extremely biased category according to their political orientation by manu-
ally checking the bias report of each websites on www.allsides.com and mediabiasfactcheck.com.
Details about our classification of websites spreading misinformation is available in the Methods sec-
tion.
We also use a finer classification for traditional news websites based on their political orientation.
We identify the most important traditional news outlets by manually inspecting the list of top 250
URL’s hostnames, representing 79% of all URLs, shared on Twitter. We classify news outlets as
right, right leaning, center, left leaning or left based on their reported bias on www.allsides.com and
mediabiasfactcheck.com. The news outlets in the right leaning, center and left leaning categories
are more likely to follow the traditional rules of fact-based journalism. As we move toward more biased
categories, websites are more likely to have mixed factual reporting. As for misinformation websites,
we discard insignificant outlets by keeping only websites that accumulate more than one percent of
the total number of tweets of their respective category. Although we do not know how many news
websites are contained in the list of less popular URLs, a threshold as small as 1% allows us to capture
a relatively broad sample of the media in term of popularity. Assuming that the decay in popularity
of the websites in each media category is similar, our measure of the proportion of tweets and users in
each category should not be significantly changed if we extended our measure to the entire dataset of
tweets with URLs. While the detail of our classification is subject to some subjectivity, we find that our
analysis reveals patterns encompassing several media categories that form group with similar charac-
teristic. Our results are therefore robust to changes of classification within these larger group of media.
We report the hostnames in each categories along with the number of tweets with a URL point-
ing toward them in Supplementary Table 1. Using this final separation in seven classes, we iden-
tify in our dataset (we give the top hostname as en example in parenthesis): 16 hostnames corre-
sponding to fake news websites (e.g. thegatewaypundit.com), 17 hostnames for extremely biased
(right) news websites (e.g. breitbart.com), 7 hostnames for extremely biased (left) news websites
(e.g. dailynewsbin.com), 18 hostnames for left news websites (e.g. huffingtonpost.com), 19 host-
names for left leaning news websites (e.g. nytimes.com), 13 hostnames for center news websites (e.g.
cnn.com), 7 hostnames for right leaning websites (e.g. wsj.com) and 20 hostnames for right websites
(e.g. foxnews.com).
We identified 30.7 million tweets with an URLs directing to a news outlet website, sent by 2.3 million
users. An important point when comparing the absolute number of tweets and users contributing to
the spread of different types of news is the bias introduced by the keywords selected during the data
collection. Indeed, if we had used keywords targeting specific news outlets or hashtags concerning
specific news event, it would be impossible to perfectly control the bias toward fake and reliable news
or representation of the political orientation of the tweet sample. Here, we used neutral keywords in
term of media representation, the names of the two main candidates to the presidential election (see
Methods), in order to collect a sample representative of the real coverage of the election on Twitter
by all media sources.
3

Figure 1: Importance of different types of news outlets in Twitter. Number of distinct tweets (a)and number of distinct users having sent tweets (b) with a URL pointing to a website belonging to one offollowing categories: fake or extremely biased, right, right leaning, center, left or left leaning news outlets.While the tweet volume of fake and extremely biased news is comparable to the tweet volumes of center and leftvolume (a), users posting fake and extremely biased news are around twice more active in average (see Table 1).Consequently, the share of users posting fake and extremely biased news (b) is smaller (12%) than the share oftweets directing toward fake and extremely biased news websites (25%).
We see a large number of tweets linking to fake news websites and extremely biased news websites
(Fig. 1a and Table 1). However, the majority of tweets linking to news outlets points toward left lean-
ing news websites closely followed by center news websites. Tweets directing to left and left leaning
news websites represent together 38% of the total and tweets directing towards center news outlets
represents 21%. Tweets directing to fake and extremely biased news websites represents a share of
25%. When considering the number of distinct users having sent the tweets instead of the number
of tweets (Fig. 1b and Table 1), the share of left and left leaning websites increases to 43% and the
share of center news to 29%, while the share going to fake news and extremely biased news is equal
Nt pt Nu pu Nt/Nu pt,n/o pu,n/o Nt,n/o/Nu,n/o
fake news 2 991 073 0.10 204 899 0.05 14.60 0.19 0.03 80.35extreme bias (right) 3 969 639 0.13 294 175 0.07 13.49 0.09 0.03 36.52right news 4 032 284 0.13 416 510 0.10 9.68 0.11 0.04 24.80right leaning news 1 006 746 0.03 272 347 0.06 3.70 0.18 0.06 11.39center news 6 322 257 0.21 1 032 722 0.24 6.12 0.20 0.05 26.68left leaning news 7 491 344 0.24 1 272 672 0.30 5.89 0.14 0.04 18.64left news 4 353 999 0.14 674 744 0.16 6.45 0.14 0.05 16.64extreme bias (left) 609 503 0.02 99 743 0.02 6.11 0.06 0.03 11.46
Table 1: Tweet and user volume corresponding to each media category in Twitter. Number, Nt,and proportion, pt, of tweets with a URL pointing to a website belonging to one of the media categories.Number, Nu, and proportion, pu, of users having sent the corresponding tweets, and average number of tweetsper user, Nt/Nu, for each category. Proportion of tweets sent by non-official clients, pt,n/o, proportion of usershaving sent at least one tweet from an non-official client, pu,n/o, and average number of tweets per user sentfrom non-official clients, Nt,n/o/Nu,n/o.
4

to 12% (the share of users differ slightly from Table 1 when grouping categories as users may belong
to several categories). The number of tweets linking to websites producing fake and extremely biased
news is comparable with the number for center, left and left leaning media outlets. However, users
posting links to fake news or extreme bias (right) websites are, in average, more active than users
posting links to other news websites (Table 1). In particular, they post around twice the number of
tweets compared to users posting links towards center or left leaning news outlets.
The proportion of tweets sent by, and users using, non-official Twitter clients (Table 1) allows to
evaluate the importance of automated posting in each category. Details about our classification of
official Twitter clients are available in the Methods. We see that the two top categories are fake news
and center news with around 20% of tweets being sent from non-official accounts. When considering
the proportion of users sending tweets from non-official clients, the number are very similar for all cat-
egories, around 4%, showing that the automation of posting plays an important role across all media
categories. Indeed, non-official clients includes a broad range of clients, from “social bots” to applica-
tions used to facilitate the management of professional Twitter accounts. A large discrepancy between
sources arises when we consider the average number of tweets per users sent from non-official clients
(Table 1). Users using non-official clients to send tweets with links directing to websites displaying
fake news tweeted an average of 80 times during the collection period, which is more than twice the
value for other types of news outlets. This high activity from non-official clients suggests an abnormal
presence of bots. The role of bots in the diffusion of fake news has already been documented [13, 26]
as well as their presence in the Twitter discussions during 2016 US election [24].
We note that Breitbart News is the most dominant media outlet in term of number of tweets among
the right end of the outlet categories with 1.8 million tweets (see Supplementary Table 1). We examine
the relation between Breitbart and the rest of the media outlets in Supplementary Note 1, Supple-
mentary Tables 2, 3, 4, 5 & 6 as well as Supplementary Fig. 1. Our analysis shows that removing
Breitbart from the extreme bias category does not change our results significantly.
2.2 Networks of information flow
To investigate the flow of information we build the retweet networks for each category of news websites,
i.e. when a user u retweets (a retweet allows a user to rebroadcast the tweet of an other user to his
followers) the tweet of a user v that contains a URL linking to a website belonging to one of the news
media category, we add a link, or edge, going from node v to node u in the network. The direction of
the links represents the direction of the information flow between Twitter users. We do not consider
multiple links with the same direction between the same two users and neither consider self-links, i.e.
when a user retweet her/his own tweet. The out-degree of a node is its number of out-going links
and is equal to the number of different users that have retweeted at least one of her/his tweets. Its
in-degree is its number of in-going links and represents the number of different users she/he retweeted.
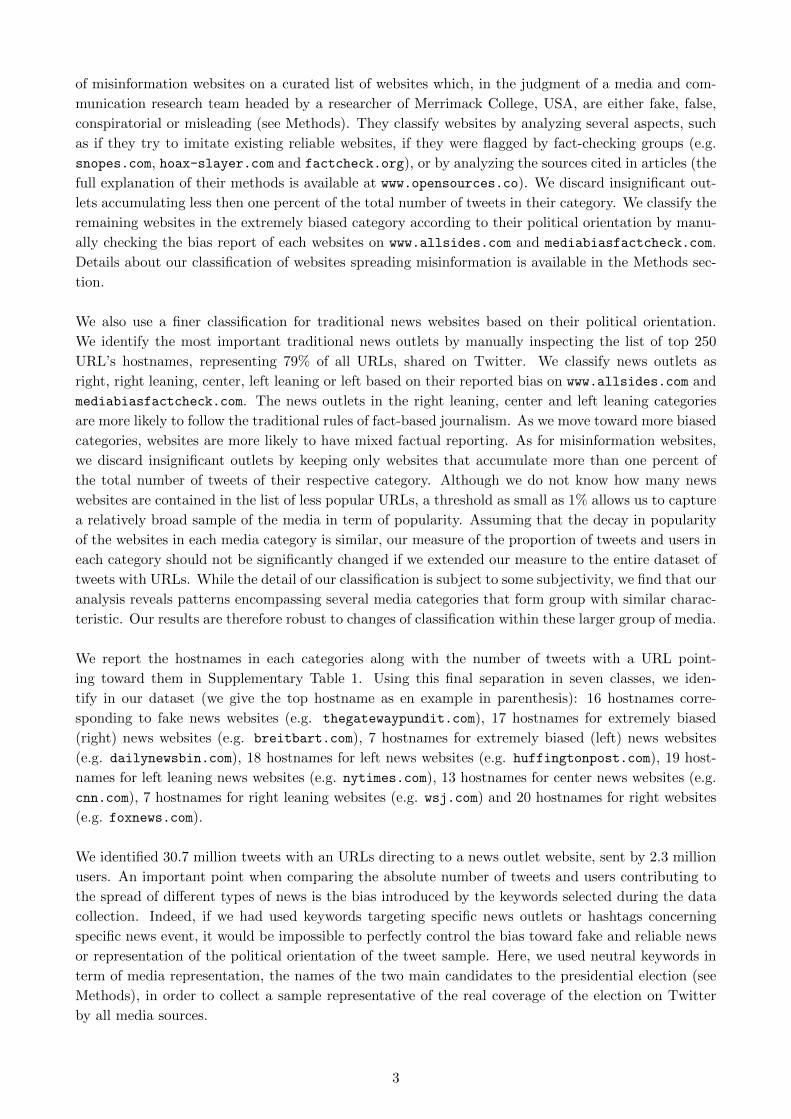
Figure 2 shows the networks formed by the top 100 news spreaders of the 6 most important retweet
networks. The retweet networks for right leaning and extreme bias (left) news is shown in Supplemen-
tary Fig. 2. We explain in Section (2.3) and in the Methods how the news spreaders are identified. A
clear difference is apparent between the networks representing the flow of fake and extremely biased
(right) news and the networks for left leaning and center news (Table 2 and Supplementary Fig. 3).
The left leaning and center news outlets correspond to larger networks in term of number of nodes
and edges, revealing their larger reach and influence in Twitter. However, the retweet networks cor-
responding to fake and extremely biased (right) news outlets are the most dense with an average
5
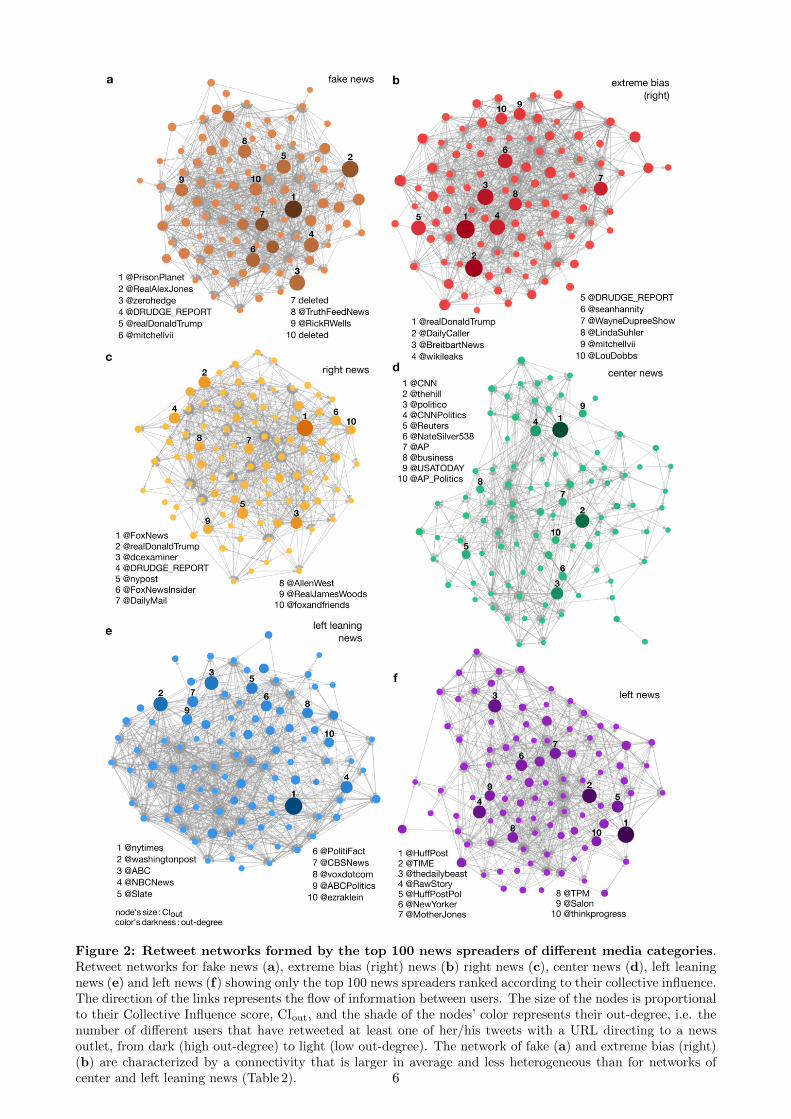
Figure 2: Retweet networks formed by the top 100 news spreaders of different media categories.Retweet networks for fake news (a), extreme bias (right) news (b) right news (c), center news (d), left leaningnews (e) and left news (f) showing only the top 100 news spreaders ranked according to their collective influence.The direction of the links represents the flow of information between users. The size of the nodes is proportionalto their Collective Influence score, CIout, and the shade of the nodes’ color represents their out-degree, i.e. thenumber of different users that have retweeted at least one of her/his tweets with a URL directing to a newsoutlet, from dark (high out-degree) to light (low out-degree). The network of fake (a) and extreme bias (right)(b) are characterized by a connectivity that is larger in average and less heterogeneous than for networks ofcenter and left leaning news (Table 2). 6
degree 〈k〉 ' 6.5. The retweet network for right news has characteristics in between those two groups
with a slightly larger size than the networks for fake and extremely biased (right) news and a larger
average degree than center news. These results show that users spreading fake and extremely biased
news, although in smaller numbers, are not only more active in average (Table 1), but also connected
(through retweets) to more users in average than users in the traditional news networks. Table 2 also
shows that the center and left leaning networks have the most heterogeneous out-degree distribution
and the fake news retweet networks has the less heterogeneous out-degree distribution. We measure
the heterogeneity of the distribution with a bootstrapping procedure (see Table 2) to ensure the in-
dependence of the measure on the networks’ sizes. Our analysis indicates that the larger networks
(center, left leaning) differ from the smaller ones not just by their size but also by their structure. The
heterogeneity of the degree distribution plays an important role in spreading processes on networks,
indicating a strong hierarchical diffusion cascade from hubs to intermediate degree, and finally to
small degree classes [29,30]. The characteristics of the weighted retweet networks, taking into account
multiple interactions between users, reveal the same patterns than the unweighted networks (Supple-
mentary Table 7). Table 2 and Supplementary Fig. 3a reveals the existence of users with very large
out-degree (kout > 5× 10⁵), in the center and left leaning networks, i.e. very important broadcasters
of information, which are not present in other networks. This suggests that different mechanisms of
information diffusion could be at play in the center and left leaning news networks, where high degree
nodes may play a more important role, than in the fake and extremely biased news networks.
We note that a difference between the largest networks, i.e center and left leaning news, and the fake
and extremely biased networks is that the former have typically access to more broadcasting tech-
nologies, which may be disruptive to understanding diffusion patterns based on network data [31].
The structural differences we observe may be explained by the fact that there is something different
about the way that the people in these networks organize and share information but it may also be
the case that there are subgroups of users in the center and left leaning news networks that form
diffusion networks with a similar structure as the smaller fake and extremely biased news networks
and then also have a large number of other individuals added to these subgroups due to the presence
of important broadcast networks that feed their ideology or information needs.
While inspecting specific accounts is not the goal of this study, looking at the two accounts with
N nodes N edges 〈k〉 σ(kout)/ 〈k〉 σ(kin)/ < k > max(kout) max(kin)
fake news 175 605 1 143 083 6.51 32± 4 2.49± 0.06 42 468 1232extreme bias (right) 249 659 1 637 927 6.56 36± 6 2.73± 0.03 51 845 588right 345 644 1 797 023 5.20 44± 11 2.70± 0.04 86 454 490right leaning 216 026 495 307 2.29 45± 11 1.72± 0.02 32 653 129center 864 733 2 501 037 2.89 75± 39 2.69± 0.06 229 751 512left leaning 1 043 436 3 570 653 3.42 59± 19 3.38± 0.10 145 047 843left 536 903 1 801 658 3.36 47± 12 3.50± 0.08 58 901 733extreme bias (left) 78 911 277 483 3.52 33± 6 2.49± 0.08 23 168 648
Table 2: Retweet networks characteristics for each news source categories. We show the numberof nodes and edges (links) of the networks, the average degree, 〈k〉 = 〈kin〉 = 〈kout〉, (the in-/out-degree of anode is the number of in-going/out-going links attached to it). In a directed network, the average in-degreeand out-degree are always equal. The out-degree of a node, i.e. a user, is equal to the number of different usersthat have retweeted at least one of her/his tweets. Its in-degree represents the number of different users she/heretweeted. The ratio of the standard deviation and the average of the in- and out-degree distribution, σ(kin)/ 〈k〉and σ(kout)/ 〈k〉, measures the heterogeneity of the connectivity of each networks. As the standard deviationof heavy-tailed degree distributions can depend on the network size, we computed the values of σ(kin)/ 〈k〉and σ(kout)/ 〈k〉 by taking the average, and standard error, of 1000 independent samples, of 78 911 values each,drawn from the in- and out- degree distributions of each network.
7

Figure 3: Types of top news spreaders accounts per media category. Proportion of verified (green),unverified (orange) and deleted (black) accounts among the top 100 news spreaders in each media category.
the maximum kout and kin reveals an interesting contrast between users of both networks. The user
with the largest out-degree of the center news network is the verified account of the Cable News
Network, CNN, (@CNN), which regularly posts links towards its own website using mainly the non-
official professional client Sprinklr (www.sprinklr.com). The user with the largest in-degree of the
fake news network is the user @Patriotic Folks, which, at the moment of this writing, seems to
belong to a deceiving user, whose profile description contains the hashtag #MAGA and refer to a
website belonging to our fake news website list (thetruthdivision.com). The name of the account
is “Annabelle Trump” and its profile picture is a young woman wearing cow-boy clothes (a reverse
image search on the web reveals that this profile image is not authentic as it comes in fact from the
catalog of a website selling western clothes). Most of its tweet are sent from the official Twitter Web
Client, suggesting that a real person is managing the account, and contains URLs directing to the
same fake news website. However, having a high in-degree does not indicate that this user has an
important influence. Indeed, its out-degree is approximately 3.5 times smaller than its in-degree and,
as we explain in the next section, influence is poorly measured by local network properties such as in-
or out-degree.
2.3 Top news spreaders
In order to uncover the most influential users of each retweet network, we use the Collective Influence
(CI) algorithm [32] which is based on the solution of the optimal network percolation. For a Twitter
user to be highly ranked by the CI algorithm, she/he does not necessarily need to be directly retweeted
by many users, but she/he needs to be surrounded by highly retweeted users (see Methods for more
details).
We find that top news spreaders of left leaning and center news are almost uniquely verified accounts
belonging to news outlets or journalists (Table 3). A very different situation for news spreaders of
the fake news and extremely biased news websites is revealed, where, among verified accounts of news
websites and journalists, we also find a large number of unknown, unverified, users that are not pub-
lic figures but are important news spreaders in Twitter (Fig. 3 and Table 3). We also find deleted
accounts, that could have been deleted either by Twitter for infringing their rules and policies or by
the users themselves, mostly in the fake and extremely biased news spreaders. We find that, based on
the timestamp of their last tweet in our dataset, 24 out of the 28 accounts had tweeted after election
8
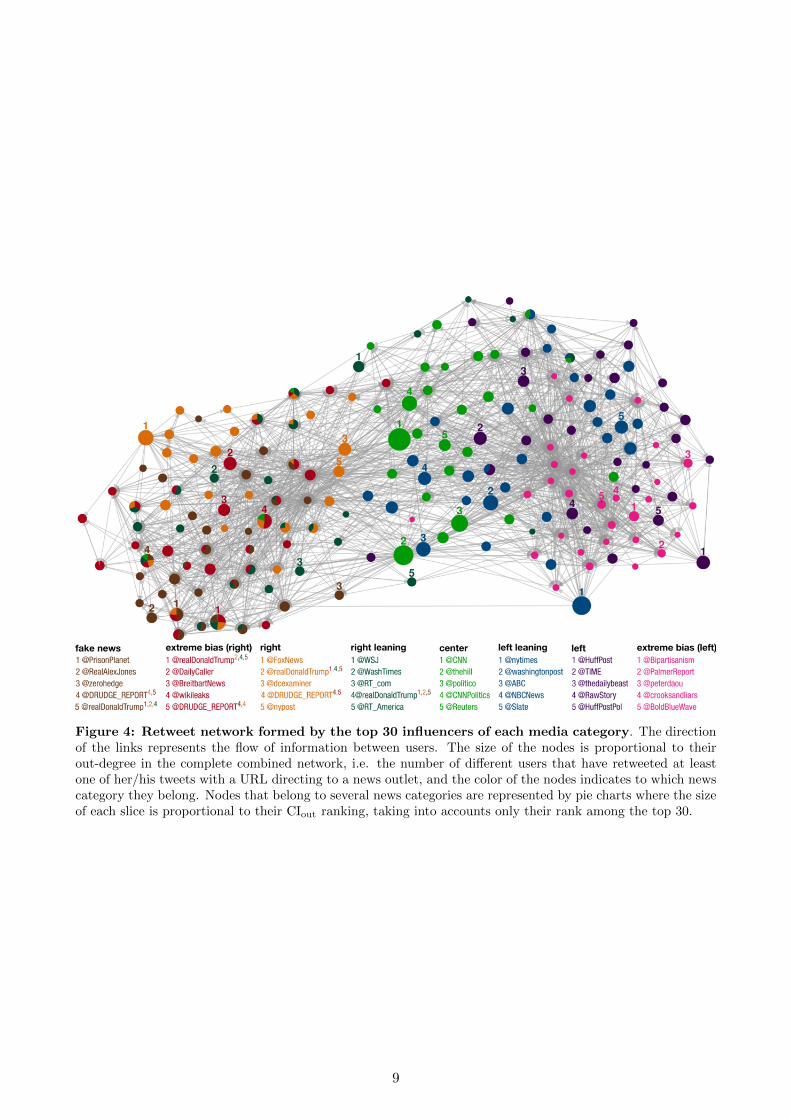
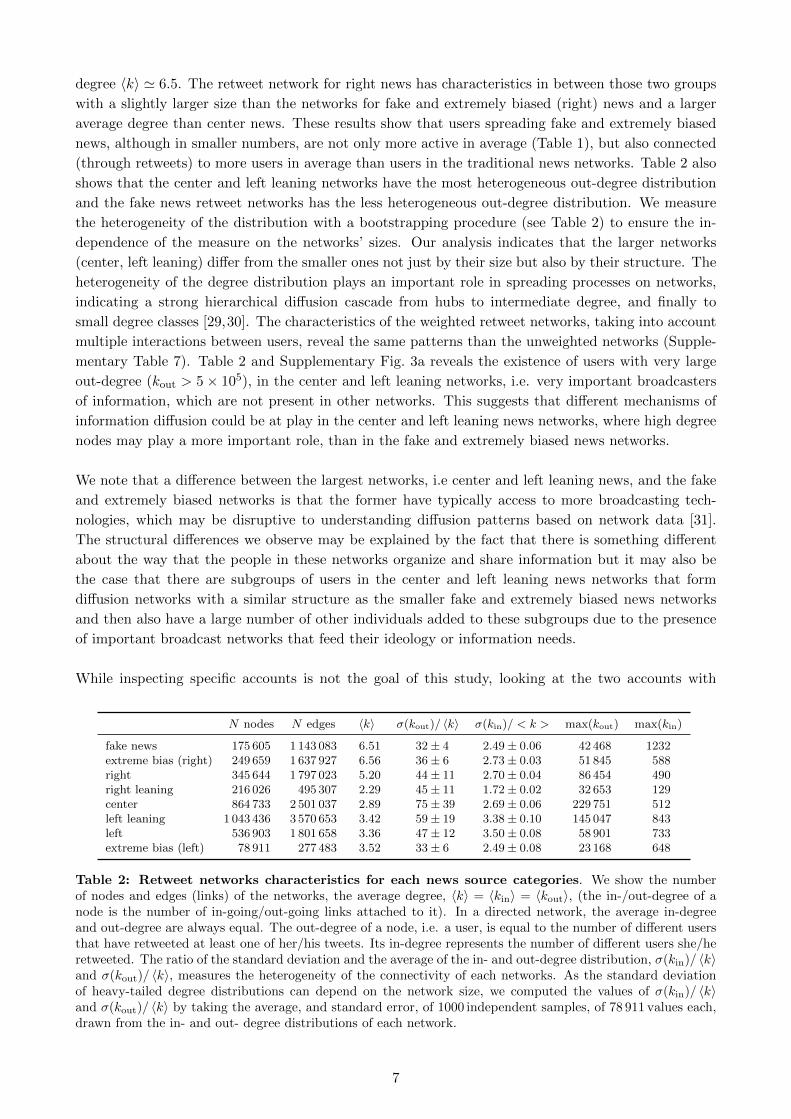
Figure 4: Retweet network formed by the top 30 influencers of each media category. The directionof the links represents the flow of information between users. The size of the nodes is proportional to theirout-degree in the complete combined network, i.e. the number of different users that have retweeted at leastone of her/his tweets with a URL directing to a news outlet, and the color of the nodes indicates to which newscategory they belong. Nodes that belong to several news categories are represented by pie charts where the sizeof each slice is proportional to their CIout ranking, taking into accounts only their rank among the top 30.
9

rank fake news extreme bias (right) news right news right leaning news(7 verified, 2 deleted, (15 verified, 1 deleted, (23 verified, 0 deleted, (20 verified, 1 deleted16 unverified) 9 unverified) 2 unverified) 4 unverified)
1 @PrisonPlanetX @realDonaldTrumpX @FoxNewsX @WSJX2 @RealAlexJonesX @DailyCallerX @realDonaldTrumpX @WashTimesX3 @zerohedge @BreitbartNewsX @dcexaminerX @RT comX4 @DRUDGE REPORT @wikileaksX @DRUDGE REPORT @realDonaldTrumpX5 @realDonaldTrumpX @DRUDGE REPORT @nypostX @RT AmericaX6 @mitchellviiX @seanhannityX @FoxNewsInsiderX @WSJPoliticsX7 deleted @WayneDupreeShowX @DailyMailX @DRUDGE REPORT8 @TruthFeedNews @LindaSuhler @AllenWestX @KellyannePollsX9 @RickRWells @mitchellviiX @RealJamesWoodsX @TeamTrumpX
10 deleted @LouDobbsX @foxandfriendsX @LouDobbsX11 @gatewaypunditX @PrisonPlanetX @foxnationX @rebeccaballhausX12 @infowars @DonaldJTrumpJrX @LouDobbsX @WSJopinionX13 @Lagartija Nix @gerfingerpoken @KellyannePollsX @reidepsteinX14 @DonaldJTrumpJrX @FreeBeaconX @JudicialWatchX deleted15 @ThePatriot143 @gerfingerpoken2 @PrisonPlanetX @JasonMillerinDCX16 @V of Europe @TeamTrumpX @wikileaksX @DanScavinoX17 @KitDaniels1776 @Italians4Trump @TeamTrumpX @PaulManafortX18 @Italians4Trump @benshapiroX @IngrahamAngleX @SopanDebX19 @ Makada @KellyannePollsX @marklevinshowX @asamjulian20 @BigStick2013 @DanScavinoX @LifeZetteX @JudicialWatchX21 @conserv tribuneX deleted @theblazeX @ Makada22 @Miami4Trump @JohnFromCranber @FoxBusinessX @mtraceyX23 @MONAKatOILS @true pundit @foxnewspoliticsX @Italians4Trump24 @JayS2629 @ThePatriot143 @BIZPACReview @TelegraphX25 @ARnews1936 @RealJack @DonaldJTrumpJrX @RealClearNewsX
rank center news left leaning news left news extreme bias (left) news(24 verified, 0 deleted, (25 verified, 0 deleted (25 verified, 0 deleted, (7 verified, 1 deleted,1 unverified) 0 unverified) 0 unverified) 17 unverified)
1 @CNNX @nytimesX @HuffPostX @BipartisanismX2 @thehillX @washingtonpostX @TIMEX @PalmerReportX3 @politicoX @ABCX @thedailybeastX @peterdaouX4 @CNNPoliticsX @NBCNewsX @RawStoryX @crooksandliarsX5 @ReutersX @SlateX @HuffPostPolX @BoldBlueWave6 @NateSilver538X @PolitiFactX @NewYorkerX @ShareblueX7 @APX @CBSNewsX @MotherJonesX @Karoli8 @businessX @voxdotcomX @TPMX @RealMuckmaker9 @USATODAYX @ABCPoliticsX @SalonX @GinsburgJobs
10 @AP PoliticsX @ezrakleinX @thinkprogressX @AdamsFlaFan11 @FiveThirtyEightX @nytpoliticsX @mmfaX @mcspocky12 @bpoliticsX @guardianX @joshtpmX @ShakestweetzX13 @jaketapperX @NYDailyNewsX @MSNBCX deleted14 @DRUDGE REPORT @latimesX @NYMagX @JSavoly15 @cnnbrkX @BuzzFeedNewsX @samsteinX @OccupyDemocrats16 @businessinsiderX @MediaiteX @JuddLegumX @ZaibatsuNews17 @AC360X @HillaryClintonX @mashableX @wvjoe91118 @cnniX @nytopinionX @theinterceptX @DebraMessingX19 @brianstelterX @CillizzaCNNX @DavidCornDCX @SayNoToGOP20 @KellyannePollsX @MSNBCX @dailykosX @coton luver21 @wikileaksX @KFILEX @JoyAnnReidX @EJLandwehr22 @SopanDebX @TheAtlanticX @nxthompsonX @mch757623 @KFILEX @SopanDebX @thenationX @RVAwonk24 @BBCWorldX @FahrentholdX @justinjm1X @ Carja25 @NewDayX @BuzzFeedX @ariannahuffX @Brasilmagic
Table 3: Top 25 CI news spreaders of the retweet networks corresponding to each media cate-gory. Verified users have a checkmark (X) next to their user name. Verifying its accounts is a feature offeredby Twitter, that “lets people know that an account of public interest is authentic” (help.twitter.com/en/managing-your-account/about-twitter-verified-accounts). Unverified accounts do not have a checkmarkand accounts marked as deleted have been deleted, either by Twitter or by the users themselves.
day (November 8th, 2016) indicating that they were deleted after the election. Deleted accounts were
extremely active, with a median number of tweets of 2224 (minimum: 156, 1st quartile: 1400, 3rd
quartile 6711 and maximum: 15930). In comparison, the median number of tweets per users for our
entire dataset is 2. We also find that 21 deleted accounts used an unofficial Twitter client (the most
used one by deleted accounts is dlvr.it). The list of the right, right leaning and left news top spread-
ers form a mix of verified and unverified accounts. Figure 2 shows the retweet networks formed by the
10

top 100 spreaders of each category and Fig. 4 shows the combined retweet network formed by top 30
news spreaders of all media categories and reveals the separation of the top news spreaders in two main
clusters and the relative importance of the top spreaders. The sets of top 100 fake news, extremely
biased (right), right and right leaning news spreaders have an important overlap, > 30 (Fig. 4 and
Supplementary Table 8). Fake and extremely biased news is mostly spread by unverified accounts
which could be due to the fact that some accounts are trying to hide their real identity but also to
the fact that audiences of the fake and extremely biased news are more likely to listen to “non-public”
figures due to their distrust of the establishment.
We distinguish three types of unverified accounts: 1) unverified accounts that are not necessarily mis-
leading or deceiving, for example @zerohedge, @DRUDGE REPORT or @TruthFeedNews make their
affiliation to their respective news websites clear, although their identities or the ones of their websites
administrators is not always clear; 2) unverified accounts that make their motif clear in their choice
of screen-name, e.g. @Italians4Trump or @Miami4Trump, although the real identity of the persons
behind such accounts is also usually undisclosed; 3) finally, unverified accounts that seem to be real
persons with profile pictures and user names, e.g @Lagartija Nix, @ThePatriot143, @BigStick2013,
@LindaSuhler, @gerfingerpoken or @AdamsFlaFan, but are not public figures. Whether such users
are authentic, social bots or fake users operated by someone else is not clear. However, our results
show that such users are not present in the top news spreaders of the center and left leaning news,
while they have a high prevalence in the fake and extremely biased categories.
Another observation is the presence of members of the campaign staffs of each candidate in the top
news spreaders (see Supplementary Note 2 and Supplementary Table 9). We see more users linked
to the campaign staff of Donald Trump (13), and with higher ranks in term of influence, than to the
campaign staff of Hillary Clinton (3), revealing the more important direct role of the Trump team in
the diffusion of news in Twitter.
2.4 News spreading dynamics
To investigate the news spreading dynamics of the different media categories on Twitter, we analyze
the correlations between the time series of tweeting rate measured for each category. The Twitter
activity time series are constructed by counting the number of tweets with a URL directing toward a
website belonging to each of the media category at a 15 minute resolution. In addition to the activity
related to each media group, we also consider the time series of the activity of the supporters of each
presidential candidates. We classify supporters based on the content of their tweets using a supervised
machine learning algorithm trained on a dataset obtained from the network of hashtag co-occurrences.
The full detail of our method and the validation of its opinion trend with the national polling average
of the New York Times is described in ref. [27]. We use our full dataset of tweets concerning the two
candidates, namely 171 million tweets sent by 11 million distinct users during more than five months.
After removing automated tweets (see Methods), we have a total of 157 million tweets. This repre-
sents an average of 1.1 million tweets per day (standard deviation of 0.6 million) sent by an average
of about 375,000 distinct users per day (standard deviation of 190,000). A majority of users, 64%, is
in favor of Hillary Clinton while 28% is in favor of Donald Trump (8% are unclassified as they have
the same number of tweets in each camp). However, we find that Trump supporters are, in average,
1.5 times more active than Clinton supporters [27]. The supporters therefore represent the general
Twitter population commenting on the candidate of the election.
We removed the trend and circadian cycles present in the time series with the widely used STL
(seasonal-trend decomposition procedure based on Loess) method [33], which is a robust iterative
filtering method allowing to separate a time series in seasonal (in this case, daily), trend and remainder
11

Figure 5: Activity correlation between news outlets and supporters. (a) Pearson cross-correlationcoefficients between activity time series related to the different types of news outlets, Trump supporters andClinton supporters. (b) Graph showing the correlation relations between the types of news websites and thesupporters. The edges of the graph represent correlations larger than r0 = 0.49. Fake news, extreme bias (right)and right websites form a first cluster, indicated by a red square in (a) and shown in orange in (b), while center,left leaning and left news websites form a second cluster, indicated by a blue square in (a) and shown in bluein (b). The activity of Trump supporters is equally correlated with all news sources and the activity of Clintonsupporters, which represents the largest activity, is mainly correlated with the second media cluster and onlypoorly with the first one.
components (see Methods).
The separation of the media sources in two correlated clusters is revealed when using a threshold
of r0 = 0.49, corresponding to the place of the largest gap between the sorted correlation values
(Fig. 5). The value of each cross-correlation coefficient is reported in Supplementary Table 10. The
first activity cluster (indicated by a red square in Fig. 5a) comprises the fake, extreme bias (right)
and right leaning news. The second activity cluster (indicated by a blue square) is made of the center,
left and left leaning news sources. The activities of right leaning and extremely biased (left) news are
only poorly correlated with the other news categories or supporters (see Supplementary Table 10). We
observe the following patterns between the media groups and the supporters dynamics: the activity of
Clinton supporters has a higher correlation with the second cluster than with the first one while the
activity of Trump supporters is equally correlated with the two clusters. This indicate that Trump
supporters are likely to react to any type of news while Clinton supporters mostly react to center and
news on the left and tend to ignore news coming from the right side.
These results indicate that the media included in the two clusters respond to two different news dynam-
12
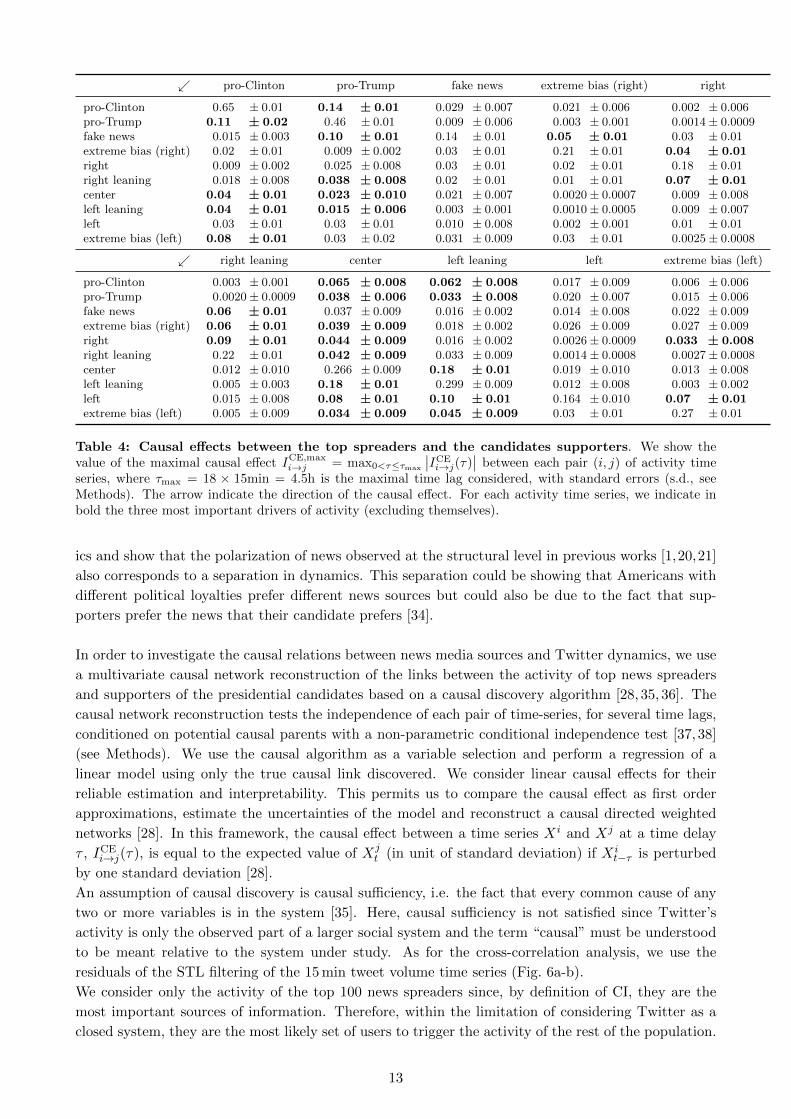
↙ pro-Clinton pro-Trump fake news extreme bias (right) right
pro-Clinton 0.65 ± 0.01 0.14 ± 0.01 0.029 ± 0.007 0.021 ± 0.006 0.002 ± 0.006pro-Trump 0.11 ± 0.02 0.46 ± 0.01 0.009 ± 0.006 0.003 ± 0.001 0.0014± 0.0009fake news 0.015 ± 0.003 0.10 ± 0.01 0.14 ± 0.01 0.05 ± 0.01 0.03 ± 0.01extreme bias (right) 0.02 ± 0.01 0.009 ± 0.002 0.03 ± 0.01 0.21 ± 0.01 0.04 ± 0.01right 0.009 ± 0.002 0.025 ± 0.008 0.03 ± 0.01 0.02 ± 0.01 0.18 ± 0.01right leaning 0.018 ± 0.008 0.038 ± 0.008 0.02 ± 0.01 0.01 ± 0.01 0.07 ± 0.01center 0.04 ± 0.01 0.023 ± 0.010 0.021 ± 0.007 0.0020± 0.0007 0.009 ± 0.008left leaning 0.04 ± 0.01 0.015 ± 0.006 0.003 ± 0.001 0.0010± 0.0005 0.009 ± 0.007left 0.03 ± 0.01 0.03 ± 0.01 0.010 ± 0.008 0.002 ± 0.001 0.01 ± 0.01extreme bias (left) 0.08 ± 0.01 0.03 ± 0.02 0.031 ± 0.009 0.03 ± 0.01 0.0025± 0.0008
↙ right leaning center left leaning left extreme bias (left)
pro-Clinton 0.003 ± 0.001 0.065 ± 0.008 0.062 ± 0.008 0.017 ± 0.009 0.006 ± 0.006pro-Trump 0.0020± 0.0009 0.038 ± 0.006 0.033 ± 0.008 0.020 ± 0.007 0.015 ± 0.006fake news 0.06 ± 0.01 0.037 ± 0.009 0.016 ± 0.002 0.014 ± 0.008 0.022 ± 0.009extreme bias (right) 0.06 ± 0.01 0.039 ± 0.009 0.018 ± 0.002 0.026 ± 0.009 0.027 ± 0.009right 0.09 ± 0.01 0.044 ± 0.009 0.016 ± 0.002 0.0026± 0.0009 0.033 ± 0.008right leaning 0.22 ± 0.01 0.042 ± 0.009 0.033 ± 0.009 0.0014± 0.0008 0.0027± 0.0008center 0.012 ± 0.010 0.266 ± 0.009 0.18 ± 0.01 0.019 ± 0.010 0.013 ± 0.008left leaning 0.005 ± 0.003 0.18 ± 0.01 0.299 ± 0.009 0.012 ± 0.008 0.003 ± 0.002left 0.015 ± 0.008 0.08 ± 0.01 0.10 ± 0.01 0.164 ± 0.010 0.07 ± 0.01extreme bias (left) 0.005 ± 0.009 0.034 ± 0.009 0.045 ± 0.009 0.03 ± 0.01 0.27 ± 0.01
Table 4: Causal effects between the top spreaders and the candidates supporters. We show thevalue of the maximal causal effect ICE,max
i→j = max0<τ≤τmax
∣∣ICEi→j(τ)
∣∣ between each pair (i, j) of activity timeseries, where τmax = 18 × 15min = 4.5h is the maximal time lag considered, with standard errors (s.d., seeMethods). The arrow indicate the direction of the causal effect. For each activity time series, we indicate inbold the three most important drivers of activity (excluding themselves).
ics and show that the polarization of news observed at the structural level in previous works [1,20,21]
also corresponds to a separation in dynamics. This separation could be showing that Americans with
different political loyalties prefer different news sources but could also be due to the fact that sup-
porters prefer the news that their candidate prefers [34].
In order to investigate the causal relations between news media sources and Twitter dynamics, we use
a multivariate causal network reconstruction of the links between the activity of top news spreaders
and supporters of the presidential candidates based on a causal discovery algorithm [28, 35, 36]. The
causal network reconstruction tests the independence of each pair of time-series, for several time lags,
conditioned on potential causal parents with a non-parametric conditional independence test [37, 38]
(see Methods). We use the causal algorithm as a variable selection and perform a regression of a
linear model using only the true causal link discovered. We consider linear causal effects for their
reliable estimation and interpretability. This permits us to compare the causal effect as first order
approximations, estimate the uncertainties of the model and reconstruct a causal directed weighted
networks [28]. In this framework, the causal effect between a time series Xi and Xj at a time delay
τ , ICEi→j(τ), is equal to the expected value of Xj
t (in unit of standard deviation) if Xit−τ is perturbed
by one standard deviation [28].
An assumption of causal discovery is causal sufficiency, i.e. the fact that every common cause of any
two or more variables is in the system [35]. Here, causal sufficiency is not satisfied since Twitter’s
activity is only the observed part of a larger social system and the term “causal” must be understood
to be meant relative to the system under study. As for the cross-correlation analysis, we use the
residuals of the STL filtering of the 15 min tweet volume time series (Fig. 6a-b).
We consider only the activity of the top 100 news spreaders since, by definition of CI, they are the
most important sources of information. Therefore, within the limitation of considering Twitter as a
closed system, they are the most likely set of users to trigger the activity of the rest of the population.
13

Figure 6: Granger causal network reconstruction between top news spreaders and supportersactivity. (a) Activity time series corresponding to the top 100 left leaning news spreaders (dashed) and theClinton supporters (continuous, right vertical axis). (b) Activity time series of the top 100 fake news spreaders(dashed) and the Trump supporters (continuous, right vertical axis). We show the residuals of the STL filteringafter the removal of the seasonal (daily) and trend components. A causal effect seems apparent from the top100 left leaning news spreaders to the Clinton supporters (a). Peaks in the left leaning news spreaders activity(yellow, dashed) tend to precede peaks in the activity of Clinton supporters (blue). A causal effect relation fromthe Trump supporters to the top 100 fake news news spreaders (b) seems also apparent. (c) Graph showingthe maximal causal effects between the activity of the top 100 news spreaders of each media category (left)and the activity of the presidential candidate supporters (right) computed over the entire five months. Arrowsindicate the direction of a the maximal causal effect (> 0.05) between two activity time series. The width ofeach arrow is proportional to the strength of the causation and the size of each node is proportional to theauto-correlation of each time series. The center and left leaning top news spreaders are the news spreadersthat show the strongest causal effect on the supporters activity. The values of the causal effects between eachactivity time series are shown in Table 4.
We test this hypothesis with Granger causal analysis.
Our causal analysis takes into account self-links, i.e. the auto-correlation of each time series, and
reveals that they are the strongest causal effect for all time series. Since we are interested in the
cross-links, we leave the self-links aside for the rest of the discussion. The center and left leaning
news spreaders have the strongest causation on the supporters activity, with a stronger effect on the
Clinton supporters than on the Trump supporters (Table 4 and Fig. 6c). Since the Clinton supporters
dominate Twitter activity, they also are the main drivers of the global activity. The other top news
spreaders have only a small or negligible effect on the supporters activity. In particular, extreme
bias (left), left, right leaning and right news spreaders are more influenced by the activity of Clinton
and Trump supporters than the opposite. We also observe that Trump supporters have a significant
causal effect on the fake news spreaders’ activity and Clinton supporters have a significant effect on
extreme bias (left) spreaders’ activity (Fig. 6c). This suggests that they are in fact following Twitter
activity rather than driving it. Regarding the causal relations in-between news spreaders, center news
spreaders are the most central driver as they are among the top three drivers of all news spreaders
(Table 4). Strong mutual causal effects are revealed between center and left leaning spreaders. Right
14
leaning top spreaders are driving the activity of the right, extremely biased (right) and fake news
spreaders. The two supporter groups have also strong mutual causal effects.
These results reveal two very different dynamics of news diffusion for traditional, center and left
leaning, news and misinformation. Center and left leaning news spreaders are the most influential and
are driving the supporters activity. On the other hand, the dynamics of fake news spreaders seems to
be governed by the ensemble of Trump supporters.
The interpretation of the discovered causal effects must be understood within the limitation that we
do not measure the diffusion of news outside of Twitter. Indeed, the fact that center and left leaning
news spreaders have a causal effect on the Clinton supporters could be explained by the fact that they
simply are the first to be “activated” by some news appearing, for example on television, while the
supporters take more time to be “activated” by the same news. However, we have other indications
that the news spreaders are directly causing at least part of the supporters’ activity, namely that the
top news spreaders are precisely the most important source of news retweets. Moreover, if the external
driver is an other media outside of Twitter and that the center/left leaning news spreaders, who are
almost all journalists, are the first to be activated, it is very likely that the media channel outside of
Twitter is related to the journalists. In this case, even if the causation is indirect, we still identify
the correct driver through the affiliation of the journalists. More importantly, while we observe a
strong causal effect between center/left leaning news spreaders and the supporters, we do not observe
a significant causal effect between other news spreaders and the supporters. This indicates that, even
if the causal driver could be outside of Twitter, the diffusion mechanisms of traditional and fake news
are very likely different.
We investigate the influence of the presence of staff members of candidates’ teams in Supplementary
Note 2, Supplementary Fig. 4 and Supplementary Table 11. We observe no significant changes in the
causal relations after having removed all users linked to the campaigns. We also repeated our analysis
after having removed news aggregators from our dataset (see Supplementary Note 3, Supplementary
Fig. 5, Supplementary Tables 12 and 13) and found that news aggregators are not responsible for the
observed differences in dynamics.
3 Discussion
Using a dataset of tweets collected during the five months preceding the 2016 presidential elections, we
investigated the spread of content classified as fake news and compared its importance and influence
with traditional, fact-based, media. We find that fake news represents 10% and extremely biased
news 15% of the tweets linking to a news outlet media. However, taking into account the difference
in user activity decreases the share of fake and extremely biased news to 12%. Although we find
approximately the same ratio of users using automated Twitter clients in each media category, we
find that automated accounts diffusing fake news are much more active than the automated accounts
diffusing other types of news. This results confirms the role of bots in the diffusion of fake news, that
has been shown using a different method of bot detection [26], and shows that automated accounts
also play a role, although smaller, in the diffusion of traditional news.
We analyzed the structure of the information diffusion network of each category of news and found that
fake and extremely biased (right) news diffusion networks are more densely connected, i.e. in average
users retweet more people and are more retweeted, and have less heterogeneous connectivity distri-
butions than traditional, center and left leaning, news diffusion networks. The heterogeneity of the
degree distribution is known to play an important role in in spreading processes on networks [29,30].
Spreading in networks with heterogeneous connectivity usually follows a hierarchical dynamics in
which the information propagates from higher-degree to lower-degree classes [30].
15
We discovered the top news spreaders of each type of news by computing their collective influence [32]
and found very different profiles of fake and extremely biased news top spreaders compared to tradi-
tional news spreaders. While traditional news spreaders are mostly journalists with verified Twitter
accounts, fake and extremely biased news top spreaders include unverified accounts with deceiving
profiles.
Analyzing the Twitter activity dynamics of the news diffusion corresponding to each media category,
we reveal the existence of two main clusters of media in term of activity correlation which is consistent
with the findings of previous works [4–9] that revealed the separation in polarized communities of on-
line social media news consumers. We also show that right news media outlets are clustered together
with fake news. Finally, a causality analysis between the top news spreaders activity and the activity
of presidential candidate supporters revealed that top news spreaders of center and left leaning news
outlets are the ones driving Twitter activity while top news spreaders of fake news are in fact following
Twitter activity, particularly Trump supporters activity.
Our analysis focuses on news concerning the candidate of the presidential election published from
the most popular news outlets and therefore its results cannot be directly generalized to the entire
Twitter population. Nevertheless, our investigation provides new insights into the dynamics of news
diffusion in Twitter. Namely, our results suggests that fake and extremely biased news are governed
by a different diffusion mechanisms than traditional center and left leaning news. Center and left
leaning news diffusion is driven by a small number of influential users, mainly journalists, and follow
a diffusion cascade in a network with heterogeneous degree distribution which is typical of diffusion in
social networks [30], while the diffusion of fake and extremely biased news seems to not be controlled
by a small set of influencers but rather to take place in more connected clusters and to be the result
of a collective behavior.
Methods
Twitter data collection and processing
We collected tweets continuously using the Twitter Search API from June 1st, 2016 to November
8th, 2016. We gather a total of 171 million tweets in the English language, mentioning the two top
candidates from the Republican Party (Donald J. Trump) and Democratic Party (Hillary Clinton)
by using two different queries with the following keywords: hillary OR clinton OR hillaryclinton and
trump OR realdonaldtrump OR donaldtrump.
We extracted the URLs from tweets by using the expanded url field attached to each tweet contain-
ing at least one URL. A large number of URL were redirecting links using URL shortening services
(e.g. bit.ly, dlvr.it or ift.tt). News websites sometimes also uses shortened versions of their
hostnames (e.g. cnn.it, nyti.ms, hill.cm or politi.co). We programmatically resolved shortened
URLs, using the Python Requests library, in order to find their final destination URL and extracted
the hostname of each final URL in our dataset.
To identify tweets that may originate from bots, we extract the name of the Twitter client used to post
each tweet from their source field and kept only tweets originating from an official twitter client. Third-
party clients represents a variety of applications, form applications mainly used by professional for
automating some tasks (e.g. www.sprinklr.com or dlvrit.com) to manually programmed bots, and
are used to post ≤ 8% of the total number of tweets. When a programmatic access to Twitter is gained
through its API to send tweets, the value of the source field of automated tweets corresponds to the
16

name, which must be unique, given to the “App” during the creation of access tokens. Supplementary
Table 14 shows the clients we consider as official and the corresponding number of tweets with URLs
originating from each client. The number of tweets with a URL originating from official clients
represents 82% of the total number of tweets with a URL. This simple method allows to identify tweets
that have not been automated and scales very easily to large datasets contrary to more sophisticated
methods [39]. Indeed, Botometer is not well suited for historical data as it requires several tweets per
users (up to 200) and results of a Twitter search of tweets (up to 100) mentioning each users, which we
cannot do retroactively. We compared our method with the results of Botometer (see Methods section
of ref. [27]) and found that our method has a good accuracy but suffer from a relatively high number
of false positive compared to Botometer. Advanced bots might not be detected by our method, but
this is also a problem for more advanced methods that relies on a training set of known bots [39]. We
remove all tweets sent from non-official clients when computing the activity of supporters but we keep
them when building the retweet networks, as we want to include automated accounts that play a role
in the diffusion of news.
News outlets classification
Among the 55 million tweets with URLs linking outside of Twitter, we identified tweets directing
to websites containing fake news by matching the URLs’ hostname with a curated list of websites,
which, in the judgment of a media and communication research team headed by Melissa Zimdars of
Merrimack College, USA, are either fake, false, conspiratorial or misleading. The list, freely available
at www.opensources.co, classifies websites in several categories, such as “Fake News”, “Satire” or
“Junk Science”. For our study, we construct two non-overlapping set of websites: fake news websites
and extremely biased websites. The set of fake news website is constructed by joining the hostnames
listed under the categories “Fake News” and “Conspiracy Theory” by www.opensources.co. The
following definitions of these two categories are given on www.opensources.co
• “Fake News”: sources that entirely fabricate information, disseminate deceptive content, or
grossly distort actual news reports,
• “Conspiracy Theory”: sources that are well-known promoters of kooky conspiracy theories.
The set of extremely biased websites contains hostnames appearing in the category “Extreme Bias”
(defined as sources that come from a particular point of view and may rely on propaganda, decontex-
tualized information, and opinions distorted as facts by www.opensources.co) but not in any of the
categories used to construct the set of fake news. Hostnames in each categories along with the num-
ber of tweets with a URL pointing toward them are reported in Supplementary Table 1. We discard
insignificant outlets accumulating less then one percent of the total number of tweets in their category.
Websites classified in the extremely biased (right) category, respectively extremely biased (left) cate-
gory, have a ranking between right bias and extreme right bias, respectively left and extreme left, on
mediabiasfactcheck.com. The bias ranking on www.allsides.com of these same websites is right,
respectively left, (corresponding to the most biased categories of www.allsides.com). The website
mediabiasfactcheck.com also reports a level of factual reporting for each websites and we find that
all the websites classified in the extremely bias category have a level of factual reporting which is mixed
or worse. We also find that all the websites remaining in the fake news category have a bias between
right and extreme right on mediabiasfactcheck.com. The website www.allsides.com rates media
bias using a combination of several methods such as blind surveys, community feedback and inde-
pendent research (see www.allsides.com/media-bias/media-bias-rating-methods for a detailed
explanation of the media bias rating methodology used by AllSides), and mediabiasfactcheck.com
scores media bias by evaluating wording, sourcing and story choices as well as political endorsement
17
(see mediabiasfactcheck.com/methodology for an explanation of Media Bias Fact Check method-
ology).
A potential issue with the methodology of OpenSources is the blurring of the assessment of bias, which
has to do with news content, with the assessment of establishment, which has to do with news form.
Specifically, their steps 4-6 indicate they count thinks like use of the Associated Press style guide and
the production quality of the website. These criteria thus conflate adherence to establishment norms
–which are likely to be correlated with things like budgets for professional design, fact-checking, edi-
torial oversight etc.– with lack of bias. That is, if two media sites present the same news, but one does
it in a less established format, it may be considered extremely biased. For this reason, we manually
reassessed the bias of each website in the extreme bias categories on mediabiasfactcheck.com and
allsides.com to validate their bias, as these two websites do not list the rejection of the establishment
as a criteria for their bias assessment. However, even if we do not use the criteria of adherence or
rejection of the establishment in our classification, websites in the extreme bias (right) and extreme
bias (left) categories are more likely to not adhere with the establishment as this variable seems to be
highly correlated with political bias.
In order to validate our classification, we compare it to the domain-level ideological alignment scores
of news outlets obtained by Bakshy et al. [1] which is based on the average self declared ideological
alignment of Facebook users sharing URLs directing to news outlets. We find a R2 = 0.9 for the lin-
ear regression between the ideological alignment found by Bakshy et al. and our classification where
we mapped our categories between -3 and 3 (see Supplementary Fig. 6). Supplementary Data file
SuppData top urls per category.csv contains the top 10 URLs of each media category along with
notes about their classification on fact checking websites (when available), links to the fact checking
websites and additional information. We observe that the classification of the most popular URLs is
well aligned with the label assigned to their domains.
We investigate the influence and importance of news at the domain level and not at the article level.
Since a website classified as fake may contain factual articles and vice versa, domain-level classification
implies a level of imprecision. However, it allows us to reveal the integrated effect of news outlets over
more than five months and to measure the relative importance of each type of news by classifying all
URLs directing to important news outlets. Moreover, classifying domains instead of URL (or article)
allows to consider the extended effect of each type of news. Indeed, when a Twitter user follows a
URL to a news article containing factual information on a website publishing mostly fake news, she/he
will be exposed to the other articles containing fake news on the websites. Therefore, this particular
fact-based news ultimately increases the potential influence of fake news.
3.1 Collective influence algorithm in directed networks
We use the Collective Influence (CI) algorithm [32] applied to directed networks to find the most
influential nodes of the information retweet networks. The Collective Influence algorithm is based on
the solution of the optimal percolation of random networks which consists of identifying the minimal
set of nodes, the super-spreaders, whose removal would dismember the network in many disconnected
and non-extensive components. The fragmentation of the network is measured by the size of the
largest connected component, called the giant component of the network. The CI algorithm considers
influence as an emergent collective property, not as a local property such as the node’s degree, and
has been shown to be able to identify super-spreaders of information in social networks [40,41]. Here,
we consider a directed version of the algorithm where we target the super-sources of information.
18
The procedure is as follow [40]: we first compute the value of CI`,out(i) for all nodes i = 1, ..., N as
CI`,out(i) = (kout(i)− 1)∑
j∈∂Bout(i,`)kout(j)>0
(kout(j)− 1) , (1)
where ` is the radius of the ball around each node we consider, here we use ` = 2, kout(i) is the
out-degree of node i and ∂Bout(i, `) is the set of nodes situated at a distance ` from node i computed
by following outgoing paths from i. The node with the largest CI`,out value is then removed from the
network and the value of CI`,out of nodes whose value is changed by this removal is recomputed. This
procedure is repeated until the size of the weakly connected largest component becomes negligible.
The order of removal of the nodes corresponds to the final ranking of the network top news spreaders
shown in Table 3.
A comparison of the ranking obtained by the CI algorithm with rankings obtained by considering
out-degree (high degree centrality) and Katz centrality [42] (Supplementary Fig. 7) shows that high
degree (HD) and Katz rankings of the top 100 CI spreaders fall mostly within the top 100 ranks of
these two other measures with only a small number of top CI spreaders having a poor HD or Katz
ranking. Note that the CI algorithm is especially good at identifying influential nodes that are locally
weakly connected but are influent on a larger scale [32].
3.2 Time series processing
We find that a 15 minute resolution offers a sufficiently detailed sampling of Twitter activity. Indeed,
a representative time scale of Twitter activity is given by the characteristic retweet delay time, i.e. the
typical time between an original tweet and its retweet. We find that the median time of the retweet
delay distribution in our dataset is 1 h 57 min and the distribution has a log-normal shape (first quartile
at 20 min and third quartile at 9 h 11 min). We tested the consistency of our results using a resolution
of 5 min and 1 h and did not see significant changes.
In order to perform the cross-correlation and causality analysis of the activity time series, we processed
the time series to remove the trend and circadian activity cycles and to deal with missing data points.
For each missing data points, we remove the entire day corresponding to the missing observation in
order to keep the period of the circadian activity consistent over the entire time series. This is necessary
to apply filtering technique to remove the periodic component of the time series. When removing an
entire day, we consider that the day starts and ends at 4 am, corresponding to the time of the day with
lowest Twitter activity. We removed a total of 24 days, representing 15% of our observation period.
We then applied a STL (seasonal-trend decomposition procedure based on Loess) [33] procedure to
extract the trend, seasonal and remainder components of each activity time series. We only consider
the remainder components for the cross-correlation and causality analysis. We set the seasonal period
of the STL filter equal to the number of observations per day, np = 96, and the seasonal smoothing
period to ns = 95, such that the seasonal component is smooth and the remainder component retains
the higher frequency signal containing the activity of interest. Varying the value of the smoothing
period to ns = 47 does not change significantly the results.
3.3 Causal analysis
The STL procedure removes the trend and circadian pattern in the time series, resulting in stationary
time series (the stationarity of each time series is confirmed by an augmented Dickey–Fuller test [43]).
Before performing the causal analysis, we also standardized each time series in order to remove any
influence of the difference in absolute values of time series. The causal analysis is performed using
19

the entire time period (more than 5 months) and therefore reveals causal effects that are observed “in
average” over the entire time period.
In order to infer the causal relations between the activity of the top news spreaders and the supporters,
we use a multivariate causal discovery algorithm based on the PC algorithm [35] and further adapted
for multivariate time series by Runge et al. [28,36,44]. Considering an ensemble of stochastic processes
X the algorithm proceeds as follow. First, for every time series Y ∈ X the sets of preliminary parents
is constructed by testing their independence at a range of time lags: PYt = {Xt−τ |0 < τ ≤ τmax, Yt 6⊥Xt−τ}. As this set also contains indirect links, they are then removed by testing if the dependence
between Yt and each Xτ ∈ PYt vanishes when it is conditioned on an incrementally increased set of
conditions Pn,iYt⊆ PYt , where n is the cardinality of Pn,iYt
and i is the index iterating over the number
of combinations of picking n conditions from PYt . The combinations of parents having the strongest
dependence in the previous step are selected first [28,44].
The main free parameters are the maximum time lag τmax and the significance level of the independence
test used during the first step to build the set of preliminary parents which we set to αPC = 0.1. We
set the value of the maximum time lag to τmax = 18 time steps (i.e. 270 min) as it is the lag after
which the lagged cross-correlations between each time series falls below 0.1 in absolute value (see
Supplementary Figs. 8, 9, 10 & 11). We set the maximum number of tested combinations of the
conditioning set to 3 and we do not limit the size of the conditioning set.
We test the conditional independence of time series with the non-parametric RCoT test [38]. This test
uses random Fourier features to approximate the kernel-based conditional independence test KCIT [37]
and is at least as accurate as KCIT while having a run time that scales linearly with sample size [38].
This point is crucial for our case given the size of our dataset (13 152 time points × 10 time series ×18 time lags). We set the number of Fourier features to nf = 400.
We select the significant final causal links by applying a Benjamini-Hochberg False Discovery Rate
correction [45] to the p-values of the conditional independence tests with a threshold level of 0.05.
FDR corrections allow to control the expected proportion of false positive. The final causal links, i.e.
parents of each time series, are reported in Supplementary Table 15.
Following the procedure of refs. [28, 46], We then regress a linear model:
Xt =
τmax∑τ=1
Φ(τ)Xt−τ + εt, (2)
where all time series are standardized and only coefficients corresponding to true causal links are
estimated while all the other ones are kept equal to zero, i.e. Φij(τ) 6= 0 only for Xit−τ → Xj
t . The
causal effect between a time series Xi and Xj at a time delay τ can be computed from the regressed
coefficients as:
ICEi→j(τ) = Ψij(τ), (3)
where Ψ(τ) is computed from the relation Ψ(τ) =∑τ
s=1 Φ(s)Ψ(τ − s) , with Φ(0) = I. Here, Ψij(τ)
gives the sum over the products of path coefficients along all causal paths up to a time lag τ . The
causal effect ICEi→j(τ) represents the expected value of Xj
t (in unit of standard deviation) if Xit−τ is
perturbed by one standard deviation [28].
To reconstruct the causal network, we are interested in the aggregated effects and therefore use the
lag with maximum effect:
ICE,maxi→j = max
0<τ≤τmax
∣∣ICEi→j(τ)
∣∣ . (4)
20

We estimate the standard errors of each causal effects with a residual-based bootstrap procedure
(similarly to ref. [28]). We employ 200 bootstrap surrogates time series generated by running model
(2) with a joint random sample ε∗t (with replacement) of the original multivariate residual time series
εt and compute the standard deviation of the ICE,maxi→j values.
3.4 Code availability
The analysis and plotting scripts allowing to reproduce the results of this paper are available at
https://github.com/alexbovet/information_diffusion. The Python module used for the net-
work analysis (graph-tool) is available at https://graph-tool.skewed.de. The causal discovery
algorithm software (TIGRAMITE) is available at https://jakobrunge.github.io/tigramite. The
code for the conditional independence test (RCIT and RCoT software) is available at https://github.
com/ericstrobl/RCIT. The code for the LOESS processing is available at https://github.com/
jcrotinger/pyloess.
3.5 Data availability
The raw Twitter data cannot be directly shared as it could infringe the Twitter Developer Terms.
However, we are sharing the tweet IDs of the data we collected which would allow anyone to download
the tweets we used for this study directly from Twitter. The full datasets analyzed in this study
are available under the limits of Twitter’s Developer Terms at http://kcore-analytics.com. The
classification of news as ’fake’ news or ’extremely biased’ news is a matter of opinion, rather than a
statement of fact. This opinion originated in publically available datasets from fact-checking organi-
zations (i.e. www.opensources.co). The conclusions contained in this article should not be interpreted
as representing those of the authors.
References
[1] Allcott, H. & Gentzkow, M. Social Media and Fake News in the 2016 Election. Tech. Rep. 2,
National Bureau of Economic Research, Cambridge, MA (2017). http://www.nber.org/papers/
w23089.pdf.
[2] Politico. The long and brutal history of fake news (2017). https://www.politico.com/
magazine/story/2016/12/fake-news-history-long-violent-214535. (2016).
[3] Howell, L. et al. Digital wildfires in a hyperconnected world. WEF Report
3, 15–94 (2013). http://reports.weforum.org/global-risks-2013/risk-case-1/
digital-wildfires-in-a-hyperconnected-world.
[4] Bessi, A. et al. Science vs Conspiracy: Collective Narratives in the Age of Misinformation. PloS
one 10, e0118093 (2015). http://dx.plos.org/10.1371/journal.pone.0118093.
[5] Bessi, A. et al. Viral Misinformation. In Proc. 24th International Conference on World Wide
Web - WWW ’15 Companion, 355–356 (ACM Press, New York, New York, USA, 2015). http:
//dl.acm.org/citation.cfm?doid=2740908.2745939.
[6] Mocanu, D., Rossi, L., Zhang, Q., Karsai, M. & Quattrociocchi, W. Collective attention in the
age of (mis)information. Comput. Hum. Behav. 51, 1198–1204 (2015). http://linkinghub.
elsevier.com/retrieve/pii/S0747563215000382.
[7] Bessi, A. et al. Trend of Narratives in the Age of Misinformation. PloS one 10, e0134641 (2015).
http://dx.plos.org/10.1371/journal.pone.0134641.
21

[8] Bessi, A. et al. Homophily and polarization in the age of misinformation. Eur. Phys. J. Spec.
Top. 225, 2047–2059 (2016). http://link.springer.com/10.1140/epjst/e2015-50319-0.
[9] Del Vicario, M. et al. The spreading of misinformation online. Proc. Natl. Acad. Sci. 113, 554–559
(2016). http://www.pnas.org/content/early/2016/01/02/1517441113.
[10] Del Vicario, M., Gaito, S., Quattrociocchi, W., Zignani, M. & Zollo, F. Public discourse and
news consumption on online social media: A quantitative, cross-platform analysis of the Italian
Referendum. Preprint at http://arxiv.org/abs/1702.06016 (2017)
[11] Shao, C., Ciampaglia, G. L., Flammini, A. & Menczer, F. Hoaxy. In Proc. 25th International
Conference Companion on World Wide Web - WWW ’16 Companion, 745–750 (ACM Press, New
York, New York, USA, 2016). http://dx.doi.org/10.1145/2872518.2890098.
[12] Vosoughi, S., Roy, D. & Aral, S. The spread of true and false news online. Science 359, 1146–1151
(2018). http://www.sciencemag.org/lookup/doi/10.1126/science.aap9559.
[13] Shao, C. et al. Anatomy of an online misinformation network. PloS one 13, 1–23 (2018).
https://doi.org/10.1371/journal.pone.0196087.
[14] Bessi, A. et al. Users polarization on Facebook and Youtube. PloS one 11, 1–24 (2016). https:
//doi.org/10.1371/journal.pone.0159641.
[15] Kumar, S., West, R. & Leskovec, J. Disinformation on the Web. In Proc. 25th International
Conference on World Wide Web - WWW ’16, 591–602 (ACM Press, New York, New York, USA,
2016). http://dl.acm.org/citation.cfm?doid=2872427.2883085.
[16] Del Vicario, M., Scala, A., Caldarelli, G., Stanley, H. E. & Quattrociocchi, W. Modeling confir-
mation bias and polarization. Sci. Rep. 7, 40391 (2017). http://www.nature.com/articles/
srep40391.
[17] Askitas, N. Explaining opinion polarisation with opinion copulas. PloS one 12, e0183277 (2017).
http://dx.plos.org/10.1371/journal.pone.0183277.
[18] Klayman, J. & Ha, Y.-W. Confirmation, disconfirmation, and information in hypothesis testing.
Psychol. Rev. 94, 211–228 (1987). http://doi.apa.org/getdoi.cfm?doi=10.1037/0033-295X.
94.2.211.
[19] Qiu, X., F. M. Oliveira, D., Sahami Shirazi, A., Flammini, A. & Menczer, F. Limited individual
attention and online virality of low-quality information. Nat. Hum. Behav. 1, 0132 (2017). http:
//www.nature.com/articles/s41562-017-0132.
[20] Schmidt, A. L. et al. Anatomy of news consumption on Facebook. Proc. Natl. Acad. Sci. 114,
3035–3039 (2017). http://www.pnas.org/lookup/doi/10.1073/pnas.1617052114.
[21] Del Vicario, M., Zollo, F., Caldarelli, G., Scala, A. & Quattrociocchi, W. Mapping social dynamics
on Facebook: The Brexit debate. Soc. Networks 50, 6–16 (2017). http://dx.doi.org/10.1016/
j.socnet.2017.02.002.
[22] Bakshy, E., Messing, S. & Adamic, L. A. Exposure to ideologically diverse news and opinion on
Facebook. Science 348, 1130–1132 (2015). http://www.sciencemag.org/cgi/doi/10.1126/
science.aaa1160.
[23] Lee, K., Eoff, B. D. & Caverlee, J. Seven Months with the Devils: A Long-Term Study of
Content Polluters on Twitter. In Proc. 5th Int. AAAI Conf. Weblogs Soc. Media, 185–192 (2006).
https://www.aaai.org/ocs/index.php/ICWSM/ICWSM11/paper/viewFile/2780/3296.
22

[24] Bessi, A. & Ferrara, E. Social bots distort the 2016 U.S. Presidential election online discussion.
First Monday 21 (2016). https://doi.org/10.5210/fm.v21i11.7090.
[25] Ferrara, E., Varol, O., Davis, C., Menczer, F. & Flammini, A. The rise of social bots. Commun.
ACM 59, 96–104 (2016). http://dl.acm.org/citation.cfm?doid=2963119.2818717.
[26] Shao, C., Ciampaglia, G. L., Varol, O., Yang, K., Flammini, A. & Menczer, F. The spread of
low-credibility content by social bots. Preprint at http://arxiv.org/abs/1707.07592 (2018).
[27] Bovet, A., Morone, F. & Makse, H. A. Validation of Twitter opinion trends with national polling
aggregates: Hillary Clinton vs Donald Trump. Sci. Rep. 8, 8673 (2018). http://www.nature.
com/articles/s41598-018-26951-y.
[28] Runge, J. et al. Identifying causal gateways and mediators in complex spatio-temporal systems.
Nat. Commun. 6, 8502 (2015). http://www.nature.com/articles/ncomms9502.
[29] Barthelemy, M., Barrat, A., Pastor-Satorras, R. & Vespignani, A. Velocity and Hierarchical
Spread of Epidemic Outbreaks in Scale-Free Networks. Phys. Rev. Lett. 92, 178701 (2004).
https://link.aps.org/doi/10.1103/PhysRevLett.92.178701.
[30] Vespignani, A. Modelling dynamical processes in complex socio-technical systems. Nat. Phys. 8,
32–39 (2011). http://www.nature.com/doifinder/10.1038/nphys2160.
[31] Goel, S., Watts, D. J., & Goldstein, D. G. The Structure of Online Diffusion Networks. Proc. 13th
ACM Conference on Electronic Commerce 1, 623–638 (2012). http://dl.acm.org/citation.
cfm?id=2229058.
[32] Morone, F. & Makse, H. A. Influence maximization in complex networks through optimal perco-
lation. Nature 524, 65–68 (2015). http://dx.doi.org/10.1038/nature14604.
[33] Cleveland, R. B., Cleveland, W. S., McRae, J. E. & Terpenning, I. STL: A seasonal-trend
decomposition procedure based on loess. J. Off. Stat. 6, 3–73 (1990). http://www.jos.nu/
Articles/abstract.asp?article=613.
[34] Margolin, D. B., Hannak, A. & Weber, I. Political Fact-Checking on Twitter: When Do Cor-
rections Have an Effect? Political Commun. 35, 196–219 (2018). https://doi.org/10.1080/
10584609.2017.1334018.
[35] Spirtes, P., Glymour, C. & Scheines, R. Causation, Prediction, and Search (MIT Press, 2000).
[36] Runge, J., Heitzig, J., Petoukhov, V. & Kurths, J. Escaping the Curse of Dimensionality in
Estimating Multivariate Transfer Entropy. Phys. Rev. Lett. 108, 258701 (2012). https://link.
aps.org/doi/10.1103/PhysRevLett.108.258701.
[37] Zhang, K., Peters, J., Janzing, D. & Schoelkopf, B. Kernel-based Conditional Independence Test
and Application in Causal Discovery. In UAI 2011, Proc. 27th Conference on Uncertainty in
Artificial Intelligence, 804–813 (Barcelona, 2011). http://arxiv.org/abs/1202.3775.
[38] Strobl, E. V., Zhang, K. & Visweswaran, S. Approximate Kernel-based Conditional Independence
Tests for Fast Non-Parametric Causal Discovery. Preprint at http://arxiv.org/abs/1702.
03877 (2017).
[39] Varol, O., Ferrara, E., Davis, C. A., Menczer, F. & Flammini, A. Online human-bot interactions:
detection, estimation, and characterization. In Proc. 11th Int. AAAI Conf. Weblogs Soc. Media,
280–289 (2017). https://aaai.org/ocs/index.php/ICWSM/ICWSM17/paper/view/15587.
23
[40] Morone, F., Min, B., Bo, L., Mari, R. & Makse, H. A. Collective Influence Algorithm to find
influencers via optimal percolation in massively large social media. Sci. Rep. 6, 30062 (2016).
http://www.nature.com/articles/srep30062.
[41] Teng, X., Pei, S., Morone, F. & Makse, H. A. Collective Influence of Multiple Spreaders Evaluated
by Tracing Real Information Flow in Large-Scale Social Networks. Sci. Rep. 6, 36043 (2016).
http://www.nature.com/articles/srep36043.
[42] Katz, L. A new status index derived from sociometric analysis. Psychometrika 18, 39–43 (1953).
http://link.springer.com/10.1007/BF02289026.
[43] MacKinnon, J. G. Approximate Asymptotic Distribution Functions for Unit-Root and Cointe-
gration Tests. J. Bus. Econ. Stat. 12, 167–176 (1994). http://www.tandfonline.com/doi/abs/
10.1080/07350015.1994.10510005.
[44] Runge, J., Sejdinovic, D. & Flaxman, S. Detecting causal associations in large nonlinear time
series datasets. Preprint at http://arxiv.org/abs/1702.07007 (2017).
[45] Benjamini, Y. & Hochberg, Y. Controlling the False Discovery Rate : A Practical and Powerful
Approach to Multiple Testing. J. Royal Stat. Soc. S. B 57, 289–300 (1995). https://www.jstor.
org/stable/2346101.
[46] Eichler, M. & Didelez, V. On Granger causality and the effect of interventions in time series.
Lifetime Data Anal. 16, 3–32 (2010). https://doi.org/10.1007/s10985-009-9143-3.
Acknowledgements
A. Bovet thanks the Swiss National Science Foundation (SNSF) and the Flagship European Research
Area Network (FLAG-ERA) Joint Transnational Call FuturICT 2.0 for the financial support provided
and R. Lambiotte for helpful comments.
Author contributions statement
H. A. M. and A. B. conceived the project. A. B. performed the analysis and prepared figures. A. B.
and H. A. M. wrote the manuscript.
Additional information
Competing interests: H. A. M. has shares in KCore Analytics, LLC. A. B. declares no competing
interests.
24
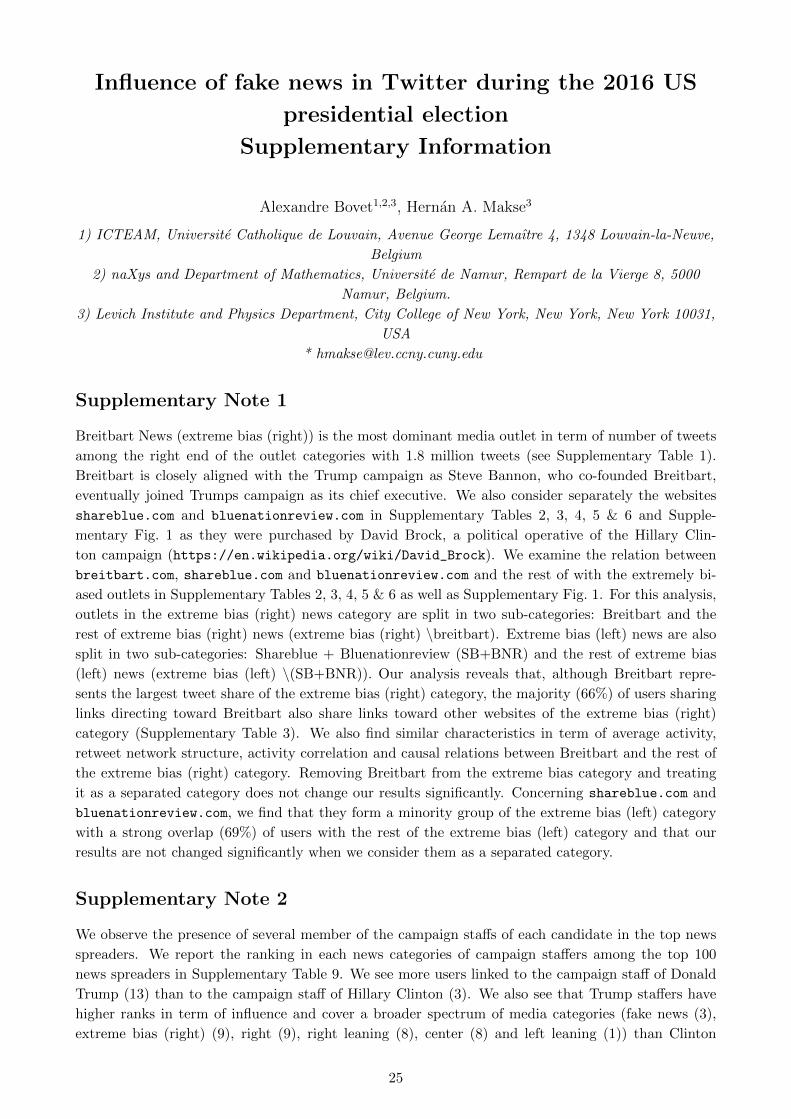
Influence of fake news in Twitter during the 2016 US
presidential election
Supplementary Information
Alexandre Bovet1,2,3, Hernan A. Makse3
1) ICTEAM, Universite Catholique de Louvain, Avenue George Lemaıtre 4, 1348 Louvain-la-Neuve,
Belgium
2) naXys and Department of Mathematics, Universite de Namur, Rempart de la Vierge 8, 5000
Namur, Belgium.
3) Levich Institute and Physics Department, City College of New York, New York, New York 10031,
USA
Supplementary Note 1
Breitbart News (extreme bias (right)) is the most dominant media outlet in term of number of tweets
among the right end of the outlet categories with 1.8 million tweets (see Supplementary Table 1).
Breitbart is closely aligned with the Trump campaign as Steve Bannon, who co-founded Breitbart,
eventually joined Trumps campaign as its chief executive. We also consider separately the websites
shareblue.com and bluenationreview.com in Supplementary Tables 2, 3, 4, 5 & 6 and Supple-
mentary Fig. 1 as they were purchased by David Brock, a political operative of the Hillary Clin-
ton campaign (https://en.wikipedia.org/wiki/David_Brock). We examine the relation between
breitbart.com, shareblue.com and bluenationreview.com and the rest of with the extremely bi-
ased outlets in Supplementary Tables 2, 3, 4, 5 & 6 as well as Supplementary Fig. 1. For this analysis,
outlets in the extreme bias (right) news category are split in two sub-categories: Breitbart and the
rest of extreme bias (right) news (extreme bias (right) \breitbart). Extreme bias (left) news are also
split in two sub-categories: Shareblue + Bluenationreview (SB+BNR) and the rest of extreme bias
(left) news (extreme bias (left) \(SB+BNR)). Our analysis reveals that, although Breitbart repre-
sents the largest tweet share of the extreme bias (right) category, the majority (66%) of users sharing
links directing toward Breitbart also share links toward other websites of the extreme bias (right)
category (Supplementary Table 3). We also find similar characteristics in term of average activity,
retweet network structure, activity correlation and causal relations between Breitbart and the rest of
the extreme bias (right) category. Removing Breitbart from the extreme bias category and treating
it as a separated category does not change our results significantly. Concerning shareblue.com and
bluenationreview.com, we find that they form a minority group of the extreme bias (left) category
with a strong overlap (69%) of users with the rest of the extreme bias (left) category and that our
results are not changed significantly when we consider them as a separated category.
Supplementary Note 2
We observe the presence of several member of the campaign staffs of each candidate in the top news
spreaders. We report the ranking in each news categories of campaign staffers among the top 100
news spreaders in Supplementary Table 9. We see more users linked to the campaign staff of Donald
Trump (13) than to the campaign staff of Hillary Clinton (3). We also see that Trump staffers have
higher ranks in term of influence and cover a broader spectrum of media categories (fake news (3),
extreme bias (right) (9), right (9), right leaning (8), center (8) and left leaning (1)) than Clinton
25

staffers (center (1), left leaning (2), left (1) and extreme bias (left) (1)). This reveals that the Trump
team played an important direct role in the diffusion of news in Twitter.
Although members of the Trump team are prevalent in the top spreaders of fake, extremely biased
(right), right and right leaning news, the causal analysis reveals that they are not driving the activity of
Trump and Clinton supporters which is more importantly influenced by the top center and left leaning
spreaders, consisting mainly of journalists. To verify the importance of users linked to the candidates’
teams, we repeated the causal analysis after having removed all users linked to the campaigns. We
report these results in Supplementary Fig. 4 and Supplementary Table 11. We observe no significant
changes in the causal relations between the different groups as the relations are still dominated by
center and left leaning top spreaders.
Supplementary Note 3
A possible distinction between the diffusion mechanisms of different news outlets could be due to the
fact that some websites aggregates news from other websites instead of producing news. We find four
websites that, at least partly, aggregates news: zerohedge.com (fake news), wnd.com (extreme bias
(right)), realclearpolitics.com (right leaning) and truepundit.com (extreme bias (right)). To
understand if the presence of news aggregators in categories other than the center and left leaning
could explain the difference in dynamics that we observe, we repeated our analysis of the dynamics
after having removed the news aggregators from our dataset. We report the results in Supplemen-
tary Tables 12 and 13 and Supplementary Fig. 5. We observe no significant changes in the activity
correlations and and that without the news aggregators, the top fake news, extreme bias (right) and
right leaning spreaders have a smaller causal effect on the other groups, while the left leaning and
center influencers stay the dominant ones. This shows that news aggregators are not responsible for
the differences on dynamics that we observe.
26

fake news extreme bias (right) news right newshostnames N hostnames N hostnames N
1 thegatewaypundit.com 761 756 breitbart.com 1 854 920 foxnews.com 1 122 7322 truthfeed.com 554 955 dailycaller.com 759 504 dailymail.co.uk 474 8463 infowars.com 478 872 americanthinker.com 179 696 washingtonexaminer.com 462 7694 therealstrategy.com 241 354 wnd.com 141 336 nypost.com 441 6485 conservativetribune.com 212 273 freebeacon.com 129 077 bizpacreview.com 170 7706 zerohedge.com 186 706 newsninja2012.com 127 251 nationalreview.com 164 0367 rickwells.us 78 736 hannity.com 114 221 lifezette.com 139 2578 departed.co 72 773 newsmax.com 94 882 redstate.com 105 9129 thepoliticalinsider.com 66 426 endingthefed.com 88 376 allenbwest.com 104 85710 therightscoop.com 63 852 truepundit.com 84 967 theconservativetreehouse.com 102 51511 teaparty.org 48 757 westernjournalism.com 77 717 townhall.com 102 40812 usapoliticsnow.com 46 252 dailywire.com 67 893 investors.com 102 29513 clashdaily.com 45 970 newsbusters.org 60 147 theblaze.com 99 02914 thefederalistpapers.org 45 831 ilovemyfreedom.org 54 772 theamericanmirror.com 91 53815 redflagnews.com 45 423 100percentfedup.com 54 596 ijr.com 71 55816 thetruthdivision.com 44 486 pjmedia.com 46 542 judicialwatch.org 70 54317 weaselzippers.us 45 199 thefederalist.com 55 83518 hotair.com 55 43119 conservativereview.com 54 30720 weeklystandard.com 50 707
right leaning news center news left leaning newshostnames N hostnames N hostnames N
1 wsj.com 310 416 cnn.com 2 291 736 nytimes.com 1 811 6272 washingtontimes.com 208 061 thehill.com 1 200 123 washingtonpost.com 1 640 0883 rt.com 157 474 politico.com 1 173 717 nbcnews.com 512 0564 realclearpolitics.com 128 417 usatoday.com 326 198 abcnews.go.com 467 5335 telegraph.co.uk 82 118 reuters.com 283 962 theguardian.com 439 5806 forbes.com 64 186 bloomberg.com 266 662 vox.com 369 7897 fortune.com 57 644 businessinsider.com 239 423 slate.com 279 4388 apnews.com 198 140 buzzfeed.com 278 6429 observer.com 128 043 cbsnews.com 232 88910 fivethirtyeight.com 124 268 politifact.com 198 09511 bbc.com 118 176 latimes.com 190 99412 ibtimes.com 72 424 nydailynews.com 188 76913 bbc.co.uk 71 941 theatlantic.com 177 63714 mediaite.com 152 87715 newsweek.com 149 49016 npr.org 142 14317 independent.co.uk 127 68918 cnb.cx 87 09419 hollywoodreporter.com 84 997
left news extreme bias (left) newshostnames N hostnames N
1 huffingtonpost.com 1 057 518 dailynewsbin.com 189 2572 thedailybeast.com 378 931 bipartisanreport.com 119 8573 dailykos.com 324 351 bluenationreview.com 75 4554 rawstory.com 297 256 crooksandliars.com 73 6155 politicususa.com 293 419 occupydemocrats.com 73 1436 time.com 252 468 shareblue.com 50 8807 motherjones.com 210 280 usuncut.com 27 6538 talkingpointsmemo.com 199 3469 msnbc.com 177 09010 mashable.com 173 12911 salon.com 172 80712 thinkprogress.org 172 14413 newyorker.com 171 10214 mediamatters.org 152 16015 nymag.com 121 63616 theintercept.com 109 59117 thenation.com 54 66118 people.com 47 942
Supplementary Table 1: Hostnames in each media category. We also show the number (N) of tweetswith a URL pointing toward each hostname. Tweets with several URLs are counted multiple times.
27

Nt pt Nu pu Nt/Nu pt,n/o pu,n/o Nt,n/o/Nu,n/o
extreme bias (right) news 3 969 639 0.13 294 175 0.07 13.49 0.09 0.03 36.52breitbart 1 849 871 0.06 163 707 0.04 11.30 0.09 0.04 28.20extreme bias (right) \breitbart 2 119 876 0.07 238 517 0.05 8.89 0.10 0.03 26.95
extreme bias (left) news 609 503 0.02 99 743 0.02 6.11 0.06 0.03 11.46SB+BNR 126 191 0.00 28 888 0.01 4.37 0.04 0.03 5.11extreme bias (left) \(SB+BNR) 483 325 0.02 90 367 0.02 5.35 0.07 0.03 11.37
Supplementary Table 2: Tweet and user volume corresponding to extremely biased news inTwitter. Number, Nt, and proportion, pt, of tweets with a URL pointing to a website belonging to one ofmedia categories. Number, Nu, and proportion, pu, of users having sent the corresponding tweets, and averagenumber of tweets per user, Nt/Nu, for each category. Proportion of tweets sent by non-official clients, pt,n/o,proportion of users having sent at least one tweet from an non-official client, pu,n/o, and average number oftweets per user sent from non-official clients, Nt,n/o/Nu,n/o. The average number of tweets per users and theproportion of tweets sent from unofficial clients are very similar for each sub-categories.
extreme bias breitbart extreme bias (right) extreme bias SB+BNR extreme bias (left)(right) \breitbart (left) \(SB+BNR)
extreme bias (right) 1.00 0.56 0.81 0.06 0.03 0.06breitbart 0.56 1.00 0.37 0.06 0.02 0.06extreme bias (right)\breitbart
0.81 0.37 1.00 0.06 0.02 0.06
extreme bias (left) 0.06 0.06 0.06 1.00 0.29 0.91SB+BNR 0.03 0.02 0.02 0.29 1.00 0.20extreme bias (left)\(SB+BNR)
0.06 0.06 0.06 0.91 0.20 1.00
Supplementary Table 3: Jaccard indices between the sets of users in the extremely biased newscategories. Jaccard indices between the sets of users tweeting URLs directing to extreme bias (right) newsoutlets, breitbart.com, extreme bias (right) minus breitbart.com (extreme bias (right) \breitbart), extremebias (left) news outlets, shareblue.com and bluenationreview.com (SB+BNR), extreme bias (left) minus share-blue.com and bluenationreview.com (extreme bias (left) \(SB+BNR)). The Jaccard index between two sets Aand B is computed as J = A ∩B/A ∪B. Although breitbart represents the largest tweet share of the extremebias (right) category, the majority (66%) of users sharing links directing toward breitbart also share links towardother websites of the extreme bias (right) category. Shareblue and bluenationreview form a minority group ofthe extreme bias (left) category with a strong overlap (69%) of users with the rest of the extreme bias (left)category.
N nodes N edges < k > σ(kout)/ < k > σ(kin)/ < k > max(kout) max(kin)
extreme bias (right) 249 659 1 637 927 6.56 36± 6 2.73± 0.03 51 845 588breitbart 141 924 795 504 5.61 31± 6 2.33± 0.02 41 039 376extreme bias (right) \breitbart 201 563 940 161 4.66 43± 8 2.28± 0.03 51 845 562
extreme bias (left) 78 911 277 483 3.52 33± 6 2.49± 0.08 23 168 648SB+BNR 25 956 59 515 2.29 45± 6 1.34± 0.01 15 544 65extreme bias (left) \(SB+BNR) 70 405 223 532 3.17 31± 8 2.4 ± 0.1 23 168 648
Supplementary Table 4: Retweet networks characteristics for extremely biased news categories.We show the number of nodes and edges (links) of the networks, the average degree, 〈k〉 = 〈kin〉 = 〈kout〉, (thein-/out-degree of a node is the number of in-going/out-going links attached to it). The out-degree of a node,i.e. a user, is equal to the number of different users that have retweeted at least one of her/his tweets. Itsin-degree represents the number of different users she/he retweeted. The ratio of the standard deviation andthe average of the in- and out-degree distribution, σ(kin)/ 〈k〉 and σ(kout)/ 〈k〉, measures the heterogeneity ofthe connectivity of each networks. As the standard deviation of heavy-tailed degree distributions can dependon the network size, we computed the values of σ(kin)/ 〈k〉 and σ(kout)/ 〈k〉 with a bootstrap procedure. Theaverage degree and the heterogeneity of the degree distributions are similar for each sub-categories.
28
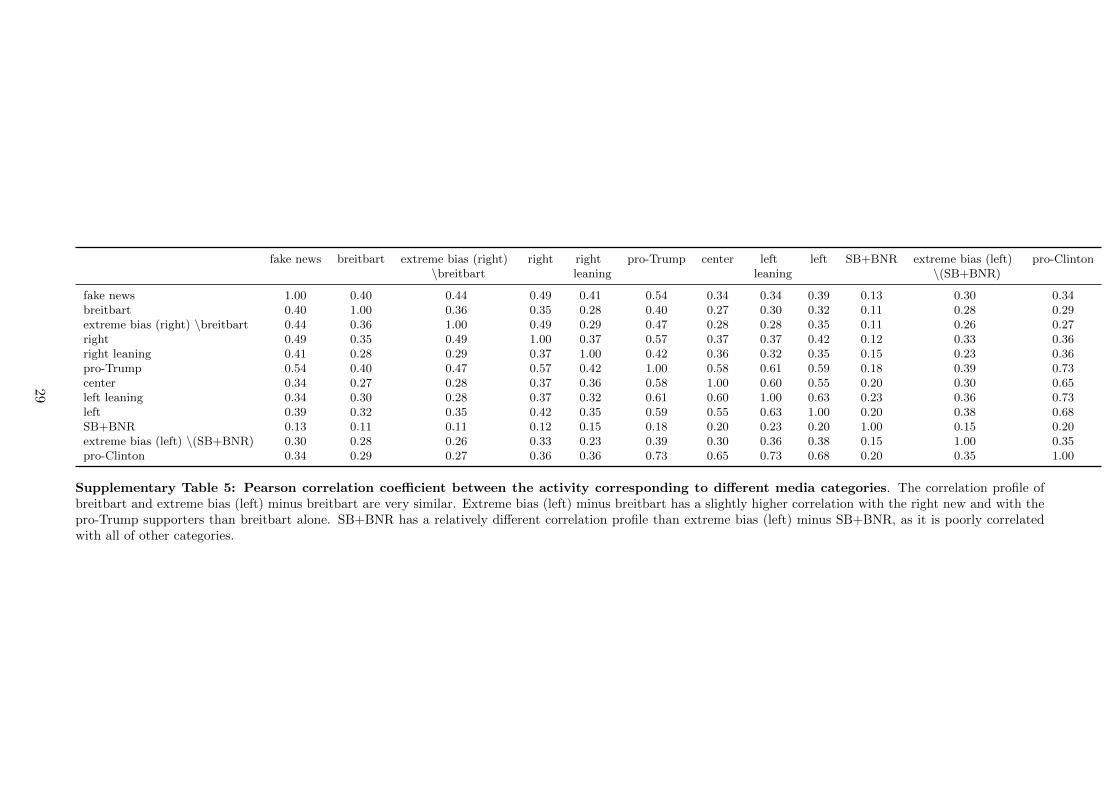
fake news breitbart extreme bias (right) right right pro-Trump center left left SB+BNR extreme bias (left) pro-Clinton\breitbart leaning leaning \(SB+BNR)
fake news 1.00 0.40 0.44 0.49 0.41 0.54 0.34 0.34 0.39 0.13 0.30 0.34breitbart 0.40 1.00 0.36 0.35 0.28 0.40 0.27 0.30 0.32 0.11 0.28 0.29extreme bias (right) \breitbart 0.44 0.36 1.00 0.49 0.29 0.47 0.28 0.28 0.35 0.11 0.26 0.27right 0.49 0.35 0.49 1.00 0.37 0.57 0.37 0.37 0.42 0.12 0.33 0.36right leaning 0.41 0.28 0.29 0.37 1.00 0.42 0.36 0.32 0.35 0.15 0.23 0.36pro-Trump 0.54 0.40 0.47 0.57 0.42 1.00 0.58 0.61 0.59 0.18 0.39 0.73center 0.34 0.27 0.28 0.37 0.36 0.58 1.00 0.60 0.55 0.20 0.30 0.65left leaning 0.34 0.30 0.28 0.37 0.32 0.61 0.60 1.00 0.63 0.23 0.36 0.73left 0.39 0.32 0.35 0.42 0.35 0.59 0.55 0.63 1.00 0.20 0.38 0.68SB+BNR 0.13 0.11 0.11 0.12 0.15 0.18 0.20 0.23 0.20 1.00 0.15 0.20extreme bias (left) \(SB+BNR) 0.30 0.28 0.26 0.33 0.23 0.39 0.30 0.36 0.38 0.15 1.00 0.35pro-Clinton 0.34 0.29 0.27 0.36 0.36 0.73 0.65 0.73 0.68 0.20 0.35 1.00
Supplementary Table 5: Pearson correlation coefficient between the activity corresponding to different media categories. The correlation profile ofbreitbart and extreme bias (left) minus breitbart are very similar. Extreme bias (left) minus breitbart has a slightly higher correlation with the right new and with thepro-Trump supporters than breitbart alone. SB+BNR has a relatively different correlation profile than extreme bias (left) minus SB+BNR, as it is poorly correlatedwith all of other categories.
29
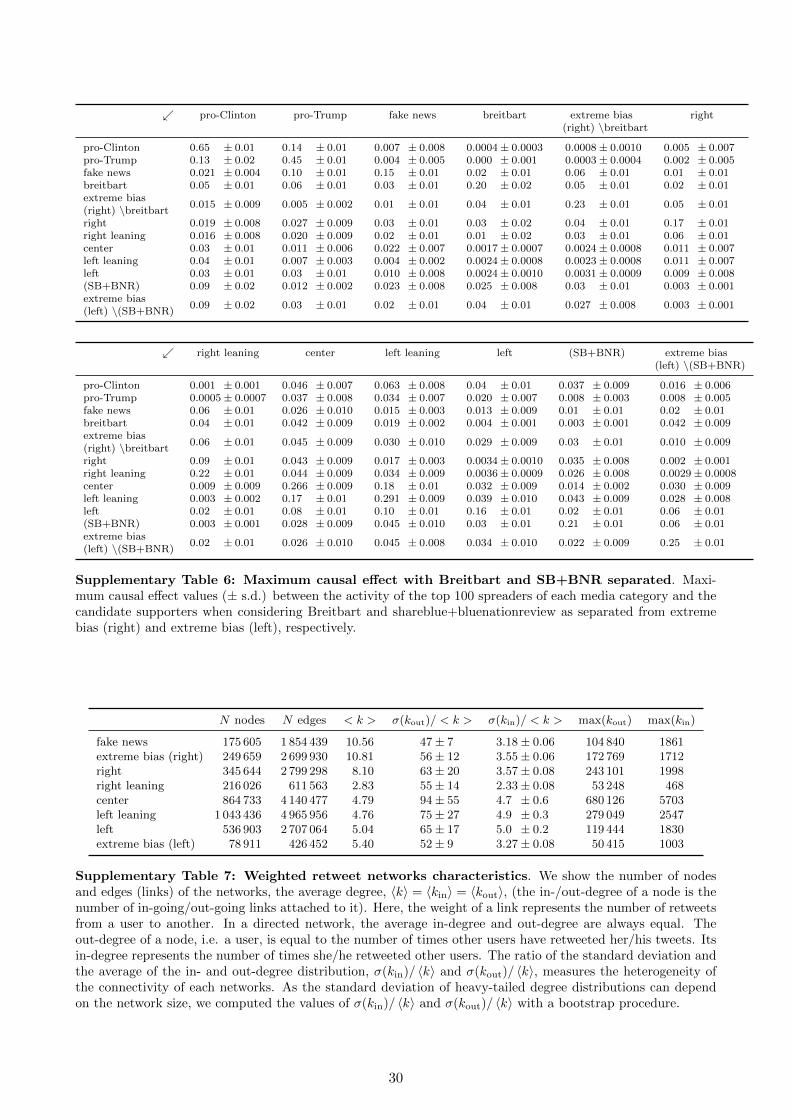
↙ pro-Clinton pro-Trump fake news breitbart extreme bias right(right) \breitbart
pro-Clinton 0.65 ± 0.01 0.14 ± 0.01 0.007 ± 0.008 0.0004± 0.0003 0.0008± 0.0010 0.005 ± 0.007pro-Trump 0.13 ± 0.02 0.45 ± 0.01 0.004 ± 0.005 0.000 ± 0.001 0.0003± 0.0004 0.002 ± 0.005fake news 0.021 ± 0.004 0.10 ± 0.01 0.15 ± 0.01 0.02 ± 0.01 0.06 ± 0.01 0.01 ± 0.01breitbart 0.05 ± 0.01 0.06 ± 0.01 0.03 ± 0.01 0.20 ± 0.02 0.05 ± 0.01 0.02 ± 0.01extreme bias(right) \breitbart
0.015 ± 0.009 0.005 ± 0.002 0.01 ± 0.01 0.04 ± 0.01 0.23 ± 0.01 0.05 ± 0.01
right 0.019 ± 0.008 0.027 ± 0.009 0.03 ± 0.01 0.03 ± 0.02 0.04 ± 0.01 0.17 ± 0.01right leaning 0.016 ± 0.008 0.020 ± 0.009 0.02 ± 0.01 0.01 ± 0.02 0.03 ± 0.01 0.06 ± 0.01center 0.03 ± 0.01 0.011 ± 0.006 0.022 ± 0.007 0.0017± 0.0007 0.0024± 0.0008 0.011 ± 0.007left leaning 0.04 ± 0.01 0.007 ± 0.003 0.004 ± 0.002 0.0024± 0.0008 0.0023± 0.0008 0.011 ± 0.007left 0.03 ± 0.01 0.03 ± 0.01 0.010 ± 0.008 0.0024± 0.0010 0.0031± 0.0009 0.009 ± 0.008(SB+BNR) 0.09 ± 0.02 0.012 ± 0.002 0.023 ± 0.008 0.025 ± 0.008 0.03 ± 0.01 0.003 ± 0.001extreme bias(left) \(SB+BNR)
0.09 ± 0.02 0.03 ± 0.01 0.02 ± 0.01 0.04 ± 0.01 0.027 ± 0.008 0.003 ± 0.001
↙ right leaning center left leaning left (SB+BNR) extreme bias(left) \(SB+BNR)
pro-Clinton 0.001 ± 0.001 0.046 ± 0.007 0.063 ± 0.008 0.04 ± 0.01 0.037 ± 0.009 0.016 ± 0.006pro-Trump 0.0005± 0.0007 0.037 ± 0.008 0.034 ± 0.007 0.020 ± 0.007 0.008 ± 0.003 0.008 ± 0.005fake news 0.06 ± 0.01 0.026 ± 0.010 0.015 ± 0.003 0.013 ± 0.009 0.01 ± 0.01 0.02 ± 0.01breitbart 0.04 ± 0.01 0.042 ± 0.009 0.019 ± 0.002 0.004 ± 0.001 0.003 ± 0.001 0.042 ± 0.009extreme bias(right) \breitbart
0.06 ± 0.01 0.045 ± 0.009 0.030 ± 0.010 0.029 ± 0.009 0.03 ± 0.01 0.010 ± 0.009
right 0.09 ± 0.01 0.043 ± 0.009 0.017 ± 0.003 0.0034± 0.0010 0.035 ± 0.008 0.002 ± 0.001right leaning 0.22 ± 0.01 0.044 ± 0.009 0.034 ± 0.009 0.0036± 0.0009 0.026 ± 0.008 0.0029± 0.0008center 0.009 ± 0.009 0.266 ± 0.009 0.18 ± 0.01 0.032 ± 0.009 0.014 ± 0.002 0.030 ± 0.009left leaning 0.003 ± 0.002 0.17 ± 0.01 0.291 ± 0.009 0.039 ± 0.010 0.043 ± 0.009 0.028 ± 0.008left 0.02 ± 0.01 0.08 ± 0.01 0.10 ± 0.01 0.16 ± 0.01 0.02 ± 0.01 0.06 ± 0.01(SB+BNR) 0.003 ± 0.001 0.028 ± 0.009 0.045 ± 0.010 0.03 ± 0.01 0.21 ± 0.01 0.06 ± 0.01extreme bias(left) \(SB+BNR)
0.02 ± 0.01 0.026 ± 0.010 0.045 ± 0.008 0.034 ± 0.010 0.022 ± 0.009 0.25 ± 0.01
Supplementary Table 6: Maximum causal effect with Breitbart and SB+BNR separated. Maxi-mum causal effect values (± s.d.) between the activity of the top 100 spreaders of each media category and thecandidate supporters when considering Breitbart and shareblue+bluenationreview as separated from extremebias (right) and extreme bias (left), respectively.
N nodes N edges < k > σ(kout)/ < k > σ(kin)/ < k > max(kout) max(kin)
fake news 175 605 1 854 439 10.56 47± 7 3.18± 0.06 104 840 1861extreme bias (right) 249 659 2 699 930 10.81 56± 12 3.55± 0.06 172 769 1712right 345 644 2 799 298 8.10 63± 20 3.57± 0.08 243 101 1998right leaning 216 026 611 563 2.83 55± 14 2.33± 0.08 53 248 468center 864 733 4 140 477 4.79 94± 55 4.7 ± 0.6 680 126 5703left leaning 1 043 436 4 965 956 4.76 75± 27 4.9 ± 0.3 279 049 2547left 536 903 2 707 064 5.04 65± 17 5.0 ± 0.2 119 444 1830extreme bias (left) 78 911 426 452 5.40 52± 9 3.27± 0.08 50 415 1003
Supplementary Table 7: Weighted retweet networks characteristics. We show the number of nodesand edges (links) of the networks, the average degree, 〈k〉 = 〈kin〉 = 〈kout〉, (the in-/out-degree of a node is thenumber of in-going/out-going links attached to it). Here, the weight of a link represents the number of retweetsfrom a user to another. In a directed network, the average in-degree and out-degree are always equal. Theout-degree of a node, i.e. a user, is equal to the number of times other users have retweeted her/his tweets. Itsin-degree represents the number of times she/he retweeted other users. The ratio of the standard deviation andthe average of the in- and out-degree distribution, σ(kin)/ 〈k〉 and σ(kout)/ 〈k〉, measures the heterogeneity ofthe connectivity of each networks. As the standard deviation of heavy-tailed degree distributions can dependon the network size, we computed the values of σ(kin)/ 〈k〉 and σ(kout)/ 〈k〉 with a bootstrap procedure.
30
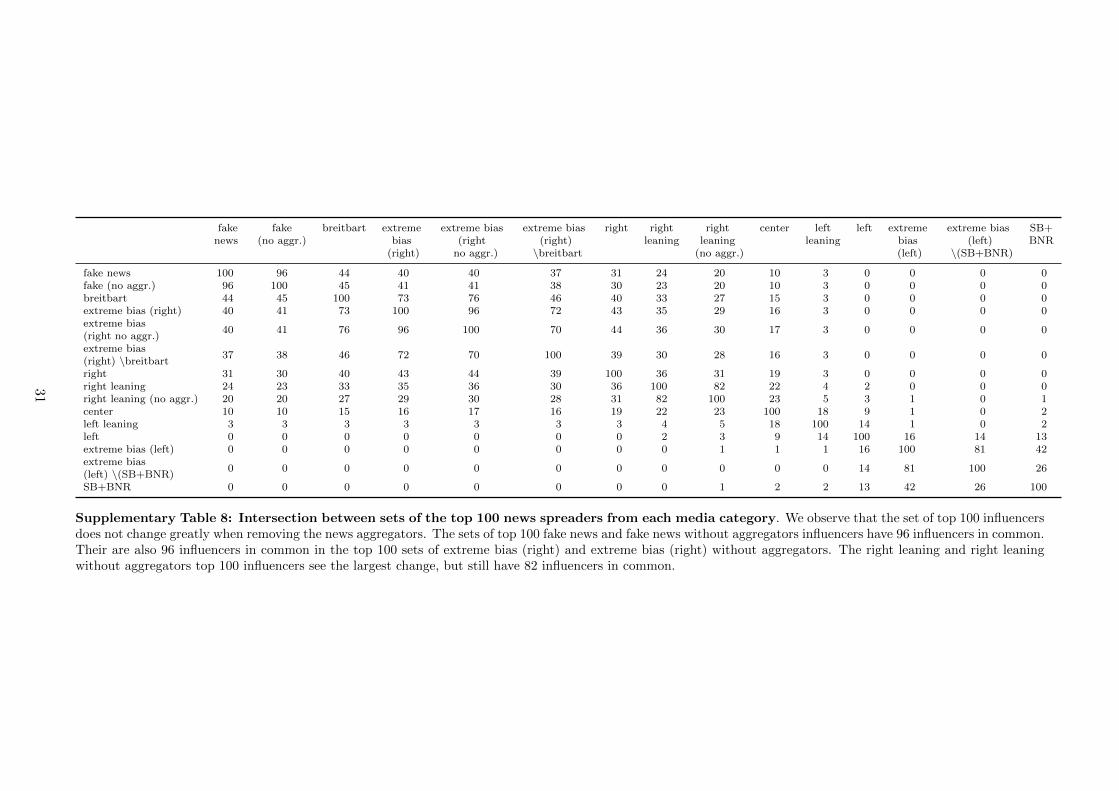
fake fake breitbart extreme extreme bias extreme bias right right right center left left extreme extreme bias SB+news (no aggr.) bias (right (right) leaning leaning leaning bias (left) BNR
(right) no aggr.) \breitbart (no aggr.) (left) \(SB+BNR)
fake news 100 96 44 40 40 37 31 24 20 10 3 0 0 0 0fake (no aggr.) 96 100 45 41 41 38 30 23 20 10 3 0 0 0 0breitbart 44 45 100 73 76 46 40 33 27 15 3 0 0 0 0extreme bias (right) 40 41 73 100 96 72 43 35 29 16 3 0 0 0 0extreme bias(right no aggr.)
40 41 76 96 100 70 44 36 30 17 3 0 0 0 0
extreme bias(right) \breitbart
37 38 46 72 70 100 39 30 28 16 3 0 0 0 0
right 31 30 40 43 44 39 100 36 31 19 3 0 0 0 0right leaning 24 23 33 35 36 30 36 100 82 22 4 2 0 0 0right leaning (no aggr.) 20 20 27 29 30 28 31 82 100 23 5 3 1 0 1center 10 10 15 16 17 16 19 22 23 100 18 9 1 0 2left leaning 3 3 3 3 3 3 3 4 5 18 100 14 1 0 2left 0 0 0 0 0 0 0 2 3 9 14 100 16 14 13extreme bias (left) 0 0 0 0 0 0 0 0 1 1 1 16 100 81 42extreme bias(left) \(SB+BNR)
0 0 0 0 0 0 0 0 0 0 0 14 81 100 26
SB+BNR 0 0 0 0 0 0 0 0 1 2 2 13 42 26 100
Supplementary Table 8: Intersection between sets of the top 100 news spreaders from each media category. We observe that the set of top 100 influencersdoes not change greatly when removing the news aggregators. The sets of top 100 fake news and fake news without aggregators influencers have 96 influencers in common.Their are also 96 influencers in common in the top 100 sets of extreme bias (right) and extreme bias (right) without aggregators. The right leaning and right leaningwithout aggregators top 100 influencers see the largest change, but still have 82 influencers in common.
31

fake news extreme bias right lean center lean left extreme biasfake (right) right left (left)
@realDonaldTrump (T) 5 1 2 4 28 53@DonaldJTrumpJr (T) 14 12 25 62 84@DanScavino (T) 73 20 36 16 76@BreitbartNews (T) 3@EricTrump (T) 45 31@TeamTrump (T) 16 17 9 34@PaulManafort (T) 59 45 17 82@KellyannePolls (T) 19 13 8 20@JasonMillerinDC (T) 60 26 15 43@seanspicer (T) 80 38 83@RealBenCarson (T)@BreitbartXM (T) 65@BreitbartTech (T) 87
@HillaryClinton (C) 67 17 51@JesseLehrich (C) 85@Shareblue (C) 6
Supplementary Table 9: Collective influence ranking of Twitter users linked to the campaignstaffs. Influence ranking of users in the campaign staffs of Donald Trump (T) and Hillary Clinton (C) among thetop 100 news spreaders of each media category. Based on http://www.p2016.org/trump/trumporggen.html
and http://www.p2016.org/clinton/clintonorggen.html. We consider accounts related to Breitbart.comto be linked to the Trump team because of Steve Bannon who co-founded Breitbart and was chief executiveof Donald Trump’s presidential campaign (https://en.wikipedia.org/wiki/Steve_Bannon). We consider@Shareblue to be linked to Clinton team because of David Brock, a political operative of the Hillary Clintoncampaign who purchased Shareblue (https://en.wikipedia.org/wiki/David_Brock).
32
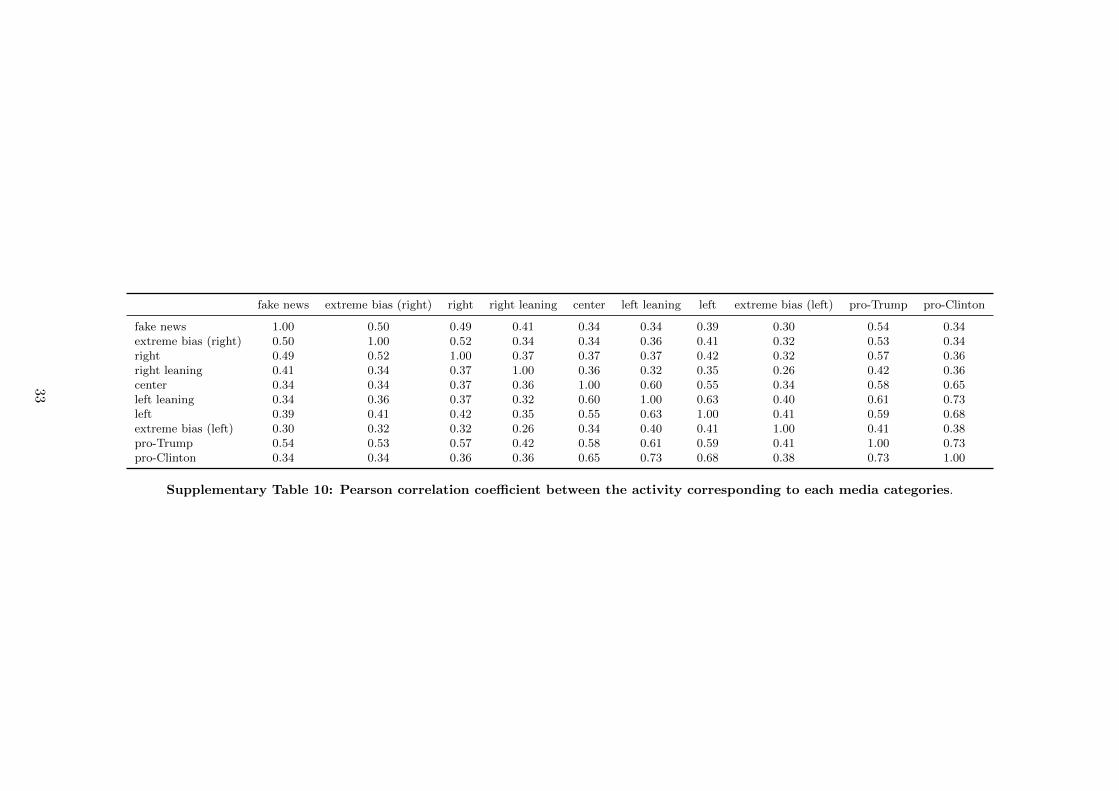
fake news extreme bias (right) right right leaning center left leaning left extreme bias (left) pro-Trump pro-Clinton
fake news 1.00 0.50 0.49 0.41 0.34 0.34 0.39 0.30 0.54 0.34extreme bias (right) 0.50 1.00 0.52 0.34 0.34 0.36 0.41 0.32 0.53 0.34right 0.49 0.52 1.00 0.37 0.37 0.37 0.42 0.32 0.57 0.36right leaning 0.41 0.34 0.37 1.00 0.36 0.32 0.35 0.26 0.42 0.36center 0.34 0.34 0.37 0.36 1.00 0.60 0.55 0.34 0.58 0.65left leaning 0.34 0.36 0.37 0.32 0.60 1.00 0.63 0.40 0.61 0.73left 0.39 0.41 0.42 0.35 0.55 0.63 1.00 0.41 0.59 0.68extreme bias (left) 0.30 0.32 0.32 0.26 0.34 0.40 0.41 1.00 0.41 0.38pro-Trump 0.54 0.53 0.57 0.42 0.58 0.61 0.59 0.41 1.00 0.73pro-Clinton 0.34 0.34 0.36 0.36 0.65 0.73 0.68 0.38 0.73 1.00
Supplementary Table 10: Pearson correlation coefficient between the activity corresponding to each media categories.
33
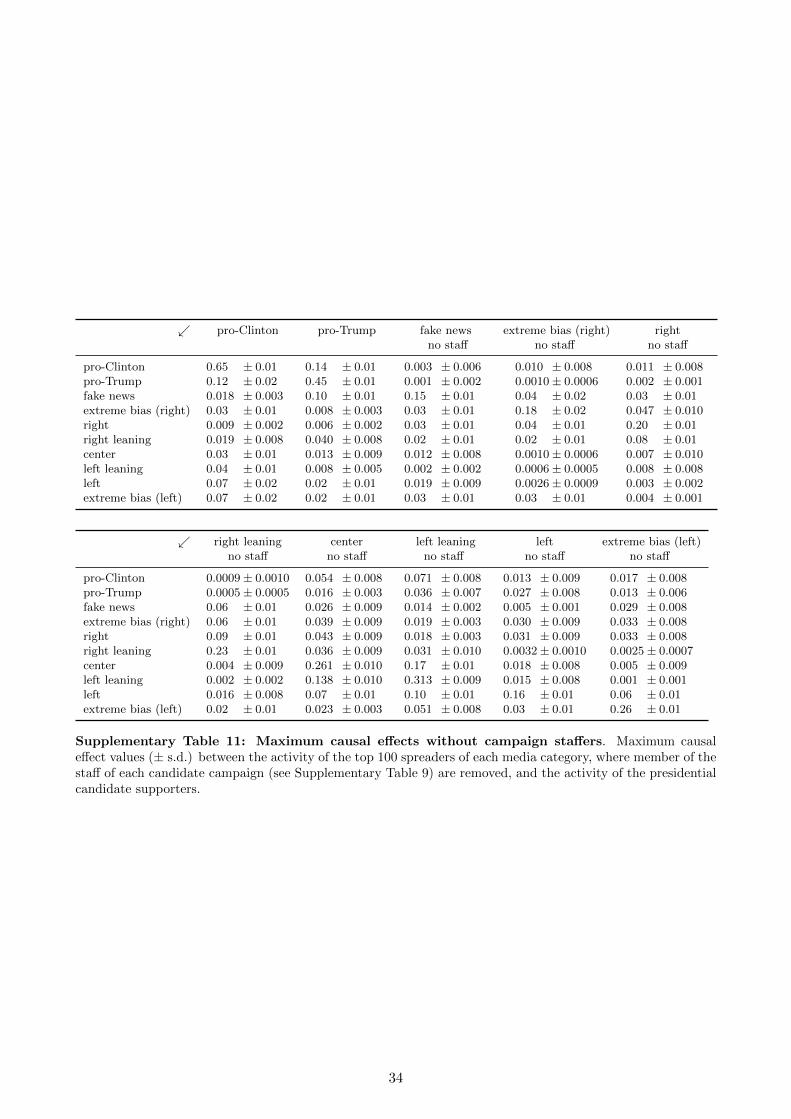
↙ pro-Clinton pro-Trump fake news extreme bias (right) rightno staff no staff no staff
pro-Clinton 0.65 ± 0.01 0.14 ± 0.01 0.003 ± 0.006 0.010 ± 0.008 0.011 ± 0.008pro-Trump 0.12 ± 0.02 0.45 ± 0.01 0.001 ± 0.002 0.0010± 0.0006 0.002 ± 0.001fake news 0.018 ± 0.003 0.10 ± 0.01 0.15 ± 0.01 0.04 ± 0.02 0.03 ± 0.01extreme bias (right) 0.03 ± 0.01 0.008 ± 0.003 0.03 ± 0.01 0.18 ± 0.02 0.047 ± 0.010right 0.009 ± 0.002 0.006 ± 0.002 0.03 ± 0.01 0.04 ± 0.01 0.20 ± 0.01right leaning 0.019 ± 0.008 0.040 ± 0.008 0.02 ± 0.01 0.02 ± 0.01 0.08 ± 0.01center 0.03 ± 0.01 0.013 ± 0.009 0.012 ± 0.008 0.0010± 0.0006 0.007 ± 0.010left leaning 0.04 ± 0.01 0.008 ± 0.005 0.002 ± 0.002 0.0006± 0.0005 0.008 ± 0.008left 0.07 ± 0.02 0.02 ± 0.01 0.019 ± 0.009 0.0026± 0.0009 0.003 ± 0.002extreme bias (left) 0.07 ± 0.02 0.02 ± 0.01 0.03 ± 0.01 0.03 ± 0.01 0.004 ± 0.001
↙ right leaning center left leaning left extreme bias (left)no staff no staff no staff no staff no staff
pro-Clinton 0.0009± 0.0010 0.054 ± 0.008 0.071 ± 0.008 0.013 ± 0.009 0.017 ± 0.008pro-Trump 0.0005± 0.0005 0.016 ± 0.003 0.036 ± 0.007 0.027 ± 0.008 0.013 ± 0.006fake news 0.06 ± 0.01 0.026 ± 0.009 0.014 ± 0.002 0.005 ± 0.001 0.029 ± 0.008extreme bias (right) 0.06 ± 0.01 0.039 ± 0.009 0.019 ± 0.003 0.030 ± 0.009 0.033 ± 0.008right 0.09 ± 0.01 0.043 ± 0.009 0.018 ± 0.003 0.031 ± 0.009 0.033 ± 0.008right leaning 0.23 ± 0.01 0.036 ± 0.009 0.031 ± 0.010 0.0032± 0.0010 0.0025± 0.0007center 0.004 ± 0.009 0.261 ± 0.010 0.17 ± 0.01 0.018 ± 0.008 0.005 ± 0.009left leaning 0.002 ± 0.002 0.138 ± 0.010 0.313 ± 0.009 0.015 ± 0.008 0.001 ± 0.001left 0.016 ± 0.008 0.07 ± 0.01 0.10 ± 0.01 0.16 ± 0.01 0.06 ± 0.01extreme bias (left) 0.02 ± 0.01 0.023 ± 0.003 0.051 ± 0.008 0.03 ± 0.01 0.26 ± 0.01
Supplementary Table 11: Maximum causal effects without campaign staffers. Maximum causaleffect values (± s.d.) between the activity of the top 100 spreaders of each media category, where member of thestaff of each candidate campaign (see Supplementary Table 9) are removed, and the activity of the presidentialcandidate supporters.
34
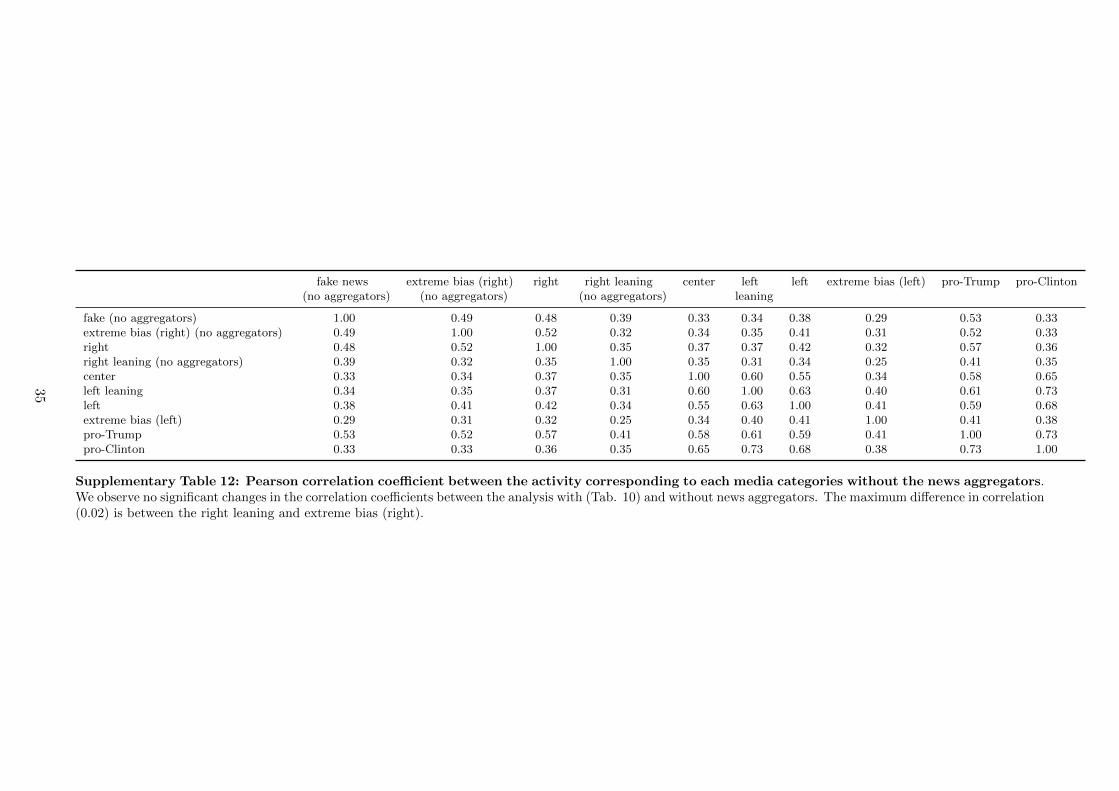
fake news extreme bias (right) right right leaning center left left extreme bias (left) pro-Trump pro-Clinton(no aggregators) (no aggregators) (no aggregators) leaning
fake (no aggregators) 1.00 0.49 0.48 0.39 0.33 0.34 0.38 0.29 0.53 0.33extreme bias (right) (no aggregators) 0.49 1.00 0.52 0.32 0.34 0.35 0.41 0.31 0.52 0.33right 0.48 0.52 1.00 0.35 0.37 0.37 0.42 0.32 0.57 0.36right leaning (no aggregators) 0.39 0.32 0.35 1.00 0.35 0.31 0.34 0.25 0.41 0.35center 0.33 0.34 0.37 0.35 1.00 0.60 0.55 0.34 0.58 0.65left leaning 0.34 0.35 0.37 0.31 0.60 1.00 0.63 0.40 0.61 0.73left 0.38 0.41 0.42 0.34 0.55 0.63 1.00 0.41 0.59 0.68extreme bias (left) 0.29 0.31 0.32 0.25 0.34 0.40 0.41 1.00 0.41 0.38pro-Trump 0.53 0.52 0.57 0.41 0.58 0.61 0.59 0.41 1.00 0.73pro-Clinton 0.33 0.33 0.36 0.35 0.65 0.73 0.68 0.38 0.73 1.00
Supplementary Table 12: Pearson correlation coefficient between the activity corresponding to each media categories without the news aggregators.We observe no significant changes in the correlation coefficients between the analysis with (Tab. 10) and without news aggregators. The maximum difference in correlation(0.02) is between the right leaning and extreme bias (right).
35
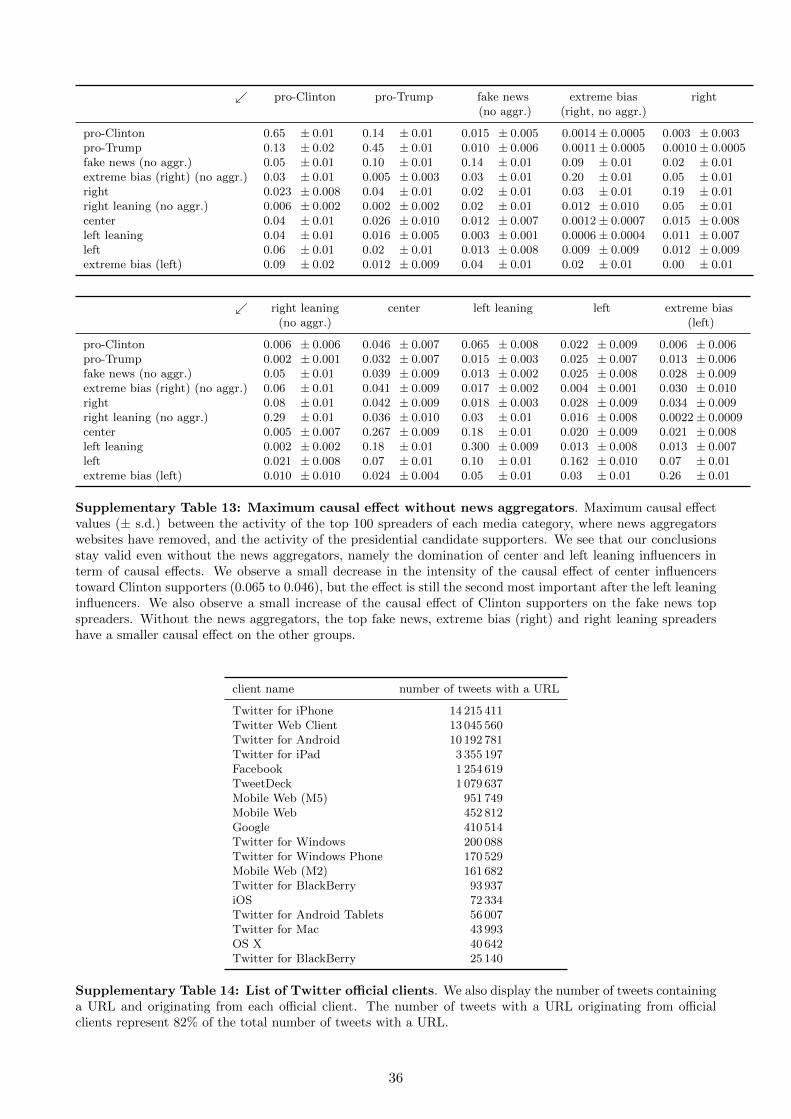
↙ pro-Clinton pro-Trump fake news extreme bias right(no aggr.) (right, no aggr.)
pro-Clinton 0.65 ± 0.01 0.14 ± 0.01 0.015 ± 0.005 0.0014± 0.0005 0.003 ± 0.003pro-Trump 0.13 ± 0.02 0.45 ± 0.01 0.010 ± 0.006 0.0011± 0.0005 0.0010± 0.0005fake news (no aggr.) 0.05 ± 0.01 0.10 ± 0.01 0.14 ± 0.01 0.09 ± 0.01 0.02 ± 0.01extreme bias (right) (no aggr.) 0.03 ± 0.01 0.005 ± 0.003 0.03 ± 0.01 0.20 ± 0.01 0.05 ± 0.01right 0.023 ± 0.008 0.04 ± 0.01 0.02 ± 0.01 0.03 ± 0.01 0.19 ± 0.01right leaning (no aggr.) 0.006 ± 0.002 0.002 ± 0.002 0.02 ± 0.01 0.012 ± 0.010 0.05 ± 0.01center 0.04 ± 0.01 0.026 ± 0.010 0.012 ± 0.007 0.0012± 0.0007 0.015 ± 0.008left leaning 0.04 ± 0.01 0.016 ± 0.005 0.003 ± 0.001 0.0006± 0.0004 0.011 ± 0.007left 0.06 ± 0.01 0.02 ± 0.01 0.013 ± 0.008 0.009 ± 0.009 0.012 ± 0.009extreme bias (left) 0.09 ± 0.02 0.012 ± 0.009 0.04 ± 0.01 0.02 ± 0.01 0.00 ± 0.01
↙ right leaning center left leaning left extreme bias(no aggr.) (left)
pro-Clinton 0.006 ± 0.006 0.046 ± 0.007 0.065 ± 0.008 0.022 ± 0.009 0.006 ± 0.006pro-Trump 0.002 ± 0.001 0.032 ± 0.007 0.015 ± 0.003 0.025 ± 0.007 0.013 ± 0.006fake news (no aggr.) 0.05 ± 0.01 0.039 ± 0.009 0.013 ± 0.002 0.025 ± 0.008 0.028 ± 0.009extreme bias (right) (no aggr.) 0.06 ± 0.01 0.041 ± 0.009 0.017 ± 0.002 0.004 ± 0.001 0.030 ± 0.010right 0.08 ± 0.01 0.042 ± 0.009 0.018 ± 0.003 0.028 ± 0.009 0.034 ± 0.009right leaning (no aggr.) 0.29 ± 0.01 0.036 ± 0.010 0.03 ± 0.01 0.016 ± 0.008 0.0022± 0.0009center 0.005 ± 0.007 0.267 ± 0.009 0.18 ± 0.01 0.020 ± 0.009 0.021 ± 0.008left leaning 0.002 ± 0.002 0.18 ± 0.01 0.300 ± 0.009 0.013 ± 0.008 0.013 ± 0.007left 0.021 ± 0.008 0.07 ± 0.01 0.10 ± 0.01 0.162 ± 0.010 0.07 ± 0.01extreme bias (left) 0.010 ± 0.010 0.024 ± 0.004 0.05 ± 0.01 0.03 ± 0.01 0.26 ± 0.01
Supplementary Table 13: Maximum causal effect without news aggregators. Maximum causal effectvalues (± s.d.) between the activity of the top 100 spreaders of each media category, where news aggregatorswebsites have removed, and the activity of the presidential candidate supporters. We see that our conclusionsstay valid even without the news aggregators, namely the domination of center and left leaning influencers interm of causal effects. We observe a small decrease in the intensity of the causal effect of center influencerstoward Clinton supporters (0.065 to 0.046), but the effect is still the second most important after the left leaninginfluencers. We also observe a small increase of the causal effect of Clinton supporters on the fake news topspreaders. Without the news aggregators, the top fake news, extreme bias (right) and right leaning spreadershave a smaller causal effect on the other groups.
client name number of tweets with a URL
Twitter for iPhone 14 215 411Twitter Web Client 13 045 560Twitter for Android 10 192 781Twitter for iPad 3 355 197Facebook 1 254 619TweetDeck 1 079 637Mobile Web (M5) 951 749Mobile Web 452 812Google 410 514Twitter for Windows 200 088Twitter for Windows Phone 170 529Mobile Web (M2) 161 682Twitter for BlackBerry 93 937iOS 72 334Twitter for Android Tablets 56 007Twitter for Mac 43 993OS X 40 642Twitter for BlackBerry 25 140
Supplementary Table 14: List of Twitter official clients. We also display the number of tweets containinga URL and originating from each official client. The number of tweets with a URL originating from officialclients represent 82% of the total number of tweets with a URL.
36
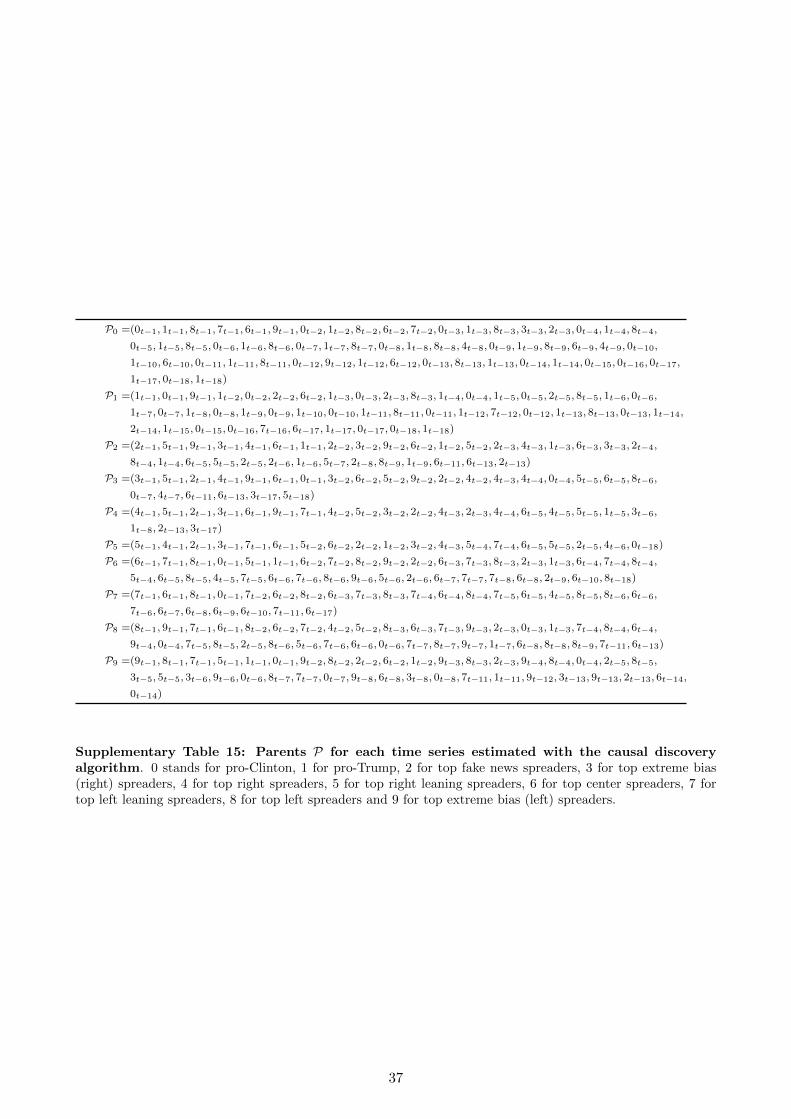
P0 =(0t−1, 1t−1, 8t−1, 7t−1, 6t−1, 9t−1, 0t−2, 1t−2, 8t−2, 6t−2, 7t−2, 0t−3, 1t−3, 8t−3, 3t−3, 2t−3, 0t−4, 1t−4, 8t−4,
0t−5, 1t−5, 8t−5, 0t−6, 1t−6, 8t−6, 0t−7, 1t−7, 8t−7, 0t−8, 1t−8, 8t−8, 4t−8, 0t−9, 1t−9, 8t−9, 6t−9, 4t−9, 0t−10,
1t−10, 6t−10, 0t−11, 1t−11, 8t−11, 0t−12, 9t−12, 1t−12, 6t−12, 0t−13, 8t−13, 1t−13, 0t−14, 1t−14, 0t−15, 0t−16, 0t−17,
1t−17, 0t−18, 1t−18)
P1 =(1t−1, 0t−1, 9t−1, 1t−2, 0t−2, 2t−2, 6t−2, 1t−3, 0t−3, 2t−3, 8t−3, 1t−4, 0t−4, 1t−5, 0t−5, 2t−5, 8t−5, 1t−6, 0t−6,
1t−7, 0t−7, 1t−8, 0t−8, 1t−9, 0t−9, 1t−10, 0t−10, 1t−11, 8t−11, 0t−11, 1t−12, 7t−12, 0t−12, 1t−13, 8t−13, 0t−13, 1t−14,
2t−14, 1t−15, 0t−15, 0t−16, 7t−16, 6t−17, 1t−17, 0t−17, 0t−18, 1t−18)
P2 =(2t−1, 5t−1, 9t−1, 3t−1, 4t−1, 6t−1, 1t−1, 2t−2, 3t−2, 9t−2, 6t−2, 1t−2, 5t−2, 2t−3, 4t−3, 1t−3, 6t−3, 3t−3, 2t−4,
8t−4, 1t−4, 6t−5, 5t−5, 2t−5, 2t−6, 1t−6, 5t−7, 2t−8, 8t−9, 1t−9, 6t−11, 6t−13, 2t−13)
P3 =(3t−1, 5t−1, 2t−1, 4t−1, 9t−1, 6t−1, 0t−1, 3t−2, 6t−2, 5t−2, 9t−2, 2t−2, 4t−2, 4t−3, 4t−4, 0t−4, 5t−5, 6t−5, 8t−6,
0t−7, 4t−7, 6t−11, 6t−13, 3t−17, 5t−18)
P4 =(4t−1, 5t−1, 2t−1, 3t−1, 6t−1, 9t−1, 7t−1, 4t−2, 5t−2, 3t−2, 2t−2, 4t−3, 2t−3, 4t−4, 6t−5, 4t−5, 5t−5, 1t−5, 3t−6,
1t−8, 2t−13, 3t−17)
P5 =(5t−1, 4t−1, 2t−1, 3t−1, 7t−1, 6t−1, 5t−2, 6t−2, 2t−2, 1t−2, 3t−2, 4t−3, 5t−4, 7t−4, 6t−5, 5t−5, 2t−5, 4t−6, 0t−18)
P6 =(6t−1, 7t−1, 8t−1, 0t−1, 5t−1, 1t−1, 6t−2, 7t−2, 8t−2, 9t−2, 2t−2, 6t−3, 7t−3, 8t−3, 2t−3, 1t−3, 6t−4, 7t−4, 8t−4,
5t−4, 6t−5, 8t−5, 4t−5, 7t−5, 6t−6, 7t−6, 8t−6, 9t−6, 5t−6, 2t−6, 6t−7, 7t−7, 7t−8, 6t−8, 2t−9, 6t−10, 8t−18)
P7 =(7t−1, 6t−1, 8t−1, 0t−1, 7t−2, 6t−2, 8t−2, 6t−3, 7t−3, 8t−3, 7t−4, 6t−4, 8t−4, 7t−5, 6t−5, 4t−5, 8t−5, 8t−6, 6t−6,
7t−6, 6t−7, 6t−8, 6t−9, 6t−10, 7t−11, 6t−17)
P8 =(8t−1, 9t−1, 7t−1, 6t−1, 8t−2, 6t−2, 7t−2, 4t−2, 5t−2, 8t−3, 6t−3, 7t−3, 9t−3, 2t−3, 0t−3, 1t−3, 7t−4, 8t−4, 6t−4,
9t−4, 0t−4, 7t−5, 8t−5, 2t−5, 8t−6, 5t−6, 7t−6, 6t−6, 0t−6, 7t−7, 8t−7, 9t−7, 1t−7, 6t−8, 8t−8, 8t−9, 7t−11, 6t−13)
P9 =(9t−1, 8t−1, 7t−1, 5t−1, 1t−1, 0t−1, 9t−2, 8t−2, 2t−2, 6t−2, 1t−2, 9t−3, 8t−3, 2t−3, 9t−4, 8t−4, 0t−4, 2t−5, 8t−5,
3t−5, 5t−5, 3t−6, 9t−6, 0t−6, 8t−7, 7t−7, 0t−7, 9t−8, 6t−8, 3t−8, 0t−8, 7t−11, 1t−11, 9t−12, 3t−13, 9t−13, 2t−13, 6t−14,
0t−14)
Supplementary Table 15: Parents P for each time series estimated with the causal discoveryalgorithm. 0 stands for pro-Clinton, 1 for pro-Trump, 2 for top fake news spreaders, 3 for top extreme bias(right) spreaders, 4 for top right spreaders, 5 for top right leaning spreaders, 6 for top center spreaders, 7 fortop left leaning spreaders, 8 for top left spreaders and 9 for top extreme bias (left) spreaders.
37
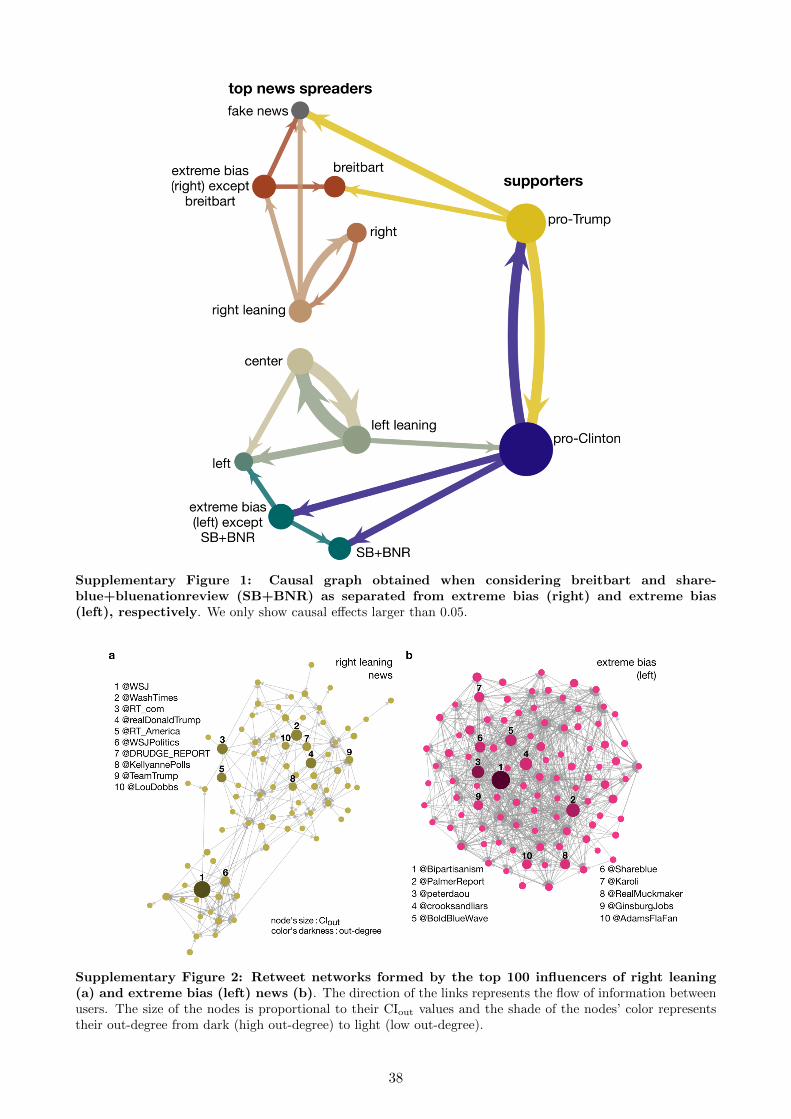
Supplementary Figure 1: Causal graph obtained when considering breitbart and share-blue+bluenationreview (SB+BNR) as separated from extreme bias (right) and extreme bias(left), respectively. We only show causal effects larger than 0.05.
Supplementary Figure 2: Retweet networks formed by the top 100 influencers of right leaning(a) and extreme bias (left) news (b). The direction of the links represents the flow of information betweenusers. The size of the nodes is proportional to their CIout values and the shade of the nodes’ color representstheir out-degree from dark (high out-degree) to light (low out-degree).
38
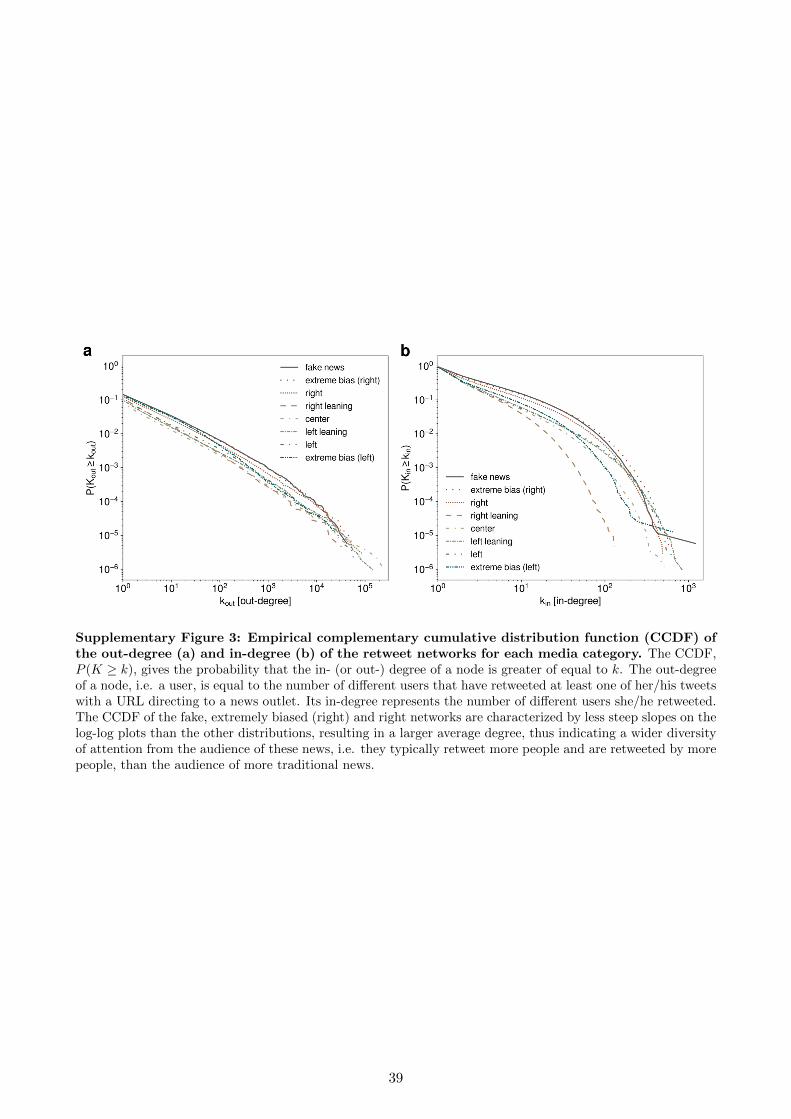
Supplementary Figure 3: Empirical complementary cumulative distribution function (CCDF) ofthe out-degree (a) and in-degree (b) of the retweet networks for each media category. The CCDF,P (K ≥ k), gives the probability that the in- (or out-) degree of a node is greater of equal to k. The out-degreeof a node, i.e. a user, is equal to the number of different users that have retweeted at least one of her/his tweetswith a URL directing to a news outlet. Its in-degree represents the number of different users she/he retweeted.The CCDF of the fake, extremely biased (right) and right networks are characterized by less steep slopes on thelog-log plots than the other distributions, resulting in a larger average degree, thus indicating a wider diversityof attention from the audience of these news, i.e. they typically retweet more people and are retweeted by morepeople, than the audience of more traditional news.
39

Supplementary Figure 4: Causal graph obtained after removing all users linked to the campaignstaff of each candidate from the influencers. We only show causal effects larger than 0.05.
40
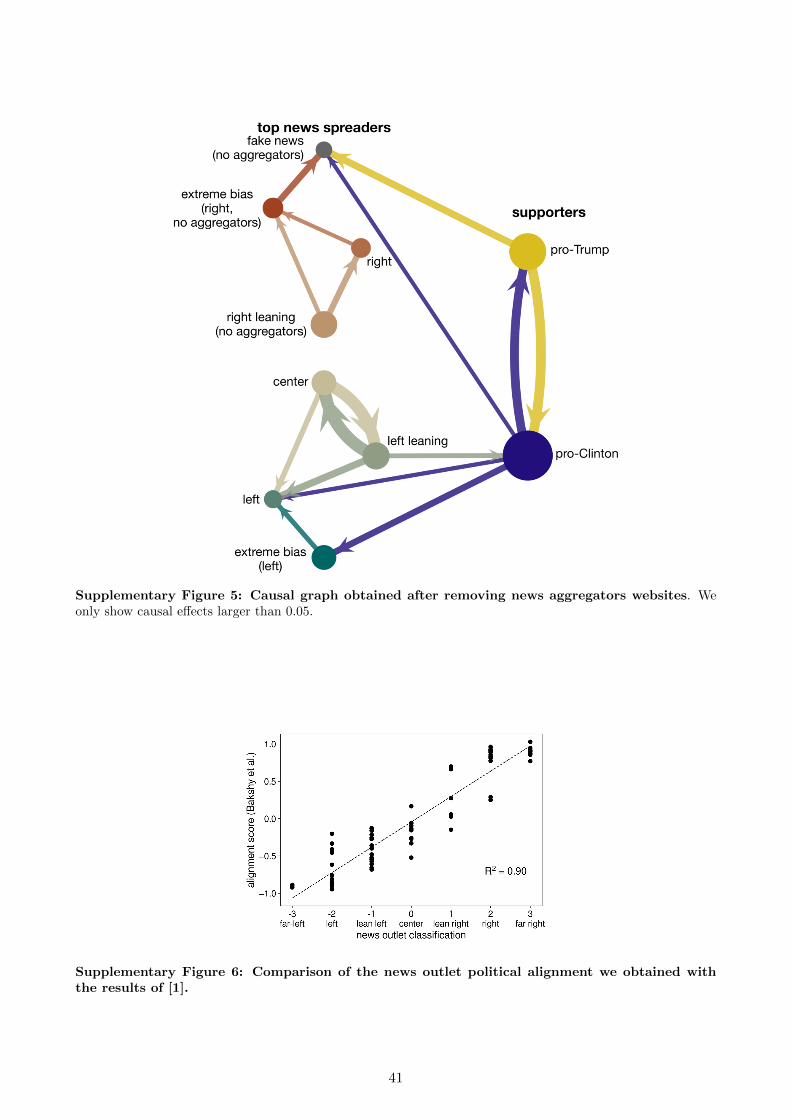
Supplementary Figure 5: Causal graph obtained after removing news aggregators websites. Weonly show causal effects larger than 0.05.
Supplementary Figure 6: Comparison of the news outlet political alignment we obtained withthe results of [1].
41
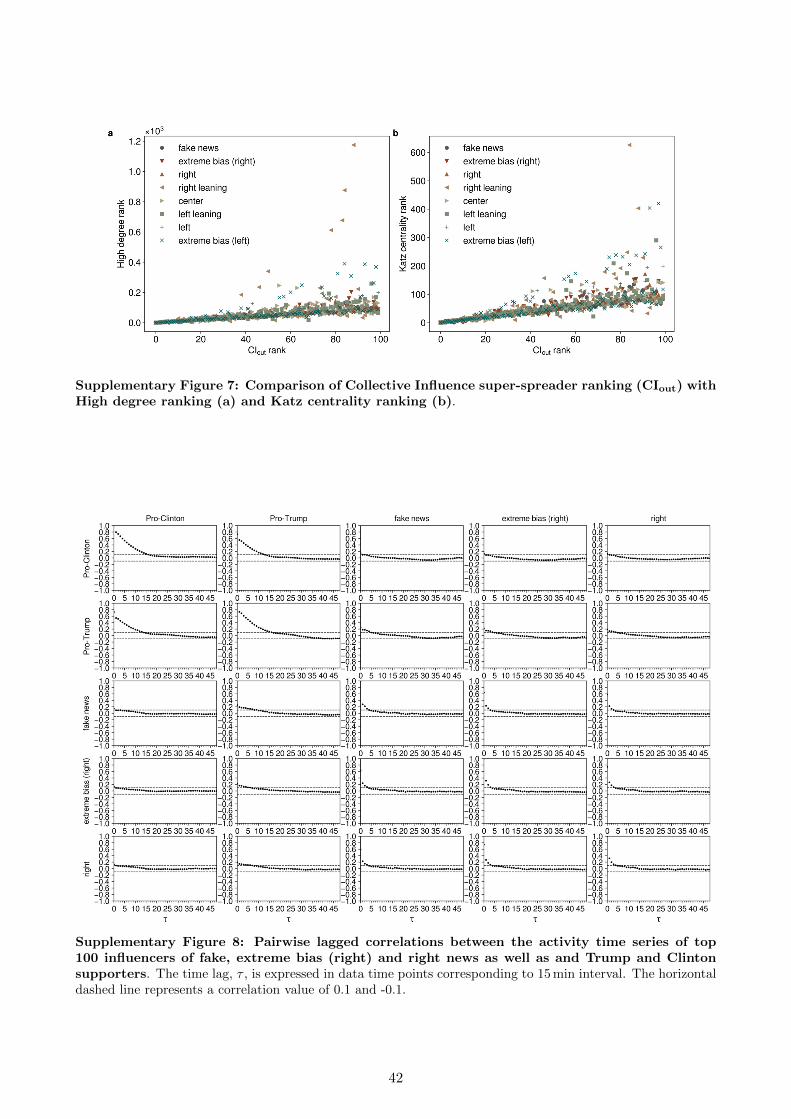
Supplementary Figure 7: Comparison of Collective Influence super-spreader ranking (CIout) withHigh degree ranking (a) and Katz centrality ranking (b).
Supplementary Figure 8: Pairwise lagged correlations between the activity time series of top100 influencers of fake, extreme bias (right) and right news as well as and Trump and Clintonsupporters. The time lag, τ , is expressed in data time points corresponding to 15 min interval. The horizontaldashed line represents a correlation value of 0.1 and -0.1.
42
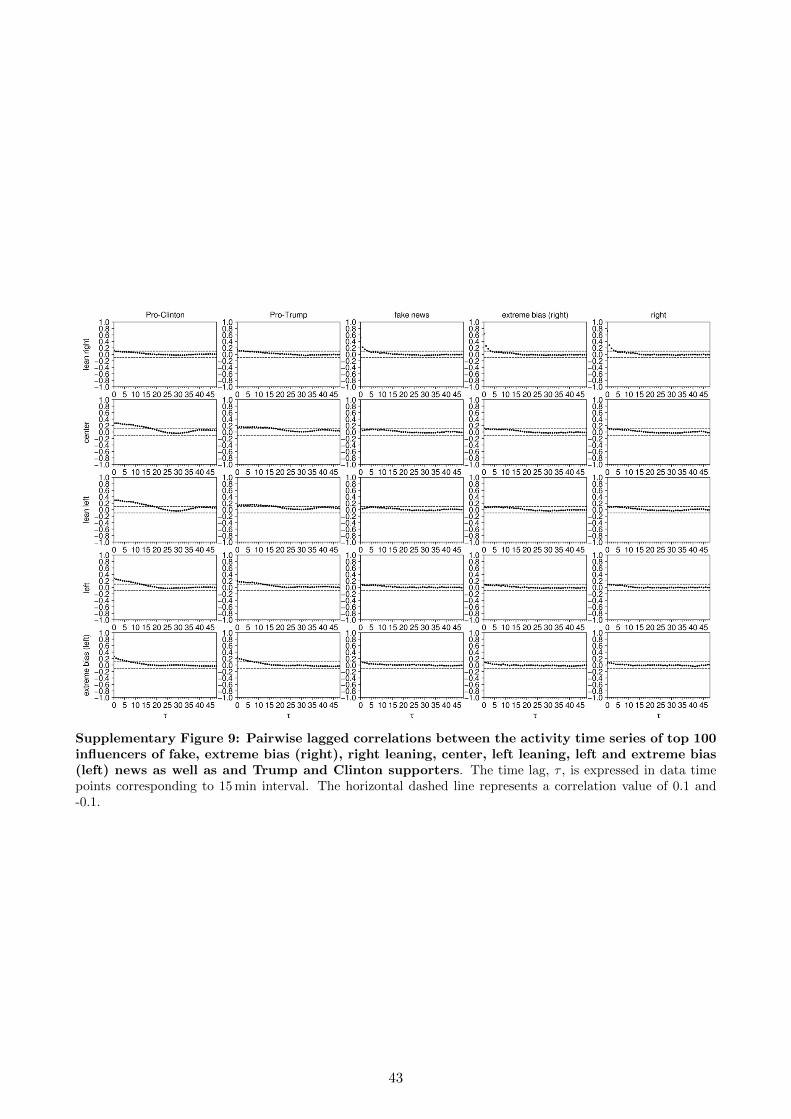
Supplementary Figure 9: Pairwise lagged correlations between the activity time series of top 100influencers of fake, extreme bias (right), right leaning, center, left leaning, left and extreme bias(left) news as well as and Trump and Clinton supporters. The time lag, τ , is expressed in data timepoints corresponding to 15 min interval. The horizontal dashed line represents a correlation value of 0.1 and-0.1.
43
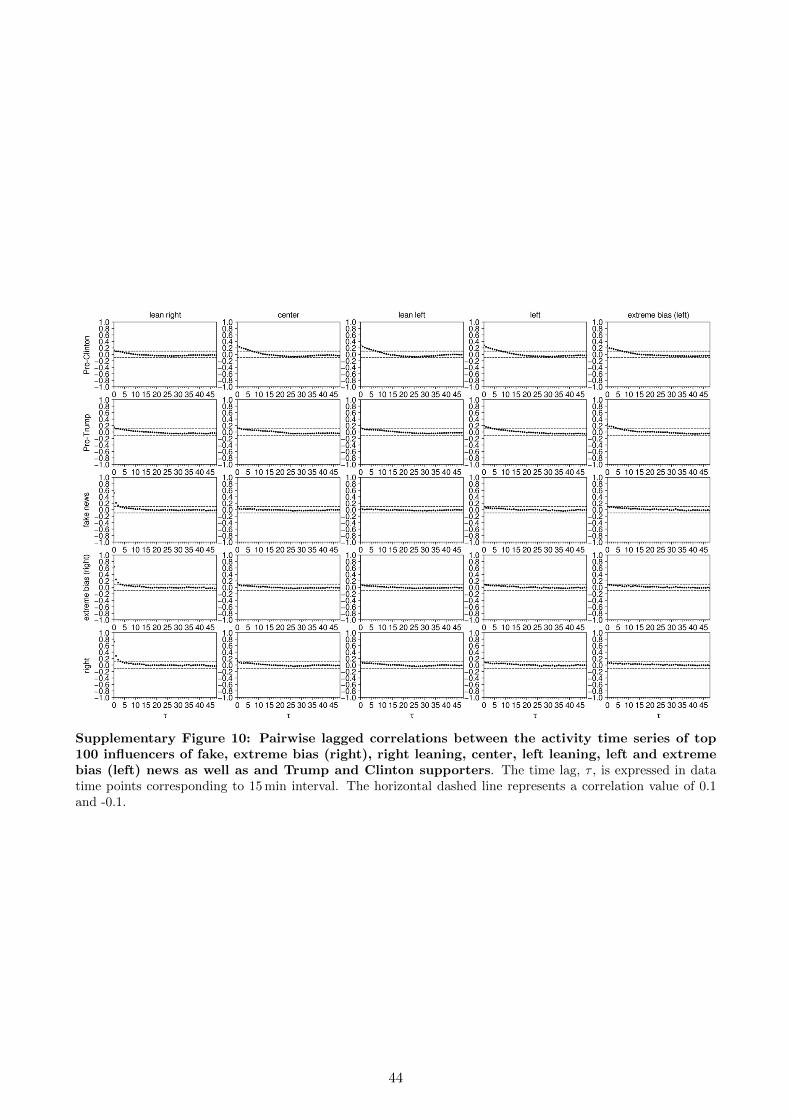
Supplementary Figure 10: Pairwise lagged correlations between the activity time series of top100 influencers of fake, extreme bias (right), right leaning, center, left leaning, left and extremebias (left) news as well as and Trump and Clinton supporters. The time lag, τ , is expressed in datatime points corresponding to 15 min interval. The horizontal dashed line represents a correlation value of 0.1and -0.1.
44

Supplementary Figure 11: Pairwise lagged correlations between the activity time series of top100 influencers of right leaning, center, left leaning, left and extreme bias (left) news. The timelag, τ , is expressed in data time points corresponding to 15 min interval. The horizontal dashed lines representsa correlation value of 0.1 and -0.1.
45

References
[1] Bakshy, E., Messing, S. & Adamic, L. A. Exposure to ideologically diverse news and opinion
on Facebook. Science 348, 1130–1132 (2015). http://www.sciencemag.org/cgi/doi/10.1126/
science.aaa1160.
46