in touch with tomorrow - ubl digital
TRANSCRIPT

UNITED BANK LIMITEDUBL Head OfficeI.I. Chundrigar Road, Karachi - 74000, Pakistan.UAN: 111-825-888 Website: www.ubldigital.com
ANNUAL REPORT 2020
In Touchwith Tomorrow

In Touchwith TomorrowAt UBL we believe that connectivity is key. Our connection to tomorrow is indigenous to our brand attributes of being Pakistan's most progressive and innovative bank. For us it is more than just being ahead of the curve, it's having the foresight to shape it. We are committed to foreseeing future challenges and facing them head on by keeping a step ahead and constantly striving for a better tomorrow to provide world class technological solutions to our valued customers.

In Touchwith TomorrowAt UBL we believe that connectivity is key. Our connection to tomorrow is indigenous to our brand attributes of being Pakistan's most progressive and innovative bank. For us it is more than just being ahead of the curve, it's having the foresight to shape it. We are committed to foreseeing future challenges and facing them head on by keeping a step ahead and constantly striving for a better tomorrow to provide world class technological solutions to our valued customers.
01Annual Report 2020

Contents
United Bank Limited02

ContentsCompany Information 09
Chairman’s Profile 11
Board of Directors 12
Chairman’s Review Report to the Members 22
Directors’ Report to the Members 2020 23
Sustainability at UBL in 2020 43
President and CEO Review 2020 44
Management Team 48
Growth at a Glance 52
UBL International Network 56
Report of Shariah Board for the Financial Year-2020 58
Independent Auditor’s Review Report
to the Members of United Bank Limited 64
Statement of Compliance with Listed Companies
(Code of Corporate Governance) Regulations, 2019 65
Annual Statement on Internal Controls 2020 67
Complaint Handling at UBL 68
Financial Statements 2020 70
Auditor’s Report on Unconsolidated Financial
Statements to the Members 71
Unconsolidated Statement of Financial Position 75
Unconsolidated Profit and Loss Account 76
Unconsolidated Statement of Comprehensive
Income 77
Unconsolidated Statement of Changes in Equity 78
Unconsolidated Cash Flow Statement 79
Notes to and forming part of the Unconsolidated
Financial Statements 80
Annexure ‘I’ as referred to in note 10.6 of the Bank’s
Unconsolidated and Consolidated Financial
Statements 155
Annexure ‘II’ as referred to in note 2.3 and 10.7 of
the Bank’s Unconsolidated and Consolidated
Financial Statements 161
Annexure ‘III’ as referred to in note 11.6 of the Bank’s
Unconsolidated Financial Statements 168
Auditor’s Report on Consolidated Financial
Statements to the Members 169
Consolidated Statement of Financial Position 173
Consolidated Profit and Loss Account 174
Consolidated Statement of Comprehensive Income 175
Consolidated Statement of Changes in Equity 176
Consolidated Cash Flow Statement 177
Notes to and forming part of the Consolidated
Financial Statements 178
Annexure ‘III’ as referred to in note 11.6 of the
Group’s Consolidated Financial Statements 258
Consolidated Statement of Financial Position in USD 259
Consolidated Profit and Loss Account in USD 260
Category of Shareholders 261
Details of Mutual Funds & Modarabas 262
Pattern of Shareholding 263
Shares Trading (Sale / Purchase) during the year 2020 268
Directorship / Membership of UBL’s Directors in other
Corporate Bodies 269
Notice of 62nd Annual General Meeting 273
Form of Proxy
03Annual Report 2020

VisionTo be a world class bank dedicated to excellence, and to surpass the highest expectations of our customers and all other stakeholders.
Mission• Be the undisputed leader in financial services for our customers• Most innovative and fastest growing bank in targeted businesses • Continue to diversify across chosen geographies• Achieve operational excellence with the highest level of compliance • Consistently create leaders through inspired human capital • Contribute positively to the communities we operate in
Values• Customer first• Honesty of purpose• Teamwork• Excellence• Meritocracy
Vision to LeadMission that EmpowersValues that Form our Core
United Bank Limited04

VisionTo be a world class bank dedicated to excellence, and to surpass the highest expectations of our customers and all other stakeholders.
Mission• Be the undisputed leader in financial services for our customers• Most innovative and fastest growing bank in targeted businesses • Continue to diversify across chosen geographies• Achieve operational excellence with the highest level of compliance • Consistently create leaders through inspired human capital • Contribute positively to the communities we operate in
Values• Customer first• Honesty of purpose• Teamwork• Excellence• Meritocracy
Vision to LeadMission that EmpowersValues that Form our Core
05Annual Report 2020

Innovation isImminentUBL is always ahead of the curve in terms of the technological finesse of its products and services. The Bank is proud of the many innovations it has been able to bring forth to serve the financial needs of the people of Pakistan. In 2020, as the country’s fastest growing digital bank, we dedicated our efforts towards a warp-speed digital transformation. Working on several innovative ventures we were able to offer our more than 10 million customers, multiple, unparalleled and efficacious digital solutions. Being hailed the Best Digital Bank in Pakistan, by both national and international bodies, during the year, we are now positioned to bring home the digital transformation of banking services happening across the globe and offer the ultimate banking experience to our customers.
United Bank Limited06

Innovation isImminentUBL is always ahead of the curve in terms of the technological finesse of its products and services. The Bank is proud of the many innovations it has been able to bring forth to serve the financial needs of the people of Pakistan. In 2020, as the country’s fastest growing digital bank, we dedicated our efforts towards a warp-speed digital transformation. Working on several innovative ventures we were able to offer our more than 10 million customers, multiple, unparalleled and efficacious digital solutions. Being hailed the Best Digital Bank in Pakistan, by both national and international bodies, during the year, we are now positioned to bring home the digital transformation of banking services happening across the globe and offer the ultimate banking experience to our customers.
07Annual Report 2020

Company InformationMr. Arshad Ahmad MirNon-Executive Director
Mr. Amar Zafar KhanIndependent Director
Mr. Tariq RashidIndependent Director
Ms. Shazia SyedIndependent Director
Sir Mohammed Anwar Pervez, OBE, HPkChairman/Non-Executive Director
Lord Zameer M. Choudrey, CBE, SI Pk, FCANon-Executive Director
Mr. Haider Zameer ChoudreyNon-Executive Director
Mr. Rizwan PervezNon-Executive Director
Mr. Shazad G. DadaPresident & CEO
Board of Directors
Ms. Shazia Syed ChairpersonMr. Haider Zameer ChoudreyMemberMr. Rizwan PervezMemberMr. Aqeel Ahmed Nasir Secretary
Committees of the Board
Board Audit Committee (BAC)
Mr. Arshad Ahmad MirChairmanLord Zameer M. Choudrey, CBE, SI Pk, FCAMemberMs. Shazia SyedMemberMr. Shazad G. DadaMemberMr. Imran SarwarSecretary
Board Risk & Compliance Committee (BRCC)
Sir Mohammed Anwar Pervez, OBE, HPkChairmanLord Zameer M. Choudrey, CBE, SI Pk, FCAMemberMr. Arshad Ahmad MirMemberMr. Aqeel Ahmed NasirSecretary
Board Nomination Committee (BNC)
Chief Financial OfficerMr. Aameer Karachiwalla
Company Secretary &Chief Legal CounselMr. Aqeel Ahmed Nasir
Registered Office13th Floor, UBL Building, Jinnah Avenue,Blue Area, Islamabad
UBL Head OfficeI.I. Chundrigar Road, Karachi–74000, Pakistan
Share Registrar THK Associates (Pvt.) LimitedPlot No. 32-C, Jami Commercial Street-2 D.H.A. Phase VII,Karachi-75500.Phone No.: 021-35310187UAN: 021-111-000-322Fax No.: 021-35310190Email: [email protected]
Mr. Tariq RashidChairmanSir Mohammed Anwar Pervez, OBE, HPkMemberMr. Arshad Ahmad MirMemberMr. Rizwan PervezMemberMs. Sadia SaeedSecretary
Board Human Resource &Compensation Committee (HRCC)
Auditors M/s. A.F. Ferguson & Co.,Chartered Accountants
Legal AdvisorsM/s. Mehmood Abdul Ghani & Co.,Advocates
ContactsUAN: 111-825-111Contact Centre: 111-825-888Website: www.ubldigital.comEmail: [email protected]
Mr. Tariq RashidChairmanLord Zameer M. Choudrey, CBE, SI,PkMemberMr. Haider Zameer ChoudreyMemberMr. Shazad G. DadaMemberMr. Muhammad Faisal AnwarSecretary
Board IT Committee (BITC)
United Bank Limited08

Company InformationMr. Arshad Ahmad MirNon-Executive Director
Mr. Amar Zafar KhanIndependent Director
Mr. Tariq RashidIndependent Director
Ms. Shazia SyedIndependent Director
Sir Mohammed Anwar Pervez, OBE, HPkChairman/Non-Executive Director
Lord Zameer M. Choudrey, CBE, SI Pk, FCANon-Executive Director
Mr. Haider Zameer ChoudreyNon-Executive Director
Mr. Rizwan PervezNon-Executive Director
Mr. Shazad G. DadaPresident & CEO
Board of Directors
Ms. Shazia Syed ChairpersonMr. Haider Zameer ChoudreyMemberMr. Rizwan PervezMemberMr. Aqeel Ahmed Nasir Secretary
Committees of the Board
Board Audit Committee (BAC)
Mr. Arshad Ahmad MirChairmanLord Zameer M. Choudrey, CBE, SI Pk, FCAMemberMs. Shazia SyedMemberMr. Shazad G. DadaMemberMr. Imran SarwarSecretary
Board Risk & Compliance Committee (BRCC)
Sir Mohammed Anwar Pervez, OBE, HPkChairmanLord Zameer M. Choudrey, CBE, SI Pk, FCAMemberMr. Arshad Ahmad MirMemberMr. Aqeel Ahmed NasirSecretary
Board Nomination Committee (BNC)
Chief Financial OfficerMr. Aameer Karachiwalla
Company Secretary &Chief Legal CounselMr. Aqeel Ahmed Nasir
Registered Office13th Floor, UBL Building, Jinnah Avenue,Blue Area, Islamabad
UBL Head OfficeI.I. Chundrigar Road, Karachi–74000, Pakistan
Share Registrar THK Associates (Pvt.) LimitedPlot No. 32-C, Jami Commercial Street-2 D.H.A. Phase VII,Karachi-75500.Phone No.: 021-35310187UAN: 021-111-000-322Fax No.: 021-35310190Email: [email protected]
Mr. Tariq RashidChairmanSir Mohammed Anwar Pervez, OBE, HPkMemberMr. Arshad Ahmad MirMemberMr. Rizwan PervezMemberMs. Sadia SaeedSecretary
Board Human Resource &Compensation Committee (HRCC)
Auditors M/s. A.F. Ferguson & Co.,Chartered Accountants
Legal AdvisorsM/s. Mehmood Abdul Ghani & Co.,Advocates
ContactsUAN: 111-825-111Contact Centre: 111-825-888Website: www.ubldigital.comEmail: [email protected]
Mr. Tariq RashidChairmanLord Zameer M. Choudrey, CBE, SI,PkMemberMr. Haider Zameer ChoudreyMemberMr. Shazad G. DadaMemberMr. Muhammad Faisal AnwarSecretary
Board IT Committee (BITC)
09Annual Report 2020

Chairman’s ProfileSir Mohammed Anwar Pervez, OBE HPk is the Chairman of the Board of Directors of United Bank Limited since December 2013, Chairman of Board Nomination Committee (BNC) and Member of Board Human Resource & Compensation Committee (HRCC). He is also the Chairman of Bestway Group & its subsidiaries, which include Batleys Limited, Well Pharmacy and Bestway Cement Limited.
Sir Anwar began his career in the food business in 1963 when he opened a convenience store in London. He ventured into the wholesale business in 1976 and has been responsible for growing Bestway Group into the 9th largest family business in the UK.
Today, it is the 2nd largest wholesaler in the UK, the 3rd largest retail pharmacy in the UK, the 2nd largest cement producer in Pakistan and the 2nd largest private bank in Pakistan. The Group provides employment to over 33,600 globally.
Sir Anwar was awarded the Order of the British Empire (OBE) in 1992 and was conferred the title of Knight’s Bachelor in 1999 by Her Majesty the Queen for his services to the food industry and various charitable causes in the UK. In 2000 he was awarded ‘Hilal-e-Pakistan’.
In 2005, Sir Anwar Pervez was voted winner of the prestigious ‘Grocer Cup for Outstanding Business Achievement’ by the Institute of Grocery Distribution, UK.
In 2006 he received ‘Sitara-e-Essar’ by the President of Pakistan. The same year he was chosen as the ‘Master Entrepreneur – UK’ at the Ernst & Young Entrepreneur of the Year 2006 Awards.
In 2011, Sir Anwar was awarded with an honorary Doctor of Laws degree by FC College Lahore.
In 2012, in recognition of his philanthropic services to the Community, the University of Bradford conferred on Sir Anwar Pervez an honorary Doctor of Laws degree.
He is the Chairman of Bestway Foundation UK and Patron-in-Chief of Bestway Foundation Pakistan.
United Bank Limited10

Chairman’s ProfileSir Mohammed Anwar Pervez, OBE HPk is the Chairman of the Board of Directors of United Bank Limited since December 2013, Chairman of Board Nomination Committee (BNC) and Member of Board Human Resource & Compensation Committee (HRCC). He is also the Chairman of Bestway Group & its subsidiaries, which include Batleys Limited, Well Pharmacy and Bestway Cement Limited.
Sir Anwar began his career in the food business in 1963 when he opened a convenience store in London. He ventured into the wholesale business in 1976 and has been responsible for growing Bestway Group into the 9th largest family business in the UK.
Today, it is the 2nd largest wholesaler in the UK, the 3rd largest retail pharmacy in the UK, the 2nd largest cement producer in Pakistan and the 2nd largest private bank in Pakistan. The Group provides employment to over 33,600 globally.
Sir Anwar was awarded the Order of the British Empire (OBE) in 1992 and was conferred the title of Knight’s Bachelor in 1999 by Her Majesty the Queen for his services to the food industry and various charitable causes in the UK. In 2000 he was awarded ‘Hilal-e-Pakistan’.
In 2005, Sir Anwar Pervez was voted winner of the prestigious ‘Grocer Cup for Outstanding Business Achievement’ by the Institute of Grocery Distribution, UK.
In 2006 he received ‘Sitara-e-Essar’ by the President of Pakistan. The same year he was chosen as the ‘Master Entrepreneur – UK’ at the Ernst & Young Entrepreneur of the Year 2006 Awards.
In 2011, Sir Anwar was awarded with an honorary Doctor of Laws degree by FC College Lahore.
In 2012, in recognition of his philanthropic services to the Community, the University of Bradford conferred on Sir Anwar Pervez an honorary Doctor of Laws degree.
He is the Chairman of Bestway Foundation UK and Patron-in-Chief of Bestway Foundation Pakistan.
11Annual Report 2020

Board of Directors
Lord Zameer Mohammed Choudrey CBE, SI Pk has been a Member of the Board of Directors of United Bank Limited since October 2002. He is a Member of the Board Risk and Compliance Committee (BRCC), Board IT Committee (BITC) and Board Nomination Committee (BNC). He is also a Director of UBL Insurers Limited.
He is the Chief Executive of Bestway Group, which is the 9th largest family owned business in UK with an annual turnover of £3.8 billion. The Group is the 2nd largest wholesaler in the UK, the 3rd largest retail pharmacy in the UK, the largest cement producer in Pakistan and the 2nd largest private bank in Pakistan. The Group provides employment to over 33,600 globally.
Lord Choudrey is a Chartered Accountant by profession. He joined Bestway Group as a Financial Controller in 1984. In 1990, he was promoted as the Group Finance Director. In 1995, he was given additional responsibilities of business diversification both in UK and Pakistan and was promoted as Chief Executive of Bestway Cement Limited. He was appointed as the Group CEO in 2004.
He is a fellow of the Institute of Chartered Accounts of England & Wales. He is the Chairman of Conservative Friends of Pakistan.
Lord Choudrey is a trustee of Bestway Foundation UK and Chairman of Bestway Foundation Pakistan. He is also a trustee of Crimestoppers. He also chairs The British Asian Trust’s UK Advisory Council and is a member of HRH Prince of Wales Pakistan Recovery Fund International Leadership Team.
In 2014, he was awarded an honorary degree by the University of Kent in recognition of his philanthropic services to the community.
In December 2015, he was appointed Commander of the Order of the British Empire (CBE) by Her Majesty the Queen for his services to the UK wholesale industry and various charitable causes in the UK and abroad.
In March 2018, the President of Pakistan awarded the Sitara-e-Imitiaz (Star of Excellence) to him in recognition of his contributions to advancing Pakistan through his services and the wide array of philanthropic work.
In 2019, he was appointed to the House of Lords, UK. This appointment is in recognition of his considerable contributions to Britain’s domestic and foreign trade as a leading businessman and entrepreneur, his wide array of philanthropic work both in the UK and abroad, and his role as Chairman of the Conservative Friends of Pakistan.
Lord Zameer Mohammed Choudrey,CBE, SI Pk, FCA
DirectorMr. Haider Zameer Choudrey has been a Director of United Bank Limited since March 2014. He is Member of the Board Audit Committee (BAC) and Board IT Committee (BITC) and has the distinction of becoming the youngest Director of any listed commercial bank in Pakistan. He is a Chartered Accountant by profession.
He is the Finance Director of Bestway Group, which is the 9th largest family owned business in the UK with an annual turnover of over £3.8 billion.
After having distinguished himself at the world-renowned Eton College, Haider read Economics at Gonville & Caius College, University of Cambridge. He also received his Masters in Economics from University of Cambridge. Haider is a member of the Institute of Chartered Accountants in England and Wales and previously trained with KPMG UK LLP, where he was an integral part of the Consumer Markets Audit; Corporate Tax & Corporate Finance Teams.
Haider has extensive experience in finance, strategy, digital, tax and transaction services. He has been involved in a variety of roles and projects at Bestway Group, including the acquisition and post-acquisition management of Well Pharmacy and Conviviality Retail. Haider has been a Director of Bestway Cement Limited since 2016.
Haider is actively involved with the charitable work of the Bestway Foundation in the UK and Pakistan; and is part of the management team involved in the construction of two state of the art schools in Chakwal, Punjab.
Haider is a Certified Director from the Pakistan Institute of Corporate Governance (PICG).
Haider Zameer Choudrey, ACA
Director
United Bank Limited12

Board of Directors
Lord Zameer Mohammed Choudrey CBE, SI Pk has been a Member of the Board of Directors of United Bank Limited since October 2002. He is a Member of the Board Risk and Compliance Committee (BRCC), Board IT Committee (BITC) and Board Nomination Committee (BNC). He is also a Director of UBL Insurers Limited.
He is the Chief Executive of Bestway Group, which is the 9th largest family owned business in UK with an annual turnover of £3.8 billion. The Group is the 2nd largest wholesaler in the UK, the 3rd largest retail pharmacy in the UK, the largest cement producer in Pakistan and the 2nd largest private bank in Pakistan. The Group provides employment to over 33,600 globally.
Lord Choudrey is a Chartered Accountant by profession. He joined Bestway Group as a Financial Controller in 1984. In 1990, he was promoted as the Group Finance Director. In 1995, he was given additional responsibilities of business diversification both in UK and Pakistan and was promoted as Chief Executive of Bestway Cement Limited. He was appointed as the Group CEO in 2004.
He is a fellow of the Institute of Chartered Accounts of England & Wales. He is the Chairman of Conservative Friends of Pakistan.
Lord Choudrey is a trustee of Bestway Foundation UK and Chairman of Bestway Foundation Pakistan. He is also a trustee of Crimestoppers. He also chairs The British Asian Trust’s UK Advisory Council and is a member of HRH Prince of Wales Pakistan Recovery Fund International Leadership Team.
In 2014, he was awarded an honorary degree by the University of Kent in recognition of his philanthropic services to the community.
In December 2015, he was appointed Commander of the Order of the British Empire (CBE) by Her Majesty the Queen for his services to the UK wholesale industry and various charitable causes in the UK and abroad.
In March 2018, the President of Pakistan awarded the Sitara-e-Imitiaz (Star of Excellence) to him in recognition of his contributions to advancing Pakistan through his services and the wide array of philanthropic work.
In 2019, he was appointed to the House of Lords, UK. This appointment is in recognition of his considerable contributions to Britain’s domestic and foreign trade as a leading businessman and entrepreneur, his wide array of philanthropic work both in the UK and abroad, and his role as Chairman of the Conservative Friends of Pakistan.
Lord Zameer Mohammed Choudrey,CBE, SI Pk, FCA
DirectorMr. Haider Zameer Choudrey has been a Director of United Bank Limited since March 2014. He is Member of the Board Audit Committee (BAC) and Board IT Committee (BITC) and has the distinction of becoming the youngest Director of any listed commercial bank in Pakistan. He is a Chartered Accountant by profession.
He is the Finance Director of Bestway Group, which is the 9th largest family owned business in the UK with an annual turnover of over £3.8 billion.
After having distinguished himself at the world-renowned Eton College, Haider read Economics at Gonville & Caius College, University of Cambridge. He also received his Masters in Economics from University of Cambridge. Haider is a member of the Institute of Chartered Accountants in England and Wales and previously trained with KPMG UK LLP, where he was an integral part of the Consumer Markets Audit; Corporate Tax & Corporate Finance Teams.
Haider has extensive experience in finance, strategy, digital, tax and transaction services. He has been involved in a variety of roles and projects at Bestway Group, including the acquisition and post-acquisition management of Well Pharmacy and Conviviality Retail. Haider has been a Director of Bestway Cement Limited since 2016.
Haider is actively involved with the charitable work of the Bestway Foundation in the UK and Pakistan; and is part of the management team involved in the construction of two state of the art schools in Chakwal, Punjab.
Haider is a Certified Director from the Pakistan Institute of Corporate Governance (PICG).
Haider Zameer Choudrey, ACA
Director
13Annual Report 2020

Board of Directors
Mr. Arshad Ahmad Mir, appointed as a Member of the Board of Directors with effect from 26 October 2009, has over four decades of extensive corporate experience in financial services, oil industry, management consultancy, manufacturing and wholesale distribution businesses.
He has served with major corporate entities in areas of general management, corporate planning, project management, compliance and consultancy. Geographical coverage of his corporate roles and responsibilities encompass Pakistan, Middle East, Africa, UK & Europe.
Arshad is a member of the Institute of Chartered Accountants and Institute of Bankers UK. He has attended various management courses and conferences including the Advanced Management Programme of London Business School. He is a Certified Director from Pakistan Institute of Corporate Governance (PICG).
He is a Chairman of the Board Risk & Compliance Committee (BRCC), Member of Board Human Resources & Compensation Committee (HRCC) and Member of Board Nomination Committee (BNC).
Arshad Ahmad Mir
DirectorMr. Rizwan Pervez has been a Member of the Board of Director of United Bank Limited since March 2014. He is a Member of the Board Audit Committee (BAC) and the Board of Human Resource & Compensation Committee (HRCC). He is also Director of UBL Insurers Limited.
Rizwan graduated from the University of Pittsburgh, USA in 1990 with a BSc in Business Management.
He was trained with a leading UK firm of Chartered Accountants and qualified in August 1995. Rizwan is a member of the Institute of Chartered Accountants in England & Wales.
He joined Bestway as a Financial Accountant in 1995 and was elected to the Board of Directors in January 2000 as Group Business Development Director. He was responsible for developing the Group’s fascia and delivered business. Rizwan was instrumental in creating the ‘Best-One’ symbol group and Bestway Direct, the Group’s delivered wholesale operation.
In 2006, Rizwan was appointed Operations Director where he led and managed the integration of Bestway and Batleys wholesale operations which created the UK’s largest independent wholesale group. In 2012, Rizwan was appointed the Group Marketing & PR Director. In 2014, he was appointed as Wholesale Operations Director. In 2016, he was appointed as Customer Liaison Director.
In 2019, Rizwan was appointed as Managing Director of MAP Trading Limited.
Rizwan has served as Governor of John Kelly Schools in North West London playing a leading role in the school’s attainment of ‘academy’ status and establishing the school as a centre of excellence under its new name of The Crest Academy.
Rizwan is a Trustee of Bestway Foundation UK.
Rizwan is a Certified Director from the Pakistan Institute of Corporate Governance (PICG).
Rizwan Pervez
Director
United Bank Limited14

Board of Directors
Mr. Arshad Ahmad Mir, appointed as a Member of the Board of Directors with effect from 26 October 2009, has over four decades of extensive corporate experience in financial services, oil industry, management consultancy, manufacturing and wholesale distribution businesses.
He has served with major corporate entities in areas of general management, corporate planning, project management, compliance and consultancy. Geographical coverage of his corporate roles and responsibilities encompass Pakistan, Middle East, Africa, UK & Europe.
Arshad is a member of the Institute of Chartered Accountants and Institute of Bankers UK. He has attended various management courses and conferences including the Advanced Management Programme of London Business School. He is a Certified Director from Pakistan Institute of Corporate Governance (PICG).
He is a Chairman of the Board Risk & Compliance Committee (BRCC), Member of Board Human Resources & Compensation Committee (HRCC) and Member of Board Nomination Committee (BNC).
Arshad Ahmad Mir
DirectorMr. Rizwan Pervez has been a Member of the Board of Director of United Bank Limited since March 2014. He is a Member of the Board Audit Committee (BAC) and the Board of Human Resource & Compensation Committee (HRCC). He is also Director of UBL Insurers Limited.
Rizwan graduated from the University of Pittsburgh, USA in 1990 with a BSc in Business Management.
He was trained with a leading UK firm of Chartered Accountants and qualified in August 1995. Rizwan is a member of the Institute of Chartered Accountants in England & Wales.
He joined Bestway as a Financial Accountant in 1995 and was elected to the Board of Directors in January 2000 as Group Business Development Director. He was responsible for developing the Group’s fascia and delivered business. Rizwan was instrumental in creating the ‘Best-One’ symbol group and Bestway Direct, the Group’s delivered wholesale operation.
In 2006, Rizwan was appointed Operations Director where he led and managed the integration of Bestway and Batleys wholesale operations which created the UK’s largest independent wholesale group. In 2012, Rizwan was appointed the Group Marketing & PR Director. In 2014, he was appointed as Wholesale Operations Director. In 2016, he was appointed as Customer Liaison Director.
In 2019, Rizwan was appointed as Managing Director of MAP Trading Limited.
Rizwan has served as Governor of John Kelly Schools in North West London playing a leading role in the school’s attainment of ‘academy’ status and establishing the school as a centre of excellence under its new name of The Crest Academy.
Rizwan is a Trustee of Bestway Foundation UK.
Rizwan is a Certified Director from the Pakistan Institute of Corporate Governance (PICG).
Rizwan Pervez
Director
15Annual Report 2020

Board of Directors
Ms. Shazia Syed has been a Member of the Board of Directors of United Bank Limited since November 10, 2020. She is the Chairperson of Board Audit Committee (BAC) and member of Board Risk & Compliance Committee (BRCC).
Ms. Shazia Syed is an Executive Vice President at Unilever Plc., the Anglo-Dutch giant of the Fast Moving Consumer Goods sector. She is responsible for Unilever’s global tea business based out of Rotterdam, The Netherlands.
Prior to becoming the global head of tea business, she was on the Board of Unilever Pakistan Limited as Chairperson & CEO as well as on the Board of Unilever Pakistan Foods Limited as CEO. She has a career spanning across 30 years in the FMCG sector and has worked in leadership roles in South East Asia, South Asia and Europe.
She was the erstwhile President of the Overseas Investor’s Chamber of Commerce & Industry and has also served as a Director for the Pakistan Business Council. In addition, Shazia also contributed her time on the Advisory Council at the British Asian Trust, Advisory Board of Change-Pakistan and as a Trustee at the Duke of Edinburgh’s Award Foundation.
Shazia is an active advocate for Diversity & Inclusion at the workplace, with a vision to enable and facilitate working women from all backgrounds across all sectors.
She is a Certified Director from the Pakistan Institute of Corporate Governance (PICG).
Shazia Syed
DirectorMr. Amar Zafar Khan is a Chartered Accountant turned International banker with over 30 years’ multi-functional international experience at Price Waterhouse, UK and Citibank NA. His core contribution has been in turnarounds and developing new products and businesses in commercial banking, investment banking, domestic and cross-border corporate finance and securities trading.
As an international staff member of Citibank, he served in Europe, the Middle East and Africa. In Europe he built a new aircraft and ship leasing business to a position of market leadership. Another notable commercial success was the pioneering First Securities Discount House, an IFC investment in Nigeria, which he set up and grew to market leadership in trading Fixed Income Securities and Asset Management. He later returned to Nigeria as Executive Director to oversee the restructuring of retail banking, investment banking and international operations of United Bank for Africa, after it was privatised. He returned to Pakistan after 23 years. Initially as an advisor and later as Chairman and CEO of United Bank Limited (UBL) a nationalised institution; he restructured, commercialised and privatised the Bank. He continued with the new owners as CEO before retiring to Malaysia in order to pursue academic interests, social causes and mentoring new businesses.
He pursues efforts to influence a shift in Pakistan’s emphasis towards horticulture exports and upscaling of industry away from unsustainable import substitution to exports. Amar is Certified Director from the Pakistan Institute of Corporate Governance (PICG). He has served on the Boards of various NGOs engaged in Healthcare, Population Control and Education. Aside from UBL, he serves on the Boards of two other listed companies as a non executive independent director.
Amar holds an M.B.A. (Major in Marketing) from Cranfield School of Management, Bedford, UK. In 1981 he was admitted as a Fellow of the Institute of Chartered Accountants in England & Wales.
Amar Zafar Khan
Director
United Bank Limited16

Board of Directors
Ms. Shazia Syed has been a Member of the Board of Directors of United Bank Limited since November 10, 2020. She is the Chairperson of Board Audit Committee (BAC) and member of Board Risk & Compliance Committee (BRCC).
Ms. Shazia Syed is an Executive Vice President at Unilever Plc., the Anglo-Dutch giant of the Fast Moving Consumer Goods sector. She is responsible for Unilever’s global tea business based out of Rotterdam, The Netherlands.
Prior to becoming the global head of tea business, she was on the Board of Unilever Pakistan Limited as Chairperson & CEO as well as on the Board of Unilever Pakistan Foods Limited as CEO. She has a career spanning across 30 years in the FMCG sector and has worked in leadership roles in South East Asia, South Asia and Europe.
She was the erstwhile President of the Overseas Investor’s Chamber of Commerce & Industry and has also served as a Director for the Pakistan Business Council. In addition, Shazia also contributed her time on the Advisory Council at the British Asian Trust, Advisory Board of Change-Pakistan and as a Trustee at the Duke of Edinburgh’s Award Foundation.
Shazia is an active advocate for Diversity & Inclusion at the workplace, with a vision to enable and facilitate working women from all backgrounds across all sectors.
She is a Certified Director from the Pakistan Institute of Corporate Governance (PICG).
Shazia Syed
DirectorMr. Amar Zafar Khan is a Chartered Accountant turned International banker with over 30 years’ multi-functional international experience at Price Waterhouse, UK and Citibank NA. His core contribution has been in turnarounds and developing new products and businesses in commercial banking, investment banking, domestic and cross-border corporate finance and securities trading.
As an international staff member of Citibank, he served in Europe, the Middle East and Africa. In Europe he built a new aircraft and ship leasing business to a position of market leadership. Another notable commercial success was the pioneering First Securities Discount House, an IFC investment in Nigeria, which he set up and grew to market leadership in trading Fixed Income Securities and Asset Management. He later returned to Nigeria as Executive Director to oversee the restructuring of retail banking, investment banking and international operations of United Bank for Africa, after it was privatised. He returned to Pakistan after 23 years. Initially as an advisor and later as Chairman and CEO of United Bank Limited (UBL) a nationalised institution; he restructured, commercialised and privatised the Bank. He continued with the new owners as CEO before retiring to Malaysia in order to pursue academic interests, social causes and mentoring new businesses.
He pursues efforts to influence a shift in Pakistan’s emphasis towards horticulture exports and upscaling of industry away from unsustainable import substitution to exports. Amar is Certified Director from the Pakistan Institute of Corporate Governance (PICG). He has served on the Boards of various NGOs engaged in Healthcare, Population Control and Education. Aside from UBL, he serves on the Boards of two other listed companies as a non executive independent director.
Amar holds an M.B.A. (Major in Marketing) from Cranfield School of Management, Bedford, UK. In 1981 he was admitted as a Fellow of the Institute of Chartered Accountants in England & Wales.
Amar Zafar Khan
Director
17Annual Report 2020

Board of Directors
Mr. Shazad G. Dada was appointed the President and CEO of UBL in July 2020. He is a prominent capital markets professional and has over 30 years of distinguished experience with renowned financial institutions in the United States and Pakistan.
Before joining UBL, Shazad was the CEO of Standard Chartered Bank (Pakistan) Ltd and a member of its Africa and Middle East regional Management Team. He also served as the CEO and Managing Director of Barclays Pakistan and Head of Regional Transaction Services Steering Committee for Asia, India, UAE and Pakistan.
Shazad started his career at Deutsche Bank Securities Inc. in New York, where he worked for over 15 years in various capacities, last as the Managing Director of the Mergers, Acquisitions and Corporate Advisory Group. He moved back to Pakistan in 2005 as the Managing Director and Chief Country Officer of Deutsche Bank AG Pakistan.
He is the Chairman of the Board for UBL (Switzerland) AG, Director on the Board of UBL UK, Council Member at the Institute of Bankers Pakistan, nominated representative at the Pakistan Business Council and a member of the Board of British Business Centre Pakistan.
Shazad is the Chairman of the Board of Trustees of Developments in Literacy (DIL) Pakistan and has held various non-executive positions in the past including President of Overseas Chamber of Commerce and Industry (OICCI), Chairman of Pakistan Mercantile Exchange, Chairman Pakistan Banks Association, Independent Director of the Pakistan Stock Exchange (PSX), member of the Board of Directors of Sui Southern Gas Company Limited and member Board of Governors of British Overseas School.
Shazad is a graduate with honours from University of Pennsylvania with Bachelors of Science and Bachelors of Arts degrees and holds an MBA from the Wharton Business School.
He is a Member of the Board Risk and Compliance Committee (BRCC) and Board IT Committee (BITC) of UBL. He is a Certified Director from the Pakistan Institute of Corporate Governance (PICG).
Shazad G. Dada
President & CEOMr. Tariq Rashid has more than 25 years’ experience in Management & Information Technology at senior levels. He spearheaded the setup of the IT infrastructure of mobile operator Mobilink (now Jazz) since inception. He led the IT organisation of Mobilink through different phases of the Telecom industry’s life cycle i.e. infancy, growth and consolidation and served as VP & Chief Strategy Officer for more than 5 years. He also served as a Director of Information Technology at the HQ of a Telecommunication company in Egypt. He successfully led few large business/technology transformation initiatives during his career.
He served as a Director on the Board of Mobilink Microfinance Bank and headed the Risk Committee. He served as Director on the Board of Mobile Number Portability Database (Guarantee) Limited. He also served as President on the Board of International School of Islamabad (ISOI) for more than 4 years.
He is a Chairman of the Board IT Committee (BITC) and Board Human Resource & Compensation Committee (HRCC) of UBL.
He holds an engineering degree from the University of Engineering & Technology, Lahore and post graduate certificate in Computers from National Academy of Higher Education. He attended different management programs abroad and locally from institutes like IMD, INSEAD, MIT and LUMS.
He is a Certified Director from the Pakistan Institute of Corporate Governance (PICG).
Tariq Rashid
Director
United Bank Limited18

Board of Directors
Mr. Shazad G. Dada was appointed the President and CEO of UBL in July 2020. He is a prominent capital markets professional and has over 30 years of distinguished experience with renowned financial institutions in the United States and Pakistan.
Before joining UBL, Shazad was the CEO of Standard Chartered Bank (Pakistan) Ltd and a member of its Africa and Middle East regional Management Team. He also served as the CEO and Managing Director of Barclays Pakistan and Head of Regional Transaction Services Steering Committee for Asia, India, UAE and Pakistan.
Shazad started his career at Deutsche Bank Securities Inc. in New York, where he worked for over 15 years in various capacities, last as the Managing Director of the Mergers, Acquisitions and Corporate Advisory Group. He moved back to Pakistan in 2005 as the Managing Director and Chief Country Officer of Deutsche Bank AG Pakistan.
He is the Chairman of the Board for UBL (Switzerland) AG, Director on the Board of UBL UK, Council Member at the Institute of Bankers Pakistan, nominated representative at the Pakistan Business Council and a member of the Board of British Business Centre Pakistan.
Shazad is the Chairman of the Board of Trustees of Developments in Literacy (DIL) Pakistan and has held various non-executive positions in the past including President of Overseas Chamber of Commerce and Industry (OICCI), Chairman of Pakistan Mercantile Exchange, Chairman Pakistan Banks Association, Independent Director of the Pakistan Stock Exchange (PSX), member of the Board of Directors of Sui Southern Gas Company Limited and member Board of Governors of British Overseas School.
Shazad is a graduate with honours from University of Pennsylvania with Bachelors of Science and Bachelors of Arts degrees and holds an MBA from the Wharton Business School.
He is a Member of the Board Risk and Compliance Committee (BRCC) and Board IT Committee (BITC) of UBL. He is a Certified Director from the Pakistan Institute of Corporate Governance (PICG).
Shazad G. Dada
President & CEOMr. Tariq Rashid has more than 25 years’ experience in Management & Information Technology at senior levels. He spearheaded the setup of the IT infrastructure of mobile operator Mobilink (now Jazz) since inception. He led the IT organisation of Mobilink through different phases of the Telecom industry’s life cycle i.e. infancy, growth and consolidation and served as VP & Chief Strategy Officer for more than 5 years. He also served as a Director of Information Technology at the HQ of a Telecommunication company in Egypt. He successfully led few large business/technology transformation initiatives during his career.
He served as a Director on the Board of Mobilink Microfinance Bank and headed the Risk Committee. He served as Director on the Board of Mobile Number Portability Database (Guarantee) Limited. He also served as President on the Board of International School of Islamabad (ISOI) for more than 4 years.
He is a Chairman of the Board IT Committee (BITC) and Board Human Resource & Compensation Committee (HRCC) of UBL.
He holds an engineering degree from the University of Engineering & Technology, Lahore and post graduate certificate in Computers from National Academy of Higher Education. He attended different management programs abroad and locally from institutes like IMD, INSEAD, MIT and LUMS.
He is a Certified Director from the Pakistan Institute of Corporate Governance (PICG).
Tariq Rashid
Director
19Annual Report 2020

A Prospect ofProgressSince its inception over sixty years ago, UBL has consistently evolved to re-define the way banking is done in Pakistan. 2020 - an unprecedented year, brought with it, a new resolve for us to ensure seamless operational efficiency through our branches while giving paramount importance to customer and employee safety. What followed has been an incredible journey of exploring new avenues to create value in every sphere of our operations. UBL aggressively promoted its Digital Vision while at the same time, offering multiple financial relief packages to its customers affected by the pandemic. We also became key stakeholders in crucial initiatives undertaken by the Government of Pakistan and State Bank of Pakistan, providing financial assistance and opportunities to local and overseas Pakistanis. Being declared the “Bank of the Year” Pakistan for 2020 by The Banker, a leading global financial publication, for the fourth time in one decade, further consolidated our resolve in expanding the scope of financial services in Pakistan, remaining committed to investing in areas that drive the country’s economic development and contributing towards a more financially inclusive Pakistan.
United Bank Limited20

A Prospect ofProgressSince its inception over sixty years ago, UBL has consistently evolved to re-define the way banking is done in Pakistan. 2020 - an unprecedented year, brought with it, a new resolve for us to ensure seamless operational efficiency through our branches while giving paramount importance to customer and employee safety. What followed has been an incredible journey of exploring new avenues to create value in every sphere of our operations. UBL aggressively promoted its Digital Vision while at the same time, offering multiple financial relief packages to its customers affected by the pandemic. We also became key stakeholders in crucial initiatives undertaken by the Government of Pakistan and State Bank of Pakistan, providing financial assistance and opportunities to local and overseas Pakistanis. Being declared the “Bank of the Year” Pakistan for 2020 by The Banker, a leading global financial publication, for the fourth time in one decade, further consolidated our resolve in expanding the scope of financial services in Pakistan, remaining committed to investing in areas that drive the country’s economic development and contributing towards a more financially inclusive Pakistan.
21Annual Report 2020

Chairman’s Review Reportto the Members
Directors’ Reportto the Members 2020
As Chairman of the Board, I am pleased that United Bank Limited (UBL) has delivered strong financial results in 2020 and has demonstrated great resilience during unprecedented challenges brought about by COVID-19. It is highly commendable that our management and staff ensured high standards of service levels across all channels, even during the most difficult phases of the pandemic. I am inspired by the strength and determination of the country and its people and believe that we will emerge much stronger from this crisis.
The domestic franchise is the cornerstone of UBL and the key driver for our profitability. Branch banking continues to maintain strong momentum under an aggressive growth strategy, aiming to meet and exceed customer expectations. The domestic deposits base now stands at over Rs. 1.4 trillion, with an average market share of 8.1%, with over 10 million customers served. In a year which saw strong build up in home remittances, UBL remained the trusted partner of the overseas diaspora with a leading market share of over 23%.
Our international business has been impacted by the prolonged adverse economic environment in the GCC region, which was further exacerbated by COVID-19. The medium term strategy remains to de-risk the balance sheet and conduct business with enhanced vigilance. We are redefining our business model to be more sustainable in the longer term, in line with the region’s evolving business dynamics.
The bank adheres to the highest standards of corporate governance in line with regulatory guidelines and international best practices. The Board has constituted various sub-committees with a comprehensive oversight framework for governance across risk management, audit, information technology and other key functions necessary for achieving the bank’s strategic objectives. Pakistan Institute for Corporate Governance (PICG), an external, independent consultant, has been engaged to evaluate the performance of the Board. There exists no conflict of interest between PICG and any of the board members. UBL’s board and its sub-committee have carried out their responsibilities with the highest levels of competence, professionalism, proficiency and in accordance with their respective terms of reference.
The pace of technological innovation within the banking industry is picking up in Pakistan. I take immense pride in the fact that UBL has always been an industry leader in introducing innovative and technologically superior banking solutions. It started with UBL Omni, our flagship branchless banking proposition which made it possible for the mass unbanked population to conduct basic banking transactions. We continue to lead with technological innovations, including our “UBL Digital App”, one of the fastest growing Banking apps in the market with a digital subscriber base of over 1.5 million.
During the year, the Bank was recognized both locally and internationally, as the Best Digital Bank for 2020 by Asiamoney, and the “Best Digital Bank” at the 2020 Pakistan Banking Awards. UBL was also recognized as the “Bank of the Year 2020 - Pakistan” at the Banker Awards. The Banker, is an affiliate of the Financial Times UK and is the world’s leading financial publication. One of the most prestigious titles in the global Banking industry, the Banker Awards recognize excellence in performance, adding customer value, innovation and leadership in society. UBL has won the award for the fourth time this decade. It is a testament to the Bank’s contributions during these extraordinary times, spearheading innovation and expanding the scope of financial services in Pakistan as a core strategy.
The UBL brand is deeply embedded in the fabric of Pakistan. The Bank’s presence is far and wide, from urban cities to rural towns and villages, and we remain committed to serving the financial needs of the country. The Bank’s diversified product offering caters to the needs of individuals, small and medium sized entities, large corporate customers as well as new and emerging market segments. As the country emerges from the pandemic, UBL will continue to play an integral role in the economic revival of the country and in expanding the scope of financial services for a more financially inclusive Pakistan.
In the end, I would like to thank all our customers for their continued trust and support to UBL. I would also like to take this opportunity to express my gratitude to all fellow Board members for their invaluable contributions. I would like to thank all the regulatory authorities for their continued guidance and support. I have full faith that our strong and dynamic leadership team will meet the expectations of all our stakeholders. Our staff remains our most prized asset and it is their untiring devotion over the years that has made UBL the strong brand it is today.
Sir Mohammed Anwer Pervez, OBE, HPkFebruary 24, 2021
On behalf of the Board of Directors, we are pleased to present the 62nd Annual Report of United Bank Limited (UBL or the bank) for the year ended December 31, 2020.
IntroductionThe COVID-19 virus, has emerged as one of the most disruptive event in recent human history. The pandemic has resulted in the loss of countless lives all across the world and has had an unprecedented impact on the domestic as well as the global economy. The discovery of an effective vaccine against the virus provides some hope as the world slowly emerges from the second wave of infections, however, the outlook for the global economy remains uncertain.
On the domestic front, the country has fared better in dealing with the health and economic fallout from the pandemic compared to others in the region. The Government of Pakistan and the State Bank of Pakistan (SBP) initiated significant relief measures to protect the country’s most vulnerable citizens as well as supporting businesses to enable the economy to navigate this crisis. As domestic demand picks up with macroeconomic indicators exhibiting encouraging trends, it is imperative that this positive momentum is maintained in the medium term, while implementation of reform measures remains key in addressing the long standing structural issues holding the country back in achieving its true economic potential.
Performance OverviewOn a standalone basis, UBL recorded a profit before tax (PBT) of Rs. 34.2 Billion for the year 2020, largely in line with the PBT earned in 2019.
Gross revenues were recorded at Rs. 92.1 Billion for 2020, growing by 10% over 2019. The bank recorded a strong year on year growth of 21% in net markup income which stood at Rs. 75.0 billion for 2020. Non-markup income was recorded at Rs. 17.1 billion for 2020 (2019: Rs. 21.7 billion), lower mainly due to the COVID led slowdown in fee earnings and lower foreign exchange income.
The bank’s administrative expenses remained well controlled, standing at Rs. 40.1 billion for 2020 (2019: Rs. 40.2 billion). Resultantly, the cost to income ratio improved significantly, from 48.2% in 2019 to 43.5% in 2020.
The bank recorded a net provision charge of Rs. 16.8 billion in 2020 as against a net provision charge of Rs. 8.2 billion in 2019, mainly against UBL International’s loans and advances portfolio.
Financial Results UBL posted an unconsolidated profit after tax (PAT) of Rs. 20.9 billion for 2020, a growth of 9% over 2019. The unconsolidated earnings per share (EPS) were recorded at Rs. 17.07 as against Rs. 15.63 last year. On a consolidated basis, PAT stood at Rs. 20.8 billion (2019: Rs. 19.0 billion). The consolidated EPS was measured at Rs. 17.10 for 2020 (2019: Rs. 15.60).
Net Markup IncomeUBL posted net markup income of Rs. 75.0 billion for the year ended 2020, a strong growth of 21% over 2019. To address the slowdown emanating from the pandemic, the SBP reduced the policy rate from 13.25% at Dec’19 to 7.00% at Jun’20, a cumulative reduction of 625 bps. The bank’s average interest earning asset base was measured at Rs. 1.6 trillion for 2020, growing by 7% year on year. Bank level net interest margins (NIMs) improved by 47 bps year on year, from 4.3% in 2019 to 4.7% in 2020 while UBL Domestic’s NIMs improved from 4.5% in 2019 to 5.0% this year.
This is mainly due to strong yields on earnings assets supported by active build up in the low cost deposits base, which contained the overall cost of funding.
Bank level average deposits scaled the Rs. 1.5 trillion mark, as they recorded a 10% growth year on year. The average domestic earnings asset base recorded a strong growth of 11% over 2019, measuring at Rs. 1.4 trillion for 2020. This is primarily due to 14% year on year growth in average CASA deposits, which stood at Rs. 1.1 trillion for 2020 i.e. an increase of Rs. 134 billion. The bank continued its active sales drive to acquire new customers, particularly within current accounts, as it added 571,000 new current accounts in 2020 (2019: 534,000 new current accounts). This enabled domestic bank to record a 13% growth in average current deposits, which stood at Rs. 538 billion in 2020, a net increase of Rs. 63 billion. Led by the ‘Mahana Amdani’ savings proposition, the domestic average savings deposits were measured at Rs. 544 billion for 2020, a strong growth of 15% over 2019, i.e. a net increase of Rs. 70 billion. This enabled the bank to maintain a strong average domestic CASA ratio of 85.4% in 2020 (2019: 86.2%). The active build up in low cost core deposits enabled the domestic bank to reduce its cost of deposits by 106 bps, from 5.5% in 2019 to 4.5% in 2020. UBL International’s deposits base averaged USD 1.4 billion in 2020, declining by 17% year on year. Bank level cost of deposits was measured at 4.0% in 2020, a reduction of 87 bps year on year.
On the asset front, the bank’s earning advances averaged Rs. 569 billion for 2020, declining by 10% over 2019. Domestic performing advances averaged Rs. 461 billion in 2020, down 4% versus last year. Islamic banking advances witnessed strong growth in 2020 with the average portfolio measuring at Rs. 21 billion, more than doubling over 2019. Despite the slowdown, the consumer loan book averaged Rs. 17 billion, in line with last year, with the portfolio predominantly concentrated in the secured autos segment. The bank continued its de-risking strategy within International as the performing loan book was reduced by 32% year on year, averaging USD 666 million in 2020.
The bank’s markup earning investments averaged Rs. 1.0 trillion for 2020, growing by 24% over last year. The government securities portfolio averaged Rs. 839 billion in 2020, growing by 27% over last year, earning the bank a strong yield of 10.0% during the year (2019: 10.3%). UBL International’s markup earning investments, largely comprise of sovereign government debt holdings, averaged USD 705 million for 2020, an increase of 7% year on year, and earned the bank healthy returns of 6.0% (2019: 6.2%).
Non-Markup IncomeThe bank earned non markup income of Rs. 17.1 billion in 2020 as against Rs. 21.7 billion earned in 2019. Non markup income contributed 19% to bank’s overall gross revenues in 2020 (2019: 26%). Last year’s non-markup income included a major one-off in the form of realization of exchange translation reserve on the winding up of the bank’s New York operations.
Fees and commissions were recorded at Rs. 11.1 billion in 2020, down 20% over last year. Fees and commissions contributed 65% to the total non-markup income in 2020 (2019: 64%). Income from this key revenue stream remained impacted by the COVID related disruptions to overall economic activity, within both the domestic franchise as well as in the GCC region. However, business activity picked up in the second half of the year, as all fee lines are now at pre COVID levels, with the domestic bank reporting strong quarter on quarter growth of 25%.
United Bank Limited22

Chairman’s Review Reportto the Members
Directors’ Reportto the Members 2020
As Chairman of the Board, I am pleased that United Bank Limited (UBL) has delivered strong financial results in 2020 and has demonstrated great resilience during unprecedented challenges brought about by COVID-19. It is highly commendable that our management and staff ensured high standards of service levels across all channels, even during the most difficult phases of the pandemic. I am inspired by the strength and determination of the country and its people and believe that we will emerge much stronger from this crisis.
The domestic franchise is the cornerstone of UBL and the key driver for our profitability. Branch banking continues to maintain strong momentum under an aggressive growth strategy, aiming to meet and exceed customer expectations. The domestic deposits base now stands at over Rs. 1.4 trillion, with an average market share of 8.1%, with over 10 million customers served. In a year which saw strong build up in home remittances, UBL remained the trusted partner of the overseas diaspora with a leading market share of over 23%.
Our international business has been impacted by the prolonged adverse economic environment in the GCC region, which was further exacerbated by COVID-19. The medium term strategy remains to de-risk the balance sheet and conduct business with enhanced vigilance. We are redefining our business model to be more sustainable in the longer term, in line with the region’s evolving business dynamics.
The bank adheres to the highest standards of corporate governance in line with regulatory guidelines and international best practices. The Board has constituted various sub-committees with a comprehensive oversight framework for governance across risk management, audit, information technology and other key functions necessary for achieving the bank’s strategic objectives. Pakistan Institute for Corporate Governance (PICG), an external, independent consultant, has been engaged to evaluate the performance of the Board. There exists no conflict of interest between PICG and any of the board members. UBL’s board and its sub-committee have carried out their responsibilities with the highest levels of competence, professionalism, proficiency and in accordance with their respective terms of reference.
The pace of technological innovation within the banking industry is picking up in Pakistan. I take immense pride in the fact that UBL has always been an industry leader in introducing innovative and technologically superior banking solutions. It started with UBL Omni, our flagship branchless banking proposition which made it possible for the mass unbanked population to conduct basic banking transactions. We continue to lead with technological innovations, including our “UBL Digital App”, one of the fastest growing Banking apps in the market with a digital subscriber base of over 1.5 million.
During the year, the Bank was recognized both locally and internationally, as the Best Digital Bank for 2020 by Asiamoney, and the “Best Digital Bank” at the 2020 Pakistan Banking Awards. UBL was also recognized as the “Bank of the Year 2020 - Pakistan” at the Banker Awards. The Banker, is an affiliate of the Financial Times UK and is the world’s leading financial publication. One of the most prestigious titles in the global Banking industry, the Banker Awards recognize excellence in performance, adding customer value, innovation and leadership in society. UBL has won the award for the fourth time this decade. It is a testament to the Bank’s contributions during these extraordinary times, spearheading innovation and expanding the scope of financial services in Pakistan as a core strategy.
The UBL brand is deeply embedded in the fabric of Pakistan. The Bank’s presence is far and wide, from urban cities to rural towns and villages, and we remain committed to serving the financial needs of the country. The Bank’s diversified product offering caters to the needs of individuals, small and medium sized entities, large corporate customers as well as new and emerging market segments. As the country emerges from the pandemic, UBL will continue to play an integral role in the economic revival of the country and in expanding the scope of financial services for a more financially inclusive Pakistan.
In the end, I would like to thank all our customers for their continued trust and support to UBL. I would also like to take this opportunity to express my gratitude to all fellow Board members for their invaluable contributions. I would like to thank all the regulatory authorities for their continued guidance and support. I have full faith that our strong and dynamic leadership team will meet the expectations of all our stakeholders. Our staff remains our most prized asset and it is their untiring devotion over the years that has made UBL the strong brand it is today.
Sir Mohammed Anwer Pervez, OBE, HPkFebruary 24, 2021
On behalf of the Board of Directors, we are pleased to present the 62nd Annual Report of United Bank Limited (UBL or the bank) for the year ended December 31, 2020.
IntroductionThe COVID-19 virus, has emerged as one of the most disruptive event in recent human history. The pandemic has resulted in the loss of countless lives all across the world and has had an unprecedented impact on the domestic as well as the global economy. The discovery of an effective vaccine against the virus provides some hope as the world slowly emerges from the second wave of infections, however, the outlook for the global economy remains uncertain.
On the domestic front, the country has fared better in dealing with the health and economic fallout from the pandemic compared to others in the region. The Government of Pakistan and the State Bank of Pakistan (SBP) initiated significant relief measures to protect the country’s most vulnerable citizens as well as supporting businesses to enable the economy to navigate this crisis. As domestic demand picks up with macroeconomic indicators exhibiting encouraging trends, it is imperative that this positive momentum is maintained in the medium term, while implementation of reform measures remains key in addressing the long standing structural issues holding the country back in achieving its true economic potential.
Performance OverviewOn a standalone basis, UBL recorded a profit before tax (PBT) of Rs. 34.2 Billion for the year 2020, largely in line with the PBT earned in 2019.
Gross revenues were recorded at Rs. 92.1 Billion for 2020, growing by 10% over 2019. The bank recorded a strong year on year growth of 21% in net markup income which stood at Rs. 75.0 billion for 2020. Non-markup income was recorded at Rs. 17.1 billion for 2020 (2019: Rs. 21.7 billion), lower mainly due to the COVID led slowdown in fee earnings and lower foreign exchange income.
The bank’s administrative expenses remained well controlled, standing at Rs. 40.1 billion for 2020 (2019: Rs. 40.2 billion). Resultantly, the cost to income ratio improved significantly, from 48.2% in 2019 to 43.5% in 2020.
The bank recorded a net provision charge of Rs. 16.8 billion in 2020 as against a net provision charge of Rs. 8.2 billion in 2019, mainly against UBL International’s loans and advances portfolio.
Financial Results UBL posted an unconsolidated profit after tax (PAT) of Rs. 20.9 billion for 2020, a growth of 9% over 2019. The unconsolidated earnings per share (EPS) were recorded at Rs. 17.07 as against Rs. 15.63 last year. On a consolidated basis, PAT stood at Rs. 20.8 billion (2019: Rs. 19.0 billion). The consolidated EPS was measured at Rs. 17.10 for 2020 (2019: Rs. 15.60).
Net Markup IncomeUBL posted net markup income of Rs. 75.0 billion for the year ended 2020, a strong growth of 21% over 2019. To address the slowdown emanating from the pandemic, the SBP reduced the policy rate from 13.25% at Dec’19 to 7.00% at Jun’20, a cumulative reduction of 625 bps. The bank’s average interest earning asset base was measured at Rs. 1.6 trillion for 2020, growing by 7% year on year. Bank level net interest margins (NIMs) improved by 47 bps year on year, from 4.3% in 2019 to 4.7% in 2020 while UBL Domestic’s NIMs improved from 4.5% in 2019 to 5.0% this year.
This is mainly due to strong yields on earnings assets supported by active build up in the low cost deposits base, which contained the overall cost of funding.
Bank level average deposits scaled the Rs. 1.5 trillion mark, as they recorded a 10% growth year on year. The average domestic earnings asset base recorded a strong growth of 11% over 2019, measuring at Rs. 1.4 trillion for 2020. This is primarily due to 14% year on year growth in average CASA deposits, which stood at Rs. 1.1 trillion for 2020 i.e. an increase of Rs. 134 billion. The bank continued its active sales drive to acquire new customers, particularly within current accounts, as it added 571,000 new current accounts in 2020 (2019: 534,000 new current accounts). This enabled domestic bank to record a 13% growth in average current deposits, which stood at Rs. 538 billion in 2020, a net increase of Rs. 63 billion. Led by the ‘Mahana Amdani’ savings proposition, the domestic average savings deposits were measured at Rs. 544 billion for 2020, a strong growth of 15% over 2019, i.e. a net increase of Rs. 70 billion. This enabled the bank to maintain a strong average domestic CASA ratio of 85.4% in 2020 (2019: 86.2%). The active build up in low cost core deposits enabled the domestic bank to reduce its cost of deposits by 106 bps, from 5.5% in 2019 to 4.5% in 2020. UBL International’s deposits base averaged USD 1.4 billion in 2020, declining by 17% year on year. Bank level cost of deposits was measured at 4.0% in 2020, a reduction of 87 bps year on year.
On the asset front, the bank’s earning advances averaged Rs. 569 billion for 2020, declining by 10% over 2019. Domestic performing advances averaged Rs. 461 billion in 2020, down 4% versus last year. Islamic banking advances witnessed strong growth in 2020 with the average portfolio measuring at Rs. 21 billion, more than doubling over 2019. Despite the slowdown, the consumer loan book averaged Rs. 17 billion, in line with last year, with the portfolio predominantly concentrated in the secured autos segment. The bank continued its de-risking strategy within International as the performing loan book was reduced by 32% year on year, averaging USD 666 million in 2020.
The bank’s markup earning investments averaged Rs. 1.0 trillion for 2020, growing by 24% over last year. The government securities portfolio averaged Rs. 839 billion in 2020, growing by 27% over last year, earning the bank a strong yield of 10.0% during the year (2019: 10.3%). UBL International’s markup earning investments, largely comprise of sovereign government debt holdings, averaged USD 705 million for 2020, an increase of 7% year on year, and earned the bank healthy returns of 6.0% (2019: 6.2%).
Non-Markup IncomeThe bank earned non markup income of Rs. 17.1 billion in 2020 as against Rs. 21.7 billion earned in 2019. Non markup income contributed 19% to bank’s overall gross revenues in 2020 (2019: 26%). Last year’s non-markup income included a major one-off in the form of realization of exchange translation reserve on the winding up of the bank’s New York operations.
Fees and commissions were recorded at Rs. 11.1 billion in 2020, down 20% over last year. Fees and commissions contributed 65% to the total non-markup income in 2020 (2019: 64%). Income from this key revenue stream remained impacted by the COVID related disruptions to overall economic activity, within both the domestic franchise as well as in the GCC region. However, business activity picked up in the second half of the year, as all fee lines are now at pre COVID levels, with the domestic bank reporting strong quarter on quarter growth of 25%.
23Annual Report 2020

Directors’ Reportto the Members 2020Customer fees from branch banking operations were recorded at Rs. 1.6 billion in 2020, down 17% year on year, owing to lower branch footfall in the early part of the year. The bank remained the market leader in the home remittance business as it recorded an average market share of 23.3% in 2020. Resultantly, fee income from home remittances stood at Rs. 1.6 billion for 2020 (2019: Rs. 1.7 billion). Income from trade and guarantees was recorded at Rs. 1.3 billion, down 10% year on year, as the slowdown affected global trade for much of the year. However, commissions from guarantee business recorded a 35% year on year growth, led by the bank’s Financial Institution’s desks, both within domestic and International.
Bancassurance commissions were recorded at Rs. 1.2 billion in 2020, down 27% over 2019, with premium volumes of Rs. 2.6 billion in 2020 (2019: Rs. 3.7 billion). However, in line with the pick up in business momentum, bancassurance commissions recorded a 48% growth Q4’20 versus Q3’20.
During the year, the bank added 681 k new debit cards with a strong active base of 2.1 million at Dec’20. Consequently, income from debit and credit cards stood at Rs. 1.6 billion, largely in line with 2019 levels. Consumer finance fees was recorded at Rs. 877 million in 2020 (2019: Rs. 983 million) as the bank continued its momentum, particularly within the autos lending segment. Commissions from cash management recorded a growth of 8% year on year, being recorded at Rs. 846 million, with throughput volumes of over Rs. 3.0 trillion processed in 2020.
The bank earned foreign exchange income of Rs. 3.7 billion in 2020 (2019: Rs. 4.5 billion), as the FX markets remained stable for much of the year. Dividend income was recorded at Rs. 1.3 billion for 2020 (2019: Rs. 1.5 billion), with strong returns from equity holdings in energy and fertilizer stocks as well as the bank’s subsidiaries. Active trading by UBL domestic in the fixed income and equity markets and by UBL International in the foreign debt securities markets enabled the bank to generate net capital gains of Rs. 411 million in 2020. Provisions, Loan Losses and Non-Performing LoansUBL recorded a net provisioning expense of Rs. 16.8 billion in 2020 as against a net provisioning expense of Rs. 8.2 billion in 2019.
Bank level non-performing loans (NPL)s increased from Rs. 77.0 billion as at Dec’19 to Rs. 83.6 billion at Dec’20. This increase includes the exchange impact on revaluation of foreign currency NPLs of approximately Rs. 1.6 billion. Overall asset quality was measured at 13.7% at Dec’20 (Dec’19: 11.0%), while specific coverage was enhanced from 82.6% at Dec’19 to 85.8% at Dec’20.
UBL DomesticDomestic stock of NPLs increased from Rs. 27.6 billion at Dec’19 to Rs. 28.7 billion at Dec’20. A net provision charge of Rs. 1.9 billion was recorded within UBL Domestic, mainly against the loans portfolio, as against a net provision charge of Rs. 2.2 billion taken last year. Asset quality was measured at 6.3% at Dec’20 (Dec’19: 5.3%), an increase mainly due to the reduction in the overall loan book, while specific coverage was measured at 85.7% at Dec’20 (Dec’19: 92.2%).
UBL InternationalIn the backdrop of a challenging business environment in the GCC, further compounded by the COVID-19 slowdown, UBL International NPLs increased from USD 319 million to USD 343 million as at Dec’20. To provide adequate buffers against loan
losses, a net provision charge of USD 91.8 million was taken in 2020 as against a net provision charge of USD 40.1 million in 2019. This resulted in specific coverage being enhanced from 77.3% at Dec’19 to 85.9% at Dec’20. However, specific coverage with Forced Sale Value (FSV) of mortgaged properties and cash collateral was further enhanced and stood at 95.5% at Dec’20. (Dec’19: 90.9%, refer note 10.4.2 to the financial statements).
Cost ManagementUBL remains focused on enhancing operational efficiencies through improving processes, cost optimization and building greater collaboration across businesses and support functions. The bank’s administrative expenses were recorded at Rs. 40.1 billion for 2020 which are flat versus last year. Staff costs stood at Rs. 15.6 billion, increasing by 7% over 2019, in line with the growth across the network and hiring mainly within front end business functions. Property related expenses were recorded at Rs. 6.7 billion, down 8% year on year. IT related expenses were recorded at Rs. 4.2 billion for 2020, an increase of 15% over last year, as the bank continued to invest in technology platforms as part of the overall data driven digital strategy. Other operating expenses were down by 7% year on year, mainly due to lower volumes as business momentum remained impacted for much of 2020.
Balance Sheet ManagementUBL’s balance sheet stood at Rs. 2.0 trillion as at Dec’20, growing by 8% over Dec’19. The bank’s network stands at 1,370 branches (2019: 1,376 branches). This includes 100 Islamic branches (2019: 100 branches) with over 187 Islamic banking windows (2019: 162 Islamic banking windows).
Bank level deposits stood at Rs. 1.6 trillion at Dec’20, growing by 12% over Dec’19. The bank has a multi-pronged liabilities strategy aimed at increasing the active customer base and deepening wallet share from existing customers. We remain focused on mobilizing stable and longer term, low cost deposits, with an aim to maintain an optimal funding profile. The core of the franchise is the Branch Banking Group, which delivered another strong performance this year, as the domestic deposits base closed 2020 at Rs. 1.4 trillion, growing by 17% over Dec’19. This enabled the bank to maintain an average market share of 8.1% of banking sector deposits in 2020 (2019: 8.1%). The bank also maintained its momentum in the Islamic banking space as total deposits stood at Rs. 111 billion at Dec’20, a strong growth of 37% since Dec’19. UBL International’s deposits stood at USD 1.4 billion at Dec’20, declining by 15% since Dec’19, while improving cost of deposits.
Domestic current deposits stood at Rs. 615 billion, a strong growth of 18% over Dec’19. The current to total deposits ratio improved from 42.7% at Dec’19 to 43.3% at Dec’20. The domestic portfolio of savings deposits closed Dec’20 at Rs. 596 billion, a strong growth of 18% year on year. This enabled the bank to improve the domestic CASA ratio from 84.2% at Dec’19 to 85.2% at Dec’20. Domestic term deposits portfolio stood at Rs. 210 billion, growing by 9% over Dec’19.
The bank’s net advances closed at Rs. 530 billion at Dec’20, declining by 17% over Dec’19. Domestic performing advances stood at Rs. 430 billion, down 14% year on year. Lending strategy continues to be based on maintaining optimal asset quality levels and improving the overall return on lending relationships. The bank continued to actively reduce its loan exposures within UBL International as the performing book was reduced from USD 830 million at Dec’19 to USD 601 million at Dec’20.
The bank’s investment portfolio closed at Rs. 1.1 trillion as at Dec’20 (Dec’19: Rs. 840 billion). Funding is primarily deployed in treasury securities, with Rs. 237 billion invested in fixed rate PIBs, Rs. 341 billion invested in floating rate PIBs and Rs. 345 billion in treasury bills. In view of the current low interest rate environment, liquidity is being deployed in the shorter tenor treasury bills and floating rate bonds to ensure returns are in line with the yield curve. The bank’s listed shares holdings stood at Rs. 10.4 billion at Dec’20 (Dec’19: Rs. 13.4 billion), as capital gains were realized in scrips where profitable opportunities presented during the year. UBL International’s investments, primarily consisting of foreign sovereign debt, stood at USD 771 million at Dec’20 (Dec’19: USD 699 million).
Capital RatiosThe bank seeks to maintain strong levels of capitalization to build resilience and maintain adequate buffers over regulatory requirements as well as provide a solid platform for future business expansions. UBL has been designated a Domestic Systemically Important Bank (D-SIB) by the SBP. This designation requires the bank to hold an additional 1.5% Higher Loss Absorbency (HLA) Surcharge, over and above its minimum capital adequacy ratio (CAR) limit in 2019, on both a standalone and consolidated basis. However, the SBP has reduced the HLA surcharge by 50 bps to 1.0% effective March 2020 as per their latest D-SIB designation.
SBP has also provided regulatory relief for COVID-19 to support the banking sector in extending credit facilities to its customers. In this respect, SBP has reduced the Capital Conservation Buffer (CCB) from its existing level of 2.5% to 1.5%, for the time being till further instructions are issued. Thus, the minimum CAR requirement for UBL stood at 12.5% (including the HLA Surcharge of 1.0%) as at December 31, 2020. This is lower by 150 bps from the minimum regulatory CAR requirement applicable for the bank (including the HLA Surcharge of 1.5%) of 14.0% at Dec’19.
The bank’s overall CAR stood at 24.4% at Dec’20 (Dec’19: 18.9%), maintaining a buffer of 11.9% over the minimum regulatory requirement of 12.5%. The Common Equity Tier 1 (CET-1) ratio stood at 17.0% at Dec’20 (Dec’19: 13.7%). Total Tier 1 Capital ratio was measured at 18.4% at Dec’20 (Dec’19: 14.9%).
The Board of Directors of UBL declared a final dividend of 95% (Rs. 9.50 per share) in their meeting in Karachi held on February 24, 2021, along with the results for the year ended December 31, 2020.
UBL Digital UBL remains the pioneer in the domestic banking space in providing seamless digital banking services to its ever-growing customer base as well as promoting greater financial inclusion through lowering entry barriers to the vast unbanked section of the population. As part of an all-encompassing digital strategy, the bank aims to transform its products, processes, customer interactions and the overall way in which banking is traditionally conducted. The end state is to develop a holistic payments ecosystem which would enable customers to manage all of their banking needs using their preferred modes and at their own comfort.
The UBL Digital App encapsulates the core principles of our digital banking strategy. The app is not only transformative in the way financial services are provided but also acts as a uniquely convenient channel to onboard new customers towards a formal liability relationship with the bank. The UBL Digital App continues to gain prominence amongst the bank’s customer base as the number of registered subscribers surpassed the 1.5 million mark as at December 31, 2020. The app also includes the facility to open a Roshan Digital account as part of SBP’s initiative to provide innovative banking solutions to non-resident Pakistanis (NRPs) for conducting banking, payments and investment activities in Pakistan.
Economy ReviewThe country’s economy is gradually returning to pre COVID levels as a notable pickup was witnessed in the latter half of 2020 with strong rebound in industrial activity and in the general levels of overall domestic demand. Fiscal and external sectors also showed strong resilience as the government eased restrictions following a gradual decline in the number of new cases amid timely measures to counter the slowdown caused by the pandemic. However, the overall pace of recovery is expected to be gradual in the medium term with potential risks emanating from a prolonged second wave, slowdown in remittances, inflationary pressures from increase in utilities prices and supply side pressures on major food items as well as key crop inputs to exports.
On the inflation front, CPI was measured at 8.0% for Dec’20 (Dec’19: 12.6%), with average inflation measured at 9.5% for 2020 versus 9.4% for 2019. Food items remained elevated during most of 2020 mainly due to supply side shocks which were, however, largely offset by stable non-food prices. The SBP decided to maintain the policy rate at 7.00% in their recent Monetary Policy Statement on January 22, 2021, with the inflation expected to remain on the lower side in FY’21.
The external sector has displayed significant strength despite the challenges posed by the pandemic. After recording a surplus in the first five months of FY’21, the current account recorded a deficit of USD 662 million in Dec’20, largely owing to an increase in the level of imports. However, the country recorded a current account surplus of USD 1.1 billion in H1 FY’21 versus a current account deficit of USD 2.0 billion in H1 FY’20. The country’s imports stood at USD 24.5 billion for H1 FY’21, growing by 6% over the corresponding period of last year while exports stood at USD 12.1 billion for H1 FY’21, up 5% versus H1 FY’20.
The country received monthly home remittances in excess of USD 2.0 billion in each of the six months of the current fiscal year, with flows stood at USD 14.2 billion for H1 FY’21, growing by 25% year on year. Ease in travel restrictions as well as positive policy measures, including SBP’s Pakistan Remittance Initiative (PRI), and promotion of formal and digital channels were the primary reasons for this sustained momentum. These positive developments provided strong support to the country’s foreign exchange reserves which crossed the USD 20 billion mark, standing at USD 20.5 billion as at Dec’20, growing by 13% over Dec’19 and 9% over Jun’20. The exchange rate remained relatively stable for much of the year, closing at Rs. 159.8 / USD at Dec’20, depreciating by 3% since Dec’19, following the introduction of a more market determined exchange rate regime.
The positive economic momentum was also echoed in the country’s capital markets, as the KSE-100 index improved from a low of 27,229 points in the month of Mar’20 to close at 43,755 points at Dec’20, an increase of 7% since Dec’19.
Banking sector deposits stood at Rs. 17.9 trillion at Dec’20, a significant growth of 22% over Dec’19. Sector advances were recorded at Rs. 8.5 trillion at Dec’20, 4% over Dec’19. Non-performing loans for the banking industry stood at Rs. 829 billion at December 31, 2020, 9% above Dec’19, as asset quality levels deteriorated from 8.6% at Dec’19 to 9.2% at Dec’20.
UBL InternationalThe COVID-19 pandemic has had far-reaching consequences for the global economy. Measures to contain the spread of the virus have led to sharp decline in economic activity across the world. The GCC region’s underlying economic troubles originate from OPEC production cuts and weaker global and regional demand. The regional authorities have implemented a range of measures to mitigate the crisis, including initiating fiscal stimulus relief packages, relaxation of monetary and prudential rules, and significant injection of liquidity into the banking system. However, the economic outlook for the region remains subdued with the pace of recovery is likely to be much slower in the immediate term.
United Bank Limited24

Directors’ Reportto the Members 2020Customer fees from branch banking operations were recorded at Rs. 1.6 billion in 2020, down 17% year on year, owing to lower branch footfall in the early part of the year. The bank remained the market leader in the home remittance business as it recorded an average market share of 23.3% in 2020. Resultantly, fee income from home remittances stood at Rs. 1.6 billion for 2020 (2019: Rs. 1.7 billion). Income from trade and guarantees was recorded at Rs. 1.3 billion, down 10% year on year, as the slowdown affected global trade for much of the year. However, commissions from guarantee business recorded a 35% year on year growth, led by the bank’s Financial Institution’s desks, both within domestic and International.
Bancassurance commissions were recorded at Rs. 1.2 billion in 2020, down 27% over 2019, with premium volumes of Rs. 2.6 billion in 2020 (2019: Rs. 3.7 billion). However, in line with the pick up in business momentum, bancassurance commissions recorded a 48% growth Q4’20 versus Q3’20.
During the year, the bank added 681 k new debit cards with a strong active base of 2.1 million at Dec’20. Consequently, income from debit and credit cards stood at Rs. 1.6 billion, largely in line with 2019 levels. Consumer finance fees was recorded at Rs. 877 million in 2020 (2019: Rs. 983 million) as the bank continued its momentum, particularly within the autos lending segment. Commissions from cash management recorded a growth of 8% year on year, being recorded at Rs. 846 million, with throughput volumes of over Rs. 3.0 trillion processed in 2020.
The bank earned foreign exchange income of Rs. 3.7 billion in 2020 (2019: Rs. 4.5 billion), as the FX markets remained stable for much of the year. Dividend income was recorded at Rs. 1.3 billion for 2020 (2019: Rs. 1.5 billion), with strong returns from equity holdings in energy and fertilizer stocks as well as the bank’s subsidiaries. Active trading by UBL domestic in the fixed income and equity markets and by UBL International in the foreign debt securities markets enabled the bank to generate net capital gains of Rs. 411 million in 2020. Provisions, Loan Losses and Non-Performing LoansUBL recorded a net provisioning expense of Rs. 16.8 billion in 2020 as against a net provisioning expense of Rs. 8.2 billion in 2019.
Bank level non-performing loans (NPL)s increased from Rs. 77.0 billion as at Dec’19 to Rs. 83.6 billion at Dec’20. This increase includes the exchange impact on revaluation of foreign currency NPLs of approximately Rs. 1.6 billion. Overall asset quality was measured at 13.7% at Dec’20 (Dec’19: 11.0%), while specific coverage was enhanced from 82.6% at Dec’19 to 85.8% at Dec’20.
UBL DomesticDomestic stock of NPLs increased from Rs. 27.6 billion at Dec’19 to Rs. 28.7 billion at Dec’20. A net provision charge of Rs. 1.9 billion was recorded within UBL Domestic, mainly against the loans portfolio, as against a net provision charge of Rs. 2.2 billion taken last year. Asset quality was measured at 6.3% at Dec’20 (Dec’19: 5.3%), an increase mainly due to the reduction in the overall loan book, while specific coverage was measured at 85.7% at Dec’20 (Dec’19: 92.2%).
UBL InternationalIn the backdrop of a challenging business environment in the GCC, further compounded by the COVID-19 slowdown, UBL International NPLs increased from USD 319 million to USD 343 million as at Dec’20. To provide adequate buffers against loan
losses, a net provision charge of USD 91.8 million was taken in 2020 as against a net provision charge of USD 40.1 million in 2019. This resulted in specific coverage being enhanced from 77.3% at Dec’19 to 85.9% at Dec’20. However, specific coverage with Forced Sale Value (FSV) of mortgaged properties and cash collateral was further enhanced and stood at 95.5% at Dec’20. (Dec’19: 90.9%, refer note 10.4.2 to the financial statements).
Cost ManagementUBL remains focused on enhancing operational efficiencies through improving processes, cost optimization and building greater collaboration across businesses and support functions. The bank’s administrative expenses were recorded at Rs. 40.1 billion for 2020 which are flat versus last year. Staff costs stood at Rs. 15.6 billion, increasing by 7% over 2019, in line with the growth across the network and hiring mainly within front end business functions. Property related expenses were recorded at Rs. 6.7 billion, down 8% year on year. IT related expenses were recorded at Rs. 4.2 billion for 2020, an increase of 15% over last year, as the bank continued to invest in technology platforms as part of the overall data driven digital strategy. Other operating expenses were down by 7% year on year, mainly due to lower volumes as business momentum remained impacted for much of 2020.
Balance Sheet ManagementUBL’s balance sheet stood at Rs. 2.0 trillion as at Dec’20, growing by 8% over Dec’19. The bank’s network stands at 1,370 branches (2019: 1,376 branches). This includes 100 Islamic branches (2019: 100 branches) with over 187 Islamic banking windows (2019: 162 Islamic banking windows).
Bank level deposits stood at Rs. 1.6 trillion at Dec’20, growing by 12% over Dec’19. The bank has a multi-pronged liabilities strategy aimed at increasing the active customer base and deepening wallet share from existing customers. We remain focused on mobilizing stable and longer term, low cost deposits, with an aim to maintain an optimal funding profile. The core of the franchise is the Branch Banking Group, which delivered another strong performance this year, as the domestic deposits base closed 2020 at Rs. 1.4 trillion, growing by 17% over Dec’19. This enabled the bank to maintain an average market share of 8.1% of banking sector deposits in 2020 (2019: 8.1%). The bank also maintained its momentum in the Islamic banking space as total deposits stood at Rs. 111 billion at Dec’20, a strong growth of 37% since Dec’19. UBL International’s deposits stood at USD 1.4 billion at Dec’20, declining by 15% since Dec’19, while improving cost of deposits.
Domestic current deposits stood at Rs. 615 billion, a strong growth of 18% over Dec’19. The current to total deposits ratio improved from 42.7% at Dec’19 to 43.3% at Dec’20. The domestic portfolio of savings deposits closed Dec’20 at Rs. 596 billion, a strong growth of 18% year on year. This enabled the bank to improve the domestic CASA ratio from 84.2% at Dec’19 to 85.2% at Dec’20. Domestic term deposits portfolio stood at Rs. 210 billion, growing by 9% over Dec’19.
The bank’s net advances closed at Rs. 530 billion at Dec’20, declining by 17% over Dec’19. Domestic performing advances stood at Rs. 430 billion, down 14% year on year. Lending strategy continues to be based on maintaining optimal asset quality levels and improving the overall return on lending relationships. The bank continued to actively reduce its loan exposures within UBL International as the performing book was reduced from USD 830 million at Dec’19 to USD 601 million at Dec’20.
The bank’s investment portfolio closed at Rs. 1.1 trillion as at Dec’20 (Dec’19: Rs. 840 billion). Funding is primarily deployed in treasury securities, with Rs. 237 billion invested in fixed rate PIBs, Rs. 341 billion invested in floating rate PIBs and Rs. 345 billion in treasury bills. In view of the current low interest rate environment, liquidity is being deployed in the shorter tenor treasury bills and floating rate bonds to ensure returns are in line with the yield curve. The bank’s listed shares holdings stood at Rs. 10.4 billion at Dec’20 (Dec’19: Rs. 13.4 billion), as capital gains were realized in scrips where profitable opportunities presented during the year. UBL International’s investments, primarily consisting of foreign sovereign debt, stood at USD 771 million at Dec’20 (Dec’19: USD 699 million).
Capital RatiosThe bank seeks to maintain strong levels of capitalization to build resilience and maintain adequate buffers over regulatory requirements as well as provide a solid platform for future business expansions. UBL has been designated a Domestic Systemically Important Bank (D-SIB) by the SBP. This designation requires the bank to hold an additional 1.5% Higher Loss Absorbency (HLA) Surcharge, over and above its minimum capital adequacy ratio (CAR) limit in 2019, on both a standalone and consolidated basis. However, the SBP has reduced the HLA surcharge by 50 bps to 1.0% effective March 2020 as per their latest D-SIB designation.
SBP has also provided regulatory relief for COVID-19 to support the banking sector in extending credit facilities to its customers. In this respect, SBP has reduced the Capital Conservation Buffer (CCB) from its existing level of 2.5% to 1.5%, for the time being till further instructions are issued. Thus, the minimum CAR requirement for UBL stood at 12.5% (including the HLA Surcharge of 1.0%) as at December 31, 2020. This is lower by 150 bps from the minimum regulatory CAR requirement applicable for the bank (including the HLA Surcharge of 1.5%) of 14.0% at Dec’19.
The bank’s overall CAR stood at 24.4% at Dec’20 (Dec’19: 18.9%), maintaining a buffer of 11.9% over the minimum regulatory requirement of 12.5%. The Common Equity Tier 1 (CET-1) ratio stood at 17.0% at Dec’20 (Dec’19: 13.7%). Total Tier 1 Capital ratio was measured at 18.4% at Dec’20 (Dec’19: 14.9%).
The Board of Directors of UBL declared a final dividend of 95% (Rs. 9.50 per share) in their meeting in Karachi held on February 24, 2021, along with the results for the year ended December 31, 2020.
UBL Digital UBL remains the pioneer in the domestic banking space in providing seamless digital banking services to its ever-growing customer base as well as promoting greater financial inclusion through lowering entry barriers to the vast unbanked section of the population. As part of an all-encompassing digital strategy, the bank aims to transform its products, processes, customer interactions and the overall way in which banking is traditionally conducted. The end state is to develop a holistic payments ecosystem which would enable customers to manage all of their banking needs using their preferred modes and at their own comfort.
The UBL Digital App encapsulates the core principles of our digital banking strategy. The app is not only transformative in the way financial services are provided but also acts as a uniquely convenient channel to onboard new customers towards a formal liability relationship with the bank. The UBL Digital App continues to gain prominence amongst the bank’s customer base as the number of registered subscribers surpassed the 1.5 million mark as at December 31, 2020. The app also includes the facility to open a Roshan Digital account as part of SBP’s initiative to provide innovative banking solutions to non-resident Pakistanis (NRPs) for conducting banking, payments and investment activities in Pakistan.
Economy ReviewThe country’s economy is gradually returning to pre COVID levels as a notable pickup was witnessed in the latter half of 2020 with strong rebound in industrial activity and in the general levels of overall domestic demand. Fiscal and external sectors also showed strong resilience as the government eased restrictions following a gradual decline in the number of new cases amid timely measures to counter the slowdown caused by the pandemic. However, the overall pace of recovery is expected to be gradual in the medium term with potential risks emanating from a prolonged second wave, slowdown in remittances, inflationary pressures from increase in utilities prices and supply side pressures on major food items as well as key crop inputs to exports.
On the inflation front, CPI was measured at 8.0% for Dec’20 (Dec’19: 12.6%), with average inflation measured at 9.5% for 2020 versus 9.4% for 2019. Food items remained elevated during most of 2020 mainly due to supply side shocks which were, however, largely offset by stable non-food prices. The SBP decided to maintain the policy rate at 7.00% in their recent Monetary Policy Statement on January 22, 2021, with the inflation expected to remain on the lower side in FY’21.
The external sector has displayed significant strength despite the challenges posed by the pandemic. After recording a surplus in the first five months of FY’21, the current account recorded a deficit of USD 662 million in Dec’20, largely owing to an increase in the level of imports. However, the country recorded a current account surplus of USD 1.1 billion in H1 FY’21 versus a current account deficit of USD 2.0 billion in H1 FY’20. The country’s imports stood at USD 24.5 billion for H1 FY’21, growing by 6% over the corresponding period of last year while exports stood at USD 12.1 billion for H1 FY’21, up 5% versus H1 FY’20.
The country received monthly home remittances in excess of USD 2.0 billion in each of the six months of the current fiscal year, with flows stood at USD 14.2 billion for H1 FY’21, growing by 25% year on year. Ease in travel restrictions as well as positive policy measures, including SBP’s Pakistan Remittance Initiative (PRI), and promotion of formal and digital channels were the primary reasons for this sustained momentum. These positive developments provided strong support to the country’s foreign exchange reserves which crossed the USD 20 billion mark, standing at USD 20.5 billion as at Dec’20, growing by 13% over Dec’19 and 9% over Jun’20. The exchange rate remained relatively stable for much of the year, closing at Rs. 159.8 / USD at Dec’20, depreciating by 3% since Dec’19, following the introduction of a more market determined exchange rate regime.
The positive economic momentum was also echoed in the country’s capital markets, as the KSE-100 index improved from a low of 27,229 points in the month of Mar’20 to close at 43,755 points at Dec’20, an increase of 7% since Dec’19.
Banking sector deposits stood at Rs. 17.9 trillion at Dec’20, a significant growth of 22% over Dec’19. Sector advances were recorded at Rs. 8.5 trillion at Dec’20, 4% over Dec’19. Non-performing loans for the banking industry stood at Rs. 829 billion at December 31, 2020, 9% above Dec’19, as asset quality levels deteriorated from 8.6% at Dec’19 to 9.2% at Dec’20.
UBL InternationalThe COVID-19 pandemic has had far-reaching consequences for the global economy. Measures to contain the spread of the virus have led to sharp decline in economic activity across the world. The GCC region’s underlying economic troubles originate from OPEC production cuts and weaker global and regional demand. The regional authorities have implemented a range of measures to mitigate the crisis, including initiating fiscal stimulus relief packages, relaxation of monetary and prudential rules, and significant injection of liquidity into the banking system. However, the economic outlook for the region remains subdued with the pace of recovery is likely to be much slower in the immediate term.
25Annual Report 2020

UBL International continues to actively reduce its balance sheet, exiting from riskier exposures across the GCC. The business model is focused more on trade based financing and placements with established financial institutions. Asset writing remains subdued, while lending confined only to existing quality relationships, with rigorous oversight to contain any new NPL formation. The Special Assets Management unit is further stepping up its efforts for recoveries against non-performing accounts. Excess liquidity is being deployed in foreign sovereign government securities for stable interest accruals and active trading where profitable opportunities exist. On the liabilities front, the bank is actively focused on expanding the low cost deposits base and looking to reduce concentration, particularly within expensive term deposits.
UBL International’s deposits averaged USD 1.4 billion in 2020, down 17% over the previous year. Cost of deposits improved from 2.2% in 2019 to 1.6% in 2020. The average loan portfolio was reduced from USD 982 million in 2019 to USD 666 million in 2020, a decline of 32%. Net investments, consisting of mainly fixed income government securities, averaged USD 701 million in 2020, with return on sovereign bonds of 5.7% in 2020 (2019: 5.9%).
Subsidiaries Performance OverviewHighlights of the financial performance of our subsidiaries in 2020 is as follows:-
United National Bank Limited (UBL UK) is a 55% owned subsidiary of UBL. In 2020, UBL UK posted a net loss before tax of £ 2.2 million (2019: net loss before tax of £ 825 k). The bank’s net markup income grew by 28% year on year. Non markup income witnessed a 28% decline over last year. Fee income was down 15% year on year, largely due to the pandemic led slowdown. Administrative expenses reduced by 4% year on year. Profitability was impacted by a provision expense of £ 2.3 million taken during the year (2019: provision reversal of £ 523 k), primarily for impairment on investments. The bank’s investments portfolio grew by 7%, while performing advances grew by 30%. The deposits base expanded by 30% over Dec’19.
UBL Switzerland AG is a wholly owned subsidiary of UBL. Its revenues are derived principally from trade and FI related business. UBL Switzerland’s profit before tax stood at CHF 1.1 million in 2020, declined by 60% over the 2019. Net markup income stood lower by 7% over the previous year, while non mark-up income declined by 27%. Income from commissions declined by 27% year on year owing to the pandemic led slowdown. The balance sheet size reduced by 38% over Dec’19.
UBL Fund Managers Limited, Pakistan (UBLFM) is a 98.9% owned subsidiary of UBL. UBLFM recorded a PBT of Rs. 454 million in 2020, a strong growth of 23% year on year. The funds under management of UBLFM stood at Rs. 90 billion at the close of 2020 (2019: Rs. 63 billion).
UBL Bank (Tanzania) Limited (UBTL) was established in 2012 and is a wholly owned subsidiary of UBL. UBTL entered into an asset and liabilities purchase agreement with EXIM Bank Tanzania Limited (Exim) on 22 May 2019. Exim took over control of UBTL’s assets and liabilities on November 1, 2019. UBTL has ceased its banking operations and is in the process of voluntary wind up and liquidation (refer to note 9.13 to the financial statements).
United Executors and Trustees Company Limited, Pakistan (UET) was incorporated in Pakistan in 1965 as an unlisted public limited Company and is a wholly owned subsidiary of UBL. The
board of directors in their meeting held on February 19, 2020 have resolved to wind up the Company. The Company is inactive, and will have no impact on the overall profitability of the Bank.
Credit RatingVIS Credit Rating Company Limited (VIS) re-affirmed the entity ratings of UBL at ‘‘AAA / A-1+” (Triple A / A-One Plus) on June 29, 2020. Furthermore, UBL’s Additional Tier-1 (ADT-1) TFC has also been reaffirmed at ‘AA+’ (Double A plus). Outlook on the assigned ratings are ‘Stable’.
Awards and RecognitionUBL was recognized as the “Bank of the Year 2020 - Pakistan” at the Banker Awards. The Banker, is an affiliate of the Financial Times UK and is the world’s leading financial publication. One of the most prestigious titles in the global banking industry, the Banker Awards recognize excellence in performance, adding customer value, innovation and leadership in society. UBL won the award, for the fourth time within a decade, on the back of its contribution, during extraordinary times during the current pandemic, while expanding the scope of financial services in Pakistan as a core strategy and spearheading innovation in the local banking industry.
During 2020, UBL was declared Pakistan's Best Digital Bank for 2020 by Asiamoney, an associate of Euromoney. The award is a testament to UBL's contribution in expanding the scope of financial services through digital channels in Pakistan and spearheading innovation in the local banking industry.
UBL was also declared the 'Best Digital Bank' at the 2020 Pakistan Banking Awards. The year has seen UBL work on innovative ventures to bring about many customer centric technological offerings. The award recognizes UBL's position as Pakistan's leading progressive and innovative Bank.
Future OutlookThe COVID-19 pandemic has had a significant impact on the domestic as well as the global economy. The country has dealt reasonably well with the aftermath but maintaining the recent positive momentum remains critical in the immediate term. As the economy emerges from the crisis, UBL with its vast scale, diversified product offerings and widespread presence in all corners of the country, is ideally placed to play a leading role in the recovery. The bank remains committed in expanding the scope of intermediation services across the individuals, mid-market and large corporates.
Branch Banking remains the core of the UBL franchise where the aim is to expand the bank’s reach by achieving the required levels of service quality that is intrinsically perceived as the best in class. We aim to become the most preferred financial services provider in Pakistan to the ever growing customer base.
The bank will look to build on its award winning digital proposition and will continue to introduce unique and innovative solutions, with the aim of making banking easier and accessible to all, including the significantly unbanked population.
As economic activities pick up momentum, lending avenues will gradually open up and the bank will seek to deepen and expand relationships across the established and emerging business segments, within an acceptable risk profile.
The bank is continually striving to strengthen compliance standards to be at par with the global best practices. UBL’s
greatest asset is its employees, where the bank will continue to invest in their progression and develop the leaders of the future. Corporate GovernanceDirectors’ StatementThe Board of Directors is committed to ensuring that the requirements of corporate governance set by the Securities and Exchange Commission of Pakistan are fully met. The bank has adopted good corporate governance practices and the Directors are pleased to report that:• The financial statements, prepared by the management of the
bank, present fairly the state of affairs of the bank, the results of its operations, cash flows and changes in equity.
• Proper books of accounts of the bank have been maintained.• Appropriate accounting policies have been consistently applied
in the preparation of the financial statements. Accounting estimates are based on reasonable and prudent judgment.
• International Financial Reporting Standards, as applicable to banks in Pakistan, have been followed in preparation of financial statements without any departure therefrom.
• The system of internal control in the bank is sound in design and is effectively implemented and monitored.
• There are no significant doubts regarding the bank’s ability to continue as a going concern.
• There has been no material departure from the best practices of corporate governance.
• Performance highlights for the last six years are attached to these unconsolidated financial statements.
• Profit amounting to Rs. 2.1 billion has been transferred to Statutory Reserve for the year 2020.
• The Board of Directors consists of eight (8) male and one (1) female member. The detailed composition of the Board is given in paragraphs 1 and 2 of the Statement of Compliance with the Code of Corporate Governance.
• A renowned external consultant has been appointed to evaluate the performance of the board and its sub-committees in accordance with applicable regulatory framework and best practices.
• Details of Directors’ training programs are given in the Statement of Compliance with the Code of Corporate Governance.
• The Non-Executive Directors, including Independent Directors, are eligible for fees and logistic related expenses for attending meetings of the Board and its Committees, as approved by the Board of Directors. Moreover, the fee paid to these directors is made part of the agenda for the Annual General Meeting to obtain post facto approval from the shareholders.
• The Board has constituted the following five Committees with defined Terms of Reference (ToRs):
Board Audit Committee (BAC):Ms. Shazia Syed ChairpersonMr. Haider Zameer Choudrey MemberMr. Rizwan Pervez MemberMr. Aqeel Ahmed Nasir Secretary
Board Risk and Compliance Committee (BRCC):Mr. Arshad Ahmad Mir ChairmanLord Zameer M. Choudrey, CBE, SI Pk MemberMs. Shazia Syed MemberMr. Shazad G. Dada MemberMr. Imran Sarwar Secretary
Board Human Resource & Compensation Committee (HRCC):Mr. Tariq Rashid ChairmanSir Mohammed Anwar Pervez, OBE, HPk MemberMr. Arshad Ahmad Mir MemberMr. Rizwan Pervez MemberMs. Sadia Saeed Secretary
Board IT Committee (BITC):Mr. Tariq Rashid ChairmanLord Zameer M. Choudrey, CBE, SI Pk MemberMr. Haider Zameer Choudrey MemberMr. Shazad G. Dada MemberMr. Muhammad Faisal Anwar Secretary
Board Nomination Committee (BNC):Sir Mohammed Anwar Pervez, OBE, HPk ChairmanLord Zameer M. Choudrey, CBE, SI Pk MemberMr. Arshad Ahmad Mir MemberMr. Aqeel Ahmed Nasir Secretary
A brief description of the core functions under the ToRs of each sub-committee are as follows:-
Board Audit Committee (BAC):-The primary activity of the board audit committee is to provide oversight of the financial reporting process, the audit process as well as the system of internal controls and compliance with laws and regulations. The committee reviews the results of audits with the bank’s management as well as the external auditors. The committee also reviews the scope and extent of internal audit, audit plan, reporting framework and procedures and ensures that the internal audit function has adequate resources and is appropriately placed within the Bank. The committee also provides oversight and review of the internal control over financial reporting (ICFR) system for effective implementation and its upgrade.
Board Risk and Compliance Committee (BRCC):-The committee is responsible for setting the overall risk management framework and ensuring the evolution and effectiveness of all risk management policies in line with the changing economic climate for risk mitigation. The committee oversees the overall risk management function across the bank and ensures compliance with various risk management policies through operational risk and Basel, treasury and market risk, credit risk and credit policy functions. Furthermore, the committee also monitors the effectiveness of the risk management function to ensure compliance with regulatory risk requirements including effective safeguards against financial crimes.
Board Human Resource & Compensation Committee (HRCC):-The committee is responsible for recommending to the Board the overall remuneration mechanism and policy across the bank and ensuring that the policies are aligned with regulatory requirements. The purview of the committee includes the review of the overall compensation and benefit structure, including material risk takers (MRTs) and material risk controllers (MRCs), headcount levels, as well as recommending human resource management policies to the Board. The committee is also responsible for recommending to the Board a policy framework for determining remuneration of directors, executive and non-executive directors, and members of senior management in accordance with relevant prevailing regulatory guidelines.
Board IT Committee (BITC):-The Committee is responsible for providing an effective governance framework to ensure that the bank’s technology function enables the achievement of corporate strategies and objectives. The Committee communicates to the Board the progress of the technology activities and digital initiatives being undertaken across the bank. Furthermore, the Committee is also responsible for ensuring that risk management strategies are designed and implemented to effectively respond to wide-scale disruptions, as well as managing Information Technology (IT) and Cyber Security Risks.
Board Nomination Committee (BNC):-The primary responsibility for the Committee is to review the
Directors’ Reportto the Members 2020
United Bank Limited26

UBL International continues to actively reduce its balance sheet, exiting from riskier exposures across the GCC. The business model is focused more on trade based financing and placements with established financial institutions. Asset writing remains subdued, while lending confined only to existing quality relationships, with rigorous oversight to contain any new NPL formation. The Special Assets Management unit is further stepping up its efforts for recoveries against non-performing accounts. Excess liquidity is being deployed in foreign sovereign government securities for stable interest accruals and active trading where profitable opportunities exist. On the liabilities front, the bank is actively focused on expanding the low cost deposits base and looking to reduce concentration, particularly within expensive term deposits.
UBL International’s deposits averaged USD 1.4 billion in 2020, down 17% over the previous year. Cost of deposits improved from 2.2% in 2019 to 1.6% in 2020. The average loan portfolio was reduced from USD 982 million in 2019 to USD 666 million in 2020, a decline of 32%. Net investments, consisting of mainly fixed income government securities, averaged USD 701 million in 2020, with return on sovereign bonds of 5.7% in 2020 (2019: 5.9%).
Subsidiaries Performance OverviewHighlights of the financial performance of our subsidiaries in 2020 is as follows:-
United National Bank Limited (UBL UK) is a 55% owned subsidiary of UBL. In 2020, UBL UK posted a net loss before tax of £ 2.2 million (2019: net loss before tax of £ 825 k). The bank’s net markup income grew by 28% year on year. Non markup income witnessed a 28% decline over last year. Fee income was down 15% year on year, largely due to the pandemic led slowdown. Administrative expenses reduced by 4% year on year. Profitability was impacted by a provision expense of £ 2.3 million taken during the year (2019: provision reversal of £ 523 k), primarily for impairment on investments. The bank’s investments portfolio grew by 7%, while performing advances grew by 30%. The deposits base expanded by 30% over Dec’19.
UBL Switzerland AG is a wholly owned subsidiary of UBL. Its revenues are derived principally from trade and FI related business. UBL Switzerland’s profit before tax stood at CHF 1.1 million in 2020, declined by 60% over the 2019. Net markup income stood lower by 7% over the previous year, while non mark-up income declined by 27%. Income from commissions declined by 27% year on year owing to the pandemic led slowdown. The balance sheet size reduced by 38% over Dec’19.
UBL Fund Managers Limited, Pakistan (UBLFM) is a 98.9% owned subsidiary of UBL. UBLFM recorded a PBT of Rs. 454 million in 2020, a strong growth of 23% year on year. The funds under management of UBLFM stood at Rs. 90 billion at the close of 2020 (2019: Rs. 63 billion).
UBL Bank (Tanzania) Limited (UBTL) was established in 2012 and is a wholly owned subsidiary of UBL. UBTL entered into an asset and liabilities purchase agreement with EXIM Bank Tanzania Limited (Exim) on 22 May 2019. Exim took over control of UBTL’s assets and liabilities on November 1, 2019. UBTL has ceased its banking operations and is in the process of voluntary wind up and liquidation (refer to note 9.13 to the financial statements).
United Executors and Trustees Company Limited, Pakistan (UET) was incorporated in Pakistan in 1965 as an unlisted public limited Company and is a wholly owned subsidiary of UBL. The
board of directors in their meeting held on February 19, 2020 have resolved to wind up the Company. The Company is inactive, and will have no impact on the overall profitability of the Bank.
Credit RatingVIS Credit Rating Company Limited (VIS) re-affirmed the entity ratings of UBL at ‘‘AAA / A-1+” (Triple A / A-One Plus) on June 29, 2020. Furthermore, UBL’s Additional Tier-1 (ADT-1) TFC has also been reaffirmed at ‘AA+’ (Double A plus). Outlook on the assigned ratings are ‘Stable’.
Awards and RecognitionUBL was recognized as the “Bank of the Year 2020 - Pakistan” at the Banker Awards. The Banker, is an affiliate of the Financial Times UK and is the world’s leading financial publication. One of the most prestigious titles in the global banking industry, the Banker Awards recognize excellence in performance, adding customer value, innovation and leadership in society. UBL won the award, for the fourth time within a decade, on the back of its contribution, during extraordinary times during the current pandemic, while expanding the scope of financial services in Pakistan as a core strategy and spearheading innovation in the local banking industry.
During 2020, UBL was declared Pakistan's Best Digital Bank for 2020 by Asiamoney, an associate of Euromoney. The award is a testament to UBL's contribution in expanding the scope of financial services through digital channels in Pakistan and spearheading innovation in the local banking industry.
UBL was also declared the 'Best Digital Bank' at the 2020 Pakistan Banking Awards. The year has seen UBL work on innovative ventures to bring about many customer centric technological offerings. The award recognizes UBL's position as Pakistan's leading progressive and innovative Bank.
Future OutlookThe COVID-19 pandemic has had a significant impact on the domestic as well as the global economy. The country has dealt reasonably well with the aftermath but maintaining the recent positive momentum remains critical in the immediate term. As the economy emerges from the crisis, UBL with its vast scale, diversified product offerings and widespread presence in all corners of the country, is ideally placed to play a leading role in the recovery. The bank remains committed in expanding the scope of intermediation services across the individuals, mid-market and large corporates.
Branch Banking remains the core of the UBL franchise where the aim is to expand the bank’s reach by achieving the required levels of service quality that is intrinsically perceived as the best in class. We aim to become the most preferred financial services provider in Pakistan to the ever growing customer base.
The bank will look to build on its award winning digital proposition and will continue to introduce unique and innovative solutions, with the aim of making banking easier and accessible to all, including the significantly unbanked population.
As economic activities pick up momentum, lending avenues will gradually open up and the bank will seek to deepen and expand relationships across the established and emerging business segments, within an acceptable risk profile.
The bank is continually striving to strengthen compliance standards to be at par with the global best practices. UBL’s
greatest asset is its employees, where the bank will continue to invest in their progression and develop the leaders of the future. Corporate GovernanceDirectors’ StatementThe Board of Directors is committed to ensuring that the requirements of corporate governance set by the Securities and Exchange Commission of Pakistan are fully met. The bank has adopted good corporate governance practices and the Directors are pleased to report that:• The financial statements, prepared by the management of the
bank, present fairly the state of affairs of the bank, the results of its operations, cash flows and changes in equity.
• Proper books of accounts of the bank have been maintained.• Appropriate accounting policies have been consistently applied
in the preparation of the financial statements. Accounting estimates are based on reasonable and prudent judgment.
• International Financial Reporting Standards, as applicable to banks in Pakistan, have been followed in preparation of financial statements without any departure therefrom.
• The system of internal control in the bank is sound in design and is effectively implemented and monitored.
• There are no significant doubts regarding the bank’s ability to continue as a going concern.
• There has been no material departure from the best practices of corporate governance.
• Performance highlights for the last six years are attached to these unconsolidated financial statements.
• Profit amounting to Rs. 2.1 billion has been transferred to Statutory Reserve for the year 2020.
• The Board of Directors consists of eight (8) male and one (1) female member. The detailed composition of the Board is given in paragraphs 1 and 2 of the Statement of Compliance with the Code of Corporate Governance.
• A renowned external consultant has been appointed to evaluate the performance of the board and its sub-committees in accordance with applicable regulatory framework and best practices.
• Details of Directors’ training programs are given in the Statement of Compliance with the Code of Corporate Governance.
• The Non-Executive Directors, including Independent Directors, are eligible for fees and logistic related expenses for attending meetings of the Board and its Committees, as approved by the Board of Directors. Moreover, the fee paid to these directors is made part of the agenda for the Annual General Meeting to obtain post facto approval from the shareholders.
• The Board has constituted the following five Committees with defined Terms of Reference (ToRs):
Board Audit Committee (BAC):Ms. Shazia Syed ChairpersonMr. Haider Zameer Choudrey MemberMr. Rizwan Pervez MemberMr. Aqeel Ahmed Nasir Secretary
Board Risk and Compliance Committee (BRCC):Mr. Arshad Ahmad Mir ChairmanLord Zameer M. Choudrey, CBE, SI Pk MemberMs. Shazia Syed MemberMr. Shazad G. Dada MemberMr. Imran Sarwar Secretary
Board Human Resource & Compensation Committee (HRCC):Mr. Tariq Rashid ChairmanSir Mohammed Anwar Pervez, OBE, HPk MemberMr. Arshad Ahmad Mir MemberMr. Rizwan Pervez MemberMs. Sadia Saeed Secretary
Board IT Committee (BITC):Mr. Tariq Rashid ChairmanLord Zameer M. Choudrey, CBE, SI Pk MemberMr. Haider Zameer Choudrey MemberMr. Shazad G. Dada MemberMr. Muhammad Faisal Anwar Secretary
Board Nomination Committee (BNC):Sir Mohammed Anwar Pervez, OBE, HPk ChairmanLord Zameer M. Choudrey, CBE, SI Pk MemberMr. Arshad Ahmad Mir MemberMr. Aqeel Ahmed Nasir Secretary
A brief description of the core functions under the ToRs of each sub-committee are as follows:-
Board Audit Committee (BAC):-The primary activity of the board audit committee is to provide oversight of the financial reporting process, the audit process as well as the system of internal controls and compliance with laws and regulations. The committee reviews the results of audits with the bank’s management as well as the external auditors. The committee also reviews the scope and extent of internal audit, audit plan, reporting framework and procedures and ensures that the internal audit function has adequate resources and is appropriately placed within the Bank. The committee also provides oversight and review of the internal control over financial reporting (ICFR) system for effective implementation and its upgrade.
Board Risk and Compliance Committee (BRCC):-The committee is responsible for setting the overall risk management framework and ensuring the evolution and effectiveness of all risk management policies in line with the changing economic climate for risk mitigation. The committee oversees the overall risk management function across the bank and ensures compliance with various risk management policies through operational risk and Basel, treasury and market risk, credit risk and credit policy functions. Furthermore, the committee also monitors the effectiveness of the risk management function to ensure compliance with regulatory risk requirements including effective safeguards against financial crimes.
Board Human Resource & Compensation Committee (HRCC):-The committee is responsible for recommending to the Board the overall remuneration mechanism and policy across the bank and ensuring that the policies are aligned with regulatory requirements. The purview of the committee includes the review of the overall compensation and benefit structure, including material risk takers (MRTs) and material risk controllers (MRCs), headcount levels, as well as recommending human resource management policies to the Board. The committee is also responsible for recommending to the Board a policy framework for determining remuneration of directors, executive and non-executive directors, and members of senior management in accordance with relevant prevailing regulatory guidelines.
Board IT Committee (BITC):-The Committee is responsible for providing an effective governance framework to ensure that the bank’s technology function enables the achievement of corporate strategies and objectives. The Committee communicates to the Board the progress of the technology activities and digital initiatives being undertaken across the bank. Furthermore, the Committee is also responsible for ensuring that risk management strategies are designed and implemented to effectively respond to wide-scale disruptions, as well as managing Information Technology (IT) and Cyber Security Risks.
Board Nomination Committee (BNC):-The primary responsibility for the Committee is to review the
Directors’ Reportto the Members 2020
27Annual Report 2020

nomination of directors, including their profile, academic background, skills, knowledge and experience. The Committee is responsible for reviewing the overall structure, size and composition of the Board and its committees and to make recommendations to the Board in this regard. The Committee also makes recommendations for filling casual vacancies on the board and board sub-committees and monitor the annual board evaluation process as per regulatory requirements.
Directors Appointment and NominationThe directors of the Bank are elected by the shareholders while casual vacancies are filled by the directors in accordance with the articles of association and the applicable laws and regulations. Furthermore, every new director has to pass through the assessment criteria of ‘Fit and Proper Test’ as set and advised by the State Bank of Pakistan.
While appointing a director, it is ensured that the Board is well structured comprising of members who have diversified experience, suitable knowledge, appropriate skill set, expertise and competency related to the bank's operations, creating an effective decision making body. It is also ensured that the Board contains appropriate mix of non-executive, independent and female members that meet all the requirements of the applicable laws and regulations regarding diversity, size of the board and have no material conflicts of interest.
Active role of Independent Directors is ensured to enhance the overall effectiveness of the Board. While selecting and appointing independent directors, the applicable provisions of the laws, rules and regulations are meticulously complied with. Independent Directors are selected to demonstrate the transparency and fairness in their role and also to provide an objective and independent judgment in the best interest of the Bank.
The profiles of each director, including their qualification, expertise, past work experience along with their status as well as their membership on board(s) / shariah Board(s) of other companies is included in the directors’ profile in the Annual Report.
Board Performance EvaluationTo comply with the requirement of SBP’s BPRD Circular No. 11 dated August 22, 2016, a formal process of evaluation of performance of the Board as a whole and its committees has been framed and implemented, and an external independent institution, as approved by SECP, has been engaged.
As per the approved mechanism, Pakistan Institute for Corporate Governance has been engaged for evaluating the performance of the overall board, the sub-committees of the Board, the chairman, non-executive directors, including independent directors, as well as the President and CEO.
Compensation of DirectorsThe Board of Directors of UBL in their 216th meeting held on August 02, 2018 approved a comprehensive package regarding remuneration paid to directors including the Chairman for attending the Board and the Board’s committee meetings. The document also covered other expenses related to Board meetings. This policy was approved by the shareholders in the Annual General Meeting (AGM) held on March 28, 2019. In light of the guidelines issued by SBP in the BPRD Circular No. 03 dated August 17, 2019, the Board approved the Directors’ Remuneration Policy in its meeting held on February 19, 2020. Under this policy, non-executive directors, including the Chairman will be eligible to receive an amount of Rs. 750,000
per Board meeting and Rs. 750,000 for attending a committee meeting of the Board. In addition to the meeting fees, the Chairman will be entitled for a remuneration up to 20% of the Board meeting fee for holding the office of the Chairman. The policy also covers traveling, logistics and accommodation expenses as well as daily allowance entitlements. This policy has been approved by the shareholders of the bank in the AGM held on March 25, 2020.
The details of compensation of directors in 2020 are disclosed in Note 40 to the unconsolidated financial statements.
Meetings of Board CommitteesThe number of Board Committees’ meetings held during the year and the number of meetings attended by the directors is shown below:
* Resigned on August 5, 2020 ** Expiry of Term on June 30, 2020*** Joined on July 16, 2020
The bank operates five funded retirement schemes which are the Provident Fund, Gratuity Fund, Pension Fund, Benevolent Fund and General Provident Fund.
The values of the investments of these funds, based on their latest audited financial statements as at December 31, 2019 are as follows:
Meetings of the BoardDuring the year under review, the Board of Directors met six times. The number of meetings attended by each Director during the year is shown below:
Pattern of ShareholdingThe pattern of shareholding as at December 31, 2020 is given
below:
The aggregate shares held by the following are:
* The bank is a subsidiary of Bestway (Holdings) Limited which is incorporated in the United Kingdom** Name wise detail of Modarabas & Mutual Funds is annexed with Categories of Shareholders*** There were no shares held by the spouses or minor children of the Directors and CEO of the bank
Trades in the shares of UBL carried out by Directors, Executives and their spouses and minor children are annexed along with the Pattern of Shareholding.
Shariah BoardThe details relating to Shariah board and its members required to be disclosed in the Director’s Report are covered in the Report of Shariah Board as part of the Annual Report.
Remuneration FrameworkIn compliance with regulatory guidelines, UBL has put in a place a comprehensive remuneration policy to ensure that the bank’s remuneration practices attract, retain and reward the best talent, are in compliance with regulatory guidelines and are aligned with the bank’s overall strategic objectives. One of the key features of the remuneration framework is to promote effective risk management in line with the bank’s risk appetite and within the thresholds set by the bank.
UBL’s board of directors has the overall responsibility for reviewing, approving and monitoring the implementation of the remuneration framework, based on recommendations of Board Human Resource and Compensation Committee (HRCC).
The bank offers a remuneration structure comprising of both fixed and variable elements.
Some of the key features of the remuneration structure are as follows:-
Fixed remuneration: This comprises of the base salary, including any annual increments, and role-based fixed allowances, if applicable. Fixed remuneration does not vary with performance and is payable in cash.
Variable performance based remuneration: These are determined based on the bank’s overall performance, profitability of the respective business unit and the employee’s individual performance. Such remuneration takes the form of annual or periodic bonuses and sales incentives.
Other Benefits: These are awarded on the basis of individual employment contracts and local market practices. These may include staff loans, expense allowances / reimbursements, life insurance, medical care and relocation allowances amongst others.
Sign-on / Joining Bonus: This is considered as part of variable pay and is granted only in exceptional cases in accordance with human resources policies and is payable within twelve months from joining the bank.
Severance pay: These are part of an employee’s variable pay and includes any payment made to employees at the time of their retirement, separation or termination of contract over and above their normal retirement, separation or termination benefits.
Material Risk Takers (MRTs) and Material Risk Controllers (MRCs)The criteria for an employee to be designated as an MRT / MRC has been developed in accordance with regulatory guidelines and best practices. MRTs and MRCs are identified as functions and designations having appropriate level of authority and control within the bank. MRCs have appropriate level of authority and control and are duly governed by approved organograms having clearly defined independent reporting lines.
MRTs and MRCs include employees and designations entailing; President and CEO, members of management teams reporting directly to the President and CEO, members of critical management committees, heads of critical functions responsible for managing businesses, risks and controls, country heads of overseas branches. MRTs and MRCs also include employees taking decisions, which may affect the Bank’s exposure to credit risk, market risk, operational risk and liquidity risk based on appropriate materiality levels.
MRT and MRC performance is measured using risk-adjusted balanced scorecards, ensuring correlation and alignment of risks and rewards, incorporating various financial and non-financial, qualitative as well as ‘risk-adjusting’ factors. Each category within the scorecard includes multiple factors and KPIs which is assessed based on appropriate benchmarks and targets. Ratings are assigned to MRTs and MRCs based on this risk-adjusted performance assessment. These scorecards are reviewed every year, with interim reviews carried out in case of any significant changes in underlying circumstances.
Remuneration of MRTs and MRCsThe compensation structures for MRTs and MRCs is determined and proposed by the Human Resources department which ensures an appropriate balance between fixed and variable pay, considering the employees position, roles and responsibilities, as well as performance against financial and non-financial objectives and KPIs. The compensation for MRTs and MRCs includes fixed and variable elements similar in structure to the banks’ remuneration policy for all employees.
Fixed remuneration comprises of base salary, increments and role-based fixed allowances if applicable. The Human Resources department derives an appropriate benchmark using external market data, in order to ensure the appropriateness of the fixed remuneration to attract and retain employees. Variable remuneration is performance based, similar to the bank’s other employees.
The employee score can be adjusted downwards for elements of under-achievement in financial performance, undue risk
BAC BRCC HRCC BITC BNCNumber of meetings held 4 4 4 4 3Number of meetings attended:Sir Mohammed Anwar Pervez, OBE, HPk - - 1 - 3Lord Zameer M. Choudrey, CBE, SI Pk - 4 - - 3Mr. Haider Zameer Choudrey 4 - - 4 -Mr. Rizwan Pervez 4 - 1 - -Mr. Arshad Ahmad Mir - 4 4 - 3Mr. Khalid A. Sherwani* 3 - 3 - -Mr. Amar Zafar Khan 3 - 3 - -Mr. Tariq Rashid 1 - 1 4 -Ms. Sima Kamil** - 2 - 2 -Mr. Shazad G. Dada*** - 2 - 2 -
Shareholders holding 5% or more No. of Shares %voting rights
Bestway (Holdings) Limited 631,728,895 51.60
Bestway Cement Limited 93,649,744 7.65
Shareholders No. of Shares % of Ordinary SharesBestway Group (BG) 752,569,602 61.48%General Public & Others 336,618,325 27.49%Banks, DFIs & NBFIs 26,004,716 2.12%Insurance Companies 67,048,735 5.48%Modarabas & Mutual Funds 40,967,484 3.35%International GDRs (non-voting shares) 969,111 0.08%Privatization Commission of Pakistan 1,714 0.00%TOTAL OUTSTANDING SHARES 1,224,179,687 100.00%
Rupees in ‘000Employees’ Provident Fund 3,842,241Employees’ Gratuity Fund 793,390Staff Pension Fund 8,557,720Staff General Provident Fund 788,247Officers / Non-Officers’ Benevolent Fund 317,976
Name of the Director Designation Meetings AttendedSir Mohammed Anwar Pervez, OBE, HPk Chairman 6Lord Zameer M. Choudrey, CBE, SI Pk Director 6Mr. Haider Zameer Choudrey Director 6Mr. Rizwan Pervez Director 6Mr. Arshad Ahmad Mir Director 6Mr. Khalid A. Sherwani (Resigned on August 5, 2020) Director 4Mr. Amar Zafar Khan Director 6Mr. Tariq Rashid Director 6Ms. Shazia Syed (No meeting held since assumption of her office) Director -Ms. Sima Kamil (Expiry of Term on June 30, 2020) President & CEO 2Mr. Shazad G. Dada (Joined on July 16, 2020) President & CEO 3
Directors’ Reportto the Members 2020
No. of Shares a) Associated Companies, undertakings & related parties - Bestway (Holdings) Limited * - Bestway Cement Limited b) Modarabas & Mutual Funds **c) Directors & CEO *** - Sir Mohammed Anwar Pervez, OBE, HPk - Lord Zameer M. Choudrey, CBE, SI PK - Mr. Haider Zameer Choudrey - Mr. Rizwan Pervez - Mr. Arshad Ahmad Mir - Mr. Amar Zafar Khan - Mr. Tariq Rashid d) Executivese) Public sector companies and corporationsf) Banks, DFIs, NBFIs, Insurance Companies
631,728,89593,649,74440,967,484
12,765,3682,403,8702,000,000
129,5002,5002,5002,500
668,902118,628
93,053,451
United Bank Limited28

nomination of directors, including their profile, academic background, skills, knowledge and experience. The Committee is responsible for reviewing the overall structure, size and composition of the Board and its committees and to make recommendations to the Board in this regard. The Committee also makes recommendations for filling casual vacancies on the board and board sub-committees and monitor the annual board evaluation process as per regulatory requirements.
Directors Appointment and NominationThe directors of the Bank are elected by the shareholders while casual vacancies are filled by the directors in accordance with the articles of association and the applicable laws and regulations. Furthermore, every new director has to pass through the assessment criteria of ‘Fit and Proper Test’ as set and advised by the State Bank of Pakistan.
While appointing a director, it is ensured that the Board is well structured comprising of members who have diversified experience, suitable knowledge, appropriate skill set, expertise and competency related to the bank's operations, creating an effective decision making body. It is also ensured that the Board contains appropriate mix of non-executive, independent and female members that meet all the requirements of the applicable laws and regulations regarding diversity, size of the board and have no material conflicts of interest.
Active role of Independent Directors is ensured to enhance the overall effectiveness of the Board. While selecting and appointing independent directors, the applicable provisions of the laws, rules and regulations are meticulously complied with. Independent Directors are selected to demonstrate the transparency and fairness in their role and also to provide an objective and independent judgment in the best interest of the Bank.
The profiles of each director, including their qualification, expertise, past work experience along with their status as well as their membership on board(s) / shariah Board(s) of other companies is included in the directors’ profile in the Annual Report.
Board Performance EvaluationTo comply with the requirement of SBP’s BPRD Circular No. 11 dated August 22, 2016, a formal process of evaluation of performance of the Board as a whole and its committees has been framed and implemented, and an external independent institution, as approved by SECP, has been engaged.
As per the approved mechanism, Pakistan Institute for Corporate Governance has been engaged for evaluating the performance of the overall board, the sub-committees of the Board, the chairman, non-executive directors, including independent directors, as well as the President and CEO.
Compensation of DirectorsThe Board of Directors of UBL in their 216th meeting held on August 02, 2018 approved a comprehensive package regarding remuneration paid to directors including the Chairman for attending the Board and the Board’s committee meetings. The document also covered other expenses related to Board meetings. This policy was approved by the shareholders in the Annual General Meeting (AGM) held on March 28, 2019. In light of the guidelines issued by SBP in the BPRD Circular No. 03 dated August 17, 2019, the Board approved the Directors’ Remuneration Policy in its meeting held on February 19, 2020. Under this policy, non-executive directors, including the Chairman will be eligible to receive an amount of Rs. 750,000
per Board meeting and Rs. 750,000 for attending a committee meeting of the Board. In addition to the meeting fees, the Chairman will be entitled for a remuneration up to 20% of the Board meeting fee for holding the office of the Chairman. The policy also covers traveling, logistics and accommodation expenses as well as daily allowance entitlements. This policy has been approved by the shareholders of the bank in the AGM held on March 25, 2020.
The details of compensation of directors in 2020 are disclosed in Note 40 to the unconsolidated financial statements.
Meetings of Board CommitteesThe number of Board Committees’ meetings held during the year and the number of meetings attended by the directors is shown below:
* Resigned on August 5, 2020 ** Expiry of Term on June 30, 2020*** Joined on July 16, 2020
The bank operates five funded retirement schemes which are the Provident Fund, Gratuity Fund, Pension Fund, Benevolent Fund and General Provident Fund.
The values of the investments of these funds, based on their latest audited financial statements as at December 31, 2019 are as follows:
Meetings of the BoardDuring the year under review, the Board of Directors met six times. The number of meetings attended by each Director during the year is shown below:
Pattern of ShareholdingThe pattern of shareholding as at December 31, 2020 is given
below:
The aggregate shares held by the following are:
* The bank is a subsidiary of Bestway (Holdings) Limited which is incorporated in the United Kingdom** Name wise detail of Modarabas & Mutual Funds is annexed with Categories of Shareholders*** There were no shares held by the spouses or minor children of the Directors and CEO of the bank
Trades in the shares of UBL carried out by Directors, Executives and their spouses and minor children are annexed along with the Pattern of Shareholding.
Shariah BoardThe details relating to Shariah board and its members required to be disclosed in the Director’s Report are covered in the Report of Shariah Board as part of the Annual Report.
Remuneration FrameworkIn compliance with regulatory guidelines, UBL has put in a place a comprehensive remuneration policy to ensure that the bank’s remuneration practices attract, retain and reward the best talent, are in compliance with regulatory guidelines and are aligned with the bank’s overall strategic objectives. One of the key features of the remuneration framework is to promote effective risk management in line with the bank’s risk appetite and within the thresholds set by the bank.
UBL’s board of directors has the overall responsibility for reviewing, approving and monitoring the implementation of the remuneration framework, based on recommendations of Board Human Resource and Compensation Committee (HRCC).
The bank offers a remuneration structure comprising of both fixed and variable elements.
Some of the key features of the remuneration structure are as follows:-
Fixed remuneration: This comprises of the base salary, including any annual increments, and role-based fixed allowances, if applicable. Fixed remuneration does not vary with performance and is payable in cash.
Variable performance based remuneration: These are determined based on the bank’s overall performance, profitability of the respective business unit and the employee’s individual performance. Such remuneration takes the form of annual or periodic bonuses and sales incentives.
Other Benefits: These are awarded on the basis of individual employment contracts and local market practices. These may include staff loans, expense allowances / reimbursements, life insurance, medical care and relocation allowances amongst others.
Sign-on / Joining Bonus: This is considered as part of variable pay and is granted only in exceptional cases in accordance with human resources policies and is payable within twelve months from joining the bank.
Severance pay: These are part of an employee’s variable pay and includes any payment made to employees at the time of their retirement, separation or termination of contract over and above their normal retirement, separation or termination benefits.
Material Risk Takers (MRTs) and Material Risk Controllers (MRCs)The criteria for an employee to be designated as an MRT / MRC has been developed in accordance with regulatory guidelines and best practices. MRTs and MRCs are identified as functions and designations having appropriate level of authority and control within the bank. MRCs have appropriate level of authority and control and are duly governed by approved organograms having clearly defined independent reporting lines.
MRTs and MRCs include employees and designations entailing; President and CEO, members of management teams reporting directly to the President and CEO, members of critical management committees, heads of critical functions responsible for managing businesses, risks and controls, country heads of overseas branches. MRTs and MRCs also include employees taking decisions, which may affect the Bank’s exposure to credit risk, market risk, operational risk and liquidity risk based on appropriate materiality levels.
MRT and MRC performance is measured using risk-adjusted balanced scorecards, ensuring correlation and alignment of risks and rewards, incorporating various financial and non-financial, qualitative as well as ‘risk-adjusting’ factors. Each category within the scorecard includes multiple factors and KPIs which is assessed based on appropriate benchmarks and targets. Ratings are assigned to MRTs and MRCs based on this risk-adjusted performance assessment. These scorecards are reviewed every year, with interim reviews carried out in case of any significant changes in underlying circumstances.
Remuneration of MRTs and MRCsThe compensation structures for MRTs and MRCs is determined and proposed by the Human Resources department which ensures an appropriate balance between fixed and variable pay, considering the employees position, roles and responsibilities, as well as performance against financial and non-financial objectives and KPIs. The compensation for MRTs and MRCs includes fixed and variable elements similar in structure to the banks’ remuneration policy for all employees.
Fixed remuneration comprises of base salary, increments and role-based fixed allowances if applicable. The Human Resources department derives an appropriate benchmark using external market data, in order to ensure the appropriateness of the fixed remuneration to attract and retain employees. Variable remuneration is performance based, similar to the bank’s other employees.
The employee score can be adjusted downwards for elements of under-achievement in financial performance, undue risk
BAC BRCC HRCC BITC BNCNumber of meetings held 4 4 4 4 3Number of meetings attended:Sir Mohammed Anwar Pervez, OBE, HPk - - 1 - 3Lord Zameer M. Choudrey, CBE, SI Pk - 4 - - 3Mr. Haider Zameer Choudrey 4 - - 4 -Mr. Rizwan Pervez 4 - 1 - -Mr. Arshad Ahmad Mir - 4 4 - 3Mr. Khalid A. Sherwani* 3 - 3 - -Mr. Amar Zafar Khan 3 - 3 - -Mr. Tariq Rashid 1 - 1 4 -Ms. Sima Kamil** - 2 - 2 -Mr. Shazad G. Dada*** - 2 - 2 -
Shareholders holding 5% or more No. of Shares %voting rights
Bestway (Holdings) Limited 631,728,895 51.60
Bestway Cement Limited 93,649,744 7.65
Shareholders No. of Shares % of Ordinary SharesBestway Group (BG) 752,569,602 61.48%General Public & Others 336,618,325 27.49%Banks, DFIs & NBFIs 26,004,716 2.12%Insurance Companies 67,048,735 5.48%Modarabas & Mutual Funds 40,967,484 3.35%International GDRs (non-voting shares) 969,111 0.08%Privatization Commission of Pakistan 1,714 0.00%TOTAL OUTSTANDING SHARES 1,224,179,687 100.00%
Rupees in ‘000Employees’ Provident Fund 3,842,241Employees’ Gratuity Fund 793,390Staff Pension Fund 8,557,720Staff General Provident Fund 788,247Officers / Non-Officers’ Benevolent Fund 317,976
Name of the Director Designation Meetings AttendedSir Mohammed Anwar Pervez, OBE, HPk Chairman 6Lord Zameer M. Choudrey, CBE, SI Pk Director 6Mr. Haider Zameer Choudrey Director 6Mr. Rizwan Pervez Director 6Mr. Arshad Ahmad Mir Director 6Mr. Khalid A. Sherwani (Resigned on August 5, 2020) Director 4Mr. Amar Zafar Khan Director 6Mr. Tariq Rashid Director 6Ms. Shazia Syed (No meeting held since assumption of her office) Director -Ms. Sima Kamil (Expiry of Term on June 30, 2020) President & CEO 2Mr. Shazad G. Dada (Joined on July 16, 2020) President & CEO 3
Directors’ Reportto the Members 2020
No. of Shares a) Associated Companies, undertakings & related parties - Bestway (Holdings) Limited * - Bestway Cement Limited b) Modarabas & Mutual Funds **c) Directors & CEO *** - Sir Mohammed Anwar Pervez, OBE, HPk - Lord Zameer M. Choudrey, CBE, SI PK - Mr. Haider Zameer Choudrey - Mr. Rizwan Pervez - Mr. Arshad Ahmad Mir - Mr. Amar Zafar Khan - Mr. Tariq Rashid d) Executivese) Public sector companies and corporationsf) Banks, DFIs, NBFIs, Insurance Companies
631,728,89593,649,74440,967,484
12,765,3682,403,8702,000,000
129,5002,5002,5002,500
668,902118,628
93,053,451
29Annual Report 2020

Board of Directors
exposure, customer related issues, audit / internal controls and compliance ineffectiveness.
Deferral MechanismA certain portion of the MRTs and MRCs variable compensation will be withheld for a defined period whereas remaining portion of the variable compensation shall be paid up-front. This is aimed at aligning the employees’ and stakeholders’ interests and reinforcing that compensation is appropriately linked to longer-term sustainable performance. The deferral percentage ranges between 25% to 40%, while the deferral period for all MRTs and MRCs will be three years, and will be paid on vesting, proportionally through yearly installments, during the deferred period.
Risk Management FrameworkUBL’s Risk and Credit Policy Group has the following verticals:• Corporate, Commercial, SME and Financial Institutions Risk• International Risk• Consumer Credit• Enterprise Risk • Market and Treasury Risk, and Basel • Operational Risk • Vendor Management • Information Security• Credit Policy and Research
The bank’s risk governance is exercised by the following committees:1. Operational & Risk Management Committee2. Portfolio Review Committee3. Information Security Steering Committee4. NPL Review Committee International
Operational and Risk Management Committee is chaired by the President and CEO and comprises of Heads of Risk, Businesses, Finance, Treasury and Operations. Other stakeholders are invited to attend as deemed necessary. The ORMC is responsible for reviewing and undertaking strategic business decisions with a collective view on credit risk and credit maintenance, market risk and capital efficiencies and operational risk.
The Portfolio Review Committee reviews the overall portfolio of problem credits (Watch-listed and NPL credits) with a focus to formulate action plans and remedial strategies. The PRC Review Committee is chaired by the President and CEO, Chief Risk Officer, Heads of Credit Risk of business segments, Head of Business segments, Chief Financial Officer, Credit Administration and the Special Asset Management Group. Other stakeholders are invited to attend as deemed necessary.
The Information Security Steering Committee is chaired by the President and CEO and comprises Heads of all Groups. The Committee is responsible for reviewing and undertaking strategic information and cyber security related reviews.
The NPL Review Committee International is chaired by the President and CEO and comprises of Risk and Business leadership for the International Group. The Committee reviews and monitors the NPL and Watchlist portfolio of GCC and focuses on formulation of action plan for recovery.
The year 2020 was affected by the novel coronavirus and its impact on both local and global economies. Pandemic induced business lockdowns led the economy to contract by 0.4% in FY’20. However, a positive consequence was a decrease in the country’s balance of payment and trade deficit in the second half 2020 because of marked fall in international oil prices and
significant increase in remittance inflows, which helped in the strengthening the exchange rate towards the end of the year. In an effort to mitigate the impact of COVID, the Government and SBP timely provided an emergency relief package of Rs. 1.2 trillion supported by IMF’s USD 1.4 billion under Rapid Financing Instrument Scheme (RIFS) to rejuvenate the ailing economy. The bank modified its strategy in accordance with the COVID led economic challenges and regulatory environment to control portfolio infections and maximize internal controls.
International lending also remained in a consolidation phase owing to COVID-19 pandemic which exacerbated the issues being faced by the region i.e. low oil prices and elongated receivables cycle. The economic growth in the GCC suffered affecting businesses and ultimately the banking sector.
The bank’s Credit Risk Management Division is focused on regular risk assessments and portfolio reviews for stress testing to identify vulnerable and weak segments and potential asset deterioration across all businesses. Focus was also maintained on overall credit maintenance and discipline of managing exposures to rectify any deficiencies.
The consumer credit portfolio has continued to sustain its steady growth under a well-managed risk environment. The controlled level of portfolio delinquencies is owed to robust portfolio management for NPLs including but not limited to stress tests. Periodic review of policies along with automation in risk management procedures ensured a well aligned risk and reward profile of the portfolio.
In line with the SBP Risk Governance Framework for Overseas Operations, the division is being managed from head office, with on ground presence where required. During the year, several initiatives such as de-risking of high RWA assets, focus on cost efficiencies, proactive portfolio management, mapping of policies with domestic structure as well as gap analysis of local regulatory guidelines were undertaken.
The role of Market Risk includes defining and implementing a market risk management framework to systematically identify, assess, monitor and report market related risks. The key objective is to facilitate business growth within a controlled and transparent overall risk management framework.
The objective of the bank’s liquidity risk management framework is to ensure that the bank can fulfill its payment obligations at all times and can manage liquidity and funding risks within its risk appetite. There is a control framework in place for managing liquidity risk and is designed to maintain high quality liquid assets that are sufficient in amount, quality and funding tenor profile. The bank has a comprehensive liquidity policy and stress testing framework and a well-defined contingency plan in place. Regular monitoring of defined key liquidity indicators are undertaken to ensure adequacy of liquidity is maintained at all times.
The bank at all times has maintained its Capital Adequacy Ratio (CAR) well above the regulatory thresholds under the prescribed Basel-III regulations, inclusive of all applicable buffers. The Internal Capital Adequacy Assessment Process (ICAAP) Framework is well defined and is reviewed on an annual basis.
The Operational Risk Management Framework is designed to ensure that an adequate control environment exists across its businesses and functions to maintain an acceptable level of residual risk. The framework is governed by comprehensive policies and procedures in line with the applicable regulatory
Directors’ Reportto the Members 2020
guidelines. The bank has implemented a robust operational risk management system to further strengthen the framework.UBL has established an extensive Information and Cyber Security (IS) Program to manage the security of its information assets. The sensitive information managed by UBL includes data entrusted to the bank by its customers, partners and staff, which is among the organization’s most valuable assets. Given the competitive nature of the banking business and significant value of the data it manages, the Risk Group, in conjunction with business and technology, has taken measures to reduce information security risks and potential business impacts to an acceptable level through the introduction of a detailed Information Security Risk Assessment / Management program that includes following key defensive measures:• 24 x 7 threat monitoring and incident response.• Intrusion prevention at multiple layers.• Regular employee education and awareness campaigns.
Corporate Social Responsibility (CSR)The foundation of UBL’s sustainability agenda is supporting causes that positively influence and enable communities. In 2020, UBL donated to projects that further diversified its sustainability efforts. While a major portion of the projects the Bank participated in during 2020, directly or indirectly, brought relief to those impacted by the Covid-19 pandemic, there were many other projects which reinforced the core areas of UBL’s sustainability efforts, i.e. education and healthcare. Employee engagement in some of the projects was encouraged and the UBL team actively volunteered as symbols of hope for their communities. As recognition for its contributions, UBL was declared one of the top-ten ‘Most Supportive Brands of Pakistan’ during the COVID 19 crisis, by a survey conducted by Ipsos, a multinational market research and consulting firm in 2020.
Statement of Internal ControlsThe Board is pleased to endorse the statement made by the management relating to Internal Controls over Financial Reporting (ICFR) and also the overall internal controls. The Statement on Internal Controls is included in the Annual Report. AuditorsThe present auditor, M/S. A. F. Ferguson & Co., Chartered Accountants, being eligible, in accordance with the special approval as received from the State Bank of Pakistan, offer themselves for re-appointment in the forthcoming Annual General Meeting. The Board of Directors, on the recommendation of the Board Audit Committee, recommends M/S. A. F. Ferguson & Co.
Chartered Accountants, for re-appointment as auditors of the bank for the financial year 2021 at a fee of Rs. 11.475 million with out of pocket expenses and taxes to be paid in actuals.
Conclusion We would like to extend our sincere thanks and appreciation to UBL’s shareholders and customers for their continued trust and support. We value the commitment and dedication of our people that has transformed UBL into the organization that it is today. We would also like to express our appreciation to the Government of Pakistan, the State Bank of Pakistan, the Securities & Exchange Commission and other regulatory bodies for their direction and continued support.
For and on behalf of the Board,
Shazad G. Dada President & CEO
Arshad Ahmad MirDirector
Karachi, February 24th, 2021
United Bank Limited30

Board of Directors
exposure, customer related issues, audit / internal controls and compliance ineffectiveness.
Deferral MechanismA certain portion of the MRTs and MRCs variable compensation will be withheld for a defined period whereas remaining portion of the variable compensation shall be paid up-front. This is aimed at aligning the employees’ and stakeholders’ interests and reinforcing that compensation is appropriately linked to longer-term sustainable performance. The deferral percentage ranges between 25% to 40%, while the deferral period for all MRTs and MRCs will be three years, and will be paid on vesting, proportionally through yearly installments, during the deferred period.
Risk Management FrameworkUBL’s Risk and Credit Policy Group has the following verticals:• Corporate, Commercial, SME and Financial Institutions Risk• International Risk• Consumer Credit• Enterprise Risk • Market and Treasury Risk, and Basel • Operational Risk • Vendor Management • Information Security• Credit Policy and Research
The bank’s risk governance is exercised by the following committees:1. Operational & Risk Management Committee2. Portfolio Review Committee3. Information Security Steering Committee4. NPL Review Committee International
Operational and Risk Management Committee is chaired by the President and CEO and comprises of Heads of Risk, Businesses, Finance, Treasury and Operations. Other stakeholders are invited to attend as deemed necessary. The ORMC is responsible for reviewing and undertaking strategic business decisions with a collective view on credit risk and credit maintenance, market risk and capital efficiencies and operational risk.
The Portfolio Review Committee reviews the overall portfolio of problem credits (Watch-listed and NPL credits) with a focus to formulate action plans and remedial strategies. The PRC Review Committee is chaired by the President and CEO, Chief Risk Officer, Heads of Credit Risk of business segments, Head of Business segments, Chief Financial Officer, Credit Administration and the Special Asset Management Group. Other stakeholders are invited to attend as deemed necessary.
The Information Security Steering Committee is chaired by the President and CEO and comprises Heads of all Groups. The Committee is responsible for reviewing and undertaking strategic information and cyber security related reviews.
The NPL Review Committee International is chaired by the President and CEO and comprises of Risk and Business leadership for the International Group. The Committee reviews and monitors the NPL and Watchlist portfolio of GCC and focuses on formulation of action plan for recovery.
The year 2020 was affected by the novel coronavirus and its impact on both local and global economies. Pandemic induced business lockdowns led the economy to contract by 0.4% in FY’20. However, a positive consequence was a decrease in the country’s balance of payment and trade deficit in the second half 2020 because of marked fall in international oil prices and
significant increase in remittance inflows, which helped in the strengthening the exchange rate towards the end of the year. In an effort to mitigate the impact of COVID, the Government and SBP timely provided an emergency relief package of Rs. 1.2 trillion supported by IMF’s USD 1.4 billion under Rapid Financing Instrument Scheme (RIFS) to rejuvenate the ailing economy. The bank modified its strategy in accordance with the COVID led economic challenges and regulatory environment to control portfolio infections and maximize internal controls.
International lending also remained in a consolidation phase owing to COVID-19 pandemic which exacerbated the issues being faced by the region i.e. low oil prices and elongated receivables cycle. The economic growth in the GCC suffered affecting businesses and ultimately the banking sector.
The bank’s Credit Risk Management Division is focused on regular risk assessments and portfolio reviews for stress testing to identify vulnerable and weak segments and potential asset deterioration across all businesses. Focus was also maintained on overall credit maintenance and discipline of managing exposures to rectify any deficiencies.
The consumer credit portfolio has continued to sustain its steady growth under a well-managed risk environment. The controlled level of portfolio delinquencies is owed to robust portfolio management for NPLs including but not limited to stress tests. Periodic review of policies along with automation in risk management procedures ensured a well aligned risk and reward profile of the portfolio.
In line with the SBP Risk Governance Framework for Overseas Operations, the division is being managed from head office, with on ground presence where required. During the year, several initiatives such as de-risking of high RWA assets, focus on cost efficiencies, proactive portfolio management, mapping of policies with domestic structure as well as gap analysis of local regulatory guidelines were undertaken.
The role of Market Risk includes defining and implementing a market risk management framework to systematically identify, assess, monitor and report market related risks. The key objective is to facilitate business growth within a controlled and transparent overall risk management framework.
The objective of the bank’s liquidity risk management framework is to ensure that the bank can fulfill its payment obligations at all times and can manage liquidity and funding risks within its risk appetite. There is a control framework in place for managing liquidity risk and is designed to maintain high quality liquid assets that are sufficient in amount, quality and funding tenor profile. The bank has a comprehensive liquidity policy and stress testing framework and a well-defined contingency plan in place. Regular monitoring of defined key liquidity indicators are undertaken to ensure adequacy of liquidity is maintained at all times.
The bank at all times has maintained its Capital Adequacy Ratio (CAR) well above the regulatory thresholds under the prescribed Basel-III regulations, inclusive of all applicable buffers. The Internal Capital Adequacy Assessment Process (ICAAP) Framework is well defined and is reviewed on an annual basis.
The Operational Risk Management Framework is designed to ensure that an adequate control environment exists across its businesses and functions to maintain an acceptable level of residual risk. The framework is governed by comprehensive policies and procedures in line with the applicable regulatory
Directors’ Reportto the Members 2020
guidelines. The bank has implemented a robust operational risk management system to further strengthen the framework.UBL has established an extensive Information and Cyber Security (IS) Program to manage the security of its information assets. The sensitive information managed by UBL includes data entrusted to the bank by its customers, partners and staff, which is among the organization’s most valuable assets. Given the competitive nature of the banking business and significant value of the data it manages, the Risk Group, in conjunction with business and technology, has taken measures to reduce information security risks and potential business impacts to an acceptable level through the introduction of a detailed Information Security Risk Assessment / Management program that includes following key defensive measures:• 24 x 7 threat monitoring and incident response.• Intrusion prevention at multiple layers.• Regular employee education and awareness campaigns.
Corporate Social Responsibility (CSR)The foundation of UBL’s sustainability agenda is supporting causes that positively influence and enable communities. In 2020, UBL donated to projects that further diversified its sustainability efforts. While a major portion of the projects the Bank participated in during 2020, directly or indirectly, brought relief to those impacted by the Covid-19 pandemic, there were many other projects which reinforced the core areas of UBL’s sustainability efforts, i.e. education and healthcare. Employee engagement in some of the projects was encouraged and the UBL team actively volunteered as symbols of hope for their communities. As recognition for its contributions, UBL was declared one of the top-ten ‘Most Supportive Brands of Pakistan’ during the COVID 19 crisis, by a survey conducted by Ipsos, a multinational market research and consulting firm in 2020.
Statement of Internal ControlsThe Board is pleased to endorse the statement made by the management relating to Internal Controls over Financial Reporting (ICFR) and also the overall internal controls. The Statement on Internal Controls is included in the Annual Report. AuditorsThe present auditor, M/S. A. F. Ferguson & Co., Chartered Accountants, being eligible, in accordance with the special approval as received from the State Bank of Pakistan, offer themselves for re-appointment in the forthcoming Annual General Meeting. The Board of Directors, on the recommendation of the Board Audit Committee, recommends M/S. A. F. Ferguson & Co.
Chartered Accountants, for re-appointment as auditors of the bank for the financial year 2021 at a fee of Rs. 11.475 million with out of pocket expenses and taxes to be paid in actuals.
Conclusion We would like to extend our sincere thanks and appreciation to UBL’s shareholders and customers for their continued trust and support. We value the commitment and dedication of our people that has transformed UBL into the organization that it is today. We would also like to express our appreciation to the Government of Pakistan, the State Bank of Pakistan, the Securities & Exchange Commission and other regulatory bodies for their direction and continued support.
For and on behalf of the Board,
Shazad G. Dada President & CEO
Arshad Ahmad MirDirector
Karachi, February 24th, 2021
31Annual Report 2020

سیکورٹی ورسائبر ا انفارمیشن جامع ایک لیے کے ی�ورٹی یک� س� کی س ٹ
� یس�ی �ا انفارمیشن اپنے نے ایل یوبی
ز پارٹنر کسٹمزز، میں اس ہے رکھتا پاس اپنے معلومات ور ا ڈیٹا جوحساس ایل یوبی ہے۔ کیا قائم )IS(م پروگرا
س ٹ
� یس�ی �ا وراہم ا قیمتی سے سب کے رے دا جوا ہیں شمار و د وراعدا ا معلومات شدہ تفویض سے جانب کی عملے ور ا
ہیں۔
ہے۔رسک کرتا م انصرا و انتظام بینک کا جس ہے ڈیٹا قدر ں گرا ور ا کاکاروبار نوعیت مسابقتی کا ایل بی یو
کے سیکورٹی انفارمیشن کہ جو ہیں کیے اقدامات کئی سے حوالے کے ورٹیکنالوجی ا کاروبار نے گروپ مینجمنٹ
ی�ورٹی یک� س� انفارمیشن تفصیلی میں ضمن اس رکھے۔ تک حد قبول قابل کو اثرات ی کاروبار متوقع ور ا رسکس
ہیں: ذیل درج اقدامات دفاعی اہم چند م کے پروگرا �ٹ ن
جم� �ی�ن�ٹ / م�
نیسم� یس� �
ا رسکس
رپورٹ کی واقعات ور ا مانیٹرنگ کی • 24/7خطرات
سطحیں کثیر کی بچاؤ سے • انٹروژن
مہمات کی آگہی ور ا جانکاری باقاعدہ کی • ملازمین
)CSR))Corporate Social Responsibility) داری ذمہ سماجی کاروباری اثرات مثبت پر معاشرے مددسے کی طبقات پسماندہ ہی بنیاد کی ایجنڈے کے ریت پائیدا کے ایل بی یو
جس کی صرف پر منصوبوں فلاحی رقم خاصی نے ایل بی یو میں 2020 ہے۔ بااختیاربنانا انہیں ور ا کرنا مرتب
تر زیادہ کا منصوبوں فلاحی ملی۔ہمارے تقویت کومزید کوششوں کی استحکام معاشرتی میں شعبوں مختلف سے
میں ن تھے۔ا لیے کے ریلیف سے وباء کی کورونا پر طور بالواسطہ یا بلاواسطہ جو تھا مشتمل پر اقدامات ن ا حصہ
ور ا تعلیم یعنی ملی تقویت کو کوششوں کی لانے ری پائیدا کی ایل بی یو سے جس تھے بھی اقدامات ایسے کچھ سے
حوصلہ بھی کی شرکت میں منصوبوں ور ا سرگرمیوں ایسی کی ملازمین سے میں ن فراہمی۔ا کی سہولیات طبی
کے خدمات قدر ں گرا کی ایل بی یو تھے۔ کرن کی امید لیے کے آبادیوں مقامی اپنی ہ و جہاں گئی کی افزائی
سے ”سب سرفہرست دس کو ایل بی یو سے حوالے کے ء وبا کی کورونا ن دورا کے جائزے ایک میں ف اعترا
نے Ipsos فرم مشاورتی ور ا تحقیقی ف معرو 2020میں جائزہ گیا۔یہ دیا ر قرا ایک سے میں برانڈز“ معاون
تھا۔ کیا شائع
)Statement of Internal Controls) اسٹیٹمنٹ برائے اندرونی انضباط
انضباط اندرونی ورمجموعی ا )ICFR( رپورٹنگ فنانشل برائے انضباط اندرونی سے طرف کی مینجمنٹ بورڈ،
شامل میں رپورٹ سالانہ انضباط اندرونی برائے اسٹیٹمنٹ کرتاہے۔ توثیق مسرت بصد کی بیان متعلق سے
ہے۔
)Auditors) یٹرز آڈسے پاکستان آف بینک اسٹیٹ س،
ٹ�
ن�
ٹ�
ن�
اکاؤ چارٹرڈ A.F.Ferguson & Co. میسرز آڈیٹرز موجودہ
دوبارہ میں عام اجلاس سالانہ آئندہ کو خود ور ا ہیں اہل لیے کے تقرری دوبارہ مطابق کے منظوری خصوصی
میسرز مطابق کے سفارشات کی کمیٹی آف بور ڈائریکٹرز، آف بورڈ ہیں۔ کرتے پیش لیے کے تقرری
دوبارہ طورپر کے آڈیٹرز کے بینک لیے سال2021کے کی س ٹ
�ن
�ٹ
�ن�
اکاؤ .A.F.Ferguson & Co چارٹر
جس گے جائیں کیے دا ا روپے ملین 11.475 فیس بطور کو فرم لیے کے ہیں۔اس کرتے سفارش کی تقرری
دا کیے جائیں گے۔ ور ٹیکسز بمطابق اصل ا داکیے گئے اخراجات ا میں جیب سے ا
)Conclusion) اختتامیہاعتماد مسلسل پر ہم نے جنہوں ہیں ر شکرگزا سے دل تہہ کسٹمرزکے ور ا ہولڈرز شیئر تمام اپنے ہم میں آخر
ایل بی یو نے جنہوں ہیں سراہتے کوبھی پورلگن بھر ور ا کوششوں انتھک کی ٹیم پوری کی ایل بی یو ہم کیا۔
آف کمیشن ایکسچینج اینڈ ی�ورٹیز یک� س� پاکستان، آف بینک اسٹیٹ ہم پہنچایا۔ تک مقام عالی اس رہ دا ا بطور آج کو
ہیں۔ کرتے دا ا شکریہ کا ن پرا ورمعاونت ا رہنمائی مسلسل سے جانب کی روں دا ا ریگولیٹری دیگر ور ا پاکستان
بورڈ طرف ز وا برائے
دا دا جی د شہزا
و ا ای سی ر و ا پریذیڈنٹ
میر احمد رشد ا
ڈائریکٹر
کراچی
24فروری2021
United Bank Limited32

ور ا لینے جائزہ ساتھ کے نظر نکتہ اجتماعی ایک پر ل ٹ�ی� ک�ی�پ
ور ا رسک رسک، آپریشنل رسک، مارکیٹ کریڈٹ
پریشنل آ کے بینک مقصد کا کمیٹی مینجمنٹ رسک آپریشنل ہے۔ ر دا ذمہ کی کرنے فیصلے کاروباری اسٹرٹیجک
کنٹرول مطلوبہ لیے کے کرنے کم سے کم کو رسک ورریذیڈیشنل ا بنانا یقینی کو انتظام جامع ور ا موثر کے رسک
ہے۔ لینا جائزہ کا
شامل سربراہ کے مینجمنٹ ٹ ی ا�ی ایڈمنسٹریشن رسک، کاروباری، کریڈٹ کریڈٹ میں کمیٹی ریویو فولیو پورٹ
مسائل کے کریڈٹس کمیٹی فولیوریویو پورٹ ہیں۔ کرتے و ا ای سی ر و ا صدر سربراہی کی ورکمیٹی ا ہیں ہوتے
ہے۔ لیتی کاجائزہ فولیو پورٹ مجموعی کا جات قرضہ فعال غیر میں شعبوں ورمختلف ا اکاؤنٹس لسٹ واچ بشمول
ورلائحہ ا کرنے وضع عملی حکمت کی کرنے حل مسائل ہوئے نظررکھتے کومد حالت کی فولیو پورٹ کمیٹی یہ
آفیسر، رسک چیف میں و، دیگر ا ای سی ور ا صدر رت صدا کی کمیٹی ہے۔اس ر دا ذمہ کی کرنے کومرتب عمل
کریڈٹ آفیسر، فنانشل چیف س، ٹ
�ن
یگم� س�بزنس آف ہیڈ س،
ٹ�
نیگم�ی� س�
بزنس آف رسک کریڈٹ آف ہیڈز
کیاجاتا مدعو ضرورت حسب کو ن را دا ذمہ ہیں۔دیگر شامل گروپ �ٹ ن
جم� �ی�نم� ٹ ی ا�ی سپیشل ور ا ایڈمنسٹریشن
ہے۔
کمیٹی ہیں۔ ہیڈزکرتے کے گروپس تمام ور ا و ا ای صدر،سی سربراہی کی کمیٹی اسٹیئرنگ سکیورٹی انفارمیشن
کی کرنے مرتب عمل لائحہ ور ا کرنے وضع علمی حکمت متعلق سے سکیورٹی سائبر ور ا معلومات جک � �یٹ
ی� اسٹر�
ہے۔ ر دا ذمہ
انٹرنیشنل وریہ ا ہیں کرتے و ا ای سی ور ا صدر رت صدا کی انٹرنیشنل کمیٹی جائزہ کی جات قرضہ فعال غیر
لیتی کاجائزہ جات قرضہ فعال غیر کمیٹی یہ ہے۔ ہوتا مشتمل پر لیڈرشپ بزنس ور ا رسک لیے کے گروپ
عملی لیے کے ریکوری ور ا ہے کرتی لسٹ واچ کو فولیو پورٹ کے کونسل تعاون خلیج ور ا ہے کرتی نگرانی ور ا
ہے۔ دیتی توجہ پر دینے ترتیب منصوبے
اثرات منفی پر معیشت الاقوامی بین ور ا مقامی سے اس ور ا کیا متاثر د زیاہ بہت نے وباء کورونا سال2020کو
اثر مثبت ایک پر ملک تاہم گئیں۔ پڑ سست سرگرمیاں معاشی سے ؤن ڈا لاک سے وجہ کی وباء اس پڑے۔
2020کی ہوا۔سال ر نمودا میں صورت کی کمی میں خسارے تجارتی ور ا بہتری میں زن توا کے دائیگیوں ا
نمایاں بھی میں زر ترسیلات سے ملک بیرون ہ علاو کے کمی میں قیمتوں عالمی کی تیل میں ششماہی دوسری
میں آیا۔ملک میں دیکھنے استحکام میں تبادلہ شرح میں مہینوں آخر کے سال سے جس آئی۔ میں دیکھنے بہتری
نے1.2 حکومت ور ا پاکستان آف بینک اسٹیٹ لیے کے لانے کمی میں اثرات معاشی کے کورونا)کویڈ۔19(
گ ن
س�ن
فنا� ڈ ٹ
پ ر�ی معاونت کی ڈالر رب ا 1.4 نے ایف ایم آئی میں جس دیا پیکیج ریلیف ایمرجنسی کا روپے ن
ی ٹر�ی
کے وباء کی کوویڈ نے بینک سکے۔ جا دیا سہارا کو معیشت کمزور تاکہ دی تحت کے )RIFS( سکیم انسٹرومنٹ
پورٹ کنٹرول کر بنا بہتر کو ماحول ی ریگولیٹر ور ا مشکلات معاشی تاکہ کی تبدیلی میں عملی حکمت اپنی مطابق
سکے۔ جا بنایا یقینی کو انضباط اندرونی زیادہ سے زیادہ ور ا ر ن
�ن
�ش
یکس ف�ن
�ا فولیو
خطے ہوا۔ متاثر بھی بینکاری شعبہ میں نتیجے کے جس رہی متاثر معیشت ور ا کاروبار بھی میں کونسل تعاون خلیج
کی سرمائے ور ا کمی میں قیمتوں کی تیل جیسے رہیں درپیش مشکلات نظر پیش کے کوویڈ-19وباء موجود میں
ہوئی۔ متاثر بھی گیری قرض الاقوامی بین سے وجہ کی اضافہ، جس میں دورانیہ کے واپسی
جس دی توجہ پر بنانے موثر کو اقدامات کے نمٹنے سے رسک نے ڈویژن �ٹ ن
جم� �ی�نم� رسک کریڈٹ کے بینک
کمزور تاکہ ہے شامل ثانی نظر پر فولیو پورٹ ور ا لینا جائزہ سے باقاعدگی کا خطرات لیے کے آزمائش کی دباؤ میں
رپورٹ کی ڈائریکٹرز کو ارکان
پر فرسودگی متوقع کی اثاثوں میں شعبوں کاروباری تمام ور ا سکے جا کی پہچان کی دوچارشعبوں سے خطرے ور ا
کرکے بندی درجہ کی خطرات آمدہ پیش ور ا گیا کیا اضافہ بھی میں توجہ پر کریڈٹس سکے۔مجموعی جا رکھی نظر
جاسکے۔ کیا کوٹھیک بھی موجودخامی پاکرکسی قابو پر خطرات ممکنہ ن ا تاکہ گئی کی س ن�
ن�ی�
ٹ�
ن� م�ی
ر برقرا نمو بتدریج میں فولیو پورٹ کریڈٹ کنزیومر تحت کے انوائرمنٹ رسک گئے رکھے میں قابو طرح اچھی
کی کنٹرول کی حدود کی فولیو پورٹ لیے کے �ٹ ن
جم� �ی�نم� فولیو رپورٹ
ش ئمو� کے قرضوں فعال ہے۔غیر گئی رکھی
منظم میں ز اندا اچھے کے فولیو نہیں۔پورٹ محدود Stress Testingتک محض جو گیا رکھا نظر پیش کو سطح
رسک ہ علاو کے جائزے اندر کے مدت مقررہ کے پالیسیوں لیے کے بنانے یقینی کو پروفائل آور ثمر ور ا
ہے۔ گئی کی بھی آٹومیشن کی کار طریقہ کے �ٹ ن
جم� �ی�نم�
ڈویژن مطابق کے ورک فریم گورننس رسک کے پاکستان آف بینک اسٹیٹ لیے کے آپریشنز ملک بیرون
کے ہے۔سال گئی بنائی یقینی بھی موجودگی پر موقع ہو، ضروری جہاں ور ا ہے رہا جا چلایا سے آفس ہیڈ کو
ز اندا متحرک لانے، کمی میں لاگتوں گ، ن
رسک� ڈی کی یس �ٹیس� �
ا RWA بلند جیسے گئے کئے اقدامات کئی ن دورا
ریگولیٹری لوکل ساتھ ساتھ کے سازی خاکہ کی پالیسیوں اسٹرکچرکی ک ٹیس� ڈوم� ، �ٹ
نجم� �ی�
نم� فولیو پورٹ سے
ہیں۔ شامل اقدامات جیسے تجزیہ کا خامیوں موجود میں گائیڈلائنز
جس ہے درآمدشامل عمل ور ا تعارف کا ورک فریم �ٹ ن
جم� �ی�نم� رسک مارکیٹ میں ر کردا کے رسک مارکیٹ
ہے۔ہمارا شامل رپورٹ ور ا نگرانی جائزہ، نشاندہی، میں ز اندا مربوط کی رسکس متعلق سے مارکیٹ میں
سے ز اندا شفاف ور ا منظم ہوئے رہتے میں فریم کے �ٹ ن
جم� �ی�نم� رسک پر طور مجموعی ہم کہ ہے یہ مقصد بنیادی
کریں۔ فراہم سہولت میں نمو کاروباری
کی دائیگیوں ا وقت ہر بینک کہ ہے بنانا یقینی کو امر اس مقصد کا ورک فریم �ٹ ن
جم� �ی�نم� رسک لیکویڈٹی کی بینک
لیکویڈٹی اپنی لیے کے نمٹنے سے خطرات ہوئے رہتے اندر کے حد اپنی ور ا ہو قابل کے داکرنے ا ری دا ذمہ
موجود ورک فریم کنٹرول ایک لیے کے کوسنبھالنے رسک سکے۔لیکویڈٹی کوسنبھال رسکس کے فنڈنگ ور ا
پروفائل ورمتوقع ا کوالٹی جو ہے گیا بنایا لیے کے رکھنے ر برقرا کو س ٹ
� یس�ی �ا لیکویڈ کے کوالٹی اعلی کو اس ور ا ہے
عمل، لائحہ جامع ایک ورStress Testing کا ا پالیسی لیکویڈٹی پاس کے بینک سکے۔ کر فراہم فنڈز لیے کے
ر برقرا وقت ہمہ کو لیکویڈٹی پر سطح ہر تاکہ ہے موجود نزم میکا کا نگرانی باقاعدہ لاگو ور ا عمل کا تعین کے حدود
سکے۔ جا رکھا
مجوزہ بفرزسمیت لاگو جوتمام ہے، ہوئے رکھے ر برقرا وقت ہمہ کو )CAR(ریشو ایڈیکویسی ل ٹ�ی� ک�ی�پ
بینک،
حامل کے ہے۔موزونیت پر بلندسطح سے تقاضوں ریگولیٹری تحت کے Basel-III Regulations
جاتا لیا جائزہ پر وں بنیاد سالانہ کا اس ور ا ہے واضح بڑا بھی ورک فریم )ICAAP( عمل کے جائزے اندرونی
ہے۔
موزوں ایک افعال ور ا امور کاروباری تمام کہ ہے گیا بنایا سے ز اندا اس ورک فریم �ٹ ن
جم� �ی�نم� رسک آپریشنل
ورک رہے۔فریم ر برقرا بھی سطح قبول قابل کی رسک ریزیڈیول ور ا پائیں انجام میں ماحول کے کنٹرول
جاتا چلایا ذریعے کے کار ہائے طریقہ ور ا پالیسیوں جامع مطابق کے لائنز گائیڈ ریگولیٹری اطلاق قابل کو
عمل پر سسٹم �ٹ ن
جم� �ی�نم� رسک آپریشنل موثر ایک نے بینک لیے کے بنانے مستحکم مزید کو ورک ہے۔فریم
ہے۔ کیا درآمد
33Annual Report 2020
ہے۔مشاہرے حامل کا ڈھانچے کے مشاہرے کے طرح دونوں عناصر، پذیر تغیر ور ا شدہ)فکسڈ( طے بینک
ہیں۔ ذیل درج خصوصیات نمایاں چند کی
)اگر ہے مشتمل پر الاؤنسز فکسڈ بیسڈ رول ور ا س ٹ
�ن
یم� �انکر سالانہ بشمول تنخواہ بنیادی ایک یہ مشاہرہ: فکسڈ
ہے۔ جاتا کیا دا ا نقد ور ہے ا ہوتا حامل کا بیشی کمی میں صورت کی کارکردگی مشاہرہ فکسڈ ہوں(۔
نفع کی یونٹ ی کاروبار متعلقہ کارکردگی، مجموعی کی بینک تعین کا اس مشاہرہ: پر بنیاد کی کارکردگی پذیر تغیر
کے مدت معینہ ور ا سالانہ میں مشاہرے ہے.ایسے تا جا کیا پر ر بنیا کی کارکردگی دی انفرا کی ملازم ور ا پذیری
ہیں۔ ہوتی شامل ترغیبات کی سیلز ور ا بونس
ئ
د�ی پر بنیاد کی ر ن
س�ٹ
یک� پر� موجود میں مارکیٹ مقامی ور ا پر بنیاد کی س تیک� کنٹر� دی انفرا کے ملازمین فوائد: یہ دیگر
انشورنس، لائف دائیگیاں، بازا یا الاؤنسز کے اخراجات جات، قرضہ لیے کے عملے میں ن ہیں۔ا جاتے
تغیر ہیں۔یہ شامل بونسز کے کرنے ن ا سائن یا شمولیت ہ علاو کے الاؤنسز کے منتقلی جگہ نئی ور ا کیئر میڈیکل
دیا مطابق کے پالیسیوں ریسورسز ہیومن میں صورتوں معمولی غیر صرف ور ا ہے جاتا سمجھا کاحصہ تنخواہ پذیر
ہے۔ جاتی کی اندر کے سے 12ماہ شمولیت میں بینک دائیگی ا کی ہے۔اس جاتا
دائیگی ا ایسی تاہم ہے۔ ہوتی حصہ کا تنخواہ پذیر تغیر کی ملازمین یہ :)Severance Pay( دائیگی ا حتمی
برطرفی ہ و چاہئے ہے جاتی کی میں صورت کی سبکدوشی سے ایل بی یو کی ن ا یا ریٹائرمنٹ صرف کو ملازمین
یا علیحدگی ریٹائرمنٹ، کی ملازم سے ایل بی یو یہ ور ا ہو میں صورت کی علیحدگی رضاکارانہ یا ہو میں صورت کی
ہے۔ ہوتی میں صورت کی ہونے ختم کنٹریکٹ
)MRCs(کنٹرولرز رسک میٹریل ور ٹیکرز)MRTs( ا رسک میٹریل
معیار کے MRT / MRC شدہ تفویض کو ملازمین مطابق کے اعمال بہترین ور ا اصولوں رہنما کے ضابطے
ور ا اختیار سطح موزوں ساتھ کے پہچان ایک عہدہ ور ا عمل بطور کو MRC ور ا MRTہے۔ گیا دیا ترتیب کو
شدہ طے کی ن ا ور ا ہے جاتا کیا اختیار ہی اندر کے ساخت تنظیمی کی رے دا ا ورMRCsکو ا ہے ہوتی انضباط
ہیں۔ ہوتی لائنز رپورٹنگ ور ا دی آزا موزوں
ٹیم �ٹ ن
جم� �ی�نم� ممبر و، ا ای سی ور ا صدر جیسے ہیں شامل بھی عہدے کے ن ا ور ا ملازمین میں MRT / MRC
اینڈ رسک انتظام، کاروباری ن، ممبرا کے کمیٹیوں اہم ہیں، کرتے رپورٹ کو و ا ای سی ور ا صدر راست براہ جو
ہ و میں MRT / MRCہیڈز۔ کنٹری کے شاخوں ملک بیرون سربراہ، کے امور اہم والے کنٹرولزکرنے
رسک، رسک، مارکیٹ کریڈٹ سے جانب کی بینک جو ہیں ہوتے شامل میں فیصلے جواہم ہیں شامل بھی ملازمین
ہیں۔ ہوتے ز اندا اثر پر بینک ور ا ہیں کرتے دہی انجام کی معاملات رسک کے ی�وڈیٹی یک� ل� ور ا رسک آپریشنل
ور ا رسک ور ا ہوئے بناتے یقینی کو تعلق باہمی سکورکارڈ، بیلنس risk-adjusted میں MRT / MRC
ور ا مالیاتی مختلف ہ علاو کے ہے۔اس جاتی کی پیمائش کی کارکردگی ہوئے کرتے استعمال کو زن توا میں رڈز ریوا
بندی ددرجہ ہر ہے۔ جاتا رکھا مدنظر بھی کو م عوا کے ردوبدل خطراتی ساتھ ساتھ کے ری مقدا مالیاتی، غیر
بنیاد کی ف اہدا ور ا مارکس بینچ موزوں کا جن ہیں ہوتے KPIs ور ا عوامل جہتی کثیر بشمول سکورکارڈ اندر کے
ریٹنگ میں MRT / MRC کر لے جائزہ کا کارکردگی پر بنیاد کی ردوبدل کے ہے۔خطرات جاتا لیا جائزہ پر
تو ہو رونما تبدیلی اہم کوئی میں حالات نظر زیر اگر ور ہے ا جاتا لیا جائزہ سال ہر کا کارڈز سکور ن ہے۔ا جاتی دی
ہے۔ جاتا لیا بھی جائزہ عبوری میں صورت اس
مشاہرے ورMRTs کے MRCs ا
ہیومن بھی تجویز کی اس ور ا ہے تا جا کیا تعین کا ساخت کی معاوضے یعنی مشاہرے ورMRTs میں MRCs ا
زن توا موزوں ایک میں تنخواہ ورفکسڈ ا زدہ تغیر ن دورا کے عمل اس ور ا ہے کرتا ڈیپارٹمنٹ ریسورسز
مالیاتی غیر ور ا مالیاتی ساتھ ساتھ کے ریوں دا ذمہ ور ا ر کردا عہدے، کے ملازم میں ضمن ہے۔اس جاتا رکھا
میں اجرت کی MRTsور ا MRCsہے۔ تا جا لایا غور زیر بھی کو کارکردگی مدمقابل کے KPIsور ا مقاصد
پالیسی مشاہرہ لیے کے ملازمین تمام بینک کے کہ جیسا ہے جاتا رکھا نظر پیش کو عناصر دونوں پذیر تغیر ور ا فکسڈ
ہے۔ ہوتی ساخت کی
ہیں۔ ہوتے شامل ہوں( )اگر الاؤنسز مقررہ پر بنیاد کی ر کردا ور ا س ٹ
�ن
یم� �انکر تنخواہ، بنیادی میں تنخوا فکسڈ
جاتا کیا استعمال ڈیٹاکو کے مارکیٹ بیرونی میں جس ہے کرتا تعین کا کلید موزوں ایک شعبہ کا ریسورسز ہیومن
وابستگی اپنی سے ایل بی یو ہ و کہ سکے جا بنایا ورموزوں ا کشش پر اتنا لیے کے ملازمین کو معاوضے فکسڈ تاکہ ہے
رکھیں۔ قائم
ہے۔ ہوتا لیے کے ملازمین دیگر کے بینک کہ جیسا ہے ہوتا منسلک سے کارکردگی معاوضہ پذیر تغیر
اندرونی یا آڈٹ مسائل، متعلق سے کسٹمر کرنے، سامنا کا خطرات ضروری کمی،غیر میں کارکردگی مالیاتی
ہے۔. سکتی جا کی کمی میں سکور کے ملازم میں عناصر کے موثریت عدم کی پلائنس کم� ور ا انضباط
)Deferral Mechanism(کار طریقہ ء کا التوا
گا جائے لیا روک لیے کے ت مد شدہ طے کو ر مقدا کی �ن ش
یس س�ن� کم�پ
پذیر تغیر ایک کی MRCs ور ا MRTs
گا۔ جائے کیا دا ا پیشگی کو �ن ش
یس س�ن� کم�پ
باقی کہ جب
یہ کہ ہے دینا تقویت کو بات اس ور ا لانا زن توا میں مفادات کے ہولڈرز اسٹیک ور ا ملازمین مقصد کا اس
میں حد %40کی %25سے شرح کی مشاہرہ ء التوا زیر ہو۔ منسلک سے کارکردگی ر پائیدا مدتی طویل �ن ش
یس س�ن� کم�پ
ن دورا کے معیاد التوائی ور ا ہے تی ہو سال تین معیاد التوائی کی MRCsور ا MRTs تمام کہ جب ہے ہوتی
گی۔ ہو دا ا پر تفویض گی،جو جائے کی دا ا پر طور متناسب میں اقساط سالانہ
)Risk Management Framework) ورک فریم مینجمنٹ رسک ہے: مشتعل پر شعبوں ذیل درج پالیسی کریڈٹ اینڈ رسک کی ایل بی یو
رسک کا روں دا ا مالیاتی ور ا ای ایم کارپوریٹ، کمرشل، ایس •
رسک انٹرنیشنل •
کریڈٹ کنزیومر •
رسک انٹرپرائز •
Baselرسک، اینڈ ٹریژری اینڈ مارکیٹ •
رسک آپریشنل •�ٹ
نجم� �ی�
نم� وینڈور •
ی�ورٹی یک� س� انفارمیشن •
ریسرچ اینڈ پالیسی • کریڈٹ
ہیں متحرک کمیٹیاں ذیل درج لیے کے گورننس رسک کی بینک
کمیٹی �ٹ ن
جم� �ی�نم� رسک اینڈ آپریشنل 1۔
کمیٹی ریویو فولیو پورٹ 2۔
کمیٹی سٹیئرنگ ی�ورٹی یک� س� انفارمیشن 3۔
انٹارنیشنل ریویو کمیٹی ایل پی این 4۔
ن ممبرا کہ جب ور ا ہیں کرتے و ا ای سی ور ا صدر کے بینک سربراہی کے کمیٹی مینجمنٹ وررسک ا آپریشنل
کمیٹی مینجمنٹ رسک ہیں۔ شامل سربراہ کے شعبوں تمام آپریشنزکے ور ا ورفنانس ا کاروباری رسک، میں
United Bank Limited34

)Meeting of the Board) اجلاس کے بورڈ ہونے ن دورا کے سال ہوئے۔ منعقد اجلاس )6( چھ کے ڈائریکٹرز آف بورڈ ن دورا کے سال جائزہ زیر
ہے: ذیل درج د تعدا کی حاضری کی ڈائریکٹر ہر میں اجلاس والے
میں اجلاس حاضری
عہدہ نام کا ڈائریکٹر
6 چیئرمین پاکستان پرویز،OBE، ہلال انور سرمحمد
6 ڈائریکٹر چوہدری،CBE،ستارہ امتیاز )پاکستان( ایم ضمیر جناب
6 ڈائریکٹر چوہدری ضمیر حیدر جناب
6 ڈائریکٹر پرویز ن رضوا جناب
6 ڈائریکٹر میر احمد رشد ا جناب
4 ڈائریکٹر شیروانی ے ا خالد جناب
ہوئے( مستعفی )5اگست2020کو
6 ڈائریکٹر خان ظفر عامر جناب
6 ڈائریکٹر رشید طارق جناب
- ڈائریکٹر سید شازیہ محترمہ
ہوا( نہیں اجلاس بعدکوئی کے سنبھالنے ) عہدہ
2 ورچیف ا پریزیڈنٹ
آفیسر ایگزیکٹو
کامل سیما محترمہ
ہوئیں( سبکدوش )30جون2020کو
3 ورچیف ا پریذیڈنٹ
آفیسر ایگزیکٹو
د دا جی د شہزا جناب
کی( اختیار شمولیت )16جولائی2020کو
)Pattern of Shareholding) پیٹرن ہولڈنگ شیر ہے: دیاگیا میں ذیل پیٹرن ہولڈنگ شیئر مطابق 31دسمبر2020 کے
فیصد کا ز شیئر آرڈنری د تعدا کی شیئرز ہولڈرز شیئر
61.48% 752,569,602 )BG(گروپ ے بیسٹ و
27.49% 336,618,325 دیگر ور ا الناس م عوا
2.12% 26,004,716 NBFIsور کس،DFIsان
ج�ی� �
5.48% 67,048,735 کمپنیاں انشورنس
3.35% 40,967,484 فنڈز ورمیوچل ا مضاربہ
0.08% 969,111 شیئرز( ووٹنگ انٹرنیشنل GDRs)نان
0.00% 1,714 پاکستان آف کمیشن پرائیویٹائزیشن
100.00% 1,224,179,687 شیئرز اسٹینڈنگ ؤٹ آ مجموعی
رپورٹ کی ڈائریکٹرز کو ارکان
شیئرز: مجموعی موجود میں تحویل کی ذیل درج
د تعدا کی شیئرز
پارٹیاں ورمتعلقہ ا جات کمپنیاں،معاہدہ منسلک )a
631,728,895 ے )ہولڈنگز( لمیٹڈ* بیسٹ و
93,649,744 لمیٹڈ سیمنٹ ے بیسٹ و
40,967,484 فنڈز** ورمیوچل ا مضاربہ )b
آفیسر *** ایگزیکٹو چیف ور ا ز c( ڈائریکٹر
12,765,368 پاکستان پرویز OBE، ہلال انور سرمحمد
2,403,870 چوہدری،CBE،ستارہ امتیاز )پاکستان( ایم ضمیر جناب
2,000,000 چوہدری ضمیر حیدر جناب
129,500 پرویز ن رضوا جناب
2,500 میر احمد رشد ا جناب
2,500 خان ظفر عامر جناب
2,500 رشید طارق جناب
668,902 ایگزیکٹوز )d
118,628 ورکارپوریشنز ا کمپنیاں سیکٹر پبلک )e
93,053,451 کمپنیاں ورانشورنس کس، DFIs، NBFIs ان
ج�ی� �)f
ہے۔ شدہ قائم میں جوبرطانیہ ہے رہ دا ا کاذیلی ے )ہونگز( لمیٹڈ بیسٹ و * بینک
ہیں۔ منسلک ساتھ کے یگ�ریز �ٹ
� ک�یکی ہولڈرز شیئر تفصیلات نام بالحاظ فنڈز ورمیوچل ا ** مضاربہ
ہیں۔ نہیں شیئرز کوئی میں تحویل کی بچوں عمر ورنو ا حیات شریک ور CEO کے / کی ا ز ڈائریکٹر کی *** بینک
فیصد د تعدا کی شیئرز والے رکھنے حقوق کے ووٹنگ زائد یا 5 فیصد
ہولڈر شیئر
51.60% 631,728,895 ے)ہولڈنگز( لمیٹڈ بیسٹ و
7.65% 93,649,744 لمیٹڈ سیمنٹ ے بیسٹ و
نوعمر ور ا حیات شریک /کی کے ن ورا ایگزیکٹیوزا ڈائریکٹرز، کے جواس خریدوفروخت، کی شیئرز کی ایل بی یو
ہے۔ منسلک ہمراہ کے ہولڈنگ شیئر آف گئی، پیٹرن کی سے طرف کی بچوں
)Shariah Board) بورڈ شریعہ جنہیں ہیں جاتی ظاہرکی میں رپورٹ ڈائریکٹرز تفصیلات مطلوبہ متعلق سے ن ممبرا کے اس ور بورڈا شریعہ
ہے۔ گیا کیا شامل میں رپورٹ بورڈکی شریعہ پر طور کے حصے ایک کے رپورٹ سالانہ
)Remuneration Framework) ورک فریم کا مشاہرے ہے ہوئی کی نافذ پالیسی جامع ایک کی مشارہرے نے ایل بی یو ساتھ کے ری پاسدا کی لائنز گائیڈ ریگولیٹری
ضابطہ جو ہو بخش صلہ ور ا ریت برقرا کشش، مشاہرہ لیے کے د افرا حامل کے صلاحیت بہترین میں بینک تاکہ
لائحہ کے مشاہرے ہو۔ آہنگ ہم سے مقاصد تزویراتی مجموعی کی بینک ور ا ری پاسدا کی اصولوں رہنما کے
risk appetite کی بینک ور ا اندر کے بینک کہ جو ہے بنانا ر ش ئ
مو� کو مینجمنٹ رسک عنصر کلیدی ایک کا عمل
ہو۔ مطابق کے
لیں، جائزہ کا عمل لائحہ کے مشاہرے ہ و کہ ہے ری دا ذمہ مجموعی یہ کی ڈئریکٹرز آف بورڈ کے ایل بی یو
ور ا ریسورسز ہیومن بورڈ کے ایل بی یو بنیاد کی جس کرائیں درآمد عمل پر اس ور ا کریں نگرانی دیں، منظوری
گی۔ ں ہو کردہ تجویز کمیٹی )HRCC( کی �ن ش
یس س�ن� کم�پ
35Annual Report 2020

ن ا میں جس ہے ہوتا کرنا نامزدگی کی ڈائریکٹرز ری دا ذمہ بنیادی کی کمیٹی کمیٹی )BNC(: اس �ن ش
یس �ن
م�ی�نو بورڈ
ساخت، طور مجموعی کمیٹی ہے۔یہ شامل احاطہ کا تجربے ور ا علم مہارتوں، منظر، پس تعلیمی تعارف، مختصر کے
ر دا ذمہ بھی کی کرنے پیش تجاویز اپنی کو بورڈ میں ضمن اس ور ا لینے جائزہ کا تشکیل کی ورکمیٹیوں ا بورڈ ور ا سائز
ور ا ہے ر دا ذمہ بھی کی کرنے پیش کو کمیٹیوں ذیلی ور ا کو بورڈ تجویز کی کرنے پر اسامیاں جزووقتی کمیٹی یہ ہے۔
ہے۔ شامل میں فرائض کے اس بھی نگرانی کی قدرپیمائی کی بورڈ سالانہ مطابق کے تقاضوں کے ضابطے
)Directors Appointment and Nomination)نامزدگی اور تقرری کی ڈائریکٹرز بینک کے ڈائریکٹرز کا انتخاب شیئر ہولڈرز کرتے ہیں جب کہ جز وقتی اسامیاں ڈائریکٹرز ہی پر کرتے ہیں جس
ڈائریکٹر ہر زیں ا ہ ہے۔علاو جاتا رکھا خیال کا ضوابط ور ا قوانین لاگو تمام ور ا ایشن ایسوسی آف آرٹیکلز میں
ہے۔ ہوتا کرنا ٹیسٹ” پاس موزوں ور ا مطابق “لائق کے معیار کردہ طے کے پاکستان آف بینک اسٹیٹ کو
تجربہ، متنوع کا جن ہیں شامل ن ممبرا ہ و میں بورڈ کہ ہے جاتا بنایا یقینی یہ وقت کے تقرری کی ڈائریکٹر کسی
ہے موجود قابلیت ور ا شہرت متعلق سے آپریشن بینک مجموعے، کے مہارتیں ترین موزوں علم، موزوں
نان پر طور بورڈموزوں کہ ہے جاتی بنائی یقینی بھی بات یہ سکے۔ ہو تشکیل کی رے دا سازا فیصلہ ر ش ئ
مو� سے جس
پورا پر تقاضوں کے ضابطوں ور ا قوانین اطلاق قابل کہ جو ہے مشتمل پر ن ممبرا خاتون ور ا د آزا ایگزیکٹیوز،
ہے۔ نہیں ؤ ٹکرا کوئی کا مفادات ذاتی کے ن ا ور ا ہے شامل د تعدا کی ن بورڈممبرا میں جن ہیں اترتے
د ہے۔آزا تا جا بنایا یقینی کو ر کردا فعال کے ڈائریکٹرز د آزا لیے کے بڑھانے کو موثریت پر طور مجموعی کی بورڈ
سے سختی کی ضوابط ور ا رولز دفعات، قانونی اطلاق قابل ہوئے کرتے تقرری ور ا انتخاب کے ڈائریکٹرز
جاتا کیا لیے کے اظہار کے ر کردا منصفانہ کے ن ا ور ا شفافیت انتخاب کا ڈائریکٹرز د ہے۔آزا جاتی کی ری پاسدا
کرسکیں۔ فیصلے دانہ آزا میں مفاد کے بینک ہ و تاکہ ہے
یا بورڈ ور ا حیثیت کی ن ا مع تجربہ کاعملی قابلیت، مہارت، ماضی تعلیمی کی ن ا بشمول تعارف مختصر کا ڈائریکٹر ہر
حصہ کا رپورٹ سالانہ میں پروفائل کی ڈائرکٹرز کچھ رکنیت، سبھی کی ن ا طورڈمیں شریعہ کے کمپنی دوسری کسی
ہے۔ گیا بنایا
)Board Performance Evaluation) جائزہ کا کارکردگی کی بورڈ کی تقاضوں کے نمبر11مورخہ22اگست2016 BPRDسرکلر کے بورڈ پاکستان آف بینک اسٹیٹ
کے ہے، جس جاتا لیا جائزہ کا کمیٹیوں کی اس ور ا بورڈ تحت کے عمل ضابطہ شدہ منظور لیے کے کرنے ری پاسدا
ہیں۔ دی ے د منظوری SECPنے کی جس ہیں گئی کی حاصل خدمات کی رے دا ا د آزا ایک لیے
اس کے بورڈ کی بطور مجموعی کارکردگی کے باضابطہ پروسس کی قدرپیمائی کے لیے اس کی کمیٹیاں تشکیل دی گئی
پاکستان آف کمیشن ایکسچینج اینڈ ی�ورٹیز یک� س� کہ جیسا ہے گیا کیا درآمد عمل ور ا کے رے دا ا د آزا بیرونی ور ہیں۔ا
گیا۔ کیا مشغول دی، انہیں منظوری نے
بورڈ کے کر حاصل خدمات کی گورننس کارپوریٹ فار ٹیوٹ انسٹی پاکستان تحت کے کار طریقہ شدہ منظور
سی ور ا صدر ساتھ ساتھ کے ڈائریکٹرز د آزا بشمول ڈائریکٹرز ایگزیکٹیو نان چیئرمین، کمیٹیوں، ذیلی کی وراس ا
گا۔ جائے لیا بھی جائزہ کا کارکردگی مجموعی وکی ا ای
)Compensation of Directors) معاوضہ کا ڈائریکٹرز بشمول ڈائریکٹرز میں اجلاس 216ویں اپنے 2اگست2018کو نے ڈائریکٹرز آف بورڈ کے ایل بی یو
معاوضہ لیے کے شرکت میں اجلاسوں کے کمیٹیوں بورڈ ور ا ہو شریک میں اجلاس کے بورڈ چیئرمین،جو
اجلاسوں کے بورڈ میں دستاویز تھی۔اس دی منظوری کی پیکیج جامع ایک لیے کے دائیگی ا کی مشاہرے یا
ہولڈرز شیئر 28مارچ2019کو منظوری کی پالیسی ہے۔اس گیا کیا بھی احاطہ کا اخراجات دیگر متعلق سے
سرکلر کے پاکستان آف بینک اسٹیٹ کردہ جاری گئی۔17اگست2019کو دی میں عام اجلاس سالانہ کے
منظوری کی پالیسی مشاہرہ کی ڈائریکٹرز نے بورڈ میں روشنی لائنزکی گائیڈ کردہ فراہم تحت نمبر03کے
ایگزیکٹیو نان سمیت چیئرمین تحت کے پالیسی دی۔اس میں اجلاس والے ہونے منعقد 2020کو 19فروری
اجلاس کے کمیٹیوں ور ا اجلاس فی روپے 750,000 میں صورت کی شرکت میں اجلاس کے ڈائریکٹرزبورڈ
کے فیس گے۔اجلاس ہوں اہل کے لینے معاوضہ اجلاس فی روپے 750,000 میں صورت کی شرکت میں
گا۔پالیسی ہو بھی اہل کا معاوضہ 20فیصد اضافی کے فیس کی اجلاس بورڈ سے وجہ کی عہدہ اس چیئرمین ہ علاو
پالیسی گے۔اس جائیں دیے بھی الاؤنس یومیہ ساتھ ساتھ کے اخراجات رہائشی ور ا س ٹ
جسک� �لا سفری، میں
منظورکیا۔ نے ہولڈرز شیئر میں عام اجلاس سالانہ والے ہونے منعقد کو25مارچ2020کو
ہیں۔ درج نوٹ40میں کے رے گوشوا مالیاتی مجتمع غیر تفصیلات کی معاوضہ کے ڈائریکٹرز 2020میں
اجلاس کے کمیٹیوں بورڈ والے کرنے شرکت میں اجلاس ور ا د تعدا کی اجلاسوں کے کمیٹیوں بورڈ والے ہونے منعقد ن دورا کے سال
ہے۔ ذیل درج د تعدا کی ڈائریکٹرز
BNC BITC HRCCBRCC BAC
3 4 4 4 4 د تعدا کی اجلاسوں منعقدہ
د تعدا کی والوں کرنے شرکت میں اجلاس
3 - 1 - - پرویز،OBE، ہلال پاکستان انور محمد سر
3 - - 4 - چوہدری،CBE، ستارہ امتیاز )پاکستان( ایم ضمیر لارڈ
- 4 - - 4 چوہدری ضمیر حیدر جناب
- - 1 - 4 پرویز ن رضوا جناب
3 - 4 4 - میر احمد رشد ا جناب
- - 3 - 3 شیروانی* ے ا خالد جناب
- - 3 - 3 خان ظفر عامر جناب
- 4 1 - 1 طارق رشید جناب
- 2 - 2 - کامل** سیما محترمہ
- 2 - 2 - دا*** دا جی د شہزا جناب
گئے ہو مستعفی * 5اگست 2020کو
ہوئی ختم مدت ** 30جون2020کو
کی اختیار شمولیت *** 16جولائی2020کو
�ٹ ن
بینوول�ی� فنڈ، پنشن فنڈ، گریجویٹی فنڈ، پروویڈنٹ میں جن ہے چلاتا اسکیمیں ریٹائرمنٹ شدہ فنڈ پانچ بینک
آڈٹ ترین بنیادتازہ کی �وں ت
مال�ی� لیے کے کاری سرمایہ میں فنڈز ن ہیں۔ا شامل فنڈ پروویڈنٹ جنرل ور ا فنڈ
ہیں: ذیل درج تحت کہ 31دسمبر2019کے جو ہیں رے گوشوا مالیاتی شدہ
Rupees in ‘000
3,842,241 فنڈ ؤیڈنٹ پرا کا ملازمین
793,390 فنڈ گریجویٹی کا ملازمین
8,557,720 فنڈ پنشن اسٹاف
788,247 فنڈ ؤیڈنٹ پرا جنرل اسٹاف
317,976 فنڈ �ٹ ن
بینوول�ی� ز آفیسر آفیسرز / نان
United Bank Limited36

ہے۔ منسلک ساتھ کے روں گوشوا مالیاتی مجتمع غیر ن ا جھلکیاں کی کارکردگی کی • گزشتہ 6 سالوں
ہے۔ چکا جا کیا منتقل میں منافع Statutory ریزرو کا روپے رب لئے2.1ا سال2020کے •
آف کوڈ تشکیل کی ہے۔بورڈ مشتمل پر ممبر ایک )1(خاتون ور ا آٹھ )8( حضرات ڈائریکٹرز آف بورڈ •
ہیں۔ گئی دی ور 2میں نمبر 1ا ف پیراگرا کے اسٹیٹمنٹ کی تعمیل ساتھ کے گورننس کارپوریٹ
کی کمیٹیز سب کی اس ور ا بورڈ مطابق کے معمولات بہترین ور ا ورک فریم ریگولیٹری اطلاق قابل •
ہیں۔ گئی کی حاصل خدمات کی کنسلٹنٹ بیرونی ف معرو ایک لیے کے تجزیے کے کارکردگی
آف منٹ سٹیٹ ساتھ کے گورننس کارپوریٹ آف کوڈ تفصیلات کی م پروگرا تربیتی کے ڈائریکٹرز •
ہے۔ گیا دیا پلائنس میں کم�
لیے کے شرکت میں اجلاسوں کے کمیٹیوں بورڈ ور ا بورڈ ڈائریکٹرز د آزا بشمول ڈائریکٹرز ایگزیکٹیو نان •
ہوں اہل کے کرنے وصول اخراجات لاجسٹک ور ا فیس کردہ منظور سے جانب کی ڈائریکٹرز آف بورڈ
گیا بنایا حصہ کا ایجنڈے کے اجلاس عام سالانہ کو فیس والی جانے کی دا ا کو ڈائریکٹرز ن ا ں برا گے۔مزید
جاسکے۔ کی حاصل منظوری �و ٹ
یک� ف� پوسٹ سے ن را دا حصہ تاکہ ہے
ہے: گیا کیا تعین کا ریفرنس آف ٹرمز کے جن ہیں دی تشکیل ذیل 5 کمیٹیاں درج نے بورڈ •
)BAC) کمیٹی آڈٹ بورڈ سید چیئرپرسن شازیہ محترمہ
ممبر چوہدری ضمیر حیدر جناب
ممبر پرویز ن رضوا جناب
سیکرٹری ناصر احمد عقیل جناب
)BRCC) کمیٹی لائنس پ م� ک اینڈ رسک بورڈ میر چیئرمین احمد رشد ا جناب
چوہدری، CBE، ستارہ امتیاز)پاکستان( ممبر ایم لارڈضمیر
سید ممبر شازیہ محترمہ
ممبر دا دا جی د جناب شہزا
سیکرٹری سرور ن عمرا جناب
)HRCC) کمیٹی �ن ش
یس س�ن� کم�پ
اینڈ ریسورس ہیومن بورڈ رشید چیئرمین طارق جناب
پرویزOBE، ہلال پاکستان ممبر انور محمد سر
ممبر میر احمد رشد ا جناب
پرویز ممبر ن رضوا جناب
سعید سیکرٹری سعدیہ محترمہ
)BITC)کمیٹی ٹی آئی بورڈ رشید چیئرمین طارق جناب
ممبر چوہدری، CBE، ستارہ امتیاز)پاکستان( ایم لارڈضمیر
چوہدری ممبر ضمیر حیدر جناب
دا ممبر دا جی د شہزا جناب
انور سیکرٹری محمدفیصل جناب
رپورٹ کی ڈائریکٹرز کو ارکان
)BNC)کمیٹی �ن ش
�یسن
�ی� منو بورڈ
پرویز، OBE، ہلال پاکستان چیئرمین انور محمد سر
چوہدری، CBE، ستارہ امتیاز)پاکستان( ممبر ایم لارڈضمیر
میر ممبر احمد رشد ا جناب
ناصر سیکرٹری احمد عقیل جناب
ہے۔ جاتا کیا پیش میں ذیل درج ہے مطابق کے ریفرنس آف ٹرمز کہ جو خلاصہ کا افعال کے کمیٹیوں تمام
پروسس آڈٹ پروسس، رپورٹنگ مالیاتی سرگرمی، بنیادی کی کمیٹی بورڈآڈٹ :)BAC(کمیٹی آڈٹ بورڈ
کرنا پیش جائزہ اپنا میں بارے کے ری پاسدا کی ضابطوں و قانون ور ا نظام کے انضباط اندرونی ساتھ ساتھ کے
کمیٹی یہ ہے۔ لیتی جائزہ ساتھ کے آڈیٹرز اندرونی ساتھ ساتھ کے انتظامیہ بینک کا نتائج کے آڈٹس کمیٹی ہے۔
بناتی یقینی ور ا ہے لیتی جائزہ بھی کا وسعتوں کی کار طریقہ ور ا ورک فریم پلان، رپورٹنگ انضباط، آڈٹ اندرونی
تعینات پر طور موزوں کو ن ا میں بینک ور ا ہیں وسائل موزوں پاس کے ڈیپارٹمنٹ آڈٹ اندرونی کہ ہے
ہے لیتی جائزہ ور ا نگرانی بھی کی سسٹم کے )ICFR(کنٹرولز اندرونی کے رپورٹنگ مالیاتی کمیٹی ہے۔ کیاگیا
جائے۔ کیا ردوبدل ضرورت حسب ور ا جائے درآمدکیا عمل پرموثر اس تاکہ
ورک فریم کے �ٹ ن
جم� �ی�نم� رسک میں بینک پر طور مجموعی کمیٹی یہ :)BRCC( کمیٹی پلائنس کم� اینڈ رسک بورڈ
�ٹ ن
جم� �ی�نم� رسک لیے کے نمٹنے سے خطرات میں نامے منظر معاشی ہوئے بدلتے ور ا ہے ر دا ذمہ کی تشکیل کی
امور کے �ٹ ن
جم� �ی�نم� رسک میں بینک پر طور مجموعی کمیٹی ہے۔یہ بناتی یقینی کو موثریت ور ا قدرپیمائی کی پالیسیوں
کریڈٹ ور ا رسک کریڈٹ رسک، مارکیٹ ور ا ٹریژری ،Basel رسک، آپریشنل ور ا ہے کرتی نگرانی کی
زیں ا ہ علاو ہے۔ بناتی یقینی کو پلائنس کم� ساتھ کے پالیسیوں �ٹ ن
جم� �ی�نم� رسک مختلف ذریعے کے افعال کے پالیسی
روک موئر کی جرائم مالیاتی تاکہ ہے کرتی بھی نگرانی کی ہونے موثر کے اقدامات کے �ٹ ن
جم� �ی�نم� رسک کمیٹی
سکے جا بنایا یقینی کو ری پاسدا کی تقاضوں کے ضاابطوں سے حوالے کے خطرات لیے کے تھام
معاوضے و مشاہرے میں بینک پر طور مجموعی کمیٹی یہ :)HRCC( کمیٹی �ن ش
یس س�ن� کم�پ
اینڈ ریسورسز ہیومن بورڈ
کے ضابطوں پالیسیاں کہ ہے بناتی یقینی کو بات اس ور ا ہے ر دا ذمہ کی ترتیب کی پالیسیوں ور ا کار طریقہ کے
کا اجرتوں یا مشاہرے میں بینک پر طور مجموعی میں ریوں دا ذمہ کی ہوں۔کمیٹی مطابق عین کے تقاضوں
،)MRCs(کنٹرولرز رسک میٹریل ور ا )MRTs(ٹیکرز رسک ی�ریل �ٹم�ی� بشمول فوائد ساختیاتی ور ا لینا جائزہ
ہے۔ کرنا پیش سفارشات کو بورڈ کی پالیسیوں �ٹ ن
جم� �ی�نم� ریسورس ساتھ ہیومن ساتھ کے قوت دی افرا
تعین کے مشاہروں کے ن ممبرا کے انتظامیہ اعلی ور ا ڈائریکٹرز ایگزیکٹیو نان ور ا ایگزیکٹیوز ڈائریکٹرز، کمیٹی یہ
ریگولیٹری موجودہ کہ جو ہے ر دا ذمہ بھی کی ترغیب کی کرنے مرتب ورک فریم پالیسی ایک کو بورڈ لیے کے
ہوں۔ مطابق کے لائنز گائیڈ
فراہم ورک فریم کا گورننس ر ش ئ
مو� ایسی ہ و کہ ہے ر دا ذمہ کی امر اس کمیٹی یہ :)BITC( کمیٹی ٹی آٹی بورڈ
قابل کے کرنے حاصل کو مقاصد ور ا عملیوں حکمت کی بینک امورکو متعلق سے ٹیکنالوجی بینک کے جو کرے
ے د ترتیب طرح اس کو ر ن
ی� ج� �ٹ ی� اسٹر� �ٹ
نجم� �ی�
نم� رسک ہ و کہ ہے ر دا ذمہ کی بات اس کمیٹی ہ علاو کے بنائے۔اس
م انصرا و انتظام کا رسکس ی�ورٹی یک� س� سائبر ور ا رسک ٹیکنالوجی انفارمیشن کے بینک ور ا کرائے درآمد عمل ور ا
جاسکے۔ کیا پیش حل موثر کا خطرات ممکنہ بھی کسی کہ کرے
37Annual Report 2020

اضافہ 7فیصد فولیومیں پورٹ �ٹ ن
م�ٹ یس� انو� کے ہے۔بینک پرخسارہ �ٹ
نم�
ٹ یس� انو� وجہ بنیادی کی ریورسل(،اس
میں ڈیپازٹس میں مقابلہ ہے۔دسمبر2019کے ہوا اضافہ 30فیصد میں ایڈوانسز فعال ہے،جبکہ ہوا
ہے۔ ہوا 30فیصداضافہ
پر طور بنیادی ریوینیوز کے ہے۔اس رہ دا ا ذیلی ملکیتی کا ایل بی یو پر طور مکمل جی ے ا سوئٹزرلینڈ ایل بی یو
قبل کا لینڈ سوئٹزر ایل بی یو سال2020میں ہیں۔ ہوتے حاصل سے کاروبار کے روں دا ا مالیاتی ور ا تجارت
کی سال ہے۔گزشتہ کم نسبت60فیصد کی 2019 سال گزشتہ جو رہا فرانک سوئس منافع1.1ملین زٹیکس ا
کی کمیشن ہے۔ ہوئی کمی 27فیصد میں آمدنی اپ مارک نان جبکہ ہوئی فیصدکمی آمدنی7 اپ مارک نیٹ نسبت
بیلنس ہے۔ روی سست باعث کے وباء وجہ بڑی کی جس ہے ہوئی 27فیصدکمی سال بہ سال میں آمدنی میں مد
ہوگیا۔ میں 38فیصدکم مقابلہ دسمبر 2019کے حجم سالانہ شیٹ کا
نے UBL FM ہے۔ فیصد ملکیت98.9 کی ایل یوبی میں )UBLFM(پاکستان لمیٹڈ، منیجرز فنڈ ایل بی یو
سال ہے۔ نمو سال بہ سال کہ23فیصدکی جو کیا ریکارڈ منافع ٹیکس ز ا قبل روپے 454ملین سال2020میں
رب تھے )2019میں 63ا روپےکے فنڈز رب پاس90ا کے مینجمنٹ پرUBL FM کی اختتام 2020کے
روپے(۔
ایل بی یو ملکیت مکمل کی اس ور ا آیا میں عمل 2012میں قیام کا ایل( ٹی بی لمیٹڈ)یو بینک)تنزانیہ( ایل بی یو
ری خریدا کی ر ن
ی� �ٹیل� ج� �
ئلا� ور ا اثاثوں کے )EXIM( تنزانیہ)لمیٹڈ( بینک ایگزم کا ایل ٹی بی تھی۔یو پاس کے
نومبر یکم کنٹرول کا ر ن
ی� �ٹیل� ج� �
ئلا� ور ا اثاثوں کے ایل ٹی بی یو نے بینک ایگزم ور ا سمجھوتا22مئی2019کوہوا کا
ور ا سمیٹنے کاروبار پر طور رضاکارانہ ور ا دیا کر بند کو آپریشنز بینکنگ اپنے نے ایل ٹی بی یو لیا۔ لے 2019کو
رہ( گوشوا نوٹ9.13 مالیاتی ہے۔ )بحوالہ ف مصرو میں عمل کے ی�وڈیشن یک� ل�
غیرمندرج 1965کوایک میں ٹی(پاکستان ای )یو پاکستان لمیٹڈ کمپنی ٹرسٹی اینڈ ایگزیکیوٹرز یونائیٹڈ
رہ دا ا ذیلی ایک میں ملکیت کی ایل بی پریو طور مکمل یہ ور ا گئی کی قائم کمپنی لمیٹڈ پبلک )Unlisted(
کی کرنے ختم کو کمپنی میں اجلاس اپنے منعقدہ 19فروری2020میں ڈائریکٹرزنے آف بورڈ کے ہے۔اس
ہوگا۔ نہیں اثر کوئی کا اس پر منافع مجموعی کے بینک ور ا ہے فعال غیر تھی۔کمپنی کی منظور د ردا قرا
)Credit Rating) ریٹنگ کریڈٹ ی
ٹ ی� �ٹ�
نی� ا� کی )UBL( لمیٹڈ کویونائیٹڈبینک جون2020 29 نے )VIS(لمیٹڈ کمپنی ریٹنگ کریڈٹ VIS
اضافی کی ایل بی زیں، یو ا ہ ہے۔علاو کی توثیق پلس( کی ون ے ے / ا ا )ٹرپل ’’AAA/A-1+’’ ،رن
گ�ن
�ٹ
ی� ر�
کردہ تفویض ہے۔ کی توثیق پر طور پلس(کے ے ا بھی “+AA”)ڈبل کی سی ایف ر۔ADT-1(1(ٹی ئ ی
ٹ�
ہیں۔ مستحکم پرتوقعات ر ن
گ�ن
�ٹ
ی� ر�
)Awards and Recognition) اعترافات اور ایوارڈز ٹائمز فنانشل ہے۔بینکر گیا کیا تسلیم پر طور ‘‘کے بینک بہترین 2020کا سال “ میں رڈز ایوا بینکر کو ایل بی یو
ایک انڈسٹری بینکنگ عالمی ہے۔یہ جریدہ مالیاتی نمایاں ایک کا بھر دنیا ور ا ہے شدہ الحاق سے یو۔کے
میں سوسائٹی ور ا اضافہ،جدت قدرمیں لیے کے صارف ور ا کارکردگی اعلی رڈز زایوا ہے۔بینکر ز معتبراعزا
میں،پاکستان حالات معمولی غیر ن، دورا کے وباء حالیہ میں، انڈسٹری بینکنگ ہیں۔مقامی ف اعترا کا قیادت
یہ بار چوتھی نے ایل بی یو باعث کے جدت ور ا ی �جٹ ی� �
اسٹر بنیادی جیسی دینے وسعت میں خدمات مالیاتی میں
ہے۔ جیتا رڈ ایوا
بہترین کا پاکستان سے طرف کی ایٹ،ایشامنی سی ایسو ایک کے یورومنی کو ایل بی ن،یو دورا 2020کے سال
ذریعے چینلزکے ڈیجیٹل میں پاکستان رڈدراصل ایوا ہے۔یہ گیا دیا ر سال2020قرا برائے بینک ڈیجیٹل
ہے۔ سند ایک کی شراکت کی ایل بی یو میں جدت میں بینکاری ور ا اضافہ کے وسعتوں مالیاتی
ہے۔اس دیاگیا ر بینک ‘‘ قرا ڈیجیٹل سال 2020کا “ بہترین سے طرف کی رڈز ایوا بینکنگ پاکستان کو ایل بی یو
جدت سے بہت ور ا کیں پیش پروڈکٹس مبنی پر ٹیکنالوجی جدید سی بہت کو صارفین اپنے نے ایل بی یو سال
مستحکم میں بینکوں مبنی پر جدت ور ا یافتہ ترقی نمایاں کے پاکستان پوزیشن کی ایل بی یو سے رڈ کیے۔ایوا کام آمیز
ہے۔ ہوئی
)Future Outlook) توقعات کی مستقبل نہایت ہیں۔جسے کیے مرتب اثرات نمایاں بھی پر معیشت عالمی ساتھ کے ک
ٹیس� ڈوم� نے کوویڈ۔19وباء
ملک ایل یوبی ہے۔ حامل کا اہمیت بہت رکھنا ر برقرا کو م ٹ �
ن� م�ی
مو مثبت حالیہ لیکن گیا سنبھالا سے ز اندا معقول
بنا کی موجودگی تر وسیع اپنی ور ا پیشکش کی پروڈکٹس متنوع اپنی پر پیمانے وسیع میں نکالنے سے ن بحرا معاشی کو
کو خدمات کی ن ش ئانٹرمیڈ�ی لیے کے کارپوریٹس بڑے ور ا مارکیٹ درمیانی ہے۔بینک رکھتا صلاحیت قائدانہ پر
ہے۔ پرعزم لیے کے دینے وسعت
کے حصول کے سطح مطلوبہ کی معیار کے مقصدخدمت کا جس ہے بنیاد فرنچائزکی ایل بی یو بینکنگ برانچ
مالیاتی ترجیحی کو صارفین ہوئے بڑھتے ہمارے میں مقصدپاکستان ہے۔ہمارا بڑھانا کو رسائی کی بینک ذریعے
ہے۔ فراہمی کی سروسز
کرائے متعارف سلوشن جدید ور ا منفرد ور ا گا رکھے جاری کو تیاری کی پروپوزیشن ڈیجیٹل یافتہ رڈ ایوا بینک
بھی طبقہ ہ و کا آبادی میں وراس ا ہے بنانا قابل کے رسائی ور ا آسان کو بینکاری لیے کے سب مقصد کا گاجس
ہے۔ محروم سے سہولت کی بینکاری جو ہے شامل
ور ا گی ہوں ر ہموا آہستہ آہستہ بھی راہیں نئے کی دینے قرض ساتھ ساتھ کے اضافے میں سرگرمیوں معاشی
کو تعلقات ساتھ کے طبقات کاروباری ہوئے ابھرتے ور ا مستحکم ہوئے رہتے میں خطرات قبول قابل بینک
ہے۔ متلاشی کا دینے مزیدوسعت
کوشاں مسلسل لیے کے کرنے مستحکم کو ات معیار کے پلائنس کم� اپنی مطابق رکے ن
س�ٹ
یک� پر� بہترین عالمی بینک
لیے کے مستقبل ور ا بڑھوتری اپنی بینک ہیں،جہاں ملازمین کے اس اثاثہ بڑا سے سب کا ایل بی ہے۔یو
گا۔ رکھے جاری کاری سرمایہ میں لیڈرتیارکرنے
)Corporate Governance) گورننس یٹ کارپور)Directors’ Statement( اسٹیٹمنٹ ڈائریکٹرکی
سے طرف کی پاکستان آف کمیشن ایکسچینج اینڈ سیکورٹیز کہ ہیں کرتے عہد کا بنانے یقینی یہ ڈائریکٹرز بورڈآف
ر ن
س�ٹ
یک� � پر گورننس کارپوریٹ نے گئی، بینک کی تکمیل طرح پوری کی تقاضوں کے گوورننس کارپوریٹ کردہ طے
کہ: ہیں دیتے اطلاع یہ بخوشی ز ڈائریکٹر ور ا ہے کیا اختیار سے عمدگی کو
صورت کی معاملات کے بینک طورپر منصفانہ رے گوشوا مالیاتی تیارکردہ سے طرف کی انتظامیہ کی • بینک
ہیں۔ کرتے پیش تبدیلیاں میں ایکویٹی ور ا فلوز نتائج، کیش کے حال، سرگرمیوں
ہیں۔ گئے رکھے ی�ن �ٹ�
ن� م�ی
کھاتے درست کے اکاؤنٹس سے طرف کی • بینک
تخمینے کے اکاؤنٹس ہے۔ گیا کیا اطلاق کا ر ن
ی� یس� پال� اکاؤنٹنگ مناسب مستقلا میں تیاری کی روں گوشوا مالیاتی •
ہیں۔ مبنی پر زے اندا محتاط ور ا موزوں
میں پاکستان کہ جیسا ،)IFRS( رڈز اسٹینڈ رپورٹنگ فنانشل انٹرنیشنل میں تیاری کی روں گوشوا مالیاتی •
ہے۔ گئی بغیرتعمیل کی کے تہی پہلو بھی کسی ہیں، کی اطلاق قابل
گئی کی ورنگرانی ا اطلاق مؤثر کا وراس ا ہے گیا کیا ڈیزائن پر طرز درست نظام کا انضباط اندرونی میں • بینک
ہے۔
ہیں۔ نہیں خدشات ذکر قابل کوئی پر اہلیت کی رکھنے جاری کاروبار کے • بینک
ہے۔ گیا کیا نہیں ف انحرا مادی کا قسم کسی سے روایات بہترین کی گورننس • کارپوریٹ
United Bank Limited38

سے د1.5ملین تعدا صارفین)users(کی رجسٹرڈ ہے، جیساکہ31دسمبر2020تک جارہی بڑھتی مقبولیت
کاری سرمایہ ور ا دائیگیاں، ا بینکاری، میں پاکستان )NRPs(کو پاکستانیوں مقیم غیر میں ایپ گئی۔اس تجاوزکر
آف بینک اسٹیٹ لیے کے فراہمی کی سہولیات آمیز جدت کی بینکاری لیے کے دینے سرانجام سرگرمیاں کی
ہے۔ شامل بھی سہولت کی کھولنے اکاؤنٹ ڈیجیٹل روشن پر طور کے حصے ایک کے م اقدا کے پاکستان
)Economy Review) جائزہ معاشی نصف دوسرے 2020کے ور ا ہے ہورہی بحال بتدریج پر سطح کی پہلے 19سے کوویڈ۔ معیشت کی ملک
باعث کے کمی میں ر ن
یس� ک� نئے 19کے کوویڈ۔ ہواہے۔ اضافہ میں طلب مجموعی ور ا سرگرمیوں صنعتی میں
ہوگئی شروع آنا بہتری بھی میں شعبوں وربیرونی ا تومالیاتی گئی کی نرمی میں پابندیوں سے طرف کی حکومت
میں قیمتوں کی روی،اجناس سست میں س ن� �ی
ٹ� یم�ی �
نظرر پیش کے خطرے ممکنہ کے لہر دوسری کی وباء ہے،تاہم
مسائل جیسے رکاوٹ میں برآمدات کی فصلوں نمایاں ور ا سپلائی کی اشیاء غذائی وراہم ا زر افراط سے اضافے
ہیں۔ موجود بھی اب خدشات کے
زر افراط وسط ا 12.6فیصد(، )دسمبر2019میں گئی کی ریکارڈ 8.0فیصد )CPI(دسمبر2020میں زر افراط
اشیائے ن دورا گئی۔سال2020کے کی ریکارڈ 9.5فیصد 2020میں میں مقابلہ کے 9.4فیصد 2019کے
مستحکم قیمتیں رہی۔تاہم،دیگراشیاء کی رکاوٹ میں سپلائی وجہ بڑی کی جس ہوا اضافہ میں قیمتوں کی خوردونوش
حالیہ اپنی نے 22جنوری 2021میں پاکستان آف بینک اسٹیٹ ہوگئے۔ کم اثرات کے اس سے وجہ کی رہنے
کم 2021میں سال مالی زر افراط سے جس رکھا ر برقرا کو ریٹ پالیسی 7.0فیصد میں اسٹیٹمنٹ پالیسی مانیٹری
ہے۔ امکان کا رہنے ر برقرا پر سطح
گیا۔مالی دیکھا استحکام زبردست باوجود کے چیلنجز والے آنے سے وجہ کی وباء میں شعبے بیرونی
امریکی خسارہ 662ملین اکاؤنٹ کرنٹ میں بعد،دسمبر2020 کے سرپلس میں ماہ پانچ پہلے سال2021کے
نصف 20کے سال20 ہے۔تاہم،مالی اضافہ میں درآمدات وجہ بڑی سے سب کی گیا،اس کیا ریکارڈ ڈالر
ول ا نصف 2021کے سال مالی میں مقابلہ کے خسارہ اکاؤنٹ کرنٹ کے ڈالر امریکی رب 2.0ا میں ول ا
ملک میں ول ا نصف 2021کے سال گیا۔مالی کیا ریکارڈ ڈالر امریکی رب سرپلس1.1ا اکاؤنٹ کرنٹ میں
مالی ہے۔جبکہ زیادہ 6فیصد سے مدت اسی کی سال تھا،جوگزشتہ پر ڈالر امریکی رب 24.5ا کاحجم درآمدات کی
نصف سال2020کے مالی یہ تھا، ڈالر امریکی رب 12.1ا حجم کا برآمدات میں ول ا نصف 2021کے سال
ہے۔ زیادہ میں 5فیصد مقابلہ کے ول ا
ہوئے،سال وصول ڈالر امریکی رب 2.0ا س ن� �ی
ٹ� یم�ی �
ر ہوم ماہانہ میں 6ماہ پہلے کے سال مالی موجودہ میں ملک
امریکی رب 14.2ا حجم کا ترسیلات میں ول ا نصف 2021کے سال مالی ساتھ کے نمو کی 25فیصد سال بہ
ور ا ورباضابطہ ا ٹینس ریمی کا پاکستان آف بینک اسٹیٹ بشمول اقدامات مثبت ور ا پابندیاں ڈالررہا۔سفری
پیش مثبت ن رہا۔ا ر برقرا تسلسل کایہ ترسیلات ہی بدولت کی اقدامات بنیادی جیسے فروغ چینلزکے ڈیجیٹل
کرگئے تجاوز حدسے ڈالرکی امریکی رب یہ 20ا سے جس ہے ملی تقویت کو ذخائر کے زرمبادلہ ملکی سے رفتوں
13فیصد میں مقابلہ سال2019کے گزشتہ کہ تھے،جو پر ڈالر امریکی رب 20.5ا دسمبر2020میں جو
دسمبر ور ا رہی مستحکم شرح کی زرمبادلہ ن دورا کے ہے۔سال اضافہ 9فیصد میں مقابلہ ورجون2020کے ا
ہے۔ کمی یہ 3فیصد میں مقابلہ ہو،دسمبر2019کے اختتام ڈالرپر امریکی روپے159.8فی 2020 میں
دسمبر2020میں ہوکر بہتر سے سطح تر کم 27,229کی 2019میں مارچ انڈیکس KSE-100
ہے۔ اضافہ میں 7فیصد مقابلہ دسمبر2019 کے ہوا۔یہ پربند 43,755پوائنٹس
رپورٹ کی ڈائریکٹرز کو ارکان
میں مقابلہ دسمبر2019کے کہ جو ہے رہا روپے 17.9ٹریلین دسمبر2020میں ڈیپازٹ سیکٹرکا بینکنگ
کیے ریکارڈ روپے ایڈوانسز8.5ٹریلین سیکٹرکے بینکنگ ہے۔دسمبر2020میں نمو نمایاں ایک کی 22فیصد
گئے،اس طرح دسمبر2019کے مقابلہ میں 4 فیصد اضافہ ہوا۔بینکنگ انڈسٹری کے غیر فعال قرضے بمطابق
کہ ہے،جیسا اضافہ 9فیصد میں مقابلہ دسمبر2019کے میں جس تھے روپے رب 829ا 31دسمبر2020،
ہے۔ ہوگئی دسمبر2020 تک 9.2فیصد سے دسمبر2019 میں 8.6 فیصد سطح کی معیار کی جات اثاثہ
)UBL International) انٹرنیشنل ایل بی یو پھیلاؤکو کے وائرس میں بھر دنیا ہیں۔ کیے مرتب نتائج دوررس لیے کے معیشت عالمی نے وباء کوویڈ۔19
وپیک)OPEC(کی ا میں خطہ کو کونسل تعاون ہوگئیں۔خلیج محدود سرگرمیاں معاشی میں نتیجہ کے روکنے
اتھارٹیزنے پڑا۔ریجنل سامناکرنا کا مشکلات معاشی باعث کے کمی میں طلب علاقائی ور ا عالمی ور ا ر وا پیدا
ورپروڈنشل ا آغاز،مانیٹری پیکیجزکا ریلیف مالیاتی میں کیے،جس ت اقداما وسیع لیے کے کرنے کم کو ن بحرا اس
کے ریجن میں دور ہیں۔تاہم،موجودہ شامل شمولیت ں نمایا کی لیکوڈٹی میں نظام بینکاری ور نرمی،ا میں قوانین
۔ ہے امکان کا رہنے روی سست رفتارمیں کی ریکوری ور ا لک ؤٹ آ معاشی
اپنی تحت کے اقدامات بھرپور لیے کے نمٹنے سے خطرات موجودہ کے کونسل تعاون خلیج انٹرنیشنل ایل بی یو
توجہ پر سرگرمیوں مالیاتی ور ا تجارتی ساتھ کے روں دا ا مالی مستحکم میں ماڈل کررہاہے۔بزنس کم شیٹ بیلنس
تک شپس ریلیشن معیاری موجودہ سرگرمی کی دینے قرض کہ جب رہی سست رائٹنگ ٹ ی ا�ی ہے۔ مرکوز
کی اکاؤنٹس فعال غیر نے یونٹ مینجمنٹ ٹ ی ا�ی اسپیشل گئی۔ رکھی نظر کڑی پر نادہندگی ممکنہ ور ا رہی محدود
مستحکم منافع ہیں وہاں اپنی کوششوں میں مزیداضافہ کیا۔ جہاں منافع کے مواقع موجود ہوتے لیے وصولی کے
میں ڈیپازٹ لاگتی کم گئی۔بینک رکھی ی�وڈٹی یک� ل� اضافی ی�ورٹیزمیں یک� س� حکومتی ملکی غیر لیے کے ٹریڈنگ فعال ور ا
ہے۔ جارہی کی کم توجہ میں ڈیپازٹس مدتی طویل طورپرمہنگے ورخاص ا ہے خواہاں لیے کے توسیع
کے سال گزشتہ کہ جو ڈالررہے امریکی رب 1.4ا 2020میں سال ڈیپازٹس وسط ا کے انٹرنیشنل ایل بی یو
آئی کمی 2020میں سال میں مقابلہ کے لاگت کی ڈیپازٹس 2019میں سال ہیں۔ کم 17فیصد میں مقابلہ
سے ڈالر امریکی 982ملین 2019میں فولیو پورٹ لون وسط ہوگئی۔ا کر1.6فیصد ہو کم 2.2فیصدسے جو ہے
حکومتی فکسڈانکم، 2020میں ہے۔سال کم کہ32فیصد ہوگیاجو ڈالر امریکی 666ملین ہوکر2020میں کم
منافع کا سے 2020میں 5.7فیصد جس تھی ڈالر امریکی وسطا 701 ملین ا کاری سرمایہ کل مشتمل پر ی�ورٹیز یک� س�
ہوا۔)سال 2019میں 5.9فیصد(۔ حاصل
جائزہ کا کارکردگی کی اداروں ذیلی )Subsidiaries Performance Overview)
ہیں۔ ذیل درج نکات نمایاں کے کارکردگی مالیاتی سال2020میں کی روں دا ا ذیلی ہمارے
ایل بی یو شیئرز 55فیصد میں جس ہے ڈری ٹ
جس� س� کی ایل بی یو کے( یو ایل، بی لمیٹڈ)یو بینک نیشنل یونائیٹڈ
کا پاؤنڈز قبل2.2ملین سے دائیگی ا کی ٹیکس نے برطانیہ ایل یوبی ن دورا ہیں۔سال2020کے ملکیت کی
بہ سال کی بینک طرح اسی خسارہ(۔ کا پاؤنڈ برطانوی ر ہزا 825 )دسمبر2019میں کیا پوسٹ خسارہ نیٹ
اپ مارک نان میں مقابلے کے سال گزشتہ آئی۔ بہتری 28فیصد میں آمدنی اپ مارک پرنیٹ بنیاد کی سال
وجہ بڑی کی ہے،اس ہوئی کمی 15فیصد میں آمدنی میں مد کی فیس سال بہ ہوئی۔سال کمی 28فیصد میں آمدنی
ن دورا کے ہے۔سال ہوئی کمی 4فیصد میں اخراجات انتظامی سال بہ ہے۔سال روی سست باعث کے وباء
پرویژن پونڈ ر 523ہزا )2019میں اہے پڑ اثر پر منافع سے وجہ کی اخراجات پرویژن کے پونڈ 2.3ملین
39Annual Report 2020

رب روپے دی لاگت15.6ا ور پورے نیٹ ورک میں بہتری کے لیے افرا معاملات کے لیے عملے کی تقرری ا
کیے ریکارڈ روپے رب اخراجات6.7ا متعلقہ سے ہے۔پراپرٹی زیادہ میں 7فیصد مقابلہ کہ 2019کے جو رہی
روپے رب متعلقہ اخراجات4.2 ا سے ٹی آئی کے بینک ہے۔سال2020میں سال8فیصدکم بہ سال گئے،یہ
طور مجموعی وجہ کی ہیں۔اس زیادہ 15فیصد میں مقابلے کے مدت اسی کی سال گزشتہ کہ جو گئے کیے ریکارڈ
بہ سال ہے۔دیگراخراجات رکھنا جاری کاری سرمایہ میں فارمز پلیٹ ٹیکنالوجی تحت کے ی �جٹ ی� �
سٹر ا ڈیجیٹل پر
ہے۔ رہنا شکار کا روی سست کا کاروبار سال 2020میں وجہ بڑی کی ہیں۔اس ہوئے کم سال7فیصد
)Balance Sheet Management) نسق و نظم کا شیٹ بیلنس 8فیصد دسمبر2019سے کہ جو رہی روپے ٹریلین 2.0 دسمبر2020، بمطابق شیٹ بیلنس کی ایل بی یو
میں 1376برانچیں(۔اس )2019میں ہے مشتمل پر 1370برانچوں ورک نیٹ کا ہے۔بینک زائد
کی بینکاری 187اسلامک ساتھ کے اس ور برانچیں(ا 100 )2019میں ہیں شامل برانچیں 100اسلامک
ونڈوز(۔ کی بینکاری ہیں )2019میں 162اسلامک ونڈوزبھی
زائد جودسمبر2019سے12فیصد رہے روپے ڈیپازٹس1.6ٹریلین پر سطح کی بینک دسمبر2020تک
ور ا کوبڑھانا شیئر والٹ کسٹمرزسے مقصدموجودہ کا جس ہے ی �جٹ ی� �
اسٹر ی ٹ جل� �
ئلا� کثیرالجہتی پاس کے ہیں۔بینک
کو ڈیپازٹس والے لاگت مدتی،کم طویل ور ا مستحکم توجہ ہے۔ہماری کرنا اضافہ دمیں تعدا کی ز کسٹمر فعال
ہے۔ رہی مرکوز پر کرنے متحرک
دکھائی کارکردگی زبردست بہت میں سال اس نے ہے،جس گروپ بینکنگ برانچ بنیاد کی فرنچائز
کہ گئے،جو کیے ریکارڈ روپے 1.4ٹریلین ڈیپازٹس ک ٹیس� ڈوم� پر اختتام 2020کے باعث کے ہے،جس
2020میں سال یہ کہ ہوا ممکن لیے کے بینک سے ہیں۔اس زائد 17فیصد میں مقابلے دسمبر2019کے
8.1فیصد(۔بینک 2019میں سکے)سال رکھ ر شیئربرقرا مارکیٹ وسط کا8.1فیصدا سیکٹرڈیپازٹس بینکنگ
رب ڈیپازٹس111ا کل دسمبر2020میں رکھی۔ جاری قدمی پیش اپنی بھی میں بینکاری اسلامی نے
ڈیپازٹس انٹرنیشنل ایل بی تھی۔یو نمو 37فیصدزبردست میں مقابلہ دسمبر2019کے جو ہیں رہے روپے
ہیں۔ ہوئے کم میں 15فیصد مقابلہ دسمبر2019کے جو تھے ڈالر امریکی رب دسمبر2020میں 1.4ا
18فیصد میں مقابلہ 2019کے ررہے،جودسمبر برقرا پر روپے رب ڈیپازٹس615ا کرنٹ ک ٹیس� ڈوم�
دسمبر2019میں جو ہے ہوئی ی بہتر میں تناسب کے ڈیپازٹس کل ور ا ہے۔کرنٹ نمو زبردست کی
فولیو پورٹ کا ڈیپازٹس سیونگ ک ٹیس� ڈوم� ہوگیا۔ فیصد 43.3 میں وردسمبر2020 ا تھا 42.7فیصد
بینک سے ہوئی۔اس نمو زبردست کی سال18فیصد بہ سال میں رہاجس روپے رب دسمبر2020میں 596ا
بہتری میں ک CASAتناسب ٹیس� ڈوم� دسمبر 2020میں 85.2 فیصد دسمبر 2019میں 84.2فیصدسے نے
میں مقابلہ رہا،دسمبر 2019کے ر برقرا پر روپے رب فولیو210ا پورٹ ڈیپازٹ ٹرم ک ٹیس� بنایا۔ڈوم� ممکن کو
ہے۔ گئی میں 9فیصدنمودیکھی اس
17 میں مقابلہ دسمبر2019کے رہے،جو روپے رب ا ایڈوانسز530 نیٹ کے بینک میں دسمبر2020
میں جس رہے روپے رب 430ا ایڈوانسز فعال ک ٹیس� ڈوم� طرح اسی ہے کرتا ظاہر کو رحجان کے کمی فیصد
معیار بلندترین کا جات بدستوراثاثہ عملی حکمت کی دینے ہے۔قرض گئی دیکھی سال14فیصدکمی بہ سال
اپنی میں انٹرنیشنل ایل بی یو ہے۔بینک مبنی پر بہتری میں منافع مجموعی پر تعلق جاتی قرضہ ور ا ور ا رکھنے ر برقرا
کم سے ڈالر امریکی 830ملین دسمبر2019میں بک لون فعال کہ جیسا ہے، کررہا کوکم کاری سرمایہ کی لون
ہے۔ ہوگئی ڈالر امریکی ہوکردسمبر2020میں 601ملین
رب ا 840 )دسمبر2019میں رہا روپے ٹریلین 1.1 دسمبر2020میں فولیو پورٹ �ٹ ن
م�ٹ یس� انو� کا بینک
�ٹ ن
م�ٹ یس� انو� پاکستان روپے رب ا ور237 ا گئیں رکھی میں ی�ورٹیز یک� س� ٹریژری پر طور ابتدائی فنڈنگ روپے(۔
رب پر341ا ریٹ فلوٹنگ میں بانڈ �ٹ ن
م�ٹ یس� انو� پاکستان کہ جب گئے کئے انویسٹ پر ریٹ فکس میں بانڈ
گئی۔حالیہ کی کاری سرمایہ کی روپے رب ا 345 میں بلز ٹریژری طرح اسی گئی۔ کی کاری سرمایہ میں کی روپے
تاکہ گئی لگائی میں بانڈز ریٹ فلوٹنگ ور ا ور بلزا ٹریژری کے مدت مختصر میں،لیکویڈٹی تناظر کے سود شرح کم
روپے رب ا 10.4 دسمبر2020میں ہولڈنگ ایکیوٹی کی جاسکے۔بینک بنایا ممکن کو منافع مطابق کے ر وا پیدا
آئے، میسر مواقع بخش منافع جہاں ن دورا کے سال کہ روپے(جیسا رب ا 13.4 )دسمبر2019میں رہی
،بنیادی طور پر،غیر ملکی ڈیبٹ �ٹن
م�ٹ یس� تمسکات کی فروخت سے سرمایہ وصول کیا گیا۔یو بی ایل کی انٹرنیشنل انو�
ڈالر(۔ امریکی تھی )دسمبر2019میں 699 ملین ڈالر امریکی ہے، جودسمبر2020میں 771ملین مشتمل پر
)Capital Ratios) تناسب جاتی سرمایہ کے توسیع کاروباری میں مستقبل ور ا رکھنے ر برقرا اقدامات استحکامی مناسب پر تقاضوں ریگولیٹری ور ا بینک
مندہے۔ کاخواہش رکھنے ر بنیادبرقرا جاتی سرمایہ مضبوط لیے کے کرنے فراہم فارم پلیٹ مستحکم لیے
Domestic Systemically Important Bank سے جانب کی پاکستان آف بینک سٹیٹ کوا ایل بی یو
Higher Loss زیادہ فیصد 1.5 کو بینک لئے کے نامزدگی ،اس ہے گیا کیا نامزد )D-SIB(
سرمائے کم سے کم کی اس 2019میں کہ جو ہے ضروری رکھنا )HLA( Absorbency Surcharge
دونوں مجتمع غیر ور ا مجتمع جو چاہیے۔ ہونی زیادہ سے حد کی Capital Adequacy Ratio )CAR(
مارچ مطابق کے D-SIBترین تازہ اپنی نے ہاکستان آف بینک اسٹیٹ ہے،تاہم ضروری ہونا پر وں بنیاد
ہے۔ کردیا کرکے 1.0 فیصد کمی 50 کی bps میں چارج العملHLA سر نافذ 2020سے
سیکٹر بینکنگ میں سلسلہ کے دینے توسیع میں سہولیات کریڈٹ کو صارفین اپنے نے پاکستان آف بینک اسٹیٹ
میں،اسٹیٹ سلسلہ ہے۔اس کیا فراہم کوویڈ۔19بھی برائے ریلیف ریگولیٹری ایک لیے کے معاونت کی
کر 1.5فیصد کے کر کم کو سطح موجود 2.5فیصدکی )CCB(کی بفر کنزرویشن کیپٹل نے پاکستان آف بینک
12.5فیصدپر )CAR( تناسب جاتی سرمایہ کم سے کم درکار لیے کے ایل بی یو 31دسمبر2020کو دی۔لہذا
CAR ریگولیٹری زکم ا کم 14.0فیصدکی دسمبر2019میں جو سرچارج(۔ HLA 1.0فیصدکا رہی)بشمول
ہے( شامل کا HLAسرچارج میں 1.5فیصد ہے )اس کم پوائنٹس سے 150بنیادی حد کی
12.5 18.9فیصد(،جو )دسمبر2019میں فیصدپررہی 24.4 CAR مجموعی کی بینک دسمبر2020میں
CET-( 1 ر ئ ی
ٹ� ایکویٹی کامن ہے۔دسمبر2020میں 11.9فیصدزائد سے حد ریگولیٹری کم ز ا کم فیصدکی
جاتی ر1سرمایہ یئ ٹ
� کل میں 2020 13.7فیصد(۔دسمبر )دسمبر2019میں رہا 1(کاتناسب17.0فیصد
تناسب18.4فیصدرہا )دسمبر2019میں 14.9فیصد(۔
9.5 یعنی فیصد 95 میں کراچی منعقدہ اجلاس کے ڈائریکٹرز آف بورڈ کے ایل بی 2021کویو 24فروری
گیا۔ کیا اعلان کا نتائج کے سال والے ہونے ختم ساتھ 31دسمبر 2020کو حتمی ڈیویڈنڈکے کے شیئر فی روپے
)UBL Digital) ڈیجیٹل ایل بی یو پیش میں فراہمی کی سروسز ڈیجیٹل کوبلاتعطل صارفین ہوئے بڑھتے اپنے میں بینکنگ ک
ٹیس� ڈوم� ایل، بی یو
ذریعے کے کرنے کم کو رکاوٹوں میں شمولیت کی طبقات محروم سے بینکنگ ساتھ ساتھ کے اس ہے رہا پیش
مقصد، اپنی کا بینک تحت کے ی �جٹ ی� �
اسٹر ڈیجیٹل جامع رہاہے۔ایک کوشاں لیے کے اضافے میں شمولیت مالیاتی
میں نتیجے کے جس ہے لانا جدت میں بینکاری ور ا طرزعمل مجموعی ور ا روابط سے کار،کسٹمرز پراڈکٹس،طریقہ
استعمال لیے کے سہولت اپنی کو کار طریقہ ترجیحی اپنی صارفین سے جس ہے کرنا تیار ایکوسسٹم جامع ایسا ایک
کرسکیں۔ پورا کو ضروریات تمام کی بینکاری اپنی کرکے
صرف نہ ہے۔ایپ کرتی احاطہ کا اصولوں اہم کے ی �جٹ ی� �
اسٹر بینکنگ ڈیجیٹل ایپ،ہماری ڈیجیٹل ایل بی یو
نئے طرف کی تعلقات باقاعدہ ایک ساتھ کے بینک بلکہ انگیزہے انقلاب میں فراہمی کی خدمات مالیاتی
میں صارفین کے بینک کی ایپ ڈیجیٹل ایل بی ہے۔یو بھی ذریعہ آسان ور منفردا ایک لیے کے صارفین
United Bank Limited40

کے سال گزشتہ کہ جو رہا روپے وسطا1.0ٹریلین ا 2020میں سال حجم کا کاری سرمایہ بخش منافع کی بینک
رہا،جس روپے رب وسطا839ا ا سال 2020میں فولیو پورٹ ی�ورٹیز یک� س� ہے۔حکومتی نمو میں 24فیصد مقابلہ
10.3 میں رہی)2019 آمدن10.0فیصد شرح پر اس ور ا ہوا کااضافہ ن27فیصد دورا کے سال میں
Soveriegn( قرضوں حکومتی خودمختار پر طور بنیادی �ٹ ن
م�ٹ یس� انو� بخش منافع کی انٹرنیشنل ایل بی فیصد(۔یو
ن دورا ساتھ2020کے کے اضافہ 7فیصد سال بہ سال ہے،جو مشتمل پر )Government Debt
705ملین امریکی ڈالر رہی اور اس سے بینک نے 6.0فیصد منافع حاصل کیا ہے )سال 2019 میں6.2 فیصد(۔
)Non-Markup Income) آمدنی اپ مارک نان روپے رب ا 17.1 ن دورا سال2020کے میں مقابلہ کے روپے رب 21.7ا سال2019کی میں بینک
فیصد حصہ19 کا اپ مارک نان میں محاصل مجموعی کے بینک طرح اس گئی دیکھی آمدنی اپ مارک نان کی
ے ت
�ٹ
یم� س�آپریشنزکو نیویارک کے بینک میں آمدنی اپ مارک نان سال 26فیصد(۔گزشتہ رہا)2019میں
تھا۔ شامل منافع والا ہونے پر وصولی کی ڈپازٹس ہوئے
کے سال گزشتہ کہ گئے،جو کیے ریکارڈ روپے رب 11.1ا میں مد کی کمیشن ور ا فیس 2020میں سال
مشتمل پر کمیشن ور ا فیس 65فیصد آمدنی اپ مارک نان کل 2020میں سال ہے۔ کم 20فیصد میں مقابلہ
سے وجہ کی خلل کے سرگرمیوں معاشی مجموعی سے وجہ کی کورونا 64فیصد(۔ )سال2019میں ہے
کے سال سرگرمیاں ہوا۔تاہم،کاروباری متاثر بھی کاخطہ کونسل تعاون خلیج ساتھ، مقامی،فرنچائزکے
سے کورونا میں بینک ک ٹیس� ڈوم� سے حوالے کے فیسوں ور ا ہوئیں شروع ہونا بحال میں حصہ نصف دوسرے
گئی۔ کی رپورٹ نمو ماہی سہ کی پر25فیصد سطح کی پہلے
سال کہ جو گئی کی ریکارڈ 2020میں سال روپے رب فیس1.6ا کی کسٹمرز میں آپریشنز بینکنگ برانچ
ہے۔بینک کمی میں ورفت آمد کسٹمرزکی میں حصے ابتدائی کے سال وجہ کی ہے،جس کم سال17فیصد بہ
شیئر وسطا23.3فیصدمارکیٹ ا 2020میں سال ہے۔ رہا لیڈر مارکیٹ میں بزنس س ن� �ی
ٹ� یم�ی �
ر ہوم
رہی روپے رب 1.6ا انکم فیس سے س ن� �ی
ٹ� یم�ی �
ر ہوم 2020میں سال میں نتیجہ کے گیا،جس کیا ریکارڈ
سال جو گئی کی ریکارڈ آمدنی روپے رب میں 1.3ا مد کی گارنٹی ور ا ٹریڈ روپے(۔ رب )سال2019میں 1.7ا
مالیاتی کے بینک رہی۔تاہم، متاثر زیادہ بہت تجارت عالمی وجہ کی روی سست نکہ کیو ہے کم 10فیصد سال بہ
نمو35فیصد سال بہ سال میں بزنس گارنٹی پر سطح انٹرنیشنل ور ا ک ٹیس� ڈوم� بدولت کی کارکردگی کی روں دا ا
گئی۔ کی ریکارڈ
مقابلہ 2019کے سال کہ گیا،جو کیا ریکارڈ روپے رب 1.2ا کمیشن ایشورنس بینک سال2020میں
رب 3.7ا )2019میں ہے رہا روپے رب کاحجم2.6ا پریمیم 2020میں ہے،سال کم 27فیصد میں
ماہی سہ چوتھی میں مقابلہ کے ماہی سہ تیسری کی سال ساتھ کے بڑھنے تیزی ی روپے(۔تاہم،کاروبار
گیا۔ کیا ریکارڈ اضافہ کمیشن میں 48فیصد ایشورنس میں،بینک
کارڈز ڈیبٹ فعال دسمبر2020میں ساتھ کے ء اجرا زکے کارڈ ڈیبٹ نئے ن،681,000 دورا کے سال
آمدنی روپے رب 1.6ا کارڈزسے کریڈٹ ور ا ڈیبٹ میں نتیجہ کے اس گئی ہو 2.1ملین د تعدا مجموعی کی
گئی کی ریکارڈ روپے 877ملین 2020میں سال فیس ہے۔کنزیومر مساوی کے سال2019 جو ہوئی
مستحکم کو قدمی پیش اپنی میں �ٹ ن
یگم� س� لینڈنگ آٹوز نے بینک روپے(،کیونکہ 983ملین )سال2019میں
کہ جب رہی 846ملین ساتھ کے کرانے ریکارڈ نمو 8فیصد مینجمنٹ کیش ن دورا 2020کے سال رکھا۔
گیا۔ کیا پروسیس حجم مجموعی زائدکا سے روپے 2020میں 3.0ٹریلین
رپورٹ کی ڈائریکٹرز کو ارکان
2019میں )سال ہے ہوئی حاصل آمدنی کی روپے رب 3.7ا 2020میں سال سے زرمبادلہ کو بینک
انرجی 2020میں رہی۔سال مستحکم تک حد بہت میں سال مارکیٹ ایکسچینج فارن کہ روپے(جیسا رب 4.5ا
کے منافع زبردست سے ہولڈرز ایکویٹی کے رروں دا ا ذیلی کے بینک ساتھ ساتھ کے سٹاکس فرٹیلائزرا ور ا
روپے(۔فکسڈ رب 1.5ا 2019میں )سال گئی کی ریکارڈ آمدنی روپے رب 1.3ا مدمیں کی ڈیویڈنڈ باعث
بی یو میں مارکیٹس ی�ورٹیز یک� س� ٹ
ج ڈ�ی فارن ور ا ٹریڈنگ فعال کی ک ٹیس� ڈوم� ایل بی یو میں مارکیٹس ایکویٹی ور ا انکم
کیے۔ حاصل گینز ل ٹ�ی� ک�ی�پ
کے روپے سال 2020میں 411ملین نے بینک بدولت کی انٹرنیشنل ایل
جات قرضہ فعال غیر اور رقوم مختص لیے کے نادہندگی ممکنہ پر قرضوں )Provisions, loan losses and non-performing loans)
)net provisioning(اخراجات پروویژننگ نیٹ کے روپے رب 8.2ا سال2019میں نے ایل بی یو
ہیں۔ کیے ریکارڈ اخراجات پروویژننگ نیٹ کے روپے رب سال 2020میں 16.8ا میں مقابلہ کے
دسمبر کہ جو تھے روپے رب 77.0ا )NPLs(دسمبر2019میں جات قرضہ فعال غیر پر سطح کی بینک
دوبارہ کی قرضوں غیرفعال میں کرنسی غیرملکی میں اضافہ ہوگئے۔اس روپے رب کر 83.6ا بڑھ 2020میں
دسمبر طورپر رہے۔مجموعی روپے رب تقریبا1.6ا کہ جو ہیں شامل بھی اثرات کے پرزرمبادلہ قدرپیمائی
مخصوص 11.0فیصد(،جبکہ تھی)دسمبر2019میں گئی پیمائش13.7فیصدکی کی معیار کے اثاثہ 2020میں
ہوگئی۔ دسمبر2020میں 85.8فیصد کر بڑھ سے دسمبر2019 میں 82.6فیصد کوریج
)UBL Domestic) کٹیس� ڈوم� ایل یوبی
دسمبر2020میں کر بڑھ سے روپے رب ا 27.6 دسمبر2019میں حجم کا جات قرضہ فعال غیر مقامی
روپے رب 1.9ا میں فولیو پورٹ لون پر طور خاص میں ک ٹیس� ڈوم� ایل بی ہے۔یو ہوگیا روپے رب 28.7ا
تھا۔دسمبر گیا لیا چارج پروویژن نیٹ کا روپے رب 2.2ا سال گزشتہ ہے، گیا کیا ریکارڈ پروویژن نیٹ کا
کی اضافہ 5.3فیصد(اس )دسمبر2019میں تھی گئی کی پیمائش6.3فیصد کی معیار کے اثاثہ 2020میں
رہی 85.7فیصد دسمبر2020میں کوریج مخصوص جبکہ ہے کمی میں بک لون طورپر مجموعی وجہ بنیادی
تھی)دسمبر19میں 92.2فیصد(۔
)UBL International) انٹرنیشنل ایل بی یو میں معاملات باعث میں،کوویڈ۔19کے منظر پس کے ماحول کاروباری گ
نج� �
نیل� � �پ میں کونسل تعاون خلیج
سے ڈالر امریکی 319ملین دسمبر2020میں جات قرضہ فعال غیر کے انٹرنیشنل ایل بی آگیا،یو تعطل
لیے کے کرنے فراہم buffer مناسب میں مقابلہ کے ہیں۔نادہندگی گئے ہو ڈالر امریکی بڑھ343ملین
91.8ملین 2020 سال میں مقابلہ کے چارج پرویژن نیٹ کے ڈالر امریکی 40.1ملین سال2019میں
دسمبر2019میں جو کوریج مخصوص میں نتیجہ کے تھا۔اس گیا لیا چارج پرویژن نیٹ کا ڈالر امریکی
شدہ مورگیج دسمبر2020میں گئی۔تاہم، 85.9فیصدہو کردسمبر2020میں بڑھ 77.3فیصدتھی،
رہی 95.5فیصد کوریج مخصوص ساتھ ویلیو)FSV(کے سیل فورسڈ کی کی کولیٹرل ورکیش ا دوں جائیدا
ہے(۔ موجود نوٹ10.4.2میں کے رے گوشوا مالیاتی حوالہ کا )دسمبر2019میں 90.9فیصد، جس
)Cost Management) نسق و نظم کا اخراجات کی ورک نیٹ پورے ور آہنگی ا ہم بہترین میں امور معاون دیگر ور ا معاملات کاروباری کے بینک نے ایل یوبی
اخراجات انتظامی کے رکھا۔بینک جاری سلسلہ کا کنٹرول موثر پر اخراجات اپنے سے فروغ کے کمی میں لاگت
کاروباری ہیں۔ مساوی کے سال گزشتہ کہ جو گئے کئے ریکارڈ روپے رب ا ن40.1 دورا سال2020کے
41Annual Report 2020

لمیٹڈ بینک یونائیٹڈ لیے کے سال والے ہونے ختم 31دسمبر2020کو سے طرف کی ز ڈائریکٹر آف بورڈ
ہے۔ مسرت باعث لیے ہمارے کرنا پیش رپورٹ سالانہ ایل(کی 62ویں بی )یو
)Introduction) تعارفبھر ہے،دنیا ہوا ر طورپرنمودا کے وقوعہ انگیز خلل کوویڈ۔COVID-19(19( ایک میں تاریخ انسانی حالیہ
ساتھ کے معیشت مقامی سے وراس ا بیٹھے دھو ہاتھ سے زندگیوں اپنی د افرا د لاتعدا میں نتیجہ کے ء وبا اس میں
پیدا امید کچھ سے ویکسین موثر کی ہیں،وائرس ہوئے مرتب اثرات معمولی غیر بھی پر معیشت عالمی ساتھ
یقینی غیر اب صورتحال لیے کے معیشت ہے،تاہم،عالمی رہی ابھر لہر دوسری کی انفیکشن میں دنیا کیونکہ ہوئی
رہی۔ نہیں
سے طریقہ کوبہتر معیشت ور ا صحت نسبت کی ممالک دیگر کے خطہ باعث کے ء وبا نے پر،پاکستان محاذ مقامی
ن بحرا اس ور ا شہریوں محفوظ غیر کے ملک نے پاکستان آف بینک اسٹیٹ ور ا پاکستان ہے،حکومت سنبھالا
کیا،میکرو آغاز کا اقدامات مبنی پر ریلیف لیے کے تحفظ کے کاروبار معاون لیے کے کوچلانے معیشت میں
ضروری بہت ے۔یہ ہوا اضافہ میں طلب مقامی کہ ہے ہوتا ظاہر یہ سے اشاریوں ء افزا حوصلہ کے اکنامکس
کے حصول دوبارہ کے استحکام معاشی جائے،جبکہ رکھا ر برقرا کو رفت پیش مثبت میں مدت درمیانی اس کہ تھا
ہے۔ بھی اب ضرورت اقدامات کی اصلاحاتی نمایاں لیے کے نمٹنے سے مسائل ل سٹرکچر درپیش کو ملک لیے
)Performance Overview) جائزہ کا کارکردگی ز ٹیکس منافع ریکارڈکیا جو کہ سال2019میں کمائے رب روپے کا قبل ا یو بی ایل نے سال 2020 میں 34.2 ا
ز ٹیکس منافع کے مساوی رہا۔ گئے قبل ا
میں10فیصد مقابلہ 2019کے سال گئی،جو کی ریکارڈ آمدنی مجموعی کی روپے رب 92.1ا 2020میں سال
لیے سال 2020کے جو ہے کی ریکارڈ سال21فیصدنمو بہ سال میں آمدنی اپ مارک نیٹ نے ہے،بینک زائد
گئی )سال کی ریکارڈ روپے رب آمدنی17.1ا اپ مارک لیے،نان رہی۔سال 2020کے روپے رب 75.0ا
فیسوں باعث کے کورونا کیونکہ ہے کم میں مقابلہ کے سال تھی(جوگزشتہ روپے رب یہ21.7ا 2019میں
ورزرمبادلہ کی آمدنی میں کمی واقع ہوئی ہے۔ ا
2019میں )سال رہے روپے رب 40.1ا 2020میں سال رہے،جو میں قابو اخراجات انتظامی کے بینک
2019میں آئی،جوسال بہتری نمایاں میں تناسب کے لاگت ور ا آمدنی تھے(، روپے رب 40.2ا
48.2فیصد جبکہ سال2020میں 43.5فیصدرہا۔
رب 16.8ا طورپر چارج)net provision charge(مجموعی پروویژن نیٹ ن دورا 2020کے سال
مجموعی )net provision charge(چارج پروویژن نیٹ ن دورا سال2019کے کہ جب رہے روپے
مشتمل پر فولیو پورٹ کے ایڈوانسز ور ا لونز انٹرنیشنل کے پربینک طور بنیادی جو تھے روپے رب ا 8.2 پر طور
ہیں۔
)Financial Results) نتائج مالیاتی سال جو کیا ریکارڈ )PAT( منافع ٹیکس ز ا بعد مجتمع غیر کا روپے رب نے20.9ا ایل بی یو سال2020میں
فی مجتمع غیر میں مقابلے کے روپے 15.63 سال گزشتہ ہے کرتا ظاہر کو فیصدنمو 9 میں مقابلہ 2019کے
رہا روپے رب ا ٹیکس20.8 ز ا بعد منافع پر بنیادوں مجتمع گیا۔ کیا ریکارڈ روپے 17.07 )EPS( منافع شیئر
رپورٹ کی ڈائریکٹرز کو ارکان
کیا ریکارڈ 17.10روپے شیئرمنافع فی مجتمع 2020میں روپے(۔سال رب 19.0ا 2019میں )سال ہے
گیا)سال 2019میں 15.60روپے(۔
)Net Markup Income) آمدنی اپ مارک نیٹ میں 21 فیصدکی مقابلے جوکہ 2019 کے رہی روپے رب آمدنی 75 ا اپ مارک نیٹ کی 2020میں ایل بی یو
پاکستان آف بینک لیے،اسٹیٹ کے نمٹنے سے ری کسادبازا باعث کے وباء عالمی کی ہے۔کورونا نمو زبردست
مجموعی کی پوائنٹس سے 625بنیادی سطح کی دسمبر2019میں 13.25فیصد جو ہے کی کمی میں ریٹ پالیسی نے
ن دورا سال 2020کے اثاثے بخش منافع وسط ا کے ہوگیا۔بینک جون2020میں 7.00فیصد ساتھ کے کمی
منافع میں مد کی انٹرسٹ پر سطح کی ہوا۔بینک اضافہ 7فیصد سال بہ سال میں جس رہے روپے 1.6ٹریلین
4.7فیصد 2020میں ساتھ کے اضافے کے پوائنٹس 47بنیادی سے سطح 4.3فیصدکی 2019میں جات
کی 4.5فیصد 2019میں جو ہوئی بہتری میں جات منافع مقامی میں مد کی انٹرسٹ کے ایل بی یو جبکہ رہے
مددسے کی اضافہ میں بیس ڈیپازٹ لاگتی کم وجہ بنیادی کی گئے۔اس ہو سال.5.0فیصد اس کر بڑھ سے سطح
رکھا۔ محدود کو لاگتوں مجموعی کی فنڈنگ نے ہے، جس منافع بہترین پر اثاثوں
اضافہ کا 10فیصد سال بہ سال میں جس گئے کیے ریکارڈ روپے 1.5ٹریلین ڈیپازٹس وسط ا پر سطح کی بینک
بہ سال میں جس رہے روپے 1.4ٹریلین ن دورا 2020کے سال اثاثے بخش منافع وسط ا مقامی ہوا۔
سال میں )CASA(ڈیپازٹس اکاؤنٹس سیونگ اکاؤنٹس کرنٹ طورپر بنیادی ہوا۔یہ اضافہ 11فیصد سال
روپے 1.1ٹریلین 2020میں سال کہ جو ہے سے وجہ کی روپے( رب اضافہ)134ا سال14فیصد بہ
نتیجے کے رکھاجس جاری کو سیلز ایکٹیو اپنی میں اکاؤنٹس کرنٹ پر طور صارفین،خاص نئے نے رہے۔بینک
کرنٹ 534,000نئے میں 2019( ہوا اضافہ کا اکاؤنٹس کرنٹ 571,000نئے 2020میں سال میں
سال2020میں جو گئی دیکھی نمو 13فیصد میں ڈیپازٹس کرنٹ وسط ا کے بینک سے وجہ کی اکاؤنٹس(۔اس
سیونگز آمدنی ماہانہ “ 2020میں سال رہے۔ روپے رب 538ا ساتھ کے اضافہ کے روپے رب 63ا
ہیں گئے کیے ریکارڈ روپے رب ڈیپازٹس544ا سیونگز ک ٹیس� ڈوم� وسط ا بدولت، کی اضافہ میں اکاؤنٹس‘‘
2020میں نے بینک سے کااضافہ(۔اس روپے رب 15فیصدزائدرہے،)70ا میں مقابلہ 2019کے جو
2019میں ہے۔)سال رکھا ر برقرا تناسب وسط 85.4فیصدا میں اکاؤنٹ سیونگ ور ا اکاؤنٹ کرنٹ
لاگت کی ڈیپازٹس نے بینک ک ٹیس� ڈوم� سے فعالیت میں ڈیپازٹس بنیادی کے لاگت 86.2فیصد(۔کم
کی کمی کی پوائنٹس 106بنیادی تک 4.5فیصد سال2020میں سے 5.5فیصد 2019میں سال میں
بہ سال میں ڈالررہے،جس امریکی رب ڈیپازٹس1.4ا وسط ا کے انٹرنیشنل ایل یوبی 2020میں ہے۔سال
میں گئی،جس کی ریکارڈ لاگت 4.0 فیصد کی پرڈیپازٹس سطح کی بینک ہوئی۔سال 2020میں سال17فیصدکمی
ہوئی۔ کمی کی پوائنٹ سال87بنیادی بہ سال
مقابلہ سال 2019کے کہ جو ہے رہی روپے رب آمدنی 569ا وسط ا ایڈوانسزسے کی بینک سال 2020میں
کے سال گزشتہ رہے،جو روپے رب ایڈوانسز461ا ملکی فعال وسط ا 2020میں ہے،سال کم 10فیصد میں
مضبوط کی روپے رب 21ا ن دورا 2020کے سال میں ایڈوانسز بینکنگ ہیں۔اسلامک کم 4فیصد میں مقابلہ
لون باوجود،کنزیومر کے روی ہے۔سست زائد بھی دوگناسے میں مقابلہ 2019کے سال کہ جو گئی دیکھی نمو
پر �ٹ ن
یگم� س� آٹو محفوظ رتکاز ا زیادہ کا فولیو پورٹ رہی،جہاں روپے رب وسطا17ا ا طرح کی سال گزشتہ بک
بہ سال میں بک لون رکھاجو جاری کو عملی حکمت کی نکلنے سے خطرات میں کاروبار الااقوامی بین نے رہا۔بینک
ہے۔ ڈالر امریکی وسطا666ملین ا سال2020میں ساتھ کے کمی سال32فیصدکی
United Bank Limited42

Sustainabilityat UBL - 2020UBL’s Board-approved Sustainability Policy Statement declares that as a responsible corporate citizen, the Bank work towards assisting the less fortunate by supporting causes and empowering communities. Focusing on the sectors of Education, Healthcare, Literature & Arts, Water Scarcity and Natural Disaster Relief, the Bank works both independently as well as in partnership with specialist organisations, to empower disadvantaged sections of the society through economic regeneration and employment creation.
UBL has always strived to consolidate itself as a conscientious and respected corporate citizen. The Bank recognises its obligation to continuously improve its processes, systems, products and services to create value for the communities it operates in. Through a transparent and prudent Sustainability agenda, UBL aims to encourage a positive impact via projects aimed towards the betterment of the environment, consumers, employees, communities and all its stakeholders.
In 2020, an unprecedented year mired by the ravages of a global pandemic, UBL strived to further its sustainability efforts by venturing into areas that fostered the Bank’s mission to contribute positively to society at large. While a major portion of the projects the Bank participated in during 2020, directly or indirectly, brought relief to those impacted by the Covid-19 pandemic, there were many other projects which reinforced the core areas of UBL’s sustainability efforts, i.e. education and healthcare. Employee engagement in some of the projects was encouraged and the UBL team actively volunteered as symbols of hope for their communities.
As recognition for its contributions, UBL was declared one of the top-ten ‘Most Supportive Brands of Pakistan’ during the Covid-19 crisis, by a survey conducted by IPSOS, a multinational market research and consulting firm in 2020.
43Annual Report 2020

Financial Highlights 2020
Strong returns despite a challenging year 2020 was a difficult year for the bank with the impact of COVID-19 evident across all major sectors of the economy. Despite these challenges, UBL maintained its momentum with another year of stable returns. Gross Revenues grew by 10% to reach Rs. 92 billion in 2020 with standalone profit before tax (PBT) recorded at of Rs. 34.2 billion in 2020 (2019: Rs. 34.2 billion). Profit after tax (PAT) was recorded at Rs. 20.9 billion, a growth of 9% over the previous year. Bank level return on equity was measured at 13.9% in 2020 (2019: 13.8%).
These results were delivered by the highly dedicated UBL team, who have worked with the tremendous discipline and perseverance in the face of the challenges from COVID-19.
UBL’s balance sheet crossed the Rs. 2 trillion mark in 2020, a growth of 8% over 2019. Bank level deposits grew to Rs. 1.6 trillion as at Dec’20, an increase of 12% over Dec’19. Domestic deposits grew by 17% over Dec’19, closing at Rs. 1.4 trillion, i.e. a net increase of Rs. 204 billion. This enabled the bank to maintain average domestic deposits market share of over 8.1% for the year. Lending opportunities remained restricted during most of 2020 due to the pandemic, while the bank continued its de-risking strategy in its International operations. Resultantly, UBL’s net advances declined by 17% over Dec’19, standing at Rs. 530 billion at Dec’20.
The bank’s capital base strengthened further during the year, with the total Capital Adequacy Ratio (CAR) improving from 18.9% at Dec’19 to 24.4% at the end of Dec’20, well above the applicable minimum regulatory requirements.
In 2020, UBL was recognized as the “Bank of the Year 2020 - Pakistan” at the Banker Awards. The Banker, is an affiliate of the Financial Times UK and is the world’s leading financial publication. The award recognizes excellence in performance, adding customer value, innovation and leadership in society. UBL won the award, for the fourth time within a decade, on the back of its contribution, during extraordinary times during the current pandemic, while expanding the scope of financial services in Pakistan as a core strategy and spearheading innovation in the local banking industry.
Build up in core revenue with margin expansion The bank’s net markup income grew by 21% year on year to Rs. 75 billion. We continue to effectively utilize and grow our low cost deposit base in order to maximize net interest earnings. The average domestic CASA ratio was recorded at 85.4% for 2020, one of the highest in the industry. This allowed the bank to contain its domestic cost of deposit at 4.5% in 2020 (2019: 5.5%). The investment portfolio grew by 39% during the year to over Rs. 1.0 trillion (2019: Rs. 725 billion). Our investment book consists primarily of treasury bills, fixed rated and floating rate PIBs. This diversification enabled the bank to expand its domestic net interest margins from 4.5% in 2019 to 5.0% in 2020.
The bank recorded non-markup income of Rs. 17.1 billion in 2020 (2019: Rs. 21.7 billion). Income from fees and commissions were recorded at Rs. 11.1 billion for 2020, a decline of 20% against last year’s levels. This is mainly as a result of the COVID related slowdown in the first half of the year. As business activity has taken a strong rebound in the second half of the year, all fee lines are now at pre COVID levels, as the domestic bank reported a strong 25% growth Q4’20 versus Q3’20.
Dividend income stood at Rs. 1.3 billion in 2020 as compared to Rs. 1.5
billion during 2019, mainly due to reduced payouts as COVID impacted revenues and liquidity positions of our equity holdings. FX earnings reduced by 19% on a year on year basis, impacted by the slowdown in trade as well as less volatile exchange rate regime. Capital gains amounting to Rs. 411 million were realized in 2020, mainly on listed shares and foreign bonds.
Maintaining a lean cost base while investing in technology Administrative expenses were restricted to Rs. 40.1 billion for the year (2019: Rs. 40.2 billion). This was a result of the collective effort of the bank which continues to focus on improving operational efficiencies through rigorous monitoring of controllable expenses and maximizing cost synergies where possible. Technology remains a key component of our future growth strategy with the bank continuing to invest significantly in IT platforms. Resultantly, IT related expenses increased by 15% year on year. Lower costs accompanied with growth in revenues resulted in the cost to income ratio improving from 48.2% in 2019 to 43.5% in 2020.
Coverage enhanced mainly across International business The bank recorded provisioning expense of Rs. 16.8 billion for 2020 (2019: Rs 8.2 billion), primarily against UBL International’s loan portfolio. Non-performing loans (NPLs) stood at Rs. 83.6 billion at Dec’20, up by Rs. 6.6 billion from Dec’19. This included an exchange devaluation impact of approximately Rs. 1.6 billion on the foreign currency denominated loans of UBL International. Bank level asset quality ratio stood at 13.7% at Dec’20 compared with 11.0% at Dec’19. The overall coverage ratio has been strengthened to 85.8% at Dec’20 from 82.6% at Dec’19.
Our Strategic Priorities to reposition the bank towards a larger aspiration As we enter into a new era that will redefine our business model across various industries, remaining agile and ready to take on the challenges of the future remains key. Market dynamics will change and large players in financial services such as UBL must be geared up to explore and evolve with the times. We believe that repositioning ourselves today across core segments with scale, innovation and entering new markets will take the bank towards its larger strategic aspirations. At the core of this strategy is customer centricity, which we define as the continuous improvement and focus on the “customer journey.” Critical to the success of this strategy is our belief in a digital future and our goal of becoming a highly data driven organization.
The bank has identified three core strategic pillars that will be the drivers of this strategy and the key towards unlocking the franchise’s true potential: • Our People and Culture - Re-energize teams, hire and retain quality
staff to build future enabling workforce• Operational Efficiency and Controls - Renewed focus on business
pocess re-engineering, cost optimization and governance• Performance and Excellence - Be the best in whatever we choose
to do
As we step into the development and execution of our long term strategy, our focus remains on enhancing shareholder value while building a sustainable business momentum. We have clearly defined our priorities for 2021 where the teams will lead a unified effort to deliver aggressively and rebuild business levels to our true potential.
We have identified five areas of focus to maximize our core earnings.• The bank will look to reposition, optimize and improve the branch
network by improving service levels with operational efficiencies. • A re-focus on International, returning to profitability and evaluating
the business model.
President and CEO Review 2020
United Bank Limited44

• Prioritizing non-fund income as a key component of our growth strategy, with a strong culture of cross sell.
• Technology enhancements – leverage and build digital capabililities to strengthen customer service
• More Proactive Treasury - Capitalize on AFS opportunities, better balance sheet management and reduce concentration risk
The wheels have been set in motion with initiatives across each area being carefully evaluated. We look forward to sharing the results in the near future.
Branch Banking Group (BBG)
Branch Network performance continues to drive earnings growthBranch Banking remains the key driver for our domestic franchise. With a network of over 1,356 branches in Pakistan (2019: 1,362 branches), located in all major regions of the country, the bank remains well positioned to serve its ever growing customer base of over 10 million customers. Our acquisition drive, particularly within current accounts, continued as we on-boarded 571,000 new to bank (NTB) current deposit customers (2019: 534,000 NTB current deposits customers). This enabled the domestic franchise to record a 13% growth in average current deposits, which were measured at Rs. 538 billion in 2020. Active buildup of current deposits remained the key priority for our distribution teams with a multi-pronged focus on mobilizing new customers as well as deepening existing relationships. The bank is actively utilizing its digital and IT capabilities to better understand the banking needs of our customers in order to serve them with the right offerings. We have a segmented liabilities strategy serving a wide spectrum of customers ranging from retail and individual customers to top corporates, institutions as well as public sector entities.
UBL continues to be the industry leader in Home Remittances, with a market share of over 23% in 2020 and remittance flows of over USD 6 billion in 2020. Through its presence in the GCC, strong and longstanding partnerships with international exchange houses, UBL is facilitating expats to send their remittances through formal documented channels. Furthermore, UBL has been playing a leading role in supporting the Roshan Digital Account initiative as part of State Bank of Pakistan’s (SBP) efforts to provide non-resident Pakistanis (NRPs) with basic banking and investment opportunities within Pakistan. For its efforts, UBL was recognized by the Government of Pakistan for having opened the highest number of Roshan Digital accounts in 2020.
Recognizing the significance and rapid growth of Islamic Banking in Pakistan, the bank is investing in its presence in the sector under our Islamic Banking proposition “UBL Ameen”. Our Islamic network currently stands at 100 Islamic branches with 187 Islamic Banking windows spread across our conventional banking network to further expand our reach. Our efforts have yielded strong results with Islamic Deposits increasing to approx. Rs. 111 billion as at Dec’20, a growth of 37% versus Dec’19. The investments book has expanded by 34% over the same period to Rs. 63 billion as at Dec’20 while Islamic financing stood at Rs 20.5 billion at Dec’20, more than double the volumes at Dec’19. As a result, UBL Ameen posted a PBT of Rs. 2.5 billion for 2020, an increase of 62% over 2019.
During the year, the bank launched a unique current account product named, “UBL Good Citizen Account”. With the objective to support the government’s documentation drive, this product is designed for tax payers, offering lower markup rates on consumer and small business loans, free ATM cash withdrawals and natural, accidental (including Covid-19) life insurance along with fee waivers on banking services. Moreover, the product offers a tax filing service through our alliances. This product has been a resounding success with a portfolio of Rs. 15 billlion and over 41,000 accounts opened within the six months of its launch.
Diversified fee streams have strong rebound in last quarter Customer fees from branch banking operations were recorded at Rs. 1.6 billion in 2020, down 17% year on year, due to lower branch traffic when compared with last year. Bancassurance commissions were recorded at Rs. 1.2 billion in 2020, down 27% over 2019, with premium volumes of Rs. 2.6 billion in 2020 (2019: Rs. 3.7 billion). However, business activity has picked up well in the second half of the year, and all fee lines are now at pre COVID levels.
Commission income from ATM / Debit cards were recorded at Rs. 1.6 billion in 2020, largely in line with last year’s levels. The bank added 681,000 debit cards in 2020, taking the overall active debit cards portfolio to over 2.1 million. The bank maintains an ATM network size of 1,442 ATMs as at Dec’20 (Dec’19: 1,479 ATMs). The year also marked the success of our ATM network maintaining an excellent service uptime of 96.6%, one of the highest in the industry.
Maintaining a strong presence in the mid-market and individual lending spaceThe bank operates one of the largest networks with dedicated centers spread across all major business hubs in Pakistan. In 2020, UBL proactively supported small enterprises, partnering with the SBP to support businesses impacted by COVID through salary and wages support loans worth Rs. 904 million. Moreover, in order to provide cash flow support to the sector, the bank deferred payments of Rs. 1.0 billion under SBP’s Loan Deferment scheme in 2020. Despite the COVID led challenges, UBL managed to book 140 new relationships during 2020.
Consumer Banking maintained its overall portfolio size at Rs 17 billion. The portfolio remains concentrated in the autos segment which grew by 8% during the year, with demand picking up well in the market in the last 6 months.
Corporate and Investment Banking Group (CIBG)
Portfolio quality remains strong with NFI focusCIBG offers multi-dimensional solutions to its clients for their working capital, trade and long term financing needs. In 2020, given the challenging economic conditions plus the onset of COVID, our focus shifted towards de-risking and maintaining portfolio quality. During these difficult times, we played a leading role in facilitating our corporate clients under the relief measures introduced by the State Bank. This includes active participation in the SBP Rozgar Scheme, loan deferments to support our customers and commitments under the SBP Temporary Economic Relief Facility (TERF). CIBG advances closed Dec’20 at Rs. 366 billion, a decline of 17% over Dec’19. We enter 2021 well positioned to expand the book with a clear emphasis to facilitate greater intermediation, expand our share of trade volumes and actively build our non-markup income streams.
UBL’s Investment Banking Group (IBG) prides itself in focusing on transactions and sectors that have been at the forefront of economic development in the country and promoted by both provincial and federal governments and the regulator. The Group distinguishes itself through four specialized functions namely Debt Capital Markets, Project Finance, Financial Advisory services and Syndications, Agency / Trustee and Custodian business. Our focus remains on continuously enhancing our product offerings across sectors and providing tailor-made solutions in line with needs of project sponsors, investors and the GoP whilst ensuring compliance with all applicable laws and regulations.
Mr. Shazad G. Dada, President & CEO UBL receiving acknowledgement memento from Mr. Imran Khan, Prime Minister Pakistan on UBL achieving highest number of Roshan Digital Accounts opened.
45Annual Report 2020

In 2020, the Group managed to close deals aggregating Rs. 200 billion, including UBL’s own underwriting commitment of over Rs. 30 billion. These transactions were mainly within the energy sector. The highlight for the year was the successful closure of Punjab Thermal Power Limited, which is one of the largest Project Finance transactions in Pakistan. IBG continues to solicit advisory mandates and enters 2021 with a healthy pipeline.
The Transaction Banking Group (TBG) also delivered a strong throughput on collections and payments, including the digital portal. The bank on-boarded 120 new cash management mandates with volumes close to Rs. 3 trillion processed in 2020.
Treasury and Capital Markets (TCM)
Well diversified investment book with stable marginsUBL’s Treasury and Capital Markets is at the forefront in market making activities of government securities. The bank is a primary dealer with a development role in the domestic market and was one of the first authorized derivatives dealers appointed by SBP in Pakistan. TCM provides access to primary markets for a wide array of clients along with facilitating other financial institutions like leasing companies, microfinance institutions, insurance companies, mutual funds, government entities and institutions. These strengths are primarily due to the UBL’s brand and the size of our balance sheet.
We continued to build our treasury securities holdings in 2020, ensuring a diversified portfolio across treasury bills as well as fixed rated and floater PIBs which contributed towards healthy accrual income. The bank actively participates in the FX market, leveraging our top tier corporate client base, large home remittance and wide branch network to aggressively pursue cross sell opportunities. Proactive positioning despite a relatively stable exchange rate environment resulted in a contribution of Rs. 2.3 billion in FX earnings in 2020.
On the capital markets front, TCM maintains a healthy equity book, comprising a well-diversified portfolio, which led to stable dividend income during the year. KSE-100 index performance was impacted by COVID led slowdown during 2020, however, the markets did rally in the second half of the year. Seizing on the profitable opportunities, capital gains (including impairment reversals) of Rs. 1.1 billion were realized during the year.
Digital Banking Group
Strong shift towards Digital driving transformation road mapUBL remains the industry leader in providing innovative and technologically superior digital banking services to our growing customer base. Our digital strategy is centered around ensuring widespread use of digital channels, particularly amongst the vast unbanked segment of the population, to access basic banking facilities in a convenient and easy manner. The bank is continuously exploring innovative ways to redesign its products, processes and customer interactions to better serve the ever growing customer needs.
Our UBL Digital app. is an embodiment of the foundational principles of our digital philosophy. The app. not only provides a convenient mode
to undertake banking activities but also serves as a unique channel to onboard customers towards a full-fledged liability relationship. The app. was released in 2018 and has gained immense popularity within our customer base. Our registered subscribers surpassed the 1.5 million mark as at December 31, 2020.
The bank continues to come up with innovative and exciting digital solutions to enable customers to make payments in a hassle free manner. We introduced a new payment feature on our digital app. - “UBL Pay”. UBL Pay is a contactless payment solution that enables customers to make secure payments on any digital medium, while also safeguarding their confidential information. The app. also includes the facility to open a Roshan Digital account as part of SBP’s initiative to support non-resident Pakistanis (NRPs) banking needs in Pakistan.
UBL’s technological advancements continue to be well received by our customers and also recognized by industry observers. UBL was declared Pakistan’s Best Digital Bank for 2020 by Asiamoney, an associate of Euromoney. The award is a testament to UBL’s contribution in expanding the scope of financial services through digital channels in Pakistan and spearheading innovation in the local banking industry.
Furthermore, UBL was also declared the ‘Best Digital Bank’ at the 2020 Pakistan Banking Awards. The year has seen the bank work on innovative ways to bring about many customer centric technological offerings. The award is a testament to UBL’s position as Pakistan’s leading progressive and innovative bank.
UBL Information Technology Group
Information Technology remains the key driver of change within UBLUBL IT ensures that our technology investments enable the bank to achieve its strategic objectives. The bank’s IT teams have been working with front end businesses and support functions to ensure that end service delivery is in line with our overall Design Thinking and Agile Methodology. In response to the challenges posed by the pandemic, UBL IT worked tirelessly to ensure continued services availability across all channels including the Digital app., Net banking, ATMs and contact centers, as well as swiftly and efficiently scaling up to handle the higher traffic across various channels.
Collaborating with SBP on Raast - Pakistan’s Instant Payment SystemIn order to broaden the scope of digital financial services in the country, SBP initiated Raast - Pakistan’s Instant Payment System in 2020, intended to enable end-to-end digital payments amongst individuals, businesses and government entities instantaneously.
UBL believes in expanding the scope of financial services throughout Pakistan. The bank successfully collaborated with SBP to promote the Raast initiative and was one of the few financial institutions in the country to develop and launch payment messaging services and also establishing communication with the micropayment gateway.
We will continue to work with the regulators towards achieving the broader strategic aim of ensuring greater financial inclusion as well as promoting convenient payment modes within Pakistan.
Enhancing Information Security as use of digital channels becomes more extensiveThe use of Digital and IT channels is fast becoming more widespread in the general economy. UBL remains cognizant of the evolution taking place within the local banking space. The bank has significantly scaled up its security measures to protect our customer’s data as well as the bank’s own intellectual assets.
The bank upgraded its protection measures against cyber threats through instituting greater access controls over systems’ administrators including two-factor authentication, network, email and endpoint intrusion prevention, 24x7 security events monitoring, post-
Mr. Shazad G. Dada, President & CEO UBL receiving the award of ‘Best Digital Bank’ from Dr. Reza Baqir, Governor State Bank of Pakistan and Mr. Mansur-Ur-Rehman Khan, Chief Executive IBP at the Pakistan Banking Awards 2020.
United Bank Limited46

incident malware forensics analysis, as well as internal and external vulnerability scanning and penetration tests, through continuous risk and configuration assessments.
The bank evaluates Information and cyber security risks on an ongoing basis through a comprehensive risk register, which enables IT to prioritize remediation efforts while ensuring service continued availability.
UBL International
Conservative outlook led to consolidation and de-riskingThe COVID-19 pandemic has had far reaching consequences for the global economy. The GCC region has been hard hit by the pandemic and regional governments instituted strict lockdown and travel restrictions to control the spread. Prior to COVID, GCC economies were already being impacted by continued lower oil prices, mandated production cuts, slowdown in the non-oil economy due to slowdown in credit growth as well as weak overall regional demand.
GCC governments instituted a number of measures to help stimulate the economies including introducing fiscal stimulus measures, easing monetary rules and liquidity injections in the banking sector as part of a comprehensive reforms package. Furthermore, a number of GCC countries are now ensuring mass availability of vaccines to inoculate the general population.
Within our International operations, UBL continued with its de-risking strategy in 2020. The bank actively reduced its performing loan book, from USD 830 million at Dec’19 to USD 601 million at Dec’20, a year on year reduction of 28%. We have redefined our lending strategy in line with the region’s economic realities. Loan disbursement decisions in all countries is centered around maintaining a cleaner overall portfolio. We are looking to expand and add quality FI names for placements and actively pursuing more opportunities in the trade financing space. Our control functions are exercising enhanced risk vigilance at all times to ensure optimal portfolio health and contain any new NPL formation while our special asset management teams are aggressively pursuing recoveries against non-performing accounts. The active reduction in the loan book enabled the bank to reduce our USD denominated RWAs by over USD 400 million since Dec’19.
Our liabilities strategy within international branches is centered around building a long term portfolio of sustainable CASA deposits to ensure each region has a stable base to fund their operations. UBL remains the preferred partner of the Pakistani diaspora, particularly within the GCC, for home remittances. As part of our strategy for acquiring NTB customers, the bank introduced the Digital app. within UAE to provide momentum to our sales drive. The digital app. along with an active sales effort in all regions is intended to onboard remittance customers towards a full deposits relationship. UBL International’s deposits base stood at USD 1.4 billion as at Dec’20, declining by 15% since Dec’19. Furthermore, the bank is actively looking to reduce concentration levels particularly within fixed deposits. These efforts have helped in reducing the cost of deposits from 2.2% in 2019 to 1.6% in 2020.
Excess liquidity is deployed in sovereign government debt securities across all regions. The deployments enabled the bank to maintain stable interest income throughout the year. UBL International’s investments averaged USD 701 million in 2020 (2019: USD 659 million), earning the bank healthy USD returns of 6.0% during the current year. Marked to market revaluation surplus on these holding stood close to USD 25 million at Dec’20 and the bank realized healthy capital gains when profitable opportunities presented during the year.
Human Resource (HR)
Building high performance culture while attracting the top talentUBL’s people remain the foundational pillar of our institution and our greatest asset. Our focus remains on being the country’s premier banking institution, which continues to attract the best people and
nurture their talent, transforming them into future leaders. The bank puts great emphasis on developing multi-skilled employees through trainings and internal rotations. Our remuneration structure remains highly competitive and ensures that we attract and retain the best talent. Employee recognition is a key component of our People strategy and we are committed in appreciating and rewarding our employees’ contributions and tireless hard work. We pride ourselves on sustaining a culture that rewards excellence, teamwork and a customer first attitude. The bank is actively conducting townhalls via physical and virtual channels to promote greater unity, clearer communication of organizational strategy and objectives and more meaningful interaction between the bank’s senior management and employees.
UBL’s staff strength stood at 13,012 as at Dec’20 (Dec’19: 13,248). HR strategy for the estate network is aimed at ensuring that branches are adequately staffed with an optimal mix of front end and support staff. We are looking to actively expand our business teams through new hirings as well as internal transfers, while ensuring that all support functions are also adequately staffed.
Conclusion
2020 has been one of the most difficult years in recent memory. However, as a result of the dedication of our teams, we continue to deliver consistent and stable returns to our shareholders.
Looking ahead, our strategy is focused on enhancing performance and achieving excellence within our core businesses, building greater operational efficiencies and agility across the organization and continuously investing in our people and culture. We will build on our award winning digital proposition and ensure customer centricity remains at the heart of everything we do. These will be strategic pillars that will further strengthen the Bank for a more challenging business environment in the future.
Branch Banking will continue to play a leading role in enabling UBL to achieve its strategic ambitions. Growing our market share remains a key priority. We will achieve this by offering broad based attractive products, deepening our customer relationships and maximizing our network performance, while improving our customer service levels to be the best in class. On the asset side, lending strategy would be directed by maximizing relationship yields, efficient capital utilization and maintaining optimal asset quality. We are redefining our business model in each of our overseas locations, in view of evolving economic realities. We aim to lead within the digital space through innovation and by evolving our service offerings with state of the art digital solutions. Along with developing our businesses, we seek to adhere to the highest levels of compliance. For us, continuous investment in human capital remains the key to achieving our goals and creating the leaders of tomorrow.
I would like to thank all our stakeholders including our shareholders, the Board of Directors, State Bank of Pakistan, the SECP and other regulatory bodies who have firmly supported us during these unprecedented times. I would especially like to express my sincere gratitude to my colleagues who have under such challenging circumstances, continued to provide the highest level of service to our customers.
Shazad G. DadaPresident & CEOFebruary 24, 2021
47Annual Report 2020

Management Team
Aslam SadruddinGroup Executive - Operations
Shazad G. DadaPresident & CEO
Aameer M. KarachiwallaChief Financial Officer
Sharjeel ShahidGroup Executive - Digital Banking
From left to right (Standing)
From left to right (Sitting)
Sadia SaeedGroup Executive - Human Resources
Zia IjazGroup Executive - Branch Banking& International
Aqeel Ahmed NasirCompany Secretary & Chief Legal Counsel
Sajid HussainGroup Executive - Compliance
Irfan Farooq MemonGroup Head - Audit &Risk Review
Muhammad Faisal AnwarChief Information Officer
Furrukh ZaeemGlobal Head - Treasury & Capital Markets
Farooq Ahmed KhanGroup Head - Corporate& Investment Banking
Tanveer Farhan MahmoodHead - Islamic Banking
Shahid Mahmood KhanGroup Head - SpecialAssets Management
Imran SarwarGroup Executive - Risk & Credit Policy
From left to right (Standing)
From left to right (Sitting)
United Bank Limited48

Management Team
Aslam SadruddinGroup Executive - Operations
Shazad G. DadaPresident & CEO
Aameer M. KarachiwallaChief Financial Officer
Sharjeel ShahidGroup Executive - Digital Banking
From left to right (Standing)
From left to right (Sitting)
Sadia SaeedGroup Executive - Human Resources
Zia IjazGroup Executive - Branch Banking& International
Aqeel Ahmed NasirCompany Secretary & Chief Legal Counsel
Sajid HussainGroup Executive - Compliance
Irfan Farooq MemonGroup Head - Audit &Risk Review
Muhammad Faisal AnwarChief Information Officer
Furrukh ZaeemGlobal Head - Treasury & Capital Markets
Farooq Ahmed KhanGroup Head - Corporate& Investment Banking
Tanveer Farhan MahmoodHead - Islamic Banking
Shahid Mahmood KhanGroup Head - SpecialAssets Management
Imran SarwarGroup Executive - Risk & Credit Policy
From left to right (Standing)
From left to right (Sitting)
49Annual Report 2020

CompassionClose at HandUBL has always strived to consolidate itself as a conscientious and respected corporate citizen. Building our immediate communities is at the heart of our transformation journey. We have a robust sustainability agenda geared towards contributing back to the society through multiple areas including education and healthcare.
In 2020, an unparalleled year consumed by the devastations of a global pandemic, we strived to further our sustainability efforts by venturing into areas that fostered our mission to contribute positively. From the onset of the pandemic, we actively sought to promote the Bank’s Digital Vision to maximize customer safety and well-being. Under the auspices of the State Bank of Pakistan, we offered multiple financial relief packages to customers affected by the pandemic/lockdowns and most importantly, we very actively pursued a comprehensive supportive campaign to contribute back to the society. Not just that, we are also committed to celebrating the literary talents and efforts of our people, with the UBL Literary Awards which bring to the forefront budding authors from across the country.
We, at UBL, are invested in protecting and nurturing what is unique to us, while at the same time championing change to propel us into the future.
United Bank Limited50

CompassionClose at HandUBL has always strived to consolidate itself as a conscientious and respected corporate citizen. Building our immediate communities is at the heart of our transformation journey. We have a robust sustainability agenda geared towards contributing back to the society through multiple areas including education and healthcare.
In 2020, an unparalleled year consumed by the devastations of a global pandemic, we strived to further our sustainability efforts by venturing into areas that fostered our mission to contribute positively. From the onset of the pandemic, we actively sought to promote the Bank’s Digital Vision to maximize customer safety and well-being. Under the auspices of the State Bank of Pakistan, we offered multiple financial relief packages to customers affected by the pandemic/lockdowns and most importantly, we very actively pursued a comprehensive supportive campaign to contribute back to the society. Not just that, we are also committed to celebrating the literary talents and efforts of our people, with the UBL Literary Awards which bring to the forefront budding authors from across the country.
We, at UBL, are invested in protecting and nurturing what is unique to us, while at the same time championing change to propel us into the future.
51Annual Report 2020

December 31 2020 2019 2018 2017 2016 2015
Financial Ratios Return on equity (RoE) 13.9% 13.8% 11.6% 20.6% 24.9% 25.7%Return on assets (RoA) 1.1% 1.0% 0.8% 1.4% 1.8% 2.0%Profit before tax ratio 37.1% 41.0% 30.7% 50.8% 57.1% 54.2%Gross spread ratio 49.3% 40.2% 49.7% 52.6% 58.1% 59.2%Return on capital employed (RoCE) 13.1% 12.9% 11.3% 20.6% 24.9% 25.7%Advances to deposits ratio (ADR) - gross 33.5% 44.3% 53.2% 49.8% 45.6% 45.2%Advances to deposits ratio (ADR) - net 28.7% 39.7% 48.7% 46.4% 42.1% 41.3%Income to expense ratio 2.26 2.04 1.88 2.18 2.46 2.45 Cost to revenue ratio 43.5% 48.2% 47.8% 45.0% 39.6% 39.7%Growth in gross income 10.3% 2.7% 3.4% -2.6% 3.6% 21.1%Growth in net profit after tax 9.2% 25.7% -39.5% -9.2% 7.8% 17.3%Total assets to shareholders’ funds 11.1 11.2 12.5 12.8 10.5 9.9 Intermediation cost ratio 2.6% 2.9% 3.3% 3.0% 3.0% 3.3%Asset quality (NPL ratio) 13.7% 11.0% 8.8% 7.8% 8.0% 9.4%Net infection ratio 0.9% 1.6% 1.1% 1.5% 0.8% 1.1%Weighted average cost of debt 5.3% 6.5% 4.1% 4.2% 4.4% 5.0%Capital adequacy ratio (CAR) 24.4% 18.9% 17.7% 15.4% 15.1% 14.6%
Share Information Cash dividend per share 12.00 12.00 11.00 13.00 13.00 13.00Dividend yield (based on cash dividend) 7.3% 9.8% 5.9% 5.4% 8.4% 7.4%Dividend payout ratio (total payout) 70.3% 76.8% 88.4% 63.2% 57.4% 61.9%Earning per share (EPS) - Rs 17.07 15.63 12.44 20.57 22.65 21.02 Price earnings ratio 7.37 10.52 9.86 9.14 10.55 7.37 Market value per share - at the end of the year - Rs 125.86 164.50 122.64 187.97 238.90 154.95Market value per share - highest during the year - Rs 181.96 173.53 219.70 283.00 243.72 186.75Market value per share - lowest during the year - Rs 89.44 119.67 121.85 162.01 137.31 141.25Breakup value per share - without surplus on revaluation of assets - Rs 127.79 117.00 110.02 103.74 95.53 86.48 Breakup value per share - with surplus on revaluation of assets - Rs 150.36 138.11 123.57 130.13 123.99 116.10
Other Information Non-performing advances (NPLs) - Rs in million 83,624 76,986 68,562 52,247 44,567 46,833 Import business - Rs in million 544,166 824,858 936,749 720,496 575,991 607,496 Export business - Rs in million 138,797 177,279 202,748 294,428 255,287 220,701 Number of employees 13,012 13,248 13,931 14,771 14,153 14,623 Number of branches - Domestic 1,356 1,362 1,364 1,361 1,341 1,312 Number of branches - International 14 14 15 18 18 18 Number of branches - Total 1,370 1,376 1,379 1,379 1,359 1,330
Growthat a Glance
December 31 2020 2019 2018 2017 2016 2015
Balance Sheet Assets Cash and balances with treasury and other banks 264,727 256,591 206,813 177,099 146,428 128,870 Lendings to financial institutions 19,959 20,183 33,942 10,868 25,711 24,095 Investments - gross 1,138,018 849,441 792,857 1,095,555 808,959 721,651 Advances - gross 609,307 702,951 776,272 670,056 559,093 497,032 Operating fixed assets 53,037 54,348 47,556 46,205 35,582 31,630 Other assets 52,906 85,497 98,976 79,617 67,812 41,124 Total assets - gross 2,137,954 1,969,011 1,956,417 2,079,400 1,643,585 1,444,402 Provisions against non-performing advances (79,028) (67,117) (60,336) (42,697) (40,525) (41,618)Provisions against diminution in value of investments (9,344) (9,118) (6,482) (3,769) (2,428) (2,133)Total assets - net of provisions 2,049,583 1,892,775 1,889,599 2,032,934 1,600,632 1,400,651 Liabilities & Equity Deposits & other accounts 1,640,212 1,467,063 1,366,060 1,272,788 1,167,124 1,051,235 Borrowings from financial institutions 128,987 154,484 268,124 512,650 201,550 163,132 Subordinated loans 10,000 10,000 9,000 - - - Bills payable 29,734 22,927 27,249 29,848 24,520 13,392 Other liabilities 56,577 69,232 67,896 58,341 55,651 30,757 Total liabilities 1,865,510 1,723,706 1,738,329 1,873,627 1,448,845 1,258,516 Net assets 184,073 169,069 151,270 159,307 151,787 142,135 Share capital 12,242 12,242 12,242 12,242 12,242 12,242 Reserves 62,274 59,320 54,439 43,847 40,455 38,402 Unappropriated profit 81,916 71,670 68,002 70,912 64,246 55,223 Equity - Tier I 156,432 143,232 134,683 127,001 116,943 105,867 Surplus on revaluation of assets - net of deferred tax 27,641 25,837 16,587 32,306 34,844 36,268 Total equity 184,073 169,069 151,270 159,307 151,787 142,135 Total liabilities & equity 2,049,583 1,892,775 1,889,599 2,032,934 1,600,632 1,400,651
Profitability Markup / return / interest earned 152,003 153,676 113,198 107,206 98,219 94,353 Markup / return / interest expensed (77,044) (91,902) (56,964) (50,781) (41,177) (38,511)Net markup / return / interest income 74,959 61,774 56,234 56,425 57,042 55,842 Fee, commission, brokerage and exchange income 14,782 18,219 17,396 14,496 14,020 14,474 Capital gains & dividend income 1,681 1,541 6,648 6,762 8,629 6,442 Other income 631 1,916 967 904 960 1,070 Total non interest income 17,094 21,676 25,011 22,162 23,609 21,986 Gross income 92,054 83,451 81,246 78,587 80,651 77,828 Administrative expenses and other charges (40,751) (40,860) (43,222) (36,109) (32,809) (31,776)Profit before donations and provisions 51,303 42,590 38,024 42,478 47,842 46,052 Donations (342) (129) (203) (110) (87) (167)Provisions (16,768) (8,220) (12,854) (2,450) (1,740) (3,710)Profit before taxation 34,192 34,242 24,967 39,918 46,015 42,175 Taxation (13,294) (15,108) (9,741) (14,739) (18,285) (16,448)Profit after taxation 20,899 19,134 15,226 25,179 27,730 25,727
Cash Flow Statement - Summary Cash flow from operating activities 372,630 134,204 (244,642) 253,459 130,777 266,960 Cash flow from investing activities (355,046) (74,098) 271,086 (208,158) (96,241) (211,420)Cash flow from financing activities (10,312) (14,629) (5,800) (15,480) (16,257) (15,942)Cash and cash equivalents at the beginning of the year 256,591 206,813 177,099 146,428 128,870 87,573 Effect of exchange rate changes on cash and cash equivalents 865 4,300 9,070 850 (721) 1,699 Cash and cash equivalents at the end of the year 264,727 256,591 206,813 177,099 146,428 128,870
Six Years Financial Summary Standalone
Rs. in million
United Bank Limited52

December 31 2020 2019 2018 2017 2016 2015
Financial Ratios Return on equity (RoE) 13.9% 13.8% 11.6% 20.6% 24.9% 25.7%Return on assets (RoA) 1.1% 1.0% 0.8% 1.4% 1.8% 2.0%Profit before tax ratio 37.1% 41.0% 30.7% 50.8% 57.1% 54.2%Gross spread ratio 49.3% 40.2% 49.7% 52.6% 58.1% 59.2%Return on capital employed (RoCE) 13.1% 12.9% 11.3% 20.6% 24.9% 25.7%Advances to deposits ratio (ADR) - gross 33.5% 44.3% 53.2% 49.8% 45.6% 45.2%Advances to deposits ratio (ADR) - net 28.7% 39.7% 48.7% 46.4% 42.1% 41.3%Income to expense ratio 2.26 2.04 1.88 2.18 2.46 2.45 Cost to revenue ratio 43.5% 48.2% 47.8% 45.0% 39.6% 39.7%Growth in gross income 10.3% 2.7% 3.4% -2.6% 3.6% 21.1%Growth in net profit after tax 9.2% 25.7% -39.5% -9.2% 7.8% 17.3%Total assets to shareholders’ funds 11.1 11.2 12.5 12.8 10.5 9.9 Intermediation cost ratio 2.6% 2.9% 3.3% 3.0% 3.0% 3.3%Asset quality (NPL ratio) 13.7% 11.0% 8.8% 7.8% 8.0% 9.4%Net infection ratio 0.9% 1.6% 1.1% 1.5% 0.8% 1.1%Weighted average cost of debt 5.3% 6.5% 4.1% 4.2% 4.4% 5.0%Capital adequacy ratio (CAR) 24.4% 18.9% 17.7% 15.4% 15.1% 14.6%
Share Information Cash dividend per share 12.00 12.00 11.00 13.00 13.00 13.00Dividend yield (based on cash dividend) 7.3% 9.8% 5.9% 5.4% 8.4% 7.4%Dividend payout ratio (total payout) 70.3% 76.8% 88.4% 63.2% 57.4% 61.9%Earning per share (EPS) - Rs 17.07 15.63 12.44 20.57 22.65 21.02 Price earnings ratio 7.37 10.52 9.86 9.14 10.55 7.37 Market value per share - at the end of the year - Rs 125.86 164.50 122.64 187.97 238.90 154.95Market value per share - highest during the year - Rs 181.96 173.53 219.70 283.00 243.72 186.75Market value per share - lowest during the year - Rs 89.44 119.67 121.85 162.01 137.31 141.25Breakup value per share - without surplus on revaluation of assets - Rs 127.79 117.00 110.02 103.74 95.53 86.48 Breakup value per share - with surplus on revaluation of assets - Rs 150.36 138.11 123.57 130.13 123.99 116.10
Other Information Non-performing advances (NPLs) - Rs in million 83,624 76,986 68,562 52,247 44,567 46,833 Import business - Rs in million 544,166 824,858 936,749 720,496 575,991 607,496 Export business - Rs in million 138,797 177,279 202,748 294,428 255,287 220,701 Number of employees 13,012 13,248 13,931 14,771 14,153 14,623 Number of branches - Domestic 1,356 1,362 1,364 1,361 1,341 1,312 Number of branches - International 14 14 15 18 18 18 Number of branches - Total 1,370 1,376 1,379 1,379 1,359 1,330
Growthat a Glance
December 31 2020 2019 2018 2017 2016 2015
Balance Sheet Assets Cash and balances with treasury and other banks 264,727 256,591 206,813 177,099 146,428 128,870 Lendings to financial institutions 19,959 20,183 33,942 10,868 25,711 24,095 Investments - gross 1,138,018 849,441 792,857 1,095,555 808,959 721,651 Advances - gross 609,307 702,951 776,272 670,056 559,093 497,032 Operating fixed assets 53,037 54,348 47,556 46,205 35,582 31,630 Other assets 52,906 85,497 98,976 79,617 67,812 41,124 Total assets - gross 2,137,954 1,969,011 1,956,417 2,079,400 1,643,585 1,444,402 Provisions against non-performing advances (79,028) (67,117) (60,336) (42,697) (40,525) (41,618)Provisions against diminution in value of investments (9,344) (9,118) (6,482) (3,769) (2,428) (2,133)Total assets - net of provisions 2,049,583 1,892,775 1,889,599 2,032,934 1,600,632 1,400,651 Liabilities & Equity Deposits & other accounts 1,640,212 1,467,063 1,366,060 1,272,788 1,167,124 1,051,235 Borrowings from financial institutions 128,987 154,484 268,124 512,650 201,550 163,132 Subordinated loans 10,000 10,000 9,000 - - - Bills payable 29,734 22,927 27,249 29,848 24,520 13,392 Other liabilities 56,577 69,232 67,896 58,341 55,651 30,757 Total liabilities 1,865,510 1,723,706 1,738,329 1,873,627 1,448,845 1,258,516 Net assets 184,073 169,069 151,270 159,307 151,787 142,135 Share capital 12,242 12,242 12,242 12,242 12,242 12,242 Reserves 62,274 59,320 54,439 43,847 40,455 38,402 Unappropriated profit 81,916 71,670 68,002 70,912 64,246 55,223 Equity - Tier I 156,432 143,232 134,683 127,001 116,943 105,867 Surplus on revaluation of assets - net of deferred tax 27,641 25,837 16,587 32,306 34,844 36,268 Total equity 184,073 169,069 151,270 159,307 151,787 142,135 Total liabilities & equity 2,049,583 1,892,775 1,889,599 2,032,934 1,600,632 1,400,651
Profitability Markup / return / interest earned 152,003 153,676 113,198 107,206 98,219 94,353 Markup / return / interest expensed (77,044) (91,902) (56,964) (50,781) (41,177) (38,511)Net markup / return / interest income 74,959 61,774 56,234 56,425 57,042 55,842 Fee, commission, brokerage and exchange income 14,782 18,219 17,396 14,496 14,020 14,474 Capital gains & dividend income 1,681 1,541 6,648 6,762 8,629 6,442 Other income 631 1,916 967 904 960 1,070 Total non interest income 17,094 21,676 25,011 22,162 23,609 21,986 Gross income 92,054 83,451 81,246 78,587 80,651 77,828 Administrative expenses and other charges (40,751) (40,860) (43,222) (36,109) (32,809) (31,776)Profit before donations and provisions 51,303 42,590 38,024 42,478 47,842 46,052 Donations (342) (129) (203) (110) (87) (167)Provisions (16,768) (8,220) (12,854) (2,450) (1,740) (3,710)Profit before taxation 34,192 34,242 24,967 39,918 46,015 42,175 Taxation (13,294) (15,108) (9,741) (14,739) (18,285) (16,448)Profit after taxation 20,899 19,134 15,226 25,179 27,730 25,727
Cash Flow Statement - Summary Cash flow from operating activities 372,630 134,204 (244,642) 253,459 130,777 266,960 Cash flow from investing activities (355,046) (74,098) 271,086 (208,158) (96,241) (211,420)Cash flow from financing activities (10,312) (14,629) (5,800) (15,480) (16,257) (15,942)Cash and cash equivalents at the beginning of the year 256,591 206,813 177,099 146,428 128,870 87,573 Effect of exchange rate changes on cash and cash equivalents 865 4,300 9,070 850 (721) 1,699 Cash and cash equivalents at the end of the year 264,727 256,591 206,813 177,099 146,428 128,870
Six Years Financial Summary Standalone
Rs. in million
53Annual Report 2020

December 31 2020 2019 2018 2017 2016 2015
Financial Ratios Return on equity (RoE) 13.9% 13.8% 11.6% 20.6% 24.9% 25.7%Return on assets (RoA) 1.1% 1.0% 0.8% 1.4% 1.8% 2.0%Profit before tax ratio 37.1% 41.0% 30.7% 50.8% 57.1% 54.2%Gross spread ratio 49.3% 40.2% 49.7% 52.6% 58.1% 59.2%Return on capital employed (RoCE) 13.1% 12.9% 11.3% 20.6% 24.9% 25.7%Advances to deposits ratio (ADR) - gross 33.5% 44.3% 53.2% 49.8% 45.6% 45.2%Advances to deposits ratio (ADR) - net 28.7% 39.7% 48.7% 46.4% 42.1% 41.3%Income to expense ratio 2.26 2.04 1.88 2.18 2.46 2.45 Cost to revenue ratio 43.5% 48.2% 47.8% 45.0% 39.6% 39.7%Growth in gross income 10.3% 2.7% 3.4% -2.6% 3.6% 21.1%Growth in net profit after tax 9.2% 25.7% -39.5% -9.2% 7.8% 17.3%Total assets to shareholders’ funds 11.1 11.2 12.5 12.8 10.5 9.9 Intermediation cost ratio 2.6% 2.9% 3.3% 3.0% 3.0% 3.3%Asset quality (NPL ratio) 13.7% 11.0% 8.8% 7.8% 8.0% 9.4%Net infection ratio 0.9% 1.6% 1.1% 1.5% 0.8% 1.1%Weighted average cost of debt 5.3% 6.5% 4.1% 4.2% 4.4% 5.0%Capital adequacy ratio (CAR) 24.4% 18.9% 17.7% 15.4% 15.1% 14.6%
Share Information Cash dividend per share 12.00 12.00 11.00 13.00 13.00 13.00Dividend yield (based on cash dividend) 7.3% 9.8% 5.9% 5.4% 8.4% 7.4%Dividend payout ratio (total payout) 70.3% 76.8% 88.4% 63.2% 57.4% 61.9%Earning per share (EPS) - Rs 17.07 15.63 12.44 20.57 22.65 21.02 Price earnings ratio 7.37 10.52 9.86 9.14 10.55 7.37 Market value per share - at the end of the year - Rs 125.86 164.50 122.64 187.97 238.90 154.95Market value per share - highest during the year - Rs 181.96 173.53 219.70 283.00 243.72 186.75Market value per share - lowest during the year - Rs 89.44 119.67 121.85 162.01 137.31 141.25Breakup value per share - without surplus on revaluation of assets - Rs 127.79 117.00 110.02 103.74 95.53 86.48 Breakup value per share - with surplus on revaluation of assets - Rs 150.36 138.11 123.57 130.13 123.99 116.10
Other Information Non-performing advances (NPLs) - Rs in million 83,624 76,986 68,562 52,247 44,567 46,833 Import business - Rs in million 544,166 824,858 936,749 720,496 575,991 607,496 Export business - Rs in million 138,797 177,279 202,748 294,428 255,287 220,701 Number of employees 13,012 13,248 13,931 14,771 14,153 14,623 Number of branches - Domestic 1,356 1,362 1,364 1,361 1,341 1,312 Number of branches - International 14 14 15 18 18 18 Number of branches - Total 1,370 1,376 1,379 1,379 1,359 1,330
December 31 2020 2019 2018 2017 2016 2015 Vertical Analysis Assets Cash and balances with treasury and other banks 12.9% 13.6% 10.9% 8.7% 9.1% 9.2%Lendings to financial institutions 1.0% 1.1% 1.8% 0.5% 1.6% 1.7%Investments - net 55.1% 44.4% 41.6% 53.7% 50.4% 51.4%Advances - net 25.9% 33.6% 37.9% 30.9% 32.4% 32.5%Operating fixed assets 2.6% 2.9% 2.5% 2.3% 2.2% 2.3%Other assets 2.6% 4.5% 5.2% 3.9% 4.2% 2.9%Total assets 100.0% 100.0% 100.0% 100.0% 100.0% 100.0% Liabilities & Equity Deposits & other accounts 80.0% 77.5% 72.3% 62.6% 72.9% 75.1%Borrowings from financial institutions 6.3% 8.2% 14.2% 25.2% 12.6% 11.6%Subordinated loans 0.5% 0.5% 0.5% 0.0% 0.0% 0.0%Bills payable 1.5% 1.2% 1.4% 1.5% 1.5% 1.0%Other liabilities 2.8% 3.7% 3.6% 2.9% 3.5% 2.2%Total liabilities 91.0% 91.1% 92.0% 92.2% 90.5% 89.9%Share capital 0.6% 0.6% 0.6% 0.6% 0.8% 0.9%Reserves 3.0% 3.1% 2.9% 2.2% 2.5% 2.7%Unappropriated profit 4.0% 3.8% 3.6% 3.5% 4.0% 3.9%Equity - Tier I 7.6% 7.6% 7.1% 6.2% 7.3% 7.6%Surplus on revaluation of assets - net of deferred tax 1.3% 1.4% 0.9% 1.6% 2.2% 2.6%Total equity 9.0% 8.9% 8.0% 7.8% 9.5% 10.1% Horizontal Analysis Assets Cash and balances with treasury and other banks 205.4% 199.1% 160.5% 137.4% 113.6% 100.0%Lendings to financial institutions 82.8% 83.8% 140.9% 45.1% 106.7% 100.0%Investments - net 156.9% 116.8% 109.3% 151.7% 112.1% 100.0%Advances - net 116.4% 139.6% 157.2% 137.8% 113.9% 100.0%Operating fixed assets 167.7% 171.8% 150.4% 146.1% 112.5% 100.0%Other assets 128.7% 207.9% 240.7% 193.6% 164.9% 100.0%Total assets 146.3% 135.1% 134.9% 145.1% 114.3% 100.0% Liabilities & Equity Deposits & other accounts 156.0% 139.6% 129.9% 121.1% 111.0% 100.0%Borrowings from financial institutions 79.1% 94.7% 164.4% 314.3% 123.6% 100.0%Subordinated loans 100.0% 100.0% 100.0% 0.0% 0.0% 0.0%Bills payable 222.0% 171.2% 203.5% 222.9% 183.1% 100.0%Other liabilities 183.9% 225.1% 220.7% 189.7% 180.9% 100.0%Total liabilities 148.2% 137.0% 138.1% 148.9% 115.1% 100.0%Share capital 100.0% 100.0% 100.0% 100.0% 100.0% 100.0%Reserves 162.2% 154.5% 141.8% 114.2% 105.3% 100.0%Unappropriated profit 148.3% 129.8% 123.1% 128.4% 116.3% 100.0%Equity - Tier I 147.8% 135.3% 127.2% 120.0% 110.5% 100.0%Surplus on revaluation of assets - net of deferred tax 76.2% 71.2% 45.7% 89.1% 96.1% 100.0%Total equity 129.5% 118.9% 106.4% 112.1% 106.8% 100.0%
Balance Sheet
December 31 2020 2019 2018 2017 2016 2015 Vertical Analysis Interest / Return / Non Interest Income Earned Markup / return / interest earned 89.9% 87.6% 81.9% 82.9% 80.6% 81.1%Fee, commission, brokerage and exchange income 8.7% 10.4% 12.6% 11.2% 11.5% 12.4%Capital gains & dividend income 1.0% 0.9% 4.8% 5.2% 7.1% 5.5%Other income 0.4% 1.1% 0.7% 0.7% 0.8% 0.9%Total 100.0% 100.0% 100.0% 100.0% 100.0% 100.0% Interest / Return / Non Interest Expense Markup / return / interest expensed 45.6% 52.4% 41.2% 39.3% 33.8% 33.1%Operating expenses 24.3% 23.4% 31.4% 28.0% 27.0% 27.5%Provisions 9.9% 4.7% 9.3% 1.9% 1.4% 3.2%Taxation 7.9% 8.6% 7.0% 11.4% 15.0% 14.1%Total expense - percentage of total income 87.6% 89.1% 89.0% 80.5% 77.2% 77.9% Profit after taxation 12.4% 10.9% 11.0% 19.5% 22.8% 22.1%Total 100.0% 100.0% 100.0% 100.0% 100.0% 100.0% Horizontal Analysis Interest / Return / Non Interest Income Earned Markup / return / interest earned 161.1% 162.9% 120.0% 113.6% 104.1% 100.0%Fee, commission, brokerage and exchange income 102.1% 125.9% 120.2% 100.2% 96.9% 100.0%Capital gains & dividend income 26.1% 23.9% 103.2% 105.0% 133.9% 100.0%Other income 59.0% 179.1% 90.3% 84.5% 89.7% 100.0%Total 145.3% 150.7% 118.8% 111.2% 104.7% 100.0% Interest / Return / Non Interest Expense Markup / return / interest expensed 200.1% 238.6% 147.9% 131.9% 106.9% 100.0%Operating expenses 128.6% 128.3% 135.9% 113.4% 103.0% 100.0%Provisions 452.0% 221.6% 346.5% 66.0% 46.9% 100.0%Taxation 80.8% 91.9% 59.2% 89.6% 111.2% 100.0%Total 163.6% 172.4% 135.7% 115.0% 103.8% 100.0% Profit after taxation 81.2% 74.4% 59.2% 97.9% 107.8% 100.0%
Profit and Loss Account
Statement of Value Added 2020 2019 Rs in million % Rs in million % Mark-up / return / interest earned - net of provisions 135,235 106.4% 145,457 103.3%Fee, commission, brokerage and exchange income 14,782 11.6% 18,219 12.9%Capital gains & dividend income 1,681 1.3% 1,541 1.1%Other income 631 0.5% 1,916 1.4% 152,329 119.8% 167,133 118.6% Administrative expenses 25,197 19.8% 26,259 18.6% Value added 127,132 100.0% 140,874 100.0% Distributed as follows: To employees as remuneration 15,554 12.2% 14,602 10.4% To government as income tax 13,294 10.5% 15,108 10.7% To depositors as profit on investments 60,642 47.7% 66,495 47.2% To institutions & individuals as profit on borrowings 16,402 12.9% 25,406 18.0%To society as donations 342 0.3% 129 0.1% To shareholders as dividends / bonus 7,957 6.3% 13,466 9.6% Retained in business as reserves and retained profits 12,941 10.2% 5,668 4.0% 127,132 100% 140,874 100%
Growthat a Glance
United Bank Limited54

December 31 2020 2019 2018 2017 2016 2015
Financial Ratios Return on equity (RoE) 13.9% 13.8% 11.6% 20.6% 24.9% 25.7%Return on assets (RoA) 1.1% 1.0% 0.8% 1.4% 1.8% 2.0%Profit before tax ratio 37.1% 41.0% 30.7% 50.8% 57.1% 54.2%Gross spread ratio 49.3% 40.2% 49.7% 52.6% 58.1% 59.2%Return on capital employed (RoCE) 13.1% 12.9% 11.3% 20.6% 24.9% 25.7%Advances to deposits ratio (ADR) - gross 33.5% 44.3% 53.2% 49.8% 45.6% 45.2%Advances to deposits ratio (ADR) - net 28.7% 39.7% 48.7% 46.4% 42.1% 41.3%Income to expense ratio 2.26 2.04 1.88 2.18 2.46 2.45 Cost to revenue ratio 43.5% 48.2% 47.8% 45.0% 39.6% 39.7%Growth in gross income 10.3% 2.7% 3.4% -2.6% 3.6% 21.1%Growth in net profit after tax 9.2% 25.7% -39.5% -9.2% 7.8% 17.3%Total assets to shareholders’ funds 11.1 11.2 12.5 12.8 10.5 9.9 Intermediation cost ratio 2.6% 2.9% 3.3% 3.0% 3.0% 3.3%Asset quality (NPL ratio) 13.7% 11.0% 8.8% 7.8% 8.0% 9.4%Net infection ratio 0.9% 1.6% 1.1% 1.5% 0.8% 1.1%Weighted average cost of debt 5.3% 6.5% 4.1% 4.2% 4.4% 5.0%Capital adequacy ratio (CAR) 24.4% 18.9% 17.7% 15.4% 15.1% 14.6%
Share Information Cash dividend per share 12.00 12.00 11.00 13.00 13.00 13.00Dividend yield (based on cash dividend) 7.3% 9.8% 5.9% 5.4% 8.4% 7.4%Dividend payout ratio (total payout) 70.3% 76.8% 88.4% 63.2% 57.4% 61.9%Earning per share (EPS) - Rs 17.07 15.63 12.44 20.57 22.65 21.02 Price earnings ratio 7.37 10.52 9.86 9.14 10.55 7.37 Market value per share - at the end of the year - Rs 125.86 164.50 122.64 187.97 238.90 154.95Market value per share - highest during the year - Rs 181.96 173.53 219.70 283.00 243.72 186.75Market value per share - lowest during the year - Rs 89.44 119.67 121.85 162.01 137.31 141.25Breakup value per share - without surplus on revaluation of assets - Rs 127.79 117.00 110.02 103.74 95.53 86.48 Breakup value per share - with surplus on revaluation of assets - Rs 150.36 138.11 123.57 130.13 123.99 116.10
Other Information Non-performing advances (NPLs) - Rs in million 83,624 76,986 68,562 52,247 44,567 46,833 Import business - Rs in million 544,166 824,858 936,749 720,496 575,991 607,496 Export business - Rs in million 138,797 177,279 202,748 294,428 255,287 220,701 Number of employees 13,012 13,248 13,931 14,771 14,153 14,623 Number of branches - Domestic 1,356 1,362 1,364 1,361 1,341 1,312 Number of branches - International 14 14 15 18 18 18 Number of branches - Total 1,370 1,376 1,379 1,379 1,359 1,330
December 31 2020 2019 2018 2017 2016 2015 Vertical Analysis Assets Cash and balances with treasury and other banks 12.9% 13.6% 10.9% 8.7% 9.1% 9.2%Lendings to financial institutions 1.0% 1.1% 1.8% 0.5% 1.6% 1.7%Investments - net 55.1% 44.4% 41.6% 53.7% 50.4% 51.4%Advances - net 25.9% 33.6% 37.9% 30.9% 32.4% 32.5%Operating fixed assets 2.6% 2.9% 2.5% 2.3% 2.2% 2.3%Other assets 2.6% 4.5% 5.2% 3.9% 4.2% 2.9%Total assets 100.0% 100.0% 100.0% 100.0% 100.0% 100.0% Liabilities & Equity Deposits & other accounts 80.0% 77.5% 72.3% 62.6% 72.9% 75.1%Borrowings from financial institutions 6.3% 8.2% 14.2% 25.2% 12.6% 11.6%Subordinated loans 0.5% 0.5% 0.5% 0.0% 0.0% 0.0%Bills payable 1.5% 1.2% 1.4% 1.5% 1.5% 1.0%Other liabilities 2.8% 3.7% 3.6% 2.9% 3.5% 2.2%Total liabilities 91.0% 91.1% 92.0% 92.2% 90.5% 89.9%Share capital 0.6% 0.6% 0.6% 0.6% 0.8% 0.9%Reserves 3.0% 3.1% 2.9% 2.2% 2.5% 2.7%Unappropriated profit 4.0% 3.8% 3.6% 3.5% 4.0% 3.9%Equity - Tier I 7.6% 7.6% 7.1% 6.2% 7.3% 7.6%Surplus on revaluation of assets - net of deferred tax 1.3% 1.4% 0.9% 1.6% 2.2% 2.6%Total equity 9.0% 8.9% 8.0% 7.8% 9.5% 10.1% Horizontal Analysis Assets Cash and balances with treasury and other banks 205.4% 199.1% 160.5% 137.4% 113.6% 100.0%Lendings to financial institutions 82.8% 83.8% 140.9% 45.1% 106.7% 100.0%Investments - net 156.9% 116.8% 109.3% 151.7% 112.1% 100.0%Advances - net 116.4% 139.6% 157.2% 137.8% 113.9% 100.0%Operating fixed assets 167.7% 171.8% 150.4% 146.1% 112.5% 100.0%Other assets 128.7% 207.9% 240.7% 193.6% 164.9% 100.0%Total assets 146.3% 135.1% 134.9% 145.1% 114.3% 100.0% Liabilities & Equity Deposits & other accounts 156.0% 139.6% 129.9% 121.1% 111.0% 100.0%Borrowings from financial institutions 79.1% 94.7% 164.4% 314.3% 123.6% 100.0%Subordinated loans 100.0% 100.0% 100.0% 0.0% 0.0% 0.0%Bills payable 222.0% 171.2% 203.5% 222.9% 183.1% 100.0%Other liabilities 183.9% 225.1% 220.7% 189.7% 180.9% 100.0%Total liabilities 148.2% 137.0% 138.1% 148.9% 115.1% 100.0%Share capital 100.0% 100.0% 100.0% 100.0% 100.0% 100.0%Reserves 162.2% 154.5% 141.8% 114.2% 105.3% 100.0%Unappropriated profit 148.3% 129.8% 123.1% 128.4% 116.3% 100.0%Equity - Tier I 147.8% 135.3% 127.2% 120.0% 110.5% 100.0%Surplus on revaluation of assets - net of deferred tax 76.2% 71.2% 45.7% 89.1% 96.1% 100.0%Total equity 129.5% 118.9% 106.4% 112.1% 106.8% 100.0%
Balance Sheet
December 31 2020 2019 2018 2017 2016 2015 Vertical Analysis Interest / Return / Non Interest Income Earned Markup / return / interest earned 89.9% 87.6% 81.9% 82.9% 80.6% 81.1%Fee, commission, brokerage and exchange income 8.7% 10.4% 12.6% 11.2% 11.5% 12.4%Capital gains & dividend income 1.0% 0.9% 4.8% 5.2% 7.1% 5.5%Other income 0.4% 1.1% 0.7% 0.7% 0.8% 0.9%Total 100.0% 100.0% 100.0% 100.0% 100.0% 100.0% Interest / Return / Non Interest Expense Markup / return / interest expensed 45.6% 52.4% 41.2% 39.3% 33.8% 33.1%Operating expenses 24.3% 23.4% 31.4% 28.0% 27.0% 27.5%Provisions 9.9% 4.7% 9.3% 1.9% 1.4% 3.2%Taxation 7.9% 8.6% 7.0% 11.4% 15.0% 14.1%Total expense - percentage of total income 87.6% 89.1% 89.0% 80.5% 77.2% 77.9% Profit after taxation 12.4% 10.9% 11.0% 19.5% 22.8% 22.1%Total 100.0% 100.0% 100.0% 100.0% 100.0% 100.0% Horizontal Analysis Interest / Return / Non Interest Income Earned Markup / return / interest earned 161.1% 162.9% 120.0% 113.6% 104.1% 100.0%Fee, commission, brokerage and exchange income 102.1% 125.9% 120.2% 100.2% 96.9% 100.0%Capital gains & dividend income 26.1% 23.9% 103.2% 105.0% 133.9% 100.0%Other income 59.0% 179.1% 90.3% 84.5% 89.7% 100.0%Total 145.3% 150.7% 118.8% 111.2% 104.7% 100.0% Interest / Return / Non Interest Expense Markup / return / interest expensed 200.1% 238.6% 147.9% 131.9% 106.9% 100.0%Operating expenses 128.6% 128.3% 135.9% 113.4% 103.0% 100.0%Provisions 452.0% 221.6% 346.5% 66.0% 46.9% 100.0%Taxation 80.8% 91.9% 59.2% 89.6% 111.2% 100.0%Total 163.6% 172.4% 135.7% 115.0% 103.8% 100.0% Profit after taxation 81.2% 74.4% 59.2% 97.9% 107.8% 100.0%
Profit and Loss Account
Statement of Value Added 2020 2019 Rs in million % Rs in million % Mark-up / return / interest earned - net of provisions 135,235 106.4% 145,457 103.3%Fee, commission, brokerage and exchange income 14,782 11.6% 18,219 12.9%Capital gains & dividend income 1,681 1.3% 1,541 1.1%Other income 631 0.5% 1,916 1.4% 152,329 119.8% 167,133 118.6% Administrative expenses 25,197 19.8% 26,259 18.6% Value added 127,132 100.0% 140,874 100.0% Distributed as follows: To employees as remuneration 15,554 12.2% 14,602 10.4% To government as income tax 13,294 10.5% 15,108 10.7% To depositors as profit on investments 60,642 47.7% 66,495 47.2% To institutions & individuals as profit on borrowings 16,402 12.9% 25,406 18.0%To society as donations 342 0.3% 129 0.1% To shareholders as dividends / bonus 7,957 6.3% 13,466 9.6% Retained in business as reserves and retained profits 12,941 10.2% 5,668 4.0% 127,132 100% 140,874 100%
Growthat a Glance
55Annual Report 2020

UBL InternationalNetworkINTERNATIONAL BRANCHES
UAEDeira BranchMohd. & Obaid Al Mullah Building,Murshid Bazar, Al Kabeer Street - Dubai,P.O. Box: 1000, Dubai - UAE.Tel: 00971-4-6085350 & 00971-4-6085351Swift Code: UNILAEADBranch Code: 0906
Bur Dubai BranchBank Street Building,Khalid Bin Al Waleed Street,P.O. Box: 1367, Dubai - UAE.Tel: 00971-4-6085200 & 00971-4-6085201Swift Code: UNILAEADBranch Code: 0907
Gold & Diamond Park BranchGold & Diamond Park,Unit No. R-52,Sheikh Zayed Road, Al Qouz Industrial Area,P.O. Box: 3846, Dubai – UAE.Tel: 00971-4-6085300 & 00971-4-6085301Swift Code: UNILAEADBranch Code: 0919 Sharjah BranchAl Majaz Building, King Faisal Street,P.O. Box: 660, Sharjah - UAE.Tel: 00971-6-5979121 & 00971-6-5979122Swift Code: UNILAEADBranch Code: 0910
Muroor BranchAylan Abdullah al Muhairi Building,Muroor Road,P.O. Box: 3052, Abu Dhabi - UAE.Tel: 00971-2-5996525Swift Code: UNILAEADBranch Code: 1207
Musaffah BranchRashid Mohd. Abdullah Al Mazroui Building,Block M14, Street 17, Musaffah Industrial Road,P.O. Box: 237, Abu Dhabi - UAE.Tel: 00971-2-5996400 & 00971-2-5996401Swift Code: UNILAEADBranch Code: 0901
Sheikh Hamdan Road BranchBuilding No. 16,Opposite Hamdan Center,Sheikh Hamdan Bin Mohamed Street,P.O. Box: 2340, Abu Dhabi - UAE.Tel: 00971-2-5996450 & 00971-2-5996451Swift Code: UNILAEADBranch Code: 0918
BahrainManama Branch Building 117, Road 385, Block 304,Government Avenue, Manama, P.O. Box: 546, Kingdom of Bahrain. Tel: 00973-17503549 Email: [email protected] Swift Code: UNILBHBM Branch Code: 0905
Muharraq Branch Building 1127-B, Road 10, Area 215, Muharraq, P.O. Box: 546, Kingdom of Bahrain. Tel: 00973-17503582 Email: [email protected] Swift Code: UNILBHBM Branch Code: 0922
YemenSana'a Branch Dr. Mohammad Ahmed Othman Al-Absi Building, Al-Zubairi Street, P.O. Box: 1295, Sana'a - Republic of Yemen. Tel: 00967-1-407540 (General) / 00967 771556955 (Mobile) Fax: 00967-1-408212 Email: [email protected] Swift Code: UNILYESA Branch Code: 917
Hodeidah Branch Essam Al-Shamsi Building, Al-Meena Street, P.O. Box: 3927, Hodeida - Republic of Yemen. Tel: 00967-3-201154 (General) / 00967 777312566 (Mobile) Fax: 00967-3-201153 Email: [email protected] Swift Code: UNILYESA Branch Code: 1781
Aden Branch Aden Mall, Crater, P.O. Box: 104, Aden - Republic of Yemen. Tel: 00967-2-269191 (General) / 00967 738222677 (Mobile) Email: [email protected] Email: [email protected] Fax: 00967-2-269065 & 00968-2-5215105 Swift Code: UNILYESA Branch Code: 1700
QatarCorniche Branch Sh. Jassim Bin Jaber Al-Thani Building,Abdullah Bin Jassim Street, P.O. Box: 242, Doha - Qatar. Tel: 00974-44254425 Email: [email protected] Swift Code: UNILQAQAxxx Branch Code: 0908
Salwa Branch Qatar General Insurance Building, Salwa Road, P.O. Box: 242, Doha - Qatar. Tel: 00974-44254466 Email: [email protected] Swift Code: UNILQAQAxxx Branch Code: 1929
REPRESENTATIVE OFFICE
China Room No. 2110, The Exchange Beijing, No. 118, Jianguo Road, Chaoyang District, Beijing, 100022, Peoples Republic of China. Tel: 0086-10-65675560, 0086-10-65675579 Fax: 0086-10-65675560
OBU-EPZEPZ Branch Karachi Export Processing Zone, Landhi Industrial Area, Mehran Highway, Landhi, Karachi. Tel: 0092-21-35082301-3 Fax: 0092-21-35082305
EPZ Branch, Sambrial (Sialkot) Plot No.: 261-A, Export Processing Zone, Wazirabad Road, Sambrial, District Sialkot. Tel: 0092-52-6523388
SUBSIDIARIES
Switzerland UBL Switzerland AGFeldeggstrasse 55, Postfach CH - 8034 Zurich - Switzerland. Tel: 0041-43-4991920 Fax: 0041-43-4991933
United KingdomLondon 2 Brook Street, London, W1S 1BQ.
Birmingham 391-393 Stratford Road, Birmingham, B11 4JZ.
Manchester Unit 4, Cheetham Hill Shopping Centre, 40 Bury Old Road, Manchester, M8 5EL.
December 31 2020 2019 2018 2017 2016 2015 Vertical Analysis Interest / Return / Non Interest Income Earned Markup / return / interest earned 89.9% 87.6% 81.9% 82.9% 80.6% 81.1%Fee, commission, brokerage and exchange income 8.7% 10.4% 12.6% 11.2% 11.5% 12.4%Capital gains & dividend income 1.0% 0.9% 4.8% 5.2% 7.1% 5.5%Other income 0.4% 1.1% 0.7% 0.7% 0.8% 0.9%Total 100.0% 100.0% 100.0% 100.0% 100.0% 100.0% Interest / Return / Non Interest Expense Markup / return / interest expensed 45.6% 52.4% 41.2% 39.3% 33.8% 33.1%Operating expenses 24.3% 23.4% 31.4% 28.0% 27.0% 27.5%Provisions 9.9% 4.7% 9.3% 1.9% 1.4% 3.2%Taxation 7.9% 8.6% 7.0% 11.4% 15.0% 14.1%Total expense - percentage of total income 87.6% 89.1% 89.0% 80.5% 77.2% 77.9% Profit after taxation 12.4% 10.9% 11.0% 19.5% 22.8% 22.1%Total 100.0% 100.0% 100.0% 100.0% 100.0% 100.0% Horizontal Analysis Interest / Return / Non Interest Income Earned Markup / return / interest earned 161.1% 162.9% 120.0% 113.6% 104.1% 100.0%Fee, commission, brokerage and exchange income 102.1% 125.9% 120.2% 100.2% 96.9% 100.0%Capital gains & dividend income 26.1% 23.9% 103.2% 105.0% 133.9% 100.0%Other income 59.0% 179.1% 90.3% 84.5% 89.7% 100.0%Total 145.3% 150.7% 118.8% 111.2% 104.7% 100.0% Interest / Return / Non Interest Expense Markup / return / interest expensed 200.1% 238.6% 147.9% 131.9% 106.9% 100.0%Operating expenses 128.6% 128.3% 135.9% 113.4% 103.0% 100.0%Provisions 452.0% 221.6% 346.5% 66.0% 46.9% 100.0%Taxation 80.8% 91.9% 59.2% 89.6% 111.2% 100.0%Total 163.6% 172.4% 135.7% 115.0% 103.8% 100.0% Profit after taxation 81.2% 74.4% 59.2% 97.9% 107.8% 100.0%
United Bank Limited56

UBL InternationalNetworkINTERNATIONAL BRANCHES
UAEDeira BranchMohd. & Obaid Al Mullah Building,Murshid Bazar, Al Kabeer Street - Dubai,P.O. Box: 1000, Dubai - UAE.Tel: 00971-4-6085350 & 00971-4-6085351Swift Code: UNILAEADBranch Code: 0906
Bur Dubai BranchBank Street Building,Khalid Bin Al Waleed Street,P.O. Box: 1367, Dubai - UAE.Tel: 00971-4-6085200 & 00971-4-6085201Swift Code: UNILAEADBranch Code: 0907
Gold & Diamond Park BranchGold & Diamond Park,Unit No. R-52,Sheikh Zayed Road, Al Qouz Industrial Area,P.O. Box: 3846, Dubai – UAE.Tel: 00971-4-6085300 & 00971-4-6085301Swift Code: UNILAEADBranch Code: 0919 Sharjah BranchAl Majaz Building, King Faisal Street,P.O. Box: 660, Sharjah - UAE.Tel: 00971-6-5979121 & 00971-6-5979122Swift Code: UNILAEADBranch Code: 0910
Muroor BranchAylan Abdullah al Muhairi Building,Muroor Road,P.O. Box: 3052, Abu Dhabi - UAE.Tel: 00971-2-5996525Swift Code: UNILAEADBranch Code: 1207
Musaffah BranchRashid Mohd. Abdullah Al Mazroui Building,Block M14, Street 17, Musaffah Industrial Road,P.O. Box: 237, Abu Dhabi - UAE.Tel: 00971-2-5996400 & 00971-2-5996401Swift Code: UNILAEADBranch Code: 0901
Sheikh Hamdan Road BranchBuilding No. 16,Opposite Hamdan Center,Sheikh Hamdan Bin Mohamed Street,P.O. Box: 2340, Abu Dhabi - UAE.Tel: 00971-2-5996450 & 00971-2-5996451Swift Code: UNILAEADBranch Code: 0918
BahrainManama Branch Building 117, Road 385, Block 304,Government Avenue, Manama, P.O. Box: 546, Kingdom of Bahrain. Tel: 00973-17503549 Email: [email protected] Swift Code: UNILBHBM Branch Code: 0905
Muharraq Branch Building 1127-B, Road 10, Area 215, Muharraq, P.O. Box: 546, Kingdom of Bahrain. Tel: 00973-17503582 Email: [email protected] Swift Code: UNILBHBM Branch Code: 0922
YemenSana'a Branch Dr. Mohammad Ahmed Othman Al-Absi Building, Al-Zubairi Street, P.O. Box: 1295, Sana'a - Republic of Yemen. Tel: 00967-1-407540 (General) / 00967 771556955 (Mobile) Fax: 00967-1-408212 Email: [email protected] Swift Code: UNILYESA Branch Code: 917
Hodeidah Branch Essam Al-Shamsi Building, Al-Meena Street, P.O. Box: 3927, Hodeida - Republic of Yemen. Tel: 00967-3-201154 (General) / 00967 777312566 (Mobile) Fax: 00967-3-201153 Email: [email protected] Swift Code: UNILYESA Branch Code: 1781
Aden Branch Aden Mall, Crater, P.O. Box: 104, Aden - Republic of Yemen. Tel: 00967-2-269191 (General) / 00967 738222677 (Mobile) Email: [email protected] Email: [email protected] Fax: 00967-2-269065 & 00968-2-5215105 Swift Code: UNILYESA Branch Code: 1700
QatarCorniche Branch Sh. Jassim Bin Jaber Al-Thani Building,Abdullah Bin Jassim Street, P.O. Box: 242, Doha - Qatar. Tel: 00974-44254425 Email: [email protected] Swift Code: UNILQAQAxxx Branch Code: 0908
Salwa Branch Qatar General Insurance Building, Salwa Road, P.O. Box: 242, Doha - Qatar. Tel: 00974-44254466 Email: [email protected] Swift Code: UNILQAQAxxx Branch Code: 1929
REPRESENTATIVE OFFICE
China Room No. 2110, The Exchange Beijing, No. 118, Jianguo Road, Chaoyang District, Beijing, 100022, Peoples Republic of China. Tel: 0086-10-65675560, 0086-10-65675579 Fax: 0086-10-65675560
OBU-EPZEPZ Branch Karachi Export Processing Zone, Landhi Industrial Area, Mehran Highway, Landhi, Karachi. Tel: 0092-21-35082301-3 Fax: 0092-21-35082305
EPZ Branch, Sambrial (Sialkot) Plot No.: 261-A, Export Processing Zone, Wazirabad Road, Sambrial, District Sialkot. Tel: 0092-52-6523388
SUBSIDIARIES
Switzerland UBL Switzerland AGFeldeggstrasse 55, Postfach CH - 8034 Zurich - Switzerland. Tel: 0041-43-4991920 Fax: 0041-43-4991933
United KingdomLondon 2 Brook Street, London, W1S 1BQ.
Birmingham 391-393 Stratford Road, Birmingham, B11 4JZ.
Manchester Unit 4, Cheetham Hill Shopping Centre, 40 Bury Old Road, Manchester, M8 5EL.
December 31 2020 2019 2018 2017 2016 2015 Vertical Analysis Interest / Return / Non Interest Income Earned Markup / return / interest earned 89.9% 87.6% 81.9% 82.9% 80.6% 81.1%Fee, commission, brokerage and exchange income 8.7% 10.4% 12.6% 11.2% 11.5% 12.4%Capital gains & dividend income 1.0% 0.9% 4.8% 5.2% 7.1% 5.5%Other income 0.4% 1.1% 0.7% 0.7% 0.8% 0.9%Total 100.0% 100.0% 100.0% 100.0% 100.0% 100.0% Interest / Return / Non Interest Expense Markup / return / interest expensed 45.6% 52.4% 41.2% 39.3% 33.8% 33.1%Operating expenses 24.3% 23.4% 31.4% 28.0% 27.0% 27.5%Provisions 9.9% 4.7% 9.3% 1.9% 1.4% 3.2%Taxation 7.9% 8.6% 7.0% 11.4% 15.0% 14.1%Total expense - percentage of total income 87.6% 89.1% 89.0% 80.5% 77.2% 77.9% Profit after taxation 12.4% 10.9% 11.0% 19.5% 22.8% 22.1%Total 100.0% 100.0% 100.0% 100.0% 100.0% 100.0% Horizontal Analysis Interest / Return / Non Interest Income Earned Markup / return / interest earned 161.1% 162.9% 120.0% 113.6% 104.1% 100.0%Fee, commission, brokerage and exchange income 102.1% 125.9% 120.2% 100.2% 96.9% 100.0%Capital gains & dividend income 26.1% 23.9% 103.2% 105.0% 133.9% 100.0%Other income 59.0% 179.1% 90.3% 84.5% 89.7% 100.0%Total 145.3% 150.7% 118.8% 111.2% 104.7% 100.0% Interest / Return / Non Interest Expense Markup / return / interest expensed 200.1% 238.6% 147.9% 131.9% 106.9% 100.0%Operating expenses 128.6% 128.3% 135.9% 113.4% 103.0% 100.0%Provisions 452.0% 221.6% 346.5% 66.0% 46.9% 100.0%Taxation 80.8% 91.9% 59.2% 89.6% 111.2% 100.0%Total 163.6% 172.4% 135.7% 115.0% 103.8% 100.0% Profit after taxation 81.2% 74.4% 59.2% 97.9% 107.8% 100.0%
57Annual Report 2020

For the first time in Pakistan’s history, Non-Resident Pakistanis (NRPs) are being provided an opportunity to remotely open an account in Pakistan through an entirely digital and Online process without any need to visit a bank branch. Opening of the account will require only a basic set of information and documents by completing all the necessary customer due diligence within 48 hours. Now NRPs willing to undertake banking, payment and investment activities, can do so through digital channels without visiting bank branches in Pakistan.
“Islamic Naya Pakistan Certificate (INPC)”, are offered to Roshan Digital accountholders with an attractive returns. INPCs are USD and PKR denominated sovereign instruments issued and administered by the Government of Pakistan through special purpose vehicle, Islamic Naya Pakistan Certificate Company Limited (INPCCL) fully owned by it. INPCs are based on a Mudarabah structure whereby the investor invests in a Mudarabah pool that is used to extend financing to the Federal Government. Investment is remunerated from the profits earned by the pool.
On Consumer Side:“UBL Ameen Mera Pakistan Mera Ghar”, a low cost housing finance scheme with the Government of Pakistan and State Bank’s support, to promote housing sector in the country. The scheme has been launched to facilitate the customers for purchase of a newly built/constructed house / apartment.
“UBL Ameen Drive”, existing product program manual of auto financing product has been renewed and approved by the Shariah Board.
On Asset Side:Product Program Manuals for Diminishing Musharakah, Commercial Ijarah and Treasury Products (Mudarabah, Wakala, Musharakah and Bai Moajjal) along with transaction documents were renewed and approved by the Shariah Board.
Corporate & SME:During the year, total 671 Corporate and SME transactions were executed. For review of Corporate and SME transactions, Shariah Compliance process is categorized in three major stages:
1) Pre-Disbursement Stage in which process flows and structures of the transactions are finalized in accordance with Shariah guidelines already provided by the Shariah Board. These process flows are duly reviewed and approved by Resident Shariah Board Member (RSBM) / Shariah Board and are ratified in the subsequent Shariah Board meetings.
2) Disbursement Stage in which required documents for the first transaction are reviewed and verified by Shariah Compliance Department and approved by Resident Shariah Board Member (RSBM), in accordance with Shariah guidelines already provided by the Shariah Board. These transactions are duly ratified in Shariah Board meetings.
3) Post Disbursement Stage in which transactional documents are reviewed on sample basis by Shariah Compliance Department, in accordance with Shariah guidelines already provided by the Shariah Board.
UBL Ameen Treasury:UBL Ameen has a separate and independent Treasury Department. During the year, 76 deals were executed under UBL Ameen treasury products namely, Musharakah, Wakalah, Mudarabah and GOP Ijarah Sukuk. Furthermore, total 16 deals were executed under SBP’s approved product Bai Moajjal, out of which three deals were executed with Government of Pakistan.
Further, to manage excess liquidity or in case of short of funds, arrangement on the basis of Qard was approved with a strategy that on best effort basis, funds would be deployed in Corporate, SME and Islamic Financial Institutions.
Profit & Loss Distribution and Pool Management:UBL Ameen has successfully implemented the Automation of Profit distribution and Pool Management system. UBL Ameen is one of the few banks in the Islamic Banking industry having IT based system to manage end to end calculation and distributions of profit to the various pools.
During the year, Profit and loss distribution mechanism, i.e. Pool calculations and weightages were discussed with the Shariah Compliance Department on monthly basis and were verified accordingly. Internal Shariah Audit Unit (ISAU) conducted its post disbursement pool audit on quarterly basis in line with the policies and announced Profit Sharing Ratio (PSR) & weightings, and presented reports to Shariah Board for opinion where required.
Training and Development:During the year 2020, various Class room and Online Islamic Banking Training sessions (via Cisco Webex) were conducted for UBL and UBL Ameen staff on basic concepts of Islamic Banking and Islamic Banking Products & Services. Trainings were conducted by Shariah Compliance Department, Shariah Board Members and executives from Product & Operations Department. Shariah Board also conducted Online training for Executive Management of the bank. Further, to abreast the staff with expertise and skills, selected staff were trained through Centre of Excellence for Islamic Finance and National Institute of Banking & Finance (NIBAF), SBP.
Detailed training sessions for Mera Pakistan Mera Ghar – Low Cost Consumer Finance Product were conducted for all UBL & UBL Ameen branches country wide where all branch staff attended the training sessions.
In line with senior management directives to promote Islamic Banking training to all staff across the bank, UBL Ameen has initiated Knowledge for You – Islamic Banking Awareness program on weekly basis where Online Islamic Banking training is conducted through Shariah Board and UBL Ameen Shariah Scholars. In addition, Shariah Compliance Department developed two pager training brochure for UBL Ameen Branches. This will help branch staff to timely respond to customer queries at branch level.
In order to further reinforce training culture across the bank, Islamic Banking training presentations were approved by Shariah Board and made available on Learning Management System through e-learning module.
Internal Shariah Audit Unit (ISAU):Internal Shariah Audit Unit performed all the tasks in line with Shariah Governance Framework and sought guidance and consultation from Shariah Board. Audit covered all business related functions including Branches, Consumer, Corporate & SME Businesses and Profit & Loss distribution extensively. Reports were discussed with the Shariah Board for opinion and subsequent submission to UBL Ameen Management, for necessary rectifications wherever required.
Charity Collections & Disbursements:The opening balance of Charity fund as of 1st January 2020 was PKR 3.49 Million. During the year, charity of PKR 3.53 Million was received and charity of PKR 4.20 Million was disbursed to the charitable organizations after detailed screening and due diligence. The amount credited in charity account was due to late payments.
Shariah Opinion:To form our opinion as expressed in this report, the Shariah Compliance Department of the Bank carried out reviews on test check basis, of each class of transactions, the relevant documentation and process flows. Further, we have also reviewed reports from Internal Shariah Audit and External Shariah Audit.
Report of Shariah Boardfor the Financial Year-2020In the name of Allah, The Most Beneficent, The Most Merciful
Alhamdulillah, by the grace of Almighty Allah, UBL Ameen Pakistan has successfully completed 14 years of Islamic Banking operations. During the year, UBL Ameen witnessed an exponential growth in terms of business profitability and market penetration. UBL Ameen performed well and business recorded a Profit Before Tax (PBT) of PKR 2.51 Billion in comparison with Profit Before Tax (PBT) of PKR 1.55 Billion last year, thereby registering a growth of 62%.
Scope:The Board of Directors and Executive Management are solely responsible to ensure that the operations of the Bank are conducted in a manner that comply with Shariah principles at all times. The scope of this report is to cover affairs of the Islamic Banking operations from Shariah perspective as described under Shariah Governance Framework of State Bank of Pakistan.
Shariah Board hereby submits its report on the overall Shariah compliance environment of UBL Ameen Pakistan and major developments that took place during the year.
Shariah Board Meetings and Reviews:In line with Shariah Governance Framework of State Bank of Pakistan, Shariah Board shall meet at least on quarterly basis. Hence, twenty-three (23) Shariah Board meetings were held till date out of which four (4) meetings were conducted in 2020. Minutes of meetings were subsequently submitted to Islamic Banking Department of State Bank of Pakistan. In addition, various meetings were held to discuss the matters related to Product Development, Islamic Banking Training, Shariah Compliance and Shariah Audit.
To observe Shariah Compliance environment as required by SBP-IBD, Shariah Board visited and conducted internal Shariah control review of selected number of branches and Head Office functions during the year.
Shariah Compliance Department:Shariah Compliance remained the key player in all activities, in order to achieve the optimum level of satisfaction. Shariah Compliance Department worked under the supervision of Shariah Board and contributed as an effective conduit between Management and the Shariah Board. Shariah Compliance Department (SCD) of UBL Ameen Pakistan constitutes of Head of Shariah Compliance & two supporting staff including Shariah Scholar.
During the year, internal Shariah control review was conducted for selected number of Islamic branches and Head Office functions. Total 80 visits were made by Shariah Compliance Department to Islamic Banking Branches and Islamic Banking Windows for Shariah compliance review. Shariah compliance review reports for Islamic branches and Islamic Banking Windows were shared with the District Management and Head Islamic Banking for rectification and compliance. Shariah Compliance Department submitted its consolidated quarterly reports to Shariah Board for ratification. Reports consisted details of all Shariah reviews and opinions given by Resident Shariah Board Member (in accordance with Shariah guidelines already provided by the Shariah Board) and opinions given by Shariah Board through circulation. Later on, RSBM and Shariah Board rulings were ratified by Shariah Board in the subsequent Shariah Board meetings.
UBL Ameen Branch Network:With the network of 100 branches spread throughout the country, UBL Ameen is one of the leading Islamic Banking Institution in Pakistan. Also, with the addition of 25 new Islamic Banking Windows (IBWs) in 2020, IBWs are now being operated through 187 UBL branches country wide.
In compliance to the SBP IBD Circular No. 2 of 2020 for revised guidelines for Islamic Banking Windows (IBWs) Operations, Islamic Banking Windows (IBWs) Policy was developed by UBL Ameen. The policy was duly approved by Shariah Board and Board of Directors of the Bank.
Products & Services:
On Liability Side:“UBL Ameen Good Citizen Account”, Mudarabah based liability product was launched during the year. The product has been designed with the aim to promote documented economy with Shariah compliant manner. UBL Ameen Good Citizen is the first ever especially designed Islamic product with an aim to offer “Free Tax Facilitation” services to individuals and sole proprietors through an independent Tax Consultant to UBL Ameen Good Citizen accountholders, to help them understand not only the importance of filing income tax return timely but also how to file the tax returns and pay taxes with peace of mind.
“UBL Ameen Tezraftaar Asaan Remittance Account”, the account facilitates customers who are beneficiaries of home remittances. The account also facilitates goal of financial inclusion in the country by expanding outreach of banking services to all segments of the society especially to unbanked or under banked population.
“UBL Ameen PayPak Debit Card”, is added to the UBL Ameen debit card product suite, the card offers low cost payment solution to domestic customers, which enables 24/7 access to their bank account within Pakistan. The Card is accepted at all locations displaying the 1Link/MNet logos on POS terminals and can be used to pay for shopping, meals, travel, entertainment, holiday, fuel etc. The existing debit cards (VISA/Master) have also been updated with NFC technology.
“Takaful Coverage for UBL Ameen Customers”, whereby UBL Ameen is offering complementary “Accidental Death and Permanent Disability Takaful Coverage” through UBL Insurers Window Takaful Operations to individual customers/accountholders of UBL Ameen.
“UBL Ameen Employee Banking (Ameen @ Work)”, UBL Ameen Employee Banking proposition offers automated salary disbursement mechanism with multiple benefits for Corporate entities. It offers bundle of services to corporate clients in terms of cash management of payroll, hence further strengthening the account relationship with corporate entities.
“UBL Ameen Roshan Digital Account”, is an Islamic version of UBL Roshan Digital Account which is a major initiative of State Bank of Pakistan, in collaboration with commercial banks operating in Pakistan. These accounts provide innovative banking solutions for millions of Non Resident Pakistanis (NRPs) seeking to undertake banking, payment and investment activities in Pakistan.
United Bank Limited58

For the first time in Pakistan’s history, Non-Resident Pakistanis (NRPs) are being provided an opportunity to remotely open an account in Pakistan through an entirely digital and Online process without any need to visit a bank branch. Opening of the account will require only a basic set of information and documents by completing all the necessary customer due diligence within 48 hours. Now NRPs willing to undertake banking, payment and investment activities, can do so through digital channels without visiting bank branches in Pakistan.
“Islamic Naya Pakistan Certificate (INPC)”, are offered to Roshan Digital accountholders with an attractive returns. INPCs are USD and PKR denominated sovereign instruments issued and administered by the Government of Pakistan through special purpose vehicle, Islamic Naya Pakistan Certificate Company Limited (INPCCL) fully owned by it. INPCs are based on a Mudarabah structure whereby the investor invests in a Mudarabah pool that is used to extend financing to the Federal Government. Investment is remunerated from the profits earned by the pool.
On Consumer Side:“UBL Ameen Mera Pakistan Mera Ghar”, a low cost housing finance scheme with the Government of Pakistan and State Bank’s support, to promote housing sector in the country. The scheme has been launched to facilitate the customers for purchase of a newly built/constructed house / apartment.
“UBL Ameen Drive”, existing product program manual of auto financing product has been renewed and approved by the Shariah Board.
On Asset Side:Product Program Manuals for Diminishing Musharakah, Commercial Ijarah and Treasury Products (Mudarabah, Wakala, Musharakah and Bai Moajjal) along with transaction documents were renewed and approved by the Shariah Board.
Corporate & SME:During the year, total 671 Corporate and SME transactions were executed. For review of Corporate and SME transactions, Shariah Compliance process is categorized in three major stages:
1) Pre-Disbursement Stage in which process flows and structures of the transactions are finalized in accordance with Shariah guidelines already provided by the Shariah Board. These process flows are duly reviewed and approved by Resident Shariah Board Member (RSBM) / Shariah Board and are ratified in the subsequent Shariah Board meetings.
2) Disbursement Stage in which required documents for the first transaction are reviewed and verified by Shariah Compliance Department and approved by Resident Shariah Board Member (RSBM), in accordance with Shariah guidelines already provided by the Shariah Board. These transactions are duly ratified in Shariah Board meetings.
3) Post Disbursement Stage in which transactional documents are reviewed on sample basis by Shariah Compliance Department, in accordance with Shariah guidelines already provided by the Shariah Board.
UBL Ameen Treasury:UBL Ameen has a separate and independent Treasury Department. During the year, 76 deals were executed under UBL Ameen treasury products namely, Musharakah, Wakalah, Mudarabah and GOP Ijarah Sukuk. Furthermore, total 16 deals were executed under SBP’s approved product Bai Moajjal, out of which three deals were executed with Government of Pakistan.
Further, to manage excess liquidity or in case of short of funds, arrangement on the basis of Qard was approved with a strategy that on best effort basis, funds would be deployed in Corporate, SME and Islamic Financial Institutions.
Profit & Loss Distribution and Pool Management:UBL Ameen has successfully implemented the Automation of Profit distribution and Pool Management system. UBL Ameen is one of the few banks in the Islamic Banking industry having IT based system to manage end to end calculation and distributions of profit to the various pools.
During the year, Profit and loss distribution mechanism, i.e. Pool calculations and weightages were discussed with the Shariah Compliance Department on monthly basis and were verified accordingly. Internal Shariah Audit Unit (ISAU) conducted its post disbursement pool audit on quarterly basis in line with the policies and announced Profit Sharing Ratio (PSR) & weightings, and presented reports to Shariah Board for opinion where required.
Training and Development:During the year 2020, various Class room and Online Islamic Banking Training sessions (via Cisco Webex) were conducted for UBL and UBL Ameen staff on basic concepts of Islamic Banking and Islamic Banking Products & Services. Trainings were conducted by Shariah Compliance Department, Shariah Board Members and executives from Product & Operations Department. Shariah Board also conducted Online training for Executive Management of the bank. Further, to abreast the staff with expertise and skills, selected staff were trained through Centre of Excellence for Islamic Finance and National Institute of Banking & Finance (NIBAF), SBP.
Detailed training sessions for Mera Pakistan Mera Ghar – Low Cost Consumer Finance Product were conducted for all UBL & UBL Ameen branches country wide where all branch staff attended the training sessions.
In line with senior management directives to promote Islamic Banking training to all staff across the bank, UBL Ameen has initiated Knowledge for You – Islamic Banking Awareness program on weekly basis where Online Islamic Banking training is conducted through Shariah Board and UBL Ameen Shariah Scholars. In addition, Shariah Compliance Department developed two pager training brochure for UBL Ameen Branches. This will help branch staff to timely respond to customer queries at branch level.
In order to further reinforce training culture across the bank, Islamic Banking training presentations were approved by Shariah Board and made available on Learning Management System through e-learning module.
Internal Shariah Audit Unit (ISAU):Internal Shariah Audit Unit performed all the tasks in line with Shariah Governance Framework and sought guidance and consultation from Shariah Board. Audit covered all business related functions including Branches, Consumer, Corporate & SME Businesses and Profit & Loss distribution extensively. Reports were discussed with the Shariah Board for opinion and subsequent submission to UBL Ameen Management, for necessary rectifications wherever required.
Charity Collections & Disbursements:The opening balance of Charity fund as of 1st January 2020 was PKR 3.49 Million. During the year, charity of PKR 3.53 Million was received and charity of PKR 4.20 Million was disbursed to the charitable organizations after detailed screening and due diligence. The amount credited in charity account was due to late payments.
Shariah Opinion:To form our opinion as expressed in this report, the Shariah Compliance Department of the Bank carried out reviews on test check basis, of each class of transactions, the relevant documentation and process flows. Further, we have also reviewed reports from Internal Shariah Audit and External Shariah Audit.
Report of Shariah Boardfor the Financial Year-2020In the name of Allah, The Most Beneficent, The Most Merciful
Alhamdulillah, by the grace of Almighty Allah, UBL Ameen Pakistan has successfully completed 14 years of Islamic Banking operations. During the year, UBL Ameen witnessed an exponential growth in terms of business profitability and market penetration. UBL Ameen performed well and business recorded a Profit Before Tax (PBT) of PKR 2.51 Billion in comparison with Profit Before Tax (PBT) of PKR 1.55 Billion last year, thereby registering a growth of 62%.
Scope:The Board of Directors and Executive Management are solely responsible to ensure that the operations of the Bank are conducted in a manner that comply with Shariah principles at all times. The scope of this report is to cover affairs of the Islamic Banking operations from Shariah perspective as described under Shariah Governance Framework of State Bank of Pakistan.
Shariah Board hereby submits its report on the overall Shariah compliance environment of UBL Ameen Pakistan and major developments that took place during the year.
Shariah Board Meetings and Reviews:In line with Shariah Governance Framework of State Bank of Pakistan, Shariah Board shall meet at least on quarterly basis. Hence, twenty-three (23) Shariah Board meetings were held till date out of which four (4) meetings were conducted in 2020. Minutes of meetings were subsequently submitted to Islamic Banking Department of State Bank of Pakistan. In addition, various meetings were held to discuss the matters related to Product Development, Islamic Banking Training, Shariah Compliance and Shariah Audit.
To observe Shariah Compliance environment as required by SBP-IBD, Shariah Board visited and conducted internal Shariah control review of selected number of branches and Head Office functions during the year.
Shariah Compliance Department:Shariah Compliance remained the key player in all activities, in order to achieve the optimum level of satisfaction. Shariah Compliance Department worked under the supervision of Shariah Board and contributed as an effective conduit between Management and the Shariah Board. Shariah Compliance Department (SCD) of UBL Ameen Pakistan constitutes of Head of Shariah Compliance & two supporting staff including Shariah Scholar.
During the year, internal Shariah control review was conducted for selected number of Islamic branches and Head Office functions. Total 80 visits were made by Shariah Compliance Department to Islamic Banking Branches and Islamic Banking Windows for Shariah compliance review. Shariah compliance review reports for Islamic branches and Islamic Banking Windows were shared with the District Management and Head Islamic Banking for rectification and compliance. Shariah Compliance Department submitted its consolidated quarterly reports to Shariah Board for ratification. Reports consisted details of all Shariah reviews and opinions given by Resident Shariah Board Member (in accordance with Shariah guidelines already provided by the Shariah Board) and opinions given by Shariah Board through circulation. Later on, RSBM and Shariah Board rulings were ratified by Shariah Board in the subsequent Shariah Board meetings.
UBL Ameen Branch Network:With the network of 100 branches spread throughout the country, UBL Ameen is one of the leading Islamic Banking Institution in Pakistan. Also, with the addition of 25 new Islamic Banking Windows (IBWs) in 2020, IBWs are now being operated through 187 UBL branches country wide.
In compliance to the SBP IBD Circular No. 2 of 2020 for revised guidelines for Islamic Banking Windows (IBWs) Operations, Islamic Banking Windows (IBWs) Policy was developed by UBL Ameen. The policy was duly approved by Shariah Board and Board of Directors of the Bank.
Products & Services:
On Liability Side:“UBL Ameen Good Citizen Account”, Mudarabah based liability product was launched during the year. The product has been designed with the aim to promote documented economy with Shariah compliant manner. UBL Ameen Good Citizen is the first ever especially designed Islamic product with an aim to offer “Free Tax Facilitation” services to individuals and sole proprietors through an independent Tax Consultant to UBL Ameen Good Citizen accountholders, to help them understand not only the importance of filing income tax return timely but also how to file the tax returns and pay taxes with peace of mind.
“UBL Ameen Tezraftaar Asaan Remittance Account”, the account facilitates customers who are beneficiaries of home remittances. The account also facilitates goal of financial inclusion in the country by expanding outreach of banking services to all segments of the society especially to unbanked or under banked population.
“UBL Ameen PayPak Debit Card”, is added to the UBL Ameen debit card product suite, the card offers low cost payment solution to domestic customers, which enables 24/7 access to their bank account within Pakistan. The Card is accepted at all locations displaying the 1Link/MNet logos on POS terminals and can be used to pay for shopping, meals, travel, entertainment, holiday, fuel etc. The existing debit cards (VISA/Master) have also been updated with NFC technology.
“Takaful Coverage for UBL Ameen Customers”, whereby UBL Ameen is offering complementary “Accidental Death and Permanent Disability Takaful Coverage” through UBL Insurers Window Takaful Operations to individual customers/accountholders of UBL Ameen.
“UBL Ameen Employee Banking (Ameen @ Work)”, UBL Ameen Employee Banking proposition offers automated salary disbursement mechanism with multiple benefits for Corporate entities. It offers bundle of services to corporate clients in terms of cash management of payroll, hence further strengthening the account relationship with corporate entities.
“UBL Ameen Roshan Digital Account”, is an Islamic version of UBL Roshan Digital Account which is a major initiative of State Bank of Pakistan, in collaboration with commercial banks operating in Pakistan. These accounts provide innovative banking solutions for millions of Non Resident Pakistanis (NRPs) seeking to undertake banking, payment and investment activities in Pakistan.
59Annual Report 2020

Based on above, we are of the view that:i. UBL Ameen has overall complied with Shariah rules and
principles in the light of Fatawa, rulings and guidelines issued by the Shariah Board.
ii. UBL Ameen has overall complied with directives, regulations, instructions and guidelines related to Shariah compliance issued by SBP in accordance with the rulings of SBP’s Shariah Advisory Committee.
iii. UBL Ameen has a satisfactory mechanism in place to ensure Shariah compliance in their overall operations.
iv. UBL Ameen has a proper system in place to ensure that any earnings realized from sources or by means prohibited by Shariah have been credited to charity account and are being properly utilized.
v. UBL Ameen has complied with the SBP instructions on Profit and Loss distribution and Pool Management.
vi. The level of awareness, capacity & sensitization of the staff and the management in appreciating the importance of Shariah compliance in the products and processes of the bank is satisfactory.
vii. Shariah Board has been provided adequate resources enabling it to discharge its duties effectively.
Recommendations:For further enhancement, Shariah Board recommends the following:i. Shariah Board appreciates bank’s efforts to increase
deployment of funds in Shariah compliant avenues viz-a-viz increase in deposits, however, as observed and discussed during the Shariah Board review of key business areas, bank is advised to further improve Finance to Deposit ratio and ensure effective utilization of excess liquidity in Shariah Compliant avenues by UBL Ameen.
ii. During the Shariah Board review of branches, it was observed that staff posted in Islamic Banking branches and Islamic Banking Windows are not adequately trained for Islamic Banking products and services. As already advised, bank must ensure Islamic Banking training is imparted to all Islamic banking and support staff. Further, Islamic Banking training should be made an integral part of performance appraisals for all the Islamic Banking staff.
iii. In order to effectively respond to customer queries in branches, bank should ensure transfer and posting of Islamic Banking trained staff from Conventional to Islamic Banking branches where required. In case where rotation, induction and internal transfer is inescapable, it is then prudent to train and fill the knowledge gap of such staff prior to posting in Islamic Banking branches.
iv. Hiring of additional resources in Shariah Compliance Department, to further improve efficiency of the unit.
v. Hiring of dedicated resources in Risk Management Department, to avoid any Shariah non-compliance at various transaction stages.
vi. Although Shariah Board acknowledges bank’s efforts to restrict Conventional account opening in UBL Ameen branches, however, bank is advised to close all such accounts opened prior to restrictions.
vii. Bank is further advised to ensure that all the Product Manuals and related agreements along with amendments are duly endorsed by the Shariah Board at all time and implemented accordingly, to comply with Shariah Governance Framework of State Bank of Pakistan.
viii. While appreciating other staff financing facilities which have been made available according to Shariah principles, we recommend that Provident Fund of Islamic banking staff should be invested in Shariah compliant avenues, as already recommended by the Shariah Board.
ix. Products and Services offered by other Islamic Banking Institutions should be compared with existing offerings and made available keeping in view the business potential.
Conclusion:The Shariah Board of UBL Ameen is satisfied with the overall performance and operations of UBL Ameen Pakistan – Islamic Banking Division of United Bank Limited and hope that the management will keep this momentum of profitability, Shariah Compliance and market penetration, and thus play pivotal role in sound and manifold growth of Islamic Banking countrywide.
Mufti Imtiaz AlamResident Shariah Board Member
Dr. Mufti Ejaz Ahmed SamadaniShariah Board Member
Dr. Mufti Muhammad Zubair UsmaniChairman Shariah Board
Date of Report: 12th February, 2021.
United Bank Limited60

Based on above, we are of the view that:i. UBL Ameen has overall complied with Shariah rules and
principles in the light of Fatawa, rulings and guidelines issued by the Shariah Board.
ii. UBL Ameen has overall complied with directives, regulations, instructions and guidelines related to Shariah compliance issued by SBP in accordance with the rulings of SBP’s Shariah Advisory Committee.
iii. UBL Ameen has a satisfactory mechanism in place to ensure Shariah compliance in their overall operations.
iv. UBL Ameen has a proper system in place to ensure that any earnings realized from sources or by means prohibited by Shariah have been credited to charity account and are being properly utilized.
v. UBL Ameen has complied with the SBP instructions on Profit and Loss distribution and Pool Management.
vi. The level of awareness, capacity & sensitization of the staff and the management in appreciating the importance of Shariah compliance in the products and processes of the bank is satisfactory.
vii. Shariah Board has been provided adequate resources enabling it to discharge its duties effectively.
Recommendations:For further enhancement, Shariah Board recommends the following:i. Shariah Board appreciates bank’s efforts to increase
deployment of funds in Shariah compliant avenues viz-a-viz increase in deposits, however, as observed and discussed during the Shariah Board review of key business areas, bank is advised to further improve Finance to Deposit ratio and ensure effective utilization of excess liquidity in Shariah Compliant avenues by UBL Ameen.
ii. During the Shariah Board review of branches, it was observed that staff posted in Islamic Banking branches and Islamic Banking Windows are not adequately trained for Islamic Banking products and services. As already advised, bank must ensure Islamic Banking training is imparted to all Islamic banking and support staff. Further, Islamic Banking training should be made an integral part of performance appraisals for all the Islamic Banking staff.
iii. In order to effectively respond to customer queries in branches, bank should ensure transfer and posting of Islamic Banking trained staff from Conventional to Islamic Banking branches where required. In case where rotation, induction and internal transfer is inescapable, it is then prudent to train and fill the knowledge gap of such staff prior to posting in Islamic Banking branches.
iv. Hiring of additional resources in Shariah Compliance Department, to further improve efficiency of the unit.
v. Hiring of dedicated resources in Risk Management Department, to avoid any Shariah non-compliance at various transaction stages.
vi. Although Shariah Board acknowledges bank’s efforts to restrict Conventional account opening in UBL Ameen branches, however, bank is advised to close all such accounts opened prior to restrictions.
vii. Bank is further advised to ensure that all the Product Manuals and related agreements along with amendments are duly endorsed by the Shariah Board at all time and implemented accordingly, to comply with Shariah Governance Framework of State Bank of Pakistan.
viii. While appreciating other staff financing facilities which have been made available according to Shariah principles, we recommend that Provident Fund of Islamic banking staff should be invested in Shariah compliant avenues, as already recommended by the Shariah Board.
ix. Products and Services offered by other Islamic Banking Institutions should be compared with existing offerings and made available keeping in view the business potential.
Conclusion:The Shariah Board of UBL Ameen is satisfied with the overall performance and operations of UBL Ameen Pakistan – Islamic Banking Division of United Bank Limited and hope that the management will keep this momentum of profitability, Shariah Compliance and market penetration, and thus play pivotal role in sound and manifold growth of Islamic Banking countrywide.
Mufti Imtiaz AlamResident Shariah Board Member
Dr. Mufti Ejaz Ahmed SamadaniShariah Board Member
Dr. Mufti Muhammad Zubair UsmaniChairman Shariah Board
Date of Report: 12th February, 2021.
:)ISAU) یونٹ آڈٹ شریعہ انٹرنل ور انٹرنل شریعہ آڈٹ یونٹ اپنے تفویض شدہ تمام امور،شریعہ گورننس فریم ورک کے مطابق انجام دیتا رہا ا
جیسے؛ برانچوں، صارفین امور کاروباری تمام میں آڈٹ رہا۔ کرتا حاصل راہنمائی ور ا مشورے سے بورڈ شریعہ
سے بورڈ شریعہ رپورٹس گیا۔آڈٹ کیا احاطہ کا معاملات کے تقسیم کی ونقصان نفع ور ا بزنسز کارپوریٹ ور ا
رہیں۔ جاتی ئی کروا جمع پاس مینجمنٹ کے کی امین ایل بی یو لئے کے اصلاحات ضروری بعد کے لینے رائے
تقسیم : اور وصولی کی چیریٹی روپے ن سال 3.53ملین تھی۔دورا روپے ر3.49 ملین مقدا کل کی چیریٹی شدہ وصول جنوری 2020 کو یکم
کی روپے 4.20ملین میں روں دا ا خیراتی بعد کے احتیاط مکمل ور ا بین چھان کڑی ور ا ہوئی وصول چیریٹی کی
سے وجہ کی تاخیر میں دائیگیوں ا رقم، تمام والی ہونے جمع میں اکاؤنٹ چیریٹی سال گئی۔اس کی تقسیم چیریٹی
ہوئی۔ جمع
کی رائے: بورڈ شریعہ کی قسم ہر نے ڈپارٹمنٹ پلائنس کم� شریعہ کہ گیا کیا بیان میں رپورٹ جیسا اس لیے کے کرنے قائم رائے اپنی
پیش کو بورڈ شریعہ رپورٹ کی اس ور ا لیا جائزہ کا عمل لائحہ کے ن ا ور ا دستاویزات متعلقہ سرگرمی، کاروباری
کا رپورٹوں کی ٹیموں معائنہ کی پاکستان آف بینک اسٹیٹ ور ا آڈٹ شریعہ انٹرنل نے ہم کہ یہ مزید ور ا کی
کہ: ہے یہ رائے ہماری میں روشنی کی حقائق بالا درج لہذا لیا جائزہ بھی
کی لائنز گائیڈ ور ا قوانین فتاوی، کردہ جاری سے طرف کی بورڈ شریعہ پر طور مجموعی نے امین ایل بی یو .1
ہے۔ کی ری پاسدا کی قواعد ور ا اصولوں کے شریعت میں روشنی
سلسلے کے پلائنس کم� شریعہ سے طرف کی پاکستان آف بینک اسٹیٹ پر طور مجموعی نے امین ایل بی یو .2
ہے۔ کی ری پاسدا کی عمل دستور ور ا ضوابط و ہدایات، قواعد اصولی کردہ جاری میں
کے بنانے یقینی کو پلائنس کم� شریعہ میں سرگرمیوں کاروباری اپنی پر طور مجموعی پاس کے امین ایل بی یو .3
نظام موجود ہے۔ اطمینان قابل لیے
سے رو کی شریعت کہ ہے بناتا یقینی کو بات اس جو ہے موجود نظام مناسب ایسا ایک میں امین ایل بی یو .4
میں ز اندا مناسب سے ا ر و ا جائے میں اکاؤنٹ چیریٹی آمدنی شدہ حاصل سے طریقوں یا ذرائع ممنوعہ
جائے۔ کیا استعمال
م )Pool Management( میں انصرا و انتظام کے پول ور ا تقسیم کی ونقصان نفع نے امین ایل بی یو .5
ری کی ہے۔ اسٹیٹ بینک آف پاکستان کی ہدایات کی پاسدا
کی ورانتظامیہ ا عملے میں بارے کے پلائنس کم� شریعہ میں سرگرمیوں کاروباری کی وربینک ا پروڈکٹس .6
ہے۔ اطمینان قابل حساسیت ور ا اہلیت ور ا آگاہی
سے طریقے احسن ریاں دا ذمہ اپنی ہ و بدولت کی جس گئے کیے فراہم وسائل مناسب کو بورڈ شریعہ .7
پایا۔ ے د انجام
سفارشات :ہے: کرتا پیش سفارشات ذیل درج بورڈ شریعہ لیے کے بہتری مزید
ڈیپازٹ ور ا بڑھانے کو استعمال میں شعبوں پلائنٹ کم� شریعہ کے فنڈز سے طرف کی بورڈ، بینک 1. شریعہ
ن دورا کے جائزے کے شعبوں مختلف کے بزنس کہ جیسا ہے، تاہم سراہتا کو کوششوں کی اضافے میں
تناسب باہمی کے ڈپوزٹ ور ا فائنانس ہ و کہ چاہیے کو بینک کہ گئی کی بھی ذکر ور ا گئی کی محسوس بات یہ
ہی میں شعبوں پلائنٹ کم� شریعہ ڈیٹی ی�و یک� ل� زائد کہ بنائے یقینی کو بات اس ور ا کرے اضافہ مزید میں
جائے۔ کی استعمال
اسلامک کہ آئی میں مشاہدے بات یہ ن دورا کے وزٹ کے برانچوں بینکنگ اسلامک بورڈکے شریعہ .2
ور ا پروڈکٹ کی بینکنگ اسلامک کی سٹاف کردہ میں تعینات ونڈوز بینکنگ اسلامک ور ا برانچوں بینکنگ
اسلامی تمام بینک، کہ گیا کہا بھی پہلے کہ جیسا نہیں۔ اطمینان قابل آگاہی میں بارے کے سے سروسز
بنائے۔ کویقینی ٹریننگ کی بینکنگ اسلامک کی سٹاف سپورٹ ور ا بینکنگ
تو ہو ضرورت اگر کہ چاہیے کو بینک لئے، کے دینے جوابات صحیح کے سوالات کے کسٹمر میں برانچ .3
یقینی کو بات اس میں تبادلہ ور ا تعینات کی عملہ میں برانچوں کی بینکنگ اسلامک سے برانچوں ن ش ن
یکنو�
انٹرنل ور ا تعینات مطابق کے معمول اگر البتہ جائے کیا متعین ہی عملہ یافتہ تربیت صرف کہ جائے بنایا
میں برانچوں پھر ور ا جائے دی ٹریننگ کی بینکنگ اسلامک کو عملہ ایسے کہ ہے یہ بہتر تو ہو ناگزیر تبادلہ
جاسکے۔ دیا جواب میں ز اندا مؤثر کا سوالات کے ز کسٹمر میں برانچوں تاکہ جائے کیا متعین
کا قوت دی افرا میں ڈیپارٹمنٹ کیلئے کرنے بہتر مزید کو کارکردگی کی ڈیپارٹمنٹ پلائنس کم� شریعہ .4
جائے۔ کیا اضافہ
میں مرحلوں مختلف کے ٹرانزیکشن تاکہ جائے کیا تقرر کا د افرا مخصوص میں ڈپارٹمنٹ مینجمنٹ رسک .5
جاسکے۔ بنایا یقینی کو پلائنس کم� شریعہ
کی بینک کیلئے تھام روک کی کھولنے اکاؤنٹ ن ش ن
کنو� میں ر ن پ
نبرا� کی امین ایل بی یو بورڈ شریعہ اگرچہ .6
بھی کو کرنے ختم اکاؤنٹس تمام ہوئے کھلے سے پہلے سے تھام روک مذکورہ تاہم ہے سراہتا کو کوششوں
جائے۔ بنایا یقینی
تر تمام س، ٹ
�ن
یم� �اگر متعلقہ ور مینولزا م پروگرا پروڈکٹ تمام کہ بنائے یقینی بھی کو بات اس بینک .7
اسٹیٹ تاکہ ہوں، العمل نافذ وروہی ا ہوں منظور یا مصدقہ کے بورڈ شریعہ وقت ہمہ سمیت، تبدیلیوں
سکے۔ ہو عمل سے طرح پوری پر ورک فریم گورننس شریعہ کردہ جاری طرف کی پاکستان آف بینک
مطابق کے اصولوں شرعی سہولیات دیگر کی فائنانس سٹاف کہ ہوئے سراہتے کو بات اس بورڈ شریعہ .8
شریعہ بھی کو فنڈ ویڈنٹ پرا کے سٹاف بینکنگ اسلامک کہ ہے دیتا تجویز یہ ہیں جارہی کی فراہم
ہے۔ چکی جا دی تجویز یہ بھی پہلے کہ جائے۔جیسا کیا انوسٹ میں شعبوں پلائنٹ کم�
کی بینک کا پروڈکٹس ور ا سروسز کردہ پیش سے جانب کی روں دا ا مالیاتی ور ا بینکوں اسلامی دوسرے .9
کی ن ا ہوئے رکھتے سامنے کو امکانات کاروباری ور ا جائے کیا زنہ موا سے سروسز ور ا پروڈکٹس موجودہ
جائے۔ بنایا یقینی کو فراہمی
اختتامیہ:مجموعی کی –پاکستان’’ امین ایل بی یو ’‘ ڈویژن بینکنگ اسلامک کے ایل یوبی بورڈ شریعہ کا امین ایل یوبی
میں مارکیٹ پلائنس، کم� شریعہ طرح اسی انتظامیہ کہ ہے کرتا امید ور ا ہے مطمئن سے آپریشنز ور ا کارکردگی
میں مزیدفروغ ور ا استحکام کے بینکنگ اسلامک میں بھر ملک ور ا گی رکھے ر برقرا کو رفتار کی منافع ور ا رسائی
گی۔ کرے دا ا ر کردا مرکزی
عالم امتیاز مفتی
ممبر بورڈ شریعہ ریزیڈنٹ
صمدانی احمد اعجاز ڈاکٹرمفتی
بورڈ شریعہ ممبر
عثمانی محمدزبیر اکٹرمفتی ڈ
بورڈ شریعہ چیئرمین
تاریخ: 12 فروری 2021ء کی رپورٹ
61Annual Report 2020

ہے۔یہ متبادل اسلامک اکاؤنٹ’’ کا ڈیجیٹل روشن ایل اکاؤنٹ ‘‘، دراصل ‘’یوبی ڈیجیٹل روشن ایل امین ’’یوبی
ملک بیرون لاکھوں ایسے ہے۔ م اقدا اہم ایک میں معیت کی بینکوں کمرشل کا پاکستان آف بینک اسٹیٹ
کے اکاؤنٹ اس ہیں، رکھتے خواہش کی انوسٹمنٹ یا دائیگی ا کی رقم بینکاری، میں پاکستان جو شہری، پاکستانی مقیم
ہیں۔ سکتے کر حاصل سروسز بینکنگ میں ز اندا نئے نت ذریعے
ڈیجیٹل پر طور مکمل بغیر کے وزٹ برانچ کو شہریوں پاکستانی مقیم ملک بیرون بار، پہلی میں تاریخ کی پاکستان
لئے کے کھلوانے اکاؤنٹ ہے۔یہ جارہی دی سہولت کی کھلوانے اکاؤنٹ بیٹھے گھر سے طریقے لائن آن ور ا
ور دستاویز ، مطلوبہ احتیاط کے پروسیس کے ذریعے48 گھنٹوں کے اندر اندر مہیا کرنا صرف ضروری معلومات ا
انوسٹمنٹ یا دائیگی ا کی رقم بینکاری، میں پاکستان جو شہری، د نژا پاکستانی ہ و بھی سہولیات یہ اب ور ا ہیں۔ ہوتی
ہیں۔ سکتے کر حاصل بیٹھے گھر سے طریقے کیے بغیر ڈیجیٹل کا برانچ وزٹ قسم بھی ہیں، کسی رکھتے خواہش کی
روشن صرف ساتھ کے منافع پرکشش ی�ٹ یک� یف� ٹ� سر� یہ ،‘‘)INPC( ی�ٹ یک� یف� ٹ� سر� پاکستان نیا ’’اسلامک
حکومتی میں مالیت کی روپے پاکستان ور ا ڈالر امریکی INPC ہیں۔ جاسکتے کیے آفر کو ہولڈرز اکاؤنٹ ڈیجیٹل
،)SPV( ور انتظام حکومت پاکستان کی طرف سے ایک سپیشل پرپز وہیکل ء ا instruments ہیں جس کا اجرا
کی instruments ن ا پر طور مکمل جوکہ ہے جارہا کیا ذریعے کے لمیٹڈ کمپنی ی�ٹ یک� یف� ٹ� سر� پاکستان نیا اسلامک
مالک ہے۔
سے: حوالے یومرکے کنزہاؤسنگ میں ملک جسے ہے، سکیم کی گ
نس�
نفائنا� کی گھر میں قیمت کم یہ ،‘‘ گھر میرا پاکستان میرا امین ایل بی ’’یو
کا سکیم اس ہے۔ حاصل تعاون کا پاکستان آف بینک اسٹیٹ ور ا پاکستان حکومت لئے کے دینے فروغ کو سیکٹر
ہے۔ کرنا فراہم سہولیات کی گھر/اپارٹمنٹ خریدنے شدہ تعمیر نیا کو کسٹمر مقصد
اس نے بورڈ شریعہ ور ا گیا لیا جائزہ دوبارہ کا مینول پراڈکٹ موجودہ کے فائناسنگ آٹو ‘‘ ڈرائیو امین ایل بی یو ’’
دی۔ بھی منظوری کی
سے: حوالے ASSET کے
کے مؤجل( بیع ور ا وکالہ مشارکہ، مضاربہ، بینک )انٹر پروڈکٹس ٹریژری ور ا اجارہ کمرشل متناقصہ، شرکت
دی۔ بھی منظوری بعد کے لینے جائزہ نے بورڈ شریعہ ڈاکیومنٹس کا ٹرانزیکشن ور ا مینولز م پروگرا پروڈکٹ
:)SME) ای ایم ایس اور یٹ کارپورایس ور ا گئیں۔کارپوریٹ لائی میں عمل ر
ن�
ن�
شٹرانزکس ای ایم ایس ور ا پر671 کارپوریٹ طور مجموعی سال ن دورا
ہے: ہوتا مشتمل پر مراحل بنیادی تین ذیل جائزہ مندرجہ کا پلائنس کم� شریعہ کی ٹرانزیکشنز ای ایم
سے کی پہلے بورڈ شریعہ میں مرحلے ہے۔اس مرحلہ کا آغاز کے ٹرانزیکشن مرحلہ:یہ کا پہلے سے تمویل •
حتمی )Process Flow( فلو ورپروسیس ا ڈھانچہ کا ٹرانزیکشن مطابق کے گائیڈلائنز کردہ فراہم
ور ریزیڈنٹ شریعہ شکل اختیار کرتا ہے۔اس مرحلے میں تمام متعلقہ عوامل کا باقاعدگی سے جائزہ لیا گیا ا
ور اس کی بعد میں شریعہ بورڈ کے اجلاس میں توثیق بھی کروائی گئی۔ بورڈ ممبر سے منظوری لی گئی ا
عمل ٹرانزیکشن پہلی مطابق )Process Flows(کے ز فلو پروسیس مرحلہ مرحلہ:یہ کا تمویل •
کی ٹرانزیکشن سے طرف کی ڈپارٹمنٹ پلائنس کم� شریعہ میں جس ہے، مرحلہ کا وقت کے لانے میں
پہلی ممبرسے بورڈ شریعہ ریزیڈنٹ مطابق کے اسی ور ا رہا جاتا لیا بھی جائزہ کا دستاویزات مطلوبہ تمام
کو گائیڈلائنز موجود سے پہلے کی بورڈ شریعہ میں مرحلے اس رہی۔ جاتی لی بھی منظوری کی ٹرانزیکشن
اجلاس والے آنے ہر کے بورڈ شریعہ کی منظوریوں م تما کی ممبر بورڈ شریعہ ریزیڈنٹ ور ا گیا رکھا مدنظر
میں توثیق بھی کروائی گئی۔
نمونہ کا، ٹرانزیکشنز سے طرف کی ڈپارٹمنٹ پلائنس کم� شریعہ میں مرحلے مرحلہ:اس کا بعد کے تمویل •
رہا۔ جاتا لیا جائزہ مطابق گائیڈلائنز کے منظورشدہ سے پہلے کی بورڈ پر، شریعہ بنیاد کی
ٹریثرری : امین ایل یوبی تحت کے پروڈکٹس ٹریثری امین سال ن دورا ہے۔ ڈیپارٹمنٹ ٹریثرری مختار خود ور ا الگ کا امین ایل بی یو
شامل صک�وک اجارہ کے پاکستان حکومت ور وکالہ،ا مضاربہ، مشارکہ، میں جن ہوئیں، کل76ٹرانزیکشنز
ٹرانزیکشنز 16 تحت کے موجل’’ ‘’بیع پروڈکٹ شدہ منظور کی پاکستان آف بینک اسٹیٹ ہ علاو کے ہیں۔اس
کمی کی فنڈز یا لیکویڈٹی زیں، اضافی ا ہ گئیں۔علاو کی ساتھ کے حکومت پاکستان ٹرانزیکشنز سے3 میں جن ہوئیں
حتی کہ تھی مشروط ساتھ کے بات اس کہ جو گئی دی منظوری کی انتظامات پر بنیاد کی ’’قرض‘‘ میں صورت کی
چاہیے۔ جانا کیا انوسٹ میں روں دا ا مالیاتی اسلامی ور ا ای ایم کارپوریٹ، ایس کو فنڈز الوسع
مینجمنٹ: پول اور تقسیم کی نقصان و نفع ایل بی یو ہے۔ دیا کر وضع ‘‘ نظام کار ’’خود لئے کے مینجمنٹ پول ور ا تقسیم کی نقصان و نفع نے امین ایل بی یو
تر تمام کے پولز کے اقسام مختلف نے جنہوں ہے سے میں بینکوں چند ن ا انڈسٹری بینکنگ اسلامک امین
متعارف نظام کار خود پر طور مکمل سے مدد کی ٹیکنالوجی انفارمیشن لئے کے تقسیم کی نقصان و نفع ور ا حسابات
ہے۔ کروایا
ماہانہ ورWeightagesکو ا کتاب حساب کا پول یعنی کار طریقہ کا تقسیم کی نقصان و نفع ن دورا کے سال اس
تصحیح اسکی سے پلائنس ڈپارٹمنٹ کم� شریعہ ور ا گیا لایا زیر بحث ساتھ کے پلائنس ڈپارٹمنٹ کم� شریعہ پر بنیادوں
آڈٹ کا اس پر بنیادوں ماہی سہ بعد کے یونٹ )ISAU(نے تقسیم آڈٹ شریعہ گئی۔انٹرنل کروائی بھی توثیق و
گئی۔ کی حاصل بھی رائے کے کر پیش رپورٹس کو بورڈ آئی، شریعہ پیش ضرورت جہاں اور ا کیا
ڈویلپمنٹ : اور یننگ ٹراسلامک لئے کے سٹاف ایل بی یو ور ا امین ایل بی یو سے طرف کی امین ایل بی یو ن دورا کے 2020ء سال
جن گیا، کیا انعقاد کا ر ن
�ن
�ش
یس س� )via Cisco Webex( لائن آن ور ا روم کلاس مختلف کے ٹریننگ کی بینکنگ
ور اسلامک بینکنگ کے برانچ آپریشنز کے بنیادی میں اسلامک بینکنگ، اسلامک بینکنگ کی پروڈکٹس، خدمات ا
ور ا ڈپارٹمنٹ پلائنس کم� شریعہ ن، ا ممبر بورڈ شریعہ انعقاد، کا ر ن
�ن
�ش
یس س� ٹریننگ ن ا گئی۔ دی ٹریننگ کی معاملات
میں تجربات ور ا قابلیت ہ علاو کے اس گیا۔ کیا سے جانب کی ایگزیکٹوز کے ڈپارٹمنٹ آپریشنز اینڈ پروڈکٹس
آف بینک اسٹیٹ ور )CEIF(‘‘ا فنانس اسلامک فار لینس یکسی ا� آف ’’سینٹر کو اسٹاف منتخب لئے کے اضافے
پاکستان کے ذیلی شعبے ’’انسٹی ٹیوٹ آف بینکنگ اینڈ فائنانس)NIBAF(‘‘کے ذریعے ٹریننگ دلوائی گئی۔
ور ا ایل یوبی میں، بھر ملک سے حوالے کے ‘‘ پاکستان میرا گھر ’’میرا پروڈکٹ Low Cost فائنانس کنزیومر
نے سٹاف تمام کے برانچ میں جس گیا، کیا انعقاد کا ر ن
�ن
�ش
یس س� ٹریننگ تفصیلی لئے کے ر ن پ
نبرا� مختلف کی امین ایل یوبی
کی۔ شرکت
لئے، یو کے دینے کوفروغ ٹریننگ بینکنگ اسلامک لئے کے میں، سٹاف بینک پورے ایماء پر مینجمنٹ کے سینئر
آغاز م‘‘ کا پروگرا آگاہی بینکنگ یو)Knowledge for You(اسلامک فار ر’’نالج وا ہفتہ نے امین ایل بی
آگاہی کی بینکنگ اسلامک پر موضوعات مختلف سکالرز شریعہ ور ا بورڈ شریعہ کے امین ایل یوبی میں جس کیا،
کا ٹریننگ لئے کے ر ن پ
نبرا� امین ایل بی یو نے ڈیپارٹمنٹ پلائنس کم� شریعہ ہ علاو کے ہیں۔اس کرتے فراہم
مختصر کتابچہ تیار کیا جو کہ کسٹمر کی بروقت رہنمائی میں برانچ سٹاف کے لئے معاون ثابت ہو گا۔
کو د موا معلوماتی سے حوالے کے بینکاری اسلامی لیے، کے دینے فروغ کو کلچر ٹریننگ میں بینک طرح اسی
گیا۔ کیا دستیاب ذریعے کے موڈیول لرننگ ای پر سسٹم مینجمنٹ لرننگ اسے ور ا کیا منظور نے بورڈ شریعہ
United Bank Limited62

الرحیم الرحمن اللہ بسم
مکمل ساتھ کے کامیابی سال کے14 بینکنگ اسلامی نے امین ایل بی یو سے کرم و فضل کے تعالی للہ،اللہ الحمد
ہوا اضافہ معمولی غیر میں وسعت کی مارکیٹ ور ا منافع روباری کا کے امین ایل بی یو سال اس ہیں۔ لیے کر
ہے۔
ریکارڈ روپے 2.51بلین )PBT( ٹیکس ز ا قبل منافع ہوئے دکھاتے کارکردگی بہترین نے امین ایل یوبی
ظاہر کو فیصداضافے 62 میں مقابلے کے ٹیکس ز ا قبل منافع کے وپے ر 1.55بلین کے سال گذشتہ جو کیا
کرتاہے۔
کار : دائرہ ر ہے کہ ہمہ وقت بینک کے تمام امور بورڈ آف ڈائریکٹر اورانتظامیہ مکمل طور پراس بات کو یقینی بنانے کی ذمہ دا
گورننس شریعہ کے پاکستان آف بینک اسٹیٹ مقصد کا رپوٹ پائیں۔اس سرانجام مطابق کے اصولوں شرعی
فریم ورک میں بیان کردہ تفصیلات کے مطابق اسلامک بینکنگ کے معاملات کا شرعی جائزہ پیش کرنا ہے۔
والی ہونے سال ن دورا ور ا ماحول کے پلائنس کم� شریعہ مجموعی کے امین ایل یوبی میں رپورٹ اس بورڈ شریعہ
ہے۔ کرتا پیش رپورٹ اپنی میں بارے کے سرگرمیوں اہم
اجلاس: کے بورڈ شریعہ زکم ا کم پر بنیادوں ماہی سہ کا بورڈ شریعہ مطابق کے ورک فریم گورننس شریعہ کے پاکستان آف بینک اسٹیٹ
میں جن ہیں، چکے ہو منعقد اجلاس 23 کل تک اب کے بورڈ شریعہ چنانچہ ہے۔ لازمی ہونا منعقد اجلاس ایک
اسلامک کے پاکستان آف بینک داسٹیٹ روئیدا کی اجلاس ہر ں زا بعدا ہوئے میں 2020ء 4اجلاس سے
شریعہ ٹریننگ، کی بینکنگ اسلامک ڈویلپمنٹ، پروڈکٹ ہ علاو کے گئی۔اس دی کروا جمع میں ڈپارٹمنٹ
ہوئے۔ منعقد اجلاس کئی لئے کے خیال تبادلہ پر پہلوؤں مختلف کے آڈٹ شریعہ ور ا پلائنس کم�
کا ماحول شرعی میں آفس ہیڈ ور ا منتخب برانچوں امین )پاکستان( کی ایل بی یو لیے کے لینے کاجائزہ ماحول شرعی
لیا۔ کاجائزہ شریعہ کنٹرولز ور ا کیا دورہ کا شعبوں مختلف نے بورڈ شریعہ ن سال دورا لئے کے لینے جائزہ
ڈیپارٹمنٹ: لائنس پ م� ک شریعہ کی شریعت میں سرگرمیوں تمام کی بینک لئے کے کرنے حاصل درجہ اطمینان قابل سے اعتبار شرعی
ہوئے کرتے کام نگرانی زیر کی بورڈ شریعہ ڈپارٹمنٹ، پلائنس کم� رہی۔شریعہ مرکز کلیدی کا توجہ ری پاسدا
شریعہ کا )پاکستان( امین ایل رہا۔یوبی کرتا دا ا ر کردا کا رابطہ مؤثر ایک درمیان کے بورڈ ورشریعہ ا انتظامیہ
شریعہ ایک میں جن ہے مشتمل پر رکان ا دومعاون ور ا سربراہ کے ڈیپارٹمنٹ ایک ڈپارٹمنٹ پلائنس کم�
سکالرہیں۔
گیا۔ لیا جائزہ کا ری پاسدا کی امور شرعی میں امور دیگر کے آفس ہیڈ ور ا بینکنگ برانچوں اسلامک سال ن دورا
جائزے کیلئے 80 کے پلائنس کم� شریعہ ونڈوز میں ور ا برانچوں بینکنگ اسلامک نے ڈپارٹمنٹ پلائس کم� شریعہ
رپورٹ کی دورے ہر کے ونڈوز ور ا برانچوں بینکنگ اسلامک سے غرض کی تعمیل ور ا کیے۔اصلاح دورے
گئی۔ کروائی کو جمع سربراہ کے بینکنگ اسلامک ور ا مینیجر ڈسٹرک
کو بورڈ شریعہ میں اجلاس والے بعدآنے کے ماہی سہ ہر رپورٹس جامع اپنی نے ڈپارٹمنٹ پلائنس کم� شریعہ
رپورٹ بورڈ شریعہ سال2020ء برائے مالی
جاری سے پہلے کی بورڈ شریعہ ور ا تفصیلات کی جائزوں شرعی تمام رپورٹس مذکورہ کیں۔ پیش لئے کے توثیق
گئی دی ذریعے کے سرکولیشن کی بورڈ شریعہ ور ا رائے ممبرکی بورڈ شریعہ ریزیڈنٹ میں روشنی کی کردہ ہدایات
ن ا بعد کے سماعت نے بورڈ شریعہ ور ا گیا کیا پیش کے لئے توثیق کی بورڈ شریعہ جنہیں تھیں مشتمل پر ہدایات
دی۔ کر توثیق کی
ورک: نیٹ برانچ امین ایل بی یو پاکستان امین ایل یوبی ہے۔ گئی ہو 100 اب د تعدا کی برانچوں بینکنگ اسلامک کی امین ایل بی یو الحمدللہ،
25 میں 2020ء سال ساتھ ساتھ کے اس ہے۔ ایک سے میں بینکوں والے کرنے دا ا ر کردا قائدانہ میں
کی ایل بی خدمات یو کی ونڈوز بینکنگ میں اسلامک بھر ملک ساتھ، اب کے اضافے کے ونڈوز بینکنگ اسلامک
پاکستان آف بینک اسٹیٹ ، سے حوالے کے ونڈوز بینکنگ ہیں۔اسلامک جارہی کی فراہم میں 187برانچوں
ایل بی یو لیے کے تعمیل 2020کی نمبر2آف سرکلر گئے کیے جاری سے طرف کی بینکنگ اسلامک شعبہ کے
منظوری سے ڈائریکٹر آف بورڈ کے بینک ور ا بورڈ شریعہ کی جس کی تیار پالیسی ونڈوز بینکنگ اسلامک نے امین
گئی۔ لی
خدمات : اور پروڈکٹس سے: حوالے Liabilityکے
آغاز کا پروڈکٹ ی ٹ جل� �ی�
ئمذکورہ لا� پر بنیاد کی مضاربہ نے بینک سال ن اکاؤنٹ ‘‘ دورا سٹیزن گڈ امین ایل ’’یوبی
امین ایل بی ہے۔یو دینا فروغ کو معیشت دستاویزی سے طریقے پلائنٹ کم� شریعہ مقصد کا پروڈکٹ اس کیا۔
کے کنسلٹنٹ خودمختار کو ہولڈر اکاؤنٹ کاروباری ور ا ذاتی جسے ہے پروڈکٹ پہلی کی نوعیت اپنی سٹیزن ڈ ٹ
گ
نہ میں ن ا ہے۔تاکہ گیا دیا ترتیب کیلئے کرنے ‘‘فراہم سہولیات مفت کی کروانے جمع رہ گوشوا ’’ٹیکس ذریعے
ساتھ کے اطمینان ذہنی بلکہ جائے کیا اجاگر کو اہمیت کی کروانے جمع رہ گوشوا ٹیکس انکم بروقت کہ یہ صرف
کی جائے۔ فراہم بھی مدد میں کروانے جمع رہ گوشوا ٹیکس
مستفیدہونیوالے سے س ن�
ٹیم�ی� �
ر ہوم اکاؤنٹ یہ ،‘‘ اکاؤنٹ س ن�
ٹیم�ی� �
ر آسان تیزرفتار امین ایل بی ’’یو
د افرا ایسے یا منقطع سے پربینکاری طور خاص طبقات تمام کے معاشرے اکاؤنٹ یہ ہے۔ لئے دکے افرا
کر ے د وسعت کو رسائی تک سہولیات کی بینکنگ لئے کے ہو نہ رسائی مکمل تک سہولیات کی بینکنگ جنہیں
ہے۔ معاون بھی لئے کے ہدف کے شمولیت مالی میں ملک
گیا کیا شامل میں پروڈکٹ کی کارڈ ڈیبٹ کے امین ایل یوبی بھی کو ،‘‘ کارڈ ڈیبٹ PayPak امین ایل بی یو ’’
کے صارفین ہے۔جو کرتا پیش حل کا دائیگی ا کی واجبات پر خرچ کم انتہائی کو صارفین گھریلو اکاؤنٹ یہ ہے۔
مقامات تمام ان کارڈ یہ ہے۔ بناتا ممکن رسائی تک اکاؤنٹ اپنے میں پاکستان ہفتے پورے ور ا گھنٹے چوبیس لئے
خریدوفروخت، طرح اسی ہو۔ ں ویزا آ لوگو پر 1Link/MNetکا ر ن
ل�ن
ٹرم�ی� POS جہاں ہے استعمال قابل پر
موجودہ ہے۔ سکتا جا کیا استعمال بھی لئے کے دائیگی ا کی وغیرہ فیول ور ا ،چھٹیاں �ٹن
م�ن
ی� ٹ� جائزانٹر� سفر، کھانا،
ہے۔ گیا کردیا ڈیٹ اپ مطابق کے سی ایف این بھی کو کارڈ ڈیبٹ
کسٹمرز/ تمام اپنے امین ایل بی یو تحت کے پروڈکٹ اس کوریج‘‘، تکافل لئے کے کسٹمرز کے امین ایل بی یو ’’
ور ا وفات ’’حادثاتی ذریعے کے آپریشنز‘‘ تکافل ونڈو انشورر ایل بی ’’یو پر طور زی اعزا کو ہولڈرز اکاؤنٹ
ہے۔ کررہا کوریج ‘‘ پیش تکافل میں صورت کی مستقل معذوری
روں دا ا کارپوریٹ مقصد کا بینکنگ ایمپلائی امین ایل بی بینکنگ )امین @ ورک(‘‘، یو ایمپلائی ایل امین ’’یوبی
کرناہے۔ پیشکش کی فوائد دیگر ساتھ کے اس ور ا کرنے دا ا تحت کے سسٹم کار خود تنخواہیں کی ملازمین اپنے کو
سروسز بہترین سے حوالے کے مینجمنٹ کیش لئے کے دائیگی ا کی تنخواہوں کو کسٹمرز کارپوریٹ اکاؤنٹ یہ
ہیں۔ بناتی مضبوط زیادہ سے شپ پہلے ریلیشن اکاؤنٹ ساتھ کے روں دا ا جوکاروباری ہے کرتا فراہم
63Annual Report 2020

Sajid HussainGroup Executive - Compliance
Aameer KarachiwallaChief Financial Officer
Shazad G. DadaPresident & CEO
Irfan MemonGroup Head – Audit &
Risk Review
Aslam SadruddinGroup Executive – Operations
Independent Auditor’s ReviewReport to the Members ofUnited Bank LimitedReview Report on the Statement of Compliance contained in Listed Companies(Code of Corporate Governance) Regulations, 2019
Annual Statement on Internal Controls 2020
We have reviewed the enclosed Statement of Compliance with the
Listed Companies (Code of Corporate Governance) Regulations,
2019 (the Regulations) prepared by the Board of Directors of
United Bank Limited (the Bank) for the year ended December 31,
2020 in accordance with the requirements of regulation 36 of the
Regulations.
The responsibility for compliance with the Regulations is that of
the Board of Directors of the Bank. Our responsibility is to review
whether the Statement of Compliance reflects the status of the
Bank’s compliance with the provisions of the Regulations and
report if it does not and to highlight any non-compliance with the
requirements of the Regulations. A review is limited primarily to
inquiries of the Bank’s personnel and review of various documents
prepared by the Bank to comply with the Regulations.
As a part of our audit of the financial statements we are required
to obtain an understanding of the accounting and internal control
systems sufficient to plan the audit and develop an effective audit
approach. We are not required to consider whether the Board of
Directors’ statement on internal control covers all risks and
controls or to form an opinion on the effectiveness of such internal
controls, the Bank’s corporate governance procedures and risks.
The Regulations require the Bank to place before the Audit
Committee, and upon recommendation of the Audit Committee,
place before the Board of Directors for their review and approval,
its related party transactions. We are only required and have
ensured compliance of this requirement to the extent of the
approval of the related party transactions by the Board of
Directors upon recommendation of the Audit Committee.
Based on our review, nothing has come to our attention which
causes us to believe that the Statement of Compliance does not
appropriately reflect the Bank's compliance, in all material
respects, with the requirements contained in the Regulations as
applicable to the Bank for the year ended December 31, 2020.
A.F. Ferguson & Co.Chartered AccountantsKarachiDated: March 3, 2021
The Internal Control System comprises of various inter-related
components including the Control Environment, Risk
Assessment, Control Activities, Information & Communication and
Monitoring.
It is the responsibility of the Bank’s management to establish an
Internal Control System to maintain an adequate and effective
Internal Control Environment. An Internal Control System is a set
of processes designed to identify and mitigate the risk of failure
and achieve overall business objectives of the Bank.
Internal controls and policies are designed to provide reasonable
assurance regarding the effectiveness and efficiency of the
Bank’s operations, reliability of financial information and
compliance with applicable laws and regulations.
Management ensures an efficient and effective Internal Control
System by carrying out risk assessment, identifying controls,
reviewing pertinent policies/procedures and establishing relevant
control procedures and monitoring systems.
Evaluation
The Bank’s Internal Control System has been designed to provide
reasonable assurance to the shareholders and Board of Directors;
however, these systems may not entirely eliminate the risk of
misreporting and failure of certain controls under a changing
environment.
Evaluation of the Bank’s Internal Control System comprises of
different levels of monitoring activities i.e. Line Management,
Compliance Group and Audit & Risk Review Group. Line
Management’s role has been enhanced to include onsite reviews
of processes in branches to identify gaps in execution with special
emphasis on the implementation of regulatory instructions in
addition to day to day monitoring of control breaches for prompt
corrective actions. In order to improve the oversight on
compliance with Regulatory requirements and KYC CDD/EDD
quality, Regional Compliance Business Managers have been
placed in each Branch Banking region. Further, keeping in view
the changing risk environment and Bank’s increased focus on
controls and compliance matters, an Internal Control Division is
operating within Operations Group for monitoring branch related
operations.
Compliance Group ensured regulatory compliance across the
Bank on an on-going basis. Audit & Risk Review Group continued
to perform audit and review activities to evaluate the
implementation of controls and ensure the existence of a healthy
control environment throughout the Bank. During the year, Audit &
Risk Review Group has performed various offsite reviews and
consulting engagements considering the emerging threats and
assessing the management responsiveness to provide insights on
overall governance, evolving risks and embedded controls for
enhancing the overall control environment.
All significant and material findings of the internal & external
auditors and regulators were addressed on a priority basis by the
management and their status was reported periodically to the
Board Audit Committee and Risk & Compliance Committee, who
ensured that management has taken appropriate corrective
actions and has put in place a system to minimize repetition to
ensure strengthening of the control environment.
The Bank endeavors to follow the State Bank of Pakistan’s
guidelines on Internal Controls. The Bank is continuously making
efforts to ensure that an effective and efficient Internal Control
System remains active & implemented through consistent &
continuous monitoring that would help in further improving the
overall control environment.
Based upon the results achieved from audits and reviews
conducted by Line Management, Compliance Group, Internal
Control Division and Audit & Risk Review Group during the year,
management considers that the existing Internal Control System
is adequate and has been effectively implemented and monitored,
though room for improvement always exists.
United Bank Limited64

16. The Board has set up an effective Internal Audit function. The Internal Auditors are conversant with the policies and procedures of the Bank and are considered suitably qualified and experienced for the purpose;
17. The statutory auditors of the Bank have confirmed that they have been given a satisfactory rating under the Quality Control Review program of the Institute of Chartered Accountants of Pakistan and registered with Audit Oversight Board of Pakistan, that they and all their partners are in compliance with International Federation of Accountants (IFAC) guidelines on code of ethics as adopted by the Institute of Chartered Accountants of Pakistan and that they and the partners of the firm involved in the audit are not a close relative (spouse, parent, dependent and non-dependent children) of the Chief Executive Officer, Chief Financial Officer, Head of Internal Audit, Company Secretary or Director of the Bank;
18. The statutory auditors or the persons associated with them have not been appointed to provide other services except in accordance with the Act, these Regulations or any other regulatory requirement and the auditors have confirmed that they have observed IFAC guidelines in this regard;
19. We confirm that all requirements of regulations 3, 6, 7, 8, 27, 32, 33 and 36 of the Regulations have been complied with.
Sir Mohammed Anwar Pervez, OBE, HPkChairmanKarachi
The Bank has complied with the requirements of the Regulations in the following manner:-
1. The total number of directors are 9 as per the following:a) Male: 8b) Female: 1
2. The composition of the Board is as follows:
3. During the year, the term of the Board of Directors (BoD) was completed and the BoD of the Bank was reconstituted in the Annual General Meeting held on March 25, 2020. All the outgoing directors were re-elected. Moreover, the term of the President and CEO, Ms. Sima Kamil (a female director), was completed on June 30, 2020. Mr. Shazad G. Dada was appointed as President & CEO of the Bank effective from July 15, 2020 by the BoD.
Subsequent to the appointment of the new President & CEO, Khalid Sherwani resigned on August 5, 2020 in order to pave the way for the induction of a female director as per requirements of the Listed Companies (Code of Corporate Governance) Regulations, 2019. Consequently, the BoD appointed Ms. Shazia Syed as Independent Director on November 9, 2020. The newly appointed director assumed her role effective from January 21, 2021 after clearance of Fit and Proper test from the State Bank of Pakistan;
4. The directors have confirmed that none of them is serving as a director on more than seven listed companies, including this Bank;
5. The Bank has prepared a code of conduct and has ensured that appropriate steps have been taken to disseminate it throughout the Bank along with its supporting policies and procedures;
6. The Board has developed a vision/mission statement, overall corporate strategy and significant policies of the Bank. The Board has ensured that complete record of particulars of the significant policies along with their date of approval or updating is maintained by the Bank;
7. All the powers of the Board have been duly exercised and decisions on relevant matters have been taken by the Board/ shareholders as empowered by the relevant provisions of the Act and these Regulations;
8. The meetings of the Board were presided over by the Chairman. The Board has complied with the requirements of
the Act and the Regulations with respect to frequency, recording and circulating minutes of meeting of the Board;
9. The Board have a formal policy and transparent procedures for remuneration of directors in accordance with the Act and these Regulations;
10. Seven directors have already attended SECP approved Directors’ Training Program. Remaining Two Directors are exempt from the requirement of the training due to their relevant experience;
11. The Board has approved appointment of Chief Financial Officer, Company Secretary and Head of Internal Audit, including their remuneration and terms and conditions of employment and complied with relevant requirements of the Regulations;
12. Chief Financial Officer and Chief Executive Officer duly endorsed the financial statements before approval of the Board;
13. The Board has formed committees comprising of members given below;
a. BOARD AUDIT COMMITTEE (BAC):
b. BOARD HUMAN RESOURCE & COMPENSATION COMMITTEE (HRCC):
c. BOARD RISK & COMPLIANCE COMMITTEE (BRCC):
d. BOARD IT COMMITTEE (BITC):
e. BOARD NOMINATION COMMITTEE (BNC):
14. The Terms of Reference (TORs) of the aforesaid committees have been formed, documented and advised to the committee for compliance;
15. The frequency of meetings (quarterly/half yearly/ yearly) of the committee were as per following:
Statement of Compliancewith Listed Companies(Code of Corporate Governance)Regulations, 2019For the year ended December 31, 2020
a. Board Audit Committee
b. Board Human Resource &
Compensation Committee
c. Board Risk & Compliance
Committee
d. Board IT Committee
e. Board Nomination Committee
Four quarterly meetings.
Four quarterly meetings.
Four quarterly meetings.
Four quarterly meetings.
Two meetings.
Mr. Tariq Rashid Chairman
Mr. Haider Zameer Choudrey Member
Mr. Rizwan Pervez Member
Mr. Arshad Ahmad Mir Chairman
Lord Zameer M. Choudrey, CBE, SI Pk, FCA Member
Mr. Shazad G. Dada Member
Sir Mohammed Anwar Pervez, OBE, HPk Chairman
Lord Zameer M. Choudrey, CBE, SI Pk, FCA Member
Mr. Arshad Ahmad Mir Member
Mr. Tariq Rashid Chairman
Sir Mohammed Anwar Pervez, OBE, HPk Member
Mr. Arshad Ahmad Mir Member
Mr. Rizwan Pervez Member
Mr. Tariq Rashid Chairman
Lord Zameer M. Choudrey, CBE, SI Pk, FCA Member
Mr. Haider Zameer Choudrey Member
Mr. Shazad G. Dada Member
Category
Independent Directors
Non-Executive Directors
Executive Director
Names
Mr. Amar Zafar Khan
Mr. Tariq Rashid
Ms. Shazia Syed (Female Director)
Sir Mohammed Anwar Pervez, OBE, HPk
Lord Zameer M. Choudrey, CBE, SI Pk, FCA
Mr. Rizwan Pervez
Mr. Haider Zameer Choudrey
Mr. Arshad Ahmad Mir
Mr. Shazad G. Dada, President & CEO
65Annual Report 2020

16. The Board has set up an effective Internal Audit function. The Internal Auditors are conversant with the policies and procedures of the Bank and are considered suitably qualified and experienced for the purpose;
17. The statutory auditors of the Bank have confirmed that they have been given a satisfactory rating under the Quality Control Review program of the Institute of Chartered Accountants of Pakistan and registered with Audit Oversight Board of Pakistan, that they and all their partners are in compliance with International Federation of Accountants (IFAC) guidelines on code of ethics as adopted by the Institute of Chartered Accountants of Pakistan and that they and the partners of the firm involved in the audit are not a close relative (spouse, parent, dependent and non-dependent children) of the Chief Executive Officer, Chief Financial Officer, Head of Internal Audit, Company Secretary or Director of the Bank;
18. The statutory auditors or the persons associated with them have not been appointed to provide other services except in accordance with the Act, these Regulations or any other regulatory requirement and the auditors have confirmed that they have observed IFAC guidelines in this regard;
19. We confirm that all requirements of regulations 3, 6, 7, 8, 27, 32, 33 and 36 of the Regulations have been complied with.
Sir Mohammed Anwar Pervez, OBE, HPkChairmanKarachi
The Bank has complied with the requirements of the Regulations in the following manner:-
1. The total number of directors are 9 as per the following:a) Male: 8b) Female: 1
2. The composition of the Board is as follows:
3. During the year, the term of the Board of Directors (BoD) was completed and the BoD of the Bank was reconstituted in the Annual General Meeting held on March 25, 2020. All the outgoing directors were re-elected. Moreover, the term of the President and CEO, Ms. Sima Kamil (a female director), was completed on June 30, 2020. Mr. Shazad G. Dada was appointed as President & CEO of the Bank effective from July 15, 2020 by the BoD.
Subsequent to the appointment of the new President & CEO, Khalid Sherwani resigned on August 5, 2020 in order to pave the way for the induction of a female director as per requirements of the Listed Companies (Code of Corporate Governance) Regulations, 2019. Consequently, the BoD appointed Ms. Shazia Syed as Independent Director on November 9, 2020. The newly appointed director assumed her role effective from January 21, 2021 after clearance of Fit and Proper test from the State Bank of Pakistan;
4. The directors have confirmed that none of them is serving as a director on more than seven listed companies, including this Bank;
5. The Bank has prepared a code of conduct and has ensured that appropriate steps have been taken to disseminate it throughout the Bank along with its supporting policies and procedures;
6. The Board has developed a vision/mission statement, overall corporate strategy and significant policies of the Bank. The Board has ensured that complete record of particulars of the significant policies along with their date of approval or updating is maintained by the Bank;
7. All the powers of the Board have been duly exercised and decisions on relevant matters have been taken by the Board/ shareholders as empowered by the relevant provisions of the Act and these Regulations;
8. The meetings of the Board were presided over by the Chairman. The Board has complied with the requirements of
the Act and the Regulations with respect to frequency, recording and circulating minutes of meeting of the Board;
9. The Board have a formal policy and transparent procedures for remuneration of directors in accordance with the Act and these Regulations;
10. Seven directors have already attended SECP approved Directors’ Training Program. Remaining Two Directors are exempt from the requirement of the training due to their relevant experience;
11. The Board has approved appointment of Chief Financial Officer, Company Secretary and Head of Internal Audit, including their remuneration and terms and conditions of employment and complied with relevant requirements of the Regulations;
12. Chief Financial Officer and Chief Executive Officer duly endorsed the financial statements before approval of the Board;
13. The Board has formed committees comprising of members given below;
a. BOARD AUDIT COMMITTEE (BAC):
b. BOARD HUMAN RESOURCE & COMPENSATION COMMITTEE (HRCC):
c. BOARD RISK & COMPLIANCE COMMITTEE (BRCC):
d. BOARD IT COMMITTEE (BITC):
e. BOARD NOMINATION COMMITTEE (BNC):
14. The Terms of Reference (TORs) of the aforesaid committees have been formed, documented and advised to the committee for compliance;
15. The frequency of meetings (quarterly/half yearly/ yearly) of the committee were as per following:
Statement of Compliancewith Listed Companies(Code of Corporate Governance)Regulations, 2019For the year ended December 31, 2020
a. Board Audit Committee
b. Board Human Resource &
Compensation Committee
c. Board Risk & Compliance
Committee
d. Board IT Committee
e. Board Nomination Committee
Four quarterly meetings.
Four quarterly meetings.
Four quarterly meetings.
Four quarterly meetings.
Two meetings.
Mr. Tariq Rashid Chairman
Mr. Haider Zameer Choudrey Member
Mr. Rizwan Pervez Member
Mr. Arshad Ahmad Mir Chairman
Lord Zameer M. Choudrey, CBE, SI Pk, FCA Member
Mr. Shazad G. Dada Member
Sir Mohammed Anwar Pervez, OBE, HPk Chairman
Lord Zameer M. Choudrey, CBE, SI Pk, FCA Member
Mr. Arshad Ahmad Mir Member
Mr. Tariq Rashid Chairman
Sir Mohammed Anwar Pervez, OBE, HPk Member
Mr. Arshad Ahmad Mir Member
Mr. Rizwan Pervez Member
Mr. Tariq Rashid Chairman
Lord Zameer M. Choudrey, CBE, SI Pk, FCA Member
Mr. Haider Zameer Choudrey Member
Mr. Shazad G. Dada Member
Category
Independent Directors
Non-Executive Directors
Executive Director
Names
Mr. Amar Zafar Khan
Mr. Tariq Rashid
Ms. Shazia Syed (Female Director)
Sir Mohammed Anwar Pervez, OBE, HPk
Lord Zameer M. Choudrey, CBE, SI Pk, FCA
Mr. Rizwan Pervez
Mr. Haider Zameer Choudrey
Mr. Arshad Ahmad Mir
Mr. Shazad G. Dada, President & CEO
United Bank Limited66

Sajid HussainGroup Executive - Compliance
Aameer KarachiwallaChief Financial Officer
Shazad G. DadaPresident & CEO
Irfan MemonGroup Head – Audit &
Risk Review
Aslam SadruddinGroup Executive – Operations
Independent Auditor’s ReviewReport to the Members ofUnited Bank LimitedReview Report on the Statement of Compliance contained in Listed Companies(Code of Corporate Governance) Regulations, 2019
Annual Statement on Internal Controls 2020
We have reviewed the enclosed Statement of Compliance with the
Listed Companies (Code of Corporate Governance) Regulations,
2019 (the Regulations) prepared by the Board of Directors of
United Bank Limited (the Bank) for the year ended December 31,
2020 in accordance with the requirements of regulation 36 of the
Regulations.
The responsibility for compliance with the Regulations is that of
the Board of Directors of the Bank. Our responsibility is to review
whether the Statement of Compliance reflects the status of the
Bank’s compliance with the provisions of the Regulations and
report if it does not and to highlight any non-compliance with the
requirements of the Regulations. A review is limited primarily to
inquiries of the Bank’s personnel and review of various documents
prepared by the Bank to comply with the Regulations.
As a part of our audit of the financial statements we are required
to obtain an understanding of the accounting and internal control
systems sufficient to plan the audit and develop an effective audit
approach. We are not required to consider whether the Board of
Directors’ statement on internal control covers all risks and
controls or to form an opinion on the effectiveness of such internal
controls, the Bank’s corporate governance procedures and risks.
The Regulations require the Bank to place before the Audit
Committee, and upon recommendation of the Audit Committee,
place before the Board of Directors for their review and approval,
its related party transactions. We are only required and have
ensured compliance of this requirement to the extent of the
approval of the related party transactions by the Board of
Directors upon recommendation of the Audit Committee.
Based on our review, nothing has come to our attention which
causes us to believe that the Statement of Compliance does not
appropriately reflect the Bank's compliance, in all material
respects, with the requirements contained in the Regulations as
applicable to the Bank for the year ended December 31, 2020.
A.F. Ferguson & Co.Chartered AccountantsKarachiDated: March 3, 2021
The Internal Control System comprises of various inter-related
components including the Control Environment, Risk
Assessment, Control Activities, Information & Communication and
Monitoring.
It is the responsibility of the Bank’s management to establish an
Internal Control System to maintain an adequate and effective
Internal Control Environment. An Internal Control System is a set
of processes designed to identify and mitigate the risk of failure
and achieve overall business objectives of the Bank.
Internal controls and policies are designed to provide reasonable
assurance regarding the effectiveness and efficiency of the
Bank’s operations, reliability of financial information and
compliance with applicable laws and regulations.
Management ensures an efficient and effective Internal Control
System by carrying out risk assessment, identifying controls,
reviewing pertinent policies/procedures and establishing relevant
control procedures and monitoring systems.
Evaluation
The Bank’s Internal Control System has been designed to provide
reasonable assurance to the shareholders and Board of Directors;
however, these systems may not entirely eliminate the risk of
misreporting and failure of certain controls under a changing
environment.
Evaluation of the Bank’s Internal Control System comprises of
different levels of monitoring activities i.e. Line Management,
Compliance Group and Audit & Risk Review Group. Line
Management’s role has been enhanced to include onsite reviews
of processes in branches to identify gaps in execution with special
emphasis on the implementation of regulatory instructions in
addition to day to day monitoring of control breaches for prompt
corrective actions. In order to improve the oversight on
compliance with Regulatory requirements and KYC CDD/EDD
quality, Regional Compliance Business Managers have been
placed in each Branch Banking region. Further, keeping in view
the changing risk environment and Bank’s increased focus on
controls and compliance matters, an Internal Control Division is
operating within Operations Group for monitoring branch related
operations.
Compliance Group ensured regulatory compliance across the
Bank on an on-going basis. Audit & Risk Review Group continued
to perform audit and review activities to evaluate the
implementation of controls and ensure the existence of a healthy
control environment throughout the Bank. During the year, Audit &
Risk Review Group has performed various offsite reviews and
consulting engagements considering the emerging threats and
assessing the management responsiveness to provide insights on
overall governance, evolving risks and embedded controls for
enhancing the overall control environment.
All significant and material findings of the internal & external
auditors and regulators were addressed on a priority basis by the
management and their status was reported periodically to the
Board Audit Committee and Risk & Compliance Committee, who
ensured that management has taken appropriate corrective
actions and has put in place a system to minimize repetition to
ensure strengthening of the control environment.
The Bank endeavors to follow the State Bank of Pakistan’s
guidelines on Internal Controls. The Bank is continuously making
efforts to ensure that an effective and efficient Internal Control
System remains active & implemented through consistent &
continuous monitoring that would help in further improving the
overall control environment.
Based upon the results achieved from audits and reviews
conducted by Line Management, Compliance Group, Internal
Control Division and Audit & Risk Review Group during the year,
management considers that the existing Internal Control System
is adequate and has been effectively implemented and monitored,
though room for improvement always exists.
67Annual Report 2020

Complaint Handlingat UBLComplaint Management Unit under umbrella of Service Quality is
responsible for managing and resolving customer grievances
efficiently at UBL. While resolving customer complaints we ensure
following:
• UBL treats its customer fairly.
• UBL always informs customers regarding its complaint
handling mechanism.
• Complaints are resolved within the shortest possible time.
• UBL complaint handling mechanism is visible and accessible
for all its customers through the Website, Helpline and
Placards mentioning all touch points details.
• UBL’s complaint handling is comprehensive and integrated to
core business.
• Adequate monitoring and controls are in place to ensure the
operational efficiency and effectiveness of complaint
handling mechanism.
• Complaints are handled with impartiality and transparency.
Year 2020 started with a full enthusiasm whereas, COVID-19
impacted us all at a very personal level and in the conduct of our daily
affairs. Nevertheless, Complaint Management was able to resolve
customer issues efficiently & effectively. This not only shows the
commitment and honesty of purpose to customers but also
maintains an enhanced customer experience.
UBL has a robust mechanism in place for handling customer
complaints where customers have complete access to register
their grievances through the following modes (but not limited to):
Email, Letter, Fax, Website, IP Hotlines & 24/7 Helpline.
UBL encourages its customers to approach the external dispute
resolution forum i.e. Banking Mohtasib Pakistan, if they are not
satisfied with the complaint resolution provided by the Bank.
Volume of complaints has been increased in year 2020, which mainly
attribute with addition of products/services and due to COVID-19
pandemic, where customer focus also diverted towards digital
channels, which resultantly increase rise in customer queries and
complaints. However, Complaints trend and closure analysis also
been shared with Senior Management & Business owners and
remedial measures are taken accordingly.
To surpass the level of excellence and achieve customer satisfaction
UBL is in process of continuous improvement while analyzing
customer complaints, also with changing need of the customers,
management committed to enhance its customer experience and
formulated, Fair Treatment & Customer Service Committee (FTCSC),
this committee comprises of senior executives and is chaired by the
CEO.
Key highlights of year 2020 were as under:
• Complaint volume of 273,373 managed successfully.
• 87% complaints were resolved within the timelines provided
to our customers.
• 99.4% resolutions were provided in 15 days’ time (excluding
Visa/Master & fraud related issues).
• Average complaint resolution time stood at 4.9 days.
United Bank Limited68

Complaint Handlingat UBLComplaint Management Unit under umbrella of Service Quality is
responsible for managing and resolving customer grievances
efficiently at UBL. While resolving customer complaints we ensure
following:
• UBL treats its customer fairly.
• UBL always informs customers regarding its complaint
handling mechanism.
• Complaints are resolved within the shortest possible time.
• UBL complaint handling mechanism is visible and accessible
for all its customers through the Website, Helpline and
Placards mentioning all touch points details.
• UBL’s complaint handling is comprehensive and integrated to
core business.
• Adequate monitoring and controls are in place to ensure the
operational efficiency and effectiveness of complaint
handling mechanism.
• Complaints are handled with impartiality and transparency.
Year 2020 started with a full enthusiasm whereas, COVID-19
impacted us all at a very personal level and in the conduct of our daily
affairs. Nevertheless, Complaint Management was able to resolve
customer issues efficiently & effectively. This not only shows the
commitment and honesty of purpose to customers but also
maintains an enhanced customer experience.
UBL has a robust mechanism in place for handling customer
complaints where customers have complete access to register
their grievances through the following modes (but not limited to):
Email, Letter, Fax, Website, IP Hotlines & 24/7 Helpline.
UBL encourages its customers to approach the external dispute
resolution forum i.e. Banking Mohtasib Pakistan, if they are not
satisfied with the complaint resolution provided by the Bank.
Volume of complaints has been increased in year 2020, which mainly
attribute with addition of products/services and due to COVID-19
pandemic, where customer focus also diverted towards digital
channels, which resultantly increase rise in customer queries and
complaints. However, Complaints trend and closure analysis also
been shared with Senior Management & Business owners and
remedial measures are taken accordingly.
To surpass the level of excellence and achieve customer satisfaction
UBL is in process of continuous improvement while analyzing
customer complaints, also with changing need of the customers,
management committed to enhance its customer experience and
formulated, Fair Treatment & Customer Service Committee (FTCSC),
this committee comprises of senior executives and is chaired by the
CEO.
Key highlights of year 2020 were as under:
• Complaint volume of 273,373 managed successfully.
• 87% complaints were resolved within the timelines provided
to our customers.
• 99.4% resolutions were provided in 15 days’ time (excluding
Visa/Master & fraud related issues).
• Average complaint resolution time stood at 4.9 days.
69Annual Report 2020

FinancialStatements 2020
United Bank Limited70

FinancialStatements 2020
71Annual Report 2020
INDEPENDENT AUDITOR’S REPORTTo the members of United Bank Limited
Report on the Audit of the Unconsolidated Financial Statements
Opinion
We have audited the annexed unconsolidated financial statements of United Bank Limited (the Bank), which comprise the unconsolidated statement of financial position as at December 31, 2020, and the unconsolidated profit and loss account, the unconsolidated statement of comprehensive income, the unconsolidated statement of changes in equity and the unconsolidated cash flow statement for the year then ended, along with unaudited certified returns received from the branches except for 101 branches which have been audited by us and notes to the unconsolidated financial statements, including a summary of significant accounting policies and other explanatory information and we state that we have obtained all the information and explanations which, to the best of our knowledge and belief, were necessary for the purposes of the audit.
In our opinion and to the best of our information and according to the explanations given to us, the unconsolidated statement of financial position, unconsolidated profit and loss account, the unconsolidated statement of comprehensive income, the unconsolidated statement of changes in equity and the unconsolidated cash flow statement together with the notes forming part thereof conform with the accounting and reporting standards as applicable in Pakistan, and, give the information required by the Banking Companies Ordinance, 1962 and the Companies Act, 2017 (XIX of 2017), in the manner so required and respectively give a true and fair view of the state of the Bank’s affairs as at December 31, 2020 and of the profit and other comprehensive income, the changes in equity and its cash flows for the year then ended.
Basis for Opinion
We conducted our audit in accordance with International Standards on Auditing (ISAs) as applicable in Pakistan. Our responsibilities under those standards are further described in the Auditor’s Responsibilities for the Audit of the Unconsolidated Financial Statements section of our report. We are independent of the Bank in accordance with the International Ethics Standards Board for Accountants’ Code of Ethics for Professional Accountants as adopted by the Institute of Chartered Accountants of Pakistan (the Code) and we have fulfilled our other ethical responsibilities in accordance with the Code. We believe that the audit evidence we have obtained is sufficient and appropriate to provide a basis for our opinion.
Key Audit Matters
Key audit matters are those matters that, in our professional judgment, were of most significance in our audit of the unconsolidated financial statements of the current period. These matters were addressed in the context of our audit of the unconsolidated financial statements as a whole, and in forming our opinion thereon, and we do not provide a separate opinion on these matters.

United Bank Limited72
Following is the Key Audit Matter:
S.No Key Audit Matter How the matter was addressed in our audit
1 Provision against advances (Refer notes 5.4 and 10.4 to the unconsolidated financial statements)
The Bank makes provision against advances extended in Pakistan on a time-based criteria that involves ensuring that all non-performing advances are classified in accordance with the ageing criteria specified in the Prudential Regulations (PRs) issued by the State Bank of Pakistan (SBP).
In addition to the above time-based criteria, the PRs require a subjective evaluation of the credit worthiness of borrowers to determine the classification of advances.
The PRs also require the creation of general provision for certain categories of advances.
During the year, as a result of COVID-19, the SBP has allowed certain relaxations including deferment of principal payment, rescheduling / restructuring of principal and mark-up, extension in timeline of provisioning against trade bills while maintaining the customer status as “regular”.
Provision against advances of overseas branches is made as per the requirements of the respective regulatory regimes.
The Bank has recognized a net provision against advances amounting to Rs. 16,203.144 million in the unconsolidated profit and loss account in the current year. As at December 31, 2020, the Bank holds a provision of Rs. 79,027.512 million against advances.
The determination of provision against advances based on the above criteria remains a significant area of judgement and estimation. Because of the significance of the impact of these judgements / estimations and the materiality of advances relative to the overall unconsolidated financial statements of the Bank, we considered the area of provision against advances as a key audit matter.
Our audit procedures to verify provision against domestic advances included, amongst others, the following:
We obtained an understanding of the design and tested the operating effectiveness of the relevant controls established by the Bank to identify loss events and for determining the extent of provisioning required against non-performing advances.
The testing of controls included testing of:
controls over correct classification of non-performing advances on time-based criteria;
controls over monitoring of advances with higher risk of default and correct classification of non-performing advances on subjective criteria;
controls over accurate computation and recording of provisions; and
controls over the governance and approval process related to provisions, including continuous reassessment by the management.
We selected a sample of loan accounts and performed the following substantive procedures:
checked repayments of loan / mark-up installments, tested classification of non-performing advances based on the number of days overdue and considered the relaxations provided by SBP as result of COVID-19; and
evaluated the management’s assessment for classification of a borrower’s loan facilities as performing or non-performing based on review of repayment pattern, inspection of credit documentation, discussions with the management and the management’s consideration of the impact of COVID-19 on the borrower.
We checked the accuracy of specific provision made against non-performing advances and of general provision made against performing advances as per the requirements of PRs by recomputing the provision amount in accordance with the criteria prescribed under the PRs and relaxations provided by SBP as a result of COVID-19.
We issued instructions to auditors of those overseas branches which were selected for audit, highlighting ‘Provision against advances’ as a significant risk. The auditors of those branches performed audit procedures to check compliance with regulatory requirements and reported the results thereof to us. We, as auditors of the Bank, evaluated the work performed by the component auditors and the results thereof.
Information Other than the Unconsolidated and Consolidated Financial Statements and Auditor’s Reports Thereon
Management is responsible for the other information. The other information comprises the information included in the Annual Report, but does not include the unconsolidated and consolidated financial statements and our auditor’s reports thereon.

73Annual Report 2020
Our opinion on the unconsolidated financial statements does not cover the other information and we do not express any form of assurance conclusion thereon.
In connection with our audit of the unconsolidated financial statements, our responsibility is to read the other information and, in doing so, consider whether the other information is materially inconsistent with the unconsolidated financial statements or our knowledge obtained in the audit or otherwise appears to be materially misstated. If, based on the work we have performed, we conclude that there is a material misstatement of this other information, we are required to report that fact. We have nothing to report in this regard.
Responsibilities of Management and the Board of Directors for the Unconsolidated Financial Statements
Management is responsible for the preparation and fair presentation of the unconsolidated financial statements in accordance with accounting and reporting standards as applicable in Pakistan, the requirements of Banking Companies Ordinance, 1962 and the Companies Act, 2017 (XIX of 2017) and for such internal control as management determines is necessary to enable the preparation of unconsolidated financial statements that are free from material misstatement, whether due to fraud or error.
In preparing the unconsolidated financial statements, management is responsible for assessing the Bank’s ability to continue as a going concern, disclosing, as applicable, matters related to going concern and using the going concern basis of accounting unless management either intends to liquidate the Bank or to cease operations, or has no realistic alternative but to do so.
The Board of directors is responsible for overseeing the Bank’s financial reporting process.
Auditor’s Responsibilities for the Audit of the Unconsolidated Financial Statements
Our objectives are to obtain reasonable assurance about whether the unconsolidated financial statements as a whole are free from material misstatement, whether due to fraud or error, and to issue an auditor’s report that includes our opinion. Reasonable assurance is a high level of assurance, but is not a guarantee that an audit conducted in accordance with ISAs as applicable in Pakistan will always detect a material misstatement when it exists. Misstatements can arise from fraud or error and are considered material if, individually or in the aggregate, they could reasonably be expected to influence the economic decisions of users taken on the basis of these unconsolidated financial statements.
As part of an audit in accordance with ISAs as applicable in Pakistan, we exercise professional judgment and maintain professional skepticism throughout the audit. We also:
Identify and assess the risks of material misstatement of the unconsolidated financial statements, whether due to fraud or error, design and perform audit procedures responsive to those risks, and obtain audit evidence that is sufficient and appropriate to provide a basis for our opinion. The risk of not detecting a material misstatement resulting from fraud is higher than for one resulting from error, as fraud may involve collusion, forgery, intentional omissions, misrepresentations, or the override of internal control.
Obtain an understanding of internal control relevant to the audit in order to design audit procedures that are appropriate in the circumstances, but not for the purpose of expressing an opinion on the effectiveness of the Bank’s internal control.
Evaluate the appropriateness of accounting policies used and the reasonableness of accounting estimates and related disclosures made by management.
Conclude on the appropriateness of management’s use of the going concern basis of accounting and, based on the audit evidence obtained, whether a material uncertainty exists related to events or conditions that may cast significant doubt on the Bank’s ability to continue as a going concern. If we conclude that a material uncertainty exists, we are required to draw attention in our auditor’s report to the related disclosures in the unconsolidated financial statements or, if such disclosures are inadequate, to modify our opinion. Our conclusions are based on the audit evidence obtained up to the date of our auditor’s report. However, future events or conditions may cause the Bank to cease to continue as a going concern.
Evaluate the overall presentation, structure and content of the unconsolidated financial statements, including the disclosures, and whether the unconsolidated financial statements represent the underlying transactions and events in a manner that achieves fair presentation.
We communicate with the Board of Directors regarding, among other matters, the planned scope and timing of the audit and significant audit findings, including any significant deficiencies in internal control that we identify during our audit.

United Bank Limited74
We also provide to the Board of Directors with a statement that we have complied with relevant ethical requirements regarding independence, and to communicate with them all relationships and other matters that may reasonably be thought to bear on our independence, and where applicable, related safeguards.
From the matters communicated with the Board of Directors, we determine those matters that were of most significance in the audit of the unconsolidated financial statements of the current period and are therefore the key audit matters. We describe these matters in our auditor’s report unless law or regulation precludes public disclosure about the matter or when, in extremely rare circumstances, we determine that a matter should not be communicated in our report because the adverse consequences of doing so would reasonably be expected to outweigh the public interest benefits of such communication.
Report on Other Legal and Regulatory Requirements
1. Based on our audit, we further report that in our opinion:
a) proper books of account have been kept by the Bank as required by the Companies Act, 2017 (XIX of 2017) and the returns referred above from the branches have been found adequate for the purpose of our audit;
b) the unconsolidated statement of financial position, the unconsolidated profit and loss account, the unconsolidated statement of comprehensive income, the unconsolidated statement of changes in equity and the unconsolidated cash flow statement together with the notes thereon have been drawn up in conformity with the Banking Companies Ordinance, 1962 and the Companies Act, 2017 (XIX of 2017) and are in agreement with the books of account and returns;
c) investments made, expenditure incurred and guarantees extended during the year were in accordance with the objects and powers of the Bank and the transactions of the Bank which have come to our notice have been within the powers of the Bank; and
d) zakat deductible at source under the Zakat and Ushr Ordinance, 1980 (XVIII of 1980), was deducted by the Bank and deposited in the Central Zakat Fund established under section 7 of that Ordinance.
2. We confirm that for the purpose of our audit we have covered more than sixty per cent of the total loans and advances of the Bank.
The engagement partner on the audit resulting in this independent auditor’s report is Shahbaz Akbar.
A.F. Ferguson & Co.Chartered AccountantsKarachiDated: March 3, 2021

UNCONSOLIDATED STATEMENT OF FINANCIAL POSITIONAS AT DECEMBER 31, 2020
Note 2020 2019
ASSETSCash and balances with treasury banks 6 250,838,052 235,861,767Balances with other banks 7 13,888,765 20,729,005Lendings to financial institutions 8 19,959,132 20,183,118Investments 9 1,128,674,494 840,322,652Advances 10 530,279,496 635,834,217Fixed assets 11 51,207,703 52,396,877Intangible assets 12 1,829,211 1,951,002Deferred tax assets 13 6,399,267 3,300,164Other assets 14 46,507,193 82,196,560
2,049,583,313 1,892,775,362
LIABILITIESBills payable 16 29,733,813 22,926,596Borrowings 17 128,987,415 154,484,000Deposits and other accounts 18 1,640,211,901 1,467,063,461Liabilities against assets subject to finance lease - - Subordinated debt 19 10,000,000 10,000,000Deferred tax liabilities 13 - - Other liabilities 20 56,577,277 69,232,422
1,865,510,406 1,723,706,479
NET ASSETS 184,072,907 169,068,883
REPRESENTED BY:Share capital 21 12,241,797 12,241,797Reserves 62,274,068 59,319,612Surplus on revaluation of assets 22 27,640,579 25,837,143Unappropriated profit 81,916,463 71,670,331
184,072,907 169,068,883
CONTINGENCIES AND COMMITMENTS 23
The annexed notes 1 to 49 and annexures I, II and III form an integral part of these unconsolidated financial statements.
Aameer Karachiwalla Shazad G. Dada Shazia Syed Arshad Ahmad Mir Sir Mohammed Anwar Pervez, OBE, HPkChief Financial Officer President & Director Director Chairman Chief Executive Officer
-------------- (Rupees in '000) --------------
Aameer KarachiwallaChief Financial Officer
Shazad G. DadaPresident &
Chief Executive Officer
Shazia Syed Director
Arshad Ahmad Mir Director
Sir Mohammed Anwar Pervez, OBE, HPkChairman
75Annual Report 2020
Notes to and forming part of the Unconsolidated Financial StatementsFor the year ended December 31, 2020Unconsolidated Statement of Financial PositionAs at December 31, 2020

UNCONSOLIDATED PROFIT AND LOSS ACCOUNTFOR THE YEAR ENDED DECEMBER 31, 2020
Note 2020 2019
Mark-up / return / interest earned 25 152,003,210 153,676,364 Mark-up / return / interest expensed 26 77,044,038 91,901,868 Net mark-up / interest income 74,959,172 61,774,496
Non mark-up / interest incomeFee and commission income 27 11,097,472 13,786,525 Dividend income 1,269,537 1,538,378 Foreign exchange income 3,684,585 4,526,109 (Loss) / income from derivatives (13,076) 64,627 Gain on securities - net 28 411,440 2,199 Other income 29 644,381 1,758,493 Total non mark-up / interest income 17,094,339 21,676,331 Total income 92,053,511 83,450,827
Non mark-up / interest expensesOperating expenses 30 40,060,602 40,208,862 Workers' Welfare Fund 31 864,956 740,249 Other charges 32 167,335 40,055 Total non mark-up / interest expenses 41,092,893 40,989,166
Profit before provisions 50,960,618 42,461,661 Provisions and write-offs - net 33 16,768,148 8,219,792
Profit before taxation 34,192,470 34,241,869
Taxation 34 13,293,687 15,108,095
Profit after taxation 20,898,783 19,133,774
Earnings per share - basic and diluted 35 17.07 15.63
The annexed notes 1 to 49 and annexures I, II and III form an integral part of these unconsolidated financial statements.
Aameer Karachiwalla Shazad G. Dada Shazia Syed Arshad Ahmad Mir Sir Mohammed Anwar Pervez, OBE, HPkChief Financial Officer President & Director Director Chairman Chief Executive Officer
----------- (Rupees in '000) ----------
----------- (Rupees) -----------
Aameer KarachiwallaChief Financial Officer
Shazad G. DadaPresident &
Chief Executive Officer
Shazia Syed Director
Arshad Ahmad Mir Director
Sir Mohammed Anwar Pervez, OBE, HPkChairman
United Bank Limited76
Notes to and forming part of the Unconsolidated Financial StatementsFor the year ended December 31, 2020Unconsolidated Profit and Loss AccountFor the year ended December 31, 2020

UNCONSOLIDATED STATEMENT OF COMPREHENSIVE INCOMEFOR THE YEAR ENDED DECEMBER 31, 2020
2020 2019
Profit after taxation for the year 20,898,783 19,133,774
Other comprehensive income
Items that may be reclassified to profit and loss account in subsequent periods
Effect of translation of net investment in foreign branches 864,578 4,299,622 Movement in surplus on revaluation of investments - net of tax 2,001,430 9,724,215
2,866,008 14,023,837
Items that will not be reclassified to profit and loss account in subsequent periods
Remeasurement loss on defined benefit obligations - net of tax (803,081) (516,524) Movement in surplus / (deficit) on revaluation of fixed assets - net of tax 403 (83,149) Movement in (deficit) / surplus on revaluation of non-banking assets - net of tax (921) 39,599
(803,599) (560,074)
Total comprehensive income for the year 22,961,192 32,597,537
The annexed notes 1 to 49 and annexures I, II and III form an integral part of these unconsolidated financial statements.
Aameer Karachiwalla Shazad G. Dada Shazia Syed Arshad Ahmad Mir Sir Mohammed Anwar Pervez, OBE, HPkChief Financial Officer President & Director Director Chairman Chief Executive Officer
----------- (Rupees in '000) ----------
Aameer KarachiwallaChief Financial Officer
Shazad G. DadaPresident &
Chief Executive Officer
Shazia Syed Director
Arshad Ahmad Mir Director
Sir Mohammed Anwar Pervez, OBE, HPkChairman
77Annual Report 2020
Notes to and forming part of the Unconsolidated Financial StatementsFor the year ended December 31, 2020Unconsolidated Statement of Comprehensive IncomeFor the year ended December 31, 2020

UNCONSOLIDATED STATEMENT OF CHANGES IN EQUITYFOR THE YEAR ENDED DECEMBER 31, 2020
Investments Fixed assets Non-banking assets
Balance as at January 1, 2019 12,241,797 23,176,891 31,262,348 (9,070,713) 25,551,923 105,856 68,001,846 151,269,948
Total comprehensive income for the year ended December 31, 2019
Profit after taxation for the year ended December 31, 2019 - - - - - - 19,133,774 19,133,774
Other comprehensive income - net of tax - 4,299,622 - 9,724,215 (83,149) 39,599 (516,524) 13,463,763
Total comprehensive income for the year ended December 31, 2019 - 4,299,622 - 9,724,215 (83,149) 39,599 18,617,250 32,597,537
Transfer from surplus on revaluation on disposalto unappropriated profit - net of tax - - - - (262,309) (114,384) 376,693 -
Transfer from surplus on revaluation of fixed assets to unappropriated profit - net of tax - - - - (53,895) - 53,895 -
Transfer to statutory reserve - - 1,913,377 - - - (1,913,377) -
Transactions with owners for the yearended December 31, 2019
Final cash dividend - December 31, 2018 declared subsequent to the year end at Rs.3.0 per share - - - - - - (3,672,539) (3,672,539)
Interim cash dividend - March 31, 2019declared at Rs.2.5 per share - - - - - - (3,060,449) (3,060,449)
Interim cash dividend - June 30, 2019declared at Rs.2.5 per share - - - - - - (3,060,449) (3,060,449)
Interim cash dividend - September 30, 2019declared at Rs.3.0 per share - - - - - - (3,672,539) (3,672,539)
- - - - - - (13,465,976) (13,465,976)realisation of exchange translation reserve - (1,332,626) - - - - - (1,332,626)
Balance as at December 31, 2019 12,241,797 26,143,887 33,175,725 653,502 25,152,570 31,071 71,670,331 169,068,883
Total comprehensive income for the year ended December 31, 2020
Profit after taxation for the year ended December 31, 2020 - - - - - - 20,898,783 20,898,783
Other comprehensive income - net of tax - 864,578 - 2,001,430 403 (921) (803,081) 2,062,409
Total comprehensive income for the year ended December 31, 2020 - 864,578 - 2,001,430 403 (921) 20,095,702 22,961,192
Transfer from surplus on revaluation on disposalto unappropriated profit - net of tax - - - - (116,346) (29,237) 145,583 -
Transfer from surplus on revaluation of fixed assets to unappropriated profit - net of tax - - - - (51,893) - 51,893 -
Transfer to statutory reserve - - 2,089,878 - - - (2,089,878) -
Transactions with owners for the yearended December 31, 2020
Final cash dividend - December 31, 2019 declared subsequent to the year end at Rs.4.0 per share - - - - - - (4,896,719) (4,896,719)
Interim cash dividend - March 31, 2020declared at Rs.2.5 per share - - - - - - (3,060,449) (3,060,449)
- - - - - - (7,957,168) (7,957,168)
Balance as at December 31, 2020 12,241,797 27,008,465 35,265,603 2,654,932 24,984,734 913 81,916,463 184,072,907
The annexed notes 1 to 49 and annexures I, II and III form an integral part of these unconsolidated financial statements.
Aameer Karachiwalla Shazad G. Dada Shazia Syed Arshad Ahmad Mir Sir Mohammed Anwar Pervez, OBE, HPkChief Financial Officer President & Director Director Chairman Chief Executive Officer
--------------------------------------------------------------------------------- (Rupees in '000) --------------------------------------------------------------------------------
Surplus / (Deficit) on revaluation
Share capital Statutory reserve
Capital reserve - exchange translation
Unappropriated profit Total
Aameer KarachiwallaChief Financial Officer
Shazad G. DadaPresident &
Chief Executive Officer
Shazia Syed Director
Arshad Ahmad Mir Director
Sir Mohammed Anwar Pervez, OBE, HPkChairman
United Bank Limited78
Notes to and forming part of the Unconsolidated Financial StatementsFor the year ended December 31, 2020Unconsolidated Statement of Changes in EquityFor the year ended December 31, 2020

UNCONSOLIDATED CASH FLOW STATEMENTFOR THE YEAR ENDED DECEMBER 31, 2020
Note 2020 2019
CASH FLOW FROM OPERATING ACTIVITIESProfit before taxation 34,192,470 34,241,869 Less: Dividend income 1,269,537 1,538,378
32,922,933 32,703,491 Adjustments: Depreciation on fixed assets 2,832,975 2,709,952 Depreciation on Islamic financing against leased assets (Ijarah) 216,195 227,783 Depreciation on right-of-use assets 1,655,038 2,097,081 Amortisation 793,562 645,869 Workers' Welfare Fund 864,956 740,249 Provision for retirement benefits 932,684 877,238 Provision for compensated absences 70,902 33,383 Provision against loans and advances - net 15,708,656 4,418,602 Provision against off balance sheet items 431,749 47,438 Provision for diminution in value of investments - net 341,551 3,199,011 Interest expense on lease liability against right-of-use assets 924,718 1,064,085 Gain on sale of operating fixed assets - net (74,202) (80,073) Gain on sale of ijarah assets - net (792) (861) Gain on sale of associate - (75,294) Gain on sale of non-banking assets (191,559) 54,649 Bad debts written-off directly 77,094 149,591 Unrealised (gain) / loss on revaluation of investments classified as held for trading (228) 7,386 Realisation of exchange translation reserve - UBL New York branch - (1,332,626) Other provisions / write-offs - net 209,098 405,150
24,792,397 15,188,613 57,715,330 47,892,104
Decrease in operating assets Lendings to financial institutions 223,986 13,758,428 Held for trading securities 68,126,135 30,437,764 Advances 89,518,531 74,889,116 Other assets (excluding advance taxation) 21,979,989 2,878,860
179,848,641 121,964,168 Increase / (decrease) in operating liabilities Bills payable 6,807,217 (4,322,540) Borrowings (25,496,585) (113,640,033) Deposits and other accounts 173,148,440 101,003,413 Other liabilities (excluding current taxation) (14,157,698) (6,469,659)
140,301,374 (23,428,819) 377,865,345 146,427,453
Payments on account of staff retirement benefits (1,731,020) (1,823,996) Income taxes paid (3,504,366) (10,399,114) Net cash flow generated from operating activities 372,629,959 134,204,343
CASH FLOW FROM INVESTING ACTIVITIESNet investments in available for sale securities (396,288,885) (117,052,504) Net investments in held to maturity securities 42,750,618 44,498,684 Net investments in subsidiaries and associates - (58,708) Dividend income received 1,103,189 1,521,055 Investment in fixed assets and intangible assets (2,905,701) (3,404,239) Sale proceeds from disposal of fixed assets 259,749 365,409 Sale proceeds from disposal of ijarah assets 35,037 32,729 Effect of translation of net investment in foreign branches 864,578 4,299,622 Net cash flow used in investing activities (354,181,415) (69,797,952)
CASH FLOW FROM FINANCING ACTIVITIESReceipts of subordinated debt - 1,000,000 Payment of lease liability against right-of-use assets (2,174,025) (2,179,971) Dividends paid (8,138,474) (13,448,704) Net cash flow used in financing activities (10,312,499) (14,628,675)
Increase in cash and cash equivalents 8,136,045 49,777,716 Cash and cash equivalents at the beginning of the year 256,590,772 206,813,056
Cash and cash equivalents at the end of the year 36 264,726,817 256,590,772
The annexed notes 1 to 49 and annexures I, II and III form an integral part of these unconsolidated financial statements.
Aameer Karachiwalla Shazad G. Dada Shazia Syed Arshad Ahmad Mir Sir Mohammed Anwar Pervez, OBE, HPkChief Financial Officer President & Director Director Chairman Chief Executive Officer
-------------- (Rupees in '000) --------------
Aameer KarachiwallaChief Financial Officer
Shazad G. DadaPresident &
Chief Executive Officer
Shazia Syed Director
Arshad Ahmad Mir Director
Sir Mohammed Anwar Pervez, OBE, HPkChairman
79Annual Report 2020
Notes to and forming part of the Unconsolidated Financial StatementsFor the year ended December 31, 2020Unconsolidated Cash Flow StatementFor the year ended December 31, 2020

NOTES TO AND FORMING PART OF THE UNCONSOLIDATED FINANCIAL STATEMENTSFOR THE YEAR ENDED DECEMBER 31, 2020
1. STATUS AND NATURE OF BUSINESS
2. BASIS OF PRESENTATION
2.1
2.2
2.3
3. STATEMENT OF COMPLIANCE
3.1
-
-
- Provisions of and directives issued under the Banking Companies Ordinance, 1962 and the Companies Act, 2017; and
-
3.2
These unconsolidated financial statements have been prepared in conformity with the format of financial statementsprescribed by the State Bank of Pakistan (SBP) vide BSD Circular No. 02, dated January 25, 2018.
Islamic Financial Accounting Standards (IFAS) issued by the Institute of Chartered Accountants of Pakistan as arenotified under the Companies Act, 2017;
Whenever the requirements of the Banking Companies Ordinance, 1962, the Companies Act, 2017 or the directives issuedby the SBP and the SECP differ with the requirements of IFRS or IFAS, the requirements of the Banking CompaniesOrdinance, 1962, the Companies Act, 2017 and the said directives shall prevail.
The SBP, vide BSD Circular letter No. 10, dated August 26, 2002, has deferred the applicability of International AccountingStandard 39, Financial Instruments: Recognition and Measurement and International Accounting Standard 40, InvestmentProperty for banking companies till further instructions. Moreover, SBP vide BPRD circular no. 4, dated February 25, 2015,has deferred the applicability of Islamic Financial Accounting Standards (IFAS) 3, Profit and Loss Sharing on Deposits.Further, according to the notification of the SECP issued vide SRO 411(I)/2008 dated April 28, 2008, IFRS 7, FinancialInstruments: Disclosures has not been made applicable for banks. Accordingly, the requirements of these standards have notbeen considered in the preparation of these unconsolidated financial statements. However, investments have been classifiedand valued in accordance with the requirements of various circulars issued by the SBP.
Key financial figures of the Islamic Banking branches are disclosed in annexure II to these unconsolidated financialstatements.
Directives issued by the State Bank of Pakistan (SBP) and the Securities and Exchange Commission of Pakistan(SECP).
International Financial Reporting Standards (IFRS) issued by the International Accounting Standards Board (IASB) asare notified under the Companies Act, 2017;
United Bank Limited (the Bank) is a banking company incorporated in Pakistan and is engaged in commercial banking andrelated services. The Bank's registered office and principal office are situated at UBL Building, Jinnah Avenue, Blue Area,Islamabad and at UBL Head Office, I. I. Chundrigar Road, Karachi respectively. The Bank operates 1,356 (2019: 1,362)branches inside Pakistan including 100 (2019: 100) Islamic Banking branches and 2 (2019: 2) branches in Export ProcessingZones. The Bank also operates 14 (2019: 14) branches outside Pakistan. The Bank is a subsidiary of Bestway (Holdings)Limited and Bestway (Holdings) Limited is a wholly owned subsidiary of Bestway Group Limited which is incorporated in theUnited Kingdom.
The Bank's ordinary shares are listed on Pakistan Stock Exchange (PSX). Its Global Depository Receipts (GDRs) are on thelist of the UK Listing Authority and the London Stock Exchange Professional Securities Market. These GDRs are also eligiblefor trading on the International Order Book System of the London Stock Exchange. Further, the GDRs constitute an offeringin the United States only to qualified institutional buyers in reliance on Rule 144A under the US Securities Act of 1933 and anoffering outside the United States in reliance on Regulation S.
In accordance with the directives of the Federal Government regarding the shifting of the banking system to Islamic modes,SBP has issued various circulars from time to time. Permissible forms of trade-related modes of financing includes purchaseof goods by banks from customers and immediate resale to them at appropriate mark-up in price on deferred payment basis.The purchase and resale arising under these arrangements are not reflected in these unconsolidated financial statements assuch, but are restricted to the amount of facility actually utilized and the appropriate portion of mark-up thereon. However, theIslamic Banking branches of the Bank have complied with the requirements set out under the Islamic Financial AccountingStandards (IFAS), issued by the Institute of Chartered Accountants of Pakistan (ICAP) as are notified under the provisions ofCompanies Act, 2017.
These unconsolidated financial statements have been prepared in accordance with the accounting and reporting standardsas applicable in Pakistan. The accounting and reporting standards comprise of:
6
United Bank Limited80
Notes to and forming part of the Unconsolidated Financial StatementsFor the year ended December 31, 2020Notes to and forming part of the Unconsolidated Financial StatementsFor the year ended December 31, 2020

NOTES TO AND FORMING PART OF THE UNCONSOLIDATED FINANCIAL STATEMENTSFOR THE YEAR ENDED DECEMBER 31, 2020
3.3
3.4
3.5
3.6 Standards, interpretations of and amendments to accounting and reporting standards that are not yet effective
4. BASIS OF MEASUREMENT
4.1 Accounting convention
4.2 Critical accounting estimates and judgments
i) classification and valuation of investments (notes 5.3 and 9)
ii)
iii) income taxes (notes 5.8 and 34)
There are certain other new amendments that are mandatory for the Bank's accounting periods beginning on or after January1, 2021, but are considered not to be relevant or will not have any significant effect on the Bank's operations and are,therefore, not detailed in these unconsolidated financial statements.
These unconsolidated financial statements represent the separate financial statements of the Bank. The consolidatedfinancial statements of the Bank and its subsidiaries are presented separately.
Standards, interpretations of and amendments to accounting and reporting standards that are effective in thecurrent year
provision against investments (notes 5.3 and 9.3), lendings to financial institutions (note 8) and advances (notes 5.4 and10.4)
The SECP vide its notification SRO 633 (I)/2014 dated July 10, 2014, adopted IFRS 10 - Consolidated Financial Statementseffective from the periods starting from June 30, 2014. However, vide its notification SRO 56 (I)/2016 dated January 28,2016, it has been notified that the requirements of IFRS 10 and section 228 of the Companies Act, 2017 will not beapplicable with respect to the investment in mutual funds established under trust structure.
IFRS 9 has been applicable in several overseas jurisdictions from January 1, 2018. Accordingly, the requirements of thisstandard are incorporated in the Bank’s unconsolidated financial statements for the jurisdictions where IFRS 9 has beenadopted. As per the SBP's BPRD Circular Letter no. 4 dated October 23, 2019, the applicability of IFRS 9 to banks inPakistan has been deferred to accounting periods beginning on or after January 1, 2021. The impact of the application ofIFRS 9 in Pakistan on the Bank's financial statements is being assessed and implementation guidelines are awaited.
The preparation of these unconsolidated financial statements in conformity with accounting and reporting standards asapplicable in Pakistan requires management to make judgments, estimates and assumptions that affect the reportedamounts of assets and liabilities and income and expenses. It also requires management to exercise judgment in theapplication of its accounting policies. The estimates and assumptions are based on historical experience and various otherfactors that are believed to be reasonable under the circumstances. These estimates and assumptions are reviewed on anongoing basis. Revisions to accounting estimates are recognised in the period in which the estimate is revised if the revisionaffects only that period, or in the period of revision and future periods if the revision affects both current and future periods.
There are certain amendments to existing accounting and reporting standards that have become applicable to the Bank foraccounting periods beginning on or after January 1, 2020. These are either considered to not be relevant or do not have anysignificant impact on these unconsolidated financial statements.
These unconsolidated financial statements have been prepared under the historical cost convention except that certain fixedassets / non-banking assets acquired in satisfaction of claims have been stated at revalued amounts, certain investmentsand derivative financial instruments have been stated at fair value and net obligations in respect of defined benefit schemesare carried at their present values.
Significant accounting estimates and areas where judgments were made by management in the application of accountingpolicies are as follows:
7
81Annual Report 2020
Notes to and forming part of the Unconsolidated Financial StatementsFor the year ended December 31, 2020

NOTES TO AND FORMING PART OF THE UNCONSOLIDATED FINANCIAL STATEMENTSFOR THE YEAR ENDED DECEMBER 31, 2020
iv) staff retirement benefits (notes 5.10 and 38)
v) fair value of derivatives (note 5.15.2)
vi) fixed assets and intangible assets - revaluation, depreciation and amortisation (notes 5.5, 11 and 12)
vii) impairment (note 5.7)
viii) valuation of non-banking assets acquired in satisfaction of claims (note 5.6)
5. SUMMARY OF SIGNIFICANT ACCOUNTING POLICIES
5.1 Cash and cash equivalents
5.2 Lendings to / borrowings from financial institutions
5.2.1 Purchase under resale agreements
5.2.2 Sale under repurchase agreements
5.2.3 Bai Muajjal
5.3 Investments
Held for trading
These are securities which are either acquired for generating a profit from short-term fluctuations in market prices, interestrate movements and dealer's margin, or are securities included in a portfolio in which a pattern of short term profit takingexists.
Securities purchased under agreement to resell (reverse repo) are included in lendings to financial institutions. Thedifferential between the purchase price and the resale price is amortised over the period of the agreement and recorded asincome.
Cash and cash equivalents for the purpose of the cash flow statement consist of cash and balances with treasury banks andbalances with other banks.
The Bank enters into transactions of reverse repos, repos and other short term money market lendings to financialinstitutions at contracted rates for a specified period of time. Further, other long term lendings to financial institutions areclassified in advances. These are recorded as under:
Securities held as collateral are not recognised in the unconsolidated financial statements, unless these are sold to thirdparties, in which case the obligation to return them is recorded at fair value as a trading liability under borrowings fromfinancial institutions.
Securities sold subject to a repurchase agreement (repo) are retained in the unconsolidated financial statements asinvestments and the counterparty liability is included in borrowings from financial institutions. The differential between thesale price and the repurchase price is amortised over the period of the agreement and recorded as an expense.
The accounting policies adopted in the preparation of these unconsolidated financial statements are consistent with those ofthe previous financial year.
Bai Muajjal transactions represent sales of Sukuks on a deferred payment basis and are shown in lendings to financialinstitutions except for transactions undertaken directly with the Government of Pakistan which are disclosed as investments.The difference between the deferred payment amount receivable and the carrying value at the time of sale is accrued andrecorded as income over the life of the transaction.
Investments of the Bank, other than investments in subsidiaries and associates, are classified as held for trading, held tomaturity and available for sale.
8United Bank Limited82
Notes to and forming part of the Unconsolidated Financial StatementsFor the year ended December 31, 2020

NOTES TO AND FORMING PART OF THE UNCONSOLIDATED FINANCIAL STATEMENTSFOR THE YEAR ENDED DECEMBER 31, 2020
Held to maturity
Available for sale
Initial measurement
Subsequent measurement
Held for trading
Held to maturity
Available for sale
Investments in Subsidiaries and Associates
Gains and losses on disposal of investments in subsidiaries and associates are included in the profit and loss account.
Investments are initially recognised at fair value which, in the case of investments other than held for trading, includestransaction costs associated with the investments. Transaction costs on investments held for trading are expensed asincurred.
These are securities with fixed or determinable payments and fixed maturities, in respect of which the Bank has the positiveintent and ability to hold to maturity.
Investments in subsidiaries and associates are valued at cost less accumulated impairment losses, if any. A reversal of animpairment loss on subsidiaries and associates is recognised in the profit and loss account as it arises provided theincreased carrying value does not exceed cost.
All “regular way” purchases and sales of investments are recognised on the trade date, i.e., the date that the Bank commits to purchase or sell the investment. Regular way purchases or sales are purchases or sales of investments that require deliveryof investments within the time frame generally established by regulation or convention in the market place.
These are investments, other than those in subsidiaries and associates, that do not fall under the held for trading or held tomaturity categories.
Unquoted equity securities are valued at the lower of cost and break-up value. The break-up value of these securities iscalculated with reference to the net assets of the investee company as per the latest available audited financial statements. Adecline in the carrying value is charged to the profit and loss account. A subsequent increase in the carrying value, upto thecost of the investment, is credited to the profit and loss account. Investments in other unquoted securities are valued at costless impairment, if any.
These are measured at subsequent reporting dates at fair value. Gains and losses on re-measurement are included in theprofit and loss account.
These are measured at amortised cost using the effective interest rate method, less any impairment loss recognised toreflect irrecoverable amounts.
Quoted securities classified as available for sale investments are measured at subsequent reporting dates at fair value. Anysurplus or deficit arising thereon is kept in a separate account shown in the statement of financial position as part of theequity and is taken to the profit and loss account when realised upon disposal or when the investment is considered to beimpaired.
Provisions for diminution in the value of term finance certificates and Sukuks are made as per the ageing criteria prescribedby the Prudential Regulations issued by the SBP. Provisions for diminution in the value of other securities are made forimpairment, if any.
983Annual Report 2020
Notes to and forming part of the Unconsolidated Financial StatementsFor the year ended December 31, 2020

NOTES TO AND FORMING PART OF THE UNCONSOLIDATED FINANCIAL STATEMENTSFOR THE YEAR ENDED DECEMBER 31, 2020
5.4 Advances
5.4.1 Finance lease receivables
5.4.2 Islamic financings and related assets
5.5 Fixed assets and depreciation
5.5.1 Tangible assets
Depreciation is calculated so as to write off the depreciable amount of the assets over their expected useful lives at the ratesspecified in note 11.2 to these unconsolidated financial statements. The depreciation charge for the year is calculated on astraight line basis after taking into account the residual value, if any. The residual values and useful lives are reviewed andadjusted, if appropriate, at each statement of financial position date.
Advances are written off when there is no realistic prospect of recovery. The amount so written-off is a book entry and doesnot necessarily prejudice the Bank's right of recovery against the customer.
The Bank determines write-offs in accordance with the criteria prescribed by the SBP vide BPRD Circular No. 06 dated June05, 2007.
Istisna is a sale contract where the Bank places an order to the manufacturer / builders to produce certain assets and thesale is completed upon the delivery of the assets to the buyer.
Running Musharakah facility is to finance the working capital requirement of the customer whereas partnership is based onstocks & receivable (manufacturing, stock and proceeds of sales).
Advances are stated net of specific and general provisions which are charged to the profit and loss account. Specificprovisions against domestic advances and general provision against domestic consumer loans portfolio are determined onthe basis of the Prudential Regulations and other directives issued by the SBP. Specific provision is determined using thetime based criteria and subjective evaluation of the credit worthiness of borrowers. General and specific provisions pertainingto overseas advances are made in accordance with the requirements of the regulatory authorities of the respective countries.
Depreciation on additions is charged from the month the asset is available for use. No depreciation is charged in the monthof disposal.
Ijarah financing represents arrangements whereby the Bank (being the owner of assets) transfers its usufruct to its customersfor an agreed period at an agreed consideration. Assets leased out under Ijarah are stated at cost less accumulateddepreciation and accumulated impairment losses, if any. These are depreciated over the term of the lease. Ijarah income isrecognised on an accrual basis.
Leases, where the Bank transfers substantially all the risks and rewards incidental to ownership of an asset to the lessee areclassified as finance lease. A receivable is recognised at an amount equal to the present value of the minimum leasepayments including guaranteed residual value, if any. Finance lease receivables are included in advances.
Receivables under Murabahah financing represent cost price plus an agreed mark-up on deferred sale arrangement. Mark-up income is recognised on a straight line basis over the period of the instalments.
Property and equipment, other than land (which is not depreciated) and capital work-in-progress, are stated at cost orrevalued amount less accumulated depreciation and accumulated impairment losses, if any. Land is carried at revaluedamount less impairment losses while capital work-in-progress is stated at cost less impairment losses. The cost and theaccumulated depreciation of property and equipment of foreign branches include exchange differences arising on currencytranslation at the year-end rates of exchange.
Diminishing Musharakah is partnership agreement between the Bank and its customer for financing vehicle or plant andmachinery. The receivable is recorded to the extent of Bank's share in the purchase of asset. Income is recognised onaccrual basis.
10United Bank Limited84
Notes to and forming part of the Unconsolidated Financial StatementsFor the year ended December 31, 2020

NOTES TO AND FORMING PART OF THE UNCONSOLIDATED FINANCIAL STATEMENTSFOR THE YEAR ENDED DECEMBER 31, 2020
5.5.2 Intangible assets
Gains and losses on sale of intangible assets are included in the profit and loss account.
5.5.3 Lease liability and Right-of-use asset
The lease liability is remeasured when the Bank reassesses the reasonable certainty of exercise of extension or terminationoption upon occurrence of either a significant event or a significant change in circumstance, or when there is a change inassessment of an option to purchase underlying asset, or when there is a change in amount expected to be payable under aresidual value guarantee, or when there is a change in future lease payments resulting from a change in an index or rateused to determine those payment. The corresponding adjustment is made to the carrying amount of the right-to-use asset, oris recorded in profit and loss if the carrying amount of right-to-use asset has been reduced to zero.
The bank enters into leasing arrangements for its branches, ATMs and warehouses. Rental contracts are typically for a fixedperiod of 1 year to 50 years and may have extension options as described below. At inception of a contract, the Bankassesses whether a contract is, or contains, a lease based on whether the contract conveys the right to control the use of anidentified asset for a period of time in exchange for consideration. Lease terms are negotiated on an individual basis andcontain a wide range of different terms and conditions.
In determining the lease term, management considers all facts and circumstances that create an economic incentive toexercise an extension option or not exercise a termination option. Extension options (or periods after termination options) areonly included in the lease term if the lease is reasonably certain to be extended (or not be terminated).
The lease liability is initially measured at the present value of the lease payments over the period lease term and that are notpaid at the commencement date, discounted using the interest rate implicit in the lease, or if that rate cannot be readilydetermined, the Bank's incremental borrowing rate.
The lease liability is subsequently measured at amortised cost using the effective interest rate method. The lease liability isalso remeasured to reflect any reassessment or lease modification, or to reflect revised in-substance fixed lease payment.
Surplus on revaluation of fixed assets (net of associated deferred tax) to the extent of the incremental depreciation chargedon the related assets is transferred to unappropriated profit.
Lease payments include fixed payments less any lease incentive receivable, variable lease payment that are based on anindex or a rate which are initially measured using the index or rate as at the commencement date, amounts expected to bepayable by the Bank under residual value guarantees, the exercise price of a purchase option if the Bank is reasonablycertain to exercise that option and payments of penalties for terminating the lease if the lease term reflects the lesseeexercising that option. The extension and termination options are incorporated in determination of lease term only when theBank is reasonably certain to exercise these options.
Land and buildings are revalued by independent, professionally qualified valuers with sufficient regularity to ensure that theirnet carrying amount does not differ materially from their fair value. An increase arising on revaluation is credited to thesurplus on revaluation of fixed assets account. A decrease arising on revaluation of fixed assets is adjusted against thesurplus of that asset or, if no surplus exists, is charged to the profit and loss account as an impairment of the asset. A surplusarising subsequently on an impaired asset is reversed through the profit and loss account up to the extent of the originalimpairment.
Intangible assets are stated at cost less accumulated amortisation and accumulated impairment losses, if any. The cost andthe accumulated amortisation of intangible assets of foreign branches include exchange differences arising on currencytranslation at the year-end rates of exchange. amortisation is calculated so as to write off the amortizable amount of theassets over their expected useful lives at the rates specified in note 12.1 to these unconsolidated financial statements. Theamortisation charge for the year is calculated on a straight line basis after taking into account the residual value, if any. Theresidual values and useful lives are reviewed and adjusted, if appropriate, at each statement of financial position date.amortisation on additions is charged from the month the asset is available for use. No amortisation is charged in the month ofdisposal.
Major renewals and improvements are capitalized and the assets so replaced, if any, are retired. Normal repairs andmaintenance are charged to the profit and loss account as and when incurred.
Gains and losses on sale of fixed assets are included in the profit and loss account, except that the related surplus onrevaluation of fixed assets (net of deferred tax) is transferred directly to unappropriated profit.
1185Annual Report 2020
Notes to and forming part of the Unconsolidated Financial StatementsFor the year ended December 31, 2020

NOTES TO AND FORMING PART OF THE UNCONSOLIDATED FINANCIAL STATEMENTSFOR THE YEAR ENDED DECEMBER 31, 2020
5.6 Non-banking assets acquired in satisfaction of claims
5.7 Impairment
Impairment of available for sale equity investments
Impairment of investments in subsidiaries and associates
Impairment of non-financial assets (excluding deferred tax)
Legal fees, transfer costs and direct costs of acquiring title to property are charged to the profit and loss account and notcapitalised. Gains and losses on sale of non-banking assets are included in the profit and loss account, except that therelated surplus on revaluation of non-banking assets (net of deferred tax) is transferred directly to unappropriated profit.
When there is a change in scope of a lease, or the consideration for a lease, that was not part of the original terms andconditions of the lease is accounted for as a lease modification. The lease modification is accounted for as a separate leaseif modification increase the scope of lease by adding the right to use one or more underlying assets and the consideration forlease increases by an amount that is commensurate with the stand-alone price for the increase in scope adjusted to reflectthe circumstances of the particular contracts, if any. When the lease modification is not accounted for as a separate lease,the lease liability is remeasured and corresponding adjustment is made to right-of-use asset.
On initial recognition, right-of-use assets are measured at an amount equal to initial lease liability adjusted for any leasepayments made at or before the commencement date, plus any initial direct costs incurred and an estimate of costs to beincurred to dismantle and remove the underlying asset or to restore the underlying asset or the site on which it is located.
Available for sale equity investments are impaired when there has been a significant or prolonged decline in their fair valuebelow their cost. The determination of what is significant or prolonged requires judgment. In making this judgment, the Bankevaluates, among other factors, the normal volatility in share price. A subsequent increase in the fair value of a previouslyimpaired listed equity security is recorded in the statement of financial position in the surplus / deficit on revaluation ofsecurities account and only recorded through the profit and loss account when realised on disposal.
The right-of-use asset is subsequently measured at cost model. The right of use asset is depreciated on a straight linemethod over the lease term as this method most closely reflects the expected pattern of consumption of future economicbenefits. The right-of-use asset is reduced by impairment losses, if any, and adjusted for certain remeasurements of thelease liability.
Non-banking assets acquired in satisfaction of claims are carried at revalued amounts less accumulated depreciation. Theseassets are revalued by professionally qualified valuers with sufficient regularity to ensure that their net carrying value doesnot differ materially from their fair value. A surplus arising on revaluation of property is credited to the 'surplus on revaluationof non-banking assets' account. A decrease arising on revaluation of non-banking asset is adjusted against the surplus ofthat asset or, if no surplus exists, is charged to the profit and loss account as an impairment of the asset. A surplus arisingsubsequently on an impaired asset is reversed through the profit and loss account up to the extent of the original impairment.
The Bank has elected to apply the practical expedient not to recognise right-of-use assets and lease liabilities for short termleases that have a lease term of 12 months or less and leases of low-value assets. The lease payments associated withthese leases is recognised as an expense on a straight line basis over the lease term.
The Bank considers that a decline in the recoverable value of the investment in a subsidiary or an associate below its costmay be evidence of impairment. Recoverable value is calculated as the higher of fair value less costs to sell and value inuse. An impairment loss is recognised when the recoverable value falls below the carrying value and is charged to the profitand loss account. A subsequent reversal of an impairment loss, upto the cost of the investment in the subsidiary or theassociate, is credited to the profit and loss account.
The carrying amounts of non-financial assets are reviewed at each reporting date for impairment whenever events orchanges in circumstances indicate that the carrying amounts of these assets may not be recoverable. The recoverableamount of an asset is the higher of its fair value less costs of disposal and its value in use. If such indication exists, andwhere the carrying value exceeds the estimated recoverable amount, assets are written down to their recoverable amount.The resulting impairment loss is charged to the profit and loss account except for an impairment loss on revalued assets,which is adjusted against the related revaluation surplus to the extent that the impairment loss does not exceed therevaluation surplus.
12United Bank Limited86
Notes to and forming part of the Unconsolidated Financial StatementsFor the year ended December 31, 2020

NOTES TO AND FORMING PART OF THE UNCONSOLIDATED FINANCIAL STATEMENTSFOR THE YEAR ENDED DECEMBER 31, 2020
5.8 Taxation
5.8.1 Current
5.8.2 Deferred
5.9 Provisions
Provisions are reviewed at each statement of financial position date and are adjusted to reflect the current best estimate.
5.10 Staff retirement and other benefits
5.10.1 Staff retirement benefit schemes
The Bank operates the following staff retirement schemes for its employees:
a)
- an approved contributory provident fund (defined contribution scheme); and- an approved gratuity scheme (defined benefit scheme).
b) For employees who have not opted for the conversion option introduced in 2001, the Bank operates:
- an approved non-contributory provident fund in lieu of the contributory provident fund; and- an approved funded pension scheme, introduced in 1975 (defined benefit scheme).
Current tax assets and liabilities are offset only if certain criteria are met.
Provisions are recognised when the Bank has a present legal or constructive obligation as a result of past events, it isprobable that an outflow of resources will be required to settle the obligation and a reliable estimate of the amount can bemade.
The carrying amount of deferred tax assets is reviewed at each statement of financial position date and reduced to the extentthat it is no longer probable that sufficient taxable profits will be available to allow all or part of the deferred tax asset to beutilized.
Provision for current taxation is based on taxable income for the year determined in accordance with the prevailing laws andat the prevailing rates for taxation on income earned by the Bank. The amount of current tax payable is the best estimate ofthe tax amount expected to be paid that reflects uncertainty related to income taxes, if any. It is measured using tax ratesenacted or substantively enacted at the reporting date.
For new employees and for those who opted for the below mentioned conversion option introduced in 2001, the Bankoperates:
Provision against identified non-funded losses is recognised when intimated and reasonable certainty exists that the Bankwill be required to settle the obligation. The provision is charged to the profit and loss account net of expected recovery andthe obligation is classified under other liabilities.
Deferred tax is recognised using the balance sheet method on all major temporary differences between the amountsattributed to assets and liabilities for financial reporting purposes and the amounts used for taxation purposes. Deferred tax iscalculated at the rates that are expected to apply to the period when the differences are expected to reverse, based on taxrates that have been enacted or substantively enacted at the statement of financial position date.
Deferred tax assets are recognised only to the extent that it is probable that future taxable profits will be available againstwhich the assets can be utilized.
The Bank also recognizes deferred tax asset / liability on the deficit / surplus on revaluation of fixed assets / non-bankingassets acquired in satisfaction of claims and securities which is adjusted against the related deficit / surplus in accordancewith the requirements of IAS 12, Income Taxes.
13
87Annual Report 2020
Notes to and forming part of the Unconsolidated Financial StatementsFor the year ended December 31, 2020

NOTES TO AND FORMING PART OF THE UNCONSOLIDATED FINANCIAL STATEMENTSFOR THE YEAR ENDED DECEMBER 31, 2020
The Bank also operates benevolent fund for all its eligible employees (defined benefit scheme).
5.10.2 Other benefits
a) Employees' compensated absences
b) Post-retirement medical benefits (defined benefit scheme)
5.10.3 Remeasurement of defined benefit obligations
5.11 Subordinated debt
5.12 Borrowings / deposits
a) Borrowings / deposits are recorded at the amount of proceeds received.b) The cost of borrowings / deposits is recognised on an accrual basis as an expense in the period in which it is incurred.
5.13 Revenue recognition
5.13.1 Advances and investments
Remeasurement gains and losses arising from experience adjustments and changes in actuarial assumptions arerecognised in other comprehensive income when they occur with no subsequent recycling through the profit and lossaccount.
Subordinated debt is initially recorded at the amount of proceeds received. Mark-up accrued on subordinated debt isrecognised separately as part of other liabilities and is charged to the profit and loss account over the period on an accrualbasis.
Revenue is recognised to the extent that the economic benefits associated with a transaction will flow to the Bank and therevenue can be reliably measured. The following recognition criteria must be met before revenue is recognised.
Mark-up / return / interest on performing advances and investments is recognised on a time proportionate basis over the termof the advances and investments that takes into account the effective yield of the asset. Where debt securities are purchasedat a premium or discount, such premium / discount is amortised through the profit and loss account over the remaining periodof maturity of the debt securities.
Annual contributions towards defined benefit schemes are made on the basis of actuarial advice using the Projected UnitCredit Method.
Interest or mark-up recoverable on non-performing or classified advances and investments is recognised on a receipt basis.
The Bank makes provisions for compensated vested and non-vested absences accumulated by its eligible employees onthe basis of actuarial advice under the Projected Unit Credit Method.
The Bank provides post-retirement medical benefits to eligible retired employees. Provision is made on the basis ofactuarial advice under the Projected Unit Credit Method.
Remeasurement gains and losses pertaining to long term compensated absences are recognised in the profit and lossaccount immediately.
For the defined contribution scheme, the Bank pays contributions to the fund on a periodic basis. The Bank has no furtherpayment obligation once the contributions have been paid. The contributions are recognised as an expense when theobligation to make payments to the fund has been established. Prepaid contributions are recognised as an asset to theextent that a cash refund or a reduction in future payments is available.
In 2001, the Bank modified the pension scheme and introduced a conversion option for employees covered under option (b)above to move to option (a). This conversion option ceased on December 31, 2003.
14United Bank Limited88
Notes to and forming part of the Unconsolidated Financial StatementsFor the year ended December 31, 2020

NOTES TO AND FORMING PART OF THE UNCONSOLIDATED FINANCIAL STATEMENTSFOR THE YEAR ENDED DECEMBER 31, 2020
Lease financing
5.13.2 Dividend income
Dividend income is recognised when the right to receive the dividend is established.
5.13.3 Fee, brokerage and commission income
Fee, brokerage and commission income is recognised on an accrual basis.
5.13.4 Grants
5.14 Foreign currencies
5.14.1 Functional and presentation currency
5.14.2 Foreign currency transactions
5.14.3 Foreign operations
5.14.4 Translation gains and losses
5.14.5 Contingencies and commitments
Translation gains and losses are taken to the profit and loss account, except those arising on translation of the netinvestment in foreign branches which are taken to capital reserves (Exchange Translation Reserve) until the disposal of thenet investment, at which time these are recognised in the profit and loss account.
Commitments for outstanding forward foreign exchange contracts are disclosed in these unconsolidated financial statementsat contracted rates. Contingent liabilities / commitments denominated in foreign currencies are expressed in rupee terms atthe rates of exchange prevailing at the statement of financial position date.
Grants received are recorded as income when the right to receive the grant, based on the related expenditure having beenincurred, has been established.
Items included in these unconsolidated financial statements are measured using the currency of the primary economicenvironment in which the Bank operates. These unconsolidated financial statements are presented in Pakistani Rupees,which is the Bank's functional and presentation currency.
Transactions in foreign currencies are translated to rupees at the foreign exchange rates prevailing on the transaction date.Monetary assets and liabilities in foreign currencies are expressed in rupee terms at the rates of exchange prevailing at thestatement of financial position date. Forward foreign exchange contracts and foreign bills purchased are valued in rupees atthe forward foreign exchange rates applicable to their respective maturities.
Non-monetary assets and liabilities in foreign currencies are expressed in rupee terms at the rates of exchange prevailing atthe date of initial recognition of the non-monetary assets / liabilities.
The assets and liabilities of foreign operations are translated to rupees at exchange rates prevailing at the statement offinancial position date. The results of foreign operations are translated at the average rates of exchange for the year.
Income from lease financing is accounted for using the financing method. Under this method, the unearned lease income(defined as the sum of total lease rentals and estimated residual value less the cost of the leased assets) is deferred andtaken to income over the term of the lease so as to produce a constant periodic rate of return on the outstanding netinvestment in the lease. Gains or losses on termination of lease contracts are recognised through the profit and loss accountwhen these are realised. Unrealised lease income and other fees on classified leases are recognised on a receipt basis.
1589Annual Report 2020
Notes to and forming part of the Unconsolidated Financial StatementsFor the year ended December 31, 2020

NOTES TO AND FORMING PART OF THE UNCONSOLIDATED FINANCIAL STATEMENTSFOR THE YEAR ENDED DECEMBER 31, 2020
Provision for claims under guarantees
5.15 Financial instruments
5.15.1 Financial assets and liabilities
5.15.2 Derivative financial instruments
5.15.3 Off setting
5.16 Segment reporting
5.16.1 Business segments
(a) Corporate / Commercial Banking
(b) Treasury
(c) Branch Banking
(d) Islamic Banking
This represents Islamic Banking branches and Islamic banking windows in the conventional branches of the Bank.
(e) International Branch Operations
Represents Bank's operations in 4 countries including two branches in export processing zones in Karachi and Sialkot.
A segment is a distinguishable component of the Bank that is engaged either in providing particular products or services(business segment), or in providing products or services within a particular economic environment (geographical segment),and is subject to risks and rewards that are different from those of other segments.
Includes fixed income, equity, foreign exchange, credit, funding, own position securities, lending and borrowings andderivatives for hedging and market making.
Financial assets and liabilities carried on the statement of financial position include cash and bank balances, lendings tofinancial institutions, investments, advances, certain receivables, bills payable, borrowings from financial institutions,deposits, subordinated loans and certain payables. The particular recognition methods adopted for significant financialassets and financial liabilities are disclosed in the individual policy notes associated with them.
Derivative financial instruments are initially recognised at fair value on the date on which the derivative contract is enteredinto and are subsequently re-measured at fair value using appropriate valuation techniques. All derivative financialinstruments are carried as assets when their fair value is positive and liabilities when their fair value is negative. Any changein the fair value of derivative financial instruments during the period is taken to the profit and loss account.
Financial assets and financial liabilities are set off and the net amount is reported in the unconsolidated financial statementswhen there is a legally enforceable right to set off and the Bank intends to either settle on a net basis, or to realize the assetsand to settle the liabilities simultaneously.
Includes project, trade and working capital finance, import and export, factoring, leasing, lending, deposits andguarantees. It also include services provided in connection with mergers and acquisitions and the underwriting /arrangement of debt and equity instruments through syndications, Initial Public Offerings and private placements.
Includes deposits, lending and banking services to private individuals and small businesses including credit cards andbranchless banking.
A provision for claims under guarantees is recognised when intimated and reasonable certainty exists that the Bank will settlethe obligation. The charge to the profit and loss account is stated net of expected recoveries and the obligation is recognisedin other liabilities.
16
United Bank Limited90
Notes to and forming part of the Unconsolidated Financial StatementsFor the year ended December 31, 2020

NOTES TO AND FORMING PART OF THE UNCONSOLIDATED FINANCIAL STATEMENTSFOR THE YEAR ENDED DECEMBER 31, 2020
(f) Others
Others includes functions which cannot be classified in any of the above segments.
5.16.2 Geographical segments
The Bank operates in following geographical regions:
- Pakistan- Middle East- Export Processing Zones in Karachi and Sialkot
5.17 Dividends and appropriations to reserves
5.18 Earnings per share
5.19 Acceptances
6. CASH AND BALANCES WITH TREASURY BANKS Note 2020 2019
In handLocal currency 20,776,101 12,394,957Foreign currencies 12,098,863 5,095,923
32,874,964 17,490,880With State Bank of Pakistan in
Local currency current accounts 6.1 75,604,954 77,855,915Foreign currency current accounts 6.2 4,420,727 3,431,095Foreign currency deposit accounts 6.3 7,767,517 10,081,214
87,793,198 91,368,224With other central banks in Foreign currency current accounts 6.4 28,800,193 28,806,149 Foreign currency deposit accounts 6.5 6,869,307 8,694,038
35,669,500 37,500,187With National Bank of Pakistan in local currency current accounts 92,628,531 89,136,038Prize Bonds 1,871,859 366,438
250,838,052 235,861,767
6.1
6.2
6.3
Dividends and appropriations to reserves are recorded in the year in which these are approved, except appropriationsrequired by law which are recorded in the period to which they pertain.
This represents a US Dollar settlement account maintained with the SBP and current accounts maintained with the SBP tocomply with statutory requirements.
Acceptances comprise undertakings by the Bank to pay bill of exchange drawn on customers. Acceptances are recognisedas financial liability in the statement of financial position with a contractual right of reimbursement from the customer as afinancial asset. Therefore, commitments in respect of acceptances have been accounted for as financial assets and financialliabilities.
The Bank presents basic and diluted earnings per share (EPS). Basic and diluted EPS is calculated by dividing the profit orloss attributable to ordinary shareholders of the Bank by the weighted average number of ordinary shares outstanding duringthe year.
This represents account maintained with the SBP to comply with the Special Cash Reserve requirement. The return on thisaccount is declared by the SBP on a monthly basis and as at December 31, 2020, it carries mark-up at the rate of 0.00%(2019: 0.70%) per annum.
----------- (Rupees in '000) ----------
This represents current accounts maintained with the SBP under the Cash Reserve Requirement of section 22 of theBanking Companies Ordinance, 1962.
17
91Annual Report 2020
Notes to and forming part of the Unconsolidated Financial StatementsFor the year ended December 31, 2020

NOTES TO AND FORMING PART OF THE UNCONSOLIDATED FINANCIAL STATEMENTSFOR THE YEAR ENDED DECEMBER 31, 2020
6.4
6.5
Note 2020 20197. BALANCES WITH OTHER BANKS
In PakistanIn deposit accounts 7.1 2,000,000 -
Outside PakistanIn current accounts 7,354,534 9,401,214 In deposit accounts 7.2 4,534,231 11,327,791
11,888,765 20,729,005 13,888,765 20,729,005
7.1
7.2
Note 2020 20198. LENDINGS TO FINANCIAL INSTITUTIONS
Call / clean money lending 8.2 10,500,000 - Repurchase agreement lendings (reverse repo) 8.3 - 9,450,000
Bai Muajjal receivable- with State Bank of Pakistan 8.4 6,433,114 - - with other financial institutions 8.5 3,026,018 10,733,118
19,959,132 20,183,118
8.1 Particulars of lendings to financial institutions
In local currency 19,959,132 20,183,118
8.2
8.3 Securities held as collateral against repurchase agreement lendings (reverse repo)
2019
Held by Bank Further given as collateral / sold Total Held by Bank Further given as
collateral / sold Total
Pakistan Investment Bonds - - - - 9,450,000 9,450,000
8.3.1
8.4
8.5 This represent Bai Muajjal agreement entered into with a financial institution whereby the Bank has sold sukuk havingcarrying value of Rs. 2,984.569 million (2019: Rs. 10,682.138 million) on deferred payment basis. The average return onthese transactions is 6.85% (2019: 12.45%) per annum.
Deposits with other central banks are maintained to meet the minimum cash reserves and capital requirements pertainingto the foreign branches of the Bank.
These carry mark-up at rates ranging from 0.05% to 1.50% (2019: 1.30% to 3.50%) per annum.
2020
--------------------------------------------------------------------- (Rupees in '000) ---------------------------------------------------------------------
These represent Bai Muajjal agreements entered into with State Bank of Pakistan whereby the Bank has sold sukukshaving carrying value of Rs. 5,927.104 million on deferred payment basis. The average return on these transactions is9.25% (2019: nil) per annum.
The market value of securities held as collateral against repurchase agreement lendings amounted to nil (2019: Rs.9,459.071 million).
These represents unsecured lendings carrying mark-up at the rate of 7.15% to 7.30% per annum and is due to mature inFebruary 2021.
--------- (Rupees in '000) --------
These represent placements with overseas central banks and carry mark-up at rates ranging from 0.75% to 2.00% (2019:1.50% to 2.00%) per annum.
This carries mark-up at the rate of 7.15% per annum and is due to mature in January 2021.
--------- (Rupees in '000) --------
18United Bank Limited92
Notes to and forming part of the Unconsolidated Financial StatementsFor the year ended December 31, 2020

NOTES TO AND FORMING PART OF THE UNCONSOLIDATED FINANCIAL STATEMENTSFOR THE YEAR ENDED DECEMBER 31, 2020
9. INVESTMENTS
9.1 Investments by type
Held for trading securitiesMarket Treasury Bills 3,009,238 - 228 3,009,466 71,095,652 - (7,121) 71,088,531Pakistan Investment Bonds - - - - 47,107 - (265) 46,842
3,009,238 - 228 3,009,466 71,142,759 - (7,386) 71,135,373Available for sale securitiesMarket Treasury Bills 341,885,979 - 238,363 342,124,342 182,898,327 - 149,496 183,047,823Pakistan Investment Bonds - fixed 76,334,054 - 333,950 76,668,004 107,776,079 - (8,446,273) 99,329,806Pakistan Investment Bonds - floaters 340,678,646 - (2,569,332) 338,109,314 96,937,574 - 1,772,076 98,709,650Government of Pakistan Eurobonds 24,216,628 (105,010) 1,126,146 25,237,764 19,657,993 (271,160) 1,291,623 20,678,456Government of Pakistan Sukuks 23,232,221 (8,713) (50,261) 23,173,247 9,056,189 (32,577) 23,973 9,047,585Governement of Pakistan Modaraba Pool 9.4 466,435 - - 466,435 - - - - Corporate Sukuks 1,220,000 - - 1,220,000 1,220,000 - - 1,220,000Ordinary shares of listed companies 13,345,156 (5,479,476) 2,517,580 10,383,260 15,583,291 (5,372,542) 3,199,996 13,410,745Preference shares 36,667 - - 36,667 101,365 (64,698) - 36,667Ordinary shares of unlisted companies 808,294 (134,392) 36 673,938 753,900 (129,779) - 624,121Investment in REIT 458,590 - (16,676) 441,914 458,590 - 62,118 520,708Investment in Mutual Fund 250,000 - (21,482) 228,518 250,000 - 2,931 252,931Term Finance Certificates 662,335 (162,033) - 500,302 791,519 (161,996) - 629,523Foreign bonds - sovereign 53,560,498 (909,881) 2,494,807 55,145,424 43,173,559 (582,836) 2,767,552 45,358,275Foreign bonds - others 4,494,088 (24,002) 299,217 4,769,303 6,875,693 (39,741) 247,823 7,083,775
881,649,591 (6,823,507) 4,352,348 879,178,432 485,534,079 (6,655,329) 1,071,315 479,950,065Held to maturity securitiesMarket Treasury Bills 2,696,727 - - 2,696,727 3,458,029 - - 3,458,029Pakistan Investment Bonds 160,738,122 - - 160,738,122 206,994,945 - - 206,994,945Government of Pakistan Eurobonds 9,383,208 (45,483) - 9,337,725 9,147,510 (147,920) - 8,999,590Government of Pakistan Sukuks 824,745 (3,374) - 821,371 800,728 (12,536) - 788,192Bai Muajjal with Government of Pakistan 9.5 29,569,648 - - 29,569,648 26,443,679 - - 26,443,679Term Finance Certificates 4,516,483 (69,951) - 4,446,532 5,355,210 (69,950) - 5,285,260Corporate Sukuks 12,022,820 (57,846) - 11,964,974 13,725,143 (87,870) - 13,637,273Participation Term Certificates 437 (437) - - 437 (437) - - Debentures 2,266 (2,266) - - 2,266 (2,266) - - Foreign bonds - sovereign 21,361,427 (628,582) - 20,732,845 17,762,050 (332,446) - 17,429,604Foreign bonds - others 1,261,784 (23,219) - 1,238,565 1,321,635 (61,085) - 1,260,550Recovery note - - - - 59,157 (59,141) - 16CDC SAARC Fund 347 - - 347 336 - - 336
242,378,014 (831,158) - 241,546,856 285,071,125 (773,651) - 284,297,474AssociatesUBL Financial Sector Fund 150,000 - - 150,000 150,000 - - 150,000UBL Insurers Limited 240,000 - - 240,000 240,000 - - 240,000Khushhali Bank Limited 9.10 832,485 - - 832,485 832,485 - - 832,485DHA Cogen Limited 9.11 - - - - - - - -
1,222,485 - - 1,222,485 1,222,485 - - 1,222,485SubsidiariesUnited National Bank Limited (UBL UK) 2,855,223 - - 2,855,223 2,855,223 - - 2,855,223UBL (Switzerland) AG 589,837 - - 589,837 589,837 - - 589,837UBL Fund Managers Limited 100,000 - - 100,000 100,000 - - 100,000United Executors and Trustees
Company Limited 9.12 30,100 - - 30,100 30,100 - - 30,1003,575,160 - - 3,575,160 3,575,160 - - 3,575,160
Discontinued OperationUBL Bank (Tanzania) Limited 9.13 1,831,006 (1,688,911) - 142,095 1,831,006 (1,688,911) - 142,095
Total Investments 1,133,665,494 (9,343,576) 4,352,576 1,128,674,494 848,376,614 (9,117,891) 1,063,929 840,322,652
--------------------------------------------------------------------------- (Rupees in '000) ---------------------------------------------------------------------------
2020 2019
Cost / Amortised
cost
Provision for
diminution
Surplus / (Deficit)
Carrying Value
Cost / Amortised
cost
Provision for
diminution
Surplus / (Deficit)
Carrying ValueNote
19 93Annual Report 2020
Notes to and forming part of the Unconsolidated Financial StatementsFor the year ended December 31, 2020

NOTES TO AND FORMING PART OF THE UNCONSOLIDATED FINANCIAL STATEMENTSFOR THE YEAR ENDED DECEMBER 31, 2020
2020 2019
9.2 Investments by segment
Federal Government SecuritiesMarket Treasury Bills 344,895,217 - 238,591 345,133,808 253,993,979 - 142,375 254,136,354Pakistan Investment Bonds - fixed 237,072,176 - 333,950 237,406,126 314,818,131 - (8,446,538) 306,371,593Pakistan Investment Bonds - floaters 340,678,646 - (2,569,332) 338,109,314 96,937,574 - 1,772,076 98,709,650Government of Pakistan Sukuks 24,056,966 (12,087) (50,261) 23,994,618 9,856,917 (45,113) 23,973 9,835,777Government of Pakistan Eurobonds 33,599,836 (150,493) 1,126,146 34,575,489 28,805,503 (419,080) 1,291,623 29,678,046Bai Muajjal with Government of Pakistan 29,569,648 - - 29,569,648 26,443,679 - - 26,443,679Governement of Pakistan Modaraba Pool 466,435 - - 466,435 - - - -
1,010,338,924 (162,580) (920,906) 1,009,255,438 730,855,783 (464,193) (5,216,491) 725,175,099Ordinary sharesListed companies 13,345,156 (5,479,476) 2,517,580 10,383,260 15,583,291 (5,372,540) 3,199,996 13,410,747Unlisted companies 808,294 (134,392) 36 673,938 753,900 (129,779) - 624,121
14,153,450 (5,613,868) 2,517,616 11,057,198 16,337,191 (5,502,319) 3,199,996 14,034,868
Preference shares 36,667 - - 36,667 101,365 (64,698) - 36,667Investment in Mutual Fund 250,000 - (21,482) 228,518 250,000 - 2,931 252,931Investment in REIT 458,590 - (16,676) 441,914 458,590 - 62,118 520,708
Non-Government Debt Securities Listed companies 1,830,662 (162,035) - 1,668,627 2,702,381 (223,114) - 2,479,267Unlisted companies 16,593,679 (130,498) - 16,463,181 18,392,194 (99,407) - 18,292,787
18,424,341 (292,533) - 18,131,808 21,094,575 (322,521) - 20,772,054Foreign SecuritiesMarket Treasury Bills 2,696,727 - - 2,696,727 3,458,029 - - 3,458,029Sovereign bonds 74,921,925 (1,538,463) 2,494,807 75,878,269 60,935,609 (915,282) 2,767,552 62,787,879CDC SAARC Fund 347 - - 347 336 - - 336Recovery note - - - - 59,157 (59,141) - 16Other Bonds 5,755,872 (47,221) 299,217 6,007,868 8,197,328 (100,826) 247,823 8,344,325
83,374,871 (1,585,684) 2,794,024 84,583,211 72,650,459 (1,075,249) 3,015,375 74,590,585AssociatesUBL Financial Sector Fund 150,000 - - 150,000 150,000 - - 150,000UBL Insurers Limited 240,000 - - 240,000 240,000 - - 240,000Khushhali Bank Limited 832,485 - - 832,485 832,485 - - 832,485DHA Cogen Limited - - - - - - - -
1,222,485 - - 1,222,485 1,222,485 - - 1,222,485SubsidiariesUnited National Bank Limited (UBL UK) 2,855,223 - - 2,855,223 2,855,223 - - 2,855,223UBL (Switzerland) AG 589,837 - - 589,837 589,837 - - 589,837UBL Fund Managers Limited 100,000 - - 100,000 100,000 - - 100,000United Executors and Trustees
Company Limited 30,100 - - 30,100 30,100 - - 30,1003,575,160 - - 3,575,160 3,575,160 - - 3,575,160
Discontinued operationsUBL Bank (Tanzania) Limited 1,831,006 (1,688,911) - 142,095 1,831,006 (1,688,911) - 142,095
Total Investments 1,133,665,494 (9,343,576) 4,352,576 1,128,674,494 848,376,614 (9,117,891) 1,063,929 840,322,652
----------------------------------------------------------------------- (Rupees in '000) -----------------------------------------------------------------------
Provision for
diminution
Surplus / (Deficit)
Carrying Value
Cost / Amortised
cost
Provision for
diminution
Surplus / (Deficit)
Carrying Value
Cost / Amortised
cost
20United Bank Limited94
Notes to and forming part of the Unconsolidated Financial StatementsFor the year ended December 31, 2020

NOTES TO AND FORMING PART OF THE UNCONSOLIDATED FINANCIAL STATEMENTSFOR THE YEAR ENDED DECEMBER 31, 2020
Note 2020 2019
9.2.1 Investments given as collateral - at market value
Market Treasury Bills 59,846,168 67,189,682Pakistan Investment Bonds - 13,499,874
59,846,168 80,689,556
9.3 Provision for diminution in value of investments
9.3.1 Opening balance 9,117,891 6,607,491Exchange adjustments 34,098 241,816
Charge / (reversals)Charge for the year 853,323 4,820,819Reversals for the year (511,772) (1,621,808)
33 341,551 3,199,011Amounts written off (149,964) (930,427)Closing balance 9.14 9,343,576 9,117,891
9.3.1.1
9.3.2 Particulars of provision against debt securities
Category of classification
DomesticLoss 292,496 292,496 714,023 322,520
Overseas Overdue by:
˃ 365 days - - 78,784 78,784
Total 292,496 292,496 792,807 401,304
9.4
2020 20199.5 Bai Muajjal with Government of Pakistan
Bai Muajjal Investment 33,031,000 33,031,000Less: Deferred Income (3,461,352) (6,587,321)Bai Muajjal Investment - net 29,569,648 26,443,679
------- (Rupees in '000) -------
2020 2019
----------------------------- (Rupees in '000) -------------------------
------- (Rupees in '000) -------
Non performing
investments (NPI)
Provision
Non performing
investments (NPI)
Provision
In accordance with SBP Circular no. 07 of 2020 dated October 22, 2020, the Government of Pakistan has established awholly owned special purpose vehicle in the name of "Islamic NPC Company Limited" (INPCCL). According to the Circular,INPCCL has formed two Mudarabah pools for issurance of "Islamic Naya Pakistan Certificates" (INPCs) in PakistaniRupee and US Dollar currencies denomination. This represents the outstanding amount of investment of the Bank inMudarabah Pools amounting to Rs. 342.284 million and USD 0.777 million (equivalent to Rs. 124.151 million) as atDecember 31, 2020, respectively.
The Bank has availed the relaxation given by the SBP in respect of determining the impairment charge against AFSsecurities and has accordingly recognised the impairment charge in a phased manner equally on a quarterly basis duringthe year ended December 31, 2020.
21
95Annual Report 2020
Notes to and forming part of the Unconsolidated Financial StatementsFor the year ended December 31, 2020

NOTES TO AND FORMING PART OF THE UNCONSOLIDATED FINANCIAL STATEMENTSFOR THE YEAR ENDED DECEMBER 31, 2020
9.6 Quality of Available for Sale Securities
Details regarding quality of Available for Sale (AFS) securities are as follows;
2020 2019
9.6.1 Domestic Securities
9.6.1.1 Federal Government Securities - Government guaranteed
Market Treasury Bills 341,885,979 182,898,327 Pakistan Investment Bonds - fixed 76,334,054 107,776,079 Pakistan Investment Bonds - floaters 340,678,646 96,937,574 Sukuks 23,232,221 9,056,189 Eurobonds 24,216,628 19,657,993 Modaraba Pool 466,435 -
806,813,963 416,326,162
9.6.1.2 Shares
Listed CompaniesCement 592,327 1,083,609 Chemical 875,779 954,589 Commercial Banks 337,311 337,311 Fertilizer 5,104,212 5,282,498 Oil & Gas Exploration Companies 603,266 594,497 Oil & Gas Marketing Companies 579,373 666,558 Power Generation & Distribution 4,665,889 5,697,831 Technology & Communication 42,995 41,654 Textile Composite 543,544 543,544 Textile Others 460 353,314
13,345,156 15,555,405
Unlisted Companies Cost Breakup value Cost Breakup value
SME Bank Limited 26,950 - 26,950 - First Women Bank 21,100 69,511 21,100 69,511 N.I.F.T 1,527 51,998 1,526 51,641 NIT (Equity) 100 830,783 100 832,941 Passco 5,500 2,725,903 5,500 1,622,928 Swift (Belgium) 2,905 19,417 2,905 15,722 VIS Credit Information Services 325 64 325 45 Mastercard International 0.003 431 0.003 374 Kay Textile Mills Limited 3,778 - 3,778 - World Bridge Connect Incorporation 77,606 - 77,606 - Techlogix International Limited 50,703 24,941 50,703 29,537 Cinepax Limited 60,122 175,313 60,122 197,405 Pakistan Mortgage Refinance Company Limited. 500,000 630,862 500,000 507,460 1 Link (Private) Limited 54,287 202,032 - -
804,903 4,731,255 750,615 3,327,564
Cost------- (Rupees in '000) -------
----------------------------- (Rupees in '000) -------------------------
2020 2019
22
United Bank Limited96
Notes to and forming part of the Unconsolidated Financial StatementsFor the year ended December 31, 2020

NOTES TO AND FORMING PART OF THE UNCONSOLIDATED FINANCIAL STATEMENTSFOR THE YEAR ENDED DECEMBER 31, 2020
2020 2019
9.6.1.3 Others
Investment in REIT 458,590 458,590Preference shares 36,667 36,667Mutual Fund 250,000 250,000
9.6.1.4 Non Government Debt Securities
Listed - AA+, AA, AA- 250,000 370,685 - A+, A, A- 250,000 250,000 - Unrated 162,335 162,336
662,335 783,021
Unlisted - AAA - 420,000 - AA+, AA, AA- 420,000 800,000 - A+, A, A- 800,000 - - Unrated - 8,498
1,220,000 1,228,498
9.6.2 Foreign Securities
9.6.2.1 Government Securities Cost Rating Cost Rating
- Qatar 8,294,761 AA- 4,115,224 AA- - United Arab Emirates 12,550,990 AA 6,851,604 AA - Srilanka 4,528,945 CCC+ 5,816,989 B - Jordan 3,672,314 B+ 3,562,863 BB- - Bahrain 6,539,325 B 6,263,102 BB- - Egypt 4,847,877 B 4,320,033 B - Kenya 1,190,908 B 1,160,041 B - Nigeria 1,563,239 B 1,520,018 B+ - Oman 5,342,200 BB- 5,140,974 BB+ - Turkey 4,230,991 B 4,133,659 BB- - South Africa 798,948 BB - N/A - Tanzania - N/A 289,052 B+
53,560,498 43,173,559
Cost------- (Rupees in '000) -------
2020 2019
----------------------------- (Rupees in '000) -------------------------
23
97Annual Report 2020
Notes to and forming part of the Unconsolidated Financial StatementsFor the year ended December 31, 2020

NOTES TO AND FORMING PART OF THE UNCONSOLIDATED FINANCIAL STATEMENTSFOR THE YEAR ENDED DECEMBER 31, 2020
2020 2019
9.6.2.2 Non Government Debt Securities
Listed - AA+, AA, AA- 288,705 674,429 - BBB+, BBB, BBB- 734,470 2,826,520 - BB+, BB, BB- - 460,440 - B+, B, B- 1,109,941 616,934 - Unrated 2,360,972 2,297,370
4,494,088 6,875,693
9.6.2.3 Equity Securities
ListedDP world - Bahrain - 27,886
UnlistedThe Benefit Company B.S.C 3,391 3,285
9.6.2.4 Preference Shares - 64,698
9.7 Particulars relating to Held to Maturity securities are as follows:
9.7.1 Domestic Securities
9.7.1.1 Federal Government Securities - Government guaranteed
Pakistan Investment Bonds 160,738,122 206,994,945 Sukuks 824,745 800,728
Bai Muajjal 29,569,648 26,443,679 Eurobonds 9,383,208 9,147,510
200,515,723 243,386,862
9.7.1.2 Non Government Debt Securities
Listed - AA+, AA, AA- 1,168,328 1,910,863
Unlisted - AAA 7,778,230 8,740,830 - AA+, AA, AA- 1,419,237 1,706,407 - A+, A, A- 685,713 821,427 - Unrated 5,490,498 5,903,529
15,373,678 17,172,193 9.7.1.3 Others
CDC SAARC Fund 347 336
------- (Rupees in '000) -------Cost
24
United Bank Limited98
Notes to and forming part of the Unconsolidated Financial StatementsFor the year ended December 31, 2020

NOTES TO AND FORMING PART OF THE UNCONSOLIDATED FINANCIAL STATEMENTSFOR THE YEAR ENDED DECEMBER 31, 2020
9.7.2 Foreign Securities
9.7.2.1 Government Securities Cost Rating Cost Rating
- Qatar 3,434,345 AA- 1,821,876 AA- - Jordan 2,768,623 B+ 2,685,927 BB- - Bahrain 3,008,615 B 1,843,236 BB- - Egypt 2,488,387 B 2,386,064 B - Kenya 1,190,482 B 1,159,578 B - Oman 2,409,048 BB- 2,326,553 BB+ - Portugal 711,520 BBB- 691,396 BBB - Sri Lanka 2,370,534 CCC+ 2,683,484 B - Tanzania - unrated 45,034 B+ - Turkey 2,180,924 B 2,118,902 BB- - South Africa 798,948 BB - N/A - Yemen 2,696,728 unrated 3,458,029 unrated
24,058,154 21,220,079
2020 20199.7.2.2 Non Government Debt Securities
Listed - BBB+, BBB, BBB- 63,934 61,939 - BB+, BB, BB- 473,922 460,440 - B+, B, B- 636,019 616,934 - Unrated 87,909 162,679
1,261,784 1,301,992 Unlisted - Unrated - 19,643
9.7.2.3 Others
Recovery Note - 59,157
9.7.3
9.8
9.9
9.10
9.11
9.12
9.13
Cost------- (Rupees in '000) -------
The market value of securities classified as held-to-maturity as at December 31, 2020, amounted to Rs. 246,788.536 million(2019: Rs. 281,380.415 million).
Investments include securities which are held by the Bank to comply with the statutory liquidity requirements as set out underSection 29 of the Banking Companies Ordinance, 1962.
Investments include Rs. 118 million (2019: Rs. 118 million) held by the State Bank of Pakistan as pledge against demandloan, TT / DD discounting facilities and foreign exchange exposure limit sanctioned to the Bank and Rs. 5 million (2019: Rs.5 million) held by the Controller of Military Accounts (CMA) under Regimental Fund Arrangements.
This represents the Bank's subscription towards the paid-up capital of Khushhali Bank Limited. Pursuant to section 10 of theKhushhali Bank Ordinance, 2000 strategic investors including the Bank cannot sell or transfer their investment before aperiod of five years that has expired on October 10, 2005. Thereafter, such sale / transfer would be subject to the priorapproval of the SBP. However, these shares are still appearing as frozen as no approval has been obtained by the Bank tounfreeze these shares.
The shareholders of the Bank in their annual general meeting held on March 27, 2020, have resolved to wind up “UnitedExecutors and Trustees Company Limited”, a wholly owned subsidiary of the Bank. The Company is inactive, and will haveno impact on the overall profitability of the Bank.
The Bank held 20.99% of the issued and paid up capital of DHA Cogen Limited without any consideration paid. DHA CogenLimited has been sold during the year 2020 for a consideration of Rs. 152.755 million.
UBL Bank (Tanzania) Limited ("UBTL") is a wholly owned subsidiary of United Bank Limited. UBTL sold materially all of itsassets and liabilities held as at October 31, 2019, including the loans and advances and deposit book to EXIM BankTanzania Limited ("Exim"), in line with the Asset and Liabilities Purchase Agreement signed on May 22, 2019. The control ofthese assets and liabilities was transferred to Exim effective from November 1, 2019. The Banking operations of thesubsidiary ceased on November 1, 2019. UBTL is in process of winding up and voluntary liquidation.
2020 2019
----------------------------- (Rupees in '000) -------------------------
25 99Annual Report 2020
Notes to and forming part of the Unconsolidated Financial StatementsFor the year ended December 31, 2020

NOTES TO AND FORMING PART OF THE UNCONSOLIDATED FINANCIAL STATEMENTSFOR THE YEAR ENDED DECEMBER 31, 2020
9.14
9.15 Summary of financial position and performance of associates and subsidiaries
AssociatesUBL Financial Sector Fund Pakistan 12.39% 1,178,034 73,543 (46,647) (84,869)UBL Insurers Limited Pakistan 30.00% 5,876,518 4,205,955 1,841,543 65,865Khushhali Bank Limited Pakistan 29.69% 107,288,360 96,415,309 1,193,189 383,353
SubsidiariesUnited National Bank Limited (UBL UK) United Kingdom 55.00% 131,552,572 114,916,979 2,565,956 (448,650)UBL (Switzerland) AG Switzerland 100.00% 23,062,408 16,471,494 879,409 145,515UBL Fund Managers Limited Pakistan 98.87% 2,781,415 771,203 928,450 311,888UBL Bank (Tanzania) Limited Tanzania 100.00% 219,488 11,575 312 (16,373)United Executors and Trustees Company Limited Pakistan 100.00% 135,259 701 9,911 6,535
AssociatesUBL Financial Sector Fund Pakistan 16.00% 994,621 11,275 142,311 51,990UBL Insurers Limited Pakistan 30.00% 5,754,807 4,088,854 1,769,967 307,875Khushhali Bank Limited Pakistan 29.69% 81,714,191 72,286,516 1,027,104 202,318
SubsidiariesUnited National Bank Limited (UBL UK) United Kingdom 55.00% 103,628,212 87,642,018 2,084,129 (141,894)UBL (Switzerland) AG Switzerland 100.00% 32,637,653 26,790,726 990,362 325,748UBL Fund Managers Limited Pakistan 98.87% 2,486,133 587,181 986,405 188,378UBL Bank (Tanzania) Limited Tanzania 100.00% 224,818 5,824 305,250 (1,224,735)United Executors and Trustees Company Limited Pakistan 100.00% 128,245 222 12,949 9,042
10. ADVANCES Note2020 2019 2020 2019 2020 2019
Loans, cash credits, running finances, etc. 10.2 474,312,018 572,733,264 80,691,738 73,673,653 555,003,756 646,406,917Islamic financings and related assets 10.7 20,542,257 9,027,259 107,478 94,043 20,649,735 9,121,302Bills discounted and purchased 30,828,990 44,205,242 2,824,527 3,218,030 33,653,517 47,423,272Advances - gross 525,683,265 625,965,765 83,623,743 76,985,726 609,307,008 702,951,491
Provision against advances 10.4- Specific - - (71,755,668) (63,615,915) (71,755,668) (63,615,915)- General (7,271,844) (3,501,359) - - (7,271,844) (3,501,359)
(7,271,844) (3,501,359) (71,755,668) (63,615,915) (79,027,512) (67,117,274)
Advances - net of provision 518,411,421 622,464,406 11,868,075 13,369,811 530,279,496 635,834,217
2020 201910.1 Particulars of advances - gross
10.1.1 In local currency 453,024,198 516,411,196In foreign currencies 156,282,810 186,540,295
609,307,008 702,951,491
Total
2019
Liabilities Revenue Profit / (loss)
2020
Country of Incorporation % Holding Assets
Provision against investments includes expected credit loss (ECL) under IFRS 9 amounting to Rs. 1,748.301 million (2019:Rs. 1,460.657 million) on overseas branches.
Liabilities
------- (Rupees in '000) -------
---------------------------------------------- (Rupees in '000) --------------------------------------------------------
Performing Non-performing
Revenue Profit / (loss)
----------------------- (Rupees in '000) -------------------
----------------------- (Rupees in '000) -------------------
Country of Incorporation % Holding Assets
26United Bank Limited100
Notes to and forming part of the Unconsolidated Financial StatementsFor the year ended December 31, 2020

NOTES TO AND FORMING PART OF THE UNCONSOLIDATED FINANCIAL STATEMENTSFOR THE YEAR ENDED DECEMBER 31, 2020
10.2 Includes net investment in finance lease as disclosed below:
Minimum lease payments - 121,993 - 121,993 - 166,967 - 166,967Financial charges for
future periods - (22,484) - (22,484) - (58,339) - (58,339)
Present value of minimum lease payments - 99,509 - 99,509 - 108,628 - 108,628
10.3
Category of Classification
DomesticOther Assets Especially Mentioned * 189,538 497 322,139 8,561Substandard 2,690,171 662,589 764,745 188,848Doubtful 1,599,695 798,209 325,325 169,274Loss 24,259,582 23,164,558 26,152,963 25,041,562
28,738,986 24,625,853 27,565,172 25,408,245Overseas Not past due but impaired ** 5,820,717 2,681,378 6,763,366 3,086,501Overdue by:
Upto 90 days 1,064,806 135,443 2,804,905 647,98491 to 180 days 5,232,868 4,695,361 1,643,198 987,640181 to 365 days 6,841,381 6,407,521 5,518,289 4,967,136˃ 365 days 35,924,985 33,210,112 32,690,796 28,518,409
54,884,757 47,129,815 49,420,554 38,207,670Total 83,623,743 71,755,668 76,985,726 63,615,915
* The other assets especially mentioned category pertains to agricultural finance and advances to small enterprises.** Not past due but impaired category mainly represents restructured exposure.
10.4 Particulars of provision against advances
Note Specific General Total Specific General Total
Opening balance 63,615,915 3,501,359 67,117,274 56,278,579 4,442,585 60,721,164 Exchange adjustments 917,623 155,659 1,073,282 3,536,985 261,133 3,798,118
Charge / (reversals)Charge for the year 14,394,123 3,623,212 18,017,335 9,660,850 25,209 9,686,059 Reversals (1,805,805) (8,386) (1,814,191) (3,521,386) (1,220,012) (4,741,398)
33 12,588,318 3,614,826 16,203,144 6,139,464 (1,194,803) 4,944,661 Amounts written off 10.5 (5,282,212) - (5,282,212) (2,754,617) - (2,754,617) Amounts charged off - agriculture financing (80,974) - (80,974) - - - Transfers (out) / in - net (3,002) - (3,002) 415,504 (7,556) 407,948 Closing balance 71,755,668 7,271,844 79,027,512 63,615,915 3,501,359 67,117,274
------------------------------------------------------------ (Rupees in '000) ------------------------------------------------------------
-------------------------------------- (Rupees in '000) --------------------------------------
Advances include Rs. 83,623.743 million (2019: Rs. 76,985.726 million) which have been placed under non-performingstatus as detailed below:
Non-Performing
LoansProvision Non-Performing
Loans Provision
2020
2020 2019
2019
------------------------------------------------------------------------------ (Rupees in '000) ---------------------------------------------------------------------------------------
2019
Total More than five years
Not later than one year
Later than one and upto five
years
Not later than one yearTotal More than
five years
Later than one and upto
five years
2020
27 101Annual Report 2020
Notes to and forming part of the Unconsolidated Financial StatementsFor the year ended December 31, 2020

NOTES TO AND FORMING PART OF THE UNCONSOLIDATED FINANCIAL STATEMENTSFOR THE YEAR ENDED DECEMBER 31, 2020
10.4.1
10.4.2
10.4.3 Particulars of provision against advances
Specific General Total Specific General Total
In local currency 24,085,365 319,955 24,405,320 24,890,486 328,342 25,218,828 In foreign currencies 47,670,303 6,951,889 54,622,192 38,725,429 3,173,017 41,898,446
71,755,668 7,271,844 79,027,512 63,615,915 3,501,359 67,117,274
10.4.4
Note 2020 201910.5 Particulars of write-offs
10.5.1 Against provisions 10.4 5,282,212 2,754,617 Directly charged to profit and loss account 77,094 149,591
5,359,306 2,904,208
10.5.2 - Write-offs of Rs. 500,000 and aboveDomestic 10.6 2,663,181 107,336 Overseas 2,629,279 2,742,502
5,292,460 2,849,838 - Write-offs of below Rs. 500,000 66,846 54,370
5,359,306 2,904,208 10.6 Details of loan write-offs of Rs. 500,000 and above
10.7
Note 2020 201911. FIXED ASSETS
Capital work-in-progress 11.1 447,893 541,722Property and equipment 11.2 50,759,810 51,855,155
51,207,703 52,396,87711.1 Capital work-in-progress
Civil works 270,445 370,308Equipment 177,448 171,414
447,893 541,722
General provision represents provision amounting to Rs. 319.955 million (2019: Rs. 328.342 million) against consumerfinance portfolio as required by the Prudential Regulations issued by the SBP and Rs. 6,951.889 million (2019: Rs.3,173.017 million) pertaining to overseas advances to meet the requirements of the regulatory authorities of the respectivecountries in which the overseas branches operate.
In terms of sub-section (3) of Section 33A of the Banking Companies Ordinance, 1962, the statement in respect of writtenoff loans or any other financial relief of five hundred thousand rupees or above allowed to a person during the year endedDecember 31, 2020, is given in annexure I to the unconsolidated financial statements (except in case of overseas brancheswrite-offs which is restricted by overseas regulatory authorities).
------- (Rupees in '000) -------
------- (Rupees in '000) -------
------------------------------------------------ (Rupees in '000) ------------------------------------------------
The Bank has availed the benefit of Forced Sale Value (FSV) of certain mortgaged properties held as collateral against non-performing advances as allowed under BSD Circular 1 of 2011. Had the benefit under the said circular not been taken bythe Bank, the specific provision against non-performing advances would have been higher by Rs. 18.337 million (2019: Rs.27.992 million). The FSV benefit availed is not available for the distribution of cash or stock dividend to shareholders.
20192020
Information related to Islamic financing and related assets is given in annexure II and is an integral part of theseunconsolidated financial statements.
The Bank has also availed FSV benefit of certain mortgaged properties held as collateral against non-performing advancesof overseas branches in accordance with the applicable regulation in the respective countries where the branches operate.Had the benefit not been taken by the Bank, the specific provision against non-performing advances would had been higher by Rs. 3,951.861 million (2019: Rs. 5,180.474 million) for the overseas branches.
During the year, as a result of COVID-19, the SBP has allowed certain relaxations including deferment of principalpayment, rescheduling / restructuring of principal and mark-up, extension and timeline of provisioning against trade billswhile maintaining the customer status as "regular". These have been considered while determining the provisioningrequirements on a time based criteria.
28
United Bank Limited102
Notes to and forming part of the Unconsolidated Financial StatementsFor the year ended December 31, 2020

NOTES TO AND FORMING PART OF THE UNCONSOLIDATED FINANCIAL STATEMENTSFOR THE YEAR ENDED DECEMBER 31, 2020
11.2 Property and Equipment
At January 1, 2020Cost / Revalued amount 6,433,625 21,515,547 2,790,183 6,930,058 5,771,075 2,254,526 14,979,480 356,804 9,107,226 70,138,524Accumulated depreciation - (1,979) (164,142) (500,166) (3,290,072) (1,359,480) (10,735,213) (215,067) (2,017,250) (18,283,369)Net book value 6,433,625 21,513,568 2,626,041 6,429,892 2,481,003 895,046 4,244,267 141,737 7,089,976 51,855,155
Year ended December 31, 2020Opening net book value 6,433,625 21,513,568 2,626,041 6,429,892 2,481,003 895,046 4,244,267 141,737 7,089,976 51,855,155Additions - - - - 478,528 92,708 1,744,741 4,950 2,188,391 4,509,318Net disposal / termination (book value) - (44,930) - (118,811) (39,240) (5,586) (67,135) (13,359) (944,932) (1,233,993)Depreciation charge - - (88,453) (258,431) (460,901) (161,636) (1,817,601) (45,953) (1,655,038) (4,488,013)Exchange rate adjustments - 10 - 399 39,850 309 70,132 307 6,336 117,343Closing net book value 6,433,625 21,468,648 2,537,588 6,053,049 2,499,240 820,841 4,174,404 87,682 6,684,733 50,759,810
At December 31, 2020
Cost / Revalued amount 6,433,625 21,470,690 2,790,183 6,797,040 5,786,556 2,187,778 15,455,565 314,148 9,558,101 70,793,686Accumulated depreciation - (2,042) (252,595) (743,991) (3,287,316) (1,366,937) (11,281,161) (226,466) (2,873,368) (20,033,876)Net book value 6,433,625 21,468,648 2,537,588 6,053,049 2,499,240 820,841 4,174,404 87,682 6,684,733 50,759,810
- - - - - - - - - -
Rate of depreciation (percentage) - - 2.5-5 2.5-5 5-20 10-25 5 - 33.33 20 4 - 100 -
At January 1, 2019Cost / Revalued amount 6,433,625 21,767,359 2,790,183 6,944,070 4,811,411 2,078,963 13,142,926 453,509 - 58,422,046Accumulated depreciation - (1,775) (75,689) (236,845) (2,814,645) (1,178,215) (8,998,129) (261,882) - (13,567,180)Net book value 6,433,625 21,765,584 2,714,494 6,707,225 1,996,766 900,748 4,144,797 191,627 - 44,854,866
Year ended December 31, 2019Opening net book value 6,433,625 21,765,584 2,714,494 6,707,225 1,996,766 900,748 4,144,797 191,627 - 44,854,866Impact of adoption of IFRS 16at January 1, 2019 - - - - - - - - 8,281,058 8,281,058Additions - - - 4,091 901,648 149,999 1,797,869 19,105 881,802 3,754,514Net disposal (book value) - (252,050) - (18,453) (2,846) (106) (4,690) (11,974) - (290,119)Depreciation charge - - (88,453) (264,095) (422,296) (158,906) (1,718,190) (58,012) (2,097,081) (4,807,033)Exchange rate adjustments - 34 - 1,124 7,731 3,311 24,481 991 24,197 61,869Closing net book value 6,433,625 21,513,568 2,626,041 6,429,892 2,481,003 895,046 4,244,267 141,737 7,089,976 51,855,155
At December 31, 2019Cost / Revalued amount 6,433,625 21,515,547 2,790,183 6,930,058 5,771,075 2,254,526 14,979,480 356,804 9,107,226 70,138,524Accumulated depreciation - (1,979) (164,142) (500,166) (3,290,072) (1,359,480) (10,735,213) (215,067) (2,017,250) (18,283,369)Net book value 6,433,625 21,513,568 2,626,041 6,429,892 2,481,003 895,046 4,244,267 141,737 7,089,976 51,855,155
- - - - - - - - - -
Rate of depreciation (percentage) - - 2.5-5 2.5-5 5-20 10-25 5 - 33.33 20 4 - 100 -
VehiclesLeasehold Improve-
ments
Right-of-use Asset -
Property
2020
Freehold land
Leasehold land
Buildings on
Freehold land
Buildings on
Leasehold land
Furniture and fixture
Electrical, office and computer equipment
Vehicles TotalLeasehold Improve-
ments
Right-of-use Asset -
PropertyTotal
----------------------------------------------------------------------------- (Rupees in '000) -----------------------------------------------------------------------------
----------------------------------------------------------------------------- (Rupees in '000) -----------------------------------------------------------------------------
2019
Freehold land
Leasehold land
Building on Freehold
land
Building on Leasehold
land
Furniture and fixture
Electrical, office and computer equipment
29103Annual Report 2020
Notes to and forming part of the Unconsolidated Financial StatementsFor the year ended December 31, 2020

NOTES TO AND FORMING PART OF THE UNCONSOLIDATED FINANCIAL STATEMENTSFOR THE YEAR ENDED DECEMBER 31, 2020
11.3 Revaluation of properties
2020 2019
Freehold land 782,581 782,581 Leasehold land 3,330,789 3,331,039 Building on freehold land 1,990,873 2,054,703 Building on leasehold land 4,757,850 4,962,504
11.4 Carrying amount of temporarily idle property of the Bank 143,420 82,420
11.5 The cost of fully depreciated assets still in use
Furniture and fixtures 476,007 540,038 Electrical, office and computer equipment 6,235,542 5,745,023 Vehicles 118,403 52,446 Leasehold improvements 831,886 1,164,000
7,661,838 7,501,507 11.6 Details of disposal of operating fixed assets to related parties
Note 2020 201912 INTANGIBLE ASSETS
Capital work-in-progress 190,355 262,404Intangible assets 12.1 1,638,856 1,688,598
1,829,211 1,951,002
12.1 At January 1Cost 5,875,765 5,015,073Accumulated amortisation and impairment (4,187,167) (3,469,200)Net book value 1,688,598 1,545,873
Year ended DecemberOpening net book value 1,688,598 1,545,873Additions 742,731 761,437Disposals (1,324) (335)Amortisation charge (793,562) (645,869)Exchange rate adjustments 2,413 27,492Closing net book value 1,638,856 1,688,598
At December 31Cost 6,554,387 5,875,765Accumulated amortisation and impairment (4,915,531) (4,187,167)Net book value 1,638,856 1,688,598
Rate of amortisation (percentage) 10-25 10-25
Useful life (in years) 4 - 10 4 - 10
The properties of the Bank were last revalued by independent professional valuers as at December 31, 2017. Therevaluation was carried out by M/s. Engineering Pakistan Int'l (Private) Limited., M/s. M. J. Surveyors (Private) Limited,M/s. Harvestor Services (Private) Limited., and M/s. Iqbal A. Nanjee & Co. (Private) Limited. on the basis of professionalassessment of present market values which resulted in an increase in surplus by Rs. 6,366.149 million. The total surplusagainst revaluation of fixed assets as at December 31, 2020, amounts to Rs. 25,630.817 million. Had there been norevaluation, the carrying amount of the revalued assets at December 31, would have been as follows:
------- (Rupees in '000) -----
The information relating to operating fixed assets disposed off during the year to related parties is given in annexure IIIand is an integral part of these unconsolidated financial statements.
------- (Rupees in '000) -----
30United Bank Limited104
Notes to and forming part of the Unconsolidated Financial StatementsFor the year ended December 31, 2020

NOTES TO AND FORMING PART OF THE UNCONSOLIDATED FINANCIAL STATEMENTSFOR THE YEAR ENDED DECEMBER 31, 2020
Note 2020 2019
12.2 The cost of fully amortised assets still in use
Software 2,297,088 1,807,345
13. DEFERRED TAX ASSETS
Deferred tax assets 13.1 6,399,267 3,300,164
13.1 Movement in temporary differences during the year
2020
Deductible temporary differences on- Post retirement employee benefits 837,307 30,335 513,445 1,381,087 - Provision against advances, off balance sheet etc. 3,291,876 3,098,387 - 6,390,263 - Workers' Welfare Fund 1,495,858 337,333 - 1,833,191
5,625,041 3,466,055 513,445 9,604,541 Taxable temporary differences on:- Surplus on revaluation of fixed assets / non-banking assets (739,593) 33,079 59,848 (646,666) - Surplus on revaluation of investments (417,813) - (1,279,603) (1,697,416) - Accelerated tax depreciation (1,147,656) 418,087 - (729,569) - Others (19,815) - (111,808) (131,623)
(2,324,877) 451,166 (1,331,563) (3,205,274)
3,300,164 3,917,221 (818,118) 6,399,267
2019
Deductible temporary differences on:- Post retirement employee benefits 403,897 103,173 330,237 837,307 - Provision against advances, off balance sheet etc. 2,292,249 999,627 - 3,291,876 - Surplus on revaluation of investments 4,880,087 - (5,297,900) (417,813) - Workers' Welfare Fund 1,083,350 412,508 - 1,495,858 - Others 788,897 (856,524) 47,812 (19,815)
9,448,480 658,784 (4,919,851) 5,187,413 Taxable Temporary Differences on:- Surplus on revaluation of fixed assets / non-banking assets (734,307) 32,786 (38,072) (739,593) - Accelerated tax depreciation (907,089) (240,567) - (1,147,656)
(1,641,396) (207,781) (38,072) (1,887,249)
7,807,084 451,003 (4,957,923) 3,300,164
Recognised in profit and loss
accountAt January 1, 2019
------------------------------------------------- (Rupees in '000) ------------------------------------------------
Recognised in OCI At December 31, 2019
------- (Rupees in '000) -----
------------------------------------------------- (Rupees in '000) ------------------------------------------------
At January 1, 2020Recognised in profit and loss
accountRecognised in OCI At December 31,
2020
31 105Annual Report 2020
Notes to and forming part of the Unconsolidated Financial StatementsFor the year ended December 31, 2020

NOTES TO AND FORMING PART OF THE UNCONSOLIDATED FINANCIAL STATEMENTSFOR THE YEAR ENDED DECEMBER 31, 2020
Note 2020 201914. OTHER ASSETS
Income / mark-up accrued in local currency - net of provision 21,075,804 28,748,779 Income / mark-up accrued in foreign currencies - net of provision 2,117,215 2,515,758
14.1 23,193,019 31,264,537
Advance taxation - net of provision for taxation 14.2 5,921,083 19,595,118 Receivable from staff retirement fund 24,160 208,312 Receivable from other banks against telegraphic transfers and demand drafts 110,689 201,592 Unrealised gain on forward foreign exchange contracts 2,703,865 6,652,236 Rebate receivable - net 631,410 2,142,484 Unrealised gain on derivative financial instruments 24.2 - 15,216 Suspense accounts 51,215 349,099 Stationery and stamps on hand 169,311 287,313 Non-banking assets acquired in satisfaction of claims 241,683 1,040,517 Advances, deposits, advance rent and other prepayments 916,276 1,100,041 Acceptances 20 10,505,651 17,366,169 Dividend Receivable 217,974 51,626 Commission Receivable - Branchless Banking 658,524 650,685 Receviable against fraud & forgery and looted notes 586,929 590,120 Others 2,006,747 1,942,031
47,938,536 83,457,096 Provision held against other assets 14.3.3 (1,392,976) (1,271,877) Other assets - net of provisions 46,545,560 82,185,219
(Deficit) / surplus on revaluation of non-banking assets acquired insatisfaction of claims 22.3 & 14.3.2 (38,367) 11,341
Other assets - total 46,507,193 82,196,560
14.1
14.2
The income tax authorities have issued amended assessment orders for the tax years 2003 to 2019, and createdadditional tax demands (including disallowances of provisions made prior to Seventh Schedule) of Rs.11,610 million(2019: Rs.11,610 million), which have been fully paid as required under the law. The Bank has filed appeals before thevarious appellate forums against these amendments. Where the appellate authorities have allowed relief on certainissues, the assessing authorities have filed appeals before higher appellate forums. Where the appellate authorities havenot allowed relief, the Bank has filed appeals before higher appellate forums. The management of the Bank is confidentthat the appeals will be decided in favor of the Bank.
The tax returns for UAE, Yemen and Qatar branches have been filed upto the year ended December 31, 2019, under theprovisions of the laws prevailing in the respective countries, and are deemed as assessed unless opened forreassessment.
The Bank has received corrective tax assessment of Qatari Riyal (QAR) 1 million (Rs: 43.895 million) from the GeneralTax Authority (GTA) in respect of tax year 2004 with no supporting calculations from GTA. Management has requesteddetails for 2004 assessment from GTA, however, to date no response has been received. Management is confident thatthe matters will be decided in favour of the Bank and the possibility of any outcome against it is remote.
------- (Rupees in '000) -------
The Income Tax returns of the Bank have been filed up to the tax year 2020 (accounting year ended December 31,2019) and were deemed to be assessed under section 120 of the Income Tax Ordinance, 2001 (Ordinance).
This includes unrealised mark-up held in suspense amounting to Rs. 13,639.898 million (2019: Rs. 10,303.471 million)kept against non-performing overseas advances / investment as per the requirements of the regulatory authorities of therespective countries in which the overseas branches operate.
The tax returns for Azad Kashmir (AK) and Gilgit Baltistan (GB) Branches have been filed upto the tax year 2020(financial year 2019) under the provisions of section 120(1) read with section 114 of the Ordinance and in compliancewith the terms of the agreement between banks and the Azad Kashmir Council in May 2005. The returns filed areconsidered as deemed assessment orders under the law.
The tax authorities have also carried out monitoring for Federal Excise Duty, Sales tax and withholding taxes coveringperiod from year ended 2005 to 2019. Consequently, various addbacks and demands were raised creating a totaldemand of Rs. 1,274 million (2019: Rs. 889 million). The Bank has filed appeals against all such demands and isconfident that these would be decided in the favor of the Bank.
32United Bank Limited106
Notes to and forming part of the Unconsolidated Financial StatementsFor the year ended December 31, 2020

NOTES TO AND FORMING PART OF THE UNCONSOLIDATED FINANCIAL STATEMENTSFOR THE YEAR ENDED DECEMBER 31, 2020
2020 2019
14.3 Market value of Non-banking assets acquired in satisfaction of claims 203,316 1,051,858
14.3.1
2020 201914.3.2 Non-banking assets acquired in satisfaction of claims
Opening balance 1,051,858 1,542,423Additions - 82,500Revaluation (1,509) (7,821)Disposals (846,541) (525,649)Impairment (268) (39,595)Other adjustments (224) - Closing balance 203,316 1,051,858
14.3.3 Provision held against other assets
Advances and other receivables 84,272 84,272 Non-banking assets acquired in satisfaction of claims - 85,200 Fraud & forgery 626,435 639,141 Others 682,269 463,264
1,392,976 1,271,877
14.3.3.1 Movement in provision held against other assets
Opening balance 1,271,877 1,086,072 Exchange adjustments 655 3,093
Charge / (reversals)Charge for the year 249,664 326,647 Reversals for the year (94,809) (72,670)
154,855 253,977 Transfers in / (out) - net 3,245 (17,000) Amounts written off (37,656) (54,265) Closing balance 1,392,976 1,271,877
15. CONTINGENT ASSETS
There were no contingent assets as at the statement of financial position date.
16. BILLS PAYABLE
In Pakistan 28,820,012 22,500,509 Outside Pakistan 913,801 426,087
29,733,813 22,926,596
17. BORROWINGS
17.1 Particulars of borrowings
In local currency 119,309,820 138,128,878 In foreign currencies 9,677,595 16,355,122
128,987,415 154,484,000
------- (Rupees in '000) -------
------- (Rupees in '000) -------
During the current year, the valuation of non-banking assets acquired in satisfaction of the claims was carried out by M.J.Surveyors (Private) Limited from among the approved list of valuer of Pakistan Banker’s Association.
33 107Annual Report 2020
Notes to and forming part of the Unconsolidated Financial StatementsFor the year ended December 31, 2020

NOTES TO AND FORMING PART OF THE UNCONSOLIDATED FINANCIAL STATEMENTSFOR THE YEAR ENDED DECEMBER 31, 2020
17.2 Details of borrowings 2020 2019
SecuredBorrowings from the State Bank of Pakistan under:
Export refinance scheme 17.3 30,724,174 30,354,891 Refinance facility for modernization of SME 17.4 3,955 10,022 Long term financing facility 17.5 22,243,644 22,959,023 Refinance scheme for payment of wages and salaries 17.6 5,587,037 - Renewable energy scheme 17.7 146,985 - Other borrowings 17.8 768,206 -
59,474,001 53,323,936
Repurchase agreement borrowings 17.9 59,835,819 67,233,660 Bai Muajjal payable to other financial institutions - 13,812,921
119,309,820 134,370,517 Unsecured Call borrowings 17.10 2,397,485 4,680,579 Overdrawn nostro accounts 356,029 588,275 Money market deals 17.11 6,924,081 14,844,629
9,677,595 20,113,483
128,987,415 154,484,000
17.3
17.4
17.5
17.6
17.7
17.8
17.9
17.10
17.11
------- (Rupees in '000) -------
These borrowings carry mark-up at rates ranging from 1.86% to 3.50% (2019: 3.21% to 4.20%) per annum, and arerepayable latest by June 2021.
These are unsecured borrowings carrying mark-up at the rate of 1.50% (2019: 1.75% to 12.52%) per annum, and arerepayable latest by March 2021.
The Bank has entered into an agreement with the SBP for extending export finance to customers. As per the terms of theagreement, the Bank has granted the SBP the right to recover the outstanding amounts from the Bank at the date ofmaturity of the finances by directly debiting the Bank's current account maintained with the SBP. These borrowings arerepayable within six months, latest by June 2021. These carry mark-up at rates ranging from 1.00% to 2.00% (2019:1.00% to 2.00%) per annum.
These borrowings have been obtained from the SBP under a scheme to finance modernization of Small and MediumEnterprises by providing financing facilities for setting up of new units, purchase of new plant and machinery forBalancing, Modernization and Replacement (BMR) of existing units and financing for import / local purchase of newgenerators upto a maximum capacity of 500 KVA. These borrowings are repayable latest by February 2022 and carrymark-up at rates of 6.00% (2019: 5.00%) per annum.
These borrowings have been obtained from the SBP for providing financing facilities to exporters for adoption of newtechnologies and modernization of their plant and machinery. These borrowings are repayable latest by April 2030.These carry mark-up at rates ranging from 2.00% to 9.70% (2019: 2.00% to 9.70%) per annum.
These repurchase agreement borrowings are secured against Pakistan Investment Bonds and Market Treasury Bills andcarry mark-up at rates ranging from 6.05% to 7.00% per annum (2019: 13.20% to 13.29% per annum). These borrowingsare repayable latest by January 2021. The market value of securities given as collateral against these borrowings isgiven in note 9.2.1.
In order to dampen effects of COVID-19, the State Bank of Pakistan has introduced conventional and islamic temporaryrefinance schemes for payment of wages and salaries to the workers and employees of the business concerns. Theseborrowings are repayable latest by January 2023. These carry mark-up / profit at rates ranging from 0.00% to 2.00% perannum.
These borrowings have been obtained from the SBP for providing financing facilities to address challenges of energyshortage and climate change through promotion of renewable energy. These borrowings are repayable latest by October2026. These carry mark-up at rates ranging from 3.00% to 4.00% per annum.
These represent borrrowings against refinance facility for combatting COVID-19, and temporary economic refinancefacilities amounting to Rs. 460.666 million and Rs. 307.540 million respectively. These borrowing are repayable latest byJune 2025 and June 2021 respectively and carry markup at the rates of 0.00% and 1.00% per annum respectively.
34United Bank Limited108
Notes to and forming part of the Unconsolidated Financial StatementsFor the year ended December 31, 2020

NOTES TO AND FORMING PART OF THE UNCONSOLIDATED FINANCIAL STATEMENTSFOR THE YEAR ENDED DECEMBER 31, 2020
18. DEPOSITS AND OTHER ACCOUNTS
In Local Currency
In Foreign Currencies Total In Local
CurrencyIn Foreign Currencies Total
CustomersFixed deposits 171,340,589 123,785,587 295,126,176 141,228,719 172,661,074 313,889,793Savings deposits 509,712,356 48,079,084 557,791,440 450,464,549 33,040,464 483,505,013Sundry deposits 5,022,037 1,750,251 6,772,288 12,592,638 848,530 13,441,168Margin deposits 3,833,926 3,164,625 6,998,551 2,825,918 2,931,103 5,757,021Current accounts - remunerative 1,387,144 5,240,221 6,627,365 1,799,190 6,026,771 7,825,961Current accounts - non-remunerative 549,419,858 111,464,961 660,884,819 449,956,720 100,687,793 550,644,513
1,240,715,910 293,484,729 1,534,200,639 1,058,867,734 316,195,735 1,375,063,469Financial InstitutionsCurrent deposits 20,978,533 1,941,161 22,919,694 26,897,943 1,873,591 28,771,534Savings deposits 56,409,524 42,544 56,452,068 36,132,073 25,334 36,157,407Term deposits 25,207,956 1,431,544 26,639,500 25,783,802 1,287,249 27,071,051
102,596,013 3,415,249 106,011,262 88,813,818 3,186,174 91,999,992
1,343,311,923 296,899,978 1,640,211,901 1,147,681,552 319,381,909 1,467,063,461
2020 201918.1 Composition of deposits
- Individuals 922,086,776 811,943,941 - Government (Federal and Provincial) 96,121,321 68,423,153 - Public Sector Entities 114,365,057 93,001,261 - Banking Companies 10,955,775 33,125,891 - Non-Banking Financial Institutions 95,055,487 58,874,101 - Private Sector 401,627,485 401,695,114
1,640,211,901 1,467,063,461
19. SUBORDINATED DEBT
Salient features of the ADT 1 issue are as follows:-
2020 2019
Issue Size
Unsecured Rating
This includes deposits eligible to be covered under insurance arrangements in accordance with DPC Circular No. 04 datedJune 22, 2018, amounting to Rs. 991,687.959 million (2019: Rs. 854,722.801 million).
The Bank has issued fully paid up, rated, listed, perpetual, unsecured, subordinated, non-cumulative and contingentconvertible debt instruments in the nature of Term Finance Certificates (TFCs) under Section 66 of the Companies Act,2017 which qualify as Additional Tier I Capital as outlined by State Bank of Pakistan (SBP) under BPRD Circular No. 6dated August 15, 2013.
“AA+” (Double A Plus) by VIS Credit Rating Company Limited
Rs. 10,000 million
------- (Rupees in '000) -----
------------------------------------------------------------------------- (Rupees in '000) ------------------------------------------------------------------------
Issue Date January 29, 2019
Mark-up rate The TFCs shall carry mark-up at the rate of 3 Month KIBOR + 1.55%.
Tenor Perpetual (i.e. no fixed or final redemption date)
Security
Loss absorbency clause
Lock-in clause
Call option
Mark-up payment frequency Profit / Mark-up shall be payable quarterly in arrears, on a non-cumulative basis.The Bank may, at its sole discretion, call the TFCs, at any time after five years from the Issue Date subject to theprior approval of the SBP.Mark-up on the TFCs shall only be paid from the current year's earnings and if the Bank is fully compliant withSBP’s Minimum Capital Requirement (MCR), Capital Adequacy Ratio (CAR) and Liquidity Ratio (LR) requirements.The TFCs shall, at the discretion of the SBP, be either permanently converted into ordinary shares or permanentlywritten off (partially or in full) pursuant to the loss absorbency clause as stipulated in the “Instructions for Basel IIIImplementation in Pakistan” issued vide BPRD Circular No. 6 dated August 15, 2013.
35109Annual Report 2020
Notes to and forming part of the Unconsolidated Financial StatementsFor the year ended December 31, 2020

NOTES TO AND FORMING PART OF THE UNCONSOLIDATED FINANCIAL STATEMENTSFOR THE YEAR ENDED DECEMBER 31, 2020
Note 2020 2019
20. OTHER LIABILITIES
Mark-up / return / interest payable in local currency 11,628,846 8,964,301 Mark-up / return / interest payable in foreign currencies 1,306,907 2,142,257
12,935,753 11,106,558 Accrued expenses 4,052,238 3,969,499 Branch adjustment account 105,228 227,950 Deferred income 882,954 367,158 Unearned commission and income on bills discounted 437,621 847,295 Provision against off - balance sheet obligations 20.1 1,065,233 622,264 Unrealised loss on forward foreign exchange contracts 3,318,593 6,962,186 Trading liability - 6,120,767 Payable to staff retirement fund 1,122,023 725,619 Deferred liabilities 20.2 3,752,247 3,743,711 Unrealised loss on derivative financial instruments 24.2 - 18,155 Workers' Welfare Fund payable 4,700,490 3,835,534 Liabilities against ATM settlement 1,199,242 1,308,571 Insurance payable against consumer assets 615,406 449,263 Dividend payable 357,578 538,884
Acceptances 14 10,505,651 17,366,169
Charity fund balance 2,827 3,494
Lease liability 20.3 7,776,503 7,761,350 Levies and taxes payable 2,666,232 2,700,232 Others 1,081,458 557,763
56,577,277 69,232,422
20.1 Provision against off-balance sheet obligations
Opening balance 622,264 833,397 Exchange adjustments 11,220 81,237
Charge for the year 568,987 288,288 Reversals for the year (137,238) (240,850)
33 431,749 47,438 Transfer out - (339,808) Closing balance 1,065,233 622,264
20.2 Deferred liabilities
Provision for post retirement medical benefits 38.5 2,028,687 1,950,906 Provision for compensated absences 954,555 1,037,908 Deferred liability for outsourced services 228,006 272,635 Deferred liability - overseas 540,999 482,262
3,752,247 3,743,711
20.3 The total cash outflow for leases during the year was Rs. 2,174.025 million (2019: Rs. 2,179.971 million).
------- (Rupees in '000) -------
36United Bank Limited110
Notes to and forming part of the Unconsolidated Financial StatementsFor the year ended December 31, 2020

NOTES TO AND FORMING PART OF THE UNCONSOLIDATED FINANCIAL STATEMENTSFOR THE YEAR ENDED DECEMBER 31, 2020
21. SHARE CAPITAL
21.1 Authorised Capital
2020 2019 2020 2019
2,000,000,000 2,000,000,000 Ordinary shares of Rs. 10 each 20,000,000 20,000,000
21.2 Issued, subscribed and paid-up capital
2020 2019 2020 2019
Fully paid-up ordinary shares of Rs. 10 each518,000,000 518,000,000 Issued for cash 5,180,000 5,180,000 706,179,687 706,179,687 Issued as bonus shares 7,061,797 7,061,797
1,224,179,687 1,224,179,687 12,241,797 12,241,797
21.3
21.4 Major shareholders (holding more than 5% of total paid-up capital)
Number of Percentage of Number of Percentage ofName of shareholder shares held shareholding shares held shareholdingBestway (Holdings) Limited 631,728,895 51.60% 631,728,895 51.60%Bestway Cement Limited 93,649,744 7.65% 93,649,744 7.65%
2020 201921.5 Shares of the Bank held by its associates
UBL Financial Sector Fund 1,616,986 479,400
Note 2020 201922. SURPLUS ON REVALUATION OF ASSETS
Surplus arising on revaluation of assets Available for sale securities 22.1 4,352,348 1,071,315 Fixed assets 22.2 25,630,817 25,872,298 Non-banking assets acquired in satisfaction of claims 22.3 1,496 50,936
29,984,661 26,994,549 Less: Deferred tax liability on revaluation of:Available for sale securities 22.1 1,697,416 417,813 Fixed assets 22.2 646,083 719,728 Non-banking assets acquired in satisfaction of claims 22.3 583 19,865
2,344,082 1,157,406 27,640,579 25,837,143
In 2007, the Bank was admitted to the official list of the UK Listing Authority and to the London Stock ExchangeProfessional Securities Market for trading of Global Depository Receipts (GDRs), each representing four ordinary sharesissued by the Bank. The GDRs constitute an offering in the United States only to qualified institutional buyers in relianceon Rule 144A under the U.S Securities Act of 1933 and an offering outside the United States in reliance on Regulation S.
(Number of shares) ------- (Rupees in '000) -------
------- (Rupees in '000) -------(Number of shares)
------- (Rupees in '000) -------
------- (Number of shares) -------
2019
Holders of GDRs are entitled, subject to the provisions of the depository agreement, to receive dividends, if any, and rankpari passu with other equity shareholders in respect of such entitlement. However, the holders of GDRs have no votingrights or other direct rights of shareholders with respect to the ordinary shares underlying such GDRs. Subject to the termsand restrictions set out in the offering circular dated June 25, 2007, the deposited ordinary shares in respect of which theGDRs were issued may be withdrawn by the GDR holders from the depository facility. Upon withdrawal, the holders willrank pari passu with other ordinary shareholders in respect of voting powers. As at December 31, 2020, 242,278 (2019:248,067) GDRs, representing 969,112 (2019: 992,268) shares were in issue.
2020
As at December 31, 2020, Bestway Group (Bestway) held 61.48% (2019: 61.48%) shareholding (including GDRs) of theBank.
37111Annual Report 2020
Notes to and forming part of the Unconsolidated Financial StatementsFor the year ended December 31, 2020

NOTES TO AND FORMING PART OF THE UNCONSOLIDATED FINANCIAL STATEMENTSFOR THE YEAR ENDED DECEMBER 31, 2020
Note 2020 2019
22.1 Surplus / (deficit) on revaluation of available for sale securities
Market Treasury Bills 238,363 149,496 Pakistan Investment Bonds - fixed 333,950 (8,446,273) Pakistan Investment Bonds - floaters (2,569,332) 1,772,076 Ordinary shares and mutual fund 2,496,134 3,202,927 REIT Investment (16,676) 62,118 Term Finance Certificates, Sukuks, other bonds etc. (50,261) 23,973 Foreign bonds 3,920,170 4,306,998
9.1 4,352,348 1,071,315 Related deferred tax liability 1,697,416 417,813
2,654,932 653,502
22.2 Surplus on revaluation of fixed assets
Surplus on revaluation of fixed assets as at January 1 25,872,298 26,218,945
Reversal of revaluation against fixed assets during the year - - Realised on disposal during the year (162,824) (263,135) Exchange adjustments 6,413 4,840 Transferred to unappropriated profit in respect of incremental
depreciation charged during the year - net of deferred tax (51,893) (53,895) Related deferred tax liability on incremental depreciation charged
during the year (33,177) (34,457) (241,481) (346,647)
25,630,817 25,872,298 Less: Related deferred tax liability on
Revaluation as at January 1 719,728 667,022 Surplus realised on disposal of fixed assets during the year (46,478) (826) Impact of change of deferred tax rate - 77,907 Reversal of revaluation against fixed assets during the year - - Exchange adjustments 6,010 10,082 Incremental depreciation charged on related assets (33,177) (34,457)
646,083 719,728
24,984,734 25,152,570
22.3 Surplus on revaluation of non-banking assets
Surplus on revaluation of non-banking assets as at January 1 50,936 173,141
Revaluation of non-banking assets during the year (1,509) (7,821) Realised on disposal during the year (47,931) (114,384)
(49,440) (122,205) 1,496 50,936
Less: Related deferred tax liability onRevaluation as at January 1 19,865 67,285 Revaluation of non-banking assets during the year (588) (3,050) Surplus realised on disposal of non-banking assets during the year (18,694) (44,370)
583 19,865
913 31,071
------- (Rupees in '000) -------
38
United Bank Limited112
Notes to and forming part of the Unconsolidated Financial StatementsFor the year ended December 31, 2020

NOTES TO AND FORMING PART OF THE UNCONSOLIDATED FINANCIAL STATEMENTSFOR THE YEAR ENDED DECEMBER 31, 2020
Note 2020 2019
23. CONTINGENCIES AND COMMITMENTS
Guarantees 23.1 147,936,161 170,495,301Commitments 23.2 891,767,423 1,206,093,067Other contingent liabilities 23.3 15,539,628 15,075,981
1,055,243,212 1,391,664,34923.1 Guarantees:
Financial guarantees 43,027,825 41,184,047Performance guarantees 104,908,336 129,311,254
147,936,161 170,495,30123.2 Commitments:
Documentary credits and short-term trade-related transactions- letters of credit 137,787,140 148,263,814
Commitments in respect of:- forward foreign exchange contracts 23.2.2 635,597,333 910,616,840- forward government securities transactions 23.2.3 - 14,307,720- derivatives 23.2.4
Interest rate swaps - 316,500FX options - 122,594
- forward lending 23.2.5 115,451,442 130,389,022- operating leases 23.2.6 55,009 38,278
Commitments for acquisition of:- Fixed assets 23.2.7 2,876,499 2,031,196
- Intangible assets 23.2.7 - 7,103
891,767,423 1,206,093,06723.2.1 Commitments to extend credit
2020 201923.2.2 Commitments in respect of forward foreign exchange contracts
Purchase 342,792,602 482,798,387
Sale 292,804,731 427,818,453
23.2.3 Commitments in respect of forward government securities transactions
Purchase - 3,043,541
Sale - 11,264,179
23.2.4 Commitments in respect of derivatives
Interest rate swaps - 316,500
FX options - purchased - 61,297
FX options - sold - 61,297
------- (Rupees in '000) -------
The Bank makes commitments to extend credit in the normal course of its business but these being revocablecommitments do not attract any significant penalty or expense if the facility is unilaterally withdrawn.
------- (Rupees in '000) -------
39113Annual Report 2020
Notes to and forming part of the Unconsolidated Financial StatementsFor the year ended December 31, 2020

NOTES TO AND FORMING PART OF THE UNCONSOLIDATED FINANCIAL STATEMENTSFOR THE YEAR ENDED DECEMBER 31, 2020
Note 2020 2019
23.2.5 Commitments in respect of forward lending
Undrawn formal standby facilities, credit lines and other commitments to lend 23.2.5.1 57,591,623 71,503,628
Others 57,859,819 58,885,394115,451,442 130,389,022
23.2.5.1
2020 201923.2.6 Commitments in respect of operating leases
Not later than one year 50,579 31,887 Later than one year and not later than five years 4,197 3,136 Later than five years 233 3,255
55,009 38,278
23.2.7 Commitments in respect of capital expenditure 2,876,499 2,038,299
23.3 Other contingencies
23.3.1 Claims against the Bank not acknowledged as debts 11,450,325 10,986,678
23.3.2
23.3.3 For contingencies relating to taxation, refer note 14.2.
24. DERIVATIVE INSTRUMENTS
Derivatives are a type of financial contract, the value of which is determined by reference to one or more underlyingassets or indices. The major categories of such contracts include forwards, futures, swaps and options. Derivatives alsoinclude structured financial products that have one or more of the characteristics of forwards, futures, swaps and options.
The Bank, as an Authorised Derivative Dealer (ADD), is an active participant in the Pakistan derivatives market and offersa wide variety of derivatives products covering both hedging and market making to satisfy customers’ needs. Whererequired, specific approval is sought from the SBP for each transaction.
The authority for approving policies lies with the Board of Directors (BoD) and the Board Risk and Compliance Committee(BRCC). The Risk Management Committee (RMC) is responsible for ensuring compliance with these policies.
These mainly represent counter claims filed by the borrowers for restricting the Bank from disposal of assets (such asmortgaged / pledged assets kept as security).
Based on legal advice and / or internal assessments, management is confident that the matters will be decided in theBank's favour and the possibility of any outcome against the Bank is remote and accordingly no provision has been madein these financial statements.
During 2016, penalties amounting to Rs. 4.089 billion were levied by the FE Adjudication Court of the State Bank ofPakistan relating to alleged contraventions of the requirements of foreign exchange regulations with respect to issuanceand certification of E-Forms by the Bank to certain customers (exporters) who failed to submit the export documents thereagainst. Consequently, foreign exchange on account of export proceeds have not been repatriated. The Bank maintainsthat it fully discharged its liability, in accordance with the law and has filed a civil suit in the High Court of Sindhchallenging the levy of the penalty. The High Court has granted a stay on action being taken against the Bank. Themanagement, based on the advice from legal counsel, is confident that the view of the Bank will prevail and the Bank willnot be exposed to any loss on this account.
------- (Rupees in '000) -------
------- (Rupees in '000) -------
These represent commitments that are irrevocable because they cannot be withdrawn at the discretion of the Bankwithout the risk of incurring significant penalty or expense.
40
United Bank Limited114
Notes to and forming part of the Unconsolidated Financial StatementsFor the year ended December 31, 2020

NOTES TO AND FORMING PART OF THE UNCONSOLIDATED FINANCIAL STATEMENTSFOR THE YEAR ENDED DECEMBER 31, 2020
With regard to derivatives, the RMC is authorised to:
-
- Review the Derivatives Business Policy and recommend approval to the BRCC / BoD.
- Review and approve derivatives product programs.
- Authorise changes in procedures and processes regarding derivatives and structured products.
Derivatives risk management
There are a number of risks undertaken by the Bank, which need to be monitored and assessed.
Credit risk
Market risk
Liquidity risk
Derivatives transactions, usually being non-funded in nature, do not carry a specific funding liquidity risk.
Operational risk
Review the derivatives business with reference to market risk exposure and assign various limits in accordance withthe risk appetite of the Bank.
Overall responsibility for derivatives trading activity lies with the Treasury and Capital Markets Group. Measurement andmonitoring of market and credit risk exposure and limits and its reporting to senior management and the BoD is done byTreasury Middle Office (TMO), which also coordinates with the business regarding approvals for derivatives risk limits.Treasury Operations records derivatives activity in the Bank’s books, and handles its reporting to the SBP.
The staff involved in the trading, settlement and risk management of derivatives is carefully trained to deal with thecomplexities involved in the process. Adequate systems and controls are in place to carry out derivatives transactionssmoothly. Each transaction is processed in accordance with the product program or a transaction memo, which containsdetailed guidance on the accounting and operational aspects of the transaction to further mitigate operational risk. Inaddition, TMO and the Compliance and Control Department are assigned the responsibility of monitoring any deviationfrom policies and procedures. The Bank’s Audit and Inspection Group also reviews this function, with a regular review ofsystems, transactional processes, accounting practices and end-user roles and responsibilities.
The Bank uses FX and Derivatives module of Treasury System which provides an end-to-end valuation solution, supportsthe routine transactional process and provides analytical tools to measure various risk exposures, carry out stress testsand sensitivity analysis.
TMO produces various reports on a periodic basis which are reviewed by senior management. These reports providedetails of the derivatives business profile such as outstanding positions, profitability, risk exposures and the status ofcompliance with limits.
Credit risk refers to the risk of non-performance or default by a party to a derivatives transaction, resulting in an adverseimpact on the Bank’s profitability. Credit risk associated with derivatives transactions is categorized into settlement riskand pre-settlement risk. Credit proposals for derivatives transactions are approved by the Credit Committee. The creditexposure of each counterparty is estimated and monitored against approved counterparty limits by TMO on a daily basis.
The liquidity risk arises from the fact that in Pakistan, interest rate derivatives generally have a uni-directional demand,and no perfect hedge is available. The Bank mitigates its risk by limiting the portfolio in terms of tenor, notional andsensitivity limits, and can also hedge its risk by taking on and off balance sheet positions in the interbank market, whereavailable.
The Bank, as a policy, hedges back-to-back all options transactions. In addition, the Bank does not carry any exchangerisk on its Cross Currency Swaps portfolio as it hedges the exposure in the interbank market. To manage the interest raterisk of Interest Rate Derivatives, the Bank has implemented various limits which are monitored and reported by TMO on adaily basis.
41115Annual Report 2020
Notes to and forming part of the Unconsolidated Financial StatementsFor the year ended December 31, 2020

NOTES TO AND FORMING PART OF THE UNCONSOLIDATED FINANCIAL STATEMENTSFOR THE YEAR ENDED DECEMBER 31, 2020
24.1 Product analysis
Counterparties
With banks for Hedging - - - - - - - - - - Market making - - - - - - - - - -
- - - - - - - - - - With FIs other than Banks Hedging - - - - - - - - - - Market making - - - - - - - - - -
- - - - - - - - - - With other entities Hedging - - - - - - - - - - Market making - - - - - - - - - -
- - - - - - - - - - Total Hedging - - - - - - - - - - Market making - - - - - - - - - -
- - - - - - - - - -
Counterparties
With banks for Hedging - - 61,297 - - - - - 61,297 - Market making 316,500 (17,107) - - - - 9,223,670 14,850 9,540,170 (2,257)
316,500 (17,107) 61,297 - - - 9,223,670 14,850 9,601,467 (2,257)With FIs other than Banks Hedging - - - - - - - - - - Market making - - - - - - 1,763,180 (488) 1,763,180 (488)
- - - - - - 1,763,180 (488) 1,763,180 (488)With other entities Hedging - - - - - - - - - - Market making - - 61,297 - 3,042,465 (94) 273,596 (100) 3,377,358 (194)
- - 61,297 - 3,042,465 (94) 273,596 (100) 3,377,358 (194)Total Hedging - - 61,297 - - - - - 61,297 - Market making 316,500 (17,107) 61,297 - 3,042,465 (94) 11,260,446 14,262 14,680,708 (2,939)
316,500 (17,107) 122,594 - 3,042,465 (94) 11,260,446 14,262 14,742,005 (2,939)
------------------------------------- (Rupees in '000) ------------------------------------------------------
2020
Forward purchase contracts of
government securities
Forward sale contracts of government
securitiesTotal
Mark to market gain / (loss)
Interest rate swaps FX options
Mark to market gain / (loss)
Mark to market gain / (loss)
2019
Interest rate swaps FX optionsForward purchase
contracts of government securities
Forward sale contracts of government
securitiesTotal
Notional principal
Notional principal
Notional principal
Notional principal
Notional principal
Mark to market gain / (loss)
Mark to market gain / (loss)
------------------------------------- (Rupees in '000) ------------------------------------------------------
Notional principal
Mark to market gain / (loss)
Notional principal
Mark to market gain / (loss)
Notional principal
Mark to market gain / (loss)
Notional principal
Mark to market gain / (loss)
Notional principal
Mark to market gain / (loss)
42
United Bank Limited116
Notes to and forming part of the Unconsolidated Financial StatementsFor the year ended December 31, 2020

NOTES TO AND FORMING PART OF THE UNCONSOLIDATED FINANCIAL STATEMENTSFOR THE YEAR ENDED DECEMBER 31, 2020
24.2 Maturity analysis of derivatives
Upto 1 month - - - - - 1 to 3 months - - - - - 3 to 6 months - - - - - 6 months to 1 year - - - - - 1 to 2 years - - - - - 2 to 3 years - - - - -
- - - - -
Upto 1 month 13 14,425,505 (1,048) 15,216 14,168 1 to 3 months - - - - - 3 to 6 months - - - - - 6 months to 1 year 1 316,500 (17,107) - (17,107) 1 to 2 years - - - - - 2 to 3 years - - - - -
14 14,742,005 (18,155) 15,216 (2,939)
2020 2019
25. MARK-UP / RETURN / INTEREST EARNED
Loans and advances 52,047,111 66,213,054 Investments 96,870,108 80,448,836 Lendings to financial institutions 2,481,197 5,648,897 Balances with banks 604,794 1,365,577
152,003,210 153,676,364
26. MARK-UP / RETURN / INTEREST EXPENSED
On deposits 60,642,133 66,495,475 On borrowings 11,066,917 18,240,740 On subordinated debt 1,099,595 1,339,041 Cost of foreign currency swaps against foreign currency deposits / borrowings 3,310,675 4,762,527 On lease liability against right of use assets 924,718 1,064,085
77,044,038 91,901,868
2020
----------------------------------- (Rupees in '000) --------------------------------
2019
No. of contracts
Notional principal
------- (Rupees in '000) -------
Positive Net
----------------------------------- (Rupees in '000) --------------------------------
Remaining maturity
Remaining maturity
Mark to Market
Negative Positive Net
No. of contracts
Notional principal
Mark to Market
Negative
43
117Annual Report 2020
Notes to and forming part of the Unconsolidated Financial StatementsFor the year ended December 31, 2020

NOTES TO AND FORMING PART OF THE UNCONSOLIDATED FINANCIAL STATEMENTSFOR THE YEAR ENDED DECEMBER 31, 2020
Note 2020 2019
27. FEE AND COMMISSION INCOME
Branch banking customer fees 1,637,366 1,978,120 Consumer finance related fees 877,273 983,099 Card related fees (debit and credit cards) 1,585,012 1,617,440 Investment banking fees 329,561 390,261 Financial Institution rebate / commission 280,324 298,616 Corporate service charges / facility fee 410,214 644,616 Commission on trade 593,785 935,736 Commission on guarantees 750,871 555,131 Commission on cash management 846,302 783,970 Commission on remittances including home remittances - net 2,164,305 2,949,489 Commission on bancassurance 1,170,790 1,612,583 Commission on Benazir Income Support Program 38,145 609,932 Rent on lockers 189,943 93,182 Others 223,581 334,350
11,097,472 13,786,525
28. GAIN ON SECURITIES - NET
Realised 28.1 411,212 9,585 Unrealised - held for trading 9.1 228 (7,386)
411,440 2,199
28.1 Realised gain on:
Federal Government securities (902,322) 858,203 Shares 671,556 (1,014,879) Foreign securities 643,520 173,256 Other securities (1,542) (6,995)
411,212 9,585
29. OTHER INCOME
Charges recovered 223,827 288,806Rent on properties 52,556 49,121Gain on sale of operating fixed assets - net 74,202 80,073Gain on sale of associate - 75,294Gain on sale of Ijarah assets - net 792 861Gain / (loss) on disposal of non-banking assets - net 29.1 191,559 (54,649)Gain / (loss) on trading liabilities - net 101,445 (13,639)Realisation of exchange translation reserve - UBL New York branch - 1,332,626
644,381 1,758,493
29.1 Gain / (loss) on disposal of Non-banking assets acquired in satisfaction of claims
Disposal proceeds 1,038,100 471,000
Less: - Cost 798,610 411,265 - Surplus 47,931 114,384
846,541 525,649
Net gain / (loss) 191,559 (54,649)
------- (Rupees in '000) -------
44
United Bank Limited118
Notes to and forming part of the Unconsolidated Financial StatementsFor the year ended December 31, 2020

NOTES TO AND FORMING PART OF THE UNCONSOLIDATED FINANCIAL STATEMENTSFOR THE YEAR ENDED DECEMBER 31, 2020
Note 2020 2019
30. OPERATING EXPENSES
Total compensation expense 30.1 15,553,886 14,601,683
Property expenseRent and taxes 30.8 1,057,354 1,157,370Insurance 221,312 189,536Utilities cost 1,450,761 1,734,152Security 1,016,246 987,716Repairs and maintenance 145,890 237,080Depreciation 807,785 774,844Depreciation - right-of-use assets 11.2 1,655,038 2,097,081Others 30,820 30,490
6,385,206 7,208,269Information technology expensesSoftware maintenance 1,506,845 1,319,860Hardware maintenance 323,173 215,741Depreciation 824,627 743,096Amortisation 12.1 793,562 645,869Network charges 708,200 696,415
4,156,407 3,620,981Other operating expensesDirectors' fees and allowances 86,200 96,075Fees and allowances to Shariah Board 9,544 6,855Legal and professional charges 606,089 1,126,854Commission paid to branchless banking agents 356,060 1,031,746Commission paid to sales force 1,235,330 1,500,302Outsourced service costs 1,331,632 1,283,916Travelling and conveyance 145,073 263,022Clearing charges 225,278 216,365Depreciation - others 1,200,563 1,192,012Depreciation on Islamic financing against leased assets 216,195 227,783Training and development 93,677 162,773Postage and courier charges 305,077 396,138Communication 453,795 477,423Stationery and printing 952,771 708,224Marketing, advertisement and publicity 570,878 760,285Donations 30.6 341,986 128,723Auditors' remuneration 30.7 85,269 80,095Insurance 212,152 134,031Deposit Protection Premium 1,367,556 1,302,279Cash transportation and sorting charges 798,446 811,290Entertainment 142,043 164,713Vehicle expenses 91,013 108,291Subscription 114,702 101,953Office running expenses 177,247 179,485Banking service charges 1,650,142 1,748,962Repairs and maintenance 600,845 510,094Miscellaneous expenses 595,540 58,240
13,965,103 14,777,92940,060,602 40,208,862
------- (Rupees in '000) -------
45119Annual Report 2020
Notes to and forming part of the Unconsolidated Financial StatementsFor the year ended December 31, 2020

NOTES TO AND FORMING PART OF THE UNCONSOLIDATED FINANCIAL STATEMENTSFOR THE YEAR ENDED DECEMBER 31, 2020
Note 2020 2019
30.1 Total compensation expense
Fees and Allowances etc 2,614,509 2,599,093Managerial Remunerationi) Fixed 6,207,016 5,768,656ii) Variable - Cash Bonus / Awards etc. 30.2 972,579 930,115Charge for defined benefit plan 567,778 550,201Contribution to defined contribution plan 364,906 327,037Charge for compensated absenses 70,902 33,383Rent & house maintenance 2,271,681 2,086,193Utilities 1,217,620 1,119,158Medical 762,605 774,883Conveyance 321,206 310,700Group assurance premium 64,018 71,223Others 66 - Sub-total 15,434,886 14,570,642Sign-on Bonus 30.3 119,000 - Severance Allowance 30.4 - 31,041Grand Total 15,553,886 14,601,683
30.2
30.3
30.4
30.5
The material outsourcing arrangements along with their nature of services are as follows:
Name of service provider Type of service 2020 2019
Paradise Press (Private) Limited Cheque printing 40,699 40,652Apex Printry (Private) Limited Cheque printing 45,096 43,254Printlink Cheque printing 40,890 37,140ASC First Solution (Private) Limited Digital & phsyical archiving of accounts
opening forms and customer records 5,764 7,302Wackenhut Pakistan (Private) Limited Off-site ATM cash replinshment 1,098 - Raaziq International Storage and archiving service for
accounts opening forms 14,418 13,254Qadri Enterprises Key Punch 9,710 10,065TCS (private) Limited Statement of account prinitng
and dispatching 73,083 77,888
This includes accrual of employee benefits in the form of awards / bonus to all permanent staff including the ChiefExecutive Officer and is determined on the basis of employees' evaluation and the Bank's performance during the year.The aggregate benefit determined in respect of all permanent staff amounted to Rs. 1,546.639 million (2019:Rs.1,242.046 million).
------- (Rupees in '000) -------
No sign-on bonus was paid to employees including Material Risk Contollers (MRCs) and Material Risk Takers (MRTs)during the years ended December 31, 2020 and 2019.
------- (Rupees in '000) -------
Total cost for the year included in other operating expenses relating to outsourced activities is Rs. 1,562.759 million(2019: Rs. 4,044.555 million). This cost includes outsourced service costs, which are disclosed specifically in note 30. Ofthe total cost of Rs. 1,562.759 million (2019: Rs. 4,044.555 million), Rs. 1,246.759 million (2019: Rs. 3,653.555 million)pertains to the payment to companies incorporated in Pakistan and Rs. 316 million (2019: Rs. 391 million) pertains topayment to companies incorporated outside Pakistan. This includes payments other than outsourced services costs,which are disclosed above. Total cost of outsourced activities for the year given to related parties is nil (2019: nil).Outsourcing shall have the same meaning as specified in Annexure-I of BPRD Circular No. 06 of 2017.
Severance allowance is paid to nil (2019: 10) employees. No severance allowance was paid to MRCs and MRTs duringthe years ended December 31, 2020 and 2019.
46
United Bank Limited120
Notes to and forming part of the Unconsolidated Financial StatementsFor the year ended December 31, 2020

NOTES TO AND FORMING PART OF THE UNCONSOLIDATED FINANCIAL STATEMENTSFOR THE YEAR ENDED DECEMBER 31, 2020
30.6 Details of donations 2020 2019
Donations individually exceeding Rs.0.5 millionPMs COVID-19 Pandemic Relief Fund – 2020 100,000 - Namal Educational Foundation 95,000 - Abdul Sattar Edhi Foundation 43,000 33,000 Shaukat Khanum Memorial Trust 33,000 33,000 Saylani Welfare International Trust 25,000 - Noor International 11,200 - Sahara for Life Trust 10,000 10,000 Lahore University of Management Sciences 10,000 10,000 Shalamar Hospital 5,000 5,000 Forman Christian College 5,000 5,000 IBA - National Talent Hunt Program 3,436 3,880 Marie Adelaide Leprosy Center 850 850 SOS Children's Village Pakistan - 9,980 Bahauddin Zakariya University - 3,840 The Citizens Foundation - 2,800 Zindagi Trust - 2,500 Center of Excellence in Journalism (IBA) - 2,000 Kashmir Education Foundation - 1,710 Nasra Schools - 1,482 People’s Primary Healthcare Initiative - 1,300 Chal Foundation - 1,000 Hisaar Foundation - 1,000 Donations individually not exceeding Rs. 0.5 million 500 381
341,986 128,723
30.6.1 Donations were not made to any donee in which a Director or his spouse had any interest.
30.7 Auditors' remunerationA. F. Ferguson Overseas
& Co. Auditors------------------------- (Rupees in '000) ------------------
Audit fee 12,393 47,063 59,456 Fee for tax and other certifications 12,214 - 12,214 Out of pocket expenses 6,696 2,157 8,853 Consultancy and other services 4,746 - 4,746
36,049 49,220 85,269
A. F. Ferguson Overseas & Co. Auditors
Audit fee 11,340 48,050 59,390 Fee for tax and other certifications 11,498 888 12,386 Out of pocket expenses 6,087 254 6,341 Consultancy and other services 1,978 - 1,978
30,903 49,192 80,095
30.8
31. WORKERS' WELFARE FUND
Total
------- (Rupees in '000) -------
This includes expense in respect of short term leases, low value assets and expenses relating to variable lease paymentsnot included in lease liabilites amounting to Rs. 24.687 million (2019: Rs. 29.312 million), Rs. 0.007 million (2019: Rs.0.007 million) and nil (2019: nil) respectively.
2020
2019
------------------------- (Rupees in '000) ------------------
Total
The Bank has made provision for Sindh Workers' Welfare Fund (SWWF) based on profit for the years ended December31, 2014, and onwards. The Sindh Workers' Welfare Fund was levied from the year ended December 31, 2014,consequent to the 18th amendment in the constitution, the chargeability has been challenged before the Sindh High Courtby filing a constitional petition, however, provision pertaining to years 2014 onwards has been maintained in respect ofSindh WWF. Matter is pending before Sindh High Court.
47 121Annual Report 2020
Notes to and forming part of the Unconsolidated Financial StatementsFor the year ended December 31, 2020

NOTES TO AND FORMING PART OF THE UNCONSOLIDATED FINANCIAL STATEMENTSFOR THE YEAR ENDED DECEMBER 31, 2020
Note 2020 201932. OTHER CHARGES
Penalties imposed by the SBP 163,940 39,233 Other penalties 3,395 822
167,335 40,055 33. PROVISIONS AND WRITE-OFFS - NET
Provision against loans and advances - net 10.4 16,203,144 4,944,661 Provision for diminution in value of investments - net 9.3 341,551 3,199,011 Bad debts written off directly 10.5 77,094 149,591 Provision against other assets - net 14.3.3 154,855 253,977 Provision against off - balance sheet obligations 20.1 431,749 47,438 Recovery of written-off / charged off bad debts (494,488) (526,059) Other provisions / write-offs 54,243 151,173
16,768,148 8,219,792 34. TAXATION
Current 17,210,908 14,765,867 Prior years - 793,231 Deferred (3,917,221) (451,003)
13,293,687 15,108,095 34.1 Relationship between tax expense and accounting profit
Accounting profit for the year 34,192,470 34,241,869
Tax on income @ 35% (2019: 35%) 11,967,365 11,984,654 Super tax @ 4% (2019 : 4%) 1,367,699 1,369,675 Tax effect of permanent differences 65,261 65,664 Tax - prior years (net of deferred tax) - 1,699,259 Others (106,638) (11,157) Tax charge 13,293,687 15,108,095
35. EARNINGS PER SHARE
Profit after taxation for the year 20,898,783 19,133,774
Weighted average number of ordinary shares 1,224,179,687 1,224,179,687
Earnings per share - basic and diluted 17.07 15.63
Note 2020 201936. CASH AND CASH EQUIVALENTS
Cash and balances with treasury banks 6 250,838,052 235,861,767 Balances with other banks 7 13,888,765 20,729,005
264,726,817 256,590,772
------- (Rupees in '000) -------
------- (Rupees in '000) -------
There were no convertible dilutive potential ordinary shares outstanding as at December 31, 2020 and 2019.
------- (Number of shares) -------
---------- (Rupees) ----------
48United Bank Limited122
Notes to and forming part of the Unconsolidated Financial StatementsFor the year ended December 31, 2020

NOTES TO AND FORMING PART OF THE UNCONSOLIDATED FINANCIAL STATEMENTSFOR THE YEAR ENDED DECEMBER 31, 2020
36.1 RECONCILIATION OF MOVEMENT OF LIABILITIES TO CASH FLOWS ARISING FROM FINANCING ACTIVITIES
Bills payable BorrowingsDeposits and
other accounts
Subordinated debts
Other liabilities Share capital Reserves
Surplus on revaluation of assets - net of deferred tax
Unappropriated profit
Balance as at January 1, 2020 22,926,596 154,484,000 1,467,063,461 10,000,000 69,232,422 12,241,797 59,319,612 25,837,143 71,670,331Changes from financing cash flowsDividend Paid - - - - - - - - (8,138,474)
Other Changes - - - - 729,827 - - (145,583) 508,195
Liability-relatedChanges in bills payable 6,807,217 - - - - - - - - Changes in borrowings - (25,496,585) - - - - - - - Changes in deposits and other accounts - - 173,148,440 - - - - - - Changes in subordinated debt - - - - - - - - - Changes in other liabilities - - - - - - - - - - Cash based - - - - (14,157,698) - - - - - Dividend payable - - - - (181,306) - - - (181,306)- Non-cash based - - - - 954,032 - - - - Transfer of profit to reserve - - - - - - 2,089,878 - (2,089,878)Total Liability related other changes 6,807,217 (25,496,585) 173,148,440 - (13,384,972) - 2,089,878 - (2,271,184)Total Equity related other changes - - - - - - 864,578 1,949,019 20,147,595Balance as at December 31, 2020 29,733,813 128,987,415 1,640,211,901 10,000,000 56,577,277 12,241,797 62,274,068 27,640,579 81,916,463
2020 201937. STAFF STRENGTH
Permanent 11,147 11,034 On contract 19 23 Bank's own staff strength 11,166 11,057 Outsourced 1,846 2,191 Total 13,012 13,248
37.1 Number of employees working domestically are 12,679 (2019: 12,905) and abroad are 333 (2019: 343).
38. DEFINED BENEFIT PLANS
38.1 General description
38.2 Number of Employees under the scheme
The number of employees covered under the following defined benefit schemes are:2020 2019
- Pension fund 7,049 7,064 - Gratuity fund 10,083 9,856 - Benevolent fund 1,982 1,966 - Employee compensated absences 1,258 1,428 - Post-retirement medical benefit scheme 7,346 7,240
The pension fund, benevolent fund and post-retirement medical benefit schemes include 2,243 (2019: 2,162), 955 (2019: 942)and 2,448 (2019: 2,501) members respectively who have retired or whose widows are receiving the benefits.
Liabilities Equity
---------------------------------------------------------------------------------------- (Rupees in '000) ----------------------------------------------------------------------------------------
The Bank operates a funded pension scheme established in 1975. The Bank also operates a funded gratuity scheme for newemployees and for those employees who have not opted for the pension scheme. The Bank also operates a benevolent fundscheme and provides post retirement medical benefits to eligible retired employees. The benevolent fund scheme and thepost-retirement medical scheme cover all regular employees of the Bank who joined the Bank pre-privatization. The liabilitiesof the Bank in respect of these schemes are determined based on actuarial valuations carried out using the Projected UnitCredit Method. Actuarial valuations of the defined benefit schemes are carried out every year and the latest valuation wascarried out as at December 31, 2020.
----------- (Number) -----------
---------- (Number) ----------
49123Annual Report 2020
Notes to and forming part of the Unconsolidated Financial StatementsFor the year ended December 31, 2020

NOTES TO AND FORMING PART OF THE UNCONSOLIDATED FINANCIAL STATEMENTSFOR THE YEAR ENDED DECEMBER 31, 2020
38.3 Principal actuarial assumptions
The actuarial valuations were carried out as at December 31, 2020, using the following significant assumptions:
2020 2019
Discount rate / expected rate of return on plan assets 9.75% 11.25%Expected rate of salary increase 7.75% 9.25%Expected rate of increase in pension 5.00% 5.00%Expected rate of increase in medical benefit 3.75% 5.25%
38.4 Reconciliation of payable to / (receivable from) defined benefit plans
Note
Present value of obligations 11,604,939 1,049,184 331,363 2,028,687 10,098,497 911,763 329,300 1,950,906Fair value of plan assets (10,521,021) (1,015,218) (330,708) - (9,318,843) (968,544) (424,706) - Payable / (receivable) 1,083,918 33,966 655 2,028,687 779,654 (56,781) (95,406) 1,950,906
38.5 Movement in defined benefit obligations
Obligations at the beginning of the year 10,098,497 911,763 329,300 1,950,906 8,986,977 831,363 321,682 1,821,847Service cost 23,856 152,839 4,109 524 19,957 145,775 4,463 687Interest cost 994,529 105,266 34,197 213,970 989,305 112,796 39,045 235,459Benefits paid by the Bank (901,142) (126,864) (42,236) (97,195) (730,840) (139,740) (62,976) (129,591)Return allocated to other funds 38.8.1 58,882 - - - 73,834 - - - Re-measurement loss / (gain) 1,330,317 6,180 5,993 (39,518) 759,264 (38,431) 27,086 22,504Obligations at the end of the year 11,604,939 1,049,184 331,363 2,028,687 10,098,497 911,763 329,300 1,950,906
38.6 Movement in fair value of plan assets
Fair value at the beginning of the year 9,318,843 968,544 424,706 - 8,168,441 805,576 461,597 - Interest income on plan assets 996,935 111,322 44,373 - 1,034,319 109,585 56,465 - Contribution by the Bank 877,014 92,184 1,601 - 849,453 180,780 1,840 - Contribution by the employees - - 1,601 - - - 1,840 - Amount paid by the fund to the Bank (703,722) (125,781) (137,717) - (645,000) (129,306) (97,748) - Re-measurements gain / (loss) 31,951 (31,051) (3,856) - (88,370) 1,909 712 - Fair value at the end of the year 10,521,021 1,015,218 330,708 - 9,318,843 968,544 424,706 -
38.7 Movement in payable / (receivable)under defined benefit schemes
Opening balance 779,654 (56,781) (95,406) 1,950,906 818,536 25,787 (139,915) 1,821,847Mark-up receivable on Bank's balance
with the fund (9,749) (310) (539) - (8,944) (189) (5,368) - Charge / (reversal) for the year 80,332 146,783 (7,668) 214,494 48,777 148,986 (14,797) 236,146Contribution by the Bank (877,014) (92,184) (1,601) - (849,453) (180,780) (1,840) - Amount paid by the Fund to the Bank 703,722 125,781 137,717 - 645,000 129,306 97,748 - Benefits paid by the Bank (901,142) (126,864) (42,236) (97,195) (730,840) (139,740) (62,976) (129,591)Re-measurement loss / (gain)
recognised in OCI during the year 1,308,115 37,541 10,388 (39,518) 856,578 (40,151) 31,742 22,504Closing balance 1,083,918 33,966 655 2,028,687 779,654 (56,781) (95,406) 1,950,906
------ Per annum -----
2019
-------------------------------------------------------------------- (Rupees in '000) -------------------------------------------------------------------
2020
Gratuity fund
Benevolent fund
Post -retirement
medical benefit
Pension fund Gratuity fund Benevolent fund
Post -retirement
medical benefit
Pension fund
50United Bank Limited124
Notes to and forming part of the Unconsolidated Financial StatementsFor the year ended December 31, 2020

NOTES TO AND FORMING PART OF THE UNCONSOLIDATED FINANCIAL STATEMENTSFOR THE YEAR ENDED DECEMBER 31, 2020
38.8 Charge for defined benefit plans
38.8.1 Cost recognised in profit and loss
Note
Current service cost 23,856 152,839 4,109 524 19,957 145,775 4,463 687Past service cost - - - - - - - - Net interest on defined benefit
asset / (liability) (2,406) (6,056) (10,176) 213,970 (45,014) 3,211 (17,420) 235,459Return allocated to other funds 38.8.1.1 58,882 - - - 73,834 - - - Employees' contribution - - (1,601) - - - (1,840) -
80,332 146,783 (7,668) 214,494 48,777 148,986 (14,797) 236,146
38.8.1.1
38.8.2 Re-measurements recognised in OCI during the year
Loss / (gain) on obligation- Financial assumptions 1,379,653 (9,341) 28,729 153,627 1,401,522 (10,623) 28,103 399,959- Experience adjustment (49,336) 15,521 (22,736) (193,145) (642,258) (27,808) (1,017) (377,455)
Return on plan assets overinterest income (31,951) 31,051 3,856 - 88,370 (1,909) (712) -
Adjustment for markup 9,749 310 539 - 8,944 189 5,368 - Total re-measurements
recognised in OCI 1,308,115 37,541 10,388 (39,518) 856,578 (40,151) 31,742 22,504
38.9 Components of plan assets
Pension fund Gratuity fund
Benevolent fund
Pension fund Gratuity fund Benevolent
fund
Cash and cash equivalents - net of current liabilities 236,332 103,110 27,891 801,016 151,344 106,984
Quoted securitiesOrdinary shares 89,090 5,483 12,491 116,441 7,137 16,321Term finance certificates 244,257 23,270 11,893 53,203 26,873 20,232
Mutual Funds Units 167,165 16,737 - - 35,077 - Pakistan Investment Bonds 4,970,102 316,307 133,867 4,512,007 314,689 134,818Market Treasury Bills 3,306,798 539,015 135,330 3,446,115 433,424 - Special Savings Certificates - - - - - 140,151National Saving Certificates / Bonds 1,507,277 11,103 2,830 - - - Certificate of Investments - - 6,406 - - 6,200Repurchase Agreements - 193 - - - - Term deposit - - - 390,061 - -
10,521,021 1,015,218 330,708 9,318,843 968,544 424,706
38.9.1
2019
------------------------------------------------------------------------ (Rupees in '000) ------------------------------------------------------------------------
------------------------------------------------------------------------ (Rupees in '000) ------------------------------------------------------------------------
2019
2020 2019
Pension fund
Gratuity fund
Benevolent fund
Post -retirement
medical benefit
2020
The Funds primarily invests in government securities and accordingly do not carry any significant credit risk. These are subjectto interest rate risk based on market movements. Investment in term finance certificates are subject to credit risk and interestrate risks, while equity securities are subject to price risk. These risks are regularly monitored by Trustees of the employeefunds.
This represents return allocated to those employees who exercised the conversion option offered in the year 2001, as referredto in note 5.11.1.
-------------------------------------------- (Rupees in '000) --------------------------------------------
Benevolent fund
Post -retirement
medical benefit
2020
Pension fund
Gratuity fund
Benevolent fund
Post -retirement
medical benefit
Pension fund
Gratuity fund
Benevolent fund
Post -retirement
medical benefit
Pension fund
Gratuity fund
51125Annual Report 2020
Notes to and forming part of the Unconsolidated Financial StatementsFor the year ended December 31, 2020

0.
NOTES TO AND FORMING PART OF THE UNCONSOLIDATED FINANCIAL STATEMENTSFOR THE YEAR ENDED DECEMBER 31, 2020
38.10 Sensitivity analysis
Increase in Discount Rate by 1 % (955,565) (69,878) (17,184) (209,939) Decrease in Discount Rate by 1 % 1,126,711 79,657 11,910 253,902 Increase in expected future increment in salary by 1% - 85,670 - - Decrease in expected future increment in salary by 1% - (76,263) - - Increase in expected future increment in pension by 1% 1,118,891 - - - Decrease in expected future increment in pension by 1% (965,068) - - - Increase in expected future increment in medical benefit by 1% - - - 232,951 Decrease in expected future increment in medical benefit by 1% - - - (198,687)
38.11 Expected contributions to be paid to the funds in the next financial year
Expected contribution - - 1,499 -
Expected charge for the year 109,601 167,443 2,479 193,055
38.12 Maturity profile
The weighted average duration of the obligation (in years) 9.36 7.09 4.23 7.93
38.13 Funding Policy
Asset Volatility
There is an insignificant equity exposure and investment in corporate bonds of around 1% respectively.
The asset class is volatile with reference to the yield on this class. This risk should be viewed together with change in thebond yield risk.
Pension fund Gratuity fund Benevolent fund
Post retirement medical benefit
Pension fund Gratuity fund Benevolent fund
Post retirement medical benefit
Pension fund Gratuity fund Benevolent fund
Post retirement medical benefit
Only three Schemes out of the all the Schemes are funded: Pension; Gratuity; and Benevolent Fund. The combinedinvestment of the three funds is Rs. 11.9 billion. Almost 92% is invested in Government Bonds with a maturity that is lessthan the maturity of the corresponding liability.
2020
The Bank endeavours to ensure that liabilities under the various employee benefit schemes are covered by the Fund onany valuation date having regards to the various actuarial assumptions such as projected future salary increase, expectedfuture contributions to the fund, projected increase in liability associated with future service and the projected investmentincome of the Fund.
Sensitivity analysis has been performed by varying one assumption keeping all other assumptions constant and calculatingthe impact on the present value of the defined benefit obligations under the various employee benefit schemes. Theincrease / (decrease) in the present value of defined benefit obligations as a result of change in each assumption issummarized below:
2020
Although the analysis does not take account of the full distribution of expected cash flows, it does provide an approximationof the sensitivity of the assumptions shown.
------------------------------- (Rupees in '000) ---------------------------
------------------------------- (Rupees in '000) ---------------------------
2021
The Bank contributes to the pension and gratuity funds according to the actuary's advice. Contribution to the benevolentfund is made by the Bank as per the rates set out in the benevolent fund scheme. Based on actuarial advice, managementestimates that the expected contribution and charge / (reversal) for the year ending December 31, 2021, would be asfollows:
52United Bank Limited126
Notes to and forming part of the Unconsolidated Financial StatementsFor the year ended December 31, 2020

NOTES TO AND FORMING PART OF THE UNCONSOLIDATED FINANCIAL STATEMENTSFOR THE YEAR ENDED DECEMBER 31, 2020
Changes in Bond Yields
Inflation Risk
Life Expectancy / Withdrawal Rate
Other Risks
Though, not imminent and generally observable, over long term there are some risks that may crystallise. This includes:
-
-
-
-
-
-
Retention Risk – The risk that employee will not be motivated to continue the service or start working with the Bank ifno market comparable retirement benefit is provided.
Final Salary Risk – The risk, for defined benefit gratuity, that any disproportionate salary merit increases in laterservice years will give rise to a multiplicative increase in the gratuity liability as such increase is applicable to all thepast years of service.
Model Risk – The defined benefit gratuity liability is valued by actuary each year. Further, the assets in the Fund arealso marked to market. This two-tier valuation gives rise to the model risk.
Operational Risk related to a separate entity - Retirement benefits are funded through a separate trust fund which is adifferent legal entity than the Bank. Generally, the protocols, processes, and conventions used throughout the Bankare not applicable or are not actively applied to the retirement benefit Funds. This gives rise to some specificoperational risks.
Compliance Risk – The risk that retirement benefits offered by the Bank do not comply with minimum statutoryrequirements.
Legal / Political Risk – The risk that the legal / political environment changes and as a result, the Bank is required tooffer additional or different retirement benefits than what the Bank projected. Specifically, in the light of recentSupreme Court decisions, this risk has materialised.
The salary inflation (especially the final salary risk) is the major risk that the Gratuity and compensated absences liabilitycarries. In pension fund the increase has been determined by the Supreme Court and does not carry this risk as the benefitis practically no longer exposed to future salary increases. Some of the post-retirement medical benefits are capped to aproportion of Pension, thus carrying no salary inflation risk. However, the hospitalization benefit is susceptible to medicalinflation risk.
In a general economic sense and in a longer view, there is a case that if bond yields increase, the ensuing change in salaryinflation generally offsets the gains from the decrease in discounted gratuity. But viewed with the fact that, for gratuity,asset values will also decrease; the salary inflation does, as an overall effect, increases the net liability of the Bank.
The Gratuity and Compensated Absences are paid off at the maximum of age 60. The life expectancy is in almost minimalrange and is quite predictable in the ages when the employee is in the accredited employment of the Bank for the purposeof the Gratuity and Compensated Absences. Thus, the risk of life expectancy is almost negligible. However, post-retirementbenefit given by the Bank like monthly pension, post-retirement medical gives rise to a significant risk which is quite difficultto value even by using advance mortality improvement models. Thus, this risk carries valuation risk as well.
Withdrawal risks is the risk of higher or lower withdrawal experience than assumed. The final effect could go either waydepending on the beneficiaries’ service/age distribution and the benefit.
There are two dimensions to the changes in Bond yields: first, as described above; second, the valuation of the GratuityLiability is discounted with reference to the government bond yields. So, any increase in Bond yields will lower theRetirement Benefits Liability and vice versa, but, it will also lower the Asset values.
53127Annual Report 2020
Notes to and forming part of the Unconsolidated Financial StatementsFor the year ended December 31, 2020

NOTES TO AND FORMING PART OF THE UNCONSOLIDATED FINANCIAL STATEMENTSFOR THE YEAR ENDED DECEMBER 31, 2020
39. OTHER EMPLOYEE BENEFITS
39.1 Defined contribution plan
40. COMPENSATION OF DIRECTORS AND KEY MANAGEMENT PERSONNEL
40.1 Total Compensation Expense
ChairmanExecutives (other than
CEO)
Non-Executives
Fees and Allowances etc. 10,495 - 75,705 9,544 - - - Managerial Remunerationi) Fixed - - - - 81,542 148,050 307,058ii) Variable - Cash Bonus / Awards - - - - 117,930 174,685 165,154Contribution to defined contribution plan - - - - 6,795 9,817 24,888Charge for defined benefit plan - - - - 2,484 4,469 14,957Rent & house maintenance - - - - 5,915 66,622 138,176Utilities - - - - 1,551 29,610 61,412Medical - - - - - 14,805 30,706Conveyance - - - - 1,155 23,835 87,940Others - - - - 3,811 1,263 16,044Total 10,495 - 75,705 9,544 221,183 473,156 846,335
Number of Persons 1 - 7 3 2 15 88
ChairmanExecutives (other than
CEO)
Non-Executives
Fees and Allowances etc. 11,710 - 84,365 6,855 - - - Managerial Remunerationi) Fixed - - - - 60,000 147,880 496,698ii) Total Variable - Cash Bonus / Awards - - - - 21,850 88,789 373,243Contribution to defined contribution plan - - - - 5,000 10,133 25,280Charge for defined benefit plan - - - - 2,315 5,359 14,096Rent & house maintenance - - - - 3,055 66,546 150,603Utilities - - - - 1,140 29,576 106,458Medical - - - - - 14,788 32,250Conveyance - - - - 453 9,359 10,008Others - - - - 1,113 616 - Total 11,710 - 84,365 6,855 94,926 373,046 1,208,636
Number of Persons 1 - 7 3 1 15 107
President / CEO
The Bank operates a contributory provident fund scheme for 10,083 (2019: 9,856) employees who are not in the pensionscheme. The employer and employee each contribute 8.33% of the basic salary to the funded scheme every month.
2020
-------------------------------------------- (Rupees in '000) --------------------------------------------
Items
DirectorsMembers Shariah Board
Key Management
Personnel
Other Material
Risk Takers/ Controllers
Items
-------------------------------------------- (Rupees in '000) --------------------------------------------
DirectorsMembers Shariah Board
President / CEO
Key Management
Personnel
Other Material
Risk Takers/ Controllers
2019
54United Bank Limited128
Notes to and forming part of the Unconsolidated Financial StatementsFor the year ended December 31, 2020

NOTES TO AND FORMING PART OF THE UNCONSOLIDATED FINANCIAL STATEMENTSFOR THE YEAR ENDED DECEMBER 31, 2020
40.2 Remuneration paid to Directors for participation in Board and Committee Meetings
1 Sir Mohammed Anwar Pervez, OBE, HPk 6,300 - 750 - - 3,000 445 10,495
2 Lord Zameer M. Choudrey, CBE, SI Pk 5,250 - - 3,000 750 3,000 587 12,587 3 Mr. Haider Zameer Choudrey 5,250 3,750 - - 3,000 - 587 12,587 4 Mr. Arshad Ahmad Mir 5,250 1,500 3,000 2,250 - 2,250 436 14,686 5 Mr. Rizwan Pervez 5,250 3,750 750 - - - 595 10,345 6 Mr. Khalid Ahmed Sherwani 3,000 2,250 2,250 - - - - 7,500 7 Mr. Amar Zafar Khan 4,500 2,250 2,250 - - - - 9,000 8 Mr. Tariq Rashid 4,500 750 750 - 3,000 - - 9,000
Total Amount Paid 39,300 14,250 9,750 5,250 6,750 8,250 2,650 86,200
1 Board Meetings 6 6 6 5 6 6 6 62 Board Audit Committee (BAC) - - 5 - 5 5 5 -3 Board Human Resource & Compensation
Committee (HRCC) - - - 3 - 4 4 -4 Board Risk & Compliance
Committee (BRCC) - 4 - 3 - - - -5 Board IT Committee (BITC) - - 5 - - - - 56 Board Nomination Committee (BNC) * - - - - - - - -
Total meetings attended 6 10 16 11 11 15 15 11
Meeting fees and allowances paid (Rs. in 000's) 11,710 11,753 11,753 9,651 11,710 13,622 12,945 12,931
Total meeting fees and allowances paid (Rs. in 000's) 96,075
*The BNC was constituted in the Board Meeting of October 2019.
40.2.1
Board Human Resource &
Compensation Committee
(HRCC)
Board Risk & Compliance Committee
(BRCC)
Board IT Committee
(BITC)
Board Nomination Committee
(BNC)
Allowance Total Amount Paid
Name of Director
The directors' fee for the year ended December 31, 2019, is based on their attendance per set of meetings which includesBoard meetings and / or committee(s) meeting(s) before or after the regular Board meeting. The amount disclosed for eachdirector during the year ended December 31, 2019, in note 40.2 can therefore not be distributed for each type of meeting.
2020
2019
For Board CommitteesMeeting Fees and Allowances Paid
Sr.No. For Board
MeetingsBoard Audit Committee
(BAC)
---------------------------------------------------------------------- (Rupees in '000) ----------------------------------------------------------------------------
(Number of meetings attended)
Sr. No. Name of Meetings
Name of Directors
Sir Mohammed
Anwar Pervez, OBE, HPk
Lord Zameer M. Choudrey, CBE, SI Pk
Mr. Haider Zameer
Choudrey
Mr. Arshad Ahmad Mir
Mr. Rizwan Pervez
Mr. Khalid Ahmed
Sherwani
Mr. Amar Zafar Khan
Mr. Tariq Rashid
55 129Annual Report 2020
Notes to and forming part of the Unconsolidated Financial StatementsFor the year ended December 31, 2020

NOTES TO AND FORMING PART OF THE UNCONSOLIDATED FINANCIAL STATEMENTSFOR THE YEAR ENDED DECEMBER 31, 2020
40.3 Remuneration paid to Shariah Board Members
Items Chairman Resident Member
Non-Resident
Member(s)Chairman Resident
Member
Non-Resident
Member(s)
Meeting Fees and Allowances 2,772 4,000 2,772 2,540 1,775 2,540
Total Number of Persons 1 1 1 1 1 1
41. FAIR VALUE OF FINANCIAL INSTRUMENTS
41.1
Level 1: Fair value measurements using quoted prices (unadjusted) in active markets for identical assets or liabilities.
Level 1 Level 2 Level 3 Total
On balance sheet financial instruments
Financial assets - measured at fair value- Investments
Government Securities (T-bills, PIBs, GoP Sukuks Eurobonds, Modaraba Pool) 808,788,572 - 808,788,572 - 808,788,572
Foreign Bonds - Sovereign 55,145,424 - 55,145,424 - 55,145,424Foreign Bonds - others 4,769,303 - 4,769,303 - 4,769,303Ordinary shares of listed companies 10,383,260 10,383,260 - - 10,383,260Mutual Fund 228,518 - 228,518 - 228,518Debt securities (TFCs, Sukuks) 1,720,302 - 1,720,302 - 1,720,302Investment in REIT 441,914 441,914 - - 441,914
881,477,293 10,825,174 870,652,119 - 881,477,293
The table below analyses financial instruments measured at the end of the reporting period by the level in the fair valuehierarchy into which the fair value measurement is categorised:
2020Carrying /
Notional valueFair value
-------------------------- (Rupees in '000) --------------------------
2020 2019
-------------------------------------------- (Rupees in '000) --------------------------------------------
Level 3: Fair value measurements using input for the asset or liability that are not based on observable market data (i.e.unobservable inputs).
The fair value of quoted securities other than those classified as held to maturity, is based on quoted market price. Quotedsecurities classified as held to maturity are carried at cost. The fair value of unquoted equity securities, other thaninvestments in associates and subsidiaries, is determined on the basis of the break-up value of these investments as pertheir latest available audited financial statements.
The fair value of unquoted debt securities, fixed term loans, other assets, other liabilities, fixed term deposits andborrowings cannot be calculated with sufficient reliability due to the absence of a current and active market for these assetsand liabilities and reliable data regarding market rates for similar instruments.
In the opinion of the management, the fair value of the remaining financial assets and liabilities are not significantly differentfrom their carrying values since these are either short-term in nature or, in the case of customer loans and deposits, arefrequently repriced.
The Bank measures fair values using the following fair value hierarchy that reflects the significance of the inputs used inmaking the measurements:
Level 2: Fair value measurements using inputs other than quoted prices included within Level 1 that are observable for theassets or liability, either directly (i.e. as prices) or indirectly (i.e. derived from prices).
56United Bank Limited130
Notes to and forming part of the Unconsolidated Financial StatementsFor the year ended December 31, 2020

NOTES TO AND FORMING PART OF THE UNCONSOLIDATED FINANCIAL STATEMENTSFOR THE YEAR ENDED DECEMBER 31, 2020
Level 1 Level 2 Level 3 Total
Financial assets - disclosed but not measured at fair value - Investments
Government Securities (T-bills, PIBs, GoP Sukuks Eurobonds, Bai Muajjal) 200,466,866 - 206,791,388 - 206,791,388
Foreign Bonds - Sovereign 23,429,572 - 22,141,647 - 22,141,647Foreign Bonds - others 1,238,565 - 1,285,465 - 1,285,465Debt securities (TFCs, Sukuks) 16,411,853 - 16,570,036 - 16,570,036
241,546,856 - 246,788,536 - 246,788,536
1,123,024,149 10,825,174 1,117,440,655 - 1,128,265,829
Off-balance sheet financial instruments - measured at fair value
Forward purchase and sale of foreign exchange contracts 635,597,333 - (614,728) - (614,728)
Interest rate swaps - - - - -
FX options - purchased and sold - - - - -
Forward purchase of Government Securities - - - - -
Forward sale of Government Securities - - - - -
Level 1 Level 2 Level 3 Total
On balance sheet financial instruments
Financial assets - measured at fair value- Investments
Government Securities (T-bills, PIBs, GoP Sukuks and Eurobonds) 481,948,693 - 481,948,693 - 481,948,693
Foreign Bonds - Sovereign 45,358,275 - 45,358,275 - 45,358,275 Foreign Bonds - others 7,083,775 - 7,083,775 - 7,083,775 Ordinary shares of listed companies 13,410,745 13,410,747 - - 13,410,747 Mutual Fund 252,931 - 252,931 - 252,931 Debt securities (TFCs) 1,849,523 - 1,914,241 - 1,914,241 Investment in REIT 520,708 520,708 - - 520,708
550,424,650 13,931,455 536,557,915 - 550,489,370Financial assets - disclosed but not measured at fair value
Government Securities (T-bills, PIBs, GoP Sukuks Eurobonds, Bai Muajjal) 243,226,406 - 241,092,760 - 241,092,760
Foreign Bonds - Sovereign 20,887,633 - 18,781,407 - 18,781,407 Foreign Bonds - others 1,260,550 - 1,301,904 - 1,301,904 Debt securities (TFCs, Sukuks) 18,922,885 - 20,204,344 - 20,204,344
284,297,474 - 281,380,415 - -
834,722,124 13,931,455 817,938,330 - 550,489,370
2019Carrying /
Notional valueFair value
-------------------------- (Rupees in '000) --------------------------
2020Carrying /
Notional valueFair value
-------------------------- (Rupees in '000) --------------------------
57 131Annual Report 2020
Notes to and forming part of the Unconsolidated Financial StatementsFor the year ended December 31, 2020

NOTES TO AND FORMING PART OF THE UNCONSOLIDATED FINANCIAL STATEMENTSFOR THE YEAR ENDED DECEMBER 31, 2020
Level 1 Level 2 Level 3 Total
Off-balance sheet financial instruments - measured at fair value
Forward purchase and sale of foreign exchange contracts 910,616,840 - (309,950) - (309,950)
Interest rate swaps 316,500 - (17,107) - (17,107)
FX options - purchased and sold 122,594 - - - -
Forward purchase of Government Securities 3,043,541 - (94) - (94)
Forward sale of Government Securities 11,264,179 - 14,262 - 14,262
41.2 Fair Value of non-financial assets
Level 1 Level 2 Level 3 Total
Fixed Assets 36,492,910 - - 36,492,910 36,492,910 Non-banking assets acquired in satisfaction of claims 203,316 - - 203,316 203,316
36,696,226 - - 36,696,226 36,696,226
Level 1 Level 2 Level 3 Total
Fixed Assets 37,003,126 - - 37,003,126 37,003,126 Non-banking assets acquired in satisfaction of claims 1,051,858 - - 1,051,858 1,051,858
38,054,984 - - 38,054,984 38,054,984
41.3
41.4 Valuation techniques used in determination of fair values within level 2 and level 3.
Debt securities
Units of mutual fund
Derivatives
The fair valuation techniques include forward pricing and swap models using present value calculations.
Fixed assets and non-banking assets acquired in satisfaction of claims
Fair value
-------------------------- (Rupees in '000) --------------------------
Certain categories of fixed assets (land and buildings) and non-banking assets acquired in satisfactions of claims arecarried at revalued amounts (level 3 measurement) determined by professional valuers based on their assessment of themarket values.
The fair value of Federal Government securities is determined using the prices / rates available on Mutual FundsAssociation of Pakistan (MUFAP) and the fair value of other corporate and foreign government securities is determinedusing the rates from Reuters / Bloomberg.
Land, buildings and non-banking assets acquired in satisfaction of claims are revalued on a periodic basis usingprofessional valuers. The valuation is based on their assessment of the market value of the assets. The effect of changes inthe unobservable inputs used in the valuations cannot be determined with certainty. Accordingly, a qualitative disclosure ofsensitivity has not been presented in these unconsolidated financial statements.
-------------------------- (Rupees in '000) --------------------------
2019
The fair values of investments in units of mutual funds are determined based on their net asset values as published at theclose of each business day.
Carrying / Notional value
Fair value
2020 Carrying /
Notional value Fair value
-------------------------- (Rupees in '000) --------------------------
2019Carrying /
Notional value
58United Bank Limited132
Notes to and forming part of the Unconsolidated Financial StatementsFor the year ended December 31, 2020

NOTES TO AND FORMING PART OF THE UNCONSOLIDATED FINANCIAL STATEMENTSFOR THE YEAR ENDED DECEMBER 31, 2020
42 SEGMENT INFORMATION
42.1 Segment details with respect to business activities
Profit & Loss
Net mark-up / return / profit 36,465,776 72,064,538 (44,818,240) 4,118,716 7,731,711 (603,329) 74,959,172 Inter segment (expense) / revenue - net (28,037,168) (64,465,202) 85,797,705 1,068,993 - 5,635,672 - Non mark-up / return / interest income 2,392,061 3,014,483 7,366,180 211,034 2,777,547 1,333,034 17,094,339 Total Income 10,820,669 10,613,819 48,345,645 5,398,743 10,509,258 6,365,377 92,053,511
Segment direct expenses 1,469,881 550,650 25,494,982 1,679,860 5,244,835 6,652,685 41,092,893 Inter segment expense allocation 558,166 71,664 4,760,410 114,868 539,126 (6,044,234) - Total expenses 2,028,047 622,314 30,255,392 1,794,728 5,783,961 608,451 41,092,893 Provisions - net (1,489,772) (123,276) (277,900) (12,905) (14,853,113) (11,182) (16,768,148) Profit / (loss) before tax 7,302,850 9,868,229 17,812,353 3,591,110 (10,127,816) 5,745,744 34,192,470
Balance Sheet
Cash & Bank balances 125,596 81,844,130 122,425,507 12,153,493 47,378,919 799,172 264,726,817 Investments 4,803,162 932,393,450 - 62,729,601 123,251,328 5,496,953 1,128,674,494 Net inter segment lending - - 1,132,694,448 6,980,805 - 77,017,055 1,216,692,308 Lendings to financial institutions - - - 19,959,132 - - 19,959,132 Advances - performing 369,114,172 - 32,976,365 20,390,074 89,119,069 6,811,741 518,411,421 Advances - non-performing net of provision 3,289,437 - 807,045 10,126 7,754,943 6,524 11,868,075 Others 14,521,202 16,648,272 14,869,004 1,700,920 13,301,659 44,902,317 105,943,374 Total Assets 391,853,569 1,030,885,852 1,303,772,369 123,924,151 280,805,918 135,033,762 3,266,275,621
Borrowings 54,852,047 60,191,848 989,202 3,632,752 9,321,566 - 128,987,415 Subordinated debt - - - - - 10,000,000 10,000,000 Deposits & other accounts 63,760,006 132,797 1,245,707,386 110,347,698 220,015,338 248,676 1,640,211,901 Net inter segment borrowing 255,020,028 960,917,205 - - 755,075 - 1,216,692,308 Others 13,779,726 3,328,909 46,185,887 5,772,050 6,305,922 10,938,596 86,311,090 Total Liabilities 387,411,807 1,024,570,759 1,292,882,475 119,752,500 236,397,901 21,187,272 3,082,202,714Equity 4,441,762 6,315,093 10,889,894 4,171,651 44,408,017 113,846,490 184,072,907 Total Equity & liabilities 391,853,569 1,030,885,852 1,303,772,369 123,924,151 280,805,918 135,033,762 3,266,275,621
Contingencies and Commitments 349,133,005 285,716,584 13,182,354 5,991,566 398,498,688 2,721,015 1,055,243,212 - - - - - - -
Segment details with respect to business activities
Profit & Loss
Net mark-up / return / profit 45,818,682 44,777,720 (38,614,134) 3,158,882 8,769,288 (2,135,942) 61,774,496 Inter segment (expense) / revenue - net (39,577,709) (58,654,888) 91,402,316 1,111,925 - 5,718,356 - Non mark-up / return / interest income 2,409,533 4,267,688 8,615,976 1,321,665 3,102,710 1,958,759 21,676,331 Total Income 8,650,506 (9,609,480) 61,404,158 5,592,472 11,871,998 5,541,173 83,450,827
Segment direct expenses 1,469,178 83,281 23,799,440 2,700,618 5,981,755 6,954,894 40,989,166 Inter segment expense allocation 617,774 74,997 5,087,240 84,797 740,244 (6,605,052) - Total expenses 2,086,952 158,278 28,886,680 2,785,415 6,721,999 349,842 40,989,166 Reversals / (Provisions) - net 549,733 (2,253,096) 122,712 (5,529) (6,010,178) (623,434) (8,219,792) Profit / (loss) before tax 7,113,287 (12,020,854) 32,640,190 2,801,528 (860,179) 4,567,897 34,241,869
Balance Sheet
Cash & Bank balances 81,168 81,316,915 103,973,001 13,676,734 56,768,716 774,238 256,590,772 Investments 5,648,871 674,218,489 - 46,726,238 108,281,811 5,447,243 840,322,652 Net inter segment lending - - 966,323,335 7,455,399 - 54,818,509 1,028,597,243 Lendings to financial institutions - 9,450,000 - 10,733,118 - - 20,183,118 Advances - performing 446,782,942 18,964 35,584,682 9,015,164 125,319,182 5,743,472 622,464,406 Advances - non-performing net of provision 1,520,316 - 604,653 6,945 11,212,859 25,038 13,369,811 Others 25,179,372 23,500,874 14,988,165 308,095 14,826,734 61,041,363 139,844,603 Total Assets 479,212,669 788,505,242 1,121,473,836 87,921,693 316,409,302 127,849,863 2,921,372,605
TotalOthersIslamic Banking
International branch operations Others Total
-------------------------------------------------------- (Rupees in '000) --------------------------------------------------------
Corporate / Commercial
BankingTreasury Branch Banking Islamic Banking
2020
-------------------------------------------------------- (Rupees in '000) --------------------------------------------------------
Treasury
2019
International branch operations
Corporate / Commercial
BankingBranch Banking
59133Annual Report 2020
Notes to and forming part of the Unconsolidated Financial StatementsFor the year ended December 31, 2020

NOTES TO AND FORMING PART OF THE UNCONSOLIDATED FINANCIAL STATEMENTSFOR THE YEAR ENDED DECEMBER 31, 2020
Borrowings 52,023,960 95,592,358 - 1,299,975 5,567,707 - 154,484,000 Subordinated debt - - - - - 10,000,000 10,000,000 Deposits & other accounts 60,853,340 131,140 1,074,305,614 80,713,661 250,442,809 616,897 1,467,063,461 Net inter segment borrowing 341,773,834 686,617,978 - - 205,431 - 1,028,597,243 Others 20,263,631 15,460,323 27,235,447 3,775,564 7,619,846 17,804,207 92,159,018 Total Liabilities 474,914,765 797,801,799 1,101,541,061 85,789,200 263,835,793 28,421,104 2,752,303,722Equity 4,297,904 (9,296,557) 19,932,775 2,132,493 52,573,509 99,428,759 169,068,883 Total Equity & liabilities 479,212,669 788,505,242 1,121,473,836 87,921,693 316,409,302 127,849,863 2,921,372,605
Contingencies and Commitments 380,411,280 586,312,922 11,832,520 5,374,239 405,700,848 2,032,540 1,391,664,349
42.2 Geographical segment analysis
Profit & Loss
Net mark-up / return / profit 67,227,461 7,433,417 298,294 74,959,172Non mark-up / return / interest income 14,316,792 2,748,589 28,958 17,094,339Total Income 81,544,253 10,182,006 327,252 92,053,511
Segment direct expenses 35,848,058 5,223,825 21,010 41,092,893Inter segment expense allocation (539,126) 536,869 2,257 - Total expenses 35,308,932 5,760,694 23,267 41,092,893Provisions - net (1,915,035) (14,853,113) - (16,768,148)Profit / (loss) before tax 44,320,286 (10,431,801) 303,985 34,192,470
Balance Sheet
Cash & Bank balances 217,347,898 47,335,696 43,223 264,726,817Investments 1,005,423,165 116,564,187 6,687,142 1,128,674,494Net inter segment lending 1,216,692,308 - - 1,216,692,308Lendings to financial institutions 19,959,132 - - 19,959,132Advances - performing 429,292,352 89,098,600 20,469 518,411,421Advances - non-performing net of provision 4,113,132 7,754,943 - 11,868,075Others 92,641,108 13,036,360 265,906 105,943,374Total Assets 2,985,469,095 273,789,786 7,016,740 3,266,275,621
Borrowings 119,665,849 9,321,566 - 128,987,415Subordinated debt 10,000,000 - - 10,000,000Deposits & other accounts 1,420,196,563 214,733,420 5,281,918 1,640,211,901Net inter segment borrowing 1,215,937,233 752,817 2,258 1,216,692,308Others 80,005,148 6,141,982 163,960 86,311,090Total Liabilities 2,845,804,793 230,949,785 5,448,136 3,082,202,714Equity 139,664,302 42,840,001 1,568,604 184,072,907Total Equity & liabilities 2,985,469,095 273,789,786 7,016,740 3,266,275,621
Contingencies and Commitments 656,744,525 398,335,422 163,265 1,055,243,212- - - #REF! -
Profit & Loss
Net mark-up / return / profit 53,005,208 8,536,463 232,825 61,774,496Non mark-up / return / interest income 18,573,621 3,051,760 50,950 21,676,331Total Income 71,578,829 11,588,223 283,775 83,450,827
Segment direct expenses 35,255,191 5,707,496 26,479 40,989,166Inter segment expense allocation (740,244) 737,515 2,729 - Total expenses 34,514,947 6,445,011 29,208 40,989,166Provisions - net (2,209,614) (6,010,178) - (8,219,792)Profit / (loss) before tax 34,854,268 (866,966) 254,567 34,241,869
------------------------------------------- (Rupees in '000) ---------------------------------------
Middle East
2020
2019
Export Processing
ZonesTotal
PakistanExport
Processing Zones
TotalMiddle East
Pakistan
2019Corporate / Commercial
BankingTreasury Branch Banking Islamic Banking International
branch operations Others Total
-------------------------------------------------------- (Rupees in '000) --------------------------------------------------------
60United Bank Limited134
Notes to and forming part of the Unconsolidated Financial StatementsFor the year ended December 31, 2020

NOTES TO AND FORMING PART OF THE UNCONSOLIDATED FINANCIAL STATEMENTSFOR THE YEAR ENDED DECEMBER 31, 2020
Balance Sheet
Cash & Bank balances 199,822,057 56,710,868 57,847 256,590,772Investments 732,040,841 103,608,000 4,673,811 840,322,652Net inter segment lending 1,028,597,243 - - 1,028,597,243Lendings to financial institutions 20,183,118 - - 20,183,118Advances - performing 497,145,224 125,280,859 38,323 622,464,406Advances - non-performing net of provision 2,156,952 11,212,859 - 13,369,811Others 125,017,868 12,430,339 2,396,396 139,844,603Total Assets 2,604,963,303 309,242,925 7,166,377 2,921,372,605
Borrowings 148,916,293 5,567,707 - 154,484,000Subordinated debt 10,000,000 - - 10,000,000Deposits & other accounts 1,216,620,652 244,850,452 5,592,357 1,467,063,461Net inter segment borrowing 1,028,391,812 92,708 112,723 1,028,597,243Others 84,539,171 7,461,053 158,794 92,159,018Total Liabilities 2,488,467,928 257,971,920 5,863,874 2,752,303,722Equity 116,495,375 51,271,005 1,302,503 169,068,883Total Equity & liabilities 2,604,963,303 309,242,925 7,166,377 2,921,372,605
- - - - Contigencies and Commitments 985,963,501 405,584,968 115,880 1,391,664,349
Transactions between reportable segments are based on an appropriate transfer pricing mechanism using agreed rates.
43. TRUST ACTIVITIES
3 - 1,110,500 - 1,110,50022 4,246,500 - 3,237,500 7,484,00095 154,900 - 1,447,770 1,602,67042 372,299,700 413,000 2,352,000 375,064,70014 400,000 - 739,300 1,139,300164 42,824,000 175,000 11,021,255 54,020,25538 2,500,700 - 4,124,345 6,625,045378 422,425,800 1,698,500 22,922,170 447,046,470
1 - 85,000 - 85,00020 15,829,100 - 6,626,200 22,455,300113 202,800 - 1,527,745 1,730,54536 338,959,700 707,000 15,660,000 355,326,7008 400,000 - 787,800 1,187,800
138 38,067,200 50,000 9,435,350 47,552,55024 476,000 - 5,966,740 6,442,740340 393,934,800 842,000 40,003,835 434,780,635
Insurance Companies
Asset Management CompaniesCorporatesIndividualsInsurance CompaniesNGO / Charitable Organisation
NGO / Charitable OrganisationPension & Employee FundsOthers
Pension & Employee FundsOthers
Asset Management CompaniesCorporatesIndividuals
2020
Category
------------------ (Rupees in '000) --------------------
The Bank acts as a custodian for some of the Term Finance Certificates it arranges and distributes on behalf of itscustomers. Further, the Bank acts as a custodian for securities held in Investor Portfolio Securities (IPS) accounts. Theseare not assets of the Bank and, therefore, are not included as such in the unconsolidated financial statements. Assets heldunder trust in IPS accounts are shown in the table below:
Number of IPS
Accounts
Securities held (Face Value) Pakistan
Investment Bonds
GoP Ijara Sukuks
Market Treasury
Bills
------------------ (Rupees in '000) --------------------
2019
Category Number of
IPS Accounts
Securities held (Face Value)
Total Pakistan Investment
Bonds
GoP Ijara Sukuks
Market Treasury
Bills
Total
------------------------------------------- (Rupees in '000) ---------------------------------------
2019
Pakistan Middle EastExport
Processing Zones
Total
61135Annual Report 2020
Notes to and forming part of the Unconsolidated Financial StatementsFor the year ended December 31, 2020

NO
TES
TO A
ND
FO
RM
ING
PAR
T O
F TH
E U
NC
ON
SOLI
DAT
ED F
INAN
CIA
L ST
ATEM
ENTS
FOR
TH
E YE
AR E
ND
ED D
ECEM
BER
31,
202
0
44.
REL
ATED
PAR
TY T
RAN
SAC
TIO
NS
The
Bank
has
rela
ted
party
tran
sact
ions
with
its
asso
ciat
es, s
ubsi
diar
y co
mpa
nies
, em
ploy
ee b
enef
it pl
ans
and
its D
irect
ors
and
Key
Man
agem
ent P
erso
nnel
.
Det
ails
of t
rans
actio
ns w
ith re
late
d pa
rties
dur
ing
the
year
, oth
er th
an th
ose
whi
ch h
ave
been
dis
clos
ed e
lsew
here
in th
ese
unco
nsol
idat
ed fi
nanc
ial s
tate
men
ts, a
re a
s fo
llow
s:
Balan
ces w
ith o
ther
ban
ks
In cu
rrent
acco
unts
-
-
-
1,4
82,28
0-
-
-
-
-
1,614
,178
-
-
In de
posit
acco
unts
-
-
-
-
-
-
-
-
-
3,871
,626
-
-
-
-
-
1,4
82,28
0-
-
-
-
-
5,485
,804
-
-
Inve
stm
ents
Open
ing ba
lance
-
-
-
5,4
06,16
61,5
82,48
53,9
43,20
2-
-
-
5,406
,166
1,238
,483
4,183
,880
Inves
tmen
t mad
e dur
ing th
e yea
r-
-
-
-
-
54
,287
-
-
-
-
36
0,000
-
Inv
estm
ent r
edee
med /
disp
osed
off d
uring
the y
ear
-
-
-
-
-
-
-
-
-
-
(15,9
98)
(240
,353)
Tran
sfer in
/ (o
ut) -
net
-
-
-
-
-
-
-
-
-
-
-
(3
25)
Clos
ing ba
lance
-
-
-
5,4
06,16
61,5
82,48
53,9
97,48
9-
-
-
5,406
,166
1,582
,485
3,943
,202
Prov
ision
for d
iminu
tion i
n valu
e of in
vestm
ents
-
-
-
1,6
88,91
1-
1,544
,596
-
-
-
1,6
88,91
1-
1,134
,720
Adva
nces
Open
ing ba
lance
-
4,6
2422
0,133
-
2,155
,149
12,71
5,998
-
2,2
2116
0,405
-
2,155
,149
6,747
,749
Addit
ion du
ring t
he ye
ar-
838
72,46
2-
-
16,39
8,899
-
15
,958
145,4
17-
-
6,591
,282
Repa
id du
ring t
he ye
ar-
(5,45
2)(6
8,603
)-
(1
52,75
5)(1
9,749
,210)
-
(1
3,555
)(8
5,689
)-
-
(623
,033)
Tran
sfer o
ut - n
et-
-
13
,869
-
(2,00
2,394
)-
-
-
-
-
-
-
Cl
osing
balan
ce-
1023
7,861
-
-
9,3
65,68
7-
4,624
220,1
33-
2,1
55,14
912
,715,9
98
Prov
ision
held
again
st ad
vanc
es-
-
-
-
-
-
-
-
-
-
2,1
55,14
9-
The
Bank
ente
rsin
totra
nsac
tions
with
rela
ted
parti
esin
the
ordi
nary
cour
seof
busi
ness
and
onsu
bsta
ntia
llyth
esa
me
term
sas
forc
ompa
rabl
etra
nsac
tions
with
pers
onof
sim
ilars
tand
ing.
Con
tribu
tions
toan
dac
crua
lsin
resp
ecto
fsta
ffre
tirem
entb
enef
itsan
dot
herb
enef
itpl
ans
are
mad
ein
acco
rdan
cew
ithth
eac
tuar
ialv
alua
tions
/ter
ms
ofth
eco
ntrib
utio
npl
an.R
emun
erat
ion
to th
e ex
ecut
ives
/ of
ficer
s is
det
erm
ined
in a
ccor
danc
e w
ith th
e te
rms
of th
eir a
ppoi
ntm
ent.
Othe
r rela
ted
parti
esDi
rect
ors
Key
man
agem
ent
pers
onne
lSu
bsid
iaries
Asso
ciate
s
2019
2020
------
------
------
------
------
------
------
------
------
------
------
------
------
------
------
------
------
------
------
-----
(Rup
ees i
n '00
0) --
------
------
------
------
------
------
------
------
------
------
------
------
------
------
------
------
------
------
------
---
Dire
ctor
sKe
y m
anag
emen
t pe
rson
nel
Subs
idiar
iesAs
socia
tes
Othe
r rela
ted
parti
esPa
rent
Pare
nt
62
United Bank Limited136
Not
es to
and
form
ing
part
of t
he U
ncon
solid
ated
Fin
anci
al S
tate
men
tsFo
r the
yea
r end
ed D
ecem
ber 3
1, 2
020

NO
TES
TO A
ND
FO
RM
ING
PAR
T O
F TH
E U
NC
ON
SOLI
DAT
ED F
INAN
CIA
L ST
ATEM
ENTS
FOR
TH
E YE
AR E
ND
ED D
ECEM
BER
31,
202
0
Othe
r Ass
ets
Inter
est m
ark-u
p acc
rued
-
-
-
-
4,2
8223
2,471
-
-
-
-
7,2
8932
5,704
Rece
ivable
from
staff
retire
ment
fund
-
-
-
-
-
24,16
0-
-
-
-
-
20
8,312
Adva
nces
, Dep
osits
& P
repa
ymen
ts-
-
-
-
-
63
,634
-
-
-
-
-
113,6
34Pr
epaid
insu
ranc
e-
-
-
-
1,002
-
-
-
-
-
2,167
-
Di
viden
d Rec
eivab
le-
-
-
-
-
10
4,215
-
-
-
-
-
-
Ot
her r
eceiv
able
-
-
-
11
,983
-
30
,164
-
-
-
21
,989
1,505
30,16
4
Prov
ision
again
st oth
er as
sets
-
-
-
-
-
30,16
4-
-
-
-
-
30
,164
Borro
wing
s
Open
ing ba
lance
-
-
-
-
-
-
-
-
-
1,364
,695
-
12
,400
Borro
wing
s dur
ing th
e yea
r-
-
-
1,760
,102
-
1,5
38,00
0-
-
-
613,4
92-
579,4
00Se
ttled d
uring
the y
ear
-
-
-
(1
61,77
9)-
(1,53
8,000
)-
-
-
(1,97
8,187
)-
(591
,800)
Clos
ing ba
lance
-
-
-
1,5
98,32
3-
-
-
-
-
-
-
-
Depo
sits a
nd o
ther
acco
unts
Open
ing ba
lance
-
8,6
79,45
049
,368
211,8
706,5
02,93
111
,346,7
52-
6,245
,367
66,30
231
2,882
11,63
8,644
8,488
,923
Rece
ived d
uring
the y
ear
-
29
,415,7
691,2
65,71
015
,708,6
4114
4,141
,551
177,6
27,32
9-
38,66
6,071
913,2
7114
,227,8
6616
0,641
,938
267,6
58,06
6W
ithdr
awn d
uring
the y
ear
-
(3
1,659
,519)
(1,19
2,377
)(1
5,639
,495)
(148
,166,0
50)
(172
,469,6
03)
-
(3
6,231
,988)
(930
,205)
(14,3
28,87
8)(1
65,77
7,647
)(2
64,80
0,237
)Tr
ansfe
r (ou
t) / in
- ne
t-
(3,91
0)(5
9,940
)-
-
6,541
-
-
-
-
(4
)-
Clos
ing ba
lance
-
6,4
31,79
062
,761
281,0
162,4
78,43
216
,511,0
19-
8,679
,450
49,36
821
1,870
6,502
,931
11,34
6,752
Othe
r Liab
ilities
Inter
est /
mar
k-up p
ayab
le on
depo
sits a
nd bo
rrowi
ngs
-
39
,335
210
1,182
7,651
115,0
24-
35,25
7-
-
72,23
394
,554
Paya
ble to
staff
retire
ment
fund
-
-
-
-
-
1,122
,023
-
-
-
-
-
725,6
19Un
earn
ed in
come
-
-
-
1,4
85-
-
-
-
-
-
-
13
,869
Othe
r Pay
able
-
3,9
00-
-
22,35
3-
-
-
-
24
,344
-
-
Dire
ctor
sKe
y m
anag
emen
t pe
rson
nel
Subs
idiar
iesAs
socia
tes
Othe
r rela
ted
parti
es
Key
man
agem
ent
pers
onne
lSu
bsid
iaries
Asso
ciate
sOt
her r
elate
d pa
rties
Dire
ctor
s
2020
2019
Pare
nt
------
------
------
------
------
------
------
------
------
------
------
------
------
------
------
------
------
------
------
-----
(Rup
ees i
n '00
0) --
------
------
------
------
------
------
------
------
------
------
------
------
------
------
------
------
------
------
------
---
Pare
nt
63
137Annual Report 2020
Not
es to
and
form
ing
part
of t
he U
ncon
solid
ated
Fin
anci
al S
tate
men
tsFo
r the
yea
r end
ed D
ecem
ber 3
1, 2
020

NO
TES
TO A
ND
FO
RM
ING
PAR
T O
F TH
E U
NC
ON
SOLI
DAT
ED F
INAN
CIA
L ST
ATEM
ENTS
FOR
TH
E YE
AR E
ND
ED D
ECEM
BER
31,
202
0
Cont
inge
ncies
and
Com
mitm
ents
Lette
r of g
uara
ntee
-
-
-
11
,053
-
4,3
60-
-
-
220,0
92-
-
Fo
rwar
d for
eign e
xcha
nge c
ontra
cts pu
rchas
e-
-
-
1,777
,719
-
-
-
-
-
2,0
35,23
8-
-
Fo
rwar
d for
eign e
xcha
nge c
ontra
cts sa
le-
-
-
1,758
,178
-
-
-
-
-
2,0
28,07
8-
-
Inco
me
Mark-
up /
retur
n / in
teres
t ear
ned
-
-
15,82
387
,462
34,83
51,2
20,36
4-
-
13
,145
132,2
1857
,978
820,9
43Co
mmiss
ion /
char
ges r
ecov
ered
-
613,7
511,0
9424
,666
23,05
9-
425
3,995
597
12,61
722
,937
Divid
end i
ncom
e-
-
-
379,0
3918
,472
175,7
94-
-
-
323,5
9991
,518
373,7
64Ne
t gain
on sa
le of
secu
rities
-
-
-
-
-
-
-
-
-
-
-
28
,515
Othe
r inco
me-
-
7,1
662,2
8552
415
,359
-
-
989
1,490
4,214
22,82
7Re
serva
l of P
rovis
ion-
-
-
-
152,7
55-
-
-
-
-
-
-
Sw
itch R
even
ue-
-
-
-
-
22
0,127
-
-
-
-
-
249,1
24Ma
nage
ment
fee-
-
-
2,548
-
-
-
-
-
4,8
57-
-
Expe
nse
Mark-
up /
retur
n / in
teres
t paid
-
18
4,964
663
13,02
037
3,541
345,4
84-
155,2
891,3
7341
,683
767,2
0038
6,351
Remu
nera
tion p
aid-
-
67
0,774
-
-
-
-
-
445,1
65-
-
-
Po
st em
ploym
ent b
enefi
ts-
-
23
,565
-
-
-
-
-
22,80
7-
-
-
No
n-ex
ecuti
ve di
recto
rs' fe
e -
86,20
0-
-
-
-
-
96
,075
-
-
-
-
Ne
t cha
rge f
or de
fined
contr
ibutio
n plan
s-
-
-
-
-
36
4,906
-
-
-
-
-
327,0
37Ne
t (re
versa
l) / ch
arge
for
defin
ed be
nefit
plans
-
-
-
-
-
272,5
92-
-
-
-
-
22
8,742
Othe
r exp
ense
s-
-
-
14,92
2-
44,87
5-
-
-
13,59
4-
49,36
3Cl
earin
g Cha
rges
-
-
-
-
-
138,4
87-
-
-
-
-
12
9,727
Semi
nar a
nd M
embe
rship
fees
-
-
-
-
-
8,246
-
-
-
-
-
13,84
5Me
mber
ship,
Sub
scrip
tion,
Spon
sorsh
ip a
nd m
ainten
ance
char
ges
-
-
-
-
-
7,358
-
-
-
-
-
14,53
4Cu
stody
Cha
rges
-
-
-
-
-
4,757
-
-
-
-
-
6,401
Insur
ance
prem
ium pa
id-
-
-
-
536,2
98-
-
-
-
-
34
8,690
-
Ins
uran
ce cl
aims s
ettled
-
-
-
-
48
5,047
-
-
-
-
-
330,4
15-
Asso
ciate
sOt
her r
elate
d pa
rties
Dire
ctor
sKe
y m
anag
emen
t pe
rson
nel
Subs
idiar
iesAs
socia
tes
Othe
r rela
ted
parti
esPa
rent
2019
Pare
nt
------
------
------
------
------
------
------
------
------
------
------
------
------
------
------
------
------
------
------
-----
(Rup
ees i
n '00
0) --
------
------
------
------
------
------
------
------
------
------
------
------
------
------
------
------
------
------
------
---
2020
Dire
ctor
sKe
y m
anag
emen
t pe
rson
nel
Subs
idiar
ies
64
United Bank Limited138
Not
es to
and
form
ing
part
of t
he U
ncon
solid
ated
Fin
anci
al S
tate
men
tsFo
r the
yea
r end
ed D
ecem
ber 3
1, 2
020

NOTES TO AND FORMING PART OF THE UNCONSOLIDATED FINANCIAL STATEMENTSFOR THE YEAR ENDED DECEMBER 31, 2020
45. CAPITAL ADEQUACY, LEVERAGE RATIO & LIQUIDITY REQUIREMENTS 2020 2019
Minimum Capital Requirement (MCR):Paid-up capital (net of losses) 12,241,797 12,241,797
Capital Adequacy Ratio (CAR):Eligible Common Equity Tier 1 (CET 1) Capital 126,860,060 114,847,818 Eligible Additional Tier 1 (ADT 1) Capital 9,934,770 9,834,770 Total Eligible Tier 1 Capital 136,794,830 124,682,588 Eligible Tier 2 Capital 45,102,462 33,900,041 Total Eligible Capital (Tier 1 + Tier 2) 181,897,292 158,582,629
Risk Weighted Assets (RWAs):Credit Risk 532,509,650 641,690,286 Market Risk 54,441,838 48,583,248 Operational Risk 157,614,605 146,919,473 Total 744,566,093 837,193,007
Common Equity Tier 1 Capital Adequacy Ratio 17.04% 13.72%Tier 1 Capital Adequacy Ratio 18.37% 14.89%Total Capital Adequacy Ratio 24.43% 18.94%
2020 2019
Leverage Ratio (LR):Eligible Tier-1 Capital 136,794,830 124,682,588Total Exposures 2,456,802,603 2,377,100,067Leverage Ratio 5.57% 5.25%
Liquidity Coverage Ratio (LCR):Total High Quality Liquid Assets 1,035,616,032 530,454,588 Total Net Cash Outflow 324,975,005 206,998,861 Liquidity Coverage Ratio 318.68% 256.26%
Net Stable Funding Ratio (NSFR):Total Available Stable Funding 1,714,566,321 1,598,050,689Total Required Stable Funding 770,865,635 1,170,120,900Net Stable Funding Ratio 222.42% 136.57%
45.1 The full disclosures on the CAPITAL ADEQUACY, LEVERAGE RATIO & LIQUIDITY REQUIREMENTS as per SBPinstructions issued from time to time are placed on the website. The link to the full disclosure is available athttps://www.ubldigital.com/Investor-Relations/CAR-Statements.aspx.
------- (Rupees in '000) -------
The SBP through its BSD Circular No. 07 dated April 15, 2009, has prescribed the minimum paid-up capital (net ofaccumulated losses) for Banks to be raised to Rs.10,000 million by the year ending December 31, 2015. The paid-upcapital of the Bank for the year ended December 31, 2020, stood at Rs.12,241.797 million (2019: Rs.12,241.797 million)and is in compliance with SBP requirements. Banks are also required to maintain a minimum Capital Adequacy Ratio(CAR) of 10.0% plus capital conservation buffer of 2.5% and High Loss Absorbency Requirement of 1.0% of the riskweighted exposures of the Bank.
Under the current capital adequacy regulations, credit risk and market risk exposures are measured using the StandardizedApproach and operational risk is measured using the Basic Indicator Approach. Credit risk mitigants are applied against theBank’s exposures based on eligible collateral under comprehensive approach.
------- (Rupees in '000) -------
Furthermore, under the SBP’s Framework for Domestic Systemically Important Banks (D-SIBs) introduced vide BPRDCircular No. 04 of 2019 dated April 13, 2019, UBL has been designated as a D-SIB. In line with this framework, the Bank isrequired to meet the Higher Loss Absorbency (HLA) capital charge of 1.0%, in the form of Additional CET 1 capital, on astandalone as well as consolidated level during 2020. As per SBP’s designation of D-SIBs for the year 2020, the HLAcapital charge is required to be maintained by UBL is 1.0% and will remain effective till next D-SIB designation isannounced by the State Bank of Pakistan.
In order to dampen the effects of COVID-19, the State Bank of Pakistan under BPRD Circular Letter No. 12 of 2020 hasgiven a regulatory relief and reduced the Capital Conservation Buffer (CCB) as prescribed vide BPRD Circular No. 6 ofAugust 15, 2013, for the time being, from its existing level of 2.5% to 1.5%, till further instructions.
Further, under Basel III instructions, Banks are also required to maintain a Common Equity Tier 1 (CET 1) ratio and Tier 1 ratio of 6.0% and 7.5%, respectively, as at December 31, 2020. The Bank is fully compliant with prescribed ratios as the Bank’s CAR is 24.4% whereas CET 1 and Tier 1 ratios stood at 17.0% and 18.4% respectively.
65139Annual Report 2020
Notes to and forming part of the Unconsolidated Financial StatementsFor the year ended December 31, 2020

NOTES TO AND FORMING PART OF THE UNCONSOLIDATED FINANCIAL STATEMENTSFOR THE YEAR ENDED DECEMBER 31, 2020
46. RISK MANAGEMENT
- Determining guidelines relating to the Bank’s risk appetite.-
-
- Developing systems and resources to review the key risk exposures of the Bank. - Approving credits and granting approval authority to qualified and experienced individuals.- Reviewing the adequacy of credit training across the Bank.- Organizing portfolio reviews focusing on quality assessment, risk profiles, industry concentrations etc.- Setting systems to identify significant portfolio indicators, problem credits and level of provisioning required.-
46.1
46.2 Credit risk
This section presents information about the Bank’s exposure to and its management and control of risks, in particular, theprimary risks associated with its use of financial instruments such as credit, market, liquidity, and operational risks.
The Bank has an integrated risk management structure in place covering domestic and International franchise.The BoardRisk and Compliance Committee (BRCC) oversees the entire risk management process of the Bank. Furthermore, RiskManagement Committee has been formed which looks at all risks collectively at senior management level. The committeeis chaired by the President and comprises of Heads of all Risk areas, Finance, Business etc. The Risk and Credit PolicyGroup is responsible for the development and implementation of all risk policies as approved by the BRCC / BoD. Thegroup is organized into the functions of Market & Treasury Risk, Financial Institution Risk, Credit Policy & Research,Consumer Credit Policy, Credit Risk Management and Operational Risk & Basel. Each risk function is headed by a seniormanager who reports directly to the Group Executive, Risk and Credit Policy. The role of the Risk and Credit Policy Groupincludes:
Recommending risk management policies in accordance with the Prudential Regulations, Basel II / III framework,Regulatory framework of foreign countries where the bank operates and international best practices.
Reviewing policies / manuals and ensuring that these are in accordance with BRCC / BoD approved risk managementpolicies.
Establish an extensive Information Security (IS) Program and governance structure to manage the Security of theInformation assets.
The COVID-19 pandemic has taken a toll on all economies and emerged as a contagion risk around the globe, includingPakistan. To reduce the impact on businesses and economies in general, regulators / governments across the globe haveintroduced a host of measures on both the fiscal and economic fronts.
The State Bank of Pakistan (SBP) has responded to the crisis by cutting the policy rate by 625 basis points to 7 percentand by introducing regulatory measures to maintain banking system soundness and to sustain economic activity. Theseinclude (i) reducing the capital conservation buffer by 100 basis points to 1.5 percent; (ii) increasing the regulatory limit onextension of credit to SMEs by 44 percent to Rs. 180 million; (iii) relaxing the debt burden ratio for consumer loans from 50percent to 60 percent; (iv) allowing banks to defer clients’ payment of principal on loan obligations by one year; and (v)relaxing regulatory criteria for restructured/rescheduled loans for borrowers who require relief beyond the extension ofprincipal repayment for one year and / or mark-up with no reflection on credit history; and Introduction of refinancingschemes for payment of wages and salaries.
COVID-19 have impacted banks in Pakistan on a number of fronts including increase in overall credit risk pertaining to theloans and advances portfolio, reduced fee income due to overall slowdown in economic activity, continuity of businessoperations and managing cybersecurity threat as a significant number of the Bank’s staff is working from home and an everincreasing number of customers are being encouraged to use digital channels.
Credit risk is the risk that a customer or counterparty may not settle an obligation for full value, either when due or at anytime thereafter. This risk arises from the potential that a customer's or counterparty’s willingness or ability to meet such anobligation is impaired, resulting in an economic loss to the Bank.
The credit risk management process is driven by the Bank's Risk Management Policy, Credit Policy for Corporate,Commercial, SME & Agri, Collateral Management Policy, Credit Policy International, Credit Policy UAE and Credit Manual,which provides policies and procedures in relation to credit initiation, approval, documentation and disbursement, creditmaintenance and remedial management.
66
NOTES TO AND FORMING PART OF THE UNCONSOLIDATED FINANCIAL STATEMENTSFOR THE YEAR ENDED DECEMBER 31, 2020
46.2.1 Lendings to financial institutions
Credit risk by public / private sector
2020 2019 2020 2019 2020 2019
Public / Government 6,433,114 - - - - - Private 13,526,018 20,183,118 - - - -
19,959,132 20,183,118 - - - -
46.2.2 Investment in debt securities
Credit risk by industry sector
2020 2019 2020 2019 2020 2019
Airlines - 391,504 - 391,504 - - Automobile and transportation equipment 3,517,627 6,180,479 - - - - Chemical and pharmaceuticals 163,719 194,104 61,263 91,288 61,263 91,288Construction 927,180 955,929 - - - - Exports / Imports 734,470 773,421 - - - - Fertilizers 252,767 1,384,516 - - - - Financial 1,083,468,800 770,901,869 - 78,784 - 78,784Food 436 437 436 437 436 437Insurance 62,207 1,607,579 - - - - Power (electricity), gas, water, sanitary 19,112,814 24,462,115 - - - - Telecommunication - 837,100 - - - - Textile 529,263 529,262 228,925 228,922 228,925 228,923Others 3,368,506 16,382,166 1,872 1,872 1,872 1,872
1,112,137,789 824,600,481 292,496 792,807 292,496 401,304
The Risk Management function of the Bank is regularly conducting assessments of the credit portfolio to identify borrowersmost likely to get affected due to changes in the business and economic environment. The Bank has further strengthenedits credit review procedures in the light of COVID-19. The Bank is continuously reviewing the portfolio, to identify accountssusceptible to higher risk, resulting from the COVID-19 outbreak.
Individual credit authorities are delegated to credit officers by the Group Executive - Risk & Credit Policy (authorised byBoD), according to their seasoning / maturity. Approvals for Consumer loans are centralized, while approval authorities forInternational, Corporate, Commercial, SME and Agri exposures are delegated at a Country / Regional level. Furthermore,credit authorities are also delegated to business teams in various regions for Commercial, SME & Agri lending. All creditpolicy functions domestic & international are centrally organized.
Concentrations of credit risk exist if clients are engaged in similar activities, or are located in the same geographical region,or have comparable economic characteristics such that their ability to meet contractual obligations would be similarlyaffected by changes in economic, political or other conditions. The Bank manages, limits and controls concentrations ofcredit risk to individual counterparties and groups, and to industries, where appropriate. Limits are also applied to portfoliosor sectors where the Bank considers it appropriate to restrict credit risk concentrations, or to areas of higher risk, or tocontrol the rate of portfolio growth.
Gross lendings Non-performing lendings Provision held
--------------------------------------------------------------- (Rupees in '000) ---------------------------------------------------------------
--------------------------------------------------------------- (Rupees in '000) ---------------------------------------------------------------
Provision heldGross investments Non-performing investments
IFRS 9 is applicable to the overseas branches of the Bank and requires the estimation of Expected Credit Loss (ECL)based on current and forecast economic conditions. The Bank has reviewed the potential impact of the COVID-19 outbreakon the inputs and assumptions for IFRS 9 ECL measurement in light of available information. Overall, the COVID-19situation remains fluid and is rapidly evolving at this point, which makes it challenging to reliably reflect impacts in ECLestimates. The Bank is assessing the situation as it develops and is in the process of accounting for the same in its ECLestimates.
67
United Bank Limited140
Notes to and forming part of the Unconsolidated Financial StatementsFor the year ended December 31, 2020

NOTES TO AND FORMING PART OF THE UNCONSOLIDATED FINANCIAL STATEMENTSFOR THE YEAR ENDED DECEMBER 31, 2020
46.2.1 Lendings to financial institutions
Credit risk by public / private sector
2020 2019 2020 2019 2020 2019
Public / Government 6,433,114 - - - - - Private 13,526,018 20,183,118 - - - -
19,959,132 20,183,118 - - - -
46.2.2 Investment in debt securities
Credit risk by industry sector
2020 2019 2020 2019 2020 2019
Airlines - 391,504 - 391,504 - - Automobile and transportation equipment 3,517,627 6,180,479 - - - - Chemical and pharmaceuticals 163,719 194,104 61,263 91,288 61,263 91,288Construction 927,180 955,929 - - - - Exports / Imports 734,470 773,421 - - - - Fertilizers 252,767 1,384,516 - - - - Financial 1,083,468,800 770,901,869 - 78,784 - 78,784Food 436 437 436 437 436 437Insurance 62,207 1,607,579 - - - - Power (electricity), gas, water, sanitary 19,112,814 24,462,115 - - - - Telecommunication - 837,100 - - - - Textile 529,263 529,262 228,925 228,922 228,925 228,923Others 3,368,506 16,382,166 1,872 1,872 1,872 1,872
1,112,137,789 824,600,481 292,496 792,807 292,496 401,304
The Risk Management function of the Bank is regularly conducting assessments of the credit portfolio to identify borrowersmost likely to get affected due to changes in the business and economic environment. The Bank has further strengthenedits credit review procedures in the light of COVID-19. The Bank is continuously reviewing the portfolio, to identify accountssusceptible to higher risk, resulting from the COVID-19 outbreak.
Individual credit authorities are delegated to credit officers by the Group Executive - Risk & Credit Policy (authorised byBoD), according to their seasoning / maturity. Approvals for Consumer loans are centralized, while approval authorities forInternational, Corporate, Commercial, SME and Agri exposures are delegated at a Country / Regional level. Furthermore,credit authorities are also delegated to business teams in various regions for Commercial, SME & Agri lending. All creditpolicy functions domestic & international are centrally organized.
Concentrations of credit risk exist if clients are engaged in similar activities, or are located in the same geographical region,or have comparable economic characteristics such that their ability to meet contractual obligations would be similarlyaffected by changes in economic, political or other conditions. The Bank manages, limits and controls concentrations ofcredit risk to individual counterparties and groups, and to industries, where appropriate. Limits are also applied to portfoliosor sectors where the Bank considers it appropriate to restrict credit risk concentrations, or to areas of higher risk, or tocontrol the rate of portfolio growth.
Gross lendings Non-performing lendings Provision held
--------------------------------------------------------------- (Rupees in '000) ---------------------------------------------------------------
--------------------------------------------------------------- (Rupees in '000) ---------------------------------------------------------------
Provision heldGross investments Non-performing investments
IFRS 9 is applicable to the overseas branches of the Bank and requires the estimation of Expected Credit Loss (ECL)based on current and forecast economic conditions. The Bank has reviewed the potential impact of the COVID-19 outbreakon the inputs and assumptions for IFRS 9 ECL measurement in light of available information. Overall, the COVID-19situation remains fluid and is rapidly evolving at this point, which makes it challenging to reliably reflect impacts in ECLestimates. The Bank is assessing the situation as it develops and is in the process of accounting for the same in its ECLestimates.
67
141Annual Report 2020
Notes to and forming part of the Unconsolidated Financial StatementsFor the year ended December 31, 2020

NOTES TO AND FORMING PART OF THE UNCONSOLIDATED FINANCIAL STATEMENTSFOR THE YEAR ENDED DECEMBER 31, 2020
2020 2019 2020 2019 2020 2019
Credit risk by public / private sector
Public / Government 1,022,772,243 813,397,809 - 391,504 - - Private 89,365,546 11,202,672 292,496 401,303 292,496 401,304
1,112,137,789 824,600,481 292,496 792,807 292,496 401,304
46.2.3 Advances
Credit risk by industry sector
2020 2019 2020 2019 2020 2019
Agri business 7,598,682 9,637,263 1,170,019 716,680 599,102 316,451Airlines 5,401,008 7,495,899 1,452,187 1,429,361 1,452,187 1,429,288Automobile and transportation equipment 12,951,474 13,824,442 125,409 122,851 122,109 122,105Cables 1,026,167 1,175,344 616,751 646,792 616,751 646,792Cement 8,822,532 7,919,680 285,636 278,426 285,636 136,211Chemical and pharmaceuticals 6,336,985 12,846,614 113,399 127,834 113,399 120,009Construction 22,498,752 26,783,185 7,112,201 7,124,989 6,159,594 4,008,433Contractors 4,753,204 9,971,659 1,120,451 842,215 1,120,451 679,587Electronics and electrical appliances 10,092,057 13,708,661 8,367,344 8,243,692 6,366,180 6,230,582Engineering 15,557,031 20,368,902 1,516,238 1,109,848 446,044 39,379Fertilizer dealers 11,819,949 14,811,984 63,246 53,298 61,996 46,548Financial 42,955,164 46,793,024 3,530,909 3,459,784 3,530,909 3,459,718Food industries 70,617,073 81,649,269 7,212,424 7,479,545 5,609,657 5,158,605Glass and allied 277,867 386,633 - - - - Hotels 2,190,534 2,111,627 595,259 616,777 595,259 616,777Individuals 48,150,725 51,755,223 8,076,206 8,240,618 5,678,232 5,179,753Paper and allied 2,013,682 2,000,326 639,480 625,182 628,987 614,656Polyester and fiber 3,280,957 4,498,424 1,577,051 1,577,051 1,577,051 1,577,051Production and transmission of energy 155,746,888 193,356,305 5,068,974 4,890,901 3,391,991 4,925,046Shoes and leather garments 2,816,497 2,975,885 2,191,352 2,320,414 2,189,602 2,281,613Sports goods 173,915 272,124 4,300 5,100 4,300 5,100Sugar 4,454,866 5,626,661 175,729 180,729 175,729 180,729Surgical and metal 200,557 42,987 - - - - Telecommunication 24,101,854 20,027,491 3,293,224 2,815,881 3,293,224 2,827,769Textile composite 40,862,679 32,023,671 3,782,368 3,910,358 3,782,368 3,910,358Textile others 11,232,898 16,890,483 2,047,876 2,402,729 2,041,748 2,395,346Textile spinning 12,912,492 19,088,233 3,662,420 3,867,408 3,662,420 3,867,408Textile weaving 5,975,856 7,819,768 351,348 421,724 351,348 356,813Wholesale traders 38,286,130 35,673,686 11,210,283 8,069,156 10,600,840 7,977,518Others 36,198,533 41,416,038 8,261,659 5,406,383 7,298,554 4,506,270
609,307,008 702,951,491 83,623,743 76,985,726 71,755,668 63,615,915
--------------------------------------------------------------- (Rupees in '000) ---------------------------------------------------------------
Provision heldGross investments Non-performing investments
Gross advances Non-performing advances Provision held
--------------------------------------------------------------- (Rupees in '000) ---------------------------------------------------------------
68United Bank Limited142
Notes to and forming part of the Unconsolidated Financial StatementsFor the year ended December 31, 2020

NOTES TO AND FORMING PART OF THE UNCONSOLIDATED FINANCIAL STATEMENTSFOR THE YEAR ENDED DECEMBER 31, 2020
Credit risk by public / private sector
2020 2019 2020 2019 2020 2019
Public / Government 204,260,276 237,692,845 1,089,630 1,089,630 22,313 22,313Private 405,046,732 465,258,646 82,534,113 75,896,096 71,733,355 63,593,602
609,307,008 702,951,491 83,623,743 76,985,726 71,755,668 63,615,915
2020 2019
46.2.4 Contingencies and Commitments
Credit risk by industry sector Agri business 17,715,477 5,468,525Airlines 2,262,738 1,799,768Automobile and transportation equipment 1,957,467 1,969,736Cables 574,708 359,209Cement 2,795,619 5,557,937Chemical and pharmaceuticals 4,929,608 3,534,842Construction 5,062,724 12,048,828Containers and ports 1,069,170 1,154,416Contractors 1,782,745 2,649,175Electronics and electrical appliances 2,473,426 398,469Engineering 9,018,950 8,274,367Fertilizer dealers 5,651,372 3,179,706Financial 697,641,219 1,003,277,075Food industries 5,254,917 7,336,979Glass and allied 186,220 287,000Hotels 2,015,989 69,740Individuals 18,277,661 15,431,641Paper and allied 1,686,887 2,638,436Polyester and fiber 2,829,494 3,819,949Production and transmission of energy 127,733,243 142,488,054Shoes and leather garments 30,075 56,330Sugar 58,914 99,262Surgical and metal 507,612 155,994Telecommunication 6,024,903 14,700,186Textile composite 1,958,314 673,835Textile others 6,075,082 6,143,341Textile spinning 6,375,600 2,261,400Textile weaving 2,284,934 1,614,426Wholesale traders 1,434,752 1,270,211Others 119,573,392 142,945,512
1,055,243,212 1,391,664,349Credit risk by public / private sector Public / Government 256,923,452 426,665,080Private 798,319,760 964,999,269
1,055,243,212 1,391,664,349
--------------------------------------------------------------- (Rupees in '000) ---------------------------------------------------------------
------- (Rupees in '000) -------
Gross advances Non-performing advances Provision held
69143Annual Report 2020
Notes to and forming part of the Unconsolidated Financial StatementsFor the year ended December 31, 2020

NOTES TO AND FORMING PART OF THE UNCONSOLIDATED FINANCIAL STATEMENTSFOR THE YEAR ENDED DECEMBER 31, 2020
46.2.5 Concentration of Advances
2020 2019
Funded 140,816,028 175,759,229Non Funded 144,008,127 131,997,318Total Exposure 284,824,155 307,756,547
The sanctioned limits against these top 10 exposures aggregated to Rs. 306,651 million (2019: Rs.322,710 million).
46.2.6 Advances - Province / Region-wise Disbursement & Utilisation
Province / Region
Punjab 127,665,134 127,665,134 - - - - - Sindh 195,268,735 - 195,268,735 - - - - KPK including FATA 986,009 - - 986,009 - - - Balochistan 826,969 - - - 826,969 - - Islamabad 117,094,564 - - - - 117,094,564 - AJK including Gilgit-Baltistan 119,277 - - - - - 119,277Total 441,960,688 127,665,134 195,268,735 986,009 826,969 117,094,564 119,277
Province / Region
Punjab 163,251,257 163,251,257 - - - - - Sindh 221,221,535 - 221,221,535 - - - - KPK including FATA 1,409,927 - - 1,409,927 - - - Balochistan 869,842 - - - 869,842 - - Islamabad 120,402,344 - - - - 120,402,344 - AJK including Gilgit-Baltistan 151,138 - - - - - 151,138Total 507,306,043 163,251,257 221,221,535 1,409,927 869,842 120,402,344 151,138
46.3 Market Risk
2020
2019
AJK including Gilgit-BaltistanIslamabadBalochistanKPK including
FATASindhPunjabDisburse-
ments
---------------------------------------------------------------------------- (Rupees in '000) ---------------------------------------------------------------------------
Disburse-ments
---------------------------------------------------------------------------- (Rupees in '000) ---------------------------------------------------------------------------
Utilisation
Punjab Sindh KPK including FATA Islamabad AJK including
Gilgit-Baltistan
------- (Rupees in '000) -------
The Bank's top 10 exposures on the basis of total (funded and non-funded exposures) aggregated to Rs. 284,824 million(2019: 307.757 million) are as following:
Utilisation
Market risk is the risk that the fair value of a financial instrument will fluctuate due to movements in market prices. It resultsfrom changes in interest rates, exchange rates and equity prices as well as from changes in the correlations between them.Each of these components of market risk consists of a general market risk and a specific market risk that is driven by thenature and composition of the portfolio.
Measuring and controlling market risk is usually carried out at a portfolio level. However, certain controls are applied, wherenecessary, to individual risk types, to particular books and to specific exposures. Controls are also applied to prevent anyundue risk concentrations in trading books, taking into account variations in price, volatility, market depth and liquidity.These controls include limits on exposure to individual market risk variables as well as limits on concentrations of tenorsand issuers.
Balochistan
70United Bank Limited144
Notes to and forming part of the Unconsolidated Financial StatementsFor the year ended December 31, 2020

NOTES TO AND FORMING PART OF THE UNCONSOLIDATED FINANCIAL STATEMENTSFOR THE YEAR ENDED DECEMBER 31, 2020
The functions of the Market Risk Management unit are as follows:
- Monitor the market risk exposure remain within the Bank’s risk appetite as assigned by the BoD and the BRCC.
-
-
-
46.3.1 Balance sheet split by trading and banking books
Banking book
Trading book Total Banking
bookTrading
book Total
Cash and balances with treasury banks 250,838,052 - 250,838,052 235,861,767 - 235,861,767Balances with other banks 13,888,765 - 13,888,765 20,729,005 - 20,729,005Lendings to financial institutions 19,959,132 - 19,959,132 20,183,118 - 20,183,118Investments 434,377,680 694,296,814 1,128,674,494 447,683,065 392,639,587 840,322,652Advances 530,279,496 - 530,279,496 635,834,217 - 635,834,217Fixed assets 51,207,703 - 51,207,703 52,396,877 - 52,396,877Intangible assets 1,829,211 - 1,829,211 1,951,002 - 1,951,002Deferred tax assets 6,399,267 - 6,399,267 3,300,164 - 3,300,164Other assets 46,507,193 - 46,507,193 82,196,560 - 82,196,560
1,355,286,499 694,296,814 2,049,583,313 1,500,135,775 392,639,587 1,892,775,362
46.3.2 Foreign Exchange Risk
The Bank is an active participant in the cash and derivatives markets for currencies and carries currency risk from thesetrading activities, conducted primarily by the Treasury and Capital Markets Group (TCM). These trading exposures aremonitored through prescribed stress tests and sensitivity analyses.
---------------------------------------------------------------- (Rupees in '000) ----------------------------------------------------------------
The Bank's reporting currency is the Pakistan Rupee, but its assets, liabilities, income and expenses are denominated inmultiple currencies. From time to time, TCM proactively hedges foreign currency exposures resulting from its marketmaking activities, subject to pre-defined limits.
Foreign Exchange Risk is the risk that the fair value of a financial instrument will fluctuate due to changes in foreignexchange rates. Exposures are monitored by currency to ensure that they remain within the established limits for eachcurrency. Exposures are also monitored on an overall basis to ensure compliance with the Bank’s SBP approved ForeignExchange Exposure Limit.
The Market and Treasury Risk division performs market risk management activities. Within this division, the Market RiskManagement unit is responsible for the development and review of market risk policies and processes, and is involved inresearch, financial modelling and testing / implementation of risk management systems, while Treasury Middle Office isresponsible for implementation and monitoring of market risk and other policies, escalation of deviations to seniormanagement, and MIS reporting.
2020 2019
Trading activities are centered in the Treasury and Capital Markets Group which facilitates clients and also runs proprietarypositions. The Bank is active in the cash and derivative markets for equity, interest rate and foreign exchange.
To develop, review and upgrade procedures for the effective implementation of market risk management policiesapproved by the BoD and BRCC.
To review new product proposals and propose / recommend / approve procedures for the management of their marketrisk. Various limits are assigned to different businesses on a product / portfolio basis. The products are approvedthrough product programs, where risks are identified and limits and parameters are set. Any transactions / productsfalling outside these product programs are approved through separate transaction / product memos.
To maintain a comprehensive database for performing risk analysis, stress testing and scenario analysis. Stress testingactivities are performed on a quarterly basis on both the Banking and Trading books.
71145Annual Report 2020
Notes to and forming part of the Unconsolidated Financial StatementsFor the year ended December 31, 2020

NOTES TO AND FORMING PART OF THE UNCONSOLIDATED FINANCIAL STATEMENTSFOR THE YEAR ENDED DECEMBER 31, 2020
2020 2019
US Dollar 200,545,109 119,630,099 (80,120,668) 794,342 207,760,592 129,030,118 (79,134,955) (404,481)Pound Sterling 3,810,575 19,901,304 16,561,167 470,438 1,461,050 18,625,631 17,589,517 424,936Japanese Yen 115,813 98,074 (16,149) 1,590 139,508 116,852 (18,246) 4,410Euro 3,605,786 8,234,827 4,725,445 96,404 2,209,520 7,446,947 5,327,214 89,787UAE Dirham 73,955,103 156,890,634 81,890,688 (1,044,843) 99,199,810 187,237,582 89,194,894 1,157,122Bahraini Dinar 13,936,810 26,800,952 11,751,534 (1,112,608) 15,531,293 25,372,795 10,065,814 224,312Qatari Riyal 16,168,969 28,718,594 12,279,612 (270,013) 19,460,863 27,995,180 9,359,104 824,787Other Currencies 3,867,084 5,311,469 1,387,653 (56,732) 3,998,119 5,715,995 1,203,330 (514,546)
316,005,249 365,585,953 48,459,282 (1,121,422) 349,760,755 401,541,100 53,586,672 1,806,327
Banking book
Trading book
Banking book
Trading book
Impact of 1% change in foreign exchange rates on - Profit and loss account
+1% change - - - - -1% change - - - -
- Other comprehensive income +1% change (11,214) - 18,063 - -1% change 11,214 - (18,063) -
46.3.3 Equity Position Risk
Banking book
Trading book
Banking book
Trading book
Impact of 5% change in equity prices on,Other comprehensive income
+5% change - 552,685 - 709,219 -5% change - (552,685) - (709,219)
46.3.4 Yield / Interest Rate Risk in the Banking Book (IRRBB) - Basel II Specific
Banking book
Trading book
Banking book
Trading book
Impact of 1% change in interest rates on - Profit and loss account
+1% change - (3,363) - (141,853) -1% change - 3,363 - 141,853
- Other comprehensive income +1% change (4,314,788) (1,731,516) (4,639,066) (1,630,607) -1% change 4,314,788 1,731,516 4,639,066 1,630,607
Interest rate risk is the risk that fair value of a financial instrument will fluctuate as a result of changes in interest rates,including changes in the shape of yield curves. Interest rate risk is inherent in many of the Bank's businesses and arisesfrom mismatches between the contractual maturities or the re-pricing of on and off-balance sheet assets and liabilities. Theinterest rate sensitivity profile is prepared on a quarterly basis based on the re-pricing or contractual maturities of assetsand liabilities.
2020 2019
2020 2019
Interest rate risk is monitored and managed by performing periodic gap analysis, sensitivity analysis and stress testing andtaking appropriate actions where required.
Equity position risk is the risk that the fair value of a financial instrument will fluctuate due to changes in the prices ofindividual stocks or the levels of equity indices. The Bank’s equity book comprises of held for trading (HFT) and availablefor sale (AFS) portfolios. The objective of the HFT portfolio is to make short-term capital gains, whilst the AFS portfolio ismaintained with a medium term view of earning both capital gains and dividend income. The Bank has availed therelaxation given by the SBP in respect of determining the impairment charge against AFS securities and has accordinglyrecognised the impairment charge in a phased manner equally on a quarterly basis during the year ended December 31,2020. Product program manuals have been developed to provide guidelines on the objectives and policies, risks andmitigants, limits and controls for the equity portfolios of the Bank.
Foreign Currency Liabilities
Off-balance sheet items
Net foreign currency exposure
2020 2019
Foreign Currency
Assets
Foreign Currency Liabilities
Off-balance sheet items
Net foreign currency exposure
Foreign Currency
Assets---------------------------------------------------------------------------------------------- (Rupees in '000) ---------------------------------------------------------------------------------------------
--------------------------------- (Rupees in '000) ---------------------------------
--------------------------------- (Rupees in '000) ---------------------------------
--------------------------------- (Rupees in '000) ---------------------------------
72United Bank Limited146
Notes to and forming part of the Unconsolidated Financial StatementsFor the year ended December 31, 2020

NOTE
S TO
AND
FOR
MIN
G PA
RT O
F TH
E UN
CONS
OLID
ATED
FIN
ANCI
AL S
TATE
MEN
TSFO
R TH
E YE
AR E
NDED
DEC
EMBE
R 31
, 202
0
46.3
.4.1
Mis
mat
ch o
f int
eres
t rat
e se
nsiti
ve a
sset
s an
d lia
bilit
ies Upto
1 mon
thOv
er 1 m
onth
to 3 m
onths
Over
3 mon
ths
to 6 m
onths
Over
6 mon
ths
to 1 y
ear
Over
1 yea
r to
2 yea
rsOv
er 2 y
ears
to
3 yea
rsOv
er 3 y
ears
to
5 yea
rsOv
er 5 y
ears
to
10 ye
arsOv
er 10
years
%On
-bal
ance
she
et fi
nanc
ial i
nstru
men
ts
Asse
tsCa
sh a
nd b
alan
ces
with
trea
sury
ban
ks0.
07%
250,
838,
052
14,6
36,8
25-
-
-
-
-
-
-
-
23
6,20
1,22
7Ba
lanc
es w
ith o
ther
ban
ks1.
47%
13,8
88,7
654,
535,
935
-
-
-
-
-
-
-
-
9,35
2,83
0Le
ndin
gs to
fina
ncia
l inst
itutio
ns9.
00%
19,9
59,1
3218
,959
,132
1,00
0,00
0-
-
-
-
-
-
-
-
Inve
stm
ents
9.54
%1,
128,
674,
494
99,7
04,2
2133
9,73
1,67
230
0,86
0,67
579
,376
,250
107,
521,
913
4,27
8,01
047
,141
,321
83,4
13,6
37-
66
,646
,795
Adva
nces
Pe
rform
ing
9.11
%51
8,41
1,42
122
,539
,678
294,
575,
740
126,
300,
245
17,8
38,2
566,
145,
891
4,95
8,02
110
,243
,123
26,9
65,9
907,
813,
770
1,03
0,70
7No
n-pe
rform
ing
11,8
68,0
75-
-
-
-
-
-
-
-
-
11
,868
,075
Oth
er a
sset
s36
,406
,306
-
-
-
-
-
-
-
-
-
36,4
06,3
061,
980,
046,
245
160,
375,
791
635,
307,
412
427,
160,
920
97,2
14,5
0611
3,66
7,80
49,
236,
031
57,3
84,4
4411
0,37
9,62
77,
813,
770
361,
505,
940
Liab
ilitie
sBi
lls p
ayab
le29
,733
,813
-
-
-
-
-
-
-
-
-
29,7
33,8
13Bo
rrowi
ngs
6.97
%12
8,98
7,41
564
,139
,213
21,6
45,9
356,
870,
621
12,1
89,5
171,
245,
978
1,42
2,72
121
,087
,774
-
-
385,
656
Depo
sits
and
othe
r acc
ount
s4.
02%
1,64
0,21
1,90
181
,298
,711
732,
048,
749
44,9
46,5
0741
,407
,311
8,39
1,30
22,
874,
467
26,6
94,8
273,
542,
979
150
699,
006,
898
Subo
rdin
ated
deb
t11
.00%
10,0
00,0
0010
,000
,000
-
-
-
-
-
-
-
-
-
O
ther
liabi
lities
38,5
66,7
62-
-
-
-
-
-
-
-
-
38
,566
,762
1,84
7,49
9,89
115
5,43
7,92
475
3,69
4,68
451
,817
,128
53,5
96,8
289,
637,
280
4,29
7,18
847
,782
,601
3,54
2,97
915
076
7,69
3,12
9
On-b
alan
ce s
heet
Gap
13
2,54
6,35
44,
937,
867
(118
,387
,272
)37
5,34
3,79
243
,617
,678
104,
030,
524
4,93
8,84
39,
601,
843
106,
836,
648
7,81
3,62
0(4
06,1
87,1
89)
Net n
on fi
nanc
ial a
sset
s51
,526
,553
Tota
l net
ass
ets
184,
072,
907
Off-b
alan
ce s
heet
fina
ncia
l ins
trum
ents
Inte
rest
Rat
e De
rivat
ives
- Lon
g po
sitio
n -
-
-
-
-
-
-
-
-
-
-
In
tere
st R
ate
Deriv
ative
s - S
hort
posit
ion
-
-
-
-
-
-
-
-
-
-
-
Cros
s Cu
rrenc
y Sw
ap -
Long
pos
ition
-
-
-
-
-
-
-
-
-
-
-
Cros
s Cu
rrenc
y Sw
ap -
Shor
t pos
ition
-
-
-
-
-
-
-
-
-
-
-
FX O
ptio
ns -
Long
pos
ition
-
-
-
-
-
-
-
-
-
-
-
FX O
ptio
ns -
Shor
t pos
ition
-
-
-
-
-
-
-
-
-
-
-
Forw
ard
purc
hase
of G
over
nmen
t Sec
uritie
s-
-
-
-
-
-
-
-
-
-
-
Fo
rwar
d sa
le o
f Gov
ernm
ent S
ecur
ities
-
-
-
-
-
-
-
-
-
-
-
Fore
ign
curre
ncy
forw
ard
purc
hase
s34
2,79
2,60
213
1,91
6,22
510
0,35
7,08
875
,434
,166
35,0
85,1
23-
-
-
-
-
-
Fore
ign
curre
ncy
forw
ard
sale
s(2
92,8
04,7
31)
(124
,114
,829
)(8
2,67
9,37
3)(5
0,90
9,91
0)(3
5,10
0,61
9)-
-
-
-
-
-
Off-b
alan
ce s
heet
Gap
49,9
87,8
717,
801,
396
17,6
77,7
1524
,524
,256
(15,
496)
-
-
-
-
-
-
Tota
l Yie
ld /
Inte
rest
Rat
e Ri
sk S
ensi
tivity
Gap
182,
534,
225
12,7
39,2
63(1
00,7
09,5
57)
399,
868,
048
43,6
02,1
8210
4,03
0,52
44,
938,
843
9,60
1,84
310
6,83
6,64
87,
813,
620
(406
,187
,189
)
Cum
ulat
ive
Yiel
d / I
nter
est R
ate
Risk
Sen
sitiv
ity G
ap12
,739
,263
(87,
970,
294)
311,
897,
754
355,
499,
936
459,
530,
460
464,
469,
303
474,
071,
146
580,
907,
794
588,
721,
414
182,
534,
225
Effec
tive
yield
/ int
erest
rate
------
------
------
------
------
------
------
------
------
------
------
------
------
------
------
------
------
------
------
(Rup
ees i
n '00
0) ---
------
------
------
------
------
------
------
------
------
------
------
------
------
------
------
------
------
------
---
Non-i
nteres
t be
aring
finan
cial
instru
ments
2020
Total
Expo
sed t
o yiel
d / in
teres
t rate
risk
73
147Annual Report 2020
Not
es to
and
form
ing
part
of t
he U
ncon
solid
ated
Fin
anci
al S
tate
men
tsFo
r the
yea
r end
ed D
ecem
ber 3
1, 2
020

NO
TES
TO A
ND
FO
RM
ING
PAR
T O
F TH
E U
NC
ON
SOLI
DAT
ED F
INAN
CIA
L ST
ATEM
ENTS
FOR
TH
E YE
AR E
ND
ED D
ECEM
BER
31,
202
0
Upto
1 m
onth
Over
1 m
onth
to
3 mon
ths
Over
3 m
onth
s to
6 m
onth
sOv
er 6
mon
ths
to 1
year
Over
1 ye
ar t
o 2 y
ears
Over
2 ye
ars
to 3
year
sOv
er 3
year
s to
5 ye
ars
Over
5 ye
ars
to 10
year
sOv
er 10
year
s
%O
n-ba
lanc
e sh
eet f
inan
cial
inst
rum
ents
Ass
ets
Cas
h an
d ba
lanc
es w
ith tr
easu
ry b
anks
0.26
%23
5,86
1,76
718
,775
,252
-
-
-
-
-
-
-
-
217,
086,
515
Bala
nces
with
oth
er b
anks
3.92
%20
,729
,005
7,83
0,77
23,
096,
952
400,
067
-
-
-
-
-
-
9,40
1,21
4Le
ndin
gs to
fina
ncia
l ins
titut
ions
11.1
0%20
,183
,118
20,1
83,1
18-
-
-
-
-
-
-
-
-
Inve
stm
ents
9.83
%84
0,32
2,65
213
3,87
1,87
717
4,28
7,93
972
,131
,087
80,3
53,9
7212
8,47
3,48
694
,506
,781
45,4
83,8
9586
,952
,547
5,71
9,74
318
,541
,325
Adva
nces
-
Perfo
rmin
g10
.47%
622,
464,
406
202,
510,
090
209,
713,
843
175,
792,
305
25,9
96,8
0732
,763
163,
300
3,46
2,04
01,
267,
038
629,
023
2,89
7,19
7N
on-p
erfo
rmin
g13
,369
,811
-
-
-
-
-
-
-
-
-
13,3
69,8
11O
ther
ass
ets
57,9
69,5
41-
-
-
-
-
-
-
-
-
57
,969
,541
1,81
0,90
0,30
038
3,17
1,10
938
7,09
8,73
424
8,32
3,45
910
6,35
0,77
912
8,50
6,24
994
,670
,081
48,9
45,9
3588
,219
,585
6,34
8,76
631
9,26
5,60
3Li
abili
ties
Bills
pay
able
22,9
26,5
96-
-
-
-
-
-
-
-
-
22
,926
,596
Borro
win
gs8.
79%
154,
484,
000
79,9
70,1
8230
,354
,891
6,63
1,43
113
,980
,198
22,9
59,0
23-
-
-
-
58
8,27
5D
epos
its a
nd o
ther
acc
ount
s4.
89%
1,46
7,06
3,46
199
,414
,211
624,
736,
150
57,7
88,9
4620
,302
,866
42,0
47,4
595,
853,
492
-
33,2
69,9
894,
234,
301
579,
416,
047
Subo
rdin
ated
deb
t13
.51%
10,0
00,0
0010
,000
,000
-
-
-
-
-
-
-
-
-
O
ther
liab
ilitie
s42
,167
,207
-
-
-
-
-
-
-
-
-
42,1
67,2
071,
696,
641,
264
189,
384,
393
655,
091,
041
64,4
20,3
7734
,283
,064
65,0
06,4
825,
853,
492
-
33,2
69,9
894,
234,
301
645,
098,
125
On-
bala
nce
shee
t Gap
11
4,25
9,03
619
3,78
6,71
6(2
67,9
92,3
07)
183,
903,
082
72,0
67,7
1563
,499
,767
88,8
16,5
8948
,945
,935
54,9
49,5
962,
114,
465
(325
,832
,522
)
Net
non
fina
ncia
l ass
ets
54,8
09,8
47
Tota
l net
ass
ets
169,
068,
883
Off-
bala
nce
shee
t fin
anci
al in
stru
men
tsIn
tere
st R
ate
Der
ivat
ives
- Lo
ng p
ositi
on
316,
500
-
-
-
316,
500
-
-
-
-
-
-
In
tere
st R
ate
Der
ivat
ives
- Sh
ort p
ositi
on
(316
,500
)-
(3
16,5
00)
-
-
-
-
-
-
-
-
FX
Opt
ions
- Lo
ng p
ositi
on61
,297
61,2
97-
-
-
-
-
-
-
-
-
FX O
ptio
ns -
Shor
t pos
ition
(61,
297)
(61,
297)
-
-
-
-
-
-
-
-
-
Fo
rwar
d pu
rcha
se o
f Gov
ernm
ent S
ecur
ities
3,04
3,54
1-
3,
043,
541
-
-
-
-
-
-
-
-
Fo
rwar
d sa
le o
f Gov
ernm
ent S
ecur
ities
(11,
264,
179)
(2,0
08,8
35)
-
-
(9,2
08,5
10)
-
(46,
834)
-
-
-
-
Fo
reig
n cu
rrenc
y fo
rwar
d pu
rcha
ses
482,
798,
387
198,
626,
902
149,
166,
343
107,
694,
181
27,3
10,9
61-
-
-
-
-
-
Fore
ign
curre
ncy
forw
ard
sale
s(4
27,8
18,4
53)
(188
,870
,359
)(1
21,6
36,9
49)
(98,
569,
424)
(18,
741,
721)
-
-
-
-
-
-
O
ff-ba
lanc
e sh
eet G
ap46
,759
,296
7,74
7,70
830
,256
,435
9,12
4,75
7(3
22,7
70)
-
(4
6,83
4)-
-
-
-
Tota
l Yie
ld /
Inte
rest
Rat
e R
isk
Sens
itivi
ty G
ap16
1,01
8,33
220
1,53
4,42
4(2
37,7
35,8
72)
193,
027,
839
71,7
44,9
4563
,499
,767
88,7
69,7
5548
,945
,935
54,9
49,5
962,
114,
465
(325
,832
,522
)
Cum
ulat
ive
Yiel
d / I
nter
est R
ate
Ris
k Se
nsiti
vity
Gap
201,
534,
424
(36,
201,
448)
156,
826,
391
228,
571,
336
292,
071,
103
380,
840,
858
429,
786,
793
484,
736,
389
486,
850,
854
161,
018,
332
------
------
------
------
------
------
------
------
------
------
------
------
------
------
------
------
------
------
------
(Rup
ees i
n '00
0) --
------
------
------
------
------
------
------
------
------
------
------
------
------
------
------
------
------
------
----
2019
Effe
ctive
yie
ld /
inte
rest
ra
te
Tota
l
Expo
sed
to yi
eld / i
nter
est r
ate r
iskNo
n-in
tere
st
bear
ing
finan
cial
inst
rum
ents
74
United Bank Limited148
Not
es to
and
form
ing
part
of t
he U
ncon
solid
ated
Fin
anci
al S
tate
men
tsFo
r the
yea
r end
ed D
ecem
ber 3
1, 2
020

NOTE
S TO
AND
FO
RMIN
G P
ART
OF
THE
UNCO
NSO
LIDA
TED
FINA
NCIA
L ST
ATEM
ENTS
FOR
THE
YEAR
END
ED D
ECEM
BER
31, 2
020
46.4
Ope
ratio
nal r
isk
Ope
ratio
nal r
isk is
reco
gnize
d as
the
risk
of lo
ss re
sultin
g fro
m in
adeq
uate
or f
aile
d in
tern
al p
roce
sses
, peo
ple
and
syst
ems
or fr
om e
xter
nal e
vent
s.
46.5
Liqu
idity
risk
Liqu
idity
risk
is th
e ris
k th
at th
e Ba
nk m
ay b
e un
able
to m
eet i
ts o
blig
atio
ns o
r to
fund
incr
ease
s in
ass
ets
as th
ey fa
ll due
with
out i
ncur
ring
unac
cept
able
cos
t or l
osse
s.
The
Asse
ts a
nd L
iabi
lities
Man
agem
ent C
omm
ittee
(ALC
O) o
f the
Ban
k is
resp
onsib
le fo
r the
ove
rsig
ht o
f liq
uidi
ty m
anag
emen
t and
mee
ts o
n a
mon
thly
basis
or m
ore
frequ
ently
, if r
equi
red.
Invie
wof
the
rela
xatio
ngr
ante
dby
SBP
ford
efer
ralo
fprin
cipal
and
mar
kup
and
resc
hedu
ling
oflo
ans
ther
ewi
llbe
anim
pact
onth
em
atur
itypr
ofile
ofth
eBa
nk.T
heAs
seta
ndLi
abilit
yCo
mm
ittee
(ALC
O)o
fthe
Bank
isco
ntin
uous
lym
onito
ring
the
liqui
dity
posi
tion
and
the
Bank
isco
nfid
entt
hatt
heliq
uidi
tybu
fferc
urre
ntly
mai
ntai
ned
issu
fficie
ntto
cate
rto
any
adve
rse
mov
emen
t in
the
cash
flow
mat
urity
pro
file.
Inco
mpl
ianc
ewi
thth
eRe
gula
tory
Gui
delin
es,a
nO
pera
tiona
lRisk
Divis
ion
ises
tabl
ished
with
inRi
sk&
Cred
itPo
licy
Gro
up.O
pera
tiona
lRisk
Divis
ion
ispr
imar
ilyre
spon
sible
fort
heov
ersig
htof
oper
atio
nalr
iskm
anag
emen
tacr
oss
the
Bank
.The
oper
atio
nalr
iskm
anag
emen
tfra
mew
ork
ofth
eBa
nkis
gove
rned
byth
eO
pera
tiona
lRisk
Man
agem
entP
olicy
and
Proc
edur
es,w
hile
the
impl
emen
tatio
nis
supp
orte
dby
anop
erat
iona
lrisk
man
agem
ents
yste
man
dde
signa
ted
oper
atio
nalr
iskco
ordi
nato
rswi
thin
diffe
rent
units
acro
ssth
eBa
nk.T
hefra
mew
ork
isin
line
with
inte
rnat
iona
lbes
tpra
ctice
s,fle
xible
enou
ghto
impl
emen
tin
stag
esan
dpe
rmits
the
over
alla
ppro
ach
toev
olve
inre
spon
seto
orga
niza
tiona
llea
rnin
gan
dfu
ture
requ
irem
ents
.
The
Bank
’sap
proa
chto
liqui
dity
man
agem
enti
sto
ensu
re,a
sfa
ras
poss
ible
,tha
titw
illal
ways
have
suffi
cient
liqui
dity
tom
eeti
tslia
biliti
eswh
endu
e,un
derb
oth
norm
alan
dst
ress
edco
nditi
ons,
with
out
incu
rring
unac
cept
able
loss
esor
riskin
gsu
stai
ned
dam
age
tobu
sines
sfra
nchi
ses.
Ace
ntra
lized
appr
oach
isad
opte
d,ba
sed
onan
inte
grat
edfra
mew
ork
inco
rpor
atin
gan
asse
ssm
ento
fall
mat
eria
lkno
wnan
dex
pect
edca
shflo
wsan
dth
eav
aila
bility
ofco
llate
ralw
hich
coul
dbe
used
tose
cure
addi
tiona
lfun
ding
ifre
quire
d.Th
efra
mew
ork
enta
ilsca
refu
lmon
itorin
gan
dco
ntro
loft
heda
ilyliq
uidi
typo
sitio
n,an
dre
gula
rliq
uidi
tyst
ress
test
ing
unde
rava
riety
ofsc
enar
ios.
Thes
een
com
pass
both
norm
alan
dst
ress
edm
arke
tco
nditi
ons,
inclu
ding
gen
eral
mar
ket c
rises
and
the
poss
ibilit
y th
at a
cces
s to
mar
kets
cou
ld b
e im
pact
ed b
y a
stre
ss e
vent
affe
ctin
g so
me
part
of th
e Ba
nk’s
busin
ess.
Busin
ess
Cont
inui
tyPl
ans
have
been
impl
emen
ted
acro
ssth
eba
nk,c
lear
lyde
finin
gth
ero
les
and
resp
onsib
ilitie
sof
resp
ectiv
est
akeh
olde
rs,a
ndco
verin
gre
cove
ryst
rate
gy,I
Tan
dst
ruct
ural
bac
kups
, sce
nario
and
impa
ct a
nalys
es a
nd te
stin
g di
rect
ives.
Inac
cord
ance
with
the
Ope
ratio
nalR
isk
polic
yan
dfra
mew
ork,
ada
taba
seco
verin
glo
sses
,con
trolb
reac
hes
and
near
miss
esis
bein
gm
aint
aine
dby
the
divis
ion.
Maj
orris
kev
ents
are
anal
yzed
from
the
cont
rolb
reac
hpe
rspe
ctive
and
mitig
atin
gco
ntro
lsar
eas
sess
edon
desig
nan
dop
erat
ing
effe
ctive
ness
.Qua
rterly
upda
tes
onO
pera
tiona
lRisk
even
tsar
ebe
ing
pres
ente
dto
the
Seni
orM
anag
emen
tand
Boar
dRi
sk&
Com
plia
nce
Com
mitt
eeof
the
Bank
.Per
iodi
cwo
rksh
ops
are
cond
ucte
dfo
rRi
sk&
Cont
rolS
elf-A
sses
smen
tand
key
risk
expo
sure
sar
eid
entif
ied
and
asse
ssed
agai
nste
xistin
gco
ntro
lsto
eval
uate
impr
ovem
ento
ppor
tuni
ties.
Key
Risk
Indi
cato
rsar
eal
sode
fined
for
mon
itorin
gof
risk
expo
sure
s.Ne
wpr
oduc
ts, s
yste
ms,
act
ivitie
s an
d pr
oces
ses,
are
sub
ject
to c
ompr
ehen
sive
oper
atio
nal r
isk a
sses
smen
ts, b
efor
e im
plem
enta
tion.
The
Bank
isclo
sely
mon
itorin
gth
esit
uatio
nan
dha
sin
voke
dre
quire
dac
tions
toen
sure
safe
tyan
dse
curit
yof
Bank
staf
fand
anun
inte
rrupt
edse
rvic
eto
ourc
usto
mer
s.Th
ese
nior
man
agem
ento
fthe
Bank
isco
ntin
uous
lym
onito
ring
the
situa
tion
and
ista
king
timel
yde
cisio
nsto
reso
lvean
yco
ncer
ns.B
usin
ess
Cont
inui
tyPl
ans
(BCP
)for
resp
ectiv
ear
eas
are
inpl
ace
and
test
ed.T
hese
nior
man
agem
ento
fthe
Bank
isco
ntin
uous
lym
onito
ring
the
situa
tion
and
ista
king
timel
yde
cisio
nsto
reso
lvean
yco
ncer
ns.T
heBa
nkha
ssig
nific
antly
enha
nced
the
mon
itorin
gof
cybe
rsec
urity
risks
durin
gth
ese
times
,thr
ough
itsin
form
atio
nse
curit
ypr
otoc
ols.
The
rem
ote
work
capa
biliti
eswe
reen
able
dfo
rcrit
icals
taff
and
rela
ted
risk
and
cont
rolm
easu
res
were
asse
ssed
tom
ake
sure
they
are
fully
prot
ecte
dus
ing
virtu
alpr
ivate
netw
ork
(“VPN
”)co
nnec
tions
.Fur
ther
,the
Bank
has
also
ensu
red
that
itsre
mot
eac
cess
syst
ems
are
suffi
cient
ly re
silie
nt to
any
unw
ante
d cy
ber-a
ttack
s.
75
149Annual Report 2020
Not
es to
and
form
ing
part
of t
he U
ncon
solid
ated
Fin
anci
al S
tate
men
tsFo
r the
yea
r end
ed D
ecem
ber 3
1, 2
020

NOTE
S TO
AND
FO
RMIN
G P
ART
OF
THE
UNCO
NSO
LIDA
TED
FINA
NCIA
L ST
ATEM
ENTS
FOR
THE
YEAR
END
ED D
ECEM
BER
31, 2
020
46.5
.1M
atur
ities
of a
sset
s an
d lia
bilit
ies
- bas
ed o
n co
ntra
ctua
l mat
urity
of t
he a
sset
s an
d lia
bilit
ies
of th
e Ba
nk
Tota
lUp
to 1
Day
Over
1 to
7 da
ysOv
er 7
to 14
da
ys
Over
14
days
to 1
Mont
h
Over
1 to
2 Mo
nths
Over
2 to
3 Mo
nths
Over
3 to
6 Mo
nths
Over
6 to
9 Mo
nths
Over
9 m
onth
s to
1 ye
ar
Over
1 to
2 ye
ars
Over
2 to
3 ye
ars
Over
3 to
5 Ye
ars
Over
5
Year
s
Asse
tsCa
sh an
d bala
nces
with
tre
asur
y ban
ks25
0,838
,052
-
-
-
250,8
38,05
2-
-
-
-
-
-
-
-
-
Balan
ces w
ith ot
her b
anks
13,88
8,765
7,352
,829
5,033
,491
639,3
3886
3,107
-
-
-
-
-
-
-
-
-
Le
nding
s to f
inanc
ial in
stitut
ions
19,95
9,132
-
5,000
,000
4,500
,000
9,459
,132
1,000
,000
-
-
-
-
-
-
-
-
Inves
tmen
ts1,1
28,67
4,494
18,94
9,010
-
68
6,207
65,05
7,047
16,79
1,291
157,3
58,33
014
4,162
,841
68,11
9,281
22,15
3,944
130,6
34,54
640
,664,5
3813
3,394
,425
330,7
03,03
4Ad
vanc
es
530,2
79,49
621
,409,0
755,3
21,81
96,3
59,41
655
,412,5
4315
,884,1
7974
,173,4
5290
,347,7
1022
,772,4
3042
,655,1
5860
,557,3
4344
,829,0
2850
,979,0
5639
,578,2
87Fix
ed as
sets
51,20
7,703
-
-
-
308,6
90-
483,4
6379
6,145
-
92
3,884
2,358
,874
2,263
,281
2,814
,618
41,25
8,748
Intan
gible
asse
ts1,8
29,21
1-
-
-
63
-
7,9
0410
,113
-
99
,212
282,0
1543
9,821
712,4
0427
7,679
Defer
red t
ax as
set
6,399
,267
-
-
-
6,399
,267
-
-
-
-
-
-
-
-
-
Ot
her a
ssets
46,50
7,193
-
-
-
7,851
,352
-
10
,824,0
504,7
54,83
9-
9,810
,943
4,999
,223
1,262
,750
2,320
,995
4,683
,041
2,049
,583,3
1347
,710,9
1415
,355,3
1012
,184,9
6139
6,189
,253
33,67
5,470
242,8
47,19
924
0,071
,648
90,89
1,711
75,64
3,141
198,8
32,00
189
,459,4
1819
0,221
,498
416,5
00,78
9Li
abilit
iesBi
lls pa
yable
29,73
3,813
-
-
-
29,73
3,813
-
-
-
-
-
-
-
-
-
Bo
rrowi
ngs
128,9
87,41
5-
60
,075,2
9517
2,500
7,485
,553
8,084
,109
16,99
1,427
7,579
,703
4,600
30,12
84,6
98,44
51,1
89,72
23,5
54,90
419
,121,0
29De
posit
s and
othe
r acc
ounts
1,640
,211,9
011,2
16,99
5,046
32,36
2,654
18,11
1,216
71,08
5,275
23,85
5,924
77,85
0,744
45,86
2,597
14,99
6,819
32,16
8,500
14,37
8,439
8,436
,770
35,59
3,707
48,51
4,210
Subo
rdina
ted de
bt10
,000,0
00-
-
-
-
-
-
-
-
-
-
-
-
10,00
0,000
Othe
r liab
ilities
56,57
7,277
-
-
-
16,29
6,654
-
36
,193,0
0319
3,822
-
1,8
27,08
420
7,331
44,14
273
,858
1,741
,383
1,865
,510,4
061,2
16,99
5,046
92,43
7,949
18,28
3,716
124,6
01,29
531
,940,0
3313
1,035
,174
53,63
6,122
15,00
1,419
34,02
5,712
19,28
4,215
9,670
,634
39,22
2,469
79,37
6,622
Net a
sset
s18
4,072
,907
(1,16
9,284
,132)
(77,0
82,63
9)(6
,098,7
55)
271,5
87,95
81,7
35,43
711
1,812
,025
186,4
35,52
675
,890,2
9241
,617,4
2917
9,547
,786
79,78
8,784
150,9
99,02
933
7,124
,167
Repr
esen
ted
by:
Shar
e cap
ital
12,24
1,797
Rese
rves
62,27
4,068
Unap
prop
riated
profi
t81
,916,4
63Su
rplus
on re
valua
tion o
f ass
ets27
,640,5
7918
4,072
,907
The
mat
urity
prof
ilepr
esen
ted
belo
wha
sbe
enpr
epar
edas
requ
ired
byIF
RS
onth
eba
sis
ofco
ntra
ctua
lmat
uriti
es,e
xcep
tfor
prod
ucts
that
dono
thav
ea
cont
ract
ualm
atur
ityw
hich
are
show
n in
the
first
buc
ket.
2020
------
------
------
------
------
------
------
------
------
------
------
------
------
------
------
------
------
------
------
------
------
------
-----
(Rup
ees i
n '00
0) --
------
------
------
------
------
------
------
------
------
------
------
------
------
------
------
------
------
------
------
------
------
------
---
76
United Bank Limited150
Not
es to
and
form
ing
part
of t
he U
ncon
solid
ated
Fin
anci
al S
tate
men
tsFo
r the
yea
r end
ed D
ecem
ber 3
1, 2
020

NOTE
S TO
AND
FO
RMIN
G P
ART
OF
THE
UNCO
NSO
LIDA
TED
FINA
NCIA
L ST
ATEM
ENTS
FOR
THE
YEAR
END
ED D
ECEM
BER
31, 2
020
Total
Upto
1 Da
yOv
er 1
to 7
days
Over
7 to
14
days
Over
14
days
to 1
Mont
h
Over
1 to
2 Mo
nths
Over
2 to
3 Mo
nths
Over
3 to
6 Mo
nths
Over
6 to
9 Mo
nths
Over
9 mo
nths
to 1
year
Over
1 to
2 ye
ars
Over
2 to
3 ye
ars
Over
3 to
5 Ye
ars
Over
5
Year
s
Asse
tsCa
sh an
d bala
nces
with
tre
asury
bank
s23
5,861
,767
-
-
-
235,8
61,76
7-
-
-
-
-
-
-
-
-
Balan
ces w
ith ot
her b
anks
20,72
9,005
9,395
,791
4,682
,026
1,021
,994
929,0
853,5
11,63
0-
1,188
,479
-
-
-
-
-
-
Lend
ings t
o fina
ncial
insti
tution
s20
,183,1
18-
1,0
00,00
07,7
38,86
511
,444,2
53-
-
-
-
-
-
-
-
-
Inves
tmen
ts84
0,322
,652
46,71
0,311
2,052
,765
-
11
6,395
,490
18,07
8,476
86,08
0,733
40,22
5,822
79,07
9,625
6,203
,585
114,1
88,68
577
,530,2
2045
,566,4
2720
8,210
,513
Adva
nces
63
5,834
,217
-
-
-
142,7
42,06
4-
89,20
3,132
74,58
5,099
-
63
,752,9
5947
,835,8
8045
,259,4
8680
,025,1
9892
,430,3
99Fix
ed as
sets
52,39
6,877
-
-
-
593,6
36-
362,7
6359
6,288
-
93
6,068
2,007
,987
2,412
,223
3,209
,275
42,27
8,637
Intan
gible
asse
ts1,9
51,00
2-
-
-
6
-
1,0
0836
7,921
-
18
8,794
305,6
8246
9,543
261,2
9135
6,757
Defer
red ta
x ass
ets3,3
00,16
4-
-
-
3,3
00,16
4-
-
-
-
-
-
-
-
-
Othe
r ass
ets82
,196,5
60-
-
-
14
,365,1
05-
19,29
1,079
6,293
,590
-
24
,883,3
093,9
81,60
83,8
98,97
72,6
91,05
56,7
91,83
71,8
92,77
5,362
56,10
6,102
7,734
,791
8,760
,859
525,6
31,57
021
,590,1
0619
4,938
,715
123,2
57,19
979
,079,6
2595
,964,7
1516
8,319
,842
129,5
70,44
913
1,753
,246
350,0
68,14
3
Liabil
ities
Bills
paya
ble22
,926,5
96-
-
-
22
,926,5
96-
-
-
-
-
-
-
-
-
Borro
wing
s15
4,484
,000
749,5
2067
,938,9
972,0
91,87
61,2
43,61
510
,201,4
0714
,537,3
0421
,185,1
7713
,840,0
7746
,895
530,3
6324
2,987
2,293
,306
19,58
2,476
Depo
sits a
nd ot
her a
ccou
nts1,4
67,06
3,461
1,127
,161,3
1822
,770,0
4847
,752,0
6827
,048,3
9418
,068,5
5565
,976,5
0647
,486,3
6017
,666,4
7943
,078,2
3211
,663,5
336,4
75,99
417
,485,6
6314
,430,3
11Su
bordi
nated
debt
10,00
0,000
-
-
-
-
-
-
-
-
-
-
-
-
10
,000,0
00Ot
her li
abilit
ies69
,232,4
22-
-
-
29
,093,9
13-
10,89
6,698
7,570
,412
-
5,4
36,95
82,3
70,12
23,0
88,46
23,3
36,70
97,4
39,14
81,7
23,70
6,479
1,127
,910,8
3890
,709,0
4549
,843,9
4480
,312,5
1828
,269,9
6291
,410,5
0876
,241,9
4931
,506,5
5648
,562,0
8514
,564,0
189,8
07,44
323
,115,6
7851
,451,9
35
Net a
ssets
169,0
68,88
3(1,
071,8
04,73
6)(82
,974,2
54)
(41,08
3,085
)44
5,319
,052
(6,67
9,856
)10
3,528
,207
47,01
5,250
47,57
3,069
47,40
2,630
153,7
55,82
411
9,763
,006
108,6
37,56
829
8,616
,208
Repr
esen
ted by
:
Share
capit
al12
,241,7
97Re
serve
s59
,319,6
12Un
appro
priate
d prof
it71
,670,3
31Su
rplus
on re
valua
tion o
f ass
ets25
,837,1
4316
9,068
,883
2019
------
------
------
------
------
------
------
------
------
------
------
------
------
------
------
------
------
------
------
------
------
------
-----
(Rup
ees i
n '00
0) ---
------
------
------
------
------
------
------
------
------
------
------
------
------
------
------
------
------
------
------
------
------
------
--
77
151Annual Report 2020
Not
es to
and
form
ing
part
of t
he U
ncon
solid
ated
Fin
anci
al S
tate
men
tsFo
r the
yea
r end
ed D
ecem
ber 3
1, 2
020

NOTE
S TO
AND
FO
RMIN
G P
ART
OF
THE
UNCO
NSO
LIDA
TED
FINA
NCIA
L ST
ATEM
ENTS
FOR
THE
YEAR
END
ED D
ECEM
BER
31, 2
020
46.5
.2M
atur
ities
of a
sset
s an
d lia
bilit
ies
- bas
ed o
n ex
pect
ed m
atur
ities
of t
he a
sset
s an
d lia
bilit
ies
of th
e Ba
nk (A
LCO
)
Tota
lUp
to 1
m
onth
Ove
r 1
mon
th to
3
mon
ths
Ove
r 3
mon
ths
to 6
m
onth
s
Ove
r 6
mon
ths
to 1
ye
ar
Ove
r 1 y
ear
to 2
yea
rsO
ver 2
yea
rs
to 3
yea
rsO
ver 3
yea
rs
to 5
yea
rsO
ver 5
yea
rs
to 1
0 ye
ars
Ove
r 10
year
s
Asse
tsCa
sh a
nd b
alan
ces
with
trea
sury
ban
ks25
0,83
8,05
214
0,53
5,01
35,
066,
408
4,96
5,28
17,
187,
883
9,99
9,28
77,
672,
723
12,1
67,1
8350
,122
,466
13,1
21,8
08Ba
lanc
es w
ith o
ther
ban
ks13
,888
,765
13,8
88,7
65-
-
-
-
-
-
-
-
Le
ndin
gs to
fina
ncia
l ins
titut
ions
19,9
59,1
3218
,959
,132
1,00
0,00
0-
-
-
-
-
-
-
In
vest
men
ts1,
128,
674,
494
68,1
33,6
8717
4,14
9,62
114
4,16
2,84
110
1,32
6,88
113
0,63
4,54
640
,664
,538
133,
394,
425
326,
735,
043
9,47
2,91
2Ad
vanc
es -
Perfo
rmin
g51
8,41
1,42
188
,502
,853
90,0
57,6
3190
,347
,710
65,4
27,5
8860
,557
,343
44,8
29,0
2850
,979
,056
22,4
86,0
495,
224,
163
Adva
nces
- No
n-pe
rform
ing
- net
of p
rovi
sion
s11
,868
,075
-
-
-
-
-
-
-
-
11
,868
,075
Fixe
d as
sets
51,2
07,7
0330
8,69
048
3,46
379
6,14
592
3,88
42,
358,
874
2,26
3,28
12,
814,
618
4,74
9,64
136
,509
,107
Inta
ngib
le a
sset
s1,
829,
211
637,
904
10,1
1399
,212
282,
015
439,
821
712,
404
277,
679
-
De
ferre
d ta
x as
set
6,39
9,26
7-
-
-
1,
599,
817
1,59
9,81
71,
599,
817
1,59
9,81
6-
-
O
ther
ass
ets
46,5
07,1
937,
851,
352
10,8
24,0
504,
754,
839
9,81
0,94
34,
999,
223
1,26
2,75
02,
320,
995
4,37
4,86
330
8,17
82,
049,
583,
313
338,
179,
555
281,
589,
077
245,
036,
929
186,
376,
208
210,
431,
105
98,7
31,9
5820
3,98
8,49
740
8,74
5,74
176
,504
,243
Liab
ilitie
sBi
lls p
ayab
le29
,733
,813
10,6
29,8
077,
780,
787
7,62
5,48
23,
697,
737
-
-
-
-
-
Borro
wing
s12
8,98
7,41
567
,733
,348
25,0
75,5
367,
579,
703
34,7
284,
698,
445
1,18
9,72
23,
554,
904
19,1
21,0
29-
Depo
sits
and
oth
er a
ccou
nts
1,64
0,21
1,90
120
0,52
8,22
315
4,83
4,34
397
,929
,834
122,
539,
344
119,
233,
575
88,8
94,9
4616
3,18
1,97
150
6,32
8,20
318
6,74
1,46
2Su
bord
inat
ed d
ebt
10,0
00,0
00-
-
-
-
-
-
-
10
,000
,000
-
O
ther
liab
ilitie
s56
,577
,277
16,2
96,6
5436
,193
,003
193,
822
1,82
7,08
420
7,33
144
,142
73,8
581,
090,
578
650,
805
1,86
5,51
0,40
629
5,18
8,03
222
3,88
3,66
911
3,32
8,84
112
8,09
8,89
312
4,13
9,35
190
,128
,810
166,
810,
733
536,
539,
810
187,
392,
267
Net a
sset
s18
4,07
2,90
742
,991
,523
57,7
05,4
0813
1,70
8,08
858
,277
,315
86,2
91,7
548,
603,
148
37,1
77,7
64(1
27,7
94,0
69)
(110
,888
,024
)
Repr
esen
ted
by:
Shar
e ca
pita
l12
,241
,797
Rese
rves
62,2
74,0
68Un
appr
opria
ted
prof
it81
,916
,463
Surp
lus
on re
valu
atio
n of
ass
ets
27,6
40,5
7918
4,07
2,90
7
Asse
tsan
dLi
abilit
ies
havi
ngco
ntra
ctua
lmat
urity
date
sar
ebu
cket
edas
pert
heir
resp
ectiv
em
atur
ities
.The
mat
urity
prof
ileof
non-
cont
ract
uald
epos
itsan
dbi
llspa
yabl
eis
estim
ated
usin
gan
Expo
nent
ially
Wei
ghte
dM
ovin
gAv
erag
em
odel
base
don
hist
oric
alda
ta.T
hem
atur
itypr
ofile
ofce
rtain
non-
cont
ract
uala
sset
san
dlia
bilit
ies
whic
har
ere
late
dto
spec
ific
asse
tsan
dlia
bilit
ies
follo
wsth
em
atur
itypr
ofile
ofth
eun
derly
ing
asse
tor
liabi
lity.
The
mat
urity
prof
ileof
othe
rno
n-co
ntra
ctua
lass
ets
and
liabi
litie
sis
expe
cted
tofo
llow
hist
oric
alpa
ttern
s of
beh
avio
ur. T
he m
etho
dolo
gy a
nd th
e as
sum
ptio
ns u
sed
to d
eriv
e th
e m
atur
ity p
rofil
e of
non
-con
tract
ual a
sset
s an
d lia
bilit
ies
have
bee
n ap
prov
ed b
y AL
CO
.
2020
------
------
------
------
------
------
------
------
------
------
------
------
------
------
------
--- (R
upee
s in
'000
) ----
------
------
------
------
------
------
------
------
------
------
------
------
------
------
-----
78
United Bank Limited152
Not
es to
and
form
ing
part
of t
he U
ncon
solid
ated
Fin
anci
al S
tate
men
tsFo
r the
yea
r end
ed D
ecem
ber 3
1, 2
020

NOTE
S TO
AND
FO
RMIN
G P
ART
OF
THE
UNCO
NSO
LIDA
TED
FINA
NCIA
L ST
ATEM
ENTS
FOR
THE
YEAR
END
ED D
ECEM
BER
31, 2
020
Tota
lUp
to 1
m
onth
Ove
r 1
mon
th to
3
mon
ths
Ove
r 3
mon
ths
to 6
m
onth
s
Ove
r 6
mon
ths
to 1
ye
ar
Ove
r 1 y
ear
to 2
yea
rsO
ver 2
yea
rs
to 3
yea
rsO
ver 3
yea
rs
to 5
yea
rsO
ver 5
yea
rs
to 1
0 ye
ars
Ove
r 10
year
s
Asse
tsC
ash
and
bala
nces
with
trea
sury
ban
ks23
5,86
1,76
713
4,74
2,68
25,
666,
087
5,55
2,99
18,
038,
669
11,1
82,8
418,
580,
896
13,6
07,3
3836
,689
,021
11,8
01,2
42Ba
lanc
es w
ith o
ther
ban
ks20
,729
,005
16,0
28,8
963,
511,
630
1,18
8,47
9-
-
-
-
-
-
Le
ndin
gs to
fina
ncia
l ins
titut
ions
20,1
83,1
1820
,183
,118
-
-
-
-
-
-
-
-
Inve
stm
ents
840,
322,
652
145,
373,
652
104,
159,
209
40,2
25,8
2299
,504
,260
114,
188,
685
77,5
30,2
2045
,566
,427
198,
486,
928
15,2
87,4
49Ad
vanc
es -
Perfo
rmin
g62
2,46
4,40
614
2,74
2,06
489
,203
,132
74,5
85,0
9963
,752
,959
47,8
35,8
8045
,259
,486
80,0
25,1
9860
,394
,829
18,6
65,7
59Ad
vanc
es -
Non
-per
form
ing
- net
of p
rovi
sion
s13
,369
,811
-
-
-
-
-
-
-
-
13
,369
,811
Fixe
d as
sets
52,3
96,8
7759
3,63
636
2,76
359
6,28
893
6,06
82,
007,
987
2,41
2,22
33,
209,
275
5,20
9,86
537
,068
,772
Inta
ngib
le a
sset
s1,
951,
002
61,
008
367,
921
188,
794
305,
682
469,
543
261,
291
356,
757
-
D
efer
red
tax
asse
t3,
300,
164
-
-
-
825,
041
825,
041
825,
041
825,
041
-
-
Oth
er a
sset
s82
,196
,560
14,3
65,1
0519
,291
,079
6,29
3,59
024
,883
,309
3,98
1,60
83,
898,
977
2,69
1,05
55,
493,
455
1,29
8,38
21,
892,
775,
362
474,
029,
159
222,
194,
908
128,
810,
190
198,
129,
100
180,
327,
724
138,
976,
386
146,
185,
625
306,
630,
855
97,4
91,4
15Li
abili
ties
Bills
pay
able
22,9
26,5
967,
812,
659
5,71
9,26
25,
605,
105
3,78
9,57
0-
-
-
-
-
Bo
rrow
ings
154,
484,
000
72,0
24,0
0824
,738
,711
21,1
85,1
7713
,886
,972
530,
363
242,
987
2,29
3,30
619
,564
,718
17,7
58D
epos
its a
nd o
ther
acc
ount
s1,
467,
063,
461
184,
339,
868
146,
789,
617
108,
978,
522
149,
762,
529
135,
498,
970
111,
041,
740
147,
094,
742
365,
255,
299
118,
302,
174
Subo
rdin
ated
deb
t10
,000
,000
-
-
-
-
-
-
-
10,0
00,0
00-
Oth
er li
abilit
ies
69,2
32,4
2229
,093
,913
10,8
96,6
987,
570,
412
5,43
6,95
82,
370,
122
3,08
8,46
23,
336,
709
3,42
2,86
34,
016,
285
1,72
3,70
6,47
929
3,27
0,44
818
8,14
4,28
814
3,33
9,21
617
2,87
6,02
913
8,39
9,45
511
4,37
3,18
915
2,72
4,75
739
8,24
2,88
012
2,33
6,21
7Ne
t ass
ets
169,
068,
883
180,
758,
711
34,0
50,6
20(1
4,52
9,02
6)25
,253
,071
41,9
28,2
6924
,603
,197
(6,5
39,1
32)
(91,
612,
025)
(24,
844,
802)
Repr
esen
ted
by:
Shar
e ca
pita
l12
,241
,797
Res
erve
s59
,319
,612
Una
ppro
pria
ted
prof
it71
,670
,331
Surp
lus
on re
valu
atio
n of
ass
ets
25,8
37,1
4316
9,06
8,88
3
2019
------
------
------
------
------
------
------
------
------
------
------
------
------
------
------
--- (R
upee
s in
'000
) ----
------
------
------
------
------
------
------
------
------
------
------
------
------
------
-----
79
153Annual Report 2020
Not
es to
and
form
ing
part
of t
he U
ncon
solid
ated
Fin
anci
al S
tate
men
tsFo
r the
yea
r end
ed D
ecem
ber 3
1, 2
020

NOTES TO AND FORMING PART OF THE UNCONSOLIDATED FINANCIAL STATEMENTSFOR THE YEAR ENDED DECEMBER 31, 2020
47. NON-ADJUSTING EVENT AFTER THE BALANCE SHEET DATE
47.1
48. GENERAL
48.1
48.2 Figures have been rounded off to the nearest thousand rupees unless otherwise stated.
49. DATE OF AUTHORISATION
Aameer Karachiwalla Shazad G. Dada Shazia Syed Arshad Ahmad Mir Sir Mohammed Anwar Pervez, OBE, HPkChief Financial Officer President & Director Director Chairman Chief Executive Officer
The Board of Directors in its meeting held on February 24, 2021, has proposed a final cash dividend in respect of 2020 ofRs. 9.5 per share (2019: Rs. 4.0 per share). In addition, the Directors have also announced a bonus issue of nil (2019: nil).These appropriations will be approved in the forthcoming Annual General Meeting. The unconsolidated financial statementsfor the year ended December 31, 2020, do not include the effect of these appropriations which will be accounted for in theunconsolidated financial statements for the year ending December 31, 2021.
Comparative information has been reclassfied, rearranged or additionally incorporated in these unconsolidated financialstatements for the purposes of better presentation.
These unconsolidated financial statements were authorised for issue on February 24, 2021, by the Board of Directors of theBank.
80
Aameer KarachiwallaChief Financial Officer
Shazad G. DadaPresident &
Chief Executive Officer
Shazia Syed Director
Arshad Ahmad Mir Director
Sir Mohammed Anwar Pervez, OBE, HPkChairman
United Bank Limited154
Notes to and forming part of the Unconsolidated Financial StatementsFor the year ended December 31, 2020

Anne
xure
'I' a
s re
ferr
ed to
in n
ote
10.6
of t
he B
ank'
s U
ncon
solid
ated
and
Con
solid
ated
Fin
anci
al S
tate
men
tsD
etai
ls o
f loa
ns w
rite-
offs
of R
s. 5
00,0
00 a
nd a
bove
Sr.
No.
Nam
e an
d Ad
dres
sN
ame
of in
divi
dual
s / p
artn
ers
/ pr
oprie
tors
/ di
rect
ors
CN
IC N
umbe
rFa
ther
/ H
usba
nd N
ame
Prin
cipa
l In
tere
st /
Mar
k-up
Oth
ers
Tota
lPr
inci
pal
Inte
rest
/ M
ark-
upO
ther
sTo
tal
1M
uham
mad
Ash
raf M
alik
& S
ons
Shop
# 1
3 N
ew G
reen
Mar
ket M
ulta
n R
oad
Baha
wal
pur.
Muh
amm
ad A
shra
f Mal
ik31
202-
9156
003-
9Ba
shir
Ahm
ed32
51,
936
-
2,26
1 -
1,93
6
-
1,
936
2M
anso
or A
utos
Hig
hway
Roa
d D
hara
nwal
a.M
umta
z Al
i31
102-
8050
035-
3C
haud
ry A
kber
Ali
345
1,69
8
-
2,
043
-
1,
698
-
1,69
8
3Bi
smilla
h Tr
ader
sPe
rmit
Roa
d Ja
toi.
Rao
Zia
ur R
ehm
an32
302-
4501
253-
5Ab
dul R
ehm
an59
91,
062
-
1,66
2 -
1,04
2
-
1,
042
4R
auf A
faq
Kara
chi B
each
Res
iden
cy F
lat N
o 51
1 7T
h Fl
oor P
lot N
o 3
Clif
ton
Nea
r Bi
law
al H
ouse
.
Rau
f Afa
q35
202-
3066
975-
7M
Afa
q51
4
-
-
51
4 44
654
11
51
1
5M
uham
mad
Yaq
oob
H N
o 60
5 B
Bloc
k Jo
har T
own
Alla
h H
oo C
how
k.M
uham
mad
Yaq
oob
3430
2-08
2150
9-5
Arsh
ad U
llah
418
-
-
418
472
36
44
552
6M
irza
Abba
s M
unir
Fl N
o A
303
Rim
Jhi
m T
ower
s 3R
d Fl
r Sa
foor
a C
how
rang
i.M
irza
Abba
s M
unir
4220
1-16
8449
4-7
Mirz
a M
unir
Akht
er58
0
-
-
58
0 49
064
26
58
1
7Fa
iz M
uham
mad
War
d N
o 9
Shai
kh M
uhal
lah
Nas
iraba
d La
rkan
a.Fa
iz M
uham
mad
4320
7-09
5912
6-1
Karim
Bux
587
-
-
587
548
57
15
621
8M
Sho
aib
Man
sha
Hou
se N
o 50
Stre
et V
illas
# 02
Sct
or C
Xp
ark
View
Pha
se 8
DH
A N
ear A
llam
a Iq
bal A
irpor
t.
M S
hoai
b M
ansh
a35
202-
3187
822-
1M
alik
Muh
amm
ad M
ansh
a55
1
-
-
55
1 56
252
6 39
1,
127
9Kh
Has
san
Ashr
afH
ouse
# 2
39-E
, Pha
se -
V, D
HA.
Kh H
assa
n As
hraf
3520
0-76
8015
7-3
Ashr
af A
li Kh
awaj
a62
4
-
-
62
4 56
74
52
624
10Kh
Meh
moo
d R
ehm
anAl
Reh
man
Hou
se#1
3-E-
1, O
ffice
rs
Col
ony
Mul
atan
.Kh
Meh
moo
d R
ehm
an36
302-
0273
260-
3Kh
awaj
a Ba
shir
Ahm
ed24
7
-
-
24
7 76
674
23
86
3
11M
alik
Riz
wan
Anw
arH
No
45 C
Blo
ck M
odel
Tow
n.M
alik
Riz
wan
Anw
ar33
100-
3897
036-
9M
alik
M A
nwar
879
-
-
879
799
76
31
906
12Pa
k R
ock
Oil
Trad
ing
Cor
p. (P
vt.)
Ltd.
O
ffice
# 5
& 6
, Gro
und
Floo
r, Zu
baid
a G
arde
n, S
hahr
ah-e
r-Fai
sal K
arac
hi.
Syed
Ani
s H
assa
nSy
ed A
mm
ar Y
asir
Zaid
i
4220
1-31
3309
9-1
4230
1-11
1511
6-9
Asra
r Hus
sain
Zai
di21
7,41
6
-
31
8,44
4 53
5,86
0 21
7,41
6
-
31
8,44
4 53
5,86
0
13Sh
ahra
j Fab
rics
(Pvt
.) Lt
d.
147-
148
M, Q
uaid
-E-A
zam
Indu
stria
l Es
tate
, Kot
Lak
hpat
, Lah
ore.
Ran
a Kh
adim
Hus
sain
Ran
a G
hula
m H
ussa
inR
ana
Ali R
aza
3520
2-29
6822
2-7
3520
2-12
0717
1-7
3520
2-84
5669
9-5
Ran
a W
alaa
yat A
li Kh
anR
ana
Wal
aaya
t Ali
Khan
Ran
a W
alaa
yat A
li Kh
an
183,
461
129,
665
-
313,
126
183,
461
129,
665
-
313,
126
14N
ew A
llied
Elec
troni
cs (P
vt.)
Ltd.
7th
Floo
r, La
kson
Squ
are
Build
ing
No.
1, S
arw
ar S
hahe
ed R
oad
Kara
chi.
Mia
n Pe
rvaz
Akh
ter
Abdu
l Rau
f
4230
1-71
7659
6-3
4220
1-35
3921
3-1
Mia
n M
uham
mad
Raf
iq
Anw
arAb
dul G
hafo
or A
tiq15
7,41
591
,730
-
24
9,14
5 15
7,41
591
,730
-
24
9,14
5
15Bh
atti
Cot
ton
Link
s18
-Km
, Rai
win
d R
oad,
Lah
ore.
Muh
amm
ad Iq
bal B
hatti
3520
2-79
3610
6-1
Muh
amm
ad D
in B
hatti
102,
538
12,7
57
75,4
28
190,
723
12,4
6912
,757
75
,428
10
0,65
4
At t
he b
egin
ning
W
ritte
n-of
f R
s. in
thou
sand
s
1
155Annual Report 2020
Ann
exur
e ‘I’
as
refe
rred
to in
not
e 10
.6 o
f the
Ban
k’s
Unc
onso
lidat
ed a
nd C
onso
lidat
ed
Fina
ncia
l Sta
tem
ents
Det
ails
of l
oans
writ
e-off
s of
Rs.
500
,000
and
abo
ve

Anne
xure
'I' a
s re
ferr
ed to
in n
ote
10.6
of t
he B
ank'
s U
ncon
solid
ated
and
Con
solid
ated
Fin
anci
al S
tate
men
tsD
etai
ls o
f loa
ns w
rite-
offs
of R
s. 5
00,0
00 a
nd a
bove
Sr.
No.
Nam
e an
d Ad
dres
sN
ame
of in
divi
dual
s / p
artn
ers
/ pr
oprie
tors
/ di
rect
ors
CN
IC N
umbe
rFa
ther
/ H
usba
nd N
ame
Prin
cipa
l In
tere
st /
Mar
k-up
Oth
ers
Tota
lPr
inci
pal
Inte
rest
/ M
ark-
upO
ther
sTo
tal
At t
he b
egin
ning
W
ritte
n-of
f R
s. in
thou
sand
s
16Ta
j Tex
tile
Mills
Ltd
49
-Km
, Lhr
-Mul
tan
Rd,
Nea
r Bha
i Ph
eru,
Dis
tt, K
asur
.
Jaha
ngir
Elah
i Ta
nvir
Elah
iAm
ir Ja
hang
ir
3520
2-25
6109
4-5
3520
0-55
2222
5-3
3520
2-06
7679
8-7
Ehsa
n El
ahi
Ehsa
n El
ahi
Jaha
ngir
Elah
i54
,813
13,0
96
59,6
07
127,
517
18,2
6113
,096
59
,607
90
,965
17An
y Ag
ro (P
vt) L
td61
-L G
ulbe
rg-II
I, N
ear K
alam
a C
how
k,La
hore
.
Jave
d M
ahm
ood
Um
er N
asir
Amir
Nas
eer
3520
2-25
8859
7-3
3520
2-12
3921
6-5
3520
0-06
9531
9-3
Sh. M
uham
mad
Ahm
edSh
. Nas
eer A
hmed
Sh. N
asee
r Ahm
ed
40,1
551,
115
40,6
57
81,9
27
40,1
551,
115
40,6
57
81,9
27
18M
GM
Cor
pora
tion
(Pvt
) Lim
ited
20-K
m S
heik
hupu
ra, F
aisa
laba
d, R
oad,
D
istri
ct S
heik
hupu
ra, P
unja
b.
Mirz
a G
hula
m M
usta
faM
rs. N
ajm
us S
ehar
Mirz
a G
hula
m M
ujta
ba
4230
1-57
8049
9-9
4230
1-17
3829
2-2
4230
1-35
1215
0-9
Mirz
a G
hula
m M
uham
mad
Mirz
a G
hula
m M
usta
faM
irza
Ghu
lam
Mus
tafa
61,1
01
-
62
,353
12
3,45
4 3,
601
-
62,3
53
65,9
54
19Pe
shaw
ar P
ipe
Mills
(Pvt
) Ltd
146
Indu
stria
l Est
ate,
Jam
rud
Roa
d,
Pesh
awar
.
Mrs
. Sha
zia
Subh
ani
Ghu
lam
Sub
hani
Zia
1730
1-37
7527
4-8
1730
1-70
7954
3-7
Ghu
lam
Sub
hani
Zia
Afza
l Zia
76,7
2853
,784
-
13
0,51
2 -
53,7
84
-
53,7
84
20Sy
ed C
orpo
ratio
nPl
ot#6
5, I&
T C
entre
, Sec
tor G
-8/1
Is
lam
abad
.Eh
san
Ulla
h Q
ures
hi61
101-
5055
806-
7Am
an U
llah
Qur
eshi
85,0
0054
,567
-
13
9,56
7 -
46,7
67
-
46,7
67
21M
/S G
. M. G
arm
ents
Ws-
11/1
, Blo
ck-2
, F.B
. Are
a, K
arac
hi.
Ghu
lam
Mur
taza
4210
1-54
2178
3-5
Ghu
lam
Muh
amm
ad S
abri
37,7
06
-
20
,190
57
,896
10
,015
20,1
90
-
30,2
05
22N
ajia
Spi
nnin
g M
ills (P
vt) L
td1-
Km C
huni
an R
oad,
Hab
ibab
ad D
istt
Kasu
r.
M. N
avee
d R
ehm
at
M. N
asee
r She
ikh
3520
2-60
1639
5-1
3520
2-57
2095
4-7
Reh
mat
Ali
Reh
mat
Ali
55,0
009,
743
-
64,7
43
12,5
009,
743
-
22,2
43
23Ba
haw
alpu
r Cot
ton
Com
pany
1-A
Cho
wk
Sara
iki B
ahaw
alpu
r.
Mr.
Muh
amm
ad A
kram
Mr.
Ch.
mun
ir Ah
mad
Mr.
Ch.
rash
id A
khta
rM
rs. S
abih
a Ift
ikha
r
3120
2-67
6657
1-9
3120
2-02
7350
8-7
3120
2-02
7350
5-9
3120
2-85
3260
9-0
Mal
ik M
uham
mad
Akb
arM
uham
mad
Raf
iqM
uham
mad
Raf
iqW
/o If
tikha
r Ahm
ad M
alik
12,9
55
-
13
,163
26
,118
-
-
13,1
18
13,1
18
24Th
e M
adin
a In
terio
rsM
alik
Cen
tre, T
ehsi
l Cho
wk
Chi
niot
.M
uham
mad
Bila
l Ahm
ed33
201-
3032
058-
5Kh
ushi
Muh
amm
ad26
,000
-
11,9
80
37,9
80
-
-
11
,980
11
,980
25Fi
ne P
ack
Laho
re21
K.M
Fer
oze
Pur R
oad,
Nea
r Gre
en
Cap
Sch
eme,
Lah
ore.
Mal
ik S
hafq
at H
ayat
3520
1-13
2648
7-9
Mal
ik M
uham
mad
Hus
sain
29,3
0374
9 11
,205
41
,257
-
-
10,7
70
10,7
70
26As
ia S
pinn
ers
Mar
h Ba
loch
an, T
ehsi
l Sag
la H
ill,
Dis
trict
Nan
kana
Sah
ib.
Mr.
M. A
rsha
d Bu
ttM
rs. F
arza
na A
rsha
d 34
101-
2665
877-
934
101-
2516
061-
8M
uham
mad
Asl
amM
uham
mad
Ars
had
Butt
15,2
21
-
10
,523
25
,744
-
-
10,4
44
10,4
44
27La
sani
Cot
ton
Indu
strie
sM
ulta
n R
oad
Veha
ri.C
h. N
avee
d Pe
rvai
zSa
eed
Ahm
ad36
603-
6265
968-
936
603-
7884
509-
3M
uham
mad
Akr
am P
erva
izN
iaz
Muh
amm
ad4,
033
-
7,94
5 11
,978
-
-
7,82
8 7,
828
28Ab
id W
eavi
ng (P
vt) L
td.
22 K
m F
eroz
epur
Roa
d, R
ohi N
ala,
La
hore
.
Abid
Mah
moo
d Ta
hir
Sana
ulla
h D
ogar
Asad
Mah
moo
dZa
hid
Mah
moo
dKa
lsoo
m B
ibi
3540
4-51
6466
4-7
3540
4-50
6956
9-7
3410
1-05
1637
4-3
3540
4-52
6051
9-7
3540
4-85
5934
0-8
Sana
ulla
h D
ogar
Dos
t Muh
amm
ad D
ogar
Sana
ulla
h D
ogar
Sana
ulla
h D
ogar
Sana
ulla
h D
ogar
22,6
76
-
7,
123
29,7
99
-
-
7,
123
7,12
3
2
United Bank Limited156
Ann
exur
e ‘I’
as
refe
rred
to in
not
e 10
.6 o
f the
Ban
k’s
Unc
onso
lidat
ed a
nd C
onso
lidat
ed
Fina
ncia
l Sta
tem
ents
Det
ails
of l
oans
writ
e-off
s of
Rs.
500
,000
and
abo
ve

Anne
xure
'I' a
s re
ferr
ed to
in n
ote
10.6
of t
he B
ank'
s U
ncon
solid
ated
and
Con
solid
ated
Fin
anci
al S
tate
men
tsD
etai
ls o
f loa
ns w
rite-
offs
of R
s. 5
00,0
00 a
nd a
bove
Sr.
No.
Nam
e an
d Ad
dres
sN
ame
of in
divi
dual
s / p
artn
ers
/ pr
oprie
tors
/ di
rect
ors
CN
IC N
umbe
rFa
ther
/ H
usba
nd N
ame
Prin
cipa
l In
tere
st /
Mar
k-up
Oth
ers
Tota
lPr
inci
pal
Inte
rest
/ M
ark-
upO
ther
sTo
tal
At t
he b
egin
ning
W
ritte
n-of
f R
s. in
thou
sand
s
29La
sani
Flo
ur &
Gen
. Mills
Shah
jaha
naba
d, S
arde
hri,
Tehs
il/ D
istt.
C
hars
adda
h.Sh
ahja
han
1710
1-87
4011
0-3
Haj
i Abd
ul K
arim
1,66
0
-
6,
807
8,46
7 -
-
6,80
7 6,
807
30C
rest
Pac
k57
, The
Mal
l, La
hore
.Aa
mir
Latif
3520
2-05
3745
4-5
Muh
amm
ad A
bdul
Lat
if14
,000
530
6,01
2 20
,542
-
530
6,01
2 6,
542
31Eh
tash
am Z
ahee
r Ali,
Ras
hid
Zahe
er
Ali,
Ism
at Ib
rahi
m, A
neel
a Ka
mal
Zahe
er N
agar
Bur
ewal
a.
Ehta
sham
Zah
eer A
liR
ashi
d Za
heer
Ali
Ism
at Ib
rahi
mAn
eela
Kam
al
3520
0-90
3225
2-7
3520
0-22
6117
0-9
3520
1-30
6262
6-0
3520
0-56
5065
7-6
S/o
Ibra
him
Zah
eer A
liS/
o Ib
rahi
m Z
ahee
r Ali
Wd/
o Ib
rahi
m Z
ahee
r Ali
Wd/
o Ka
mal
Zah
eer A
li
13,5
70
-
7,
356
20,9
26
-
-
5,
926
5,92
6
32Ka
mal
Fab
rics
(Pvt
.) Lt
d.F-
340,
Cen
tral A
venu
e, S
ite, K
arac
hi.
Afza
l Mal
ik
Amra
Afz
al42
301-
1174
091-
742
301-
0999
122-
8M
alik
Ahm
eddu
inAf
zal M
alik
23,8
01
-
7,
862
31,6
62
-
-
5,
457
5,45
7
33Itt
ehad
Flo
ur M
ills2-
Km K
otla
Moo
sa K
han
Roa
d,
Ahm
adpu
r Eas
t Dis
trict
Bah
awal
pur.
Muh
amm
ad A
slam
3120
1-63
1181
3-9
Man
zoor
Ahm
ad6,
006
1,42
9 3,
423
10,8
58
-
1,
429
3,42
3 4,
852
34Al
am T
rade
rsG
.T R
oad,
Rah
wal
i, M
ohal
lah
Shar
if Fa
rm G
ujra
nwal
a.M
uham
mad
Imra
n34
101-
2919
709-
5M
uham
mad
Akr
am7,
000
-
4,48
1 11
,481
-
-
3,95
9 3,
959
35Fr
ontie
r Ste
el (P
vt.)
Ltd.
In
dust
rial E
stat
e, G
adoo
n Am
azai
.
Abdu
l Ras
heed
You
sufz
ai
Jave
d Kh
an J
adoo
nR
ashi
d Ah
med
Kha
nTo
or K
han
130-
55-3
566-
313
0-74
-446
724
1620
2-23
7000
8-9
N/A
N/A
3,42
3
-
3,
382
6,80
4 -
-
3,38
2 3,
382
36E2
E Su
pply
Cha
in M
anag
emen
t Li
mite
dSu
it# 3
11-3
13, T
he P
laza
, KD
A Sc
hem
e #5
, Blo
ck-9
, Clif
ton,
Kar
achi
.
Abid
But
tSy
ed M
. Ahm
ed A
lam
Zahi
d Ja
ved
Butt
4230
1-40
5313
1-3
4220
1-07
8313
0-5
4200
0-04
6855
3-7
Zahi
d Ja
ved
Butt
Syed
Ala
m S
hah
M. I
shaq
But
t23
,995
3,26
6
-
27
,261
-
3,26
1
-
3,
261
37Po
pula
r Tra
ders
2-A,
Ali
Tow
n, R
aiw
ind
Roa
d, L
ahor
e.M
uham
mad
Ajm
alM
uham
mad
Am
jad
3520
2-97
4679
3-1
3520
2-98
5214
8-1
Shei
kh M
uham
mad
Ash
raf
Shei
kh M
uham
mad
Ash
raf
29,9
952,
246
-
32,2
41
-
2,
246
-
2,24
6
38In
saf T
imbe
r & Ir
on S
uppl
yKa
tche
ry R
oad,
Nea
r Das
kar M
ore
Pasr
ur.
Mirz
a W
ahee
d Ah
med
3460
2-65
0728
5-9
Bash
ir Ah
med
4,00
0
-
1,
951
5,95
1 -
-
1,95
1 1,
951
39Bi
smilla
h Po
ultry
Far
mPl
ot N
o. D
/4, N
acal
as N
o.98
, Deh
Ko
tiro,
Nea
r Ste
el T
own,
Kar
achi
.Sy
ed A
rsha
d Al
i Riz
vi42
301-
1091
489-
1Sy
ed A
ziz
Ur R
ehm
an3,
000
-
1,84
2 4,
842
-
-
1,
842
1,84
2
40C
ity A
gro
Offi
ce 1
02-1
04, M
all P
laza
, Mul
tan
Can
tt.
Syed
Ham
ad R
aza
Azha
r Naw
azAt
her N
awaz
3630
2-69
3461
2-9
3630
2-61
3258
6-1
3630
2-04
6951
6-7
Syed
Mur
taza
Sha
hM
azha
r Naw
azM
azha
r Naw
az4,
653
-
2,70
2 7,
355
-
-
1,
828
1,82
8
41Aq
eel A
hmad
But
t & S
ons
Gha
ss M
andi
Baz
ar B
ranc
h, S
ahiw
al.
Aqee
l Ahm
ad B
utt
3650
2-36
7257
8-3
Mr.k
halil
Ahm
ad B
utt
8,13
6
-
2,
383
10,5
20
-
-
1,
800
1,80
0
42Ba
jwa
Ric
e D
eale
rsO
ppos
ite S
ughr
a Sh
afi M
edic
al
Com
plex
, Mur
idke
y R
oad,
Nar
owal
.Sa
rfraz
Ahm
ed B
ajw
a
3450
1-19
1546
4-3
Said
Ahm
ed6,
700
-
1,29
7 7,
997
-
-
1,
192
1,19
2
3
157Annual Report 2020
Ann
exur
e ‘I’
as
refe
rred
to in
not
e 10
.6 o
f the
Ban
k’s
Unc
onso
lidat
ed a
nd C
onso
lidat
ed
Fina
ncia
l Sta
tem
ents
Det
ails
of l
oans
writ
e-off
s of
Rs.
500
,000
and
abo
ve

Anne
xure
'I' a
s re
ferr
ed to
in n
ote
10.6
of t
he B
ank'
s U
ncon
solid
ated
and
Con
solid
ated
Fin
anci
al S
tate
men
tsD
etai
ls o
f loa
ns w
rite-
offs
of R
s. 5
00,0
00 a
nd a
bove
Sr.
No.
Nam
e an
d Ad
dres
sN
ame
of in
divi
dual
s / p
artn
ers
/ pr
oprie
tors
/ di
rect
ors
CN
IC N
umbe
rFa
ther
/ H
usba
nd N
ame
Prin
cipa
l In
tere
st /
Mar
k-up
Oth
ers
Tota
lPr
inci
pal
Inte
rest
/ M
ark-
upO
ther
sTo
tal
At t
he b
egin
ning
W
ritte
n-of
f R
s. in
thou
sand
s
43Ka
shif
Trad
ers
87/G
Mac
hli B
azar
, Bur
ewal
a.Ka
shif
Ali
3660
1-23
7702
7-3
Shei
kh M
uham
mad
Asl
am3,
000
1,28
1
-
4,
281
-
1,
181
-
1,18
1
44M
/S N
ew M
oder
n Je
wel
lers
Mai
n Ba
zar H
aroo
naba
d, D
istri
ct
Baha
wal
naga
r.M
uham
mad
Ras
heed
3110
4-17
0010
7-7
Muh
amm
ad Y
aqoo
b90
5
-
1,
473
2,37
8 -
-
1,12
8 1,
128
45G
Way
Tra
ders
Qay
yum
Stre
et, R
oras
Roa
d Si
alko
t.Ar
shad
Mah
moo
d30
1-56
-331
131
Ch.
Faz
al A
hmad
603
46
890
1,53
9 -
-
829
829
46G
uard
Sup
er S
tore
H
ead
Qua
rter P
akis
tan
Coa
st G
uard
s,
Kaya
ni S
hahe
ed R
oad,
Kar
achi
.D
aud
Sala
r42
201-
9194
740-
5Sa
eed
Ahm
ed S
alar
950
-
632
1,58
2 -
-
607
607
47M
alik
Sar
dar A
liN
oor M
anzi
l, R
ailw
ay R
oad,
Kot
Rad
ha
Kish
an, K
asur
.M
alik
Sar
dar A
li35
102-
8088
666-
3M
alik
Muh
amm
ad S
arw
ar1,
500
-
632
2,13
2 -
-
582
582
48Sy
ed A
li Im
ran
Riz
viH
ouse
No.
R-9
37/3
, Sec
tor 1
6-A
Nor
th
Kara
chi.
Syed
Ali
Imra
n R
izvi
4210
1-80
8764
0-5
S.M
usht
aq R
izvi
1,07
868
6
-
1,
764
-
56
4
-
56
4
49Sy
ed A
li R
aza
H/N
o. 1
7, A
yesh
a Bl
ock,
Abd
ulla
h G
arde
n, C
anal
Roa
d, F
aisa
laba
d.
Syed
Ali
Raz
a33
100-
0739
773-
3Sy
ed T
asad
duq
Hus
sain
7,93
354
3
-
8,
476
-
54
3
-
54
3
50Sa
jid K
han
S-K
Gar
men
t Roo
m N
o 28
Sec
ond
Floo
r Reh
mat
Mar
ket N
ew A
nark
ali
Laho
re.
Sajid
Kha
n35
202-
7421
477-
9M
uham
mad
Asl
am K
han
1,18
318
-
1,
201
-
82
6 16
9 99
5
51Fa
raz
Cha
ngai
z Kh
anH
No
R-7
2 Bl
ock
16 F
.B A
rea
Kara
chi.
Fara
z C
hang
aiz
Khan
4210
1-67
2399
3-1
Cha
ngai
z Kh
an42
8
-
-
42
8 -
263
352
615
52M
aqso
od A
lam
42/5
Stre
et 1
3 M
odel
Col
ony
Kara
chi
Shop
04
Kanw
al A
rcad
e M
odel
Col
ony
Kara
chi.
Maq
sood
Ala
m42
201-
2681
503-
1M
uham
mad
Meh
fooz
H
ussa
in-
-
-
-
8742
8 49
56
4
53Kh
awaj
a Sh
akee
lH
No
45 F
ood
Stre
et C
ham
ber L
ane
Roa
d G
awal
man
di L
ahor
e.Kh
awaj
a Sh
akee
l35
200-
1454
285-
5Kh
awaj
a Ab
dul R
ashe
ed1,
242
24,7
94
-
26,0
36
-
24
,879
15
6 25
,034
54Ta
riq M
ehm
ood
Gul
shan
Bak
ery
Stre
et A
li Ap
rk K
han
Pur R
oad
Nea
r Ali
Da
Der
a.Ta
riq M
ehm
ood
3130
3-23
8546
7-5
Meh
moo
d-
635
-
635
-
67
5 77
75
2
55Sh
aoib
Meh
moo
dH
No
223-
B, S
hadm
an Ii
, Lah
ore.
Shao
ib M
ehm
ood
3520
2-39
8998
8-5
Abdu
l Rab
Saj
id9,
539
15,8
83
-
25,4
22
-
16
,256
20
2 16
,458
56H
umay
oun
Shab
irFl
at N
o 7
3Rd
Floo
r Bui
ldin
g 5
Bagh
-E-
Riz
wan
Blo
ck 1
6 G
ulsh
an-E
-Iqba
l Ka
rach
i.
Hum
ayou
n Sh
abir
4200
0-62
4544
1-9
Shab
ir H
ussa
in88
3
-
-
88
3 -
298
407
705
4
United Bank Limited158
Ann
exur
e ‘I’
as
refe
rred
to in
not
e 10
.6 o
f the
Ban
k’s
Unc
onso
lidat
ed a
nd C
onso
lidat
ed
Fina
ncia
l Sta
tem
ents
Det
ails
of l
oans
writ
e-off
s of
Rs.
500
,000
and
abo
ve

Anne
xure
'I' a
s re
ferr
ed to
in n
ote
10.6
of t
he B
ank'
s U
ncon
solid
ated
and
Con
solid
ated
Fin
anci
al S
tate
men
tsD
etai
ls o
f loa
ns w
rite-
offs
of R
s. 5
00,0
00 a
nd a
bove
Sr.
No.
Nam
e an
d Ad
dres
sN
ame
of in
divi
dual
s / p
artn
ers
/ pr
oprie
tors
/ di
rect
ors
CN
IC N
umbe
rFa
ther
/ H
usba
nd N
ame
Prin
cipa
l In
tere
st /
Mar
k-up
Oth
ers
Tota
lPr
inci
pal
Inte
rest
/ M
ark-
upO
ther
sTo
tal
At t
he b
egin
ning
W
ritte
n-of
f R
s. in
thou
sand
s
57As
ad J
awai
dAr
ain
Scal
e M
echa
nica
l Ele
ctro
H N
o 22
2 Bl
ock
D U
nit N
o 10
Lat
ifaba
d H
yder
abad
.
Asad
Jaw
aid
4130
4-55
1485
2-9
Ghu
lam
Ras
ool A
rain
236
476
-
712
-
46
7 56
52
3
58Ab
dul G
hani
Sha
ikh
Plot
No
48 N
ew M
urad
Wah
an
Lark
ana.
Abdu
l Gha
ni S
haik
h43
203-
5741
146-
9Sh
aikh
358
559
-
918
178
578
62
818
59Su
nny
Sale
emC
-9 R
ahee
mab
ad C
olon
y Bi
-14
F.B
Area
Kar
achi
Nas
iraba
d Pa
tel
Tele
phon
e Ex
Kar
achi
.
Sunn
y Sa
leem
4210
1-58
2637
8-1
Sale
em17
845
1
-
62
9 10
546
7 49
62
2
60M
oham
mad
Ali
Abba
siH
No
15 B
lock
B U
nit N
o 10
Q A
C
olon
y La
tifab
ad H
yder
abad
.M
oham
mad
Ali
Abba
si41
304-
2740
187-
5Ar
shad
Ali
714
-
-
714
-
42
6 20
2 62
8
61Te
hzee
b U
l Has
san
H N
o F-
4 P
& T
Col
ony
Uni
t No
7 La
tifab
ad H
yder
abad
.Te
hzee
b U
l Has
san
4130
4-63
2770
0-1
Reh
an72
7
-
-
72
7 -
412
202
614
62Sh
ahid
Raz
aH
# 7
/A, S
t # 4
-G, R
asoo
l Par
k, M
ulta
n R
oad.
Shah
id R
aza
3520
2-98
4882
1-1
Syed
Mus
htaq
Hus
sain
1,08
435
5
-
1,
439
-
45
6 14
9 60
5
63M
uham
mad
Zah
idH
No
3 Ab
dulla
h H
ouse
St N
o 3
Cha
k N
o 11
/P S
harq
i Rah
im Y
ar K
han.
Muh
amm
ad Z
ahid
3130
3-99
1510
7-1
Irsha
d Ah
mad
452
-
-
452
-
27
5 28
6 56
1
64M
uham
mad
Man
soor
Suite
No:
4 Bo
mba
y Pl
aza
Mez
zani
ne
Floo
r, O
pp N
ew C
usto
m H
ouse
Boh
ra
Roa
d, K
arac
hi.
Muh
amm
ad M
anso
or42
101-
5245
641-
7M
anso
or94
71,
248
-
2,19
5 18
41,
367
141
1,69
2
65Pa
rdee
p Ku
mar
Offi
ce N
o 20
5 Ab
dulla
h Sq
uare
New
C
halli
Kara
chi.
Pard
eep
Kum
ar43
205-
1525
675-
7Ku
mar
400
651
-
1,05
1 43
685
74
803
66W
ajid
Hus
sain
H N
o D
-1 B
lock
D N
ew L
abou
r Col
ony
SITE
Kar
achi
.W
ajid
Hus
sain
4240
1-19
5731
1-1
M B
ashi
r66
5
-
-
66
5 -
270
309
579
67M
uham
mad
Ali
Khan
Amir
Raj
put C
ater
ing
95 H
Blo
ck 2
PE
CH
S Ka
rach
i.M
uham
mad
Ali
Khan
4210
1-19
4378
4-3
Nas
ir Al
i Kha
n34
543
7
-
78
2 10
351
3 57
67
4
68H
uma
Goh
ar Q
asm
iH
.No.
C-3
, St #
10-
4 N
azim
abad
Nr
Abba
si S
hahe
ed H
ospi
tal K
arac
hi.
Hum
a G
ohar
Qas
mi
4210
1-54
7260
5-8
Goh
ar M
ahm
ood
Qas
mi
612
-
-
612
-
22
7 35
5 58
2
69M
uham
mad
Sha
hbaz
Wah
laH
No
95 G
ulsh
an B
lock
A I
Tow
n.M
uham
mad
Sha
hbaz
Wah
la35
302-
5271
932-
9W
ahla
392
579
-
971
143
654
72
869
5
159Annual Report 2020
Ann
exur
e ‘I’
as
refe
rred
to in
not
e 10
.6 o
f the
Ban
k’s
Unc
onso
lidat
ed a
nd C
onso
lidat
ed
Fina
ncia
l Sta
tem
ents
Det
ails
of l
oans
writ
e-off
s of
Rs.
500
,000
and
abo
ve

Anne
xure
'I' a
s re
ferr
ed to
in n
ote
10.6
of t
he B
ank'
s U
ncon
solid
ated
and
Con
solid
ated
Fin
anci
al S
tate
men
tsD
etai
ls o
f loa
ns w
rite-
offs
of R
s. 5
00,0
00 a
nd a
bove
Sr.
No.
Nam
e an
d Ad
dres
sN
ame
of in
divi
dual
s / p
artn
ers
/ pr
oprie
tors
/ di
rect
ors
CN
IC N
umbe
rFa
ther
/ H
usba
nd N
ame
Prin
cipa
l In
tere
st /
Mar
k-up
Oth
ers
Tota
lPr
inci
pal
Inte
rest
/ M
ark-
upO
ther
sTo
tal
At t
he b
egin
ning
W
ritte
n-of
f R
s. in
thou
sand
s
70
Dha
Cog
en L
imite
dD
-35,
Blo
ck 5
, Clif
ton
Kara
chi.
Yap
Kong
Hw
eeR
ober
t Khe
ngC
ol. (
r) At
her A
li Kh
anLt
. Col
. (r)
Naj
amul
Isla
mH
asee
b Kh
anM
uham
mad
Waq
asKh
ursh
eed
Zafa
rSa
eed
Iqba
lH
assa
n R
aza
N/A
N/A
4230
1-09
9399
9-5
4230
1-11
0827
7-3
3520
1-12
6157
7-3
4230
1-89
1603
4-1
3520
1-70
2764
6-9
4220
1-19
9265
6-9
3520
1-16
9733
6-1
N/A
N/A
Muk
aram
Ali
Khan
Pak
ista
niN
asee
r Ahm
ed R
ishi
Abdu
l Muq
it Kh
anN
/AN
/AZa
far I
qbal
Sid
diqi
Hum
ayun
Raz
a
2,15
5,15
0-
-
-
2,
002,
395
-
-
2,00
2,39
5
3,52
8,63
342
8,01
569
1,74
32,
493,
243
2,66
3,18
144
4,59
066
8,14
43,
775,
921
6
Ann
exur
e ‘I’
as
refe
rred
to in
not
e 10
.6 o
f the
Ban
k’s
Unc
onso
lidat
ed a
nd C
onso
lidat
ed
Fina
ncia
l Sta
tem
ents
Det
ails
of l
oans
writ
e-off
s of
Rs.
500
,000
and
abo
ve
United Bank Limited160

Annexure 'II' as referred to in notes 2.3 and 10.7 of the Bank's Unconsolidated and Consolidated Financial Statements
1. ISLAMIC BANKING BUSINESS
The Bank operates 100 (2019: 100) Islamic Banking branches and 187 (2019: 162) Islamic Banking windows.
The statement of financial position of the Bank's Islamic Banking branches as at December 31, is as follows:
Note 2020 2019
ASSETSCash and balances with treasury banks 9,784,450 13,092,570 Balances with other banks 2,277,264 804,553 Due from financial institutions 1.1 19,959,132 10,733,118 Investments 1.2 62,729,601 46,726,238 Islamic financing and related assets - net 1.3 20,538,157 9,017,375 Fixed assets 984,416 1,038,809 Intangible assets 4,638 7,263 Due from Head Office 7,997,409 6,824,821 Other assets 716,619 473,513 Total Assets 124,991,686 88,718,260
LIABILITIESBills payable 2,487,519 924,527 Due to financial institutions 3,632,752 1,299,975 Deposits and other accounts 1.6 111,478,161 81,432,150 Due to Head Office - - Other liabilities 2,324,027 1,532,732
119,922,459 85,189,384 NET ASSETS 5,069,227 3,528,876
REPRESENTED BYIslamic Banking Fund 2,181,000 2,181,000 Reserves - - Deficit on revaluation of assets (86,052) (59,860) Accumulated profit 2,974,279 1,407,736
5,069,227 3,528,876 CONTINGENCIES AND COMMITMENTS 1.9
The profit and loss account of the Bank's Islamic Banking branches for the year ended December 31 is as follows:
2020 2019
Profit / return earned 1.10 8,702,285 7,655,956 Profit / return expensed 1.11 (4,582,413) (4,603,982) Net profit / return 4,119,872 3,051,974
Other income Fee and Commission Income 162,670 240,015 Dividend Income - - Foreign Exchange Income 5,712 22,270 Income / (loss) from derivatives - - Loss on securities (5,797) (6,994) Other Income 15,821 22,053 Total Other Income 178,406 277,344 Total Income 4,298,278 3,329,318
Other expensesOperating expenses 1,723,247 1,734,456 Workers Welfare Fund 47,479 33,731 Other charges - - Total other expenses 1,770,726 1,768,187
Profit before provisions 2,527,552 1,561,131 Provisions and write-offs - net 12,813 9,567 Profit before taxation 2,514,739 1,551,564 Taxation 948,196 627,017 Profit after taxation 1,566,543 924,547
--------- (Rupees in '000) ---------
--------- (Rupees in '000) ---------
1
161Annual Report 2020
Annexure ‘II’ as referred to in notes 2.3 and 10.7 of the Bank’s Unconsolidated and Consolidated Financial Statements

Annexure 'II' as referred to in notes 2.3 and 10.7 of the Bank's Unconsolidated and Consolidated Financial Statements
1.1 Due from Financial Institutions
Call money lending 10,500,000 - 10,500,000 - - - Bai Muajjal Receivable from other Financial Institutions 3,026,018 - 3,026,018 10,733,118 - 10,733,118Bai Muajjal Receivable from State Bank of Pakistan 6,433,114 - 6,433,114 - - -
19,959,132 - 19,959,132 10,733,118 - 10,733,118
1.2 Investments by segments
Federal Government Securities- Ijarah Sukuks 19,992,452 - (86,052) 19,906,400 5,900,860 - (59,860) 5,841,000- Government of Pakistan Modaraba Pool 466,435 - - 466,435 - - - - - Bai Muajjal with Govt. of Pakistan 1.2.1 29,569,648 - - 29,569,648 26,443,679 - - 26,443,679
50,028,535 - (86,052) 49,942,483 32,344,539 - (59,860) 32,284,679
Non Government Debt Securities - Listed 450,000 - - 450,000 450,000 - - 450,000 - Unlisted 12,337,118 - - 12,337,118 13,991,559 - - 13,991,559
12,787,118 - - 12,787,118 14,441,559 - - 14,441,559 Total Investments 62,815,653 - (86,052) 62,729,601 46,786,098 - (59,860) 46,726,238
Note 2020 2019
1.2.1 Bai Muajjal with Government of Pakistan
Bai Muajjal Investment 33,031,000 33,031,000Less: Deferred Income (3,461,352) (6,587,321)Bai Muajjal Investment - net 29,569,648 26,443,679
1.3 Islamic financing and related assets
Ijarah 1.4 440,754 654,998 Murabahah 1.5 272,766 421,509 Musharakah 8,392,690 64,199 Diminishing Musharakah 6,754,380 5,554,909 Istisna 39,584 139,105 Islamic Export Refinance scheme - Musharakah 2,989,544 999,544 Islamic Export Refinance scheme - Murabahah - 303,449 Advances against Islamic assets
Advances against Ijarah 77,190 18,939 Advances for Diminishing Musharakah 410,595 114,776 Advances for Murabahah 33,427 153,105 Advances for Murabahah - IERS 456,623 - Advances agaisnt Mera Pakistan Mera Ghar 459 - Advances for Istisna 148,586 416,601
Inventory related to Islamic financing Istisna 296,918 166,760
Profit and other receivables against financings 336,219 113,408 Gross Islamic financing and related assets 20,649,735 9,121,302
Less: Provision against Islamic financings- Specific (90,927) (85,346) - General (20,651) (18,581)
(111,578) (103,927) Islamic financing and related assets - net of provision 20,538,157 9,017,375
2020 2019
--------------------------------------------------------- (Rupees in '000) ---------------------------------------------------------
2020 2019
In Local Currency
In Foreign Currencies Total In Local
CurrencyIn Foreign Currencies Total
Provision for
diminution
Surplus / (Deficit)
Carrying Value
Cost / Amortised
cost
--------- (Rupees in '000) ---------
Provision for
diminution Surplus / (Deficit) Carrying Value
----------------------------------------------------------------------------- (Rupees in '000) ----------------------------------------------------------------------------
Cost / Amortised
cost
2United Bank Limited162
Annexure ‘II’ as referred to in notes 2.3 and 10.7 of the Bank’s Unconsolidated and Consolidated Financial Statements

Annexure 'II' as referred to in notes 2.3 and 10.7 of the Bank's Unconsolidated and Consolidated Financial Statements
1.4 Ijarah
Plant & Machinery 673,648 15,923 505,082 309,046 109,483 252,489 252,593(184,489) (166,040)
Vehicles 408,490 20,273 391,646 118,094 106,711 203,485 188,161(37,117) (21,320)
Total 1,082,138 (185,410) 896,728 427,140 28,834 455,974 440,754
Plant & Machinery 510,676 191,251 673,648 215,764 118,733 309,046 364,602(28,279) (25,451)
Vehicles 262,411 276,604 408,490 110,531 109,048 118,094 290,396(130,525) (101,485)
Total 773,087 309,051 1,082,138 326,295 100,845 427,140 654,998
Future Ijarah payments receivable
Ijarah rental receivables 245,443 245,509 - 490,952 333,252 425,273 - 758,525
Note 2020 20191.5 Murabahah
Murabahah financing 1.5.1 272,766 421,509 Inventory for Murabahah - - Advances for Murabahah 33,427 153,105
306,193 574,614
1.5.1 Murabahah receivable - gross 1.5.2 272,766 421,509 Less: Deferred murabahah income 1.5.4 (2,159) (6,133) Less: Profit receivable shown in other assets (3,510) (11,510) Murabahah financings 267,097 403,866
1.5.2 The movement in Murabahah financing during the year is as follows:
Opening balance 421,509 742,302 Sales during the year 1,161,818 2,260,825 Adjusted during the year (1,310,561) (2,581,618) Closing balance 272,766 421,509
1.5.3 Murabahah sale price 272,766 421,509 Murabahah purchase price (267,097) (403,866)
5,669 17,643
2019
------------------------------------------------------------------ (Rupees in '000) ------------------------------------------------------------------
Book Value as at 31 Dec 2019At January
1, 2019Additions / (deletions)
At December 31, 2019
At January 1, 2019
Charge for the year
At December 31, 2019
Accumulated Depreciation2020
CostBook Value as at
31 Dec 2020At January 1, 2020
Additions / (deletions)
At December 31, 2020
At January 1, 2020
Charge for the year
At December 31, 2020
Cost Accumulated Depreciation
Over Five years
------------------------------------------------------------------ (Rupees in '000) ------------------------------------------------------------------
2020 2019
Over Five years Total Not later
than 1 year
Later than 1 year and
less than 5 years
TotalNot later than 1 year
Later than 1 year and
less than 5 years
--------- (Rupees in '000) ---------
--------------------------------------------------------------------------- (Rupees in '000) ---------------------------------------------------------------------------
3
163Annual Report 2020
Annexure ‘II’ as referred to in notes 2.3 and 10.7 of the Bank’s Unconsolidated and Consolidated Financial Statements

Annexure 'II' as referred to in notes 2.3 and 10.7 of the Bank's Unconsolidated and Consolidated Financial Statements
2020 2019
1.5.4 Deferred Murabahah incomeOpening balance 6,133 13,943 Arising during the year 33,269 76,899 Less: recognised during the year (37,243) (84,709) Closing balance 2,159 6,133
1.6 Deposits
CustomersCurrent deposits 39,475,999 884,081 40,360,080 32,478,116 779,264 33,257,380Savings deposits 18,710,264 - 18,710,264 13,018,167 - 13,018,167Term deposits 5,662,065 - 5,662,065 8,414,762 - 8,414,762
63,848,328 884,081 64,732,409 53,911,045 779,264 54,690,309Financial Institutions Current deposits 2,046,933 - 2,046,933 2,488,822 - 2,488,822Savings deposits 22,697,263 - 22,697,263 8,772,019 - 8,772,019Term deposits 22,001,556 - 22,001,556 15,481,000 - 15,481,000
46,745,752 - 46,745,752 26,741,841 - 26,741,841110,594,080 884,081 111,478,161 80,652,886 779,264 81,432,150
2020 20191.6.1 Composition of deposits
- Individuals 32,635,739 28,043,544 - Government / Public Sector Entities 2,216,437 91,025 - Banking Companies 9,033,791 17,937,862 - Non-Banking Financial Institutions 37,711,961 8,803,979 - Private Sector 29,880,233 26,555,740
111,478,161 81,432,150
1.6.2
2020 20191.7 Charity Fund
Opening balance 3,491 2,597
Additions during the periodReceived from customers on account of delayed payment 3,239 3,494 Profit on charity saving account 296 -
3,535 3,494 Payments / utilisation during the year
Education (1,000) - Health (2,700) (2,600) Others (500) -
(4,200) (2,600)
Closing balance 2,826 3,491
1.8 Islamic Banking Business Unappropriated Profit
Opening balance 1,407,736 483,189 2,514,739 1,551,564
Less: Taxation (948,196) (627,017) Closing balance 2,974,279 1,407,736
1.9 Contingencies and commitments
- Guarantees 111,454 10,602 - Commitments 5,880,112 5,363,637
5,991,566 5,374,239
--------- (Rupees in '000) ---------
This includes deposits eligible to be covered under insurance arrangements amounting to Rs. 31,125.997 million (2019: Rs.39,534.355 million).
2020 2019
------------------------------------- (Rupees in '000) -------------------------------------
--------- (Rupees in '000) ---------
In Local Currency
In Foreign currencies Total In Local
Currency
Add: Islamic Banking profit for the year
In Foreign currencies Total
--------- (Rupees in '000) ---------
4United Bank Limited164
Annexure ‘II’ as referred to in notes 2.3 and 10.7 of the Bank’s Unconsolidated and Consolidated Financial Statements

Annexure 'II' as referred to in notes 2.3 and 10.7 of the Bank's Unconsolidated and Consolidated Financial Statements
2020 20191.10 Profit / Return Earned on Financing, Investments and Placement
Profit earned on:Financing 1,860,616 1,074,949 Investments 5,394,613 4,948,004 Placements 1,174,739 1,350,349 Rental Income from Ijarah 272,317 282,654
8,702,285 7,655,956
1.11 Profit on Deposits and other Dues Expensed
Deposits and other accounts 4,430,595 4,471,693 Due to Financial Institutions 54,756 25,016 Return expense on leases 97,062 107,273
4,582,413 4,603,982
1.12 Disclosures for profit and loss distribution and pool management
General Pools
IERS Pool(s)
Treasury Pool(s)
Special Pool(s)
The Treasury pool assets generally comprise of Sovereign Guarantee Sukuk and financing under diminishing musharakah,Ijarah facility and the related liability of the Treasury pool comprise of Musharakah / Wakalah/ Mudarabah from financialinstitutions. These pools are created to meet the liquidity requirements of the Holding company.
The Bank operates general and special pools for deposits and inter-bank funds accepted / acquired under Mudarabah,Wakalah and Musharakah modes.
For General Pools, the Bank allocates PKR financing to Corporate, SME and Consumer Finance customers in diversifiedsectors and avenues of the economy / business and Investments in Sovereign Guarantee Sukuk, Corporate Sukuk, BaiMuajjal with Government of Pakistan, are also done through General Pools. All remunerative deposits are tagged to thesegeneral pools and their funds generated from the depositors are invested on priority basis.
The IERS pool assets comprise of Sovereign Guarantee Sukuk, and financing to Corporate Customers and exporters asallowed under the applicable laws and regulations, and as such are exposed to lower credit risk. The Musharakah with SBPunder IERS is tagged to the IERS pool.
Separate pool(s) are created where the customers desire to invest in high yield assets. These pool(s) rates are higher thanthe general pool depending on the assets. In case of loss in special pool, the loss will be borne by the special pool members.The net return on the pool is arrived at after deduction of direct costs from the gross return earned on the pool. From the netreturn, profit is paid to the Mudarib in the ratio of the Mudarib’s equity in the pool to the total pool. The balance represents thedistributable profit.
Under the General deposits pools, the Bank accepts funds on Mudarabah basis from depositors (Rab-ul-Maal) where theBank acts as Manager (Mudarib) and invests the funds in the Shariah Compliant modes of financing, investments andplacements. When utilising investing funds, the Bank prioritizes the funds received from depositors over the funds generatedfrom own sources after meeting the regulatory requirement relating to such deposits.
Specific pools are operated for funds acquired / accepted from the Corporate Customers, other banks and State Bank ofPakistan for liquidity management and Islamic Export Refinance to the Bank's customers respectively under the Musharakah/Mudarabah / Wakalah modes.
--------- (Rupees in '000) ---------
5
165Annual Report 2020
Annexure ‘II’ as referred to in notes 2.3 and 10.7 of the Bank’s Unconsolidated and Consolidated Financial Statements

Annexure 'II' as referred to in notes 2.3 and 10.7 of the Bank's Unconsolidated and Consolidated Financial Statements
Equity Pools
The risk characteristic of pool
The Parameters used for allocation of profit, expenses and provisions to the Pool
- No expense of general or administrative nature is charged to the pools.- No provisions against any non-performing asset of the pool is passed on to the pool except on the actual loss / write-off ofsuch non-performing asset. - The profit of the pool is shared between equity and Rab-ul-Maal of the pool on the basis of Musharakah at gross level(before charging of mudarib fee) as per the investment ratio of the equity.- The profit of the pool is shared among the members of the pool on pre-defined mechanism based on the weightagesannounced before the profit calculation period after charging of mudarib fee.
The Mudarib’s share on Deposits for the period ended December 31, 2020, is Rs.2,931.92 million (45.17% of distributableprofit of Mudarabah Pool). Of this, an amount of Rs.556.30 million (45.17% of Mudarib share) was distributed back todepositors as Hiba. The rate of profit earned on average earning assets was 10.47% per annum and the rate of profit paid onaverage deposits was 7.10% per annum.
The risk characteristic of each pool mainly depends on the assets and liability profile of the pool. As per the Bank 's policy,relatively low risk / secured financing transactions and assets are allocated to the pool. The Bank maintains General Pools,Special Pools, FI Pools, IERS pool and Equity pool. All pools are exposed to general credit risk, asset ownership risk andProfit rate risk of underlying assets involved.
- The profit of each deposit pool is calculated on all The remunerative assets booked by utilising The funds from the pool.- Profit of pool is calculated after deduction of expenses directly incurred in earning the income of such pool, the directlyrelated costs comprise of depreciation on ijarah assets, takaful premium, amortisation of Premium on investment etc.
During the year, the Bank has given General Hiba to the depositors in General and specific pool, keeping in view theprescribed guidelines of Pool Management provided by the SBP. However, Hiba are given at the sole discretion of the Bankwithout any contractual commitment with the depositors.
All other assets including fixed assets, advance against financing, bai-salam financing and subsidized financing to Bank'semployees are tagged to equity pool. To safeguard the interest of customers, all high risk investments are done throughequity pool. The Bank as Mudarib in the general pools is responsible for financing costs / assets such as land, building,furniture, fixtures, computers and IT system from its own sources / equity.
6
United Bank Limited166
Annexure ‘II’ as referred to in notes 2.3 and 10.7 of the Bank’s Unconsolidated and Consolidated Financial Statements

Annexure 'II' as referred to in notes 2.3 and 10.7 of the Bank's Unconsolidated and Consolidated Financial Statements
The Bank managed following pools during the year.
% % Rupees in '000 % % Rupees in '000
ADMA Pools 12 Mudarbahah Monthly 5.79% 50.00% 8,446 4.15% 7.74% 654 Special Pools 120 Mudarbahah Monthly 10.84% 36.96% 888,011 8.26% 36.14% 320,970 IERS Pools 24 Musharakah Monthly 5.48% 86.92% 358,319 2.00% 0.00% - General Pools 12 Mudarbahah Monthly 10.83% 50.00% 2,035,467 8.66% 20.00% 407,004 Treasury Pools - - - - - - - - -
% % Rupees in '000 % % Rupees in '000
ADMA Pools 12 Mudarbahah Monthly 5.08% 50.00% 7,829 2.81% 10.47% 820 Special Pools 133 Mudarbahah Monthly 11.39% 9.20% 197,508 10.56% 19.47% 38,459 IERS Pools 33 Musharakah Monthly 4.11% 74.84% 63,596 2.00% 0.00% - General Pools 12 Mudarbahah Monthly 8.71% 50.00% 1,453,994 7.92% 34.91% 507,609 Treasury Pools 2 Musharakah As required 12.93% 25.77% 1,278 9.60% 0.00% -
2020 2019
1.13 Deployment of Mudarabah based deposits by class of business
Chemical and pharmaceuticals 2,230,052 881,578Agri business 8,745,482 341,340Textile 1,991,142 1,795,124Financial 13,335,120 12,480,670Food industries 318,037 508,003Plastic 299,263 290,050Individuals 1,981,422 1,460,332Production and transmission of energy 13,496,129 15,341,872Government of Pakistan Securities 59,401,615 32,284,679Others 3,817,471 2,065,022
105,615,733 67,448,670
2020
No of Pools
Mudarib fee / Musharkah
share / Wakala Fee
Average profit rate /
return distributed
Amount of Mudarib share
transferred through Hiba
Nature of Pool
Profit rate and
weightages announce-
ment period
Average profit rate
earned
Profit Sharing ratio
Percentage of Mudarib share
transferred through Hiba
------- (Rupees in '000) -------
2019
No of Pools
Percentage of Mudarib share
transferred through Hiba
Average profit rate /
return distributed
Amount of Mudarib share
transferred through Hiba
Nature of Pool
Profit rate and
weightages announce-
ment period
Average profit rate
earned
Profit Sharing ratio
Mudarib fee / Musharkah
share / Wakala Fee
6
167Annual Report 2020
Annexure ‘II’ as referred to in notes 2.3 and 10.7 of the Bank’s Unconsolidated and Consolidated Financial Statements

Annexure 'III' as referred to in Note 11.6 of the Bank's Unconsolidated Financial Statements
Disposals of operating fixed assets to related parties during the year 2020
Land & BuildingLeasehold Improvements 6,557 6,557 - 2,215 Claim proceeds UBL Insurers LimitedCivil Work 1,628 1,628 - 550 Claim proceeds UBL Insurers LimitedFurniture, Electric and Civil Work 3,222 2,416 806 1,088 Claim proceeds UBL Insurers Limited
11,407 10,601 806 3,853
VehiclesToyota Corolla 1,807 1,410 397 1,400 Claim proceeds UBL Insurers LimitedToyota Corolla 1,807 1,626 181 1,400 Claim proceeds UBL Insurers LimitedMercedes S500 35,829 23,110 12,719 19,885 Buy Back Sima Kamil
39,443 26,146 13,297 22,685
Electrical, office and computer equipment15 KVA Genset 1,419 1,254 165 416 Claim proceeds UBL Insurers Limited30 KVA Genset 1,618 1,618 - 890 Claim proceeds UBL Insurers Limited40 KVA Genset 1,818 1,818 - 545 Claim proceeds UBL Insurers Limited20KVA Genset 1,065 1,065 - 108 Claim proceeds UBL Insurers Limited
5,920 5,755 165 1,959
Total 56,770 42,502 14,268 28,497
Mode of disposal Particulars of Buyers
---------------------------- (Rupees in '000) ---------------------------
Cost Accumulated depreciation
Book value
Sale proceeds
1
Annexure ‘III’ as referred to in Note 11.6 of the Bank’s Unconsolidated Financial Statements
United Bank Limited168

INDEPENDENT AUDITOR’S REPORT
169Annual Report 2020
To the members of United Bank Limited
Opinion
We have audited the annexed consolidated financial statements of United Bank Limited and its subsidiaries (the Group), which comprise the consolidated statement of financial position as at December 31, 2020, and the consolidated profit and loss account, the consolidated statement of comprehensive income, the consolidated statement of changes in equity and the consolidated cash flow statement for the year then ended, and notes to the consolidated financial statements, including a summary of significant accounting policies and other explanatory information.
In our opinion, consolidated financial statements give a true and fair view of the consolidated financial position of the Group as at December 31, 2020, and of its consolidated financial performance and its consolidated cash flows for the year then ended in accordance with the accounting and reporting standards as applicable in Pakistan.
Basis for Opinion
We conducted our audit in accordance with International Standards on Auditing (ISAs) as applicable in Pakistan. Our responsibilities under those standards are further described in the Auditor’s Responsibilities for the Audit of the Consolidated Financial Statements section of our report. We are independent of the Group in accordance with the International Ethics Standards Board for Accountants’ Code of Ethics for Professional Accountants as adopted by the Institute of Chartered Accountants of Pakistan (the Code), and we have fulfilled our other ethical responsibilities in accordance with the Code. We believe that the audit evidence we have obtained is sufficient and appropriate to provide a basis for our opinion.
Key Audit Matters
Key audit matters are those matters that, in our professional judgment, were of most significance in our audit of the consolidated financial statements of the current period. These matters were addressed in the context of our audit of the consolidated financial statements as a whole, and in forming our opinion thereon, and we do not provide a separate opinion on these matters.

United Bank Limited170
Following is the Key audit matter:
S.No. Key audit matter How the matter was addressed in our audit
1 Provision against advances (Refer notes 5.5 and 10.4 to the consolidated financial statements)
The Group makes provision against advances extended in Pakistan on a time-based criteria that involves ensuring that all non-performing advances are classified in accordance with the ageing criteria specified in the Prudential Regulations (PRs) issued by the State Bank of Pakistan (SBP).
In addition to the above time-based criteria, the PRs require a subjective evaluation of the credit worthiness of borrowers to determine the classification of advances.
The PRs also require the creation of general provision for certain categories of advances.
During the year, as a result of COVID-19, the SBP has allowed certain relaxations including deferment of principal payment, rescheduling / restructuring of principal and mark-up, extension in timeline of provisioning against trade bills while maintaining the customer status as “regular”.
Provision against advances of overseas branches and subsidiaries is made as per the requirements of the respective regulatory regimes.
The Group has recognized a net provision against advances amounting to Rs. 16,139.278 million in the consolidated profit and loss account in the current year. As at December 31, 2020, the Group holds a provision of Rs. 79,350.874 million against advances.
The determination of provision against advances based on the above criteria remains a significant area of judgement and estimation. Because of the significance of the impact of these judgements / estimations and the materiality of advances relative to the overall consolidated financial statements of the Group, we considered the area of provision against advances as a key audit matter.
Our audit procedures to verify provision against domestic advances included, amongst others, the following:
We obtained an understanding of the design and tested the operating effectiveness of the relevant controls established by the Group to identify loss events and for determining the extent of provisioning required against non-performing advances.
The testing of controls included testing of:
controls over correct classification of non-performing advances on time-based criteria;
controls over monitoring of advances with higher risk of default and correct classification of non-performing advances on subjective criteria;
controls over accurate computation and recording of provisions; and
controls over the governance and approval process related to provisions, including continuous reassessment by the management.
We selected a sample of loan accounts and performed the following substantive procedures:
checked repayments of loan / mark-up installments, tested classification of non-performing advances based on the number of days overdue and considered the relaxations provided by SBP as result of COVID-19; and
evaluated the management’s assessment for classification of a borrower’s loan facilities as performing or non-performing based on review of repayment pattern, inspection of credit documentation, discussions with the management and the management’s consideration of the impact of COVID-19 on the borrower.
We checked the accuracy of specific provision made against non-performing advances and of general provision made against performing advances as per the requirements of PRs by recomputing the provision amount in accordance with the criteria prescribed under the PRs and relaxations provided by SBP as a result of COVID-19.
We issued instructions to auditors of those overseas branches and subsidiaries which were selected for audit, highlighting ‘Provision against advances’ as a significant risk. The auditors of those branches and subsidiaries performed audit procedures to check compliance with regulatory requirements and reported the results thereof to us. We, as auditor of the Group, evaluated the work performed by the component auditors and the results thereof.
Information Other than the Consolidated and Unconsolidated Financial Statements and Auditor’s Reports Thereon
Management is responsible for the other information. The other information comprises the information included in the Annual Report, but does not include the consolidated and unconsolidated financial statements and our auditor’s reports thereon.
Our opinion on the consolidated financial statements does not cover the other information and we do not express any form of assurance conclusion thereon.

171Annual Report 2020
In connection with our audit of the consolidated financial statements, our responsibility is to read the other information and, in doing so, consider whether the other information is materially inconsistent with the consolidated financial statements or our knowledge obtained in the audit or otherwise appears to be materially misstated. If, based on the work we have performed, we conclude that there is a material misstatement of this other information, we are required to report that fact. We have nothing to report in this regard.
Responsibilities of Management and the Board of Directors for the Consolidated Financial Statements
Management is responsible for the preparation and fair presentation of the consolidated financial statements in accordance with accounting and reporting standards as applicable in Pakistan and Companies Act, 2017 and for such internal control as management determines is necessary to enable the preparation of consolidated financial statements that are free from material misstatement, whether due to fraud or error.
In preparing the consolidated financial statements, management is responsible for assessing the Group’s ability to continue as a going concern, disclosing, as applicable, matters related to going concern and using the going concern basis of accounting unless management either intends to liquidate the Group or to cease operations, or has no realistic alternative but to do so.
The Board of Directors is responsible for overseeing the Group’s financial reporting process.
Auditor’s Responsibilities for the Audit of the Consolidated Financial Statements
Our objectives are to obtain reasonable assurance about whether the consolidated financial statements as a whole are free from material misstatement, whether due to fraud or error, and to issue an auditor’s report that includes our opinion. Reasonable assurance is a high level of assurance, but is not a guarantee that an audit conducted in accordance with ISAs as applicable in Pakistan will always detect a material misstatement when it exists. Misstatements can arise from fraud or error and are considered material if, individually or in the aggregate, they could reasonably be expected to influence the economic decisions of users taken on the basis of these consolidated financial statements.
As part of an audit in accordance with ISAs as applicable in Pakistan, we exercise professional judgment and maintain professional skepticism throughout the audit. We also:
Identify and assess the risks of material misstatement of the consolidated financial statements, whether due to fraud or error, design and perform audit procedures responsive to those risks, and obtain audit evidence that is sufficient and appropriate to provide a basis for our opinion. The risk of not detecting a material misstatement resulting from fraud is higher than for one resulting from error, as fraud may involve collusion, forgery, intentional omissions, misrepresentations, or the override of internal control.
Obtain an understanding of internal control relevant to the audit in order to design audit procedures that are appropriate in the circumstances, but not for the purpose of expressing an opinion on the effectiveness of the Group’s internal control.
Evaluate the appropriateness of accounting policies used and the reasonableness of accounting estimates and related disclosures made by management.
Conclude on the appropriateness of management’s use of the going concern basis of accounting and, based on the audit evidence obtained, whether a material uncertainty exists related to events or conditions that may cast significant doubt on the Group’s ability to continue as a going concern. If we conclude that a material uncertainty exists, we are required to draw attention in our auditor’s report to the related disclosures in the consolidated financial statements or, if such disclosures are inadequate, to modify our opinion. Our conclusions are based on the audit evidence obtained up to the date of our auditor’s report. However, future events or conditions may cause the Group to cease to continue as a going concern.
Evaluate the overall presentation, structure and content of the consolidated financial statements, including the disclosures, and whether the consolidated financial statements represent the underlying transactions and events in a manner that achieves fair presentation.
Obtain sufficient appropriate audit evidence regarding the financial information of the entities or business activities within the Group to express an opinion on the consolidated financial statements. We are responsible for the direction, supervision and performance of the group audit. We remain solely responsible for our audit opinion.
We communicate with the Board of Directors regarding, among other matters, the planned scope and timing of the audit and significant audit findings, including any significant deficiencies in internal control that we identify during our audit.

A.F. Ferguson & Co.Chartered AccountantsKarachiDated: March 3, 2021
United Bank Limited172
We also provide the Board of Directors with a statement that we have complied with relevant ethical requirements regarding independence, and to communicate with them all relationships and other matters that may reasonably be thought to bear on our independence, and where applicable, related safeguards.
From the matters communicated with the Board of Directors, we determine those matters that were of most significance in the audit of the consolidated financial statements of the current period and are therefore the key audit matters. We describe these matters in our auditor’s report unless law or regulation precludes public disclosure about the matter or when, in extremely rare circumstances, we determine that a matter should not be communicated in our report because the adverse consequences of doing so would reasonably be expected to outweigh the public interest benefits of such communication.
The engagement partner on the audit resulting in this independent auditor’s report is Shahbaz Akbar.

CONSOLIDATED STATEMENT OF FINANCIAL POSITION AS AT DECEMBER 31, 2020
Note 2020 2019
ASSETS
Cash and balances with treasury banks 6 258,139,459 243,370,701Balances with other banks 7 29,583,028 42,958,677Lendings to financial institutions 8 22,212,442 21,692,946Investments 9 1,167,803,512 874,435,902Advances 10 611,851,676 694,548,909Fixed assets 11 57,467,580 58,276,411Intangible assets 12 2,034,551 2,070,938Deferred tax assets 13 4,682,494 1,723,553Other assets 15 48,101,456 83,740,942
2,201,876,198 2,022,818,979 LIABILITIES
Bills payable 17 29,741,206 22,929,220Borrowings 18 131,827,185 170,405,060Deposits and other accounts 19 1,764,392,286 1,557,995,306Liabilities against assets subject to finance lease 20 15,957 19,095Subordinated debt 21 10,000,000 10,000,000Deferred tax liabilities 13 - - Other liabilities 22 58,267,678 70,598,427
1,994,244,312 1,831,947,108
NET ASSETS 207,631,886 190,871,871
REPRESENTED BY:Share capital 23 12,241,797 12,241,797Reserves 71,020,586 66,676,412Surplus on revaluation of assets 24 29,334,212 27,404,558Unappropriated profit 87,527,909 77,335,249Total equity attributable to the equity holders of the Bank 200,124,504 183,658,016
Non-controlling interest 25 7,507,382 7,213,855207,631,886 190,871,871
CONTINGENCIES AND COMMITMENTS 26
The annexed notes 1 to 52 and annexures I, II and III form an integral part of these consolidated financial statements.
Aameer Karachiwalla Shazad G. Dada Shazia Syed Arshad Ahmad Mir Sir Mohammed Anwar Pervez, OBE, HPkChief Financial Officer President & Director Director Chairman Chief Executive Officer
------------------------------------------ (Rupees in ‘000) ------------------------------------------
Aameer KarachiwallaChief Financial Officer
Shazad G. DadaPresident &
Chief Executive Officer
Shazia Syed Director
Arshad Ahmad Mir Director
Sir Mohammed Anwar Pervez, OBE, HPkChairman
173Annual Report 2020
Consolidated Statement of Financial PositionAs at December 31, 2020

CONSOLIDATED PROFIT AND LOSS ACCOUNT FOR THE YEAR ENDED DECEMBER 31, 2020
Note 2020 2019
Mark-up / return / interest earned 28 156,078,787 157,277,853Mark-up / return / interest expensed 29 79,005,574 93,936,935Net mark-up / interest income 77,073,213 63,340,918
Non mark-up / interest incomeFee and commission income 30 12,830,086 15,725,077Dividend income 872,029 1,123,261Foreign exchange income 3,857,888 4,669,102(Loss) / income from derivatives (13,076) 64,627Gain on securities - net 31 610,230 216,670Other income 32 687,298 1,759,245Total non mark-up / interest income 18,844,455 23,557,982Total income 95,917,668 86,898,900
Non mark-up / interest expensesOperating expenses 33 43,743,044 43,843,588Workers' Welfare Fund 34 873,966 747,859Other charges 35 167,335 40,109Total non mark-up / interest expenses 44,784,345 44,631,556
Share of profit of associates 9.9.1 504,542 776,853Profit before provisions 51,637,865 43,044,197Provisions and write offs - net 36 17,255,678 7,313,543Profit before taxation from continuing operations 34,382,187 35,730,654
Taxation 37 13,577,280 15,457,158
Profit after taxation from continuing operations 20,804,907 20,273,496
Discontinued operation
Loss from discontinued operation - net of tax 14 (16,373) (1,225,198)
20,788,534 19,048,298Attributable to:Equity holders of the Bank
from continuing operations 20,954,291 20,320,339 from discontinued operation (16,373) (1,225,198)
20,937,918 19,095,141Non-controlling interest 25.1 (149,384) (46,843)
20,788,534 19,048,298
Earnings per share for profit from continuing operations attributable tothe ordinary equity holders of the BankBasic and diluted 17.12 16.60
Earnings per share for profit attributable to the ordinary equity holders of the BankBasic and diluted 38 17.10 15.60
The annexed notes 1 to 52 and annexures I, II and III form an integral part of these consolidated financial statements.
Aameer Karachiwalla Shazad G. Dada Shazia Syed Arshad Ahmad Mir Sir Mohammed Anwar Pervez, OBE, HPkChief Financial Officer President & Director Director Chairman Chief Executive Officer
------ (Rupees in ‘000) ------
------------ (Rupees) ------------
Aameer KarachiwallaChief Financial Officer
Shazad G. DadaPresident &
Chief Executive Officer
Shazia Syed Director
Arshad Ahmad Mir Director
Sir Mohammed Anwar Pervez, OBE, HPkChairman
United Bank Limited174
Consolidated Profit and Loss AccountFor the year ended December 31, 2020

CONSOLIDATED STATEMENT OF COMPREHENSIVE INCOME FOR THE YEAR ENDED DECEMBER 31, 2020
2020 2019
Profit after taxation for the year attributable to:Equity holders of the Bank 20,937,918 19,095,141 Non-controlling interest (149,384) (46,843)
20,788,534 19,048,298
Other comprehensive income
Items that may be reclassified to profit and loss account in subsequent periods
Effect of translation of net investment in foreign branches and subsidiariesEquity holders of the Bank 2,233,579 5,994,907 Non-controlling interest 425,820 777,237
2,659,399 6,772,144 Movement in surplus on revaluation of investments - net of tax
Equity holders of the Bank 2,121,194 10,419,759 Non-controlling interest 74,478 562,734
2,195,672 10,982,493 4,855,071 17,754,637
Items that will not be reclassified to profit and loss account in subsequent periods
Remeasurement loss of defined benefit obligations - net of taxEquity holders of the Bank (876,031) (540,185) Non-controlling interest (60,410) (19,359)
(936,441) (559,544)
Movement in surplus on revaluation of fixed assets - net of taxEquity holders of the Bank 7,917 383,870 Non-controlling interest 5,283 381,296
13,200 765,166
Movement in (deficit) / surplus on revaluation of non-banking assets - net of tax (921) 39,598 (924,162) 245,220
Total comprehensive income for the year 24,719,443 37,048,155
Attributable to:Equity holders of the Bank 24,423,656 35,393,090 Non-controlling interest 295,787 1,655,065
24,719,443 37,048,155
The annexed notes 1 to 52 and annexures I, II and III form an integral part of these consolidated financial statements.
Aameer Karachiwalla Shazad G. Dada Shazia Syed Arshad Ahmad Mir Sir Mohammed Anwar Pervez, OBE, HPkChief Financial Officer President & Director Director Chairman Chief Executive Officer
------- (Rupees in '000) -------
Aameer KarachiwallaChief Financial Officer
Shazad G. DadaPresident &
Chief Executive Officer
Shazia Syed Director
Arshad Ahmad Mir Director
Sir Mohammed Anwar Pervez, OBE, HPkChairman
175Annual Report 2020
Consolidated Statement of Comprehensive IncomeFor the year ended December 31, 2020

CONSOLIDATED STATEMENT OF CHANGES IN EQUITY FOR THE YEAR ENDED DECEMBER 31, 2020
Balance as at January 1, 2019 12,241,797 3,000 31,353,522 28,722,348 (10,230,277) 27,117,327 105,856 73,749,955 163,063,528 5,560,330 168,623,858
Total comprehensive income for the year ended December 31, 2019
Profit after taxation for the year ended December 31, 2019 - - - - - - - 19,095,141 19,095,141 (46,843) 19,048,298Other comprehensive income - net of tax - - - 5,994,907 10,419,759 383,870 39,598 (540,185) 16,297,949 1,701,908 17,999,857
Total comprehensive income for the year endedDecember 31, 2019 - - - 5,994,907 10,419,759 383,870 39,598 18,554,956 35,393,090 1,655,065 37,048,155
Ordinary dividend relating to non-controlling shareholders - - - - - - - - - (1,540) (1,540)
Transfer from surplus on revaluation on disposal to unappropriated profit - net of tax - - - - - (262,309) (114,383) 376,692 - - -
Transfer from surplus on revaluation of fixed assets to unappropriated profit - net of tax - - - - - (54,883) - 54,883 - - -
Transfer to statutory reserve - - 1,935,261 - - - - (1,935,261) - - -
Transactions with owners for the year ended December 31, 2019
Final cash dividend - December 31, 2018 declaredsubsequent to the year end at Rs. 3.0 per share - - - - - - - (3,672,539) (3,672,539) - (3,672,539)
Interim cash dividend - March 31, 2019 declaredat Rs. 2.5 per share - - - - - - - (3,060,449) (3,060,449) - (3,060,449)
Interim cash dividend - June 30, 2019 declaredat Rs. 2.5 per share - - - - - - - (3,060,449) (3,060,449) - (3,060,449)
Interim cash dividend - September 30, 2019 at Rs. 3.0 per share - - - - - - - (3,672,539) (3,672,539) - (3,672,539)
Realisation of exchange translation reserve - - - (1,332,626) - - - - (1,332,626) - (1,332,626)
Balance as at December 31, 2019 12,241,797 3,000 33,288,783 33,384,629 189,482 27,184,005 31,071 77,335,249 183,658,016 7,213,855 190,871,871
Total comprehensive income for the year ended December 31, 2020
Profit after taxation for the year ended December 31, 2020 - - - - - - - 20,937,918 20,937,918 (149,384) 20,788,534Other comprehensive income - net of tax - - - 2,233,579 2,121,194 7,917 (921) (876,031) 3,485,738 445,171 3,930,909
Total comprehensive income for the year ended December 31, 2020 - - - 2,233,579 2,121,194 7,917 (921) 20,061,887 24,423,656 295,787 24,719,443
Ordinary dividend relating to Non-controlling shareholders - - - - - - - - - (2,260) (2,260)
Transfer from surplus on revaluation on disposalto unappropriated profit - net of tax - - - - - (116,346) (29,237) 145,583 - - -
Transfer from surplus on revaluation of fixed assets to unappropriated profit - net of tax - - - - - (52,953) - 52,953 - - -
Transfer to statutory reserve - - 2,110,595 - - - - (2,110,595) - - -
Transactions with owners for the year ended December 31, 2020
Final cash dividend - December 31, 2019 declaredsubsequent to the year end at Rs. 4.0 per share - - - - - - - (4,896,719) (4,896,719) - (4,896,719)
Interim cash dividend - March 31, 2020 declaredat Rs. 2.5 per share - - - - - - - (3,060,449) (3,060,449) - (3,060,449)
Balance as at December 31, 2020 12,241,797 3,000 35,399,378 35,618,208 2,310,676 27,022,623 913 87,527,909 200,124,504 7,507,382 207,631,886
The annexed notes 1 to 52 and annexures I, II and III form an integral part of these consolidated financial statements.
Aameer Karachiwalla Shazad G. Dada Shazia Syed Arshad Ahmad Mir Sir Mohammed Anwar Pervez, OBE, HPkChief Financial Officer President & Director Director Chairman Chief Executive Officer
---------------------------------------------------------------------------------------- (Rupees in '000) ----------------------------------------------------------------------------------------
Attributable to equity shareholders of the BankNon-
controlling Interest
TotalShare Capital
General reserve
Statutory reserve
Capital reserve - Exchange translation
Unappro-priated profit Sub total
Investments Fixed Assets Non Banking Assets
Surplus / (deficit) on revaluation of
Aameer KarachiwallaChief Financial Officer
Shazad G. DadaPresident &
Chief Executive Officer
Shazia Syed Director
Arshad Ahmad Mir Director
Sir Mohammed Anwar Pervez, OBE, HPkChairman
United Bank Limited176
Consolidated Statement of Changes in EquityFor the year ended December 31, 2020

Aameer KarachiwallaChief Financial Officer
Shazad G. DadaPresident &
Chief Executive Officer
Shazia Syed Director
Arshad Ahmad Mir Director
Sir Mohammed Anwar Pervez, OBE, HPkChairman
CONSOLIDATED CASH FLOW STATEMENT FOR THE YEAR ENDED DECEMBER 31, 2020
Note 2020 2019
CASH FLOW FROM OPERATING ACTIVITIESProfit before taxation including discontinued operation 34,364,850 34,771,052 Less: Dividend income 872,029 1,123,261 Less: Share of profit of associates 504,542 776,853
32,988,279 32,870,938Adjustments:
Depreciation on fixed assets 2,911,166 2,806,191 Depreciation on Islamic financing against leased assets (Ijarah) 216,195 227,783 Depreciation on right-of-use assets 1,662,049 2,112,273 Amortisation 855,574 701,155 Workers' Welfare Fund 873,966 747,859 Provision for retirement benefits 1,106,435 1,062,007 Charge for compensated absences 70,902 33,383 Provision against loans and advances - net 15,644,790 4,318,706 Provision for diminution in value of investments - net 826,795 2,392,687 Interest expense on lease liability against right-of-use assets 925,848 1,068,434 Provision against off balance sheet items 431,749 47,438 Gain on sale of operating fixed assets - net (69,565) (120,056) Gain on sale of ijarah assets - net (792) (861) Gain on sale of non-banking assets (191,559) 54,649Bad debts written off directly 143,246 149,591 Unrealised (loss) / gain on revaluation of investments classified as held for trading (228) 7,386 Realisation of exchange translation reserve - UBL New York branch - (1,332,626) Other provisions / write offs 209,098 405,121
25,615,669 14,681,120 58,603,948 47,552,058
(Increase) / Decrease in operating assetsLendings to financial institutions (519,496) 13,653,605 Held for trading securities 68,126,135 30,445,150 Advances 66,658,757 54,889,311 Other assets (excluding advance taxation) 21,631,471 4,085,204
155,896,867 103,073,270 Increase / (Decrease) in operating liabilities
Bills payable 6,811,986 (4,343,747) Borrowings (38,577,875) (109,513,065) Deposits and other accounts 206,396,980 109,671,265 Other liabilities (excluding current taxation) (14,508,286) (7,044,788)
160,122,805 (11,230,335) 374,623,620 139,394,993
Payments on account of staff retirement benefits (2,027,991) (1,915,878) Income taxes paid (3,681,563) (10,396,331) Net cash flow generated from operating activities 368,914,066 127,082,784
CASH FLOW FROM INVESTING ACTIVITIESNet investments in available for sale securities (400,870,853) (101,929,186) Net investments in held to maturity securities 42,646,734 41,789,700 Net investments in associates (102,635) 103,820 Dividend income received 867,067 1,128,326 Investment in fixed assets and intangible assets (3,056,727) (4,216,578) Sale proceeds from disposal of fixed assets 676,645 539,516 Sale proceeds from disposal of ijarah assets 35,037 32,729 Effect of translation of net investment in
foreign branches and subsidiaries attributable to:- Equity holders of the Bank 2,233,579 5,994,907 - Non-controlling interest 425,820 777,237
Net cash flow used in investing activities (357,145,333) (55,779,529)
CASH FLOW FROM FINANCING ACTIVITIESLease obligation (3,138) 9,095 Receipts of subordinated debt - 1,000,000 Payment of lease liability against right-of-use assets (2,231,752) (2,195,458) Dividends paid to:
- Equity holders of the Bank (8,138,474) (13,448,704) - Non-controlling interest (2,260) (1,540)
Net cash flow used in financing activities (10,375,624) (14,636,607)
Increase in cash and cash equivalents 1,393,109 56,666,648 Cash and cash equivalents at the beginning of the year 286,329,378 229,662,730
Cash and cash equivalents at the end of the year 39 287,722,487 286,329,378
The annexed notes 1 to 52 and annexures I, II and III form an integral part of these consolidated financial statements.
Aameer Karachiwalla Shazad G. Dada Shazia Syed Arshad Ahmad Mir Sir Mohammed Anwar Pervez, OBE, HPkChief Financial Officer President & Director Director Chairman Chief Executive Officer
----------- (Rupees in '000) -----------
177Annual Report 2020
Consolidated Cash Flow StatementFor the year ended December 31, 2020

NOTES TO AND FORMING PART OF THE CONSOLIDATED FINANCIAL STATEMENTS FOR THE YEAR ENDED DECEMBER 31, 2020
1. STATUS AND NATURE OF BUSINESS
The "Group" consists of:
- Holding company
- Subsidiary companies
- United National Bank Limited - 55% holding (2019: 55% holding)
- UBL (Switzerland) AG - 100% holding (2019: 100% holding)
- United Executors and Trustees Company Limited, Pakistan - 100% holding (2019: 100% holding)
- UBL Fund Managers Limited, Pakistan - 98.87% holding (2019: 98.87% holding)
- Al Ameen Financial Services (Private) Limited - effective holding 98.87% (2019: 98.87% holding)
United Bank Limited ("the Bank") is a banking company incorporated in Pakistan and is engaged in commercialbanking and related services. The Bank's registered office and principal office are situated at UBL Building, JinnahAvenue, Blue Area, Islamabad and at UBL Head Office, I. I. Chundrigar Road, Karachi respectively. The Bankoperates 1,356 (2019: 1,362) branches inside Pakistan including 100 (2019: 100) Islamic Banking branches and 2(2019: 2) branches in Export Processing Zones. The Bank also operates 14 (2019: 14) branches outside Pakistan.The Bank is a subsidiary of Bestway (Holdings) Limited and Bestway (Holdings) Limited is a wholly owned subsidiaryof Bestway Group Limited which is incorporated in the United Kingdom.
The Bank's ordinary shares are listed on Pakistan Stock Exchange. Its Global Depository Receipts (GDRs) are on thelist of the UK Listing Authority and the London Stock Exchange Professional Securities Market. These GDRs are alsoeligible for trading on the International Order Book System of the London Stock Exchange. Further, the GDRsconstitute an offering in the United States only to qualified institutional buyers in reliance on Rule 144A under the USSecurities Act of 1933 and an offering outside the United States in reliance on Regulation S.
United National Bank Limited ("UBL UK") is an authorised banking institution incorporated in the United Kingdom.UBL UK was formed in 2001 from the merger of the UK branches of United Bank Limited and National Bank ofPakistan. The principal activities of UBL UK are to provide retail banking services through its branch network inmajor cities of the UK, wholesale banking and treasury services to financial institutions and trade finance facilitiesto businesses of all sizes. UBL UK operates 3 (2019: 3) branches inside United Kingdom. UBL UK operates underthe trade name United Bank UK.
UBL (Switzerland) AG ("USAG") is a commercial bank owned by the Bank. Founded in 1967, its main activities arein credit operations and trade financing. USAG operates 1 (2019: 1) branch in Zurich, Switzerland. USAGpreviously operated under the name, United Bank AG Zurich.
United Executors and Trustees Company Limited ("UET" or the Company) was incorporated in Pakistan in 1965 asan unlisted public limited company. The registered office of the Company is situated at State Life Building No. 1,I.I. Chundrigar Road, Karachi. The shareholders of the Bank in their annual general meeting held on March 27,2020, have resolved to wind up the Company. The Company is inactive, and will have no impact on the overallprofitability of the Group.
UBL Fund Managers Limited ("UBL FM" or the Company) was incorporated as a unlisted public limited company inPakistan on April 3, 2001. The Company is licensed to carry out Asset Management and Investment AdvisoryServices under the Non-Banking Finance Companies (Establishment and Regulation) Rules, 2003 and the Non-Banking Finance Companies and Notified Entities Regulations, 2008. The principal activities of the Company arefloating and managing mutual funds and providing investment advisory services. The registered office of theCompany is situated at STSM Building, Beaumont Road, Civil Lines, Karachi.
UBL Fund Managers has incorporated a wholly owned subsidiary Al Ameen Islamic Financial Services (Private)Limited ("the Company") on February 27, 2015. The principal activity of the subsidiary is provision of shariahcompliant financial services including distribution of shariah compliant mutual funds. The registered office of theCompany is situated at STSM Building, Beaumont Road, Civil Lines, Karachi.
6United Bank Limited178
Notes to and forming part of the Consolidated Financial StatementsFor the year ended December 31, 2020

NOTES TO AND FORMING PART OF THE CONSOLIDATED FINANCIAL STATEMENTS FOR THE YEAR ENDED DECEMBER 31, 2020
- UBL Bank (Tanzania) Limited - 100% holding (2019: 100% holding)
2. BASIS OF PRESENTATION
2.1
2.2
2.3
3. STATEMENT OF COMPLIANCE
3.1
-
-
- Provisions of and directives issued under the Banking Companies Ordinance, 1962 and the Companies Act, 2017; and-
3.2
3.3
3.4
The SECP vide its notification SRO 633 (I)/2014 dated 10 July 2014, adopted IFRS 10 - Consolidated FinancialStatements effective from the periods starting from June 30, 2014. However, vide its notification SRO 56 (I)/2016 datedJanuary 28, 2016, it has been notified that the requirements of IFRS 10 and section 228 of the Companies Act, 2017 willnot be applicable with respect to the investment in mutual funds established under trust structure.
Standards, interpretations and amendments to accounting and reporting standards that are effective in thecurrent year
There are certain amendments to existing accounting and reporting standards that have become applicable to the Groupfor accounting periods beginning on or after January 1, 2020. These are either considered to not be relevant or do nothave any significant impact on these consolidated financial statements.
Islamic Financial Accounting Standards (IFAS) issued by the Institute of Chartered Accountants of Pakistan as arenotified under the Companies Act, 2017;
Whenever the requirements of the Banking Companies Ordinance, 1962, the Companies Act, 2017 or the directivesissued by the SBP and the SECP differ with the requirements of IFRS or IFAS, the requirements of the BankingCompanies Ordinance, 1962, the Companies Act, 2017 and the said directives shall prevail.
The SBP, vide BSD Circular letter No. 10, dated August 26, 2002, has deferred the applicability of International AccountingStandard 39, Financial Instruments: Recognition and Measurement and International Accounting Standard 40, InvestmentProperty for banking companies till further instructions. Moreover, SBP vide BPRD circular no. 4, dated February 25, 2015has deferred the applicability of Islamic Financial Accounting Standards (IFAS) 3, Profit and Loss Sharing on Deposits.Further, according to the notification of the SECP issued vide SRO 411(I)/2008 dated April 28, 2008, IFRS 7, FinancialInstruments: Disclosures has not been made applicable for banks. Accordingly, the requirements of these standards havenot been considered in the preparation of these consolidated financial statements. However, investments have beenclassified and valued in accordance with the requirements of various circulars issued by the SBP.
UBL Bank (Tanzania) Limited ("UBTL") was incorporated on March 13, 2012, and had commenced operations inMay 2013. The Banking operations of the subsidiary ceased on November 1, 2019. Details of the discontinuedoperation and related financial information are disclosed in note 14.
These consolidated financial statements have been prepared in conformity with the format of financial statementsprescribed by the State Bank of Pakistan (SBP) vide BSD Circular No. 02, dated January 25, 2018.
In accordance with the directives of the Federal Government regarding the shifting of the banking system to Islamicmodes, SBP has issued various circulars from time to time. Permissible forms of trade-related modes of financing includespurchase of goods by banks from customers and immediate resale to them at appropriate mark-up in price on deferredpayment basis. The purchase and resale arising under these arrangements are not reflected in these consolidatedfinancial statements as such, but are restricted to the amount of facility actually utilised and the appropriate portion of mark-up thereon. However, the Islamic Banking branches of the Bank have complied with the requirements set out under theIslamic Financial Accounting Standards (IFAS), issued by the Institute of Chartered Accountants of Pakistan (ICAP) as arenotified under the provisions of Companies Act, 2017.
These consolidated financial statements have been prepared in accordance with the accounting and reporting standardsas applicable in Pakistan. The accounting and reporting standards comprise of:
International Financial Reporting Standards (IFRS) issued by the International Accounting Standards Board (IASB) asare notified under the Companies Act, 2017;
Key financial figures of the Islamic banking branches are disclosed in annexure II to these consolidated financialstatements.
Directives issued by the State Bank of Pakistan (SBP) and the Securities and Exchange Commission of Pakistan(SECP).
7179Annual Report 2020
Notes to and forming part of the Consolidated Financial StatementsFor the year ended December 31, 2020

NOTES TO AND FORMING PART OF THE CONSOLIDATED FINANCIAL STATEMENTS FOR THE YEAR ENDED DECEMBER 31, 2020
3.5 Standards, interpretations and amendments to accounting and reporting standards that are not yet effective
4. BASIS OF MEASUREMENT
4.1 Accounting convention
4.2 Critical accounting estimates and judgments
i) classification of investments (notes 5.4 and 9)
ii)
iii) income taxes (notes 5.9 and 37)
iv) staff retirement benefits (notes 5.11 and 41)
v) fair value of derivatives (note 5.16.2)
vi) fixed assets and intangible assets - revaluation, depreciation and amortisation (notes 5.6, 11 and 12)
vii) impairment (note 5.8)
viii) valuation of non-banking assets acquired in satisfaction of claims (note 5.7)
5. SUMMARY OF SIGNIFICANT ACCOUNTING POLICIES
5.1 Basis of consolidation
5.1.1 Subsidiaries
The consolidated financial statements include the financial statements of the Bank and its subsidiary companies.
These consolidated financial statements have been prepared under the historical cost convention except that certain fixedassets / non-banking assets acquired in satisfaction of claims have been stated at revalued amounts, certain investmentsand derivative financial instruments have been stated at fair value and net obligations in respect of defined benefitschemes are carried at their present values.
The preparation of these consolidated financial statements in conformity with accounting and reporting standards asapplicable in Pakistan requires management to make judgments, estimates and assumptions that affect the reportedamounts of assets and liabilities and income and expenses. It also requires management to exercise judgment in theapplication of its accounting policies. The estimates and assumptions are based on historical experience and various otherfactors that are believed to be reasonable under the circumstances. These estimates and assumptions are reviewed on anongoing basis. Revisions to accounting estimates are recognised in the period in which the estimate is revised if therevision affects only that period, or in the period of revision and future periods if the revision affects both current and futureperiods.
Significant accounting estimates and areas where judgments were made by management in the application of accountingpolicies are as follows:
provision against investments (notes 5.4 and 9.3), lendings to financial institutions (note 8) and advances (notes 5.5and 10.4)
The accounting policies adopted in the preparation of these consolidated financial statements are consistent with those ofthe previous financial year.
IFRS 9 has been applicable in several overseas jurisdictions from January 1, 2018. Accordingly, the requirements of thisstandard are incorporated in the Group’s consolidated financial statements for the jurisdictions where IFRS 9 has beenadopted. As per the SBP's BPRD Circular Letter no. 4 dated October 23, 2019, the applicability of IFRS 9 to banks inPakistan has been deferred to accounting periods beginning on or after January 1, 2021. The impact of the application ofIFRS 9 in Pakistan on the Bank's financial statements is being assessed and implementation guidelines are awaited.
There are certain other new amendments that are mandatory for the Group's accounting periods beginning on or afterJanuary 1, 2021, but are considered not to be relevant or will not have any significant effect on the Group's operations andare, therefore, not detailed in these consolidated financial statements.
8United Bank Limited180
Notes to and forming part of the Consolidated Financial StatementsFor the year ended December 31, 2020

NOTES TO AND FORMING PART OF THE CONSOLIDATED FINANCIAL STATEMENTS FOR THE YEAR ENDED DECEMBER 31, 2020
Discontinued operation
5.2 Cash and cash equivalents
5.3 Lendings to / borrowings from financial institutions
5.3.1 Purchase under resale agreements
5.3.2 Sale under repurchase agreements
5.3.3 Bai Muajjal
A discontinued operation is a component of the Bank that has been disposed of or is classified as held for sale and thatrepresents a separate major line of business or geographical area of operations, is part of a single co-ordinated plan todispose of such a line of business or area of operations, or is a subsidiary acquired exclusively with a view to resale. Theresults of discontinued operation is presented separately in the consolidated profit and loss account.
Securities purchased under agreement to resell (reverse repo) are included in lendings to financial institutions. Thedifferential between the purchase price and the resale price is amortised over the period of the agreement and recordedas income.
Subsidiaries are all entities over which the Group has control. The Group controls an entity when the Group is exposed to,or has rights to, variable returns from its involvement with the entity and has the ability to affect those returns through itspower to direct the activities of the entity. Subsidiaries are fully consolidated from the date on which control is transferredto the Group untill the date that control ceases.
Intercompany transactions, balances and unrealised gains on transactions between Group companies are eliminated.Unrealised losses are also eliminated unless the transaction provides evidence of an impairment of the transferred asset.Accounting policies of subsidiaries have been changed where necessary to ensure consistency with the policies adoptedby the Group.
The Group recognises non-controlling interests (NCI) in subsidiaries at the non-controlling interest's proportionate share ofthe net assets. NCI in the equity of subsidiaries are shown separately in the consolidated statement of financial position,consolidated profit and loss account, consolidated statement of comprehensive income and consolidated statement ofchanges in equity.
Cash and cash equivalents for the purpose of the cash flow statement consist of cash and balances with treasury banksand balances with other banks.
The Group enters into transactions of reverse repos, repos and other short term money market lendings to financialinstitutions at contracted rates for a specified period of time. Further, other long term lendings to financial institutions areclassified in advances. These are recorded as under:
The financial statements of subsidiaries are prepared for the same reporting period as the Holding Company, usingaccounting policies that are consistent with those of the Holding Company, except for non-banking subsidiaries in Pakistanwhich follow the requirements of IFRS 9 and IAS 40, and overseas subsidiaries which are required to comply with localregulations enforced within the respective jurisdictions.
Securities held as collateral are not recognised in the consolidated financial statements, unless these are sold to thirdparties, in which case the obligation to return them is recorded at fair value as a trading liability under borrowings fromfinancial institutions.
Securities sold subject to a repurchase agreement (repo) are retained in the consolidated financial statements asinvestments and the counterparty liability is included in borrowings from financial institutions. The differential between thesale price and the repurchase price is amortised over the period of the agreement and recorded as an expense.
Bai Muajjal transactions represent sales of Sukuks on a deferred payment basis and are shown in lendings to financialinstitutions except for transactions undertaken directly with the Government of Pakistan which are disclosed asinvestments. The difference between the deferred payment amount receivable and the carrying value at the time of sale isaccrued and recorded as income over the life of the transaction.
9 181Annual Report 2020
Notes to and forming part of the Consolidated Financial StatementsFor the year ended December 31, 2020

NOTES TO AND FORMING PART OF THE CONSOLIDATED FINANCIAL STATEMENTS FOR THE YEAR ENDED DECEMBER 31, 2020
5.4 Investments
Held for trading
Held to maturity
Available for sale
Initial measurement
Subsequent measurement
Held for trading
Held to maturity
Available for sale
These are measured at subsequent reporting dates at fair value. Gains and losses on re-measurement are included in theprofit and loss account.
These are measured at amortised cost using the effective interest rate method, less any impairment loss recognised toreflect irrecoverable amounts.
Quoted securities classified as available for sale investments are measured at subsequent reporting dates at fair value.Any surplus / deficit arising thereon is kept in a separate account shown in the statement of financial position as part ofequity and is taken to the profit and loss account when realised upon disposal or when the investment is considered to beimpaired.
Unquoted equity securities are valued at the lower of cost and break-up value. The break-up value of these securities iscalculated with reference to the net assets of the investee company as per the latest available audited financialstatements. A decline in the carrying value is charged to the profit and loss account. A subsequent increase in the carryingvalue, upto the cost of the investment, is credited to the profit and loss account. Investments in other unquoted securitiesare valued at cost less impairment, if any.
Provisions for diminution in the value of Term Finance Certificates and Sukuks are made as per the ageing criteriaprescribed by the Prudential Regulations issued by the SBP. Provisions for diminution in the value of other securities aremade for impairment, if any.
These are securities with fixed or determinable payments and fixed maturities, in respect of which the Group has thepositive intent and ability to hold to maturity.
These are investments, other than those in subsidiaries and associates, that do not fall under the held for trading or heldto maturity categories.
All “regular way” purchases and sales of investments are recognised on the trade date, i.e., the date that the Groupcommits to purchase or sell the investment. Regular way purchases or sales are purchases or sales of investments thatrequire delivery of investments within the time frame generally established by regulation or convention in the market place.
Investments of the Group, other than investments in associates, are classified as held for trading, held to maturity andavailable for sale.
These are securities which are either acquired for generating a profit from short-term fluctuations in market prices, interestrate movements and dealer's margin, or are securities included in a portfolio in which a pattern of short term profit takingexists.
Investments are initially recognised at fair value which, in the case of investments other than held for trading, includestransaction costs associated with the investments. Transaction costs on investments held for trading are expensed asincurred.
10United Bank Limited182
Notes to and forming part of the Consolidated Financial StatementsFor the year ended December 31, 2020

NOTES TO AND FORMING PART OF THE CONSOLIDATED FINANCIAL STATEMENTS FOR THE YEAR ENDED DECEMBER 31, 2020
Associates
Goodwill
5.5 Advances
5.5.1 Finance lease receivables
5.5.2 Islamic financings and related assets
Associates are all entities over which the Group has significant influence but not control or joint control. This is generallythe case where the Group holds between 20% and 50% of the voting rights. Investments in associates are accounted forusing the equity method of accounting, after initially being recognised at cost.
Under the equity method of accounting, the investments are initially recognised at cost and adjusted thereafter torecognise the Group’s share of the post-acquisition profits or losses of the investee in profit or loss, and the Group’s shareof movements in other comprehensive income of the investee in other comprehensive income. Dividends received orreceivable from associates and joint ventures are recognised as a reduction in the carrying amount of the investment.
When the Group’s share of losses in an equity-accounted investment equals or exceeds its interest in the entity, includingany other unsecured long-term receivables, the Group does not recognise further losses, unless it has incurred obligationsor made payments on behalf of the other entity.
Unrealised gains on transactions between the Group and its associates and joint ventures are eliminated to the extent ofthe Group’s interest in these entities. Unrealised losses are also eliminated unless the transaction provides evidence of animpairment of the asset transferred.
Advances are written off when there is no realistic prospect of recovery. The amount so written off is a book entry anddoes not necessarily prejudice to the Group's right of recovery against the customer.
The Bank determines write-offs in accordance with the criteria prescribed by the SBP vide BPRD Circular No. 06 datedJune 05, 2007.
Receivables under Murabahah financing represent cost price plus an agreed mark-up on deferred sale arrangement. Mark-up income is recognised on a straight line basis over the period of the instalments.
Ijarah financing represents arrangements whereby the Bank (being the owner of assets) transfers its usufruct to itscustomers for an agreed period at an agreed consideration. Assets leased out under Ijarah are stated at cost lessaccumulated depreciation and accumulated impairment losses, if any. These are depreciated over the term of the lease.Ijarah income is recognised on an accrual basis.
Advances are stated net of specific and general provisions which are charged to the profit and loss account. Specificprovisions against domestic advances and general provision against domestic consumer loans portfolio are determined onthe basis of the Prudential Regulations and other directives issued by the SBP. Specific provision is determined using thetime based criteria and subjective evaluation of the credit worthiness of borrowers. General and specific provisionspertaining to overseas advances are made in accordance with the requirements of the regulatory authorities of therespective countries.
Leases, where the Bank transfers substantially all the risks and rewards incidental to ownership of an asset to the lesseeare classified as finance lease. A receivable is recognised at an amount equal to the present value of the minimum leasepayments including guaranteed residual value, if any. Finance lease receivables are included in advances.
Goodwill is tested annually for impairment, or more frequently if events or changes in circumstances indicate that it mightbe impaired. An impairment loss is recognised for the amount by which the asset’s carrying amount exceeds itsrecoverable amount. The recoverable amount is the higher of an asset’s fair value less costs of disposal and value in use.For the purposes of assessing impairment, assets are grouped at the lowest levels for which there are separatelyidentifiable cash inflows which are largely independent of the cash inflows from other assets or groups of assets (cash-generating units).
11
183Annual Report 2020
Notes to and forming part of the Consolidated Financial StatementsFor the year ended December 31, 2020

NOTES TO AND FORMING PART OF THE CONSOLIDATED FINANCIAL STATEMENTS FOR THE YEAR ENDED DECEMBER 31, 2020
5.6 Fixed assets and depreciation
5.6.1 Tangible assets
5.6.2 Intangible assets
Gains and losses on sale of intangible assets are included in the profit and loss account.
Depreciation is calculated so as to write-off the depreciable amount of the assets over their expected useful lives at therates specified in note 11.2 to these consolidated financial statements. The depreciation charge for the year is calculatedon a straight line basis after taking into account the residual value, if any. The residual values and useful lives arereviewed and adjusted, if appropriate, at each statement of financial position date.
Depreciation on additions is charged from the month the asset is available for use. No depreciation is charged in themonth of disposal.
Land and buildings are revalued by independent, professionally qualified valuers with sufficient regularity to ensure thattheir net carrying amount does not differ materially from their fair value. An increase arising on revaluation is credited tothe surplus on revaluation of fixed assets account. A decrease arising on revaluation of fixed assets is adjusted againstthe surplus of that asset or, if no surplus exists, is charged to the profit and loss account as an impairment of the asset. Asurplus arising subsequently on an impaired asset is reversed through the profit and loss account upto the extent of theoriginal impairment.
Gains and losses on sale of fixed assets are included in the profit and loss account, except that the related surplus onrevaluation of fixed assets (net of deferred tax) is transferred directly to unappropriated profit.
Major renewals and improvements are capitalised and the assets so replaced, if any, are retired. Normal repairs andmaintenance are charged to the profit and loss account as and when incurred.
Intangible assets are stated at cost less accumulated amortisation and accumulated impairment losses, if any. The costand the accumulated amortisation of intangible assets of foreign branches and subsidiaries include exchange differencesarising on currency translation at the year-end rates of exchange. amortisation is calculated so as to write-off theamortizable amount of the assets over their expected useful lives at the rates specified in note 12.1 to these consolidatedfinancial statements. The amortisation charge for the year is calculated on a straight line basis after taking into account theresidual value, if any. The residual values and useful lives are reviewed and adjusted, if appropriate, at each statement offinancial position date. amortisation on additions is charged from the month the asset is available for use. No amortisationis charged in the month of disposal.
Surplus on revaluation of fixed assets (net of associated deferred tax) to the extent of the incremental depreciationcharged on the related assets is transferred to unappropriated profit.
Diminishing Musharakah is partnership agreement between the Bank and its customer for financing vehicle or plant andmachinery. The receivable is recorded to the extent of Bank's share in the purchase of asset. Income is recognised onaccrual basis.
Property and equipment, other than land (which is not depreciated) and capital work-in-progress, are stated at cost orrevalued amount less accumulated depreciation and accumulated impairment losses, if any. Land is carried at revaluedamount less impairment losses while capital work-in-progress is stated at cost less impairment losses. The cost and theaccumulated depreciation of property and equipment of foreign branches and subsidiaries include exchange differencesarising on currency translation at the year-end rates of exchange.
Istisna is a sale contract where the Bank places an order to the manufacturer / builders to produce certain assets and thesale is completed upon the delivery of the assets to the buyer.
Running Musharakah facility is to finance the working capital requirement of the customer whereas partnership is basedon stocks & receivable (manufacturing, stock and proceeds of sales).
12
United Bank Limited184
Notes to and forming part of the Consolidated Financial StatementsFor the year ended December 31, 2020

NOTES TO AND FORMING PART OF THE CONSOLIDATED FINANCIAL STATEMENTS FOR THE YEAR ENDED DECEMBER 31, 2020
5.6.3 Lease liability and Right-of-use asset
5.7 Non-banking assets acquired in satisfaction of claims
Non-banking assets acquired in satisfaction of claims are carried at revalued amounts less accumulated depreciation.These assets are revalued by professionally qualified valuers with sufficient regularity to ensure that their net carryingvalue does not differ materially from their fair value. A surplus arising on revaluation of property is credited to the "surpluson revaluation of non-banking assets" account. A decrease arising on revaluation of non-banking asset is adjusted againstthe surplus of that asset or, if no surplus exists, is charged to the profit and loss account as an impairment of the asset. Asurplus arising subsequently on an impaired asset is reversed through the profit and loss account upto the extent of theoriginal impairment.
The Bank leases various branches, ATMs and warehouses. Rental contracts are typically for a fixed period of 1 year to 50years and may have extension options as described below. At inception of a contract, the Bank assesses whether acontract is, or contains, a lease based on whether the contract conveys the right to control the use of an identified assetfor a period of time in exchange for consideration. Lease terms are negotiated on an individual basis and contain a widerange of different terms and conditions.
In determining the lease term, management considers all facts and circumstances that create an economic incentive toexercise an extension option or not exercise a termination option. Extension options (or periods after termination options)are only included in the lease term if the lease is reasonably certain to extended (or not be terminated).
The lease liability is initially measured at the present value of the lease payments over the period lease term and that arenot paid at the commencement date, discounted using the interest rate implicit in the lease, or if that rate cannot be readilydetermined, the Bank's incremental borrowing rate.
Lease payments include fixed payments less any lease incentive receivable, variable lease payment that are based on anindex or a rate which are initially measured using the index or rate as at the commencement date, amounts expected to bepayable by the Bank under residual value guarantees, the exercise price of a purchase option if the Banks is reasonablycertain to exercise that option and payments of penalties for terminating the lease if the lease term reflects the lesseeexercising that option. The extension and termination options are incorporated in determination of lease term only whenthe Bank is reasonably certain to exercise these options.
The lease liability is subsequently measured at amortised cost using the effective interest rate method. The lease liabilityis also remeasured to reflect any reassessment or lease modification, or to reflect revised in-substance fixed leasepayment.
The lease liability is remeasured when the Bank reassesses the reasonable certainty of exercise of extension ortermination option upon occurrence of either a significant event or a significant change in circumstance, or when there is achange in assessment of an option to purchase underlying asset, or when there is a change in amount expected to bepayable under a residual value guarantee, or when there is a change in future lease payments resulting from a change inan index or rate used to determine those payment. The corresponding adjustment is made to the carrying amount of theright-to-use asset, or is recorded in profit and loss if the carrying amount of right-to-use asset has been reduced to zero.
When there is a change in scope of a lease, or the consideration for a lease, that was not part of the original terms andconditions of the lease is accounted for as a lease modification. The lease modification is accounted for as a separatelease if modification increase the scope of lease by adding the right to use one or more underlying assets and theconsideration for lease increases by an amount that is commensurate with the stand-alone price for the increase in scopeadjusted to reflect the circumstances of the particular contracts, if any. When the lease modification is not accounted foras a separate lease, the lease liability is remeasured and corresponding adjustment is made to right-of-use asset.
The Bank has elected to apply the practical expedient not to recognise right-of-use assets and lease liabilities for shortterm leases that have a lease term of 12 months or less and leases of low-value assets. The lease payments associatedwith these leases is recognised as an expense on a straight line basis over the lease term.
The right-of-use asset is subsequently measured at cost model. The right-of-use asset is depreciated on a straight linemethod over the lease term as this method most closely reflects the expected pattern of consumption of future economicbenefits. The right-of-use asset is reduced by impairment losses, if any, and adjusted for certain remeasurements of thelease liability.
On initial recognition, right-of-use assets are measured at an amount equal to initial lease liability adjusted for any leasepayments made at or before the commencement date, plus any initial direct costs incurred and an estimate of costs to beincurred to dismantle and remove the underlying asset or to restore the underlying asset or the site on which it is located.
13
185Annual Report 2020
Notes to and forming part of the Consolidated Financial StatementsFor the year ended December 31, 2020

NOTES TO AND FORMING PART OF THE CONSOLIDATED FINANCIAL STATEMENTS FOR THE YEAR ENDED DECEMBER 31, 2020
5.8 Impairment
Impairment of available for sale equity investments
Impairment of investments in associates
Impairment of non-financial assets (excluding deferred tax)
5.9 Taxation
5.9.1 Current
5.9.2 Deferred
The current income tax charge is calculated on the basis of the tax laws enacted or substantively enacted at the end of thereporting period in the countries where the Bank and its subsidiaries and associates operate and generate taxable income.Management periodically evaluates positions taken in tax returns with respect to situations in which applicable taxregulation is subject to interpretation. It establishes provisions where appropriate on the basis of amounts expected to bepaid to the tax authorities.
Available for sale equity investments are impaired when there has been a significant or prolonged decline in their fair valuebelow their cost. The determination of what is significant or prolonged requires judgment. In making this judgment, theBank evaluates, among other factors, the normal volatility in share price. A subsequent increase in the fair value of apreviously impaired listed equity security is recorded in the statement of financial position in the surplus / deficit onrevaluation of securities account and only recorded through the profit and loss account when realised on disposal.
The Group considers that a decline in the recoverable value of the investment in an associate below its cost may beevidence of impairment. Recoverable value is calculated as the higher of fair value less costs to sell and value in use. Animpairment loss is recognised when the recoverable value falls below the carrying value and is charged to the profit andloss account. A subsequent reversal of an impairment loss, upto the cost of the investment in the associate, is credited tothe profit and loss account.
The carrying amounts of non-financial assets are reviewed at each reporting date for impairment whenever events orchanges in circumstances indicate that the carrying amounts of these assets may not be recoverable. The recoverableamount of an asset is the higher of its fair value less costs of disposal and its value in use. If such indication exists, andwhere the carrying value exceeds the estimated recoverable amount, assets are written down to their recoverable amount.The resulting impairment loss is charged to the profit and loss account except for an impairment loss on revalued assets,which is adjusted against the related revaluation surplus to the extent that the impairment loss does not exceed therevaluation surplus.
The income tax expense or credit for the period is the tax payable on the current period’s taxable income based on theapplicable income tax rate for each jurisdiction adjusted by changes in deferred tax assets and liabilities attributable totemporary differences and to unused tax losses.
Deferred income tax is provided in full, using the liability method, on temporary differences arising between the tax basesof assets and liabilities and their carrying amounts in the consolidated financial statements. However, deferred taxliabilities are not recognised if they arise from the initial recognition of goodwill. Deferred income tax is also not accountedfor if it arises from initial recognition of an asset or liability in a transaction other than a business combination that at thetime of the transaction affects neither accounting nor taxable profit or loss. Deferred income tax is determined using taxrates (and laws) that have been enacted or substantially enacted by the end of the reporting period and are expected toapply when the related deferred income tax asset is realised or the deferred income tax liability is settled.
Deferred tax assets are recognised only if it is probable that future taxable amounts will be available to utilise thosetemporary differences and losses.
Deferred tax liabilities and assets are not recognised for temporary differences between the carrying amount and taxbases of investments in foreign operations where the Bank is able to control the timing of the reversal of the temporarydifferences and it is probable that the differences will not reverse in the foreseeable future.
14United Bank Limited186
Notes to and forming part of the Consolidated Financial StatementsFor the year ended December 31, 2020

NOTES TO AND FORMING PART OF THE CONSOLIDATED FINANCIAL STATEMENTS FOR THE YEAR ENDED DECEMBER 31, 2020
5.10 Provisions
Provisions are reviewed at each statement of financial position date and are adjusted to reflect the current best estimate.
5.11 Staff retirement and other benefits
5.11.1 The Bank
Staff retirement benefit schemes
The Bank operates the following staff retirement schemes for its employees
a)
- an approved contributory provident fund (defined contribution scheme); and- an approved gratuity scheme (defined benefit scheme).
b) For employees who have not opted for the conversion option introduced in 2001, the Bank operates
- an approved non-contributory provident fund in lieu of the contributory provident fund; and- an approved funded pension scheme, introduced in 1986 (defined benefit scheme).
The Bank also operates benevolent fund for all its eligible employees (defined benefit scheme).
Other benefits
a) Employees' compensated absences
Provision against identified non-funded losses is recognised when intimated and reasonable certainty exists that theGroup will be required to settle the obligation. The provision is charged to the profit and loss account net of expectedrecovery and the obligation is classified under other liabilities.
For new employees and for those who opted for the below mentioned conversion option introduced in 2001, the Bankoperates
In 2001, the Bank modified the pension scheme and introduced a conversion option for employees covered under option(b) above to move to option (a). This conversion option ceased on December 31, 2003.
Annual contributions towards defined benefit schemes are made on the basis of actuarial advice using the Projected UnitCredit Method.
For the defined contribution scheme, the Bank pays contributions to the fund on a periodic basis. The Bank has no furtherpayment obligation once the contributions have been paid. The contributions are recognised as an expense when theobligation to make payments to the fund has been established. Prepaid contributions are recognised as an asset to theextent that a cash refund or a reduction in future payments is available.
The Bank makes provisions for compensated vested and non-vested absences accumulated by its eligible employeeson the basis of actuarial advice under the Projected Unit Credit Method.
Deferred tax assets and liabilities are offset when there is a legally enforceable right to offset current tax assets andliabilities and when the deferred tax balances relate to the same taxation authority. Current tax assets and tax liabilities areoffset where the entity has a legally enforceable right to offset and intends either to settle on a net basis, or to realise theasset and settle the liability simultaneously.
Provisions are recognised when the Group has a present legal or constructive obligation as a result of past events whichmakes it probable that an outflow of resources will be required to settle the obligation and a reliable estimate of theamount can be made.
Current and deferred tax is recognised in consolidated profit and loss account, except to the extent that it relates to itemsrecognised in other comprehensive income or directly in equity. In this case, the tax is also recognised in othercomprehensive income or directly in equity, respectively.
15
187Annual Report 2020
Notes to and forming part of the Consolidated Financial StatementsFor the year ended December 31, 2020

NOTES TO AND FORMING PART OF THE CONSOLIDATED FINANCIAL STATEMENTS FOR THE YEAR ENDED DECEMBER 31, 2020
b) Post-retirement medical benefits (defined benefit scheme)
Remeasurement of defined benefit obligations
5.11.2 United National Bank Limited ("UBL UK")
Defined benefit scheme
Defined contribution scheme
5.11.3 UBL Fund Managers Limited ("UBL FM")
Defined benefit plan
Defined contribution plan
UBL FM operates an approved contributory provident fund (defined contribution scheme) for all eligible employees.
Employee Stock Option Scheme
5.11.4 UBL (Switzerland) AG ("USAG")
The Bank provides post-retirement medical benefits to eligible retired employees. Provision is made on the basis ofactuarial advice under the Projected Unit Credit Method.
Remeasurement gains and losses arising from experience adjustments and changes in actuarial assumptions arerecognised in other comprehensive income when they occur with no subsequent recycling through the profit and lossaccount.
Remeasurement gains and losses pertaining to long term compensated absences are recognised in the profit and lossaccount immediately.
UBL UK operates a pension scheme (defined benefit scheme) for certain staff. This scheme is closed for new membersand the accrual of benefits has ceased from January 1, 2010. Gains and losses on settlements and curtailments arecharged to the profit and loss account. The interest cost and the expected return on assets are included in other liabilitiesand other assets respectively. Remeasurement gains and losses are recognised immediately in other comprehensiveincome.
The defined benefit scheme is funded, with the assets of the scheme held separately from those of UBL UK, in separatetrustee administered funds. Pension scheme assets are measured at fair value and liabilities are measured based onactuarial valuations using the Projected Unit Credit Method. The actuarial valuations are obtained at least triennially andare updated at each statement of financial position date.
UBL UK operates a defined contributory pension scheme. The contribution payable in the year in respect of pension costsand other post-retirement benefits is charged to the profit and loss account. Differences between the contribution payablein the year and contribution actually paid are shown as either accruals or prepayments in the statement of financialposition.
UBL FM operates an approved funded gratuity scheme for all employees. Annual contributions to the fund are made onthe basis of actuarial advice using the Projected Unit Credit Method. Remeasurement gains and losses arising fromexperience adjustments and changes in actuarial assumptions are recognised in other comprehensive income when theyoccur with no subsequent recycling through the profit and loss account.
UBL FM provides an incentive scheme for its top performing employees in the form of share options under the EmployeeStock Option Scheme (ESOS). The scheme has been approved by the SECP.
UBL (Switzerland) AG maintains a contribution-oriented pension scheme for employees who have reached the age of 25.It bears a large share of the costs of the occupational pension plan for all employees as well as their surviving dependentspursuant to legal requirements. The employee benefit obligations and the assets serving as coverage are outsourced to acollective insurance firm. The organization, management and financing of the pension plan comply with legal regulations,the deed of foundation and the applicable regulations of the benefit plan.
16United Bank Limited188
Notes to and forming part of the Consolidated Financial StatementsFor the year ended December 31, 2020

NOTES TO AND FORMING PART OF THE CONSOLIDATED FINANCIAL STATEMENTS FOR THE YEAR ENDED DECEMBER 31, 2020
5.12 Subordinated debt
5.13 Borrowings / deposits
a) Borrowings / deposits are recorded at the amount of proceeds received.b) The cost of borrowings / deposits is recognised on an accrual basis as an expense in the period in which it is incurred.
5.14 Revenue recognition
5.14.1 Advances and investments
Lease financing
5.14.2 Dividend income
Dividend income is recognised when the right to receive the dividend is established.
5.14.3 Fee, brokerage and commission income
Fee, brokerage and commission income is recognised on an accrual basis.
5.14.4 Grants
5.15 Foreign currencies
5.15.1 Functional and presentation currency
Subordinated debt is initially recorded at the amount of proceeds received. Mark-up accrued on subordinated debt isrecognised separately as part of other liabilities and is charged to the profit and loss account over the period on an accrualbasis.
Revenue is recognised to the extent that the economic benefits associated with a transaction will flow to the Group and therevenue can be reliably measured. The following recognition criteria must be met before revenue is recognised.
Mark-up / return / interest on performing advances and investments is recognised on a time proportionate basis over theterm of the advances and investments that takes into account the effective yield of the asset. Where debt securities arepurchased at a premium or discount, such premium / discount is amortised through the profit and loss account over theremaining period of maturity of the debt securities.
Interest or mark-up recoverable on non-performing or classified advances and investments is recognised on a receiptbasis.
Grants received are recorded as income when the right to receive the grant, based on the related expenditure having beenincurred, has been established.
Items included in these consolidated financial statements are measured using the currency of the primary economicenvironment in which the Holding Company operates. These consolidated financial statements are presented in PakistaniRupees, which is the Group's functional and presentation currency.
Income from lease financing is accounted for using the financing method. Under this method, the unearned lease income(defined as the sum of total lease rentals and estimated residual value less the cost of the leased assets) is deferred andtaken to income over the term of the lease so as to produce a constant periodic rate of return on the outstanding netinvestment in the lease. Gains or losses on termination of lease contracts are recognised through the profit and lossaccount when these are realised. Unrealised lease income and other fees on classified leases are recognised on a receiptbasis.
17 189Annual Report 2020
Notes to and forming part of the Consolidated Financial StatementsFor the year ended December 31, 2020

NOTES TO AND FORMING PART OF THE CONSOLIDATED FINANCIAL STATEMENTS FOR THE YEAR ENDED DECEMBER 31, 2020
5.15.2 Foreign currency transactions
5.15.3 Foreign operations and subsidiaries
5.15.4 Translation gains and losses
5.15.5 Contingencies and commitments
Provision for claims under guarantees
5.16 Financial instruments
5.16.1 Financial assets and liabilities
5.16.2 Derivative financial instruments
5.16.3 Off setting
5.17 Segment reporting
Transactions in foreign currencies are translated to rupees at the foreign exchange rates prevailing on the transactiondate. Monetary assets and liabilities in foreign currencies are expressed in rupee terms at the rates of exchange prevailingat the statement of financial position date. Forward foreign exchange contracts and foreign bills purchased are valued inrupees at the forward foreign exchange rates applicable to their respective maturities.
A provision for claims under guarantees is recognised when intimated and reasonable certainty exists that the Bank willsettle the obligation. The charge to the profit and loss account is stated net of expected recoveries and the obligation isrecognised in other liabilities.
A segment is a distinguishable component of the Group that is engaged either in providing particular products or services(business segment), or in providing products or services within a particular economic environment (geographicalsegment), and is subject to risks and rewards that are different from those of other segments.
Derivative financial instruments are initially recognised at fair value on the date on which the derivative contract is enteredinto and are subsequently re-measured at fair value using appropriate valuation techniques. All derivative financialinstruments are carried as assets when their fair value is positive and liabilities when their fair value is negative. Anychange in the fair value of derivative financial instruments during the period is taken to the profit and loss account.
Financial assets and financial liabilities are set-off and the net amount is reported in the consolidated financial statementswhen there is a legally enforceable right to set-off and the Group intends to either settle on a net basis, or to realise theassets and to settle the liabilities simultaneously.
Non-monetary assets and liabilities in foreign currencies are expressed in rupee terms at the rates of exchange prevailingat the date of initial recognition of the non-monetary assets / liabilities.
The assets and liabilities of foreign operations and subsidiaries are translated to rupees at exchange rates prevailing atthe statement of financial position date. The results of foreign operations and subsidiaries are translated at the averagerate of exchange for the year.
Translation gains and losses are taken to the profit and loss account, except those arising on translation of the netinvestment in foreign branches and subsidiaries which are taken to capital reserves (Exchange Translation Reserve) untilthe disposal of the net investment, at which time these are recognised in the profit and loss account.
Commitments for outstanding forward foreign exchange contracts are disclosed in these consolidated financial statementsat contracted rates. Contingent liabilities / commitments denominated in foreign currencies are expressed in rupee termsat the rates of exchange prevailing at the statement of financial position date.
Financial assets and liabilities carried on the statement of financial position include cash and bank balances, lendings tofinancial institutions, investments, advances, certain receivables, bills payable, borrowings from financial institutions,deposits, subordinated loans and certain payables. The particular recognition methods adopted for significant financialassets and financial liabilities are disclosed in the individual policy notes associated with them.
18United Bank Limited190
Notes to and forming part of the Consolidated Financial StatementsFor the year ended December 31, 2020

NOTES TO AND FORMING PART OF THE CONSOLIDATED FINANCIAL STATEMENTS FOR THE YEAR ENDED DECEMBER 31, 2020
5.17.1 Business segments
(a) Corporate / Commercial Banking
(b) Treasury
(c) Branch Banking
(d) Islamic Banking
This represents Islamic Banking branches and Islamic banking windows in the conventional branches of the Bank.
(e) International Branch Operations
Represents Bank's operations in 4 countries including two branches in export processing zones in Karachi and Sialkot.
(f) Subsidiaries
Represents operations by Bank's subsidiaries.
(g) Others
Others includes functions which cannot be classified in any of the above segments.
5.17.2 Geographical segments
The Group operates in following geographical regions:
- Pakistan - Middle East- Export Processing Zones in Karachi and Sialkot- Europe
5.18 Dividends and appropriations to reserves
5.19 Earnings per share
5.20 Acceptances
Includes deposits, lending and banking services to private individuals and small businesses including credit cards andbranchless banking.
Includes project, trade and working capital finance, import and export, factoring, leasing, lending, deposits andguarantees. It also include services provided in connection with mergers and acquisitions and the underwriting /arrangement of debt and equity instruments through syndications, Initial Public Offerings and private placements.
Includes fixed income, equity, foreign exchange, credit, funding, own position securities, lendings and borrowings andderivatives for hedging and market making.
Dividends and appropriations to reserves are recorded in the year in which these are approved, except appropriationsrequired by law which are recorded in the period to which they pertain.
The Group presents basic and diluted earnings per share (EPS). Basic and diluted EPS is calculated by dividing the profitor loss attributable to ordinary shareholders of the holding company by the weighted average number of ordinary sharesoutstanding during the year.
Acceptances comprise undertakings by the Group to pay bill of exchange drawn on customers. Acceptances arerecognised as financial liability in the statement of financial position with a contractual right of reimbursement from thecustomer as a financial asset. Therefore, commitments in respect of acceptances have been accounted for as financialassets and financial liabilities.
19191Annual Report 2020
Notes to and forming part of the Consolidated Financial StatementsFor the year ended December 31, 2020

NOTES TO AND FORMING PART OF THE CONSOLIDATED FINANCIAL STATEMENTS FOR THE YEAR ENDED DECEMBER 31, 2020
Note 2020 2019
6. CASH AND BALANCES WITH TREASURY BANKS
In handLocal currency 20,776,101 12,394,957Foreign currencies 12,160,057 5,155,165
32,936,158 17,550,122With State Bank of Pakistan in
Local currency current accounts 6.1 75,604,954 77,855,915Foreign currency current accounts 6.2 4,420,727 3,431,095Foreign currency deposit account 6.3 7,767,517 10,081,214
87,793,198 91,368,224With other central banks in
Foreign currency current accounts 6.4 36,040,406 36,255,841Foreign currency deposit accounts 6.5 6,869,307 8,694,038
42,909,713 44,949,879With National Bank of Pakistan in local currency current accounts 92,628,531 89,136,038Prize Bonds 1,871,859 366,438
258,139,459 243,370,701
6.1
6.2
6.3
6.4
6.5
Note 2020 2019
7. BALANCES WITH OTHER BANKS
In PakistanIn current accounts - 17 In deposit accounts 7.1 2,015,383 3,458
2,015,383 3,475 Outside Pakistan
In current accounts 19,102,946 20,047,723 In deposit accounts 7.2 8,464,699 22,907,479
27,567,645 42,955,202
29,583,028 42,958,677
------- (Rupees in '000) -------
These represent placements with overseas central banks and carry mark-up at rates ranging from 0.75% to 2.00% (2019:1.50% to 2.00%) per annum.
------- (Rupees in '000) -------
This represents current accounts maintained with the SBP under the Cash Reserve Requirement of section 22 of theBanking Companies Ordinance, 1962.
This represents a US Dollar settlement account maintained with the SBP and current accounts maintained with the SBP tocomply with statutory requirements.
This represents account maintained with the SBP to comply with the Special Cash Reserve requirement. The return onthis account is declared by the SBP on a monthly basis and as at December 31, 2020, it carries mark-up at the rate of0.00% (2019: 0.70%) per annum.
Deposits with other central banks are maintained to meet the minimum cash reserves and capital requirements pertainingto the foreign branches and subsidiaries of the Group.
20
United Bank Limited192
Notes to and forming part of the Consolidated Financial StatementsFor the year ended December 31, 2020

NOTES TO AND FORMING PART OF THE CONSOLIDATED FINANCIAL STATEMENTS FOR THE YEAR ENDED DECEMBER 31, 2020
7.1
7.1.1 Balances pertaining to subsidiaries carry mark-up at rates ranging from 5.00% to 5.50% per annum.
7.2
Note 2020 2019
8. LENDINGS TO FINANCIAL INSTITUTIONS
Call / clean money lending 8.2 10,624,519 - Repurchase agreement lendings (reverse repo) 8.3 - 9,450,000 Bai Muajjal receivable
- with State Bank of Pakistan 8.4 6,433,114 - - with other financial institutions 8.5 3,026,018 10,733,118
Other lendings to financial institutions 8.6 2,128,791 1,509,828 22,212,442 21,692,946
8.1 Particulars of lendings to financial institutions
In local currency 19,959,132 20,183,118 In foreign currencies 2,253,310 1,509,828
22,212,442 21,692,946
8.2
8.3 Securities held as collateral against repurchase agreement lendings (reverse repo)
2019
Held by Group
Further given as
collateral / sold
Total Held by Group
Further given as
collateral / sold
Total
Pakistan Investment Bonds - - - - 9,450,000 9,450,000
8.3.1
8.4
8.5
8.6
This carries mark-up at the rate of 7.15% per annum and is due to mature in January 2021.
These carry mark-up at rates ranging from 0.05% to 3.50% (2019: 1.30% to 3.50%) per annum.
------- (Rupees in '000) -------
2020
--------------------------------------------------- (Rupees in '000) ---------------------------------------------------
This represents Bai Muajjal agreement entered into with a financial institution whereby the Bank has sold sukuk havingcarrying value of Rs. 2,984.569 million (2019: Rs. 10,682.138 million) on deferred payment basis. The average return onthese transactions is 6.85% (2019: 12.45%) per annum.
Lendings pertaining to foreign subsidiaries carry mark-up at rates ranging from 0.03% to 4.92% (2019: 0.60% to 7.04%)per annum and are due to mature latest by December 22, 2021.
The market value of securities held as collateral against repurchase agreement lendings amounted to Rs. nil (2019: Rs.9,459.071 million).
These represents Bai Muajjal agreements entered into with State Bank of Pakistan whereby the Bank has sold sukukshaving carrying value of Rs. 5,927.104 million on deferred payment basis. The average return on these transactions is9.25% per annum.
These represent unsecured lendings carrying mark-up at the rate of 7.15% to 7.30% per annum and are due to mature byFebruary 2021.
21
193Annual Report 2020
Notes to and forming part of the Consolidated Financial StatementsFor the year ended December 31, 2020

NOTES TO AND FORMING PART OF THE CONSOLIDATED FINANCIAL STATEMENTS FOR THE YEAR ENDED DECEMBER 31, 2020
9. INVESTMENTS
9.1 Investments by type
Held for trading securitiesMarket Treasury Bills 3,009,238 - 228 3,009,466 71,095,652 - (7,121) 71,088,531Pakistan Investment Bonds - fixed - - - - 47,107 - (265) 46,842
3,009,238 - 228 3,009,466 71,142,759 - (7,386) 71,135,373Available for sale securitiesMarket Treasury Bills 341,885,979 - 238,363 342,124,342 182,898,327 - 149,496 183,047,823Pakistan Investment Bonds - fixed 76,334,054 - 333,950 76,668,004 107,776,079 - (8,446,273) 99,329,806Pakistan Investment Bonds - floaters 340,678,646 - (2,569,332) 338,109,314 96,937,574 - 1,772,076 98,709,650Government of Pakistan Eurobonds 25,519,619 (105,010) 1,226,132 26,640,741 19,657,993 (271,160) 1,291,623 20,678,456Government of Pakistan Sukuk 24,873,538 (8,713) (48,193) 24,816,632 9,056,189 (32,577) 23,973 9,047,585Governement of Pakistan Modaraba Pool 9.4 466,435 - - 466,435 - - - - Corporate Sukuks 1,220,000 - - 1,220,000 1,220,000 - - 1,220,000Ordinary shares of listed companies 13,345,156 (5,479,476) 2,517,580 10,383,260 15,583,327 (5,372,566) 3,199,996 13,410,757Preference shares 36,667 - - 36,667 101,365 (64,698) - 36,667Ordinary shares of unlisted companies 808,294 (134,392) 36 673,938 754,150 (130,029) - 624,121Investment in REIT 458,590 - (16,676) 441,914 458,590 - 62,118 520,708Investment in Mutual Fund 250,000 - (21,482) 228,518 250,000 - 2,931 252,931Term Finance Certificates 662,335 (162,033) - 500,302 791,519 (161,998) - 629,521Foreign bonds - sovereign 81,369,066 (1,401,942) 1,742,758 81,709,882 62,394,975 (582,836) 2,370,837 64,182,976Foreign bonds - others 7,256,300 (24,002) 271,352 7,503,650 16,580,570 (39,741) (241,305) 16,299,524
915,164,679 (7,315,568) 3,674,488 911,523,599 514,460,658 (6,655,605) 185,472 507,990,525Held to maturity securitiesMarket Treasury Bills 2,696,727 - - 2,696,727 3,458,029 - - 3,458,029Pakistan Investment Bonds - fixed 160,738,122 - - 160,738,122 206,994,945 - - 206,994,945Government of Pakistan Eurobonds 10,706,182 (45,483) - 10,660,699 10,448,042 (147,920) - 10,300,122Government of Pakistan Sukuk 1,296,245 (3,374) - 1,292,871 1,252,731 (12,536) - 1,240,195Bai Muajjal with Government of Pakistan 9.5 29,569,648 - - 29,569,648 26,443,679 - - 26,443,679Term Finance Certificates 4,516,483 (69,951) - 4,446,532 5,355,210 (69,950) - 5,285,260Corporate Sukuks 12,022,820 (57,846) - 11,964,974 13,725,143 (87,870) - 13,637,273Participation Term Certificates 437 (437) - - 437 (437) - - Debentures 2,266 (2,266) - - 2,266 (2,266) - - Foreign bonds - sovereign 25,058,739 (646,731) - 24,412,008 21,379,268 (332,446) - 21,046,822Foreign bonds - others 1,261,784 (23,219) - 1,238,565 1,321,635 (61,085) - 1,260,550Recovery note - - - - 59,157 (59,141) - 16CDC SAARC Fund 347 - - 347 336 - - 336
247,869,800 (849,307) - 247,020,493 290,440,878 (773,651) - 289,667,227AssociatesUBL Liquidity Plus Fund 9.9 1,837,605 - - 1,837,605 1,460,128 - - 1,460,128UBL Stock Advantage Fund 9.9 107,282 - - 107,282 180,936 - - 180,936UBL Financial Sector Fund 9.9 225,640 - - 225,640 359,485 - - 359,485UBL Cash Fund 9.9 - - - - 106,456 - - 106,456UBL Exchange Traded Fund 9.9 21,374 - - 21,374 - - - - UBL Special Savings Fund II 9.9 101,850 - - 101,850 - - - - Al Ameen Islamic Energy Fund 9.9 92,471 - - 92,471 101,395 - - 101,395UBL Insurers Limited 9.9 499,948 - - 499,948 499,786 - - 499,786Khushhali Bank Limited 9.9 3,363,784 - - 3,363,784 2,934,591 - - 2,934,591DHA Cogen Limited 9.9.1.5 - - - - - - - -
6,249,954 - - 6,249,954 5,642,777 - - 5,642,777
Total Investments 1,172,293,671 (8,164,875) 3,674,716 1,167,803,512 881,687,072 (7,429,256) 178,086 874,435,902
Carrying Value
-------------------------------------------------------------------------- (Rupees in '000) --------------------------------------------------------------------------
2020 2019
NoteCost /
Amortised cost
Provision for
diminution
Surplus / (Deficit)
Carrying Value
Cost / Amortised
cost
Provision for
diminution
Surplus / (Deficit)
22United Bank Limited194
Notes to and forming part of the Consolidated Financial StatementsFor the year ended December 31, 2020

NOTES TO AND FORMING PART OF THE CONSOLIDATED FINANCIAL STATEMENTS FOR THE YEAR ENDED DECEMBER 31, 2020
9.2 Investments by segment
Federal Government Securities
Market Treasury Bills 344,895,217 - 238,591 345,133,808 253,993,979 - 142,375 254,136,354
Pakistan Investment Bonds - fixed 237,072,176 - 333,950 237,406,126 314,818,131 - (8,446,538) 306,371,593
Pakistan Investment Bonds - floaters 340,678,646 - (2,569,332) 338,109,314 96,937,574 - 1,772,076 98,709,650
Government of Pakistan Eurobonds 36,225,801 (150,493) 1,226,132 37,301,440 30,106,035 (419,080) 1,291,623 30,978,578
Government of Pakistan Sukuk 26,169,783 (12,087) (48,193) 26,109,503 10,308,920 (45,113) 23,973 10,287,780
Bai Muajjal with Government of Pakistan 29,569,648 - - 29,569,648 26,443,679 - - 26,443,679
Governement of Pakistan Modaraba Pool 466,435 - - 466,435 - - - -
1,015,077,706 (162,580) (818,852) 1,014,096,274 732,608,318 (464,193) (5,216,491) 726,927,634
Ordinary shares
Listed companies 13,345,156 (5,479,476) 2,517,580 10,383,260 15,583,327 (5,372,566) 3,199,996 13,410,757
Unlisted companies 808,294 (134,392) 36 673,938 754,150 (130,029) - 624,121
14,153,450 (5,613,868) 2,517,616 11,057,198 16,337,477 (5,502,595) 3,199,996 14,034,878
Preference shares 36,667 - - 36,667 101,365 (64,698) - 36,667
Investment in REIT 458,590 - (16,676) 441,914 458,590 - 62,118 520,708
Investment in Mutual Fund 250,000 - (21,482) 228,518 250,000 - 2,931 252,931
Non Government Debt Securities
Listed companies 1,830,662 (162,035) - 1,668,627 2,702,381 (223,114) - 2,479,267
Unlisted companies 16,593,679 (130,498) - 16,463,181 18,392,194 (99,407) - 18,292,787
18,424,341 (292,533) - 18,131,808 21,094,575 (322,521) - 20,772,054
Foreign Securities
Market Treasury Bills 2,696,727 - - 2,696,727 3,458,029 - - 3,458,029
Sovereign bonds 106,427,805 (2,048,673) 1,742,758 106,121,890 83,774,243 (915,282) 2,370,837 85,229,798
Recovery note - - - - 59,157 (59,141) - 16
CDC SAARC Fund 347 - - 347 336 - - 336
Other bonds 8,518,084 (47,221) 271,352 8,742,215 17,902,205 (100,826) (241,305) 17,560,074
117,642,963 (2,095,894) 2,014,110 117,561,179 105,193,970 (1,075,249) 2,129,532 106,248,253
Associates
UBL Liquidity Plus Fund 1,837,605 - - 1,837,605 1,460,128 - - 1,460,128
UBL Stock Advantage Fund 107,282 - - 107,282 180,936 - - 180,936
UBL Financial Sector Fund 225,640 - - 225,640 359,485 - - 359,485
UBL Cash Fund - - - - 106,456 - - 106,456
UBL Exchange Traded Fund 21,374 - - 21,374 - - - -
UBL Special Savings Fund II 101,850 - - 101,850 - - - -
Al Ameen Islamic Energy Fund 92,471 - - 92,471 101,395 - - 101,395
UBL Insurers Limited 499,948 - - 499,948 499,786 - - 499,786
Khushhali Bank Limited 3,363,784 - - 3,363,784 2,934,591 - - 2,934,591
DHA Cogen Limited - - - - - - - -
6,249,954 - - 6,249,954 5,642,777 - - 5,642,777
Total Investments 1,172,293,671 (8,164,875) 3,674,716 1,167,803,512 881,687,072 (7,429,256) 178,086 874,435,902
------------------------------------------------------------------------- (Rupees in '000) ------------------------------------------------------------------------
2020 2019
Cost / Amortised
cost
Provision for
diminution
Surplus / (Deficit)
Carrying Value
Cost / Amortised
cost
Provision for
diminution
Surplus / (Deficit)
Carrying Value
23195Annual Report 2020
Notes to and forming part of the Consolidated Financial StatementsFor the year ended December 31, 2020

NOTES TO AND FORMING PART OF THE CONSOLIDATED FINANCIAL STATEMENTS FOR THE YEAR ENDED DECEMBER 31, 2020
Note 2020 20199.2.1 Investments given as collateral - at market value
Market Treasury Bills 59,846,168 67,189,682Pakistan Investment Bonds - 13,499,874
59,846,168 80,689,556
9.3 Provision for diminution in value of investments
9.3.1 Opening balance 7,429,256 5,725,128Exchange adjustments 58,788 241,868
Charge / (reversals)Charge for the year 1,389,189 4,014,497Reversals for the year (562,394) (1,621,810)
36 826,795 2,392,687Amounts written off (149,964) (930,427)Closing balance 9.8 8,164,875 7,429,256
9.3.1.1
9.3.2 Particulars of provision against debt securities
Category of classification 2019Non
Performing Investment
(NPI)
Provision
Non Performing Investment
(NPI)
Provision
DomesticLoss 292,496 292,496 714,023 322,520
Overseas Not past due but impaired 2,004,405 510,210 - - Overdue by:
˃ 365 days - - 78,784 78,784
Total 2,296,901 802,706 792,807 401,304
9.4
2020 20199.5 Bai Muajjal Government of Pakistan
Bai Muajjal Investment 33,031,000 33,031,000Less: Deferred Income (3,461,352) (6,587,321)Bai Muajjal Investment - net 29,569,648 26,443,679
9.6
9.7
9.8 Provision against investments includes expected credit loss (ECL) under IFRS 9 amounting to Rs. 1,748.301 million (2019:Rs: 1,460.657 million).
------- (Rupees in '000) -------
2020
--------------------------- (Rupees in '000) ---------------------------
------- (Rupees in '000) -------
Investments include securities which are held by the Bank to comply with the statutory liquidity requirements as set outunder Section 29 of the Banking Companies Ordinance, 1962.
Investments include Rs. 118 million (2019: Rs. 118 million) held by the State Bank of Pakistan as pledge against demandloan, TT / DD discounting facilities and foreign exchange exposure limit sanctioned to the Bank and Rs. 5 million (2019: Rs.5 million) held by the Controller of Military Accounts (CMA) under Regimental Fund Arrangements.
In accordance with SBP Circular no. 07 of 2020 dated October 22, 2020, the Government of Pakistan has established awholly owned special purpose vehicle in the name of "Islamic NPC Company Limited" (INPCCL). According to the Circular,INPCCL has formed two Mudarabah pools for issurance of "Islamic Naya Pakistan Certificates" (INPCs) in Pakistani Rupeeand US Dollar currencies denomination. This represents the outstanding amount of investment of the Bank in MudarabahPools amounting to Rs. 342.284 million and USD 0.777 million (equivalent to Rs. 124.151 million) as at December 31,2020, respectively.
The Bank has availed the relaxation given by the SBP in respect of determining the impairment charge against AFSsecurities and has accordingly recognised the impairment charge in a phased manner equally on a quarterly basis duringthe year ended December 31, 2020.
24United Bank Limited196
Notes to and forming part of the Consolidated Financial StatementsFor the year ended December 31, 2020

NOTES TO AND FORMING PART OF THE CONSOLIDATED FINANCIAL STATEMENTS FOR THE YEAR ENDED DECEMBER 31, 2020
9.9 Investment in associates
9.9.1 Movement of Investment in associates
Note
UBL Liquidity Plus Fund 9.9.1.1 Pakistan 7.62% 1,460,128 371,817 73,700 (68,040) - 1,837,605UBL Financial Sector Fund 9.9.1.1 Pakistan 20.43% 359,485 (88,847) (44,998) - - 225,640UBL Stock Advantage Fund 9.9.1.1 Pakistan 1.44% 180,936 (82,579) 8,925 - - 107,282UBL Special Savings Fund II 9.9.1.1 Pakistan 70.28% - 99,039 8,928 (6,416) 299 101,850UBL Exchange Traded Fund 9.9.1.1 Pakistan 45.44% - 18,672 (19) (13) 2,734 21,374UBL Cash Fund 9.9.1.1 Pakistan - 106,456 (103,786) (2,670) - - - United Growth and Income Fund 9.9.1.1 Pakistan - - (35,374) 35,374 - - - UBL Income Opportunity Fund 9.9.1.1 Pakistan - - (3,325) 3,325 - - - UBL Government Securities Fund 9.9.1.1 Pakistan - - (130) 2,890 (2,760) - - UBL Money Market Fund 9.9.1.1 Pakistan - - (9) 9 - - - Al Ameen Islamic Energy Fund 9.9.1.2 Pakistan 37.52% 101,395 1,908 (10,832) - - 92,471Al Ameen Shariah Stock Fund 9.9.1.2 Pakistan - - (6,696) 6,696 - - - Al Ameen Islamic Cash Plan 9.9.1.2 Pakistan - - - 824 (824) - - Al Ameen Islamic Cash Fund 9.9.1.2 Pakistan - - (167) 168 (1) - - Al Ameen Islamic Financial Planning Fund II 9.9.1.2 Pakistan - - (96) 96 - - - Al Ameen Islamic Sovereign Fund 9.9.1.2 Pakistan 0.00% - - - - - - UBL Insurers Limited 9.9.1.3 Pakistan 30.00% 499,786 - 18,634 (18,472) - 499,948Khushhali Bank Limited 9.9.1.4 Pakistan 29.69% 2,934,591 - 403,492 - 25,701 3,363,784
5,642,777 170,427 504,542 (96,526) 28,734 6,249,954
UBL Liquidity Plus Fund 9.9.1.1 Pakistan 14.85% 11,700 1,429,963 23,154 (4,689) - 1,460,128UBL Financial Sector Fund 9.9.1.1 Pakistan 36.56% 119,529 195,858 44,098 - - 359,485UBL Stock Advantage Fund 9.9.1.1 Pakistan 2.87% 207,469 (87,910) 61,377 - - 180,936UBL Special Savings Fund II 9.9.1.1 Pakistan - - - - - - - UBL Exchange Traded Fund 9.9.1.1 Pakistan - - - - - - - UBL Cash Fund 9.9.1.1 Pakistan 33.43% - 100,360 6,519 (423) - 106,456United Growth and Income Fund 9.9.1.1 Pakistan - - (36,516) 69,841 (33,325) - - UBL Income Opportunity Fund 9.9.1.1 Pakistan - 1,542,968 (1,517,949) 1,408 (26,427) - - UBL Government Securities Fund 9.9.1.1 Pakistan - - - - - - - UBL Money Market Fund 9.9.1.1 Pakistan - 32,069 (39,848) 7,779 - - - Al Ameen Islamic Energy Fund 9.9.1.2 Pakistan 49.84% - 100,000 1,395 - - 101,395Al Ameen Shariah Stock Fund 9.9.1.2 Pakistan - - - - - - - Al Ameen Islamic Cash Plan 9.9.1.2 Pakistan - - - - - - - Al Ameen Islamic Cash Fund 9.9.1.2 Pakistan - - - - - - - Al Ameen Islamic Financial Planning Fund II 9.9.1.2 Pakistan - - - - - - - Al Ameen Islamic Sovereign Fund 9.9.1.2 Pakistan - - (32) 32 - - - UBL Insurers Limited 9.9.1.3 Pakistan 30.00% 414,884 - 100,477 (15,575) - 499,786Khushhali Bank Limited 9.9.1.4 Pakistan 29.69% 2,572,719 - 437,887 (75,944) (71) 2,934,591Oman United Exchange Company, Muscat Oman 25.00% 68,406 (91,292) 22,886 - - -
4,969,744 52,634 776,853 (156,383) (71) 5,642,777
Dividend received
Share of unrealised
(loss) / surplus on assets
2020
2019
------------------------------------------------------ (Rupees in '000) ------------------------------------------------------
------------------------------------------------------ (Rupees in '000) ------------------------------------------------------
Country of incorporation
Country of incorporation
Investment at the end of
the year
Percentage Holding
Investment at the
beginning of the year
Investment / (Redemption)
during the year
Share of profit / (loss)
Dividend received
Share of unrealised
(loss) / surplus on assets
Investment at the end of
the year
Percentage Holding
Investment at the
beginning of the year
Investment / (Redemption)
during the year
Share of profit / (loss)
25
197Annual Report 2020
Notes to and forming part of the Consolidated Financial StatementsFor the year ended December 31, 2020

NOTES TO AND FORMING PART OF THE CONSOLIDATED FINANCIAL STATEMENTS FOR THE YEAR ENDED DECEMBER 31, 2020
9.9.1.1
9.9.1.2
9.9.1.3 UBL Insurers Limited is an unquoted public company, whose principal objective is to conduct general insurance business.
9.9.1.4
2020 2019
Net Assets 10,873,051 9,427,675
Percentage holding 29.69% 29.69%
Group share of Net Assets 3,228,661 2,799,468Goodwill 135,123 135,123Carrying amount of interest in associates 3,363,784 2,934,591
9.9.1.5
9.9.2 Summary of financial position and performance
Assets Liabilities Revenue Profit / (loss) Assets Liabilities Revenue Profit / (loss)
UBL Liquidity Plus Fund 24,280,390 168,904 1,304,366 1,151,974 10,700,149 864,510 1,162,483 1,029,282UBL Financial Sector Fund 1,178,034 73,543 (46,647) (84,869) 994,621 11,275 142,311 51,990UBL Stock Advantage Fund 7,648,838 202,397 952,937 645,495 6,457,825 163,765 1,136,731 610,693UBL Special Savings Fund II 148,421 3,501 12,395 9,608 - - - - UBL Exchange Traded Fund 47,727 686 2,014 889 - - - - UBL Cash Fund - - - - 319,423 990 12,118 11,768UBL Income Opportunity Fund - - - - 667,517 15,860 101,192 83,002UBL Money Market Fund - - - - 4,653,720 372,498 400,015 351,207Al Ameen Islamic Energy Fund 260,507 14,040 3,026 (9,347) 224,866 21,426 1,044 327UBL Insurers Limited 5,876,518 4,205,955 1,841,543 65,865 5,754,807 4,088,854 1,769,967 307,875Khushhali Bank Limited 107,288,360 96,415,309 1,193,189 383,353 81,714,191 72,286,516 1,027,104 202,318DHA Cogen Limited - - - - 4,503,235 18,010,428 - -
--------------------------------------------- (Rupees in '000) ---------------------------------------------
2020 2019
The Group held 20.99% of the issued and paid up capital of DHA Cogen Limited without any consideration paid. DHACogen Limited has been sold during the year 2020 for a consideration of Rs. 152.755 million.
These represent open ended mutual funds managed by UBL Fund Managers Limited. These funds are listed on thePakistan Stock Exchange and offer units for public subscription on a continuous basis.
These represent open ended shariah compliant mutual funds managed by UBL Fund Managers Limited. These funds arelisted on the Pakistan Stock Exchange and offer units for public subscription on a continuous basis.
This represents the Bank's subscription towards the paid-up capital of Khushhali Bank Limited. Pursuant to section 10 ofthe Khushhali Bank Ordinance, 2000 strategic investors including the Bank cannot sell or transfer their investment before aperiod of five years that has expired on October 10, 2005. Thereafter, such sale / transfer would be subject to the priorapproval of the SBP. However these shares are still appearing as frozen as no approval has been obtained by the Bank tounfreeze these shares.
------- (Rupees in '000) ------
Khushhali Bank Limited is a microfinance bank. The principal objective of the bank is to provide microfinance services andpromote social welfare through community building and social mobilisation.
26United Bank Limited198
Notes to and forming part of the Consolidated Financial StatementsFor the year ended December 31, 2020

NOTES TO AND FORMING PART OF THE CONSOLIDATED FINANCIAL STATEMENTS FOR THE YEAR ENDED DECEMBER 31, 2020
9.10 Quality of Available for Sale Securities
Details regarding quality of Available for Sale (AFS) securities are as follows
9.10.1 Domestic Securities 2020 2019
9.10.1.1 Federal Government Securities - Government guaranteed ---- (Rupees in '000) -----
Market Treasury Bills 341,885,979 182,898,327Pakistan Investment Bonds - fixed 76,334,054 107,776,079Pakistan Investment Bonds - floaters 340,678,646 96,937,574Eurobonds 25,519,619 19,657,993Sukuks 24,873,538 9,056,189Modarba Pool 466,435 -
809,758,271 416,326,1629.10.1.2 Shares
Listed CompaniesCement 592,327 1,083,609Chemical 875,779 954,589Commercial Banks 337,311 337,311Fertilizer 5,104,212 5,282,498Oil and Gas Exploration Companies 603,266 594,497Oil and Gas Marketing Companies 579,373 666,558Power Generation and Distribution 4,665,889 5,697,831Technology and Communication 42,995 41,654Textile Composite 543,544 543,544Financial - 36Textile Others 460 353,314
13,345,156 15,555,441
Unlisted Companies Cost Breakup value Cost Breakup
value----------------------- (Rupees in '000) -------------------
SME Bank Limited 26,950 - 26,950 - First Women Bank 21,100 69,511 21,100 69,511N.I.F.T 1,527 51,998 1,526 51,641NIT (Equity) 100 830,783 100 832,941PASSCO 5,500 2,725,903 5,500 1,622,928Swift (Belgium) 2,905 19,417 2,905 15,722VIS Credit Information Services 325 64 325 45Mastercard International 0.003 431 0.003 374Kay Textile Mills Limited 3,778 - 3,778 - World Bridge Connect Incorporation 77,606 - 77,606 - Techlogix International Limited 50,703 24,941 50,703 29,537Cinepax Limited 60,122 175,313 60,122 197,405Pakistan Mortgage Refinance Co. Limited 500,000 630,862 500,000 507,4601 Link (Private) Limited 54,287 202,032 - - Tri Star Shipping Company - - 250 -
804,902 4,731,255 750,865 3,327,564
2020 2019
9.10.1.3 Others
Investment in REIT 458,590 458,590
Preference shares 36,667 36,667
Mutual Fund 250,000 250,000
Cost
2020 2019
Cost------- (Rupees in '000) -------
27199Annual Report 2020
Notes to and forming part of the Consolidated Financial StatementsFor the year ended December 31, 2020

NOTES TO AND FORMING PART OF THE CONSOLIDATED FINANCIAL STATEMENTS FOR THE YEAR ENDED DECEMBER 31, 2020
2020 2019
9.10.1.4 Non-Government Debt Securities
Listed- AA+, AA, AA- 250,000 370,685 - A+, A, A- 250,000 250,000 - Unrated 162,335 162,336
662,335 783,021 Unlisted
- AAA - 420,000- AA+, AA, AA- 420,000 800,000- A+, A, A- 800,000 - - Unrated - 8,498
1,220,000 1,228,498
9.10.2 Foreign SecuritiesCost Rating Cost Rating
9.10.2.1 Government Securities ----------------------- (Rupees in '000) -------------------
- Qatar 8,294,761 AA- 4,115,224 AA-- United Arab Emirates 12,550,990 AA 6,851,601 AA- Srilanka 6,334,446 CCC+ 7,558,608 B- Jordan 3,672,314 B+ 3,562,863 BB-- Bahrain 6,539,325 B 6,263,102 BB-- Egypt 4,847,877 B 4,320,033 B- Kenya 1,190,908 B 1,160,041 B- Nigeria 1,563,239 B 1,520,018 B+- Oman 5,342,200 BB- 6,254,963 BB+- Turkey 4,230,991 B 4,133,659 BB-- South Africa 798,948 BB - -- Tanzania - - 289,052 B+- United Kingdom 6,587,323 AA 2,272,997 AA- United States of America 3,436,991 AAA 3,825,355 AAA- Republic of Zambia 1,061,525 CCC 1,024,056 CCC- Supranational entities (Banks) 14,917,228 AAA 9,243,403 AAA
81,369,066 62,394,975
2020 20199.10.2.2 Non-Government Debt Securities
Listed- AA+, AA, AA- 288,705 674,429- BBB+, BBB, BBB- 734,470 4,272,729- BB+, BB, BB- 403,386 1,320,410- B+, B, B- 2,984,178 6,725,303- CCC+, CCC, CCC- 484,589 825,277- Unrated 2,360,972 2,762,422
7,256,300 16,580,5709.10.2.3 Equity Securities
ListedDP world - Bahrain - 27,886
UnlistedThe Benefit Company B.S.C 3,392 3,285
9.10.2.4 Preference Shares - 64,698
2020 2019
Cost------- (Rupees in '000) -------
Cost---- (Rupees in '000) -----
28United Bank Limited200
Notes to and forming part of the Consolidated Financial StatementsFor the year ended December 31, 2020

NOTES TO AND FORMING PART OF THE CONSOLIDATED FINANCIAL STATEMENTS FOR THE YEAR ENDED DECEMBER 31, 2020
2020 20199.11 Particulars relating to Held to Maturity securities are as follows:
9.11.1 Domestic Securities
9.11.1.1 Federal Government Securities - Government guaranteed
Pakistan Investment Bonds - fixed 160,738,122 206,994,945Sukuks 1,296,245 1,252,731Bai Muajjal 29,569,648 26,443,679Eurobonds 10,706,182 10,448,042
202,310,197 245,139,397
9.11.1.2 Non-Government Debt Securities
Listed- AA+, AA, AA- 1,168,328 1,910,863
Unlisted- AAA 7,778,230 8,740,830- AA+, AA, AA- 1,419,237 1,706,407- A+, A, A- 685,713 821,427- Unrated 5,490,498 5,903,529
15,373,678 17,172,193
9.11.1.3 Others
CDC SAARC Fund 347 336
9.11.2 Foreign SecuritiesCost Rating Cost Rating
9.11.2.1 Government Securities ----------------------- (Rupees in '000) -------------------
- Qatar 3,434,345 AA- 1,821,876 AA-- Jordan 2,768,623 B+ 2,685,927 B-- Bahrain 3,529,236 B 2,354,816 BB-- Egypt 3,597,705 B 3,469,278 B- Kenya 1,850,460 B 1,802,397 B- Oman 2,857,738 BB- 2,755,189 BB+- Portugal 711,520 BBB- 691,396 BBB- Sri Lanka 3,329,240 CCC+ 3,610,330 B- Tanzania - - 69,157 B+- Turkey 2,180,924 B 2,118,902 BB-- South Africa 798,948 BB - -- Yemen 2,696,727 Unrated 3,458,029 Unrated
27,755,466 24,837,297
2020 2019
Cost---- (Rupees in '000) -----
29
201Annual Report 2020
Notes to and forming part of the Consolidated Financial StatementsFor the year ended December 31, 2020

NOTES TO AND FORMING PART OF THE CONSOLIDATED FINANCIAL STATEMENTS FOR THE YEAR ENDED DECEMBER 31, 2020
9.11.2.2 Non Government Debt Securities 2020 2019
---- (Rupees in '000) -----Listed
- BBB+, BBB, BBB- 63,934 61,939 - BB+, BB, BB- 473,922 460,440 - B+, B, B- 636,019 616,934 - Unrated 87,909 162,679
1,261,784 1,301,992
Unlisted- Unrated - 19,643
9.11.2.3 OtherRecovery Note - 59,157
9.11.3
10. ADVANCES Note
2020 2019 2020 2019 2020 2019
Loans, cash credits, running finances, etc. 10.2 549,179,452 629,171,538 82,324,861 74,520,520 631,504,313 703,692,058Islamic financings and related assets 10.7 20,542,257 9,027,259 107,478 94,043 20,649,735 9,121,302Bills discounted and purchased 36,223,975 46,023,954 2,824,527 3,218,030 39,048,502 49,241,984Advances - gross 605,945,684 684,222,751 85,256,866 77,832,593 691,202,550 762,055,344Provision against advances 10.4
- Specific - - (72,036,997) (63,887,915) (72,036,997) (63,887,915)- General (7,313,877) (3,618,520) - - (7,313,877) (3,618,520)
(7,313,877) (3,618,520) (72,036,997) (63,887,915) (79,350,874) (67,506,435)Advances - net of provision 598,631,807 680,604,231 13,219,869 13,944,678 611,851,676 694,548,909
2020 201910.1 Particulars of advances - gross
10.1.1 In local currency 453,024,198 516,928,932In foreign currencies 238,178,352 245,126,412
691,202,550 762,055,344
10.2 Includes net investment in finance lease as disclosed below:
Minimum lease payments - 121,993 - 121,993 - 166,967 - 166,967Financial charges for
future periods - (22,484) - (22,484) - (58,339) - (58,339)Present value of minimum
lease payments - 99,509 - 99,509 - 108,628 - 108,628
---------------------------------------------------------- (Rupees in '000) ----------------------------------------------------------
Performing Non-performing Total
Cost
The market value of securities classified as held-to-maturity as at December 31, 2020, amounted to Rs. 252,280.321million (2019: Rs. 286,750.415 million).
---- (Rupees in '000) -----
----------------------------------------------------------------------------------- (Rupees in '000) ----------------------------------------------------------------------------------
2020 2019
Not later than one
year
Later than one and upto
five years
More than five years Total Not later than
one year
Later than one and upto
five years
More than five years Total
30
United Bank Limited202
Notes to and forming part of the Consolidated Financial StatementsFor the year ended December 31, 2020

NOTES TO AND FORMING PART OF THE CONSOLIDATED FINANCIAL STATEMENTS FOR THE YEAR ENDED DECEMBER 31, 2020
10.3
Category of Classification
DomesticOther Assets Especially Mentioned* 189,538 497 322,139 8,561 Substandard 2,690,171 662,589 764,745 188,848 Doubtful 1,599,695 798,209 325,325 169,274 Loss 24,259,582 23,164,558 26,152,963 25,041,562
28,738,986 24,625,853 27,565,172 25,408,245 Overseas Not past due but impaired** 5,820,717 2,681,378 6,763,366 3,086,501 Overdue by:
Upto 90 days 1,064,806 135,443 2,804,905 647,984 91 to 180 days 5,232,868 4,695,361 1,643,198 987,640 181 to 365 days 8,266,045 6,451,881 5,518,289 4,967,136 ˃ 365 days 36,133,444 33,447,081 33,537,663 28,790,409
56,517,880 47,411,144 50,267,421 38,479,670
Total 85,256,866 72,036,997 77,832,593 63,887,915
* The Other Assets Especially Mentioned category pertains to agricultural finance and advances to small enterprises.** Not past due but impaired category mainly represents restructured exposure which has not been declassified.
10.4 Particulars of provision against advances
Note Specific General Total Specific General Total
Opening balance 63,887,915 3,618,520 67,506,435 56,763,234 4,642,931 61,406,165Exchange adjustments 937,162 160,201 1,097,363 3,575,975 280,401 3,856,376
Charge / (reversals)Charge for the year 14,338,496 3,623,212 17,961,708 9,660,851 25,209 9,686,060Reversals (1,734,374) (88,056) (1,822,430) (3,568,092) (1,273,203) (4,841,295)
12,604,122 3,535,156 16,139,278 6,092,759 (1,247,994) 4,844,765Amounts written off 10.5 (5,282,212) - (5,282,212) (2,754,618) - (2,754,618)Amounts charged off -
agriculture financing (80,974) - (80,974) - - - Transfers (out) / in - net (29,016) - (29,016) 210,565 (56,818) 153,747Closing balance 72,036,997 7,313,877 79,350,874 63,887,915 3,618,520 67,506,435
10.4.1
10.4.2
The Bank has also availed FSV benefit of certain mortgaged properties held as collateral against non-performingadvances of overseas branches in accordance with the applicable regulation in the respective countries where thebranches operate. Had the benefit not been taken by the Bank, the specific provision against non-performing advanceswould had been higher by Rs. 3,951.861 million (2019: Rs. 5,180.474 million) for the overseas branches.
The Bank has availed the benefit of Forced Sale Value (FSV) of certain mortgaged properties held as collateral againstnon-performing advances as allowed under BSD Circular 1 of 2011. Had the benefit under the said Circular not beentaken by the Bank, the specific provision against non-performing advances would have been higher by Rs. 18.337 million(2019: Rs. 27.992 million). The FSV benefit availed is not available for the distribution of cash or stock dividend to
--------------------------------- (Rupees in '000) ----------------------------------
2020 2019
--------------------------------------------------------- (Rupees in '000) --------------------------------------------------------
General provision represents provision amounting to Rs. 319.955 million (2019: Rs. 328.342 million) against consumerfinance portfolio as required by the Prudential Regulations issued by the SBP and Rs. 6,993.922 million (2019: Rs.3,290.178 million) pertaining to overseas advances to meet the requirements of the regulatory authorities of the respectivecountries in which the overseas branches and subsidiaries operate.
Advances include Rs. 85,256.866 million (2019: Rs. 77,832.593 million) which have been placed under non-performingstatus as detailed below:
2020 2019Non-
Performing Loans
Provision Non-
Performing Loans
Provision
31 203Annual Report 2020
Notes to and forming part of the Consolidated Financial StatementsFor the year ended December 31, 2020

NOTES TO AND FORMING PART OF THE CONSOLIDATED FINANCIAL STATEMENTS FOR THE YEAR ENDED DECEMBER 31, 2020
10.4.3 Particulars of provision against advances
Specific General Total Specific General Total
In local currency 24,085,365 319,955 24,405,320 24,097,983 382,342 24,480,325 In foreign currencies 47,951,632 6,993,922 54,945,554 39,789,932 3,236,178 43,026,110
72,036,997 7,313,877 79,350,874 63,887,915 3,618,520 67,506,435
10.4.4
Note 2020 2019
10.5 Particulars of write-offs
10.5.1 Against provisions 10.4 5,282,212 2,754,618 Directly charged to profit and loss account 143,246 149,591
5,425,458 2,904,209
10.5.2 Bank- Write-offs of Rs. 500,000 and above
Domestic 10.6 2,663,181 107,336 Overseas 2,629,279 2,742,502
5,292,460 2,849,838 - Write-offs of below Rs. 500,000 66,846 54,371
5,359,306 2,904,209 SubsidiariesWrite-offs 66,152 -
5,425,458 2,904,209
10.6 Details of loan write-offs of Rs. 500,000 and above
10.7
Note 2020 2019
11. FIXED ASSETS
Capital work-in-progress 11.1 447,893 541,722 Property and equipment 11.2 57,019,687 57,734,689
57,467,580 58,276,411
11.1 Capital work-in-progressCivil works 270,445 370,308 Equipment 177,448 171,414
447,893 541,722
------- (Rupees in '000) -------
2020 2019
---------------------------------------- (Rupees in '000) --------------------------------------------
------- (Rupees in '000) -------
In terms of sub-section (3) of Section 33A of the Banking Companies Ordinance, 1962, the statement in respect of writtenoff loans or any other financial relief of five hundred thousand rupees or above allowed to a person during the year endedDecember 31, 2020, is given in annexure I to these consolidated financial statements (except in case of overseasbranches and subsidiaries write-offs which is restricted by overseas regulatory authorities).
Information related to Islamic financing and related assets is given in annexure II and is an integral part of theseconsolidated financial statements.
During the year, as a result of COVID-19, the SBP has allowed certain relaxations including deferment of principalpayment, rescheduling / restructuring of principal and mark-up, extension and timeline of provisioning against trade billswhile maintaining the customer status as "regular". These have been considered while determining the provisioningrequirements on a time based criteria.
32United Bank Limited204
Notes to and forming part of the Consolidated Financial StatementsFor the year ended December 31, 2020

NOTES TO AND FORMING PART OF THE CONSOLIDATED FINANCIAL STATEMENTS FOR THE YEAR ENDED DECEMBER 31, 2020
11.2 Property and equipment
At January 1, 2020Cost / Revalued amount 6,433,625 21,515,547 9,131,960 6,924,511 5,865,596 2,650,850 15,432,002 369,444 9,169,956 77,493,491Accumulated depreciation - (1,979) (844,058) (494,621) (3,383,813) (1,656,984) (11,125,242) (227,707) (2,024,398) (19,758,802)Net book value 6,433,625 21,513,568 8,287,902 6,429,890 2,481,783 993,866 4,306,760 141,737 7,145,558 57,734,689
Year ended December 2020Opening net book value 6,433,625 21,513,568 8,287,902 6,429,890 2,481,783 993,866 4,306,760 141,737 7,145,558 57,734,689Additions - - - - 485,146 93,434 1,908,749 4,950 2,230,528 4,722,807Movement in surplus during the year - - 61,238 - - - - - - 61,238Net disposal / termination (book value) - (44,930) (306,448) (118,811) (39,240) (12,342) (71,950) (13,359) (944,932) (1,552,012)Depreciation charge - - (105,017) (258,436) (469,546) (186,817) (1,845,397) (45,953) (1,662,049) (4,573,215)Net exchange rate adjustments - 10 406,463 399 41,348 4,656 78,408 307 94,589 626,180Closing net book value 6,433,625 21,468,648 8,344,138 6,053,042 2,499,491 892,797 4,376,570 87,682 6,863,694 57,019,687
At December 31, 2020Cost / Revalued amount 6,433,625 21,470,627 9,293,213 6,806,099 6,352,850 2,736,598 17,347,209 361,342 10,550,141 81,351,704Accumulated depreciation - (1,979) (949,075) (753,057) (3,853,359) (1,843,801) (12,970,639) (273,660) (3,686,447) (24,332,017)Net book value 6,433,625 21,468,648 8,344,138 6,053,042 2,499,491 892,797 4,376,570 87,682 6,863,694 57,019,687
Rate of depreciation (percentage) - - 2.5-5 2.5-5 5-20 10-25 5 - 33.33 20 4 - 100 -
At January 1, 2019Cost / Revalued amount 6,433,625 21,767,359 8,160,119 6,944,070 4,959,090 2,442,434 13,585,230 482,725 - 64,774,652Accumulated depreciation - (1,775) (636,115) (245,857) (2,922,506) (1,438,623) (9,362,221) (290,842) - (14,897,939)Net book value 6,433,625 21,765,584 7,524,004 6,698,213 2,036,584 1,003,811 4,223,009 191,883 - 49,876,713
Year ended December 2019Opening net book value 6,433,625 21,765,584 7,524,004 6,698,213 2,036,584 1,003,811 4,223,009 191,883 - 49,876,713Impact of adoption of IFRS 16
at January 1, 2019 - - - - - - - - 8,396,393 8,396,393Additions - - 1,061 13,832 901,648 170,985 1,830,305 19,104 824,569 3,761,504Movement in surplus during the year - - 300,597 - - - - - - 300,597Net disposal (book value) - (252,050) (134,168) (18,454) (29,668) (111) (27,015) (11,977) - (473,443)Depreciation charge - - (120,709) (264,096) (427,938) (186,321) (1,749,116) (58,011) (2,112,273) (4,918,464)Net exchange rate adjustments - 34 717,117 395 1,157 5,502 29,577 738 36,869 791,389Closing net book value 6,433,625 21,513,568 8,287,902 6,429,890 2,481,783 993,866 4,306,760 141,737 7,145,558 57,734,689
At December 31, 2019Cost / Revalued amount 6,433,625 21,515,547 9,131,960 6,924,511 5,865,596 2,650,850 15,432,002 369,444 9,169,956 77,493,491Accumulated depreciation - (1,979) (844,058) (494,621) (3,383,813) (1,656,984) (11,125,242) (227,707) (2,024,398) (19,758,802)Net book value 6,433,625 21,513,568 8,287,902 6,429,890 2,481,783 993,866 4,306,760 141,737 7,145,558 57,734,689
Rate of depreciation (percentage) - - 2.5-5 2.5-5 5-20 10-25 5 - 33.33 20 4 - 100 -
11.3 Revaluation of properties
The properties of UBL UK were last revalued by independent professional valuer, Quantum Valuation LLP, as at December31, 2019. The total surplus arising against the revaluation of fixed assets as at December 31, 2020, amounts to Rs. 4,672.521million (2019: Rs. 4,293.226 million).
----------------------------------------------------------------------------- Rupees '000 -----------------------------------------------------------------------------
2019
Freehold land
Leasehold land
Buildings on Freehold
land
Buildings on
Leasehold land
Leasehold Improve-
ments
Furniture and fixture
Electrical, office and computer equipment
Vehicles Total
Total
2020
Right-of-use Asset -
Property
----------------------------------------------------------------------------- Rupees '000 -----------------------------------------------------------------------------
The properties of the Bank were last revalued by independent professional valuers as at December 31, 2017. Therevaluation was carried out by M/s. Engineering Pakistan Int'l (Private) Limited., M/s. M. J. Surveyors (Private) Limited, M/s.Harvestor Services (Private) Limited., and M/s. Iqbal A. Nanjee & Co. (Private) Limited. on the basis of professionalassessment of present market values which resulted in an increase in surplus by Rs. 6,366.149 million. The total surplusagainst revaluation of fixed assets as at December 31, 2020, amounts to Rs. 25,630.817 million.
Freehold land
Leasehold land
Buildings on Freehold
land
Buildings on
Leasehold land
Leasehold Improve-
ments
Furniture and fixture
Electrical, office and computer equipment
VehiclesRight-of-use
Asset - Property
33
205Annual Report 2020
Notes to and forming part of the Consolidated Financial StatementsFor the year ended December 31, 2020

NOTES TO AND FORMING PART OF THE CONSOLIDATED FINANCIAL STATEMENTS FOR THE YEAR ENDED DECEMBER 31, 2020
2020 2019
Freehold land 782,581 782,581 Leasehold land 3,330,789 3,331,039 Buildings on freehold land 3,482,166 3,423,335 Buildings on leasehold land 4,757,844 4,962,504
11.4 Carrying amount of temporarily idle properties of the Group 143,420 82,420
11.5 The cost of fully depreciated assets still in use
Furniture and fixtures 632,677 679,284 Electrical, office and computer equipment 6,566,747 6,026,942 Vehicles 118,403 52,446 Building on leasehold land 57,110 - Leasehold improvements 1,008,772 1,271,817
8,383,709 8,030,489 11.6 Details of disposals of operating fixed assets
Note 2020 201912 INTANGIBLE ASSETS
Capital work-in-progress 232,545 262,404 Intangible assets 12.1 1,802,006 1,808,534
2,034,551 2,070,938
12.1 At January 1
Cost 6,845,905 5,831,215 Accumulated amortisation and impairment (5,037,371) (4,179,944) Net book value 1,808,534 1,651,271
Year ended December 31Opening net book value 1,808,534 1,651,271 Additions 839,107 820,004 Disposals (1,325) (1,759) Amortisation charge (855,574) (701,155) Exchange rate adjustments 11,264 40,173 Closing net book value 1,802,006 1,808,534
At December 31Cost 7,690,616 6,845,905 Accumulated amortisation and impairment (5,888,610) (5,037,371) Net book value 1,802,006 1,808,534
Rate of amortisation (percentage) 10-33.33 10-33.33
Useful life (in years) 3 - 10 3 - 10
12.2 The cost of fully amortised assets still in use
Software 3,129,528 2,506,780
Had there been no revaluation, the carrying amount of revalued assets of the Group at December 31, would have been asfollows:
------- (Rupees in '000) -------
The information relating to operating fixed assets disposed off during the year to related parties is given in annexure 'III' andis an integral part of these consolidated financial statements.
------- (Rupees in '000) -------
34United Bank Limited206
Notes to and forming part of the Consolidated Financial StatementsFor the year ended December 31, 2020

NOTES TO AND FORMING PART OF THE CONSOLIDATED FINANCIAL STATEMENTS FOR THE YEAR ENDED DECEMBER 31, 2020
Note 2020 201913. DEFERRED TAX ASSETS
Deferred tax assets 13.1 4,682,494 1,723,553
13.1 Movement in temporary differences during the year2020
At January 1, 2020
Recognised in profit and loss
accountRecognised in OCI At December 31,
2020
Deductible temporary differences on- Tax losses carried forward - - - - - Post-retirement employee benefits 837,426 30,335 518,389 1,386,150 - Provision against advances, off-balance sheet etc. 3,291,876 3,098,387 - 6,390,263 - Workers Welfare Fund 1,495,858 337,333 - 1,833,191
5,625,160 3,466,055 518,389 9,609,604 Taxable temporary differences on
- Surplus on revaluation of fixed assets / non-banking assets (1,339,305) 32,790 20,404 (1,286,111) - Share of profit from associates (922,114) (161,346) - (1,083,460) - Surplus on revaluation on investments (375,338) - (1,322,078) (1,697,416) - Accelerated tax depreciation and others (744,233) 458,055 - (286,178) - Others (520,617) 289 (53,617) (573,945)
(3,901,607) 329,788 (1,355,291) (4,927,110)
1,723,553 3,795,843 (836,902) 4,682,494
2019
At January 1, 2019
Recognised in profit and loss
accountRecognised in OCI At December 31,
2019
Deductible temporary differences on- Tax losses carried forward 233,360 - (233,360) - - Post-retirement employee benefits 404,016 103,173 330,237 837,426 - Provision against advances, off-balance sheet etc. 2,292,249 999,627 - 3,291,876 - Surplus on revaluation of investments 1,083,350 412,508 - 1,495,858
4,012,975 1,515,308 96,877 5,625,160 Taxable temporary differences on
- Surplus on revaluation of fixed assets / non-banking assets (1,412,044) 32,786 39,953 (1,339,305) - Share of profit from Associates (680,832) (241,282) - (922,114) - Workers' Welfare Fund 4,960,471 43,339 (5,379,148) (375,338) - Accelerated tax depreciation and others (503,666) (240,567) - (744,233) - Others 309,048 (864,398) 34,733 (520,617)
2,672,977 (1,270,122) (5,304,462) (3,901,607)
6,685,952 245,186 (5,207,585) 1,723,553
14. DISCONTINUED OPERATION
2020 201914.1 Assets and liabilities under discontinued operation
AssetsBalances with other banks 219,488 236,450
LiabilitiesOther liabilities 11,575 17,936
------------------------------ (Rupees in '000) ------------------------------
------- (Rupees in '000) -------
UBL Bank (Tanzania) Limited ("UBTL") is a wholly owned subsidiary of United Bank Limited. UBTL sold materially all of itsassets and liabilities held as at October 31, 2019, including the loans and advances and deposit book to EXIM BankTanzania Limited ("Exim"), in line with the Asset and Liabilities Purchase Agreement signed on May 22, 2019. The control ofthese assets and liabilities was transferred to Exim effective from November 1, 2019. The Banking operations of thesubsidiary ceased on November 1, 2019. UBTL is in process of winding up and voluntary liquidation.
------- (Rupees in '000) -------
------------------------------ (Rupees in '000) ------------------------------
35207Annual Report 2020
Notes to and forming part of the Consolidated Financial StatementsFor the year ended December 31, 2020

NOTES TO AND FORMING PART OF THE CONSOLIDATED FINANCIAL STATEMENTS FOR THE YEAR ENDED DECEMBER 31, 2020
Note 2020 201914.2 Loss from discontinued operation
Mark-up / return / interest earned - 396,413 Mark-up / return / interest expensed - 148,114 Net mark-up / interest income - 248,299
Non mark-up / interest incomeFee and commission income - 44,227 Foreign exchange loss - (9,811) Loss on securities - net - (10,539) Other income 312 33,074 Total non mark-up / interest income 312 56,951 Total income 312 305,250
Non mark-up / interest expensesOperating expenses 17,649 635,337 Loss on fair value measurement - 536,145 Total non mark-up / interest expenses 17,649 1,171,482
Loss before provisions (17,337) (866,232) Provisions and write-offs - net - 93,370 Loss before taxation (17,337) (959,602)
Taxation (964) 265,596 Loss after taxation for the year (16,373) (1,225,198)
15. OTHER ASSETS
Income / mark-up accrued in local currency - net of provision 21,075,329 28,748,779 Income / mark-up accrued in foreign currencies - net of provision 2,211,759 2,599,478
15.1 23,287,088 31,348,257
Advance taxation - net of provision for taxation 15.2 5,992,577 19,684,137 Receivable from staff retirement fund 24,160 206,939 Receivable from other banks against telegraphic transfers and demand drafts 110,689 201,592 Unrealised gain on forward foreign exchange contracts 3,347,603 7,376,206 Rebate receivable - net 631,410 2,142,484 Unrealised gain on derivative financial instruments 27.2 - 15,216 Suspense accounts 240,002 537,962 Stationery and stamps on hand 169,311 287,314 Non-banking assets acquired in satisfaction of claims 274,451 1,071,034 Advances, deposits, advance rent and other prepayments 1,475,598 1,345,735 Acceptances 22 10,505,651 17,366,169 Dividend receivable 217,974 213,012 Commission receivable - Branchless Banking 658,524 650,685 Receviable against fraud & forgery and looted notes 586,929 590,120 Others 2,010,832 1,964,616
49,532,799 85,001,478 Provision held against other assets 15.4 (1,392,976) (1,271,877) Other assets - net of provision 48,139,823 83,729,601 (Deficit) / surplus on revaluation of non-banking assets acquired in
satisfaction of claims 24.3 & 15.3.2 (38,367) 11,341 Other assets - total 48,101,456 83,740,942
15.1
15.2 The Income Tax returns of the Bank have been filed upto the tax year 2020 (accounting year ended December 31, 2019)and were deemed to be assessed under section 120 of the Income Tax Ordinance, 2001 (Ordinance).
This includes unrealised mark-up held in suspense amounting to Rs. 13,639.898 million (2019: Rs. 10,303.471 million) keptagainst nonperforming overseas advances / investment as per the requirements of the regulatory authorities of therespective countries in which the overseas branches operate.
------- (Rupees in '000) -------
36United Bank Limited208
Notes to and forming part of the Consolidated Financial StatementsFor the year ended December 31, 2020
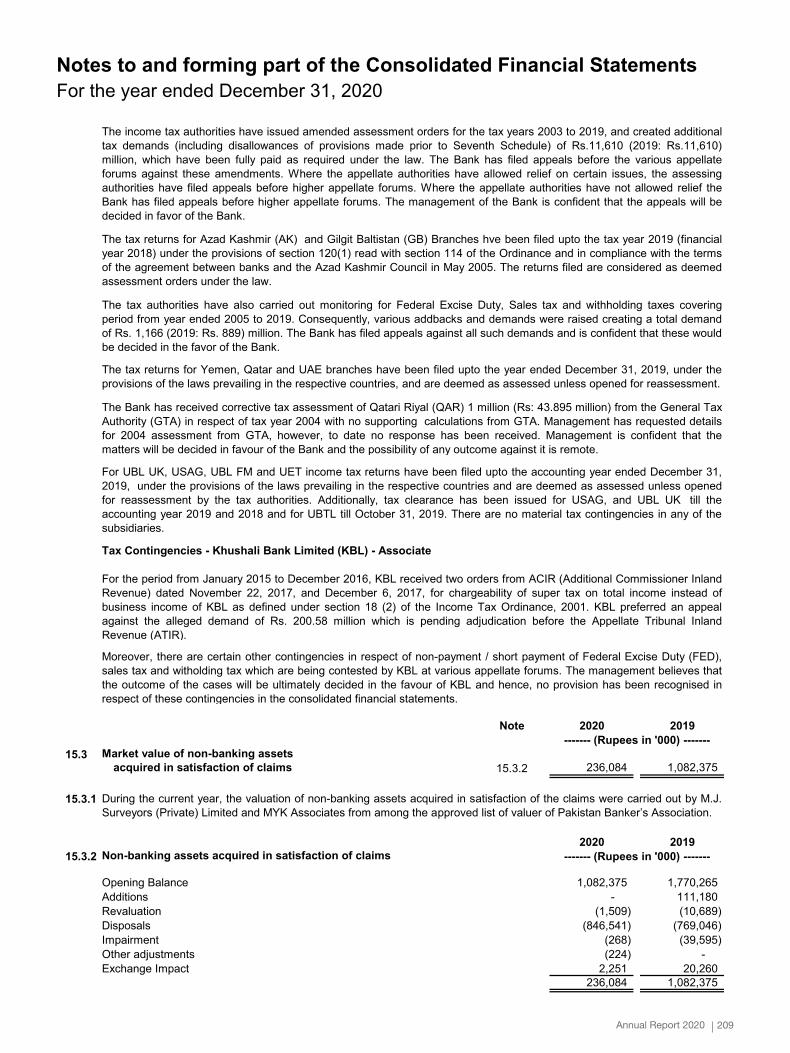
NOTES TO AND FORMING PART OF THE CONSOLIDATED FINANCIAL STATEMENTS FOR THE YEAR ENDED DECEMBER 31, 2020
Note 2020 2019
15.3 Market value of non-banking assetsacquired in satisfaction of claims 15.3.2 236,084 1,082,375
15.3.1
2020 201915.3.2 Non-banking assets acquired in satisfaction of claims
Opening Balance 1,082,375 1,770,265 Additions - 111,180 Revaluation (1,509) (10,689) Disposals (846,541) (769,046) Impairment (268) (39,595) Other adjustments (224) - Exchange Impact 2,251 20,260
236,084 1,082,375
The income tax authorities have issued amended assessment orders for the tax years 2003 to 2019, and created additionaltax demands (including disallowances of provisions made prior to Seventh Schedule) of Rs.11,610 (2019: Rs.11,610)million, which have been fully paid as required under the law. The Bank has filed appeals before the various appellateforums against these amendments. Where the appellate authorities have allowed relief on certain issues, the assessingauthorities have filed appeals before higher appellate forums. Where the appellate authorities have not allowed relief theBank has filed appeals before higher appellate forums. The management of the Bank is confident that the appeals will bedecided in favor of the Bank.
The tax returns for Azad Kashmir (AK) and Gilgit Baltistan (GB) Branches hve been filed upto the tax year 2019 (financialyear 2018) under the provisions of section 120(1) read with section 114 of the Ordinance and in compliance with the termsof the agreement between banks and the Azad Kashmir Council in May 2005. The returns filed are considered as deemedassessment orders under the law.
During the current year, the valuation of non-banking assets acquired in satisfaction of the claims were carried out by M.J.Surveyors (Private) Limited and MYK Associates from among the approved list of valuer of Pakistan Banker’s Association.
The tax authorities have also carried out monitoring for Federal Excise Duty, Sales tax and withholding taxes coveringperiod from year ended 2005 to 2019. Consequently, various addbacks and demands were raised creating a total demandof Rs. 1,166 (2019: Rs. 889) million. The Bank has filed appeals against all such demands and is confident that these wouldbe decided in the favor of the Bank.
The tax returns for Yemen, Qatar and UAE branches have been filed upto the year ended December 31, 2019, under theprovisions of the laws prevailing in the respective countries, and are deemed as assessed unless opened for reassessment.
The Bank has received corrective tax assessment of Qatari Riyal (QAR) 1 million (Rs: 43.895 million) from the General TaxAuthority (GTA) in respect of tax year 2004 with no supporting calculations from GTA. Management has requested detailsfor 2004 assessment from GTA, however, to date no response has been received. Management is confident that thematters will be decided in favour of the Bank and the possibility of any outcome against it is remote.
For UBL UK, USAG, UBL FM and UET income tax returns have been filed upto the accounting year ended December 31,2019, under the provisions of the laws prevailing in the respective countries and are deemed as assessed unless openedfor reassessment by the tax authorities. Additionally, tax clearance has been issued for USAG, and UBL UK till theaccounting year 2019 and 2018 and for UBTL till October 31, 2019. There are no material tax contingencies in any of thesubsidiaries.
------- (Rupees in '000) -------
------- (Rupees in '000) -------
Tax Contingencies - Khushali Bank Limited (KBL) - Associate
For the period from January 2015 to December 2016, KBL received two orders from ACIR (Additional Commissioner InlandRevenue) dated November 22, 2017, and December 6, 2017, for chargeability of super tax on total income instead ofbusiness income of KBL as defined under section 18 (2) of the Income Tax Ordinance, 2001. KBL preferred an appealagainst the alleged demand of Rs. 200.58 million which is pending adjudication before the Appellate Tribunal InlandRevenue (ATIR).
Moreover, there are certain other contingencies in respect of non-payment / short payment of Federal Excise Duty (FED),sales tax and witholding tax which are being contested by KBL at various appellate forums. The management believes thatthe outcome of the cases will be ultimately decided in the favour of KBL and hence, no provision has been recognised inrespect of these contingencies in the consolidated financial statements.
37209Annual Report 2020
Notes to and forming part of the Consolidated Financial StatementsFor the year ended December 31, 2020

NOTES TO AND FORMING PART OF THE CONSOLIDATED FINANCIAL STATEMENTS FOR THE YEAR ENDED DECEMBER 31, 2020
Note 2020 201915.4 Provision held against other assets
Advances, deposits, advance rent and other prepayments 84,272 84,272 Non banking assets acquired in satisfaction of claims - 85,200 Fraud and forgery 626,435 639,141 Others 682,269 463,264
1,392,976 1,271,877
15.4.1 Movement of provision held against other assets
Opening balance 1,271,877 1,086,072 Exchange adjustments 655 2,930
Charge / (reversals)Charge for the year 249,664 326,810 Reversals (94,809) (72,670)
36 154,855 254,140 Transfers in - net 3,245 (17,000) Amounts written off (37,656) (54,265) Closing balance 1,392,976 1,271,877
16. CONTINGENT ASSETS
There were no contingent assets as at the statement of financial position date.
17. BILLS PAYABLE
In Pakistan 28,820,012 22,500,509 Outside Pakistan 921,194 428,711
29,741,206 22,929,220
18. BORROWINGS
18.1 Particulars of borrowings
In local currency 119,729,587 138,528,835In foreign currencies 12,097,598 31,876,225
131,827,185 170,405,06018.2 Details of borrowings
SecuredBorrowings from the State Bank of Pakistan under:
Export refinance scheme 18.3 30,724,174 30,354,891Refinance facility for modernisation of SMEs 18.4 3,955 10,022Long term financing facility 18.5 22,243,644 22,959,023Refinance scheme for payment of wages and salaries 18.6 5,587,037 - Renewable energy scheme 18.7 146,985 - Other borrowings 18.8 1,166,820 399,702
59,872,615 53,723,638Repurchase agreement borrowings 18.9 59,835,819 74,748,710Bai Muajjal payable to other financial institutions - 13,812,921
119,708,434 142,285,269Unsecured Call borrowings 18.10 2,397,485 4,680,579Overdrawn nostro accounts 379,564 591,378Money market deals 18.11 9,341,702 22,847,834
12,118,751 28,119,791
131,827,185 170,405,060
------- (Rupees in '000) -------
38United Bank Limited210
Notes to and forming part of the Consolidated Financial StatementsFor the year ended December 31, 2020
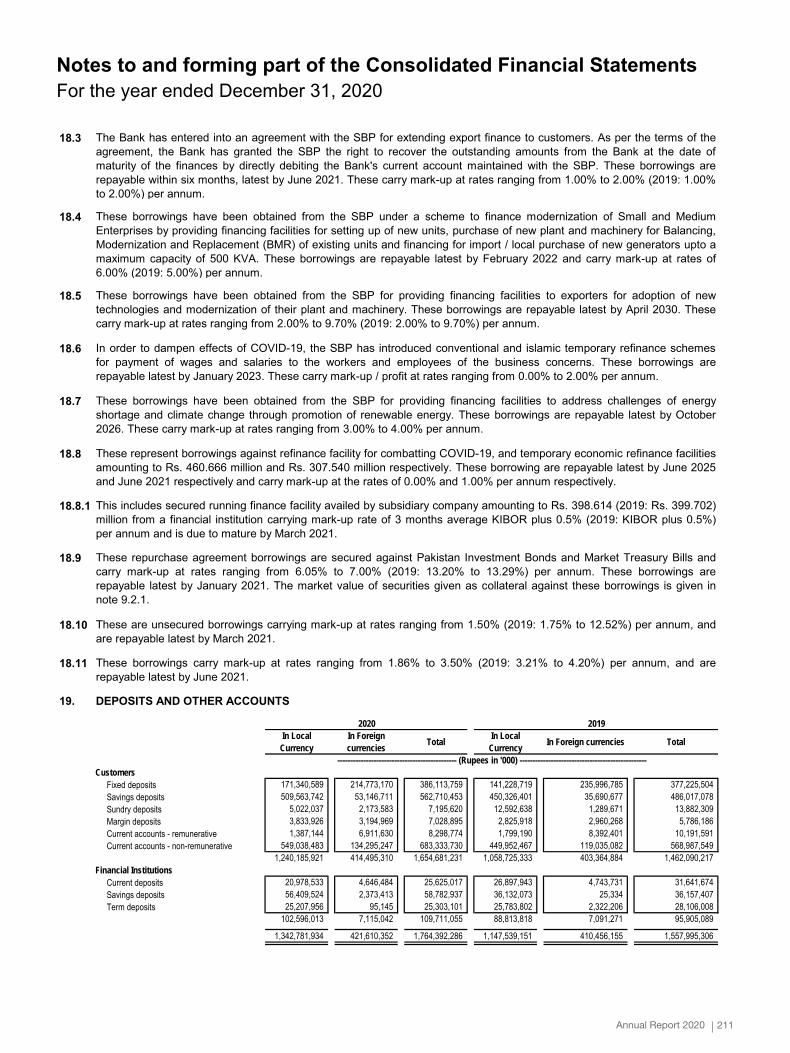
NOTES TO AND FORMING PART OF THE CONSOLIDATED FINANCIAL STATEMENTS FOR THE YEAR ENDED DECEMBER 31, 2020
18.3
18.4
18.5
18.6
18.7
18.8
18.8.1
18.9
18.10
18.11
19. DEPOSITS AND OTHER ACCOUNTS
In Local Currency
In Foreign currencies Total In Local
Currency In Foreign currencies Total
---------------------------------------------- (Rupees in '000) -------------------------------------------------Customers
Fixed deposits 171,340,589 214,773,170 386,113,759 141,228,719 235,996,785 377,225,504Savings deposits 509,563,742 53,146,711 562,710,453 450,326,401 35,690,677 486,017,078Sundry deposits 5,022,037 2,173,583 7,195,620 12,592,638 1,289,671 13,882,309Margin deposits 3,833,926 3,194,969 7,028,895 2,825,918 2,960,268 5,786,186Current accounts - remunerative 1,387,144 6,911,630 8,298,774 1,799,190 8,392,401 10,191,591Current accounts - non-remunerative 549,038,483 134,295,247 683,333,730 449,952,467 119,035,082 568,987,549
1,240,185,921 414,495,310 1,654,681,231 1,058,725,333 403,364,884 1,462,090,217Financial Institutions
Current deposits 20,978,533 4,646,484 25,625,017 26,897,943 4,743,731 31,641,674Savings deposits 56,409,524 2,373,413 58,782,937 36,132,073 25,334 36,157,407Term deposits 25,207,956 95,145 25,303,101 25,783,802 2,322,206 28,106,008
102,596,013 7,115,042 109,711,055 88,813,818 7,091,271 95,905,089
1,342,781,934 421,610,352 1,764,392,286 1,147,539,151 410,456,155 1,557,995,306
The Bank has entered into an agreement with the SBP for extending export finance to customers. As per the terms of theagreement, the Bank has granted the SBP the right to recover the outstanding amounts from the Bank at the date ofmaturity of the finances by directly debiting the Bank's current account maintained with the SBP. These borrowings arerepayable within six months, latest by June 2021. These carry mark-up at rates ranging from 1.00% to 2.00% (2019: 1.00%to 2.00%) per annum.
These borrowings have been obtained from the SBP under a scheme to finance modernization of Small and MediumEnterprises by providing financing facilities for setting up of new units, purchase of new plant and machinery for Balancing,Modernization and Replacement (BMR) of existing units and financing for import / local purchase of new generators upto amaximum capacity of 500 KVA. These borrowings are repayable latest by February 2022 and carry mark-up at rates of6.00% (2019: 5.00%) per annum.
These borrowings have been obtained from the SBP for providing financing facilities to exporters for adoption of newtechnologies and modernization of their plant and machinery. These borrowings are repayable latest by April 2030. Thesecarry mark-up at rates ranging from 2.00% to 9.70% (2019: 2.00% to 9.70%) per annum.
These repurchase agreement borrowings are secured against Pakistan Investment Bonds and Market Treasury Bills andcarry mark-up at rates ranging from 6.05% to 7.00% (2019: 13.20% to 13.29%) per annum. These borrowings arerepayable latest by January 2021. The market value of securities given as collateral against these borrowings is given innote 9.2.1.
2020 2019
In order to dampen effects of COVID-19, the SBP has introduced conventional and islamic temporary refinance schemesfor payment of wages and salaries to the workers and employees of the business concerns. These borrowings arerepayable latest by January 2023. These carry mark-up / profit at rates ranging from 0.00% to 2.00% per annum.
These borrowings have been obtained from the SBP for providing financing facilities to address challenges of energyshortage and climate change through promotion of renewable energy. These borrowings are repayable latest by October2026. These carry mark-up at rates ranging from 3.00% to 4.00% per annum.
This includes secured running finance facility availed by subsidiary company amounting to Rs. 398.614 (2019: Rs. 399.702)million from a financial institution carrying mark-up rate of 3 months average KIBOR plus 0.5% (2019: KIBOR plus 0.5%)per annum and is due to mature by March 2021.
These are unsecured borrowings carrying mark-up at rates ranging from 1.50% (2019: 1.75% to 12.52%) per annum, andare repayable latest by March 2021.
These borrowings carry mark-up at rates ranging from 1.86% to 3.50% (2019: 3.21% to 4.20%) per annum, and arerepayable latest by June 2021.
These represent borrowings against refinance facility for combatting COVID-19, and temporary economic refinance facilitiesamounting to Rs. 460.666 million and Rs. 307.540 million respectively. These borrowing are repayable latest by June 2025and June 2021 respectively and carry mark-up at the rates of 0.00% and 1.00% per annum respectively.
39
211Annual Report 2020
Notes to and forming part of the Consolidated Financial StatementsFor the year ended December 31, 2020

NOTES TO AND FORMING PART OF THE CONSOLIDATED FINANCIAL STATEMENTS FOR THE YEAR ENDED DECEMBER 31, 2020
2020 201919.1 Composition of deposits
- Individuals 1,024,507,840 893,983,544 - Government (Federal and Provincial) 99,008,897 68,423,163 - Public Sector Entities 114,365,057 93,003,677 - Banking Companies 14,655,568 37,048,530 - Non-Banking Financial Institutions 95,055,487 58,856,559 - Private Sector 416,799,437 406,679,833
1,764,392,286 1,557,995,306
20. LIABILITIES AGAINST ASSETS SUBJECT TO FINANCE LEASE
Not later than one year 5,562 452 5,110 5,180 832 4,348 Later than one year and not later than five years 11,132 285 10,847 15,549 802 14,747
16,694 737 15,957 20,729 1,634 19,095
21. SUBORDINATED DEBT
Salient features of the ADT 1 issue are as follows:-
Issue Size Rs. 10,000 millionIssue Date January 29, 2019Tenor Perpetual (i.e. no fixed or final redemption date)Rating “AA+” (Double A Plus) by VIS Credit Rating Company LimitedSecurity Unsecured Mark-up rate The TFCs shall carry mark-up at the rate of 3 Month KIBOR + 1.55%.Mark-up payment frequency Profit / Mark-up shall be payable quarterly in arrears, on a non-cumulative basisCall option
Lock-in clause
Loss absorbency clause
These represent finance leases entered into for the lease of franking machine. At the end of the lease period, the ownershipof the leased assets shall be transferred to the Group on payment of the residual values of the leased assets. The cost ofoperating and maintaining the leased assets is borne by the Group. The liabilities are secured by demand promissory notes,security deposits, and the franking machines which have been obtained under these leasing arrangements. The rate usedfor discounting future lease payments is 12.39% per annum (2019: 12.39% per annum). The amount of future minimumlease payments and the periods during which they become due are as follows:
2020Finance
charges for future
periods
Principal outstanding
Minimum lease
payments
Minimum lease
payments
2019
Finance charges for future periods
Principal outstanding
This includes deposits eligible to be covered under insurance arrangements in accordance with DPC Circular No. 04 datedJune 22, 2018, amounting to Rs. 991,687.959 million (2019: Rs. 854,722.801 million).
------- (Rupees in '000) -------
Mark-up on the TFCs shall only be paid from the current year's earnings and if the Bank is fullycompliant with SBP’s Minimum Capital Requirement (MCR), Capital Adequacy Ratio (CAR) andLiquidity Ratio (LR) requirements.The TFCs shall, at the discretion of the SBP, be either permanently converted into ordinary shares orpermanently written off (partially or in full) pursuant to the loss absorbency clause as stipulated in the“Instructions for Basel III Implementation in Pakistan” issued vide BPRD Circular No. 6 dated August15, 2013.
The Bank has issued fully paid up, rated, listed, perpetual, unsecured, subordinated, non-cumulative and contingentconvertible debt instruments in the nature of Term Finance Certificates (TFCs) under Section 66 of the Companies Act,2017 which qualify as Additional Tier I Capital as outlined by State Bank of Pakistan (SBP) under BPRD Circular No. 6dated August 15, 2013.
-------------------- (Rupees in '000) --------------------
The Bank may, at its sole discretion, call the TFCs, at any time after five years from the Issue Datesubject to the prior approval of the SBP.
40United Bank Limited212
Notes to and forming part of the Consolidated Financial StatementsFor the year ended December 31, 2020

NOTES TO AND FORMING PART OF THE CONSOLIDATED FINANCIAL STATEMENTS FOR THE YEAR ENDED DECEMBER 31, 2020
Note 2020 201922. OTHER LIABILITIES
Mark-up / return / interest payable in local currency 11,630,286 8,964,544 Mark-up / return / interest payable in foreign currencies 1,327,591 2,195,349
12,957,877 11,159,893 Accrued expenses 4,332,657 4,199,847 Branch adjustment account 105,228 227,951 Deferred income 882,954 367,158 Unearned commission and income on bills discounted 453,296 921,121 Provision against off-balance sheet obligations 22.1 1,076,530 632,785 Unrealised loss on forward foreign exchange contracts 3,376,994 6,979,761 Trading liability - 6,120,767 Payable to staff retirement fund 1,142,926 725,619 Deferred liabilities 22.2 3,969,397 3,887,845 Unrealised loss on derivative financial instruments - 18,155 Workers' Welfare Fund payable 4,752,294 3,878,370 Liabilities against ATM settlement 1,199,242 1,308,571 Insurance payable against consumer assets 615,405 449,263 Dividend payable 357,578 538,884 Acceptances 10,505,651 17,366,169 Charity fund balance 2,828 3,494 Lease Liability 7,950,494 7,826,864 Levies and taxes payable 2,671,007 2,705,417 Others 1,915,320 1,280,493
58,267,678 70,598,427 22.1 Provision against off-balance sheet obligations
Opening balance 632,785 842,545 Exchange adjustments 11,996 82,610 Charge 36 568,987 288,288 Reversals (137,238) (240,850)
431,749 47,438 Transfer out - net - (339,808)
1,076,530 632,785 22.2 Deferred liabilities
Provision for post retirement medical benefits 41.1.4 2,028,687 1,950,906 Provision for compensated absences 1,001,312 1,037,908 Deferred liability for outsourced services 228,005 272,635 Deferred liability - overseas 711,393 626,396
3,969,397 3,887,845
22.3 The total cash outflow for leases during the year was Rs. 2,231.752 million (2019: Rs. 2,195.458 million).
23. SHARE CAPITAL
23.1 Authorised Capital
2020 2019 2020 2019
2,000,000,000 2,000,000,000 Ordinary shares of Rs.10 each 20,000,000 20,000,000
23.2 Issued, subscribed and paid-up capital
2020 2019 2020 2019
Fully paid-up ordinary shares of Rs.10 each518,000,000 518,000,000 Issued for cash 5,180,000 5,180,000 706,179,687 706,179,687 Issued as bonus shares 7,061,797 7,061,797
1,224,179,687 1,224,179,687 12,241,797 12,241,797
------- (Rupees in '000) -------
----- Number of shares ----- ------- (Rupees in '000) -------
----- Number of shares ----- ------- (Rupees in '000) -------
41 213Annual Report 2020
Notes to and forming part of the Consolidated Financial StatementsFor the year ended December 31, 2020

NOTES TO AND FORMING PART OF THE CONSOLIDATED FINANCIAL STATEMENTS FOR THE YEAR ENDED DECEMBER 31, 2020
23.3
23.4 Major shareholders (holding more than 5% of total paid-up capital)
Number of Percentage of Number of Percentage ofName of shareholders shares held shareholding shares held shareholdingBestway (Holdings) Limited 631,728,895 51.60% 631,728,895 51.60%Bestway Cement Limited 93,649,744 7.65% 93,649,744 7.65%
Note 2020 201923.5 Shares of the Bank held by its associates ------- (Number of shares) -------
UBL Financial Sector Fund 1,616,986 479,400
UBL Stock Advantage Fund 3,321,071 2,288,991
24. SURPLUS ON REVALUATION OF ASSETS - 2020 2019NET OF DEFERRED TAX
Surplus / (deficit) arising on revaluation of assets - net of taxFixed assets 24.1 27,022,623 27,184,005 Available for sale securities 24.2 2,282,110 189,650 Non-banking assets acquired in satisfaction of claims 24.3 913 31,071 Surplus / (deficit) arising on revaluation of assets of associates 28,566 (168)
29,334,212 27,404,558 24.1 Surplus on revaluation of fixed assets
Surplus on revaluation of fixed assets as at January 1 30,165,526 29,742,871
Revaluation against fixed assets during the year (250,405) 227,612 Realised on disposal during the year (162,824) (263,135) Exchange adjustments 310,216 548,326 Transferred to unappropriated profit in respect of incremental
depreciation charged during the year - net of deferred tax (53,821) (55,691) Related deferred tax liability on incremental depreciation charged
during the year (33,177) (34,457) (190,011) 422,655
29,975,515 30,165,526 Less: Related deferred tax liability on
Revaluation as on January 1 1,319,440 1,344,759 Surplus realised on disposal of fixed assets during the year (46,478) (826) Impact of change of deferred tax rate - 77,907 Reversal of revaluation against fixed assets during the year (4,506) (179,746) Exchange adjustments 50,249 111,803 Incremental depreciation charged on related assets (33,177) (34,457)
13.1 1,285,528 1,319,440 28,689,987 28,846,086
Share of non-controlling interest (1,667,364) (1,662,081) Group's share 27,022,623 27,184,005
In 2007, the Bank was admitted to the official list of the UK Listing Authority and to the London Stock ExchangeProfessional Securities Market for trading of Global Depository Receipts (GDRs), each representing four ordinary sharesissued by the Bank. The GDRs constitute an offering in the United States only to qualified institutional buyers in relianceon Rule 144A under the U.S Securities Act of 1933 and an offering outside the United States in reliance on Regulation S.
------- (Rupees in '000) -------
Holders of GDRs are entitled, subject to the provisions of the depository agreement, to receive dividends, if any, and rankpari passu with other equity shareholders in respect of such entitlement. However, the holders of GDRs have no votingrights or other direct rights of shareholders with respect to the ordinary shares underlying such GDRs. Subject to the termsand restrictions set out in the offering circular dated June 25, 2007, the deposited ordinary shares in respect of which theGDRs were issued may be withdrawn by the GDR holders from the depository facility. Upon withdrawal, the holders willrank pari passu with other ordinary shareholders in respect of voting powers. As at December 31, 2020, 242,278 (2019:248,067) GDRs, representing 969,112 (2019: 992,268) shares, were in issue.
2020 2019
As at December 31, 2020, Bestway Group (Bestway) held 61.48% (2019: 61.48%) shareholding (including GDRs) of theBank.
42
United Bank Limited214
Notes to and forming part of the Consolidated Financial StatementsFor the year ended December 31, 2020

NOTES TO AND FORMING PART OF THE CONSOLIDATED FINANCIAL STATEMENTS FOR THE YEAR ENDED DECEMBER 31, 2020
2020 201924.2 Surplus / (deficit) on revaluation of available for sale securities
Market Treasury Bills 238,363 149,496Pakistan Investment Bonds - fixed 333,950 (8,446,273)Pakistan Investment Bonds - floaters (2,569,332) 1,772,076Ordinary shares and mutual fund 2,496,134 3,202,927REIT Investment (16,676) 62,118Term Finance Certificates, Sukuks, other bonds etc. (48,193) 23,973Foreign bonds 3,240,242 3,421,155
3,674,488 185,472Related deferred tax liability (1,697,416) (375,338)
1,977,072 (189,866)Share of non-controlling interest 305,038 379,516Group's share 2,282,110 189,650
24.3 Surplus on revaluation of non-banking assets
Surplus on revaluation of non-banking assets as at January 1 50,936 173,141
Revaluation of non-banking assets during the year (1,509) (7,822)Realised on disposal during the year (47,931) (114,383)
(49,440) (122,205)1,496 50,936
Less: Related deferred tax liability onLess: Revaluation as at January 1 19,865 67,285Less: Revaluation of non-banking assets during the year (588) (3,051)Less: Surplus realised on disposal of non-banking assets during the year (18,694) (44,369)
583 19,865
913 31,07125. NON-CONTROLLING INTEREST
2020 2019UNBL45%
UBL FM1.13% Total UNBL
45% UBL FM
1.13% Total
Assets 131,552,572 2,825,139 134,377,711 104,270,398 2,363,489 106,633,887Liabilities 114,916,979 934,432 115,851,411 88,284,204 587,563 88,871,767Net assets 16,635,593 1,890,707 18,526,300 15,986,194 1,775,926 17,762,120
Net assets attributable to NCI 7,486,017 21,365 7,507,382 7,193,787 20,068 7,213,855
2020UNBL45%
UBL FM1.13% Total
25.1 Key financial information
Income (Mark-up & Non-Mark-up) 2,629,764 928,300 3,558,064Expenses (including provisions) (2,969,590) (615,216) (3,584,806)Profit for the year (339,826) 313,084 (26,742)Other comprehensive income for the year 989,244 879 990,123Total Comprehensive Income 649,418 313,963 963,381
(Loss) / profit allocated to NCI (152,922) 3,538 (149,384)
OCI allocated to NCI 445,160 11 445,171
Cash flow from operating activities 5,477,010 247,743 5,724,753Cash flow from investing activities (2,599,316) (47,006) (2,646,322)Cash flow from financing activities (3,794,309) (200,000) (3,994,309)
(916,615) 737 (915,878)
------ (Rupees in '000) ------
------- (Rupees in '000) ------- ------- (Rupees in '000) -------
------- (Rupees in '000) -------
43
215Annual Report 2020
Notes to and forming part of the Consolidated Financial StatementsFor the year ended December 31, 2020

NOTES TO AND FORMING PART OF THE CONSOLIDATED FINANCIAL STATEMENTS FOR THE YEAR ENDED DECEMBER 31, 2020
Note 2020 2019
26. CONTINGENCIES AND COMMITMENTS
- Guarantees 26.1 147,961,658 170,755,664- Commitments 26.2 970,991,372 1,278,107,824- Other contingent liabilities 26.3 15,554,510 15,089,090
1,134,507,540 1,463,952,578
2020 201926.1 Guarantees:
Financial guarantees 43,053,322 41,444,410Performance guarantees 104,908,336 129,311,254
147,961,658 170,755,664
26.2 Commitments:
Documentary credits and short-term trade-related transactions- letters of credit 160,344,833 168,383,418
Commitments in respect of:- forward foreign exchange contracts 26.2.2 683,065,647 962,345,777- forward government securities transactions 26.2.3 - 14,307,720- derivatives
Interest rate swaps 26.2.4 - 316,500FX options 26.2.4 - 122,594
- forward lending 26.2.5 124,510,935 130,389,022- operating leases 26.2.6 126,093 190,863
Commitments for acquisition of:- operating fixed assets 26.2.7 2,876,499 2,031,196- intangible assets 26.2.7 - 7,103
Others 67,365 13,631970,991,372 1,278,107,824
26.2.1 Commitments to extend credit
2020 2019
26.2.2 Commitments in respect of forward foreign exchange contracts
Purchase 366,797,666 508,996,241Sale 316,267,981 453,349,536
26.2.3 Commitments in respect of forward government securities transactions
Purchase - 3,043,541Sale - 11,264,179
26.2.4 Commitments in respect of derivatives
Interest rate swaps - 316,500FX options - purchased - 61,297FX options - sold - 61,297
------- (Rupees in '000) -------
------- (Rupees in '000) -------
------- (Rupees in '000) -------
The Group makes commitments to extend credit in the normal course of its business but these being revocablecommitments do not attract any significant penalty or expense if the facility is unilaterally withdrawn.
44United Bank Limited216
Notes to and forming part of the Consolidated Financial StatementsFor the year ended December 31, 2020

NOTES TO AND FORMING PART OF THE CONSOLIDATED FINANCIAL STATEMENTS FOR THE YEAR ENDED DECEMBER 31, 2020
Note 2020 201926.2.5 Commitments in respect of forward lending
Undrawn formal standby facilities, credit lines and othercommitments to lend 26.2.5.1 66,651,116 71,503,628
Others 57,859,819 58,885,394124,510,935 130,389,022
26.2.5.1
Note 2020 201926.2.6 Commitments in respect of operating leases
Not later than one year 58,443 48,366 Later than one year and not later than five years 37,620 69,053 Later than five years 30,030 73,444
126,093 190,863
26.2.7 Commitments in respect of capital expenditure 2,876,499 2,038,299
26.3 Other contingencies
Claims against the Group not acknowledged as debts 26.3.1 11,465,207 10,999,787
26.3.1
26.3.2
26.3.3
26.4 For contingencies relating to taxation, refer note 15.2.
27. DERIVATIVE INSTRUMENTS
With regard to derivatives, the RMC is authorised to:
These represent commitments that are irrevocable because they cannot be withdrawn at the discretion of the Bankwithout the risk of incurring significant penalty or expense.
------- (Rupees in '000) -------
These mainly represent counter claims filed by the borrowers for restricting the Group from disposal of assets (such asmortgaged / pledged assets kept as security).
Based on legal advice and / or internal assessments, management is confident that the matters will be decided in favourof the Group and the possibility of any outcome against the Group is remote and accordingly no provision has been madein these consolidated financial statements.
The authority for approving policies lies with the Board of Directors (BoD) and the Board Risk and Compliance Committee(BRCC). The Risk Management Committee (RMC) is responsible for ensuring compliance with these policies.
During 2016, penalties amounting to Rs. 4.089 billion were levied by the FE Adjudication Court of the State Bank ofPakistan relating to alleged contraventions of the requirements of foreign exchange regulations with respect to issuanceand certification of E-Forms by the Bank to certain customers (exporters) who failed to submit the export documentsthere against. Consequently, foreign exchange on account of export proceeds have not been repatriated. The Bankmaintains that it fully discharged its liability, in accordance with the law and has filed a civil suit in the High Court of Sindhchallenging the levy of the penalty. The High Court has granted a stay on action being taken against the Bank. Themanagement, based on the advice from legal counsel, is confident that the view of the Bank will prevail and the Bank willnot be exposed to any loss on this account.
------- (Rupees in '000) -------
Punjab revenue authority issued show cause notice to UBL Fund Managers Limited requiring them to pay sales tax underPunjab sales tax on Service Act 2012 on management fee earned in Punjab from May 22, 2013. The Company has fileda petition on July 8, 2015, in the High Court of Sindh. A favorable outcome of this petition is expected.
The Bank, as an Authorised Derivative Dealer (ADD), is an active participant in the Pakistan derivatives market andoffers a wide variety of derivatives products covering both hedging and market making to satisfy customers’ needs.Where required, specific approval is sought from the SBP for each transaction.
Derivatives are a type of financial contract, the value of which is determined by reference to one or more underlyingassets or indices. The major categories of such contracts include forwards, futures, swaps and options. Derivatives alsoinclude structured financial products that have one or more of the characteristics of forwards, futures, swaps and options.
45 217Annual Report 2020
Notes to and forming part of the Consolidated Financial StatementsFor the year ended December 31, 2020

NOTES TO AND FORMING PART OF THE CONSOLIDATED FINANCIAL STATEMENTS FOR THE YEAR ENDED DECEMBER 31, 2020
-
- Review the Derivatives Business Policy and recommend approval to the BRCC / BoD.
- Review and approve derivatives product programs.
- Authorise changes in procedures and processes regarding derivatives and structured products.
Derivatives risk management
There are a number of risks undertaken by the Group, which need to be monitored and assessed.
Credit risk
Market risk
Liquidity risk
Derivatives transactions, usually being non-funded in nature, do not carry a specific funding liquidity risk.
Operational risk
Credit risk refers to the risk of non-performance or default by a party to a derivatives transaction, resulting in an adverseimpact on the Group’s profitability. Credit risk associated with derivatives transactions is categorised into settlement riskand pre-settlement risk. Credit proposals for derivatives transactions are approved by the Credit Committee. The creditexposure of each counterparty is estimated and monitored against approved counterparty limits by TMO on a daily basis.
The Group, as a policy, hedges back-to-back all Options transactions. In addition, the Group does not carry anyexchange risk on its Cross Currency Swaps portfolio as it hedges the exposure in the interbank market. To manage theinterest rate risk of Interest Rate Derivatives, the Group has implemented various limits which are monitored and reportedby TMO on a daily basis.
The liquidity risk arises from the fact that in Pakistan, interest rate derivatives generally have a uni-directional demand,and no perfect hedge is available. The Group mitigates its risk by limiting the portfolio in terms of tenor, notional andsensitivity limits, and can also hedge its risk by taking on and off-balance sheet positions in the interbank market, whereavailable.
The staff involved in the trading, settlement and risk management of derivatives are carefully trained to deal with thecomplexities involved in the process. Adequate systems and controls are in place to carry out derivatives transactionssmoothly. Each transaction is processed in accordance with the product program or a transaction memo, which containsdetailed guidance on the accounting and operational aspects of the transaction to further mitigate operational risk. Inaddition, TMO and the Compliance and Control Department are assigned the responsibility of monitoring any deviationfrom policies and procedures. The Group’s Audit and Inspection group also reviews this function, with a regular review ofsystems, transactional processes, accounting practices and end-user roles and responsibilities.
The Group uses FX and Derivatives module of Treasury System which provides an end-to-end valuation solution,supports the routine transactional process and provides analytical tools to measure various risk exposures, carry outstress tests and sensitivity analysis.
TMO produces various reports on a periodic basis which are reviewed by senior management. These reports providedetails of the derivatives business profile such as outstanding positions, profitability, risk exposures and the status ofcompliance with limits.
Review the derivatives business with reference to market risk exposure and assign various limits in accordance withthe risk appetite of the Bank.
Overall responsibility for derivatives trading activity lies with the Treasury and Capital Markets Group. Measurement andmonitoring of market and credit risk exposure and limits and its reporting to senior management and the BoD is done byTreasury Middle Office (TMO), which also coordinates with the business regarding approvals for derivatives risk limits.Treasury Operations records derivatives activity in the Bank’s books, and handles its reporting to the SBP.
46
United Bank Limited218
Notes to and forming part of the Consolidated Financial StatementsFor the year ended December 31, 2020

NOTES TO AND FORMING PART OF THE CONSOLIDATED FINANCIAL STATEMENTS FOR THE YEAR ENDED DECEMBER 31, 2020
27.1 Product analysis
Counterparties
With banks for Hedging - - - - - - - - - - Market making - - - - - - - - - -
- - - - - - - - - - With FIs other than Banks
Hedging - - - - - - - - - - Market making - - - - - - - - - -
- - - - - - - - - - With other entities
Hedging - - - - - - - - - - Market making - - - - - - - - - -
- - - - - - - - - - Total
Hedging - - - - - - - - - - Market making - - - - - - - - - -
- - - - - - - - - -
Counterparties
With banks for Hedging - - 61,297 - - - - - 61,297 - Market making 316,500 (17,107) - - - - 9,223,670 14,850 9,540,170 (2,257)
316,500 (17,107) 61,297 - - - 9,223,670 14,850 9,601,467 (2,257) With FIs other than Banks
Hedging - - - - - - - - - - Market making - - - - - - 1,763,180 (488) 1,763,180 (488)
- - - - - - 1,763,180 (488) 1,763,180 (488)With other entities
Hedging - - - - - - - - - - Market making - - 61,297 - 3,042,465 (94) 273,596 (100) 3,377,358 (194)
- - 61,297 - 3,042,465 (94) 273,596 (100) 3,377,358 (194)Total
Hedging - - 61,297 - - - - - 61,297 - Market making 316,500 (17,107) 61,297 - 3,042,465 (94) 11,260,446 14,262 14,680,708 (2,939)
316,500 (17,107) 122,594 - 3,042,465 (94) 11,260,446 14,262 14,742,005 (2,939)
27.2 Maturity analysis of derivatives
(Loss) Gain Net (Loss) Gain Net
Upto 1 month - - - - - 13 14,425,505 (1,048) 15,216 14,1681 to 3 months - - - - - - - - - - 3 to 6 months - - - - - - - - - - 6 months to 1 year - - - - - 1 316,500 (17,107) - (17,107)1 to 2 years - - - - - - - - - - 2 to 3 Years - - - - - - - - - -
- - - - - 14 14,742,005 (18,155) 15,216 (2,939)
---------------------------------------------------------------------------- (Rupees in 000) ----------------------------------------------------------------------------
Interest rate swaps / cross currency swaps FX options
Forward purchase contracts of government
securities
Forward sale contracts of government securities Total
Notional principal
Mark to market gain
/ (loss)
Notional principal
Mark to market gain
/ (loss)
Notional principal
Mark to market gain
/ (loss)
Notional principal
Mark to market gain
/ (loss)
Notional principal
Mark to market gain
/ (loss)
2019
Notional principal
Mark to market gain
/ (loss)
Notional principal
Mark to market gain
/ (loss)
Notional principal
Mark to market gain
/ (loss)
Notional principal
Mark to market gain
/ (loss)
Notional principal
Mark to market gain
/ (loss)---------------------------------------------------------------------------- (Rupees in 000) ----------------------------------------------------------------------------
2020
Interest rate swaps / cross currency swaps FX options
Forward purchase contracts of government
securities
Forward sale contracts of government securities Total
----------------------------- (Rupees in '000) --------------------------
2020Remaining maturity Number of
contractsNotional principal
Unrealised
------------------------------ (Rupees in '000) --------------------------
2019Number of contracts
Notional principal
Unrealised
47
219Annual Report 2020
Notes to and forming part of the Consolidated Financial StatementsFor the year ended December 31, 2020

NOTES TO AND FORMING PART OF THE CONSOLIDATED FINANCIAL STATEMENTS FOR THE YEAR ENDED DECEMBER 31, 2020
Note 2020 201928. MARK-UP / RETURN / INTEREST EARNED
Loans and advances 54,825,270 68,189,538Investments 98,053,683 81,855,592Lendings to financial institutions 2,634,660 5,990,798Balances with banks 565,174 1,241,925
156,078,787 157,277,853
29. MARK-UP / RETURN / INTEREST EXPENSED
On deposits 62,102,063 67,611,116On borrowings 11,351,528 18,674,154On subordinated debt 1,099,595 1,339,041Cost of foreign currency swaps against foreign currency deposits / borrowings 3,526,540 5,244,190On lease liability against right-of-use assets 925,848 1,068,434
79,005,574 93,936,93530. FEE AND COMMISSION INCOME
Branch banking customer fees 1,734,499 2,094,255Consumer finance related fees 1,000,321 1,072,440Card related fees (debit and credit cards) 2,204,290 2,385,761Investment banking fees 329,561 390,261Financial Institution rebate / commission 280,324 298,616Corporate service charges / facility fee 410,214 644,616Commission on trade 594,536 939,656Commission on guarantees 751,361 556,635Commission on cash management 846,302 783,970Commission on remittances including home remittances - net 2,267,149 3,036,593Commission on bancassurance 1,170,790 1,612,583Commission on Benazir Income Support Program 38,145 609,932Management fee 707,413 800,997Rent on lockers 189,943 93,182Others 305,238 405,580
12,830,086 15,725,07731. GAIN ON SECURITIES - NET
Realised 31.1 610,002 224,056Unrealised - held for trading 228 (7,386)
610,230 216,67031.1 Realised gain / (loss) on:
Federal Government securities (893,939) 864,370Shares 671,556 (1,014,879)Foreign securities 833,927 381,560Other securities (1,542) (6,995)
610,002 224,05632. OTHER INCOME
Charges recovered 285,249 288,777Rent on properties 38,688 85,213Gain on sale of operating fixed assets - net 69,565 120,056Gain on sale of Ijarah assets 792 861Gain / (loss) on sale of non-banking assets 32.1 191,559 (54,649)Gain / (loss) on trading liabilities - net 101,445 (13,639)Realisation of exchange translation reserve - UBL New York branch - 1,332,626
687,298 1,759,245
------- (Rupees in '000) -------
48
United Bank Limited220
Notes to and forming part of the Consolidated Financial StatementsFor the year ended December 31, 2020

NOTES TO AND FORMING PART OF THE CONSOLIDATED FINANCIAL STATEMENTS FOR THE YEAR ENDED DECEMBER 31, 2020
Note 2020 2019
32.1 Gain / (loss) on sale of non-banking assets acquiredin satisfaction of claims
Disposal proceeds 1,038,100 714,397Less: - Cost 798,610 654,662 - Surplus 47,931 114,384
846,541 769,046Net gain / (loss) 191,559 (54,649)
33. OPERATING EXPENSES
Total compensation expense 33.1 17,653,169 16,681,503
Property expenseRent and taxes 33.8 1,208,950 1,416,403 Insurance 234,546 203,051 Utilities cost 1,451,729 1,734,851 Security 1,016,246 987,716 Repairs and maintenance 177,345 253,487 Depreciation 832,999 818,668 Depreciation - right-of-use assets 1,662,049 2,112,273 Others 42,162 52,579
6,626,026 7,579,028 Information technology expensesSoftware maintenance 1,512,651 1,320,897 Hardware maintenance 572,043 438,060 Depreciation 855,627 770,821 Amortisation 12.1 855,574 701,155 Network charges 755,059 743,049
4,550,954 3,973,982 Other operating expensesDirectors' fees and allowances 122,734 96,075 Fees and allowances to Shariah Board 9,544 6,855 Legal and professional charges 748,442 1,289,918 Outsourced service costs including sales commission 3,013,052 3,900,348 Travelling and conveyance 157,708 283,983 Clearing charges 225,278 216,365 Depreciation others 1,222,540 1,216,702 Depreciation on Islamic financing against leased assets 216,195 227,783 Training and development 98,135 174,897 Postage and courier charges 306,072 396,138 Communication 520,961 534,188 Stationery and printing 967,386 722,049 Marketing, advertisement and publicity 648,028 795,293 Auditors' remuneration 33.6 129,415 113,386 Donations 33.7 342,245 129,497 Insurance (including deposit protection) 1,602,360 1,445,485 Cash transportation and sorting charges 805,942 820,254 Entertainment 152,567 180,327 Vehicle expenses 91,013 108,291 Subscription 217,201 214,376 Office running expenses 177,247 179,485 Banking service charges 1,742,317 1,886,427 Repairs and maintenance 661,209 578,158 Miscellaneous expenses 735,304 92,795
14,912,895 15,609,075 43,743,044 43,843,588
------- (Rupees in '000) -------
49
221Annual Report 2020
Notes to and forming part of the Consolidated Financial StatementsFor the year ended December 31, 2020

NOTES TO AND FORMING PART OF THE CONSOLIDATED FINANCIAL STATEMENTS FOR THE YEAR ENDED DECEMBER 31, 2020
Note 2020 201933.1 Total compensation expense
Fees and Allowances etc 2,614,509 2,599,093 Managerial remunerationi) Fixed 8,166,684 7,375,044 ii) Variable - Cash Bonus / Awards etc. 33.2 1,105,114 1,003,182 Charge for defined benefit plan 588,091 563,113 Contribution to defined contribution Plan 518,344 498,894 Charge for compensated absences 70,902 33,383 Rent & house maintenance 2,327,467 2,145,347 Utilities 1,236,215 1,138,876 Medical 813,484 822,453 Conveyance 389,918 382,713 Group assurance premium 64,018 71,223 Others (360,577) 17,141 Sub-total 17,534,169 16,650,462 Sign-on Bonus 33.3 119,000 - Severance Allowance 33.4 - 31,041 Grand Total 17,653,169 16,681,503
33.2
33.3
33.4
33.5
The material outsourcing arrangements along with their nature of services are as follows:
Name of service provider Type of service 2020 2019
Paradise Press (Private) Limited Cheque printing 40,699 40,652
Apex Printry (Private) Limited Cheque printing 45,096 43,254
Printlink Cheque printing 40,890 37,140
ASC First Solution (Private) Limited Digital & phsyical archiving of accountsopening forms and customer records 5,764 7,302
Wackenhut Pakistan (Private) Limited Off-site ATM cash replenishment 1,098 -
Raaziq International Storage and archiving service foraccounts opening forms 14,418 13,254
Qadri Enterprises Key Punch 9,710 10,065
TCS (Private) Limited Statement of account printing and dispatching 73,083 77,888
Total cost for the year included in other operating expenses relating to outsourced activities is Rs. 1,562.759 million (2019:Rs. 4,044.555 million). This cost includes outsourced service costs, which are disclosed specifically in note 30. Of the totalcost of Rs. 1,562.759 million (2019: Rs. 4,044.555 million), Rs. 1,246.759 million (2019: Rs. 3,653.555 million) pertains tothe payment to companies incorporated in Pakistan and Rs. 316 million (2019: Rs. 391 million) pertains to payment tocompanies incorporated outside Pakistan. This includes payments other than outsourced services costs, which aredisclosed above. Total cost of outsourced activities for the year given to related parties is nil (2019: nil). Outsourcing shallhave the same meaning as specified in Annexure-I of BPRD Circular No. 06 of 2017.
------- (Rupees in '000) -------
------- (Rupees in '000) -------
This includes accrual of employee benefits in the form of awards / bonus to all permanent staff including the ChiefExecutive Officer and is determined on the basis of employees' evaluation and the Bank's performance during the year.The aggregate benefit determined in respect of all permanent staff amounted to Rs. 1,546.639 million (2019: Rs.1,242.046million).
No sign-on bonus was paid to employees including Material Risk Contollers (MRCs) and Material Risk Takers (MRTs)during the years ended December 31, 2020 and 2019.
Severance allowance is paid to nil (2019: 10) employees. No severance allowance was paid to MRCs and MRTs during theyears ended December 31, 2020 and 2019.
50United Bank Limited222
Notes to and forming part of the Consolidated Financial StatementsFor the year ended December 31, 2020

NOTES TO AND FORMING PART OF THE CONSOLIDATED FINANCIAL STATEMENTS FOR THE YEAR ENDED DECEMBER 31, 2020
33.6 Auditors' remuneration A.F. Ferguson Overseas & Co. Auditors
Audit fee - Bank 12,393 47,063 59,456 Audit fee - subsidiaries 1,572 42,574 44,146 Fees for tax and other certifications 12,214 - 12,214 Out of pocket expenses 6,696 2,157 8,853 Consultancy and other services 4,746 - 4,746
37,621 91,794 129,415
A.F. Ferguson Overseas & Co. Auditors
Audit fee - Bank 11,340 48,050 59,390 Audit fee - subsidiaries 1,574 31,717 33,291 Fees for tax and other certifications 11,498 888 12,386 Out of pocket expenses 6,087 254 6,341 Consultancy and other services 1,978 - 1,978
32,477 80,909 113,386
33.7 Details of donations 2020 2019
Donations individually exceeding Rs. 0.5 millionPMs COVID-19 Pandemic Relief Fund – 2020 100,000 - Namal Educational Foundation 95,000 - Abdul Sattar Edhi Foundation 43,000 33,000 Shaukat Khanum Memorial Trust 33,000 33,000 Saylani Welfare International Trust 25,000 - Noor International 11,200 - Sahara for Life Trust 10,000 10,000 Lahore University of Management Sciences 10,000 10,000 Shalamar Hospital 5,000 5,000 Forman Christian College 5,000 5,000 IBA - National Talent Hunt Program 3,436 3,880 Marie Adelaide Leprosy Center 850 850 SOS Children's Village Pakistan - 9,980 Bahauddin Zakariya University - 3,840 The Citizens Foundation - 2,800 Zindagi Trust - 2,500 Center of Excellence in Journalism (IBA) - 2,000 Kashmir Education Foundation - 1,710 Nasra Schools - 1,482 People’s Primary Healthcare Initiative - 1,300 Chal Foundation - 1,000 Hisaar Foundation - 1,000
Donations individually not exceeding Rs. 0.5 million 759 1,155 342,245 129,497
----------------------- (Rupees in '000) ----------------------
------- (Rupees in '000) -------
Total
Total
2020
2019
----------------------- (Rupees in '000) ----------------------
51 223Annual Report 2020
Notes to and forming part of the Consolidated Financial StatementsFor the year ended December 31, 2020

NOTES TO AND FORMING PART OF THE CONSOLIDATED FINANCIAL STATEMENTS FOR THE YEAR ENDED DECEMBER 31, 2020
33.7.1 Donations were not made to any donee in which a Director or his spouse had any interest.
33.8
34. WORKERS' WELFARE FUND
Note 2020 2019
35. OTHER CHARGES
Penalties imposed by the SBP 163,940 39,233 Other penalties 3,395 876
167,335 40,109
36. PROVISIONS AND WRITE-OFFS - NET
Provision against loans and advances - net 10.4 16,139,278 4,844,765 Provision for diminution in value of investments - net 9.3.1 826,795 2,392,687 Bad debts written off directly 143,246 149,591 Provision against other assets - net 15.4.1 154,855 254,140 Provision against off-balance sheet obligations - net 22.1 431,749 47,438 Recovery of written off / charged off bad debts (494,488) (526,059) Other provisions / write-offs 54,243 150,981
17,255,678 7,313,543
37. TAXATION
Current 17,384,124 14,969,071 Prior years (11,001) 733,273 Deferred (3,795,843) (245,186)
13,577,280 15,457,158
37.1 Relationship between tax expense and accounting profit
Accounting profit for the year 34,382,187 35,730,654
Tax on income @ 35% (2019: 35%) 12,033,765 12,505,729 Super tax @ 4% (2019 : 4%) 1,367,699 1,369,675 Tax effect of items that are either not included in determining taxable
profit or taxed at reduced rates (permanent differences) 71,429 (201,686)Impact of different tax rates of subsidiaries (permanent differences) 54,403 41,696Tax - prior years (net of deferred tax) (11,001) 1,614,326Others 60,985 127,418Tax charge 13,577,280 15,457,158
This includes expense in respect of short term leases, low value assets and expenses relating to variable lease paymentsnot included in lease liabilites amounting to Rs. 24.687 million (2019: Rs. 29.312 million), Rs. 0.007 million (2019: Rs.0.007 million) and nil (2019: nil) respectively.
The Bank has made provision for Sindh Workers' Welfare Fund (SWWF) based on profit for the years ended December31, 2014 and onwards. The Sindh Workers' Welfare Fund was levied from the year ended December 31, 2014,consequent to the 18th amendment in the constitution, the chargeability has been challenged before the Sindh HighCourt by filing a constitional petition, however, provision pertaining to years 2014 onwards has been maintained inrespect of Sindh WWF. Matter is pending before Sindh High Court.
------- (Rupees in '000) -------
52United Bank Limited224
Notes to and forming part of the Consolidated Financial StatementsFor the year ended December 31, 2020

NOTES TO AND FORMING PART OF THE CONSOLIDATED FINANCIAL STATEMENTS FOR THE YEAR ENDED DECEMBER 31, 2020
38. EARNINGS PER SHARE
Profit after tax attributable to equity shareholders of the Bank
Weighted average number of ordinary shares
Earnings per share - basic and diluted
38.1 There were no convertible dilutive potential ordinary shares outstanding as at December 31, 2020 and 2019.
Note
39. CASH AND CASH EQUIVALENTS
Cash and balances with treasury banks 6Balances with other banks 7
39.1 Reconciliation of movement of liabilities to cash flows arising from financing activities
Balance as at January 1, 2020 22,929,220 170,405,060 1,557,995,306 10,000,000 70,617,522 12,241,797 66,676,412 27,404,558 77,335,249
Changes from financing cash flowsDividend Paid - - - - - - - - (8,138,474)
Other Changes - - - - 1,993,093 - 2,233,579 1,929,654 20,260,423
Liability-relatedChanges in bills payable 6,811,986 - - - - - - - - Changes in borrowings - (38,577,875) - - - - - - - Changes in deposits and other accounts - - 206,396,980 - - - - - - Changes in subordinated debt - - - - - - - - - Changes in other liabilities- Cash based - - - - (14,508,286) - - - - -Dividend payable - - - - 181,306 - - - 181,306- Non-cash based - - - - - - - - - Transfer of profit to reserve - - - - - - 2,110,595 - (2,110,595)Total Liability related other changes 6,811,986 (38,577,875) 206,396,980 - (14,326,980) - 2,110,595 - (1,929,289)Total Equity related other changes - - - - - - - - -
Balance as at December 31, 2020 29,741,206 131,827,185 1,764,392,286 10,000,000 58,283,635 12,241,797 71,020,586 29,334,212 87,527,909
40. STAFF STRENGTH
PermanentOn contractGroup's own staff strengthOutsourcedTotal
40.1 Number of employees working domestically 13,366 (2019: 13,657) and abroad 119 (2019: 113).
11,556 41
------------ (Number) ------------
258,139,459
------- (Rupees in '000) -------2019
243,370,701
13,770
42,958,67729,583,028287,722,487 286,329,378
11,597 1,888
13,485
2019
11,475 56
11,531 2,239
2020
------------ (Rupees) ------------
---------------------------------------- (Rupees in '000) --------------------------------------
Liabilities Equity
Bills payable Borrowings
Deposits and other
accounts
Subordina-ted debt
Other liabilities
Share capital Reserves
Surplus on revaluation of assets
Unappropri-ated profit
2020
19,095,141
1,224,179,687
----- (Number of shares) -----
15.60
2020
20,937,918
1,224,179,687
17.10
------- (Rupees in '000) -------2019
53225Annual Report 2020
Notes to and forming part of the Consolidated Financial StatementsFor the year ended December 31, 2020

NOTES TO AND FORMING PART OF THE CONSOLIDATED FINANCIAL STATEMENTS FOR THE YEAR ENDED DECEMBER 31, 2020
41. DEFINED BENEFIT PLANS
41.1 The Bank (Holding Company)
41.1.1 General description
41.1.2 Number of Employees under the scheme
The number of employees covered under the following defined benefit schemes are:2020 2019
Pension fund 7,049 7,064Gratuity fund 10,083 9,856Benevolent fund 1,982 3,383Employee compensated absences 1,258 1,417Post-retirement medical benefit scheme 7,346 8,503
41.1.3 Principal actuarial assumptions
The actuarial valuations were carried out as at December 31, 2020, using the following significant assumptions:
2020 2019
Discount rate / expected rate of return on plan assets 9.75% 11.25%Expected rate of salary increase 7.75% 9.25%Expected rate of increase in pension 5.00% 5.00%Expected rate of increase in medical benefit 3.75% 5.25%
41.1.4 Reconciliation of payable to / (receivable from) defined benefit plans
Note
Pension fund
Gratuity fund
Benevolent fund
Post-retirement
medical benefit
Pension fund
Gratuity fund
Benevolent fund
Post-retirement
medical benefit
Present value of obligations 11,604,939 1,049,184 331,363 2,028,687 10,098,497 911,763 329,300 1,950,906Fair value of plan assets (10,521,021) (1,015,218) (330,708) - (9,318,843) (968,544) (424,706) - Payable / (receivable) 1,083,918 33,966 655 2,028,687 779,654 (56,781) (95,406) 1,950,906
41.1.5 Movement in defined benefit obligations
Obligations at the beginning of the year 10,098,497 911,763 329,300 1,950,906 8,986,977 831,363 321,682 1,821,847Service cost 23,856 152,839 4,109 524 19,957 145,775 4,463 687Interest cost 994,529 105,266 34,197 213,970 989,305 112,796 39,045 235,459Benefits paid by the Bank (901,142) (126,864) (42,236) (97,195) (730,840) (139,740) (62,976) (129,591)Return allocated to other funds 41.1.8.2 58,882 - - - 73,834 - - - Re-measurement loss / (gain) 1,330,317 6,180 5,993 (39,518) 759,264 (38,431) 27,086 22,504Obligations at the end of the year 11,604,939 1,049,184 331,363 2,028,687 10,098,497 911,763 329,300 1,950,906
The Bank operates a funded pension scheme established in 1975. The Bank also operates a funded gratuity scheme fornew employees and for those employees who have not opted for the pension scheme. The Bank also operates abenevolent fund scheme and provides post retirement medical benefits to eligible retired employees. The benevolentfund scheme and the post-retirement medical scheme cover all regular employees of the Bank who joined the Bank pre-privatisation. The liabilities of the Bank in respect of these schemes are determined based on actuarial valuations carriedout using the Projected Unit Credit Method. Actuarial valuations of the defined benefit schemes are carried out every yearand the latest valuation was carried out as at December 31, 2020.
------ (Number) -----
----- Per annum ----
The pension fund, benevolent fund and post-retirement medical benefit schemes include 2,243 (2019: 2,162), 955 (2019:942) and 2,448 (2019: 2,501) members respectively who have retired or whose widows are receiving the benefits.
2020 2019
------------------------------------------------------------- (Rupees in '000) -------------------------------------------------------------
54United Bank Limited226
Notes to and forming part of the Consolidated Financial StatementsFor the year ended December 31, 2020

NOTES TO AND FORMING PART OF THE CONSOLIDATED FINANCIAL STATEMENTS FOR THE YEAR ENDED DECEMBER 31, 2020
Note
Pension fund
Gratuity fund
Benevolent fund
Post-retirement
medical benefit
Pension fund
Gratuity fund
Benevolent fund
Post-retirement
medical benefit
41.1.6 Movement in fair value of plan assets
Fair value at the beginning of the year 9,318,843 968,544 424,706 - 8,168,441 805,576 461,597 - Interest income on plan assets 996,935 111,322 44,373 - 1,034,319 109,585 56,465 - Contribution by the Bank 877,014 92,184 1,601 - 849,453 180,780 1,840 - Contribution by the employees - - 1,601 - - - 1,840 - Amount paid by the fund to the Bank (703,722) (125,781) (137,717) - (645,000) (129,306) (97,748) - Re-measurements gain / (loss) 31,951 (31,051) (3,856) - (88,370) 1,909 712 - Fair value at the end of the year 10,521,021 1,015,218 330,708 - 9,318,843 968,544 424,706 -
41.1.7 Movement in payable / (receivable)under defined benefit schemes
Opening balance 779,654 (56,781) (95,406) 1,950,906 818,536 25,787 (139,915) 1,821,847Mark-up receivable on Bank's balance with the fund (9,749) (310) (539) - (8,944) (189) (5,368) - Charge / (reversal) for the year 80,332 146,783 (7,668) 214,494 48,777 148,986 (14,797) 236,146Contribution by the Bank (877,014) (92,184) (1,601) - (849,453) (180,780) (1,840) - Amount paid by the Fund to the Bank 703,722 125,781 137,717 - 645,000 129,306 97,748 - Benefits paid by the Bank (901,142) (126,864) (42,236) (97,195) (730,840) (139,740) (62,976) (129,591)Remeasurement loss / (gain) recognised in
OCI during the year 1,308,115 37,541 10,388 (39,518) 856,578 (40,151) 31,742 22,504Closing balance 1,083,918 33,966 655 2,028,687 779,654 (56,781) (95,406) 1,950,906
41.1.8 Charge for defined benefit plans
41.1.8.1 Cost recognised in profit and loss
Current service cost 41.1.5 23,856 152,839 4,109 524 19,957 145,775 4,463 687Past service cost - - - - - - - - Net interest on defined benefit asset / (liability) (2,406) (6,056) (10,176) 213,970 (45,014) 3,211 (17,420) 235,459Return allocated to other funds 41.1.8.2 58,882 - - - 73,834 - - - Employees' contribution - - (1,601) - - - (1,840) -
80,332 146,783 (7,668) 214,494 48,777 148,986 (14,797) 236,146
41.1.8.2
Pension fund
Gratuity fund
Benevolent fund
Post-retirement
medical benefit
Pension fund
Gratuity fund
Benevolent fund
Post-retirement
medical benefit
41.1.9 Re-measurements recognised in OCI during the year
Loss / (gain) on obligation- Financial assumptions 1,379,653 (9,341) 28,729 153,627 1,401,522 (10,623) 28,103 399,959- Experience adjustments (49,336) 15,521 (22,736) (193,145) (642,258) (27,808) (1,017) (377,455)
Return on plan assets over interest income (31,951) 31,051 3,856 - 88,370 (1,909) (712) - Adjustment for mark-up 9,749 310 539 - 8,944 189 5,368 - Total re-measurements recognised in OCI 1,308,115 37,541 10,388 (39,518) 856,578 (40,151) 31,742 22,504
2019
------------------------------------------------------------- (Rupees in '000) -------------------------------------------------------------
2020
This represents return allocated to those employees who exercised the conversion option offered in the year 2001, asreferred to in note 5.12.1.
------------------------------------------------------------- (Rupees in '000) -------------------------------------------------------------
2020 2019
55 227Annual Report 2020
Notes to and forming part of the Consolidated Financial StatementsFor the year ended December 31, 2020

NOTES TO AND FORMING PART OF THE CONSOLIDATED FINANCIAL STATEMENTS FOR THE YEAR ENDED DECEMBER 31, 2020
41.1.10 Components of plan assetsPension fund Gratuity fund Benevolent
fund Pension fund Gratuity fund Benevolent fund
Cash and cash equivalents - net of currentliabilities 236,332 103,110 27,891 801,016 151,344 106,984
Quoted securitiesOrdinary shares 89,090 5,483 12,491 116,441 7,137 16,321Term finance certificates 244,257 23,270 11,893 53,203 26,873 20,232
Mutual Funds units 167,165 16,737 - - 35,077 - Pakistan Investment Bonds 4,970,102 316,307 133,864 4,512,007 314,689 134,818Market Treasury Bills 3,306,798 539,015 135,330 3,446,115 433,424 - Special Savings Certificates - - - - - 140,151National Saving Certificates / Bonds 1,507,277 11,103 2,830 - - - Repurchase Agreements - 193 - - - - Term deposits - - 6,409 390,061 - 6,200
10,521,021 1,015,218 330,708 9,318,843 968,544 424,706####### (409,974) (836,962)
41.1.10.1
41.1.11 Sensitivity analysis
Increase in discount rate by 1 % (955,565) (69,878) (17,184) (209,939)Decrease in discount rate by 1 % 1,126,711 79,657 11,910 253,902Increase in expected future increment in salary by 1% - 85,670 - - Decrease in expected future increment in salary by 1% - (76,263) - - Increase in expected future increment in pension by 1% 1,118,891 - - - Decrease in expected future increment in pension by 1% (965,068) - - - Increase in expected future increment in medical benefit by 1% - - - 232,951Decrease in expected future increment in medical benefit by 1% - - - (198,687)
41.1.12 Expected contributions to be paid to the funds in the next financial year
Expected contribution - - 1,499 -
Expected charge for the year 109,601 167,443 2,479 193,055
41.1.13 Maturity profile
The weighted average duration of the obligation (in years) 9.36 7.09 4.23 7.93
-------------------------------------------------------------- (Rupees in '000) --------------------------------------------------------------
The Funds primarily invests in Government securities and accordingly do not carry any significant credit risk. These aresubject to interest rate risk based on market movements. Investment in term finance certificates are subject to credit riskand interest rate risks, while equity securities are subject to price risk. These risks are regularly monitored by Trusteesof the employee funds.
Sensitivity analysis has been performed by varying one assumption keeping all other assumptions constant andcalculating the impact on the present value of the defined benefit obligations under the various employee benefitschemes. The increase / (decrease) in the present value of defined benefit obligations as a result of change in eachassumption is summarised below:
2020Pension fund Gratuity fund Benevolent
fundPost retirement medical benefit
2020 2019
---------------------------------------- (Rupees in '000) ------------------------------------
2020
Pension fund Gratuity fund Benevolent fund
Post retirement medical benefit
---------------------------------------- (Rupees in '000) ------------------------------------
Although the analysis does not take account of the full distribution of expected cash flows, it does provide anapproximation of the sensitivity of the assumptions shown.
The Bank contributes to the pension and gratuity funds according to the actuary's advice. Contribution to the benevolentfund is made by the Bank as per the rates set out in the benevolent fund scheme. Based on actuarial advice,management estimates that the expected contribution and charge / (reversal) for the year ending December 31, 2021,would be as follows:
2021Pension fund Gratuity fund Benevolent
fundPost retirement medical benefit
56United Bank Limited228
Notes to and forming part of the Consolidated Financial StatementsFor the year ended December 31, 2020

NOTES TO AND FORMING PART OF THE CONSOLIDATED FINANCIAL STATEMENTS FOR THE YEAR ENDED DECEMBER 31, 2020
41.1.14 Funding Policy
Asset Volatility
Changes in Bond Yields
Inflation Risk
Life Expectancy / Withdrawal Rate
Other Risks
Though, not imminent and generally observable, over long term there are some risks that may crystallise. This includes:
-
-
-
The Gratuity and Compensated Absences are paid off at the maximum of age 60. The life expectancy is in almostminimal range and is quite predictable in the ages when the employee is in the accredited employment of the Bank forthe purpose of the Gratuity and Compensated Absences. Thus, the risk of life expectancy is almost negligible. However,post-retirement benefit given by the Bank like monthly pension, post-retirement medical gives rise to a significant riskwhich is quite difficult to value even by using advance mortality improvement models. Thus, this risk carries valuationrisk as well.
Withdrawal risks is the risk of higher or lower withdrawal experience than assumed. The final effect could go either waydepending on the beneficiaries’ service/age distribution and the benefit.
Model Risk – The defined benefit gratuity liability is valued by actuary each year. Further, the assets in the Fundare also marked to market. This two-tier valuation gives rise to the model risk.
The Bank endeavours to ensure that liabilities under the various employee benefit schemes are covered by the Fund onany valuation date having regards to the various actuarial assumptions such as projected future salary increase,expected future contributions to the fund, projected increase in liability associated with future service and the projectedinvestment income of the Fund.
Only three Schemes out of the all the Schemes are funded: Pension; Gratuity; and Benevolent Fund. The combinedinvestment of the three funds is Rs. 11.9 billion. Almost 92% is invested in Government Bonds with a maturity that isless than the maturity of the corresponding liability.
In a general economic sense and in a longer view, there is a case that if bond yields increase, the ensuing change insalary inflation generally offsets the gains from the decrease in discounted gratuity. But viewed with the fact that, forgratuity, asset values will also decrease; the salary inflation does, as an overall effect, increases the net liability of theBank.
Retention risk – The risk that employee will not be motivated to continue the service or start working with the Bankif no market comparable retirement benefit is provided.Final Salary Risk – The risk, for defined benefit gratuity, that any disproportionate salary merit increases in laterservice years will give rise to a multiplicative increase in the gratuity liability as such increase is applicable to allthe past years of service.
The asset class is volatile with reference to the yield on this class. This risk should be viewed together with change inthe bond yield risk.
There is an insignificant equity exposure and investment in corporate bonds of around 1% respectively.
There are two dimensions to the changes in Bond yields: first, as described above; second, the valuation of the GratuityLiability is discounted with reference to the government bond yields. So, any increase in Bond yields will lower theRetirement Benefits Liability and vice versa, but, it will also lower the Asset values.
The salary inflation (especially the final salary risk) is the major risk that the Gratuity and compensated absences liabilitycarries. In pension fund the increase has been determined by the Supreme Court and does not carry this risk as thebenefit is practically no longer related to future salary increases. Some of the post-retirement medical benefits arecapped to a proportion of Pension, thus carrying no salary inflation risk. However, the hospitalisation benefit issusceptible to medical inflation risk.
57 229Annual Report 2020
Notes to and forming part of the Consolidated Financial StatementsFor the year ended December 31, 2020

NOTES TO AND FORMING PART OF THE CONSOLIDATED FINANCIAL STATEMENTS FOR THE YEAR ENDED DECEMBER 31, 2020
-
-
-
41.2 United National Bank Limited Pension and Life Assurance Scheme for U.K Employees
2020 2019
Discount rate 1.35% 2.00%Expected rate of pension increase 3.00% 3.00%Retail price inflation 3.05% 3.10%Consumer price inflation 2.25% 2.30%
41.2.1
Return Rupees in '000 Return Rupees in '000
Insurance policy 1.35% 1,431,309 2.30% 1,276,423
Market value of assets 1,431,309 1,276,423Present value of defined benefit obligation (1,601,703) (1,312,433)Gross pension liability (170,394) (36,010)
2020 201941.2.2 Movement in surplus / (deficit) during the year
Obligation at the beginning of the year (36,010) 26,534 Interest expense (624) 956 Employer contribution 10,180 8,222 Remeasurement gain (134,214) (71,700) Exchange adjustment (9,726) (22) Obligation at the end of the year (170,394) (36,010)
No Directors were members of the defined benefit scheme during the year or as at December 31, 2020.
Compliance Risk – The risk that retirement benefits offered by the Bank do not comply with minimum statutoryrequirements.Legal / Political Risk – The risk that the legal / political environment changes and as a result, the Bank is requiredto offer additional or different retirement benefits than what the Bank projected. Specifically, in the light of recentSupreme Court decisions, this risk has materialised.
Operational Risk related to a separate entity - Retirement benefits are funded through a separate trust fund whichis a different legal entity than the Bank. Generally, the protocols, processes, and conventions used throughout theBank are not applicable or are not actively applied to the retirement benefit funds. This gives rise to some specificoperational risks.
2020 2019
As part of the Shareholders’ Agreement (“the Agreement”) signed on November 9, 2001, between UBL UK and itsshareholders, United Bank Limited and National Bank of Pakistan (NBP), it was agreed that UBL UK may participate asan associated employer in the United Bank Limited Pension and Life Assurance Scheme (“the Scheme”) with effect fromNovember 19, 2001, the date of completion of transfer of the businesses from the Bank and NBP into UBL UK (theCompletion Date). The Scheme is classified as a defined benefit scheme providing benefits based on final pensionablesalary.
Under the terms of the Agreement, UBL UK is responsible for the funding requirements of the active members whoseemployment was transferred to UBL UK on the Completion Date and for any new members admitted to the scheme afterthe Completion Date. United Bank Limited remains responsible for the funding of the deferred members upto theCompletion Date. The scheme is closed for new members and the accrual of benefits has ceased from January 1, 2010.
Full actuarial valuations using the Projected Unit Credit Method are obtained triennially and updated at each statementof financial position date.
The last full actuarial valuation of the scheme was carried out by a qualified actuary. The major assumptions used by theactuary in the latest update as of December 31, 2020, are as follows:
---------- Per annum ----------
The assets and liabilities of the scheme noted below relate to those employees for whom UBL UK has a funding liability.
------- (Rupees in '000) -----
58United Bank Limited230
Notes to and forming part of the Consolidated Financial StatementsFor the year ended December 31, 2020

NOTES TO AND FORMING PART OF THE CONSOLIDATED FINANCIAL STATEMENTS FOR THE YEAR ENDED DECEMBER 31, 2020
2020 201941.2.3 Analysis of the amount credited / (debited) to net interest income
Expected return on pension scheme assets 25,762 30,974 Interest on pension scheme liabilities (26,386) (30,018) Net (expense) / income (624) 956
41.2.4 Sensitivity Analysis
2020Rupees in '000
Increase in discount rate by 1 % (250,566) Decrease in discount rate by 1 % 323,093 Increase in expected inflation rate by 1% 42,162 Decrease in expected inflation rate by 1% (18,569) Increase in life expectancy by 1 year 65,318 Decrease in life expectancy by 1 year (64,662)
41.3 UBL Fund Managers Limited
41.3.1 Principal actuarial assumptions
2020 2019
Discount rate 9.75% 11.25%Expected rate of return on plan assets 9.75% 9.00%Expected rate of salary increase 9.75% 11.25%
2020 201941.3.2 Reconciliation of payable to defined benefit plan
Present value of defined benefit obligations 72,474 69,982Fair value of plan assets (54,148) (54,276)Payable 18,326 15,706
41.3.3 Movement in defined benefit obligation
Obligation at the beginning of the year 69,982 55,624Current service cost 14,976 13,615Interest cost 8,342 7,645Benefits paid (19,671) (7,702)Remeasurement (gain) / loss (1,155) 800Obligation at the end of the year 72,474 69,982
41.3.4 Movement in the fair value of plan assets
Fair value of plan assets at the beginning of the year 54,276 54,726Return on plan assets 6,603 7,537Contributions to the plan 12,857 - Benefits paid (19,671) (7,702)Remeasurement gain / (loss) 83 (285)Fair value of plan assets at the end of the year 54,148 54,276
---------- Per annum ----------
------- (Rupees in '000) -----
------- (Rupees in '000) -----
Sensitivity analysis has been performed by varying one assumption keeping all other assumptions constant andcalculating the impact on the present value of the defined benefit obligation under the benefit scheme. The increase /(decrease) in the present value of defined benefit obligation as a result of a change in each assumption is summarisedbelow:
Although the analysis does not take account of the full distribution of expected cash flows, it does provide anapproximation of the sensitivity of the assumptions shown.
UBL FM operates a funded gratuity scheme. The liability of UBL FM in respect of this scheme is determined based onan annual actuarial valuation carried out using the Projected Unit Credit Method. The latest valuation was carried out asat December 31, 2020. The main assumptions used in the actuarial valuation are as follows:
59
231Annual Report 2020
Notes to and forming part of the Consolidated Financial StatementsFor the year ended December 31, 2020

NOTES TO AND FORMING PART OF THE CONSOLIDATED FINANCIAL STATEMENTS FOR THE YEAR ENDED DECEMBER 31, 2020
2020 201941.3.5 Composition of plan assets
Debt securities 34,528 2,868PIB / T-Bills - 32,877Cash 3,200 2,058Mutual Funds 498 2,719Equity securities 15,922 13,754
54,148 54,27641.3.6 Charge for defined benefit plan
Current service cost 14,976 13,615Interest cost 8,342 7,645Return on plan assets (6,603) (7,537)
16,715 13,723
Actual return on plan assets 6,207 6,354
41.3.7 Movement in net liability recognised
Opening net payable 15,706 898Expense recognised 16,715 13,723Contribution to the fund made during the year (12,857) - Remeasurement (gain) / loss (1,238) 1,085Closing net payable 18,326 15,706
41.3.8 Maturity profile and expected future contribution
41.3.9 Sensitivity Analysis
2020Rupees in '000
Increase in discount rate by 1 % 66,523Decrease in discount rate by 1 % 79,381Increase in salary increment rate by 1% 79,674Decrease in salary increment rate by 1% 66,169
42 OTHER EMPLOYEE BENEFITS
42.1 Defined contribution plan
UBL FM operates a contributory provident fund scheme. The employer and employee each contribute 10% of the basicsalary to the funded scheme every month.
The Bank operates a contributory provident fund scheme for 10,083 (2019: 9,856) employees who are not in thepension scheme. The employer and employee each contribute 8.33% of the basic salary to the funded scheme everymonth.
Based on actuarial advice, management estimates that the expected contribution and charge for the year endingDecember 31, 2021, would be Rs. 16.917 million and Rs. 16.715 million respectively. The weighted average duration ofthe obligation as of December 31, 2020, is 8.82 years.
Sensitivity analysis has been performed by varying one assumption keeping all other assumptions constant andcalculating the impact on the present value of the defined benefit obligation under the defined benefit scheme. Theincrease / (decrease) in the present value of defined benefit obligation as a result of a change in each assumption issummarised below:
Although the analysis does not take account of the full distribution of expected cash flows, it does provide anapproximation of the sensitivity of the assumptions shown.
------- (Rupees in '000) -----
60United Bank Limited232
Notes to and forming part of the Consolidated Financial StatementsFor the year ended December 31, 2020

NOTES TO AND FORMING PART OF THE CONSOLIDATED FINANCIAL STATEMENTS FOR THE YEAR ENDED DECEMBER 31, 2020
42.2 Employee Stock Option Scheme
43. COMPENSATION OF DIRECTORS AND KEY MANAGEMENT PERSONNEL
43.1 Total Compensation Expense
ChairmanExecutives (other than
CEO)
Non-Executives
Fees and Allowances etc. 10,495 - 75,705 9,544 - 31,164 - Managerial Remunerationi) Fixed - - - - 81,542 668,091 529,088 ii) Variable - Cash Bonus / Awards - - - - 117,930 184,797 171,899 Charge for defined benefit plan - - - - 2,484 8,653 14,957 Contribution to defined contribution plan - - - - 6,795 38,470 61,998 Rent & house maintenance - - - - 5,915 68,037 138,176 Utilities - - - - 1,551 35,677 61,412 Medical - - - - - 20,872 30,706 Conveyance - - - - 1,155 42,520 87,940 Others - - - - 3,811 2,723 16,044 Total 10,495 - 75,705 9,544 221,183 1,101,004 1,112,220
Number of Persons 1 - 7 3 2 48 103
ChairmanExecutives (other than
CEO)
Non-Executives
Fees and Allowances etc. 11,710 - 84,365 6,855 - 24,232 - Managerial Remunerationi) Fixed - - - - 60,000 592,741 647,202 ii) Variable - Cash Bonus / Awards - - - - 21,850 112,342 373,243 Charge for defined benefit plan - - - - 5,000 10,133 25,280 Contribution to defined contribution plan - - - - 2,315 31,397 25,184 Rent & house maintenance - - - - 3,055 84,035 150,603 Utilities - - - - 1,140 35,406 106,458 Medical - - - - - 23,353 33,994 Conveyance - - - - 453 9,359 10,008 Others - - - - 1,113 51,208 20,770 Total 11,710 - 84,365 6,855 94,926 974,206 1,392,742
Number of Persons 1 - 7 3 1 45 118
UBL Fund Managers has an incentive scheme for its top performing employees in the form of share options under the policyof Employee Stock Option Scheme (ESOS). The options give a right to subscribe ordinary shares of the Company to theextent of the lower of two million shares or five percent of the share capital of the company as of the grant date. The schemeis divided into three phases and options are exercisable at their respective exercise price determined from time to timeaccording to methodology provided in approved scheme. Each phase give a right to eligible employees to acquire optionsafter a vesting period of two years, in two tranches i.e. 50% of the vested options are exercisable upon completion of vestingperiod, while remaining 50% can be exercised after one year. The last phase was completed in 2016 in which 18,121 shareswere issued pursuant to exercise of the share options.
------------------------------------------------------------ (Rupees in '000) -----------------------------------------------------------
President / CEO
2020
------------------------------------------------------------ (Rupees in '000) -----------------------------------------------------------
Key Management
Personnel
Other Material Risk
Takers/ Controllers
Directors
Items
Directors2019
President / CEO
Key Management
Personnel
Other Material Risk
Takers/ Controllers
ItemsMembers Shariah Board
Members Shariah Board
61233Annual Report 2020
Notes to and forming part of the Consolidated Financial StatementsFor the year ended December 31, 2020

NOTES TO AND FORMING PART OF THE CONSOLIDATED FINANCIAL STATEMENTS FOR THE YEAR ENDED DECEMBER 31, 2020
43.2 Remuneration paid to Directors for participation in Board and Committee Meetings
1 Sir Mohammed Anwar Pervez, OBE, HPk 6,300 - 750 - - 3,000 445 10,495 2 Lord Zameer M. Choudrey, CBE, SI Pk 5,250 - - 3,000 750 3,000 587 12,587 3 Mr. Haider Zameer Choudrey 5,250 3,750 - - 3,000 - 587 12,587 4 Mr. Arshad Ahmad Mir 5,250 1,500 3,000 2,250 - 2,250 436 14,686 5 Mr. Rizwan Pervez 5,250 3,750 750 - - - 595 10,345 6 Mr. Khalid Ahmed Sherwani 3,000 2,250 2,250 - - - - 7,500 7 Mr. Amar Zafar Khan 4,500 2,250 2,250 - - - - 9,000 8 Mr. Tariq Rashid 4,500 750 750 - 3,000 - - 9,000
Total Amount Paid 39,300 14,250 9,750 5,250 6,750 8,250 2,650 86,200
1 Board Meetings 6 6 6 5 6 6 6 62 Board Audit Committee (BAC) - - 5 - 5 5 5 -3 Board Human Resource & Compensation
Committee (HRCC) - - - 3 - 4 4 -4 Board Risk & Compliance Committee (BRCC) - 4 - 3 - - - -5 Board IT Committee (BITC) - - 5 - - - - 56 Board Nomination Committee (BNC) - - - - - - - -
Total meetings attended 6 10 16 11 11 15 15 11
Meeting fees and allowances paid (Rs. in 000's) 11,710 11,753 11,753 9,651 11,710 13,622 12,945 12,931
Total meeting fees and allowances paid (Rs. in 000's) 96,075
43.3 Remuneration paid to Shariah Board Members
Chairman Resident Member
Non-Resident
Member(s)Chairman Resident
Member
Non-Resident
Member(s)
Meeting Fees and Allowances 2,772 4,000 2,772 2,540 1,775 2,540
1 1 1 1 1 1
44. FAIR VALUE OF FINANCIAL INSTRUMENTS
--------------------------------------------------------------------- (Rupees in '000) --------------------------------------------------------------------------
Meeting Fees and Allowances PaidFor Board Committees
Name of Director
2020
Sr.No. For Board
MeetingsBoard Audit Committee
(BAC)
Board Human Resource &
Compensation Committee
(HRCC)
Board Risk & Compliance Committee
(BRCC)
Board IT Committee
(BITC)
Board Nomination Committee
(BNC)
Allowance Total Amount Paid
(Number of meetings attended)
2019
Sr. No. Name of Meetings
Name of Directors
Sir Mohammed
Anwar Pervez, OBE, HPk
Lord Zameer M. Choudrey,
CBE, SI Pk
Mr. Haider Zameer
Choudrey
Mr. Arshad Ahmad Mir
Mr. Rizwan Pervez
Mr. Khalid Ahmed
Sherwani
Mr. Amar Zafar Khan
Mr. Tariq Rashid
The directors' fee for the year ended December 31, 2019, is based on their attendance per set of meetings which includesBoard meetings and / or committee(s) meeting(s) before or after the regular Board meeting. The amount disclosed for eachdirector during the year ended December 31, 2019, in note 43.2 can therefore not be distributed for each type of meeting.
The fair value of quoted securities other than those classified as held to maturity, is based on quoted market price. Quotedsecurities classified as held to maturity are carried at cost. The fair value of unquoted equity securities, other thaninvestments in associates, is determined on the basis of the break-up value of these investments as per their latest availableaudited financial statements.
The fair value of unquoted debt securities, fixed term loans, other assets, other liabilities, fixed term deposits and borrowingscannot be calculated with sufficient reliability due to the absence of a current and active market for these assets and liabilitiesand reliable data regarding market rates for similar instruments.
Total Number of Persons
Items
-------------------------------------------- (Rupees in '000) --------------------------------------------
20192020
62United Bank Limited234
Notes to and forming part of the Consolidated Financial StatementsFor the year ended December 31, 2020

NOTES TO AND FORMING PART OF THE CONSOLIDATED FINANCIAL STATEMENTS FOR THE YEAR ENDED DECEMBER 31, 2020
44.1
Level 1: Fair value measurements using quoted prices (unadjusted) in active markets for identical assets or liabilities.
On-balance sheet financial instruments Level 1 Level 2 Level 3 Total Financial assets measured at fair value- Investments
Government Securities (T-bills, PIBs, GoP Sukuks Eurobonds, Modaraba Pool) 811,834,934 - 811,834,934 - 811,834,934
Foreign Bonds - sovereign 81,709,882 - 81,709,882 - 81,709,882Foreign Bonds - others 7,503,650 - 7,503,650 - 7,503,650Ordinary shares of listed companies 10,383,260 10,383,260 - - 10,383,260Mutual Funds 228,518 - 228,518 - 228,518Debt securities (TFCs, Corporate Sukuks) 1,720,302 - 1,720,302 - 1,720,302Investment in REIT 441,914 441,914 - - 441,914
913,822,460 10,825,174 902,997,286 - 913,822,460Financial assets - disclosed but not measured at fair value- Investments
Government Securities (T-bills, PIBs, GoP Sukuks Eurobonds, Bai Muajjal) 204,958,067 - 208,585,861 - 208,585,861
Foreign Bonds - sovereign 24,412,008 - 25,838,959 - 25,838,959Foreign Bonds - others 1,238,565 - 1,285,465 - 1,285,465Debt securities (TFCs, Corporate Sukuks and others) 16,411,853 - 16,570,036 - 16,570,036
247,020,493 - 252,280,321 - 252,280,3211,160,842,953 10,825,174 1,155,277,607 - 1,166,102,781
Off-balance sheet financial instrumentsForward purchase and sale of foreign exchange contracts 683,065,647 - (29,391) - (29,391)Interest rate swaps - - - - - FX options - purchased and sold (net) - - - - - Forward purchase of Government Securities - - - - - Forward sale of Government Securities - - - - -
Level 1 Level 2 Level 3 Total
On-balance sheet financial instrumentsFinancial assets measured at fair value- Investments
Government Securities (T-bills, PIBs, GoP Sukuks Eurobonds and Modarba Pool) 481,948,693 - 481,948,693 - 481,948,693
Foreign Bonds - sovereign 64,182,976 - 64,182,976 - 64,182,976Foreign Bonds - others 16,299,524 - 16,299,524 - 16,299,524Ordinary shares of listed companies 13,410,757 13,410,757 - - 13,410,757Mutual Funds 252,931 - 252,931 - 252,931Debt securities (TFCs, Corporate Sukuks) 1,849,521 - 1,849,521 - 1,849,521Investment in REIT 520,708 520,708 - - 520,708
578,465,110 13,931,465 564,533,645 - 578,465,110
In the opinion of the management, the fair value of the remaining financial assets and liabilities are not significantlydifferent from their carrying values since these are either short-term in nature or, in the case of customer loans anddeposits, are frequently repriced.
The Group measures fair values using the following fair value hierarchy that reflects the significance of the inputs used inmaking the measurements:
Level 2: Fair value measurements using inputs other than quoted prices included within Level 1 that are observable forthe assets or liability, either directly (i.e. as prices) or indirectly (i.e. derived from prices).
2019Carrying /
Notional value
The table below analyses financial instruments measured at the end of the reporting period by the level in the fair valuehierarchy into which the fair value measurement is categorised:
2020Carrying /
Notional valueFair value
----------------------------------(Rupees in '000)---------------------------------
Fair value
----------------------------------(Rupees in '000)---------------------------------
Level 3: Fair value measurements using input for the asset or liability that are not based on observable market data (i.e.unobservable inputs).
63235Annual Report 2020
Notes to and forming part of the Consolidated Financial StatementsFor the year ended December 31, 2020

NOTES TO AND FORMING PART OF THE CONSOLIDATED FINANCIAL STATEMENTS FOR THE YEAR ENDED DECEMBER 31, 2020
Level 1 Level 2 Level 3 Total
Financial assets - disclosed but not measured at fair value- Investments
Government Securities (T-bills, PIBs, GoP Sukuks Eurobonds, Bai Muajjal) 248,436,970 - 242,845,295 - 242,845,295
Foreign Bonds - sovereign 21,046,822 - 22,398,872 - 22,398,872Foreign Bonds - others 1,260,550 - 1,301,904 - 1,301,904Debt securities (TFCs, Corporate Sukuks and others) 18,922,885 - 20,204,344 - 20,204,344
289,667,227 - 286,750,415 - 286,750,415868,132,337 13,931,465 851,284,060 - 865,215,525
Off-balance sheet financial instrumentsForward purchase and sale of foreign exchange contracts 650,576,446 - 1,462,513 - 1,462,513Interest rate swaps 1,674,764 - (22,101) - (22,101)FX options - purchased and sold (net) 1,159,752 - - - - Forward purchase of Government Securities 13,619,209 - (22,401) - (22,401)Forward sale of Government Securities 2,326,880 - (34,172) - (34,172)
44.2 Fair Value of non-financial assets
Level 1 Level 2 Level 3 Total
Fixed Assets 42,299,453 - - 42,299,453 42,299,453 Non-banking assets acquired in satisfaction of claims 236,084 - - 236,084 236,084
42,535,537 - - 42,535,537 42,535,537
Level 1 Level 2 Level 3 Total
Fixed Assets 42,664,985 - - 42,664,985 42,664,985 Non-banking assets acquired in satisfaction of claims 1,082,375 - - 1,082,375 1,082,375
43,747,360 - - 43,747,360 43,747,360
44.3
44.4 Valuation techniques used in determination of fair values within level 2 and level 3.
Debt securities
Units of mutual fund
Derivatives
The fair valuation techniques include forward pricing and swap models using present value calculations.
The fair values of investments in units of mutual funds are determined based on their net asset values as published at the close of each business day.
Certain categories of fixed assets (land and buildings) and non-banking assets acquired in satisfactions of claims arecarried at revalued amounts (level 3 measurement) determined by professional valuers based on their assessment of themarket values.
The fair value of Federal Government securities is determined using the prices / rates available on Mutual FundsAssociation of Pakistan (MUFAP) and the fair value of other corporate and foreign government securities is determinedusing the rates from Reuters / Bloomberg.
2020
2019Carrying /
Notional valueFair value
----------------------------------(Rupees in '000)---------------------------------
2019Carrying /
Notional valueFair value
----------------------------------(Rupees in '000)---------------------------------
Carrying / Notional value
Fair value
----------------------------------(Rupees in '000)---------------------------------
64United Bank Limited236
Notes to and forming part of the Consolidated Financial StatementsFor the year ended December 31, 2020

NOTES TO AND FORMING PART OF THE CONSOLIDATED FINANCIAL STATEMENTS FOR THE YEAR ENDED DECEMBER 31, 2020
Fixed assets and non-banking assets acquired in satisfaction of claims
45. SEGMENT INFORMATION
45.1 Segment details with respect to business activities
Profit & LossNet mark-up / return / profit 36,465,776 72,064,538 (44,818,240) 4,118,716 7,731,711 2,114,041 (603,329) 77,073,213Inter segment (expense) / revenue - net (28,037,168) (64,465,202) 85,797,705 1,068,993 - - 5,635,672 - Non mark-up / return / interest income 2,392,061 2,987,193 7,365,086 211,034 2,777,547 2,150,780 1,465,296 19,348,997Total Income 10,820,669 10,586,529 48,344,551 5,398,743 10,509,258 4,264,821 6,497,639 96,422,210
Segment direct expenses 1,469,881 550,650 25,494,982 1,679,860 5,244,835 3,691,452 6,652,685 44,784,345Inter segment expense allocation 558,166 71,664 4,760,410 114,868 539,126 - (6,044,234) - Total expenses 2,028,047 622,314 30,255,392 1,794,728 5,783,961 3,691,452 608,451 44,784,345Provisions - net (1,489,772) (123,276) (277,900) (12,905) (14,853,113) (487,530) (11,182) (17,255,678)Profit / (loss) before tax 7,302,850 9,840,939 17,811,259 3,591,110 (10,127,816) 85,839 5,878,006 34,382,187
Balance SheetCash & Bank balances 125,596 81,844,130 120,943,227 12,153,493 47,378,919 24,477,950 799,172 287,722,487Investments 4,803,162 932,393,450 - 62,729,601 123,251,328 40,068,180 4,557,791 1,167,803,512Net inter segment lending - - 1,132,694,448 6,980,805 - - 77,017,055 1,216,692,308Lendings to financial institutions - - - 19,959,132 - 2,253,310 - 22,212,442Advances - performing 369,114,172 - 32,976,365 20,390,074 89,119,069 80,220,386 6,811,741 598,631,807Advances - non-performing net of provision 3,289,437 - 807,045 10,126 7,754,943 1,351,794 6,524 13,219,869Others 14,521,202 16,648,272 14,869,004 1,700,920 13,301,659 7,426,167 43,818,857 112,286,081Total Assets 391,853,569 1,030,885,852 1,302,290,089 123,924,151 280,805,918 155,797,787 133,011,140 3,418,568,506
Borrowings 54,852,047 58,593,525 989,202 3,632,752 9,321,566 4,438,093 - 131,827,185Subordinated debt - - - - - - 10,000,000 10,000,000Deposits & other accounts 63,760,006 132,797 1,245,280,490 110,347,698 220,015,338 124,607,281 248,676 1,764,392,286Net inter segment borrowing 255,020,028 960,917,205 - - 755,075 - - 1,216,692,308Others 13,779,726 3,328,909 46,185,887 5,772,050 6,305,922 1,728,707 10,923,640 88,024,841Total Liabilities 387,411,807 1,022,972,436 1,292,455,579 119,752,500 236,397,901 130,774,081 21,172,316 3,210,936,620Equity 4,441,762 7,913,416 9,834,510 4,171,651 44,408,017 25,023,706 111,838,824 207,631,886Total Equity & liabilities 391,853,569 1,030,885,852 1,302,290,089 123,924,151 280,805,918 155,797,787 133,011,140 3,418,568,506
Contingencies and Commitments 354,762,782 278,633,736 13,182,354 377,425 398,498,687 86,347,176 2,705,380 1,134,507,540
Profit & LossNet mark-up / return / profit 45,818,682 44,777,720 (38,614,134) 3,158,882 8,769,288 1,566,422 (2,135,942) 63,340,918Inter segment (expense) / revenue - net (39,577,709) (58,654,888) 91,402,316 1,111,925 - - 5,718,356 - Non mark-up / return / interest income 2,409,533 4,293,079 8,606,719 1,321,665 3,102,710 2,571,531 2,029,598 24,334,835Total Income 8,650,506 (9,584,089) 61,394,901 5,592,472 11,871,998 4,137,953 5,612,012 87,675,753
Segment direct expenses 1,469,178 83,281 23,799,440 2,700,618 5,981,755 3,642,390 6,954,894 44,631,556Inter segment expense allocation 617,774 74,997 5,087,240 84,797 740,244 - (6,605,052) - Total expenses 2,086,952 158,278 28,886,680 2,785,415 6,721,999 3,642,390 349,842 44,631,556Reversals / (Provisions) - net 549,733 (2,253,096) 122,712 (5,529) (6,010,178) 99,925 182,890 (7,313,543)Profit / (loss) before tax 7,113,287 (11,995,463) 32,630,933 2,801,528 (860,179) 595,488 5,445,060 35,730,654
------------------------------------------------------------------------------------ (Rupees in '000) -----------------------------------------------------------------------------------
------------------------------------------------------------------------------------ (Rupees in '000) -----------------------------------------------------------------------------------
2019Corporate / Commercial
BankingTreasury Branch
BankingIslamic
Banking
International branch
operationsSubsidiaries Others Total
Land, buildings and non-banking assets acquired in satisfaction of claims are revalued on a periodic basis usingprofessional valuers. The valuation is based on their assessment of the market value of the assets. The effect of changesin the unobservable inputs used in the valuations cannot be determined with certainty. Accordingly, a qualitative disclosureof sensitivity has not been presented in these consolidated financial statements.
2020Corporate / Commercial
BankingTreasury Branch
BankingIslamic
Banking
International branch
operationsSubsidiaries Others Total
65237Annual Report 2020
Notes to and forming part of the Consolidated Financial StatementsFor the year ended December 31, 2020

NOTES TO AND FORMING PART OF THE CONSOLIDATED FINANCIAL STATEMENTS FOR THE YEAR ENDED DECEMBER 31, 2020
Balance SheetCash & Bank balances 81,169 81,316,916 102,855,184 13,676,734 52,400,729 35,224,408 774,238 286,329,378Investments 5,648,871 674,218,489 - 46,726,238 108,281,811 35,466,122 4,094,371 874,435,902Net inter segment lending - - 966,089,886 7,455,399 - - 54,818,509 1,028,363,794Lendings to financial institutions - 9,450,000 - 10,733,118 - 1,509,828 - 21,692,946Advances - performing 446,782,941 18,964 35,584,682 9,015,164 125,319,182 58,139,824 5,743,474 680,604,231Advances - non-performing net of provision 1,520,429 - 604,654 6,945 11,212,859 574,868 24,923 13,944,678Others 24,834,875 23,500,874 15,299,565 308,095 14,826,733 6,911,760 60,129,942 145,811,844Total Assets 478,868,285 788,505,243 1,120,433,971 87,921,693 312,041,314 137,826,810 125,585,457 3,051,182,773
Borrowings 52,257,409 95,592,358 (233,449) 1,299,975 5,567,707 15,921,060 - 170,405,060Subordinated debt - - - - - - 10,000,000 10,000,000Deposits & other accounts 60,853,340 131,140 1,074,094,958 80,713,661 250,441,596 91,143,714 616,897 1,557,995,306Net inter segment borrowing 341,540,385 686,617,978 - - 205,431 - - 1,028,363,794Others 20,252,937 15,460,323 27,235,447 3,775,564 7,619,847 1,387,724 17,814,900 93,546,742Total Liabilities 474,904,071 797,801,799 1,101,096,956 85,789,200 263,834,581 108,452,498 28,431,797 2,860,310,902Equity 4,412,390 (9,276,952) 22,712,567 736,110 52,573,508 21,802,989 97,911,259 190,871,871Total Equity & liabilities 479,316,461 788,524,847 1,123,809,523 86,525,310 316,408,089 130,255,487 126,343,056 3,051,182,773
Contingencies and Commitments 375,719,554 582,249,607 11,794,242 10,065,965 405,700,848 76,351,544 2,070,818 1,463,952,578
45.2. Geographical segment analysis
Profit & LossNet mark-up / return / profit 67,233,631 298,294 7,433,417 2,107,871 - 77,073,213Non mark-up / return / interest income 15,170,149 28,958 2,748,589 1,401,301 - 19,348,997Total Income 82,403,780 327,252 10,182,006 3,509,172 - 96,422,210
Segment direct expenses 36,329,244 21,010 5,223,825 3,210,266 - 44,784,345Inter segment expense allocation (539,126) 2,257 536,869 - - - Total expenses 35,790,118 23,267 5,760,694 3,210,266 - 44,784,345Provisions - net (1,915,035) - (14,853,113) (487,530) - (17,255,678)Profit / (loss) before tax 44,698,627 303,985 (10,431,801) (188,624) - 34,382,187
Balance SheetCash & Bank balances 216,500,521 43,223 46,872,026 24,087,229 219,488 287,722,487Investments 1,006,733,370 6,687,141 116,564,187 37,818,814 - 1,167,803,512Net inter segment lending 1,216,692,308 - - - - 1,216,692,308Lendings to financial institutions 19,959,132 - - 2,253,310 - 22,212,442Advances - performing 429,292,352 20,469 89,098,600 80,220,386 - 598,631,807Advances - non-performing net of provision 4,113,132 - 7,754,943 1,351,794 - 13,219,869Others 92,083,405 265,299 13,036,360 6,901,017 - 112,286,081Total Assets 2,985,374,220 7,016,132 273,326,116 152,632,550 219,488 3,418,568,506
Borrowings 118,487,293 - 9,321,566 4,018,326 - 131,827,185Subordinated debt 10,000,000 - - - - 10,000,000Deposits & other accounts 1,419,773,912 5,281,918 214,729,175 124,607,281 - 1,764,392,286Net inter segment borrowing 1,215,937,233 2,258 752,817 - - 1,216,692,308Others 80,383,951 163,960 6,141,982 1,323,373 11,575 88,024,841Total Liabilities 2,844,582,389 5,448,136 230,945,540 129,948,980 11,575 3,210,936,620Equity 140,791,831 1,567,996 42,380,576 22,683,570 207,913 207,631,886Total Equity & liabilities 2,985,374,220 7,016,132 273,326,116 152,632,550 219,488 3,418,568,506
Contingencies and Commitments 649,661,677 163,265 398,335,422 86,347,176 - 1,134,507,540
2020
------------------------------------------------------------ (Rupees in '000) -----------------------------------------------------------
------------------------------------------------------------------------------------ (Rupees in '000) -----------------------------------------------------------------------------------
Pakistan Operations
Export Processing
ZonesMiddle East Europe Africa Total
2019
Corporate / Commercial
BankingTreasury Branch
BankingIslamic
Banking
International branch
operationsSubsidiaries Others Total
66
United Bank Limited238
Notes to and forming part of the Consolidated Financial StatementsFor the year ended December 31, 2020

NOTES TO AND FORMING PART OF THE CONSOLIDATED FINANCIAL STATEMENTS FOR THE YEAR ENDED DECEMBER 31, 2020
Geographical segment analysis
Profit & LossNet mark-up / return / profit 53,011,184 232,825 8,536,463 1,560,446 - 63,340,918Non mark-up / return / interest income 19,718,083 50,950 3,051,760 1,514,042 - 24,334,835Total Income 72,729,267 283,775 11,588,223 3,074,488 - 87,675,753
Segment direct expenses 35,927,041 26,479 5,707,496 2,970,540 - 44,631,556Inter segment expense allocation (740,244) 2,729 737,515 - - - Total expenses 35,186,797 29,208 6,445,011 2,970,540 - 44,631,556(Provisions) / Reversals - net (1,403,453) - (6,010,178) 100,088 - (7,313,543)Profit / (loss) before tax 36,139,017 254,567 (866,966) 204,036 - 35,730,654
Balance SheetCash & Bank balances 198,707,716 57,847 52,342,883 34,984,482 236,450 286,329,378Investments 732,743,879 4,673,811 103,608,000 33,410,212 - 874,435,902Net inter segment lending 1,028,363,794 - - - - 1,028,363,794Lendings to financial institutions 20,183,118 - - 1,509,828 - 21,692,946Advances - performing 497,145,225 38,323 125,280,859 58,139,824 - 680,604,231Advances - non-performing net of provision 2,156,951 - 11,212,859 574,868 - 13,944,678Others 124,485,497 2,396,396 12,430,338 6,499,613 - 145,811,844Total Assets 2,603,786,180 7,166,377 304,874,939 135,118,827 236,450 3,051,182,773
Borrowings 149,316,250 - 5,567,707 15,521,103 - 170,405,060Subordinated debt 10,000,000 - - - - 10,000,000Deposits & other accounts 1,216,408,782 5,592,357 244,850,452 91,143,715 1,557,995,306Net inter segment borrowing 1,028,158,363 112,723 92,708 - - 1,028,363,794Others 84,704,850 158,794 7,461,053 1,204,109 17,936 93,546,742Total Liabilities 2,488,588,245 5,863,874 257,971,920 107,868,927 17,936 2,860,310,902Equity 118,278,817 1,302,503 51,271,005 20,019,546 - 190,871,871Total Equity & liabilities 2,606,867,062 7,166,377 309,242,925 127,888,473 17,936 3,051,182,773
Contingencies and Commitments 981,900,186 115,880 405,584,968 76,351,544 - 1,463,952,578
Transactions between reportable segments are based on an appropriate transfer pricing mechanism using agreed rates.
46 TRUST ACTIVITIES
Asset Management Companies 3 - 1,110,500 - 1,110,500Corporates 22 4,246,500 - 3,237,500 7,484,000Individuals 95 154,900 - 1,447,770 1,602,670Insurance Companies 42 372,299,700 413,000 2,352,000 375,064,700NGO / Charitable Organisation 14 400,000 - 739,300 1,139,300Pension & Employee Funds 164 42,824,000 175,000 11,021,255 54,020,255
38 2,500,700 - 4,124,345 6,625,045378 422,425,800 1,698,500 22,922,170 447,046,470
Asset Management Companies 1 - 85,000 - 85,000Corporates 20 15,829,100 - 6,626,200 22,455,300Individuals 113 202,800 - 1,527,745 1,730,545Insurance Companies 36 338,959,700 707,000 15,660,000 355,326,700NGO / Charitable Organisation 8 400,000 - 787,800 1,187,800Pension & Employee Funds 138 38,067,200 50,000 9,435,350 47,552,550
24 476,000 - 5,966,740 6,442,740340 393,934,800 842,000 40,003,835 434,780,635
2019
------------------------------------------------------------ (Rupees in '000) -----------------------------------------------------------
The Bank acts as a custodian for some of the Term Finance Certificates it arranges and distributes on behalf of itscustomers. Further, the Bank acts as a custodian for securities held in Investor Portfolio Securities (IPS) accounts. Theseare not assets of the Bank and, therefore, are not included as such in the consolidated financial statements. Assets heldunder trust in IPS accounts are shown in the table below:
Pakistan Operations
Export Processing
ZonesMiddle East Europe Africa Total
Number of IPS Accounts
Number of IPS Accounts
Others
------------------ (Rupees in '000) --------------------
Others
------------------ (Rupees in '000) --------------------
2019Securities held (Face Value)
Total Pakistan
Investment Bonds
GoP Ijara Sukuks
Market Treasury Bills
Category
Category
2020Securities held (Face Value)
Total Pakistan
Investment Bonds
GoP Ijara Sukuks
Market Treasury Bills
67239Annual Report 2020
Notes to and forming part of the Consolidated Financial StatementsFor the year ended December 31, 2020

NOTES TO AND FORMING PART OF THE CONSOLIDATED FINANCIAL STATEMENTS FOR THE YEAR ENDED DECEMBER 31, 2020
47. RELATED PARTY TRANSACTIONS
47.1 Related party transactions
Directors
Key manage-
ment personnel
Associates Other related parties Directors
Key manage-
ment personnel
Associates Other related parties
InvestmentsOpening balance - - 6,113,434 3,943,202 - - 5,119,744 4,183,880Investment made during the year - - 15,928,370 54,287 - - 13,864,341 - Investment redeemed / disposed off during
the year - - (15,868,601) - - - (13,491,052) (240,353)Transfer out (325)Equity method adjustments - - 436,751 - - - 620,401 - Closing balance - - 6,609,954 3,997,489 - - 6,113,434 3,943,202
Provision for diminution in value of investments - - - 1,544,596 - - - 1,134,720
Advances Opening balance 4,624 287,618 2,155,149 12,715,998 2,221 280,911 2,155,149 6,747,749Addition during the year 838 73,339 - 16,398,899 15,958 148,343 - 6,591,282Repaid during the year (5,452) (79,657) (152,755) (19,749,210) (13,555) (88,857) - (623,033)Transfer in / (out) - 13,869 (2,002,394) - - (52,779) - - Closing balance 10 295,169 - 9,365,687 4,624 287,618 2,155,149 12,715,998
Provision held against advances - - - - - - 2,155,149 -
Other AssetsInterest mark-up accrued - - 4,282 232,471 - - 7,289 325,704Receivable from staff retirement funds - - - 24,160 - - - 206,939Advances, Deposits & Prepayments - - - 63,634 - - - 113,634Prepaid insurance - - 1,002 - - - 2,167 - Remuneration receivable from management
of funds - - 77,194 - - - 79,080 - Sales load receivable - - 37,396 - - - 27,408 - Formation cost receivable - - 6,000 - - - - - Other receivable - - 1,750 30,164 - - 1,505 30,164Provision against other assets - - - 30,164 - - - 30,164
BorrowingsOpening balance - - - - - - - 12,400Borrowings during the year - - - 1,538,000 - - - 579,400Settled during the year - - - (1,538,000) - - - (591,800)Closing balance - - - - - - - -
------------------------------------------------------------------------------------------------------ (Rupees in '000) ------------------------------------------------------------------------------------------------------
The Group has related party transactions with its associates, employee benefit plans and its Directors and executiveofficers (including their associates).
The Group enters into transactions with related parties in the normal course of business. Contributions to and accruals inrespect of staff retirement benefits and other benefit plans are made in accordance with the actuarial valuations / terms ofthe contribution plan. Remuneration to the executives / officers is determined in accordance with the terms of theirappointment.
Details of transactions with related parties during the year, other than those which have been disclosed elsewhere in theseconsolidated financial statements, are as follows:
2020 2019
68United Bank Limited240
Notes to and forming part of the Consolidated Financial StatementsFor the year ended December 31, 2020

NOTES TO AND FORMING PART OF THE CONSOLIDATED FINANCIAL STATEMENTS FOR THE YEAR ENDED DECEMBER 31, 2020
Directors
Key manage-
ment personnel
Associates Other related parties Directors
Key manage-
ment personnel
Associates Other related parties
Deposits and other accountsOpening balance 8,679,450 71,109 6,502,931 11,347,096 6,245,367 165,303 11,638,644 8,491,509Received during the year 29,415,769 1,338,885 144,141,551 177,627,376 38,666,071 915,992 160,641,938 267,658,066Withdrawn during the year (31,659,519) (1,192,342) (148,166,050) (172,469,603) (36,231,988) (996,873) (165,777,647) (264,802,479)Transfer (out) / in - net (3,910) (59,940) - 6,541 - (13,313) (4) - Closing balance 6,431,790 157,712 2,478,432 16,511,410 8,679,450 71,109 6,502,931 11,347,096
Other LiabilitiesInterest / mark-up payable on deposits
and borrowings 39,335 210 7,651 115,024 35,257 - 72,233 94,554Payable to staff retirement fund - - - 1,142,926 - - - 725,619Unearned income - - - - - - - 13,869Other payable 3,900 - 22,353 - - - - -
Contingencies and CommitmentsForward foreign exchange contracts purchase - - - 4,360 - - - -
IncomeMark-up / return / interest earned - 18,323 34,835 1,221,777 - 15,660 57,978 822,220Commission / charges recovered 61 3,751 24,666 23,059 425 3,995 12,617 22,937Dividend received - - 96,525 175,794 - - 91,518 373,764Net gain on sale of securities - - 65,653 - - - 64,370 28,515Reversal of provision - - 152,755 - - - - - Remuneration from management of fund - - 707,413 - - - 800,997 - Sales load - - 61,202 - - - 57,898 - Other income - 7,166 524 15,359 - 989 6,157 22,827Switch revenue - - - 220,127 - - - 249,124
ExpensesMark-up / return / interest paid 184,964 1,112 373,541 346,897 155,289 1,682 767,200 387,628Remuneration paid - 1,146,732 - - - 852,955 - - Post employment benefits - 23,565 - - - 22,807 - - Non-executive directors' fee 86,199 - - - 96,075 - - - Net charge for defined contribution plans - 22,854 - 364,906 - - - - Net charge for defined benefit plans - - - 272,592 - - - 241,654Clearing charges - - - 138,487 - - - 129,727Seminar and membership fees - - - 8,246 - - - 13,845Membership, subscription, sponsorship
and maintenance charges - - - 7,358 - - - 14,534Custody charges - - - 4,757 - - - 6,401Other expenses - 36,866 - 44,875 - - - 49,363
Insurance premium paid - 1,913 537,120 - - 2,735 348,690 - Insurance claims settled - - 485,047 - - - 330,415 -
--------------------------------------------------------------------- (Rupees in '000) ---------------------------------------------------------------------
2020 2019
69241Annual Report 2020
Notes to and forming part of the Consolidated Financial StatementsFor the year ended December 31, 2020

NOTES TO AND FORMING PART OF THE CONSOLIDATED FINANCIAL STATEMENTS FOR THE YEAR ENDED DECEMBER 31, 2020
2020 2019
48. CAPITAL ADEQUACY, LEVERAGE RATIO & LIQUIDITY REQUIREMENTS
Minimum Capital Requirement (MCR):Paid-up capital (net of losses) 12,241,797 12,241,797
Capital Adequacy Ratio (CAR):Eligible Common Equity Tier 1 (CET 1) Capital 137,040,359 124,263,319Eligible Additional Tier 1 (ADT 1) Capital 10,735,774 10,530,346Total Eligible Tier 1 Capital 147,776,133 134,793,665Eligible Tier 2 Capital 47,926,723 35,934,199Total Eligible Capital (Tier 1 + Tier 2) 195,702,856 170,727,864
Risk Weighted Assets (RWAs):Credit Risk 642,342,717 729,515,624Market Risk 73,650,146 67,581,408Operational Risk 164,656,143 153,434,017Total 880,649,006 950,531,049
Common Equity Tier 1 Capital Adequacy ratio 15.56% 13.07%
Tier 1 Capital Adequacy Ratio 16.78% 14.18%
Total Capital Adequacy Ratio 22.22% 17.96%
------- (Rupees in '000) -------
The SBP through its BSD Circular No. 07 dated April 15, 2009 has prescribed the minimum paid-up capital (net ofaccumulated losses) for Banks to be raised to Rs.10,000 million by the year ending December 31, 2015. The paid-upcapital of the Bank as at December 31, 2020, stood at Rs.12,241.797 million (2019: Rs.12,241.797 million) and is incompliance with SBP requirements. Banks are also required to maintain a minimum Capital Adequacy Ratio (CAR) of10.0% plus capital conservation buffer of 2.5% and High Loss Absorbency Requirement of 1.5% of the risk weightedexposures of the Bank.
Under the current capital adequacy regulations, credit risk and market risk exposures are measured using theStandardised Approach and operational risk is measured using the Basic Indicator Approach. Credit risk mitigants are alsoapplied against the Bank’s exposures based on eligible collateral under comprehensive approach.
Furthermore, under the SBP’s Framework for Domestic Systemically Important Banks (D-SIBs) introduced vide BPRDCircular No. 04 of 2018 dated April 13, 2018, UBL has been designated as a D-SIB. In line with this framework, the Bank isrequired to meet the Higher Loss Absorbency (HLA) capital charge of 1.5%, in the form of Additional CET 1 capital, on astandalone as well as consolidated level during 2020. As per SBP’s designation of D-SIBs for the year 2020, the HLAcapital charge required to be maintained by UBL is 1.0% and will remain effective till next D-SIB designation is announcedby the State Bank of Pakistan.
In order to dampen the effects of COVID-19, the State Bank of Pakistan under BPRD Circular Letter No. 12 of 2020 hasgiven a regulatory relief and reduced the Capital Conservation Buffer (CCB) as prescribed vide BPRD Circular No. 6 ofAugust 15, 2013, for the time being, from its existing level of 2.50% to 1.50%, till further instructions.
Further, under Basel III instructions, Banks are also required to maintain a Common Equity Tier 1 (CET 1) ratio and Tier 1ratio of 6.0% and 7.5%, respectively, as at December 31, 2020. As at December 31, 2020 the Bank is fully compliant withprescribed ratios as the Bank’s CAR is 22.10% whereas CET 1 and Tier 1 ratios stood at 15.48% and 16.69% respectively.The Bank and its individually regulated operations have complied with all capital requirements throughout the year.
70United Bank Limited242
Notes to and forming part of the Consolidated Financial StatementsFor the year ended December 31, 2020

NOTES TO AND FORMING PART OF THE CONSOLIDATED FINANCIAL STATEMENTS FOR THE YEAR ENDED DECEMBER 31, 2020
2020 2019
Leverage Ratio (LR):Eligible Tier-1 Capital 147,776,133 134,793,665 Total Exposures 2,639,232,164 2,534,146,003Leverage Ratio 5.60% 5.32%
Liquidity Coverage Ratio (LCR):Total High Quality Liquid Assets 1,035,616,032 530,454,588 Total Net Cash Outflow 324,975,005 206,998,861 Liquidity Coverage Ratio 318.68% 256.26%
Net Stable Funding Ratio (NSFR):Total Available Stable Funding 1,714,566,321 1,598,050,689Total Required Stable Funding 770,865,635 1,170,120,900Net Stable Funding Ratio 222.42% 136.57%
49. RISK MANAGEMENT
- Determining guidelines relating to the Bank’s risk appetite.
-
-
- Developing systems and resources to review the key risk exposures of the Bank.
- Approving credits and granting approval authority to qualified and experienced individuals.
- Reviewing the adequacy of credit training across the Bank.
- Organising portfolio reviews focusing on quality assessment, risk profiles, industry concentrations etc.
- Setting systems to identify significant portfolio indicators, problem credits and level of provisioning required.
-
49.1
------- (Rupees in '000) -------
The full disclosures on the CAPITAL ADEQUACY, LEVERAGE RATIO & LIQUIDITY REQUIREMENTS as per SBPinstructions issued from time to time are placed on the website. The link to the full disclosure is available athttps://www.ubldigital.com/Investor-Relations/CAR-Statements.
The COVID-19 pandemic has taken a toll on all economies and emerged as a contagion risk around the globe, includingPakistan. To reduce the impact on businesses and economies in general, regulators / governments across the globe haveintroduced a host of measures on both the fiscal and economic fronts.
This section presents information about the Group’s exposure to and its management and control of risks, in particular, theprimary risks associated with its use of financial instruments such as credit, market, liquidity, and operational risks.
The Bank has an integrated risk management structure in place covering domestic and International franchise. The BoardRisk and Compliance Committee (BRCC) oversees the entire risk management process of the Bank. Furthermore, RiskManagement Committee has been formed which looks at all risks collectively at senior management level. The committeeis chaired by the President and comprises of Heads of all Risk areas, Finance, Business etc. The Risk and Credit PolicyGroup is responsible for the development and implementation of all risk policies as approved by the BRCC / BoD. TheGroup is organized into the functions of Market & Treasury Risk, Financial Institution Risk, Credit Policy & Research,Consumer Credit Policy, Credit Risk Management and Operational Risk & Basel. Each risk function is headed by a seniormanager who reports directly to the Group Executive, Risk and Credit Policy. The role of the Risk and Credit Policy Groupincludes:
Recommending risk management policies in accordance with the Prudential Regulations, Basel II / III framework,Regulatory framework of foreign countries where the bank operates and international best practices.
Reviewing policies / manuals and ensuring that these are in accordance with BRCC / BoD approved risk managementpolicies.
Establish an extensive Information Security (IS) Program and governance structure to manage the Security of theInformation assets.
71243Annual Report 2020
Notes to and forming part of the Consolidated Financial StatementsFor the year ended December 31, 2020

NOTES TO AND FORMING PART OF THE CONSOLIDATED FINANCIAL STATEMENTS FOR THE YEAR ENDED DECEMBER 31, 2020
49.2 Credit risk
49.2.1 Lendings to financial institutions
2020 2019 2020 2019 2020 2019Credit risk by public / private sector
Public / Government 6,433,114 - - - - - Private 15,779,328 21,692,946 - - - -
22,212,442 21,692,946 - - - -
------------------------------------------------- (Rupees in '000) ------------------------------------------
Concentrations of credit risk exist if clients are engaged in similar activities, or are located in the same geographical region,or have comparable economic characteristics such that their ability to meet contractual obligations would be similarlyaffected by changes in economic, political or other conditions. The Bank manages, limits and controls concentrations ofcredit risk to individual counterparties and groups, and to industries, where appropriate. Limits are also applied toportfolios or sectors where the Bank considers it appropriate to restrict credit risk concentrations, or to areas of higher risk,or to control the rate of portfolio growth.
Gross lendings Non-performing lendings Provision held
The Risk Management function of the Bank is regularly conducting assessments of the credit portfolio to identify borrowersmost likely to get affected due to changes in the business and economic environment. The Bank has further strengthenedits credit review procedures in the light of COVID-19. The Bank is continuously reviewing the portfolio, to identify accountssusceptible to higher risk, resulting from the COVID-19 outbreak.
IFRS 9 is applicable to the overseas branches of the Bank and requires the estimation of Expected Credit Loss (ECL)based on current and forecast economic conditions. The Bank has reviewed the potential impact of the COVID-19 outbreakon the inputs and assumptions for IFRS 9 ECL measurement in light of available information. Overall, the COVID-19situation remains fluid and is rapidly evolving at this point, which makes it challenging to reliably reflect impacts in ECLestimates. The Bank is assessing the situation as it develops and is in the process of accounting for the same in its ECLestimates.
The State Bank of Pakistan (SBP) has responded to the crisis by cutting the policy rate by 625 basis points to 7 percentand by introducing regulatory measures to maintain banking system soundness and to sustain economic activity. Theseinclude (i) reducing the capital conservation buffer by 100 basis points to 1.5 percent; (ii) increasing the regulatory limit onextension of credit to SMEs by 44 percent to Rs. 180 million; (iii) relaxing the debt burden ratio for consumer loans from 50percent to 60 percent; (iv) allowing banks to defer clients’ payment of principal on loan obligations by one year; and (v)relaxing regulatory criteria for restructured/rescheduled loans for borrowers who require relief beyond the extension ofprincipal repayment for one year and / or mark-up with no reflection on credit history; and Introduction of refinancingschemes for payment of wages and salaries.
COVID-19 have impacted banks in Pakistan on a number of fronts including increase in overall credit risk pertaining to theloans and advances portfolio, reduced fee income due to overall slowdown in economic activity, continuity of businessoperations and managing cybersecurity threat as a significant number of the Bank’s staff is working from home and an everincreasing number of customers are being encouraged to use digital channels.
Credit risk is the risk that a customer or counterparty may not settle an obligation for full value, either when due or at anytime thereafter. This risk arises from the potential that a customer's or counterparty’s willingness or ability to meet such anobligation is impaired, resulting in an economic loss to the Bank.
The credit risk management process is driven by the Bank's Risk Management Policy, Credit Policy for Corporate,Commercial, SME & Agri, Collateral Management Policy, Credit Policy International, Credit Policy UAE and Credit Manual,which provides policies and procedures in relation to credit initiation, approval, documentation and disbursement, creditmaintenance and remedial management.
Individual credit authorities are delegated to credit officers by the Group Executive - Risk & Credit Policy (authorised byBoD), according to their seasoning / maturity. Approvals for Consumer loans are centralized, while approval authorities forInternational, Corporate, Commercial, SME and Agri exposures are delegated at a Country / Regional level. Furthermore,credit authorities are also delegated to business teams in various regions for Commercial, SME & Agri lending. All creditpolicy functions domestic & international are centrally organized.
72United Bank Limited244
Notes to and forming part of the Consolidated Financial StatementsFor the year ended December 31, 2020

NOTES TO AND FORMING PART OF THE CONSOLIDATED FINANCIAL STATEMENTS FOR THE YEAR ENDED DECEMBER 31, 2020
49.2.2 Investment in debt securities
2020 2019 2020 2019 2020 2019Credit risk by industry sector
Airlines - 391,504 - 391,504 - - Automobile and transportation equipment 3,517,627 6,180,479 - - - - Chemical and pharmaceuticals 163,719 194,104 61,263 91,288 61,263 91,288Construction 1,330,566 1,815,899 - - - - Electronics and electrical appliances - - - - - - Exports/Imports 734,470 773,421 - - - - Fertilizers 252,767 17,362,227 - - - - Financial 1,118,514,874 770,651,869 2,004,405 78,784 510,210 78,784Food 436 - 436 - 436Insurance 62,207 1,607,579 - - - - Power (electricity), gas, water, sanitary 19,112,814 24,462,115 - - - - Telecommunication - 837,100 - - - - Textile 529,263 529,262 228,925 228,922 228,925 228,923Others 6,925,920 34,090,968 1,872 2,309 1,872 2,309
1,151,144,663 858,896,527 2,296,901 792,807 802,706 401,304
2020 2019 2020 2019 2020 2019Credit risk by public / private sector
Public / Government 1,022,772,243 823,375,824 - 391,504 - - Private 128,372,420 35,520,703 2,296,901 401,303 802,706 401,304
1,151,144,663 858,896,527 2,296,901 792,807 802,706 401,304
49.2.3 Advances
Credit risk by industry sector 2020 2019 2020 2019 2020 2019
Agri business 7,598,682 9,637,263 1,170,019 716,680 599,102 316,451Airlines 5,401,008 7,495,899 1,452,187 1,429,361 1,452,187 1,429,288Automobile and transportation equipment 21,781,261 16,857,339 670,160 122,851 166,469 122,105Cables 1,026,167 1,175,344 616,751 646,792 616,751 646,792Cement 8,822,532 7,919,680 285,636 278,426 285,636 136,211Chemical and pharmaceuticals 6,336,985 12,846,614 113,399 127,834 113,399 120,009Construction 22,498,752 27,603,129 7,112,201 7,124,989 6,159,594 3,691,935Contractors 4,753,204 9,971,659 1,120,451 842,215 1,120,451 679,587Electronics and electrical appliances 10,092,057 13,708,661 8,367,344 8,243,692 6,366,180 6,230,582Engineering 15,557,031 20,368,902 1,516,238 1,109,848 446,044 39,379Fertilizer dealers 11,819,949 14,811,984 63,246 53,298 61,996 46,548Financial 50,589,366 49,738,983 3,530,909 3,459,784 3,530,910 3,459,718Food industries 70,998,888 81,992,107 7,514,318 7,479,545 5,609,657 5,475,103Glass and allied 277,867 386,633 - - - - Hotels 3,664,003 2,111,627 595,259 616,777 595,259 616,777Individuals 67,544,297 69,625,877 8,436,830 8,564,083 5,733,393 5,282,435Paper and allied 2,013,682 2,000,326 639,480 625,182 628,987 614,656Polyester and fiber 3,280,957 4,498,424 1,577,051 1,577,051 1,577,051 1,577,051Production and transmission of energy 155,746,888 193,356,305 5,068,974 4,890,901 3,391,991 4,925,046Shoes and leather garments 2,816,497 2,975,885 2,191,352 2,320,414 2,189,602 2,281,613Sports goods 173,915 272,124 4,300 5,100 4,300 5,100Sugar 4,454,866 5,626,661 175,729 180,729 175,729 180,729Surgical and metal 200,557 42,987 - - - - Telecommunication 24,101,854 20,027,491 3,293,224 2,815,881 3,293,224 2,827,769Textile composite 40,862,679 32,023,671 3,782,368 3,910,358 3,782,368 3,910,358Textile others 11,989,559 17,595,545 2,047,876 2,402,729 2,041,748 2,395,346Textile spinning 12,912,492 19,088,233 3,662,420 3,867,407 3,662,420 3,867,407Textile weaving 5,975,856 7,819,768 351,348 421,724 351,348 356,813Wholesale traders 38,286,171 35,673,686 11,210,283 8,069,156 10,600,840 7,977,518Others 79,624,528 74,802,537 8,687,513 5,929,786 7,480,361 4,675,589
691,202,550 762,055,344 85,256,866 77,832,593 72,036,997 63,887,915
Gross investments Non-performing investments Provision held
------------------------------------------------- (Rupees in '000) ------------------------------------------
Gross investments Non-performing investments Provision held
------------------------------------------------- (Rupees in '000) ------------------------------------------
Gross advances Non-performing advances Provision held
------------------------------------------------- (Rupees in '000) ------------------------------------------
245Annual Report 2020
Notes to and forming part of the Consolidated Financial StatementsFor the year ended December 31, 2020

NOTES TO AND FORMING PART OF THE CONSOLIDATED FINANCIAL STATEMENTS FOR THE YEAR ENDED DECEMBER 31, 2020
Credit risk by public / private sector 2020 2019 2020 2019 2020 2019
Public / Government 205,551,504 331,031,291 1,089,630 1,089,630 22,313 22,313Private 485,651,046 431,024,053 84,167,236 76,742,963 72,014,684 63,865,602
691,202,550 762,055,344 85,256,866 77,832,593 72,036,997 63,887,915
49.2.4 Contingencies and Commitments 2020 2019
Credit risk by industry sector Agri business 17,715,477 5,468,525Airlines 2,262,738 1,799,768Automobile and transportation equipment 1,957,467 1,969,736Cables 574,708 359,209Cement 2,684,328 5,557,937Chemical and pharmaceuticals 4,807,699 3,534,842Construction 5,062,724 12,048,828Containers and ports 1,069,170 1,154,416Contractors 1,782,745 2,649,175Electronics and electrical appliances 2,468,867 398,469Engineering 9,018,950 8,274,367Fertilizer dealers 5,651,372 3,179,706Financial 767,692,723 1,075,399,609Food industries 5,254,917 7,336,979Glass and allied 186,220 287,000Hotels 2,015,989 69,740Individuals 18,277,661 15,431,641Paper and allied 1,686,887 2,638,436Polyester and fiber 2,829,494 3,819,949Production and transmission of energy 127,733,243 142,488,054Shoes and leather garments 30,075 56,330Sugar 58,914 99,262Surgical and metal 507,612 155,994Telecommunication 4,985,508 14,700,186Textile composite 1,899,882 673,835Textile others 6,064,991 6,143,341Textile spinning 6,375,600 2,261,400Textile weaving 2,284,934 1,614,426Wholesale traders 1,434,752 1,270,211Others 130,131,893 143,111,207
1,134,507,540 1,463,952,578Credit risk by public / private sector Public / Government 256,923,452 426,665,080Private 877,584,088 1,037,287,498
1,134,507,540 1,463,952,57849.2.5 Concentration of Advances
2020 2019
Funded 140,816,028 175,759,229Non Funded 144,008,127 131,997,318Total Exposure 284,824,155 307,756,547
The sanctioned limits against these top 10 exposures aggregated to Rs. 306,651 million (2019: Rs. 322,710 million).
------- (Rupees in '000) -------
The Bank's top 10 exposures on the basis of total (funded and non-funded exposures) aggregated to Rs. 284,824.155million (2019: Rs. 307,756.547 million) are as following:
------- (Rupees in '000) -------
Gross advances Non-performing advances Provision held
------------------------------------------------- (Rupees in '000) ------------------------------------------
74United Bank Limited246
Notes to and forming part of the Consolidated Financial StatementsFor the year ended December 31, 2020

NOTES TO AND FORMING PART OF THE CONSOLIDATED FINANCIAL STATEMENTS FOR THE YEAR ENDED DECEMBER 31, 2020
49.2.6 Advances - Province / Region-wise Disbursement & Utilisation
Province / Region
Punjab 127,665,134 127,665,134 - - - - - Sindh 195,268,735 - 195,268,735 - - - - KPK including FATA 986,009 - - 986,009 - - - Balochistan 826,969 - - - 826,969 - - Islamabad 117,094,564 - - - - 117,094,564 - AJK including Gilgit-Baltistan 119,277 - - - - - 119,277Total 441,960,688 127,665,134 195,268,735 986,009 826,969 117,094,564 119,277
Province / Region
Punjab 163,251,257 163,251,257 - - - - - Sindh 221,221,535 - 221,221,535 - - - - KPK including FATA 1,409,927 - - 1,409,927 - - - Balochistan 869,842 - - - 869,842 - - Islamabad 120,402,344 - - - - 120,402,344 - AJK including Gilgit-Baltistan 151,138 - - - - - 151,138Total 507,306,043 163,251,257 221,221,535 1,409,927 869,842 120,402,344 151,138
49.3 Market Risk
The functions of the Market Risk Management unit are as follows:
- To keep the market risk exposure within the Bank’s risk appetite as assigned by the BoD and the BRCC.
-
2020
Disburse-ments
Utilisation
Punjab Sindh KPK including FATA Balochistan Islamabad
AJK including
Gilgit-Baltistan
-------------------------------------------- (Rupees in '000) --------------------------------------
2019
Disburse-ments
Utilisation
Punjab Sindh KPK including FATA Balochistan Islamabad
AJK including
Gilgit-Baltistan
-------------------------------------------- (Rupees in '000) --------------------------------------
Market risk is the risk that the fair value of a financial instrument will fluctuate due to movements in market prices. Itresults from changes in interest rates, exchange rates and equity prices as well as from changes in the correlationsbetween them. Each of these components of market risk consists of a general market risk and a specific market risk thatis driven by the nature and composition of the portfolio.
Measuring and controlling market risk is usually carried out at a portfolio level. However, certain controls are applied,where necessary, to individual risk types, to particular books and to specific exposures. Controls are also applied toprevent any undue risk concentrations in trading books, taking into account variations in price, volatility, market depth andliquidity. These controls include limits on exposure to individual market risk variables as well as limits on concentrations oftenors and issuers.
Trading activities are centered in the Treasury and Capital Markets Group which facilitates clients and also runsproprietary positions. The Bank is active in the cash and derivative markets for equity, interest rate and foreign exchange.
The Market and Treasury Risk division performs market risk management activities. Within this division, the Market RiskManagement unit is responsible for the development and review of market risk policies and processes, and is involved inresearch, financial modeling and testing / implementation of risk management systems, while Treasury Middle Office isresponsible for implementation and monitoring of market risk and other policies, escalation of deviations to seniormanagement, and MIS reporting.
To develop, review and upgrade procedures for the effective implementation of market risk management policiesapproved by the BoD and BRCC.
75 247Annual Report 2020
Notes to and forming part of the Consolidated Financial StatementsFor the year ended December 31, 2020

NOTES TO AND FORMING PART OF THE CONSOLIDATED FINANCIAL STATEMENTS FOR THE YEAR ENDED DECEMBER 31, 2020
-
-
49.3.1 Balance sheet split by trading and Banking books
Banking book
Trading book Total Banking
book Trading
book Total
Cash and balances with treasury banks 258,139,459 - 258,139,459 243,370,701 - 243,370,701Balances with other banks 29,583,028 - 29,583,028 42,958,677 - 42,958,677Lendings to financial institutions 22,212,442 - 22,212,442 21,692,946 - 21,692,946Investments 473,506,698 694,296,814 1,167,803,512 481,796,303 392,639,599 874,435,902Advances 611,851,676 - 611,851,676 694,548,909 - 694,548,909Fixed assets 57,467,580 - 57,467,580 58,276,411 - 58,276,411Intangible assets 2,034,551 - 2,034,551 2,070,938 - 2,070,938Deferred tax assets 4,682,494 - 4,682,494 1,723,553 - 1,723,553Other assets 48,101,456 - 48,101,456 83,740,942 - 83,740,942
1,507,579,384 694,296,814 2,201,876,198 1,630,179,380 392,639,599 2,022,818,979
49.3.2 Foreign Exchange Risk
2020 2019
US Dollar 239,260,492 156,482,938 (82,520,635) 256,919 258,417,224 178,391,299 (81,396,583) (1,370,658)Pound Sterling 103,199,482 105,663,768 18,988,835 16,524,549 71,297,070 77,190,868 20,344,001 14,450,203Japanese Yen 117,063 98,096 (16,149) 2,818 140,649 116,872 (18,246) 5,531Euro 4,861,379 9,554,178 4,725,445 32,646 4,002,248 9,188,690 5,327,214 140,772UAE Dirham 73,959,036 156,890,634 81,890,688 (1,040,910) 95,773,140 183,810,055 89,194,894 1,157,979Bahraini Dinar 13,936,810 26,800,952 11,751,534 (1,112,608) 15,484,445 25,325,947 10,065,814 224,312Qatari Riyal 16,168,969 28,718,594 12,279,612 (270,013) 18,613,184 27,147,501 9,359,104 824,787Other Currencies 12,453,437 9,484,821 1,359,952 4,328,568 10,400,587 7,640,844 710,475 3,470,218
463,956,668 493,693,981 48,459,282 18,721,969 474,128,547 508,812,076 53,586,673 18,903,144
Foreign Exchange Risk is the risk that the fair value of a financial instrument will fluctuate due to changes in foreignexchange rates. Exposures are monitored by currency to ensure that they remain within the established limits for eachcurrency. Exposures are also monitored on an overall basis to ensure compliance with the Bank’s SBP approved ForeignExchange Exposure Limit.
To review new product proposals and propose / recommend / approve procedures for the management of theirmarket risk. Various limits are assigned to different businesses on a product / portfolio basis. The products areapproved through product programs, where risks are identified and limits and parameters are set. Any transactions/ products falling outside these product programs are approved through separate transaction / product memos.
To maintain a comprehensive database for performing risk analysis, stress testing and scenario analysis. Stresstesting activities are performed on a quarterly basis on both the Banking and Trading books.
2020 2019
-------------------------------------------- (Rupees in '000) --------------------------------------
The Bank is an active participant in the cash and derivatives markets for currencies and carries currency risk from thesetrading activities, conducted primarily by the Treasury and Capital Markets Group (TCM). These trading exposures aremonitored through prescribed stress tests and sensitivity analyses.
The Bank's reporting currency is the Pakistan Rupee, but its assets, liabilities, income and expenses are denominated inmultiple currencies. From time to time, TCM proactively hedges foreign currency exposures resulting from its marketmaking activities, subject to pre-defined limits.
Foreign Currency
Assets
Foreign Currency Liabilities
Off-balance sheet items
Net foreign currency exposure
Foreign Currency
Assets
Foreign Currency Liabilities
Off-balance sheet items
Net foreign currency exposure
------------------------------------------------------------------------------------------------ (Rupees in '000) ------------------------------------------------------------------------------------------------
76United Bank Limited248
Notes to and forming part of the Consolidated Financial StatementsFor the year ended December 31, 2020

NOTES TO AND FORMING PART OF THE CONSOLIDATED FINANCIAL STATEMENTS FOR THE YEAR ENDED DECEMBER 31, 2020
Banking book
Trading book
Banking book
Trading book
Impact of 1% change in foreign exchange rates on
- Profit and loss account +1% change - - - -
-1% change - - - -
- Other comprehensive income +1% change 187,220 - 189,031 - -1% change (187,220) - (189,031) -
49.3.3 Equity position Risk
Banking book
Trading book
Banking book
Trading book
Impact of 5% change in equity prices on,Other comprehensive income
+5% change - 552,685 - 709,219 -5% change - (552,685) - (709,219)
49.3.4 Yield / Interest Rate Risk in the Banking Book (IRRBB) - Basel II Specific
Banking book
Trading book
Banking book
Trading book
Impact of 1% change in interest rates on - Profit and loss account +1% change (1,283,867) (3,363) (817,943) (141,853) -1% change 1,314,457 3,363 875,384 141,853 - Other comprehensive income +1% change (4,314,788) (1,731,516) (4,639,066) (1,630,607) -1% change 4,314,788 1,731,516 4,639,066 1,630,607
---------------------------- Rupees in '000 ----------------------------
2020 2019
---------------------------- Rupees in '000 ----------------------------
Equity position risk is the risk that the fair value of a financial instrument will fluctuate due to changes in the prices ofindividual stocks or the levels of equity indices. The Bank’s equity book comprises of held for trading (HFT) and availablefor sale (AFS) portfolios. The objective of the HFT portfolio is to make short-term capital gains, whilst the AFS portfolio ismaintained with a medium term view of earning both capital gains and dividend income. The Bank has availed therelaxation given by the SBP in respect of determining the impairment charge against AFS securities and has accordinglyrecognised the impairment charge in a phased manner equally on a quarterly basis during the year ended December 31,2020. Product program manuals have been developed to provide guidelines on the objectives and policies, risks andmitigants, limits and controls for the equity portfolios of the Bank.
2020 2019
---------------------------- Rupees in '000 ----------------------------
Interest rate risk is the risk that fair value of a financial instrument will fluctuate as a result of changes in interest rates,including changes in the shape of yield curves. Interest rate risk is inherent in many of the Bank's businesses and arisesfrom mismatches between the contractual maturities or the re-pricing of on and off balance sheet assets and liabilities.The interest rate sensitivity profile is prepared on a quarterly basis based on the re-pricing or contractual maturities ofassets and liabilities.
Interest rate risk is monitored and managed by performing periodic gap analysis, sensitivity analysis and stress testingand taking appropriate actions where required.
2020 2019
77249Annual Report 2020
Notes to and forming part of the Consolidated Financial StatementsFor the year ended December 31, 2020

NO
TES
TO A
ND
FO
RM
ING
PAR
T O
F TH
E C
ON
SOLI
DAT
ED F
INAN
CIA
L ST
ATEM
ENTS
FO
R T
HE
YEAR
EN
DED
DEC
EMB
ER 3
1, 2
020
49.3
.5
Upto
1 m
onth
Over
1 m
onth
to
3 m
onth
sOv
er 3
mon
ths
to 6
mon
ths
Over
6 m
onth
s to
1 ye
arOv
er 1
year
to 2
year
sOv
er 2
year
s to
3 yea
rsOv
er 3
year
s to
5 yea
rsOv
er 5
year
s to
10 ye
ars
Over
10 ye
ars
%On
-bala
nce s
heet
fina
ncial
inst
rum
ents
Asse
tsCa
sh an
d bala
nces
with
trea
sury
bank
s0.0
7%25
8,139
,459
14,63
6,825
-
-
-
-
-
-
-
-
243,5
02,63
4
Ba
lance
s with
othe
r ban
ks1.4
7%29
,583,0
28
4,0
90,46
3
1,599
,953
-
-
-
-
-
-
-
23,89
2,612
Lend
ings t
o fina
ncial
insti
tution
s9.0
0%22
,212,4
42
20
,967,9
25
1,0
00,00
0
-
11
9,998
-
-
-
-
-
12
4,519
Inves
tmen
ts9.5
4%1,1
67,80
3,512
12
7,240
,088
339,7
31,69
9
30
0,861
,380
82,67
3,870
108,9
50,46
0
4,7
58,55
7
48,46
4,294
85,67
3,366
-
69
,449,7
98
Ad
vanc
es
Perfo
rming
9.11%
598,6
31,80
7
83
,921,4
16
29
6,448
,150
133,8
32,85
1
18
,286,1
71
6,4
61,20
9
5,841
,422
11
,238,8
01
28
,696,9
40
10
,452,0
59
3,4
52,78
8
Non-
perfo
rming
- ne
t of p
rovis
ion13
,219,8
69
-
-
-
-
-
-
-
-
-
13,21
9,869
Othe
r ass
ets36
,922,9
38
-
-
-
-
-
-
-
-
-
36,92
2,938
2,126
,513,0
55
250,8
56,71
7
63
8,779
,802
434,6
94,23
1
10
1,080
,039
115,4
11,66
9
10
,599,9
79
59
,703,0
95
11
4,370
,306
10,45
2,059
390,5
65,15
8
Liab
ilities
Bills
paya
ble29
,741,2
06
-
-
-
-
-
-
-
-
-
29,74
1,206
Borro
wing
s6.9
7%13
1,827
,185
65,77
6,619
22,84
5,918
6,870
,621
12
,189,5
17
1,2
45,97
8
1,422
,721
21
,087,7
74
-
-
38
8,037
Depo
sits a
nd ot
her a
ccou
nts4.0
2%1,7
64,39
2,286
89
,530,5
31
74
5,867
,434
53,99
1,988
47,18
0,183
16,97
8,078
22,74
9,416
58,72
8,986
3,689
,601
15
0
725,6
75,91
9
Lia
bilitie
s aga
inst a
ssets
subje
ct to
finan
ce le
ase
15,95
7
-
-
-
-
-
-
-
-
-
15,95
7
Su
bord
inated
debt
11.00
%10
,000,0
00
10
,000,0
00
-
-
-
-
-
-
-
-
-
Othe
r liab
ilities
39,15
9,161
-
-
-
-
-
-
-
-
-
39
,159,1
61
1,9
75,13
5,795
16
5,307
,150
768,7
13,35
2
60
,862,6
09
59
,369,7
00
18
,224,0
56
24
,172,1
37
79
,816,7
60
3,6
89,60
1
150
79
4,980
,280
On-b
alanc
e she
et g
ap
151,3
77,26
0
85
,549,5
67
(1
29,93
3,550
)
37
3,831
,622
41,71
0,339
97,18
7,613
(13,5
72,15
8)
(2
0,113
,665)
110,6
80,70
5
10
,451,9
09
(4
04,41
5,122
)
Net n
on fi
nanc
ial as
sets
56,25
4,626
Tota
l net
asse
ts20
7,631
,886
Off-b
alanc
e she
et fi
nanc
ial in
stru
men
tsInt
eres
t Rate
Der
ivativ
es -
Long
posit
ion
-
-
-
-
-
-
-
-
-
-
-
Int
eres
t Rate
Der
ivativ
es -
Shor
t pos
ition
-
-
-
-
-
-
-
-
-
-
-
FX
Opti
ons -
Long
posit
ion-
-
-
-
-
-
-
-
-
-
-
FX O
ption
s - S
hort
posit
ion-
-
-
-
-
-
-
-
-
-
-
Forw
ard P
urch
ase o
f Gov
ernm
ent S
ecur
ities
-
-
-
-
-
-
-
-
-
-
-
Fo
rwar
d Sale
of G
over
nmen
t Sec
uritie
s-
-
-
-
-
-
-
-
-
-
-
Fore
ign cu
rrenc
y for
ward
purch
ases
366,7
97,66
6
13
0,807
,996
100,3
57,08
8
75
,434,1
66
35
,085,1
23
-
-
-
-
-
25,11
3,293
Fore
ign cu
rrenc
y for
ward
sales
(316
,267,9
81)
(123
,006,6
01)
(82,6
79,37
3)
(5
0,909
,910)
(35,1
00,61
9)
-
-
-
-
-
(24,5
71,47
8)
Off-b
alanc
e she
et G
ap50
,529,6
85
7,8
01,39
5
17,67
7,715
24,52
4,256
(15,4
96)
-
-
-
-
-
54
1,815
Tota
l Yiel
d / In
tere
st R
ate R
isk S
ensit
ivity
Gap
201,9
06,94
5
93
,350,9
62
(1
12,25
5,835
)
39
8,355
,878
41,69
4,843
97,18
7,613
(13,5
72,15
8)
(2
0,113
,665)
110,6
80,70
5
10
,451,9
09
(4
03,87
3,307
)
Cum
ulat
ive Y
ield
/ Inte
rest
Rat
e Risk
Sen
sitivi
ty G
ap93
,350,9
62
(1
8,904
,873)
379,4
51,00
5
42
1,145
,848
518,3
33,46
1
50
4,761
,303
484,6
47,63
8
59
5,328
,343
605,7
80,25
2
20
1,906
,945
------
------
------
------
------
------
------
------
------
------
------
------
------
------
------
------
------
------
------
-----
(Rup
ees i
n '00
0) --
------
------
------
------
------
------
------
------
------
------
------
------
------
------
------
------
------
------
------
---
Mis
mat
ch o
f int
eres
t rat
e se
nsiti
ve a
sset
s an
d lia
bilit
ies
2020
Effe
ctive
yield
/ in
tere
st ra
teTo
tal
Expo
sed
to yi
eld / i
nter
est r
ate r
iskNo
n-in
tere
st
bear
ing
finan
cial
inst
rum
ents
78
United Bank Limited250
Not
es to
and
form
ing
part
of t
he C
onso
lidat
ed F
inan
cial
Sta
tem
ents
For t
he y
ear e
nded
Dec
embe
r 31,
202
0

NOTE
S TO
AND
FOR
MIN
G PA
RT O
F TH
E CO
NSOL
IDAT
ED F
INAN
CIAL
STA
TEM
ENTS
FO
R TH
E YE
AR E
NDED
DEC
EMBE
R 31
, 202
0
Upto
1 mon
thOv
er 1 m
onth
to 3 m
onths
Over
3 mon
ths
to 6 m
onths
Over
6 mon
ths
to 1 y
ear
Over
1 yea
r to 2
ye
arsOv
er 2 y
ears
to 3 y
ears
Over
3 yea
rs to
5 yea
rsOv
er 5 y
ears
to 10
years
Over
10 ye
ars
%On
-balan
ce sh
eet fi
nanc
ial in
strum
ents
Asse
tsCa
sh an
d bala
nces
with
treas
ury ba
nks
0.26%
243,3
70,70
1
18
,775,2
52
-
-
-
-
-
-
-
-
22
4,595
,449
Balan
ces w
ith ot
her b
anks
3.92%
42,95
8,677
14,47
1,460
4,114
,633
41
4,242
-
-
-
-
-
-
23,95
8,342
Lend
ings t
o fina
ncial
insti
tution
s11
.10%
21,69
2,946
21,46
0,699
-
-
-
23
2,247
-
-
-
-
-
Inv
estm
ents
9.83%
874,4
35,90
2
13
2,620
,728
176,2
58,59
7
75
,364,0
95
82
,406,6
08
13
0,994
,342
97,82
9,747
59,68
5,713
92,95
9,094
5,719
,743
20
,597,2
35
Ad
vanc
es
Perfo
rming
10.47
%68
0,604
,231
215,0
06,22
7
21
4,441
,134
187,6
24,34
4
27
,097,7
74
4,5
84,85
9
1,936
,494
24
,338,7
98
2,1
58,27
2
519,1
32
2,8
97,19
7
Non-p
erform
ing - n
et of
provis
ion13
,944,6
78
-
-
-
-
-
-
-
-
-
13,94
4,678
Othe
r ass
ets58
,210,2
62
-
-
-
-
-
-
-
-
-
58,21
0,262
1,935
,217,3
97
402,3
34,36
6
39
4,814
,364
263,4
02,68
1
10
9,504
,382
135,8
11,44
8
99
,766,2
41
84
,024,5
11
95
,117,3
66
6,2
38,87
5
344,2
03,16
3
Liabil
ities
Bills
paya
ble22
,929,2
20
-
-
-
-
-
-
-
-
-
22,92
9,220
Borro
wing
s8.7
9%17
0,405
,060
80,51
6,873
41,24
0,233
7,405
,589
16
,077,1
88
24
,576,9
02
-
-
-
-
58
8,275
Depo
sits a
nd ot
her a
ccou
nts4.8
9%1,5
57,99
5,306
10
6,138
,117
631,6
20,34
9
65
,878,8
82
30
,552,7
09
56
,857,7
11
12
,737,6
53
16
,067,2
64
33
,300,7
03
4,2
34,30
1
600,6
07,61
7
Lia
bilitie
s aga
inst a
ssets
subje
ct to
finan
ce le
ase
19,09
5
-
-
-
-
-
-
-
-
-
19,09
5
Su
bordi
nated
debt
13.51
%10
,000,0
00
10
,000,0
00
-
-
-
-
-
-
-
-
-
Othe
r liab
ilities
48,17
3,086
-
-
-
-
-
-
-
-
-
48
,173,0
86
1,8
09,52
1,767
19
6,654
,990
672,8
60,58
2
73
,284,4
71
46
,629,8
97
81
,434,6
13
12
,737,6
53
16
,067,2
64
33
,300,7
03
4,2
34,30
1
672,3
17,29
3
On-ba
lance
shee
t gap
12
5,695
,630
205,6
79,37
6
(27
8,046
,218)
190,1
18,21
0
62
,874,4
85
54
,376,8
35
87
,028,5
88
67
,957,2
47
61
,816,6
63
2,0
04,57
4
(328,1
14,13
0)
Net n
on fin
ancia
l ass
ets65
,176,2
41
Total
net a
ssets
190,8
71,87
1
Off-b
alanc
e she
et fin
ancia
l instr
umen
tsInt
erest
Rate
Deriv
ative
s - Lo
ng po
sition
31
6,500
-
31
6,500
-
-
-
-
-
-
-
-
Intere
st Ra
te De
rivati
ves -
Sho
rt pos
ition
(316,5
00)
-
(316,5
00)
-
-
-
-
-
-
-
-
FX
Opti
ons -
Long
posit
ion61
,297
61,29
7
-
-
-
-
-
-
-
-
-
FX O
ption
s - S
hort p
ositio
n(61
,297)
(61,29
7)
-
-
-
-
-
-
-
-
-
Forw
ard P
urcha
se of
Gov
ernme
nt Se
curiti
es3,0
43,54
1
-
3,0
43,54
1
-
-
-
-
-
-
-
-
Forw
ard S
ale of
Gov
ernme
nt Se
curiti
es(11
,264,1
79)
(2,00
8,835
)
-
-
(9,20
8,510
)
-
(46
,834)
-
-
-
-
Forei
gn cu
rrenc
y forw
ard pu
rchas
es50
8,996
,241
224,8
24,75
6
14
9,166
,343
107,6
94,18
1
27
,310,9
61
-
-
-
-
-
-
Fo
reign
curre
ncy f
orward
sales
(453,3
49,53
6)
(21
4,401
,442)
(121,6
36,94
9)
(98
,569,4
24)
(18,74
1,721
)
-
-
-
-
-
-
Of
f-bala
nce s
heet
Gap
47,42
6,067
8,414
,479
30
,572,9
35
9,1
24,75
7
(639,2
70)
-
(46,83
4)
-
-
-
-
Total
Yield
/ Inte
rest R
ate R
isk Se
nsitiv
ity G
ap17
3,121
,697
214,0
93,85
5
(24
7,473
,283)
199,2
42,96
7
62
,235,2
15
54
,376,8
35
86
,981,7
54
67
,957,2
47
61
,816,6
63
2,0
04,57
4
(328,1
14,13
0)
Cumu
lative
Yield
/ Inte
rest R
ate R
isk Se
nsitiv
ity G
ap21
4,093
,855
(33,37
9,428
)
16
5,863
,539
228,0
98,75
4
28
2,475
,589
369,4
57,34
3
43
7,414
,590
499,2
31,25
3
50
1,235
,827
173,1
21,69
7
------
------
------
------
------
------
------
------
------
------
------
------
------
------
------
------
------
------
------
----- (
Rupe
es in
'000
) -----
------
------
------
------
------
------
------
------
------
------
------
------
------
------
------
------
------
------
------
2019
Effec
tive y
ield
/ inter
est r
ateTo
tal
Expo
sed t
o yiel
d / in
teres
t rate
risk
Non-i
nteres
t be
aring
fin
ancia
l ins
trume
nts
79
251Annual Report 2020
Not
es to
and
form
ing
part
of t
he C
onso
lidat
ed F
inan
cial
Sta
tem
ents
For t
he y
ear e
nded
Dec
embe
r 31,
202
0

NOTE
S TO
AND
FOR
MIN
G PA
RT O
F TH
E CO
NSOL
IDAT
ED F
INAN
CIAL
STA
TEM
ENTS
FO
R TH
E YE
AR E
NDED
DEC
EMBE
R 31
, 202
0
49.4
Oper
atio
nal r
isk
Ope
ratio
nal r
isk is
reco
gnize
d as
the
risk
of lo
ss re
sultin
g fro
m in
adeq
uate
or f
aile
d in
tern
al p
roce
sses
, peo
ple
and
syst
ems
or fr
om e
xter
nal e
vent
s.
49.5
Liqu
idity
risk
Liqu
idity
risk
is th
e ris
k th
at th
e Ba
nk m
ay b
e un
able
to m
eet i
ts o
blig
atio
ns o
r to
fund
incr
ease
s in
ass
ets
as th
ey fa
ll due
with
out i
ncur
ring
unac
cept
able
cos
t or l
osse
s.
Inco
mpl
ianc
ewi
thth
eRe
gula
tory
Gui
delin
es,a
nO
pera
tiona
lRisk
Divis
ion
ises
tabl
ished
with
inRi
sk&
Cred
itPo
licy
Gro
up.O
pera
tiona
lRisk
Divis
ion
ispr
imar
ilyre
spon
sible
fort
heov
ersig
htof
oper
atio
nalr
iskm
anag
emen
tacr
oss
the
Bank
.The
oper
atio
nalr
iskm
anag
emen
tfra
mew
ork
ofth
eBa
nkis
gove
rned
byth
eO
pera
tiona
lRisk
Man
agem
entP
olicy
and
Proc
edur
es,w
hile
the
impl
emen
tatio
nis
supp
orte
dby
anop
erat
iona
lrisk
man
agem
ents
yste
man
dde
signa
ted
oper
atio
nalr
iskco
ordi
nato
rswi
thin
diffe
rent
units
acro
ssth
eBa
nk.T
hefra
mew
ork
isin
line
with
inte
rnat
iona
lbes
tpra
ctice
s,fle
xible
enou
ghto
impl
emen
tin
stag
esan
dpe
rmits
the
over
alla
ppro
ach
toev
olve
inre
spon
seto
orga
niza
tiona
llear
ning
and
futu
rere
quire
men
ts.
Inac
cord
ance
with
the
Ope
ratio
nalR
iskpo
licy
and
fram
ewor
k,a
data
base
cove
ring
loss
es,c
ontro
lbre
ache
san
dne
arm
isses
isbe
ing
mai
ntai
ned
byth
edi
visio
n.M
ajor
risk
even
tsar
ean
alyz
edfro
mth
eco
ntro
lbre
ach
pers
pect
ivean
dm
itigat
ing
cont
rols
are
asse
ssed
onde
sign
and
oper
atin
gef
fect
ivene
ss.Q
uarte
rlyup
date
son
Ope
ratio
nalR
iskev
ents
are
bein
gpr
esen
ted
toth
eSe
nior
Man
agem
enta
ndBo
ard
Risk
&Co
mpl
ianc
eCo
mm
ittee
ofth
eBa
nk.P
erio
dic
work
shop
sar
eco
nduc
ted
for
Risk
&Co
ntro
lSel
f-Ass
essm
enta
ndke
yris
kex
posu
res
are
iden
tifie
dan
das
sess
edag
ains
texis
ting
cont
rols
toev
alua
teim
prov
emen
topp
ortu
nitie
s.Ke
yRi
skIn
dica
tors
are
also
defin
edfo
rmon
itorin
gof
risk
expo
sure
s.Ne
wpr
oduc
ts, s
yste
ms,
act
ivitie
s an
d pr
oces
ses,
are
sub
ject
to c
ompr
ehen
sive
oper
atio
nal r
isk a
sses
smen
ts, b
efor
e im
plem
enta
tion.
Busin
ess
Cont
inui
tyPl
ans
have
been
impl
emen
ted
acro
ssth
eBa
nk,c
lear
lyde
finin
gth
ero
les
and
resp
onsib
ilitie
sof
resp
ectiv
est
akeh
olde
rs,a
ndco
verin
gre
cove
ryst
rate
gy,I
Tan
dst
ruct
ural
bac
kups
, sce
nario
and
impa
ct a
nalys
es a
nd te
stin
g di
rect
ives.
The
Bank
’sap
proa
chto
liqui
dity
man
agem
enti
sto
ensu
re,a
sfa
ras
poss
ible
,tha
titw
illal
ways
have
suffi
cient
liqui
dity
tom
eeti
tslia
biliti
eswh
endu
e,un
derb
oth
norm
alan
dst
ress
edco
nditio
ns,
with
out
incu
rring
unac
cept
able
loss
esor
riskin
gsu
stai
ned
dam
age
tobu
sines
sfra
nchi
ses.
Ace
ntra
lized
appr
oach
isad
opte
d,ba
sed
onan
inte
grat
edfra
mew
ork
inco
rpor
atin
gan
asse
ssm
ento
fallm
ater
ialk
nown
and
expe
cted
cash
flows
and
the
avai
labi
lityof
colla
tera
lwhi
chco
uld
beus
edto
secu
read
ditio
nalf
undi
ngif
requ
ired.
The
fram
ewor
ken
tails
care
fulm
onito
ring
and
cont
rolo
fthe
daily
liqui
dity
posit
ion,
and
regu
larl
iqui
dity
stre
sste
stin
gun
dera
varie
tyof
scen
ario
s.Th
ese
enco
mpa
ssbo
thno
rmal
and
stre
ssed
mar
ket
cond
itions
, inc
ludi
ng g
ener
al m
arke
t cris
es a
nd th
e po
ssib
ility
that
acc
ess
to m
arke
ts c
ould
be
impa
cted
by
a st
ress
eve
nt a
ffect
ing
som
e pa
rt of
the
Bank
’s bu
sines
s.
The
Asse
tsan
dLi
abilit
ies
Man
agem
entC
omm
ittee
(ALC
O)o
fthe
Bank
isre
spon
sible
fort
heov
ersig
htof
liqui
dity
man
agem
enta
ndm
eets
ona
mon
thly
basis
orm
ore
frequ
ently
,if
requ
ired.
The
Bank
isclo
sely
mon
itorin
gth
esit
uatio
nan
dha
sin
voke
dre
quire
dac
tions
toen
sure
safe
tyan
dse
curit
yof
Bank
staf
fand
anun
inte
rrupt
edse
rvice
toou
rcus
tom
ers.
The
seni
orm
anag
emen
toft
heBa
nkis
cont
inuo
usly
mon
itorin
gth
esit
uatio
nan
dis
takin
gtim
ely
decis
ions
tore
solve
any
conc
erns
.Bus
ines
sCo
ntin
uity
Plan
s(B
CP)f
orre
spec
tive
area
sar
ein
plac
ean
dte
sted
.The
seni
orm
anag
emen
toft
heBa
nkis
cont
inuo
usly
mon
itorin
gth
esit
uatio
nan
dis
takin
gtim
ely
decis
ions
tore
solve
any
conc
erns
.The
Bank
has
signi
fican
tlyen
hanc
edth
em
onito
ring
ofcy
bers
ecur
ityris
ksdu
ring
thes
etim
es,t
hrou
ghits
info
rmat
ion
secu
rity
prot
ocol
s.Th
ere
mot
ewo
rkca
pabi
lities
were
enab
led
forc
ritica
lsta
ffan
dre
late
dris
kan
dco
ntro
lmea
sure
swe
reas
sess
edto
mak
esu
reth
eyar
efu
llypr
otec
ted
usin
gvir
tual
priva
tene
twor
k(“V
PN”)
conn
ectio
ns.F
urth
er,t
heBa
nkha
sal
soen
sure
dth
atits
rem
ote
acce
sssy
stem
s ar
e su
fficie
ntly
resil
ient
to a
ny u
nwan
ted
cybe
r-atta
cks.
Invie
wof
the
rela
xatio
ngr
ante
dby
SBP
ford
efer
ralo
fprin
cipal
and
mar
k-up
and
resc
hedu
ling
oflo
ans
ther
ewi
llbe
anim
pact
onth
em
atur
itypr
ofile
ofth
eBa
nk.T
heAs
seta
ndLi
abilit
yCo
mm
ittee
(ALC
O)o
fthe
Bank
isco
ntin
uous
lym
onito
ring
the
liqui
dity
posit
ion
and
the
Bank
isco
nfid
entt
hatt
heliq
uidi
tybu
fferc
urre
ntly
mai
ntai
ned
issu
fficie
ntto
cate
rto
any
adve
rse
mov
emen
t in
the
cash
flow
mat
urity
pro
file.
80
United Bank Limited252
Not
es to
and
form
ing
part
of t
he C
onso
lidat
ed F
inan
cial
Sta
tem
ents
For t
he y
ear e
nded
Dec
embe
r 31,
202
0

NO
TES
TO A
ND
FO
RM
ING
PAR
T O
F TH
E C
ON
SOLI
DAT
ED F
INAN
CIA
L ST
ATEM
ENTS
FO
R T
HE
YEAR
EN
DED
DEC
EMB
ER 3
1, 2
020
49.5
.1M
atur
ities
of a
sset
s an
d lia
bilit
ies
- bas
ed o
n ex
pect
ed m
atur
ities
of t
he a
sset
s an
d lia
bilit
ies
of th
e G
roup
(ALC
O)
Tota
lU
pto
1 m
onth
Ove
r 1
mon
th to
3
mon
ths
Ove
r 3
mon
ths
to 6
m
onth
s
Ove
r 6
mon
ths
to 1
ye
ar
Ove
r 1 y
ear
to 2
yea
rsO
ver 2
yea
rs
to 3
yea
rsO
ver 3
yea
rs
to 5
yea
rsO
ver 5
yea
rs
to 1
0 ye
ars
Ove
r 10
year
s
Asse
tsC
ash
and
bala
nces
with
trea
sury
ban
ks25
8,13
9,45
914
7,83
6,42
05,
066,
408
4,96
5,28
17,
187,
883
9,99
9,28
77,
672,
723
12,1
67,1
8350
,122
,466
13,1
21,8
08Ba
lanc
es w
ith o
ther
ban
ks29
,583
,028
21,6
93,2
502,
070,
356
5,31
7,60
750
1,81
5-
-
-
-
-
Lend
ings
to fi
nanc
ial i
nstit
utio
ns22
,212
,442
21,0
92,4
431,
000,
000
-
11
9,99
9-
-
-
-
-
Inve
stm
ents
1,16
7,80
3,51
275
,979
,879
178,
172,
798
144,
162,
841
104,
644,
449
135,
381,
143
45,3
91,7
1114
4,15
6,19
933
0,44
1,58
09,
472,
912
Adva
nces
- Pe
rform
ing
598,
631,
807
90,7
57,5
3094
,913
,476
94,3
34,2
9567
,853
,905
67,2
14,2
8653
,973
,022
94,2
68,8
1530
,092
,315
5,22
4,16
3Ad
vanc
es -
Non
-per
form
ing
- net
of p
rovi
sion
13,2
19,8
69-
-
-
-
-
-
-
1,35
1,79
411
,868
,075
Ope
ratin
g fix
ed a
sset
s57
,467
,580
6,41
1,56
048
3,46
379
6,14
592
3,88
42,
358,
877
2,26
3,28
12,
971,
622
4,74
9,64
136
,509
,107
Inta
ngib
le a
sset
s2,
034,
551
173,
047
7,90
410
,113
99,2
1228
2,01
543
9,82
174
4,76
027
7,67
9-
Def
erre
d ta
x as
sets
4,68
2,49
4-
-
-
1,17
0,62
31,
170,
623
1,17
0,62
41,
170,
624
-
-
Oth
er a
sset
s48
,101
,456
9,36
5,46
710
,824
,050
4,75
4,83
99,
825,
189
5,06
4,44
11,
262,
749
2,32
0,99
54,
374,
863
308,
863
2,20
1,87
6,19
837
3,30
9,59
629
2,53
8,45
525
4,34
1,12
119
2,32
6,95
922
1,47
0,67
211
2,17
3,93
125
7,80
0,19
842
1,41
0,33
876
,504
,928
Liab
ilitie
sBi
lls p
ayab
le29
,741
,206
10,6
37,2
007,
780,
787
7,62
5,48
23,
697,
737
-
-
-
-
-
Bo
rrow
ings
131,
827,
185
69,3
73,1
3526
,275
,519
7,57
9,70
334
,728
4,69
8,44
51,
189,
722
3,55
4,90
419
,121
,029
-
D
epos
its a
nd o
ther
acc
ount
s1,
764,
392,
286
234,
373,
167
168,
652,
779
107,
722,
793
128,
578,
333
130,
560,
631
114,
229,
849
186,
811,
450
506,
721,
822
186,
741,
462
Liab
ilitie
s ag
ains
t ass
ets
subj
ect t
o fin
ance
leas
e15
,957
15,9
57-
-
-
-
-
-
-
-
Su
bord
inat
ed d
ebt
10,0
00,0
00-
-
-
-
-
-
-
10,0
00,0
00-
Oth
er li
abilit
ies
58,2
67,6
7817
,982
,610
36,1
93,9
6819
3,82
21,
829,
880
207,
331
44,1
4273
,858
1,09
0,57
865
1,48
91,
994,
244,
312
332,
382,
069
238,
903,
053
123,
121,
800
134,
140,
678
135,
466,
407
115,
463,
713
190,
440,
212
536,
933,
429
187,
392,
951
Net
ass
ets
207,
631,
886
40,9
27,5
2753
,635
,402
131,
219,
321
58,1
86,2
8186
,004
,265
(3,2
89,7
82)
67,3
59,9
86(1
15,5
23,0
91)
(110
,888
,023
)
Rep
rese
nted
by:
Shar
e ca
pita
l12
,241
,797
Res
erve
s71
,020
,586
Surp
lus
on re
valu
atio
n of
ass
ets
29,3
34,2
12U
napp
ropr
iate
d pr
ofit
87,5
27,9
09N
on-c
ontro
lling
inte
rest
7,50
7,38
220
7,63
1,88
6
------
------
------
------
------
------
------
------
------
------
------
------
------
------
------
-- (R
upee
s in
'000
) ----
------
------
------
------
------
------
------
------
------
------
------
------
------
------
---
Asse
tsan
dLi
abilit
ies
havi
ngco
ntra
ctua
lmat
urity
date
sar
ebu
cket
edas
per
thei
rres
pect
ive
mat
uriti
es.T
hem
atur
itypr
ofile
ofno
n-co
ntra
ctua
ldep
osits
and
bills
paya
ble
ises
timat
edus
ing
anEx
pone
ntia
llyW
eigh
ted
Mov
ing
Aver
age
mod
elba
sed
onhi
stor
ical
data
.The
mat
urity
prof
ileof
certa
inno
n-co
ntra
ctua
lass
ets
and
liabi
litie
sw
hich
are
rela
ted
tosp
ecifi
cas
sets
and
liabi
litie
sfo
llow
sth
em
atur
itypr
ofile
ofth
eun
derly
ing
asse
torl
iabi
lity.
The
mat
urity
prof
ileof
othe
rnon
-con
tract
uala
sset
san
dlia
bilit
ies
isex
pect
edto
follo
whi
stor
ical
patte
rns
ofbe
havi
our.
The
met
hodo
logy
and
the
assu
mpt
ions
use
d to
der
ive
the
mat
urity
pro
file
of n
on-c
ontra
ctua
l ass
ets
and
liabi
litie
s ha
ve b
een
appr
oved
by
ALC
O.
2020
81
253Annual Report 2020
Not
es to
and
form
ing
part
of t
he C
onso
lidat
ed F
inan
cial
Sta
tem
ents
For t
he y
ear e
nded
Dec
embe
r 31,
202
0

NO
TES
TO A
ND
FO
RM
ING
PAR
T O
F TH
E C
ON
SOLI
DAT
ED F
INAN
CIA
L ST
ATEM
ENTS
FO
R T
HE
YEAR
EN
DED
DEC
EMB
ER 3
1, 2
020
Tota
lU
pto
1 m
onth
Ove
r 1
mon
th to
3
mon
ths
Ove
r 3
mon
ths
to 6
m
onth
s
Ove
r 6
mon
ths
to 1
ye
ar
Ove
r 1 y
ear
to 2
yea
rsO
ver 2
yea
rs
to 3
yea
rsO
ver 3
yea
rs
to 5
yea
rsO
ver 5
yea
rs
to 1
0 ye
ars
Ove
r 10
year
s
Asse
tsC
ash
and
bala
nces
with
trea
sury
ban
ks24
3,37
0,70
114
2,25
1,61
55,
666,
087
5,55
2,99
18,
038,
669
11,1
82,8
418,
580,
896
13,6
07,3
3836
,689
,021
11,8
01,2
43Ba
lanc
es w
ith o
ther
ban
ks42
,958
,677
24,0
03,1
3810
,311
,479
7,71
6,78
192
7,27
9-
-
-
-
-
Lend
ings
to fi
nanc
ial i
nstit
utio
ns21
,692
,946
21,4
60,6
98-
-
-
232,
248
-
-
-
-
Inve
stm
ents
874,
435,
902
146,
178,
407
106,
960,
278
43,4
46,3
4810
1,57
2,39
811
6,42
4,35
080
,484
,853
59,7
33,7
3120
4,34
8,08
915
,287
,448
Adva
nces
- Pe
rform
ing
680,
604,
231
146,
149,
885
92,3
58,9
2877
,806
,365
65,8
57,8
2655
,360
,785
51,5
75,0
7210
5,47
0,88
467
,933
,593
18,0
90,8
93Ad
vanc
es -
Non
-per
form
ing
- net
of p
rovi
sion
13,9
44,6
78-
-
-
-
-
-
-
-
13
,944
,678
Ope
ratin
g fix
ed a
sset
s58
,276
,411
6,38
6,12
136
2,76
359
6,28
893
6,06
82,
007,
987
2,41
2,22
33,
296,
325
5,20
9,86
537
,068
,771
Inta
ngib
le a
sset
s2,
070,
938
95,3
911,
008
367,
921
188,
794
305,
682
469,
543
285,
842
356,
757
-
D
efer
red
tax
asse
ts1,
723,
553
-
-
-
43
0,88
843
0,88
843
0,88
843
0,88
9-
-
O
ther
ass
ets
83,7
40,9
4215
,784
,847
19,2
91,0
796,
293,
590
24,8
97,4
734,
091,
264
3,89
9,79
72,
691,
055
5,49
3,45
51,
298,
382
2,02
2,81
8,97
950
2,31
0,10
223
4,95
1,62
214
1,78
0,28
420
2,84
9,39
519
0,03
6,04
514
7,85
3,27
218
5,51
6,06
432
0,03
0,78
097
,491
,415
Liab
ilitie
sBi
lls p
ayab
le22
,929
,220
7,81
5,28
35,
719,
262
5,60
5,10
53,
789,
570
-
-
-
-
-
Bo
rrow
ings
170,
405,
060
72,5
70,6
9937
,241
,931
21,9
59,3
3515
,983
,962
530,
363
242,
987
2,29
3,30
619
,564
,718
17,7
59D
epos
its a
nd o
ther
acc
ount
s1,
557,
995,
306
211,
814,
178
155,
568,
524
115,
173,
509
160,
453,
780
150,
309,
222
117,
925,
901
163,
162,
006
365,
286,
013
118,
302,
173
Liab
ilitie
s ag
ains
t ass
ets
subj
ect t
o fin
ance
leas
e19
,095
19,0
95-
-
-
-
-
-
-
-
Su
bord
inat
ed d
ebt
10,0
00,0
00-
-
-
-
-
-
-
10,0
00,0
00-
Oth
er li
abilit
ies
70,5
98,4
2730
,423
,583
10,9
15,0
967,
570,
412
5,45
4,89
42,
370,
122
3,08
8,46
23,
336,
709
3,42
2,86
34,
016,
286
1,83
1,94
7,10
832
2,64
2,83
820
9,44
4,81
315
0,30
8,36
118
5,68
2,20
615
3,20
9,70
712
1,25
7,35
016
8,79
2,02
139
8,27
3,59
412
2,33
6,21
8N
et a
sset
s19
0,87
1,87
117
9,66
7,26
425
,506
,809
(8,5
28,0
77)
17,1
67,1
8936
,826
,338
26,5
95,9
2216
,724
,043
(78,
242,
814)
(24,
844,
803)
Rep
rese
nted
by:
Shar
e ca
pita
l12
,241
,797
Res
erve
s66
,676
,412
Surp
lus
on re
valu
atio
n of
ass
ets
27,4
04,5
58U
napp
ropr
iate
d pr
ofit
77,3
35,2
49N
on-c
ontro
lling
inte
rest
7,21
3,85
519
0,87
1,87
1
------
------
------
------
------
------
------
------
------
------
------
------
------
------
------
-- (R
upee
s in
'000
) ----
------
------
------
------
------
------
------
------
------
------
------
------
------
------
---
2019
82
United Bank Limited254
Not
es to
and
form
ing
part
of t
he C
onso
lidat
ed F
inan
cial
Sta
tem
ents
For t
he y
ear e
nded
Dec
embe
r 31,
202
0

NO
TES
TO A
ND
FO
RM
ING
PAR
T O
F TH
E C
ON
SOLI
DAT
ED F
INAN
CIA
L ST
ATEM
ENTS
FO
R T
HE
YEAR
EN
DED
DEC
EMB
ER 3
1, 2
020
49.5
.2M
atur
ities
of a
sset
s an
d lia
bilit
ies
- bas
ed o
n co
ntra
ctua
l mat
urity
of t
he a
sset
s an
d lia
bilit
ies
of th
e G
roup
Tota
lUp
to 1
Day
Over
1 to
7 da
ysOv
er 7
to 14
da
ysOv
er 14
day
s to
1 Mo
nth
Over
1 to
2 Mo
nths
Over
2 to
3 Mo
nths
Over
3 to
6 Mo
nths
Over
6 to
9 Mo
nths
Over
9 m
onth
s to
1 ye
ar
Over
1 to
2 ye
ars
Over
2 to
3 ye
ars
Over
3 to
5 Ye
ars
Over
5 Ye
ars
Asse
tsCa
sh an
d bala
nces
with
trea
sury
bank
s25
8,139
,459
7,301
,407
-
-
250,8
38,05
2-
-
-
-
-
-
-
-
-
Ba
lance
s with
othe
r ban
ks29
,583,0
2814
,830,4
565,2
15,18
463
9,338
1,227
,760
2,070
,356
-
5,317
,607
282,3
27-
-
-
-
-
Le
nding
s to f
inanc
ial in
stitut
ions
22,21
2,442
124,5
195,9
16,79
35,5
91,99
99,4
59,13
21,0
00,00
0-
-
-
11
9,999
-
-
-
-
Inves
tmen
ts1,1
67,80
3,512
19,05
5,380
1,598
,684
686,2
0771
,198,1
8520
,814,4
6815
7,358
,330
144,1
62,84
271
,436,8
4922
,153,9
4413
5,381
,142
45,39
1,712
144,1
56,19
933
4,409
,570
Adva
nces
611,8
51,67
621
,624,4
425,3
61,86
76,3
59,41
657
,411,8
0520
,740,0
2474
,173,4
5294
,334,2
9525
,198,7
4742
,655,1
5867
,214,2
8653
,973,0
2294
,268,8
1548
,536,3
47Op
erati
ng fix
ed as
sets
57,46
7,580
6,102
,870
-
-
308,6
90-
48
3,463
796,1
45-
92
3,884
2,358
,877
2,263
,281
2,971
,622
41,25
8,748
Intan
gible
asse
ts2,0
34,55
117
2,984
-
-
63-
7,9
0410
,113
-
99,21
228
2,015
439,8
2174
4,760
277,6
79De
ferre
d tax
asse
ts4,6
82,49
4-
-
-
4,682
,494
-
-
-
-
-
-
-
-
-
Othe
r ass
ets48
,101,4
561,2
62,58
623
226
78,1
02,38
2-
10
,824,0
504,7
54,83
914
,114
9,811
,075
5,064
,439
1,262
,749
2,320
,995
4,683
,728
2,201
,876,1
9870
,474,6
4418
,092,7
6013
,277,2
2740
3,228
,563
44,62
4,848
242,8
47,19
924
9,375
,841
96,93
2,037
75,76
3,272
210,3
00,75
910
3,330
,585
244,4
62,39
142
9,166
,072
Liab
ilities
Bills
p aya
ble29
,741,2
067,3
93-
-
29
,733,8
13-
-
-
-
-
-
-
-
-
Bo
rrowi
ngs
131,8
27,18
52,3
8160
,875,2
8426
8,499
8,226
,971
9,284
,092
16,99
1,427
7,579
,703
4,600
30,12
84,6
98,44
51,1
89,72
23,5
54,90
419
,121,0
29De
posit
s and
othe
r acc
ounts
1,764
,392,2
861,2
47,93
5,615
32,67
3,737
18,32
8,958
73,46
0,827
37,67
4,360
77,85
0,744
55,65
5,556
20,44
3,816
32,76
0,492
25,70
5,495
33,77
1,673
59,22
3,186
48,90
7,827
Liabil
ities a
gains
t ass
ets su
bject
to fin
ance
leas
e15
,957
15,95
7-
-
-
-
-
-
-
-
-
-
-
-
Su
bord
inated
debt
10,00
0,000
-
-
-
-
-
-
-
-
-
-
-
-
10
,000,0
00Ot
her li
abilit
ies58
,267,6
781,2
97,80
066
736
916
,683,7
7496
536
,193,0
0319
3,822
-
1,829
,880
207,3
3144
,142
73,85
81,7
42,06
71,9
94,24
4,312
1,249
,259,1
4693
,549,6
8818
,597,8
2612
8,105
,385
46,95
9,417
131,0
35,17
463
,429,0
8120
,448,4
1634
,620,5
0030
,611,2
7135
,005,5
3762
,851,9
4879
,770,9
23Ne
t ass
ets
207,6
31,88
6(1
,178,7
84,50
2)(7
5,456
,928)
(5,32
0,599
)27
5,123
,178
(2,33
4,569
)11
1,812
,025
185,9
46,76
076
,483,6
2141
,142,7
7217
9,689
,488
68,32
5,048
181,6
10,44
334
9,395
,149
Repr
esen
ted
by:
Shar
e cap
ital
12,24
1,797
Rese
rves
71,02
0,586
Unap
prop
riated
profi
t87
,527,9
09Su
rplus
on re
valua
tion o
f ass
ets29
,334,2
12No
n-co
ntroll
ing in
teres
t7,5
07,38
220
7,631
,886
------
------
------
------
------
------
------
------
------
------
------
------
------
------
------
------
------
------
------
------
------
------
------
------
------
- (Ru
pees
in '0
00) -
------
------
------
------
------
------
------
------
------
------
------
------
------
------
------
------
------
------
------
------
------
------
------
------
------
2020
The
mat
urity
prof
ilepr
esen
ted
belo
wha
sbe
enpr
epar
edas
requ
ired
byIF
RS
onth
eba
sis
ofco
ntra
ctua
lmat
uriti
es,e
xcep
tfor
prod
ucts
that
dono
thav
ea
cont
ract
ualm
atur
ityw
hich
are
show
n in
the
first
buc
ket.
83
255Annual Report 2020
Not
es to
and
form
ing
part
of t
he C
onso
lidat
ed F
inan
cial
Sta
tem
ents
For t
he y
ear e
nded
Dec
embe
r 31,
202
0

NO
TES
TO A
ND
FO
RM
ING
PAR
T O
F TH
E C
ON
SOLI
DAT
ED F
INAN
CIA
L ST
ATEM
ENTS
FO
R T
HE
YEAR
EN
DED
DEC
EMB
ER 3
1, 2
020
Tota
lUp
to 1
Day
Over
1 to
7 da
ysOv
er 7
to 14
da
ysOv
er 14
day
s to
1 Mo
nth
Over
1 to
2 Mo
nths
Over
2 to
3 Mo
nths
Over
3 to
6 Mo
nths
Over
6 to
9 Mo
nths
Over
9 m
onth
s to
1 ye
ar
Over
1 to
2 ye
ars
Over
2 to
3 ye
ars
Over
3 to
5 Ye
ars
Over
5 Ye
ars
Asse
tsCa
sh an
d bala
nces
with
trea
sury
bank
s24
3,370
,701
7,508
,933
-
-
235,8
61,76
8-
-
-
-
-
-
-
-
-
Ba
lance
s with
othe
r ban
ks42
,958,6
7722
,080,2
415,2
56,95
01,5
06,56
51,9
64,26
33,5
39,30
0-
7,6
84,08
138
2,596
544,6
81-
-
-
-
Le
nding
s to f
inanc
ial in
stitut
ions
21,69
2,946
-
2,2
77,58
07,7
38,86
511
,444,2
54-
-
-
-
-
23
2,247
-
-
-
Inves
tmen
ts87
4,435
,902
46,71
0,311
2,154
,480
-
117,0
98,52
920
,879,5
4586
,080,7
3343
,446,3
4881
,147,7
636,2
03,58
511
6,424
,350
80,48
4,853
59,73
3,731
214,0
71,67
4Ad
vanc
es69
4,548
,909
477,1
2737
,297
-
145,6
35,46
13,1
55,79
689
,203,1
3277
,806,3
651,6
40,37
264
,217,4
5455
,360,7
8551
,575,0
7210
5,470
,884
99,96
9,164
Oper
ating
fixed
asse
ts58
,276,4
115,7
92,48
5-
-
59
3,636
-
362,7
6359
6,288
-
936,0
682,0
07,98
72,4
12,22
33,2
96,32
542
,278,6
36Int
angib
le as
sets
2,070
,938
95,38
5-
-
6
-
1,008
367,9
21-
18
8,794
305,6
8246
9,543
285,8
4235
6,757
Defer
red t
ax as
sets
1,723
,553
-
-
-
1,7
23,55
3-
-
-
-
-
-
-
-
-
Ot
her a
ssets
83,74
0,942
1,239
,944
1,670
-
14,54
3,233
-
19,29
1,079
6,293
,590
14,11
424
,883,3
594,0
91,26
43,8
99,79
72,9
61,05
56,5
21,83
72,0
22,81
8,979
83,90
4,426
9, 727
,977
9,245
,430
528,8
64,70
327
,574,6
4119
4,938
,715
136,1
94,59
383
,184,8
4596
,973,9
4117
8,422
,315
138,8
41,48
817
1,747
,837
363,1
98,06
8
Liab
ilities
Bills
paya
ble22
,929,2
202,6
24-
-
22
,926,5
96-
-
-
-
-
-
-
-
-
Bo
rrowi
ngs
170,4
05,06
075
2,368
71,03
5,629
2,556
,371
3,114
,315
17,81
6,644
14,53
7,304
21,95
9,335
15,93
7,067
46,89
553
0,363
242,9
872,2
93,30
619
,582,4
76De
posit
s and
othe
r acc
ounts
1,557
,995, 3
061,1
53,96
2,216
22,94
5,217
47,95
6,308
27,34
2,396
26,84
7,462
65,97
6,506
53,68
1,347
28,35
7,730
43,07
8,232
26,47
3,785
13,36
0,155
33,55
2,927
14,46
1,025
Liabil
ities a
gains
t ass
ets su
bject
to fin
ance
leas
e19
,095
19,09
5-
-
-
-
-
-
-
-
-
-
-
-
Su
bord
inated
debt
10,00
0,000
-
-
-
-
-
-
-
-
-
-
-
-
10
,000,0
00Ot
her li
abilit
ies70
,598,4
271,1
37,83
16,3
001,0
0129
,799,1
479,0
9210
,896,6
987,5
70,41
2-
5,4
54,89
42,3
70,12
23,0
88,46
23,3
36,70
96,9
27,75
91,8
31,94
7,108
1,155
,874,1
3493
,987,1
4650
,513,6
8083
,182,4
5444
,673,1
9891
,410,5
0883
,211,0
9444
,294,7
9748
,580,0
2129
,374,2
7016
,691,6
0439
,182,9
4250
,971,2
60Ne
t ass
ets
190,8
71,87
1(1
,071,9
69,70
8)(8
4,259
,169)
(41,2
68,25
0)44
5,682
,249
(17,0
98,55
7)10
3,528
,207
52,98
3,499
38,89
0,048
48,39
3,920
149,0
48,04
512
2,149
,884
132,5
64,89
531
2,226
,808
Repr
esen
ted
by:
Shar
e cap
ital
12,24
1,797
Rese
rves
66,67
6,412
Unap
prop
riated
profi
t77
,335,2
49Su
rplus
on re
valua
tion o
f ass
ets27
,404,5
58No
n-co
ntroll
ing in
teres
t7,2
13,85
519
0,871
,871
2019
------
------
------
------
------
------
------
------
------
------
------
------
------
------
------
------
------
------
------
------
------
------
------
------
------
- (Ru
pees
in '0
00) -
------
------
------
------
------
------
------
------
------
------
------
------
------
------
------
------
------
------
------
------
------
------
------
------
------
84
United Bank Limited256
Not
es to
and
form
ing
part
of t
he C
onso
lidat
ed F
inan
cial
Sta
tem
ents
For t
he y
ear e
nded
Dec
embe
r 31,
202
0

NOTES TO AND FORMING PART OF THE CONSOLIDATED FINANCIAL STATEMENTS FOR THE YEAR ENDED DECEMBER 31, 2020
50. NON-ADJUSTING EVENT AFTER THE BALANCE SHEET DATE
50.1
51. GENERAL
51.1
51.2 Figures have been rounded off to the nearest thousand rupees unless otherwise stated.
52. DATE OF AUTHORISATION
Aameer Karachiwalla Shazad G. Dada Shazia Syed Arshad Ahmad Mir Sir Mohammed Anwar Pervez, OBE, HPkChief Financial Officer President & Director Director Chairman Chief Executive Officer
These consolidated financial statements were authorised for issue on February 24, 2021, by the Board of Directors of theBank.
The Board of Directors in its meeting held on February 24, 2021, has proposed a final cash dividend in respect of 2020 ofRs. 9.5 per share (2019: Rs. 4.0 per share). In addition, the Directors have also announced a bonus issue of nil (2019: nil).These appropriations will be approved in the forthcoming Annual General Meeting. The consolidated financial statementsfor the year ended December 31, 2020, do not include the effect of these appropriations which will be accounted for in theconsolidated financial statements for the year ending December 31, 2021.
Comparative information has been reclassified, rearranged or additionally incorporated in these consolidated financialstatements for the purposes of better presentation.
85
Aameer KarachiwallaChief Financial Officer
Shazad G. DadaPresident &
Chief Executive Officer
Shazia Syed Director
Arshad Ahmad Mir Director
Sir Mohammed Anwar Pervez, OBE, HPkChairman
257Annual Report 2020
Notes to and forming part of the Consolidated Financial StatementsFor the year ended December 31, 2020

Annexure 'III' as referred to in Note 11.6 of the Group's Consolidated Financial Statements
Disposals of operating fixed assets to related parties during the year 2020
Land & BuildingLeasehold Land 6,557 6,557 - 2,215 Claim proceeds UBL Insurers LimitedLeasehold Improvements 1,628 1,628 - 550 Claim proceeds UBL Insurers LimitedLeasehold Improvements 3,222 2,416 806 1,088 Claim proceeds UBL Insurers Limited
11,407 10,601 806 3,853
VehiclesToyota Corolla 1,807 1,410 397 1,400 Claim proceeds UBL Insurers LimitedToyota Corolla 1,807 1,626 181 1,400 Claim proceeds UBL Insurers LimitedPool Car 2,728 2,728 - 1,750 Claim proceeds UBL Insurers LimitedMercedes S500 35,829 23,110 12,719 19,885 Buy Back Sima Kamil
42,171 28,874 13,297 24,435
Electrical, office and computer equipment15 KVA Genset 1,419 1,254 165 416 Claim proceeds UBL Insurers Limited30 KVA Genset 1,618 1,618 - 890 Claim proceeds UBL Insurers Limited40 KVA Genset 1,818 1,818 - 545 Claim proceeds UBL Insurers Limited20 KVA Genset 1,065 1,065 - 108 Claim proceeds UBL Insurers Limited
5,920 5,755 165 1,959
Total 59,498 45,230 14,268 30,247
Mode of disposal Particulars of Buyers
------------------------------------ (Rupees in '000) ------------------------------------
Cost Accumulated depreciation Book value Sale proceeds
Annexure ‘III’ as referred to in Note 11.6 of the Group’sConsolidated Financial Statements
United Bank Limited258

259Annual Report 2020
CONSOLIDATED STATEMENT OF FINANCIAL POSITION AS AT DECEMBER 31, 2020
2020 2019
ASSETS
Cash and balances with treasury banks 1,615,043 1,522,643Balances with other banks 185,085 268,770Lendings to financial institutions 138,972 135,721Investments 7,306,334 5,470,887Advances 3,828,035 4,345,428Fixed assets 359,545 364,605Intangible assets 12,729 12,957Deferred tax assets 29,296 10,783Other assets 300,946 523,923
13,775,985 12,655,717 LIABILITIES
Bills payable 186,075 143,456Borrowings 824,774 1,066,135Deposits and other accounts 11,038,877 9,747,559Liabilities against assets subject to finance lease 100 119Subordinated debt 62,565 62,565Deferred tax liabilities - - Other liabilities 364,549 441,698
12,476,940 11,461,532
NET ASSETS 1,299,045 1,194,185
REPRESENTED BY:Share capital 76,591 76,591Reserves 444,339 417,159Surplus on revaluation of assets 183,529 171,456Unappropriated profit 547,616 483,846Total equity attributable to the equity holders of the Bank 1,252,075 1,149,052
Non-controlling interest 46,970 45,1331,299,045 1,194,185
CONTINGENCIES AND COMMITMENTS
These figures have been converted at Rs. 159.8344 per US Dollar from the audited consolidated financial statements.
------ (US Dollars in '000) ------
Consolidated Statement of Financial PositionAs at December 31, 2020

United Bank Limited260
CONSOLIDATED PROFIT AND LOSS ACCOUNT FOR THE YEAR ENDED DECEMBER 31, 2020
2020 2019
Mark-up / return / interest earned 976,503 984,005Mark-up / return / interest expensed 494,296 587,714Net mark-up / interest income 482,207 396,291
Non mark-up / interest incomeFee and commission income 80,271 98,384Dividend income 5,456 7,028Foreign exchange income 24,137 29,212(Loss) / income from derivatives (82) 404Gain on securities - net 3,818 1,356Other income 4,300 11,007Total non mark-up / interest income 117,900 147,391Total income 600,107 543,682
Non mark-up / interest expensesOperating expenses 273,677 274,306Workers' Welfare Fund 5,468 4,679Other charges 1,047 251Total non mark-up / interest expenses 280,192 279,236
Share of profit of associates 3,157 4,860Profit before provisions 323,072 269,306Provisions and write offs - net 107,960 45,757Profit before taxation from continuing operations 215,112 223,549
Taxation 84,946 96,707
Profit after taxation from continuing operations 130,166 126,842
Discontinued operation
Loss from discontinued operation - net of tax (102) (7,665)
130,064 119,177Attributable to:Equity holders of the Bank
from continuing operations 131,101 127,135 from discontinued operation (102) (7,665)
130,999 119,470Non-controlling interest (935) (293)
130,064 119,177
Earnings per share for profit from continuing operations attributable to the ordinary equity holders of the BankBasic and diluted 0.11 0.10
Earnings per share for profit attributable to the ordinary equity holders of the BankBasic and diluted 0.11 0.10
These figures have been converted at Rs. 159.8344 per US Dollar from the audited consolidated financial statements.
------ (US Dollars in '000) ------
------------ (US Dollars) ------------
Consolidated Profit and Loss AccountFor the year ended December 31, 2020

Category of ShareholdersAs on December 31, 2020
Particulars No of Folio Balance Share Percentage
DIRECTORS, CEO & CHILDREN 11 19,306,238.00 1.5771
BANKS, DFI & NBFI 18 26,004,716.00 2.1243
INSURANCE COMPANIES 22 67,048,735.00 5.477
MUTUAL FUNDS 56 40,967,013.00 3.3465
GENERAL PUBLIC (LOCAL) 20,551 63,761,834.00 5.2085
GENERAL PUBLIC (FOREIGN) 1,248 14,551,766.00 1.1887
OTHERS 99 39,690,105.00 3.2422
FOREIGN COMPANIES 157 822,260,524.00 67.1683
GOVT. OWNED ENTITIES / BANKS 2 2,201,714.00 0.1799
JOINT STOCK COMPANIES 158 127,304,154.00 10.3991
PUBLIC SECTOR COMPANIES 1 118,628.00 0.0097
CHARITABLE TRUSTS 15 963,789.00 0.0787
MODARABAS 1 471.00 0.0000
Total 22,339 1,224,179,687.00 100.0000
261Annual Report 2020
Category of ShareholdersAs on December 31, 2020

Details of Mutual Funds & ModarabasAs on December 31, 2020
Folio No Name Code Balance Held Percentage
015388000025 CDC - TRUSTEE ABL PENSION FUND - EQUITY SUB FUND 006 101,000 0.0083
012195000021 CDC - TRUSTEE ABL STOCK FUND 006 3,310,948 0.2705
006411000021 CDC - TRUSTEE AKD INDEX TRACKER FUND 006 116,429 0.0095
006619000026 CDC - TRUSTEE AKD OPPORTUNITY FUND 006 290,000 0.0237
011924000022 CDC - TRUSTEE ALFALAH GHP ALPHA FUND 006 374,199 0.0306
011809000026 CDC - TRUSTEE ALFALAH GHP STOCK FUND 006 800,231 0.0654
006197000029 CDC - TRUSTEE ALFALAH GHP VALUE FUND 006 291,000 0.0238
017640000020 CDC - TRUSTEE ALLIED FINERGY FUND 006 285,200 0.0233
010603000021 CDC - TRUSTEE APF-EQUITY SUB FUND 006 290,860 0.0238
014134000025 CDC - TRUSTEE ATLAS INCOME FUND - MT 006 200,120 0.0163
005959000027 CDC - TRUSTEE ATLAS STOCK MARKET FUND 006 5,099,463 0.4166
016485000022 CDC - TRUSTEE FAYSAL MTS FUND - MT 006 273,344 0.0223
006171000021 CDC - TRUSTEE FAYSAL STOCK FUND 006 998 0.0001
014514000028 CDC - TRUSTEE FIRST CAPITAL MUTUAL FUND 006 37,000 0.0030
017277000026 CDC - TRUSTEE FIRST HABIB ASSET ALLOCATION FUND 006 12,200 0.0010
012310000025 CDC - TRUSTEE FIRST HABIB STOCK FUND 006 27,000 0.0022
017921000026 CDC - TRUSTEE GOLDEN ARROW STOCK FUND 006 15,000 0.0012
010728000027 CDC - TRUSTEE HBL - STOCK FUND 006 1,178,610 0.0963
013607000028 CDC - TRUSTEE HBL EQUITY FUND 006 320,590 0.0262
011056000028 CDC - TRUSTEE HBL MULTI - ASSET FUND 006 69,700 0.0057
013714000025 CDC - TRUSTEE HBL PF EQUITY SUB FUND 006 124,858 0.0102
005652000023 CDC - TRUSTEE JS LARGE CAP. FUND 006 110,000 0.0090
010660000025 CDC - TRUSTEE JS PENSION SAVINGS FUND - EQUITY ACCOUNT 006 44,300 0.0036
012336000023 CDC - TRUSTEE LAKSON EQUITY FUND 006 1,192,279 0.0974
016535000024 CDC - TRUSTEE LAKSON TACTICAL FUND 006 127,047 0.0104
011262000023 CDC - TRUSTEE MCB PAKISTAN ASSET ALLOCATION FUND 006 804,640 0.0657
005371000028 CDC - TRUSTEE MCB PAKISTAN STOCK MARKET FUND 006 5,778,883 0.4721
014902000021 CDC - TRUSTEE NATIONAL INVESTMENT (UNIT) TRUST 006 841,099 0.0687
009506000026 CDC - TRUSTEE NBP BALANCED FUND 006 246,891 0.0202
017442000025 CDC - TRUSTEE NBP FINANCIAL SECTOR FUND 006 632,300 0.0517
018291000023 CDC - TRUSTEE NBP FINANCIAL SECTOR INCOME FUND - MT 006 90,442 0.0074
016022000026 CDC - TRUSTEE NBP INCOME OPPORTUNITY FUND - MT 006 6,084 0.0005
012880000027 CDC - TRUSTEE NBP MAHANA AMDANI FUND - MT 006 321,349 0.0263
018234000029 CDC - TRUSTEE NBP PAKISTAN GROWTH EXCHANGE TRADED FUND 006 28,808 0.0024
012625000027 CDC - TRUSTEE NBP SARMAYA IZAFA FUND 006 233,803 0.0191
016246000020 CDC - TRUSTEE NBP SAVINGS FUND - MT 006 9,374 0.0008
009480000021 CDC - TRUSTEE NBP STOCK FUND 006 6,423,363 0.5247
018002000026 CDC - TRUSTEE NIT ASSET ALLOCATION FUND 006 144,623 0.0118
018010000025 CDC - TRUSTEE NIT PAKISTAN GATEWAY EXCHANGE TRADED FUND 006 27,816 0.0023
012120000028 CDC - TRUSTEE NIT-EQUITY MARKET OPPORTUNITY FUND 006 2,276,102 0.1859
005488000025 CDC - TRUSTEE PAKISTAN CAPITAL MARKET FUND 006 245,502 0.0201
005777000029 CDC - TRUSTEE PICIC GROWTH FUND 006 958,705 0.0783
005645000024 CDC - TRUSTEE PICIC INVESTMENT FUND 006 741,700 0.0606
014472000025 CDC - TRUSTEE UBL ASSET ALLOCATION FUND 006 217,933 0.0178
017541000022 CDC - TRUSTEE UBL DEDICATED EQUITY FUND 006 21,409 0.0017
017483000021 CDC - TRUSTEE UBL FINANCIAL SECTOR FUND 006 1,616,986 0.1321
018051000021 CDC - TRUSTEE UBL PAKISTAN ENTERPRISE EXCHANGE TRADED FUND 006 34,744 0.0028
007377000026 CDC - TRUSTEE UBL STOCK ADVANTAGE FUND 006 3,321,071 0.2713
006213000025 CDC - TRUSTEE UNIT TRUST OF PAKISTAN 006 182,800 0.0149
016188000028 CDC-TRUSTEE NITPF EQUITY SUB-FUND 006 41,000 0.0033
014183000020 CDC-TRUSTEE UBL INCOME OPPORTUNITY FUND 006 78,000 0.0064
001826156125 HRSG OUTSOURCING (PVT) LIMITED EMPLOYEES GRATUITY FUND 006 35,100 0.0029
001826156646 HRSG OUTSOURCING (PVT) LIMITED EMPLOYEES PROVIDENT FUND 006 83,862 0.0069
011049000029 MC FSL - TRUSTEE JS GROWTH FUND 006 692,600 0.0566
005454000028 MCBFSL - TRUSTEE JS VALUE FUND 006 126,000 0.0103
003277003785 TRUSTEE CHERAT CEMENT CO.LTD.EMP.PRO.FND 006 11,648 0.0010
Folio No Name Code Balance Held Percentage
000000015653 B.R.R. GUARDIAN MODARABA 017 471 0.0000
MUTUAL FUNDS
MODARABA
United Bank Limited262
Details of Mutual Funds & ModarabasAs on December 31, 2020

NO. OF SHAREHOLDERS<---HAVING SHARES--->
SHARES HELD PERCENTAGEFrom To
4,297 1 100 268,194 0.0219
13,761 101 500 5,994,531 0.4897
1,191 501 1000 1,008,691 0.0824
1,648 1001 5000 4,041,134 0.3301
447 5001 10000 3,455,215 0.2822
167 10001 15000 2,133,858 0.1743
83 15001 20000 1,500,699 0.1226
78 20001 25000 1,794,803 0.1466
46 25001 30000 1,297,597 0.1060
25 30001 35000 821,423 0.0671
46 35001 40000 1,745,829 0.1426
21 40001 45000 899,373 0.0735
28 45001 50000 1,370,954 0.1120
21 50001 55000 1,110,293 0.0907
16 55001 60000 924,012 0.0755
18 60001 65000 1,134,763 0.0927
12 65001 70000 818,061 0.0668
16 70001 75000 1,166,398 0.0953
12 75001 80000 935,577 0.0764
11 80001 85000 920,774 0.0752
12 85001 90000 1,060,523 0.0866
6 90001 95000 556,241 0.0454
20 95001 100000 1,974,859 0.1613
10 100001 105000 1,025,114 0.0837
5 105001 110000 538,585 0.0440
7 110001 115000 786,277 0.0642
10 115001 120000 1,183,456 0.0967
10 120001 125000 1,239,785 0.1013
4 125001 130000 509,682 0.0416
4 130001 135000 533,608 0.0436
7 135001 140000 964,906 0.0788
7 140001 145000 1,002,490 0.0819
11 145001 150000 1,643,599 0.1343
8 150001 155000 1,227,500 0.1003
6 155001 160000 943,844 0.0771
4 160001 165000 658,136 0.0538
2 165001 170000 338,856 0.0277
3 170001 175000 517,935 0.0423
7 175001 180000 1,238,207 0.1011
2 180001 185000 367,000 0.0300
1 185001 190000 186,000 0.0152
3 190001 195000 581,010 0.0475
5 195001 200000 992,780 0.0811
3 200001 205000 605,363 0.0495
4 205001 210000 829,067 0.0677
263Annual Report 2020
Pattern of ShareholdingAs on December 31, 2020

Pattern of ShareholdingAs on December 31, 2020
NO. OF SHAREHOLDERS<---HAVING SHARES--->
SHARES HELD PERCENTAGEFrom To
3 210001 215000 642,854 0.0525
3 215001 220000 656,237 0.0536
3 220001 225000 664,747 0.0543
4 225001 230000 914,800 0.0747
4 230001 235000 927,756 0.0758
2 240001 245000 488,504 0.0399
7 245001 250000 1,734,493 0.1417
2 250001 255000 507,000 0.0414
1 255001 260000 259,541 0.0212
2 265001 270000 535,100 0.0437
2 270001 275000 544,433 0.0445
4 285001 290000 1,148,814 0.0938
3 290001 295000 872,887 0.0713
1 295001 300000 300,000 0.0245
1 300001 305000 300,036 0.0245
2 310001 315000 623,100 0.0509
1 315001 320000 317,400 0.0259
6 320001 325000 1,934,877 0.1581
4 325001 330000 1,313,472 0.1073
1 335001 340000 335,920 0.0274
3 340001 345000 1,029,600 0.0841
4 345001 350000 1,399,171 0.1143
1 350001 355000 350,200 0.0286
3 355001 360000 1,075,560 0.0879
1 360001 365000 364,247 0.0298
3 370001 375000 1,119,699 0.0915
2 375001 380000 755,990 0.0618
1 380001 385000 380,958 0.0311
3 395001 400000 1,195,307 0.0976
1 415001 420000 418,962 0.0342
1 420001 425000 423,942 0.0346
1 430001 435000 431,300 0.0352
2 440001 445000 883,580 0.0722
1 445001 450000 445,375 0.0364
1 475001 480000 477,847 0.0390
1 480001 485000 483,000 0.0395
1 485001 490000 490,000 0.0400
4 495001 500000 1,995,243 0.1630
1 500001 505000 501,412 0.0410
1 510001 515000 512,343 0.0419
2 515001 520000 1,033,226 0.0844
3 520001 525000 1,570,888 0.1283
1 525001 530000 529,996 0.0433
1 530001 535000 533,100 0.0435
1 535001 540000 538,100 0.0440
United Bank Limited264

Pattern of ShareholdingAs on December 31, 2020
NO. OF SHAREHOLDERS<---HAVING SHARES--->
SHARES HELD PERCENTAGEFrom To
1 555001 560000 558,600 0.0456
1 560001 565000 562,400 0.0459
2 575001 580000 1,156,525 0.0945
1 600001 605000 602,804 0.0492
2 605001 610000 1,214,300 0.0992
1 610001 615000 610,100 0.0498
1 625001 630000 629,605 0.0514
1 630001 635000 632,300 0.0517
1 635001 640000 635,300 0.0519
2 645001 650000 1,293,870 0.1057
1 680001 685000 681,530 0.0557
1 690001 695000 692,600 0.0566
1 695001 700000 700,000 0.0572
1 705001 710000 707,850 0.0578
1 720001 725000 723,319 0.0591
1 725001 730000 725,300 0.0592
1 740001 745000 741,700 0.0606
3 745001 750000 2,249,900 0.1838
1 755001 760000 759,274 0.0620
1 760001 765000 762,540 0.0623
1 785001 790000 788,426 0.0644
2 800001 805000 1,604,871 0.1311
1 820001 825000 822,977 0.0672
1 840001 845000 841,099 0.0687
1 845001 850000 845,938 0.0691
1 855001 860000 856,269 0.0699
1 895001 900000 900,000 0.0735
2 905001 910000 1,815,726 0.1483
1 915001 920000 916,500 0.0749
1 920001 925000 924,500 0.0755
1 925001 930000 928,059 0.0758
1 945001 950000 950,000 0.0776
1 955001 960000 958,705 0.0783
1 965001 970000 969,111 0.0792
1 975001 980000 980,000 0.0801
1 1000001 1005000 1,000,800 0.0818
1 1015001 1020000 1,018,080 0.0832
1 1045001 1050000 1,050,000 0.0858
1 1075001 1080000 1,075,600 0.0879
1 1095001 1100000 1,098,207 0.0897
1 1100001 1105000 1,105,000 0.0903
1 1105001 1110000 1,110,000 0.0907
1 1120001 1125000 1,123,697 0.0918
1 1155001 1160000 1,158,998 0.0947
1 1175001 1180000 1,178,610 0.0963
265Annual Report 2020

Pattern of ShareholdingAs on December 31, 2020
NO. OF SHAREHOLDERS<---HAVING SHARES--->
SHARES HELD PERCENTAGEFrom To
1 1190001 1195000 1,192,279 0.0974
1 1195001 1200000 1,197,246 0.0978
1 1220001 1225000 1,225,000 0.1001
1 1240001 1245000 1,241,750 0.1014
2 1245001 1250000 2,498,400 0.2041
1 1255001 1260000 1,255,646 0.1026
1 1300001 1305000 1,303,900 0.1065
1 1340001 1345000 1,340,627 0.1095
1 1345001 1350000 1,346,191 0.1100
1 1375001 1380000 1,375,272 0.1123
1 1400001 1405000 1,400,163 0.1144
1 1430001 1435000 1,433,050 0.1171
1 1495001 1500000 1,500,000 0.1225
1 1525001 1530000 1,528,936 0.1249
1 1545001 1550000 1,547,328 0.1264
1 1550001 1555000 1,554,125 0.1270
1 1595001 1600000 1,600,000 0.1307
1 1600001 1605000 1,600,300 0.1307
1 1605001 1610000 1,605,100 0.1311
1 1610001 1615000 1,615,000 0.1319
1 1615001 1620000 1,616,986 0.1321
1 1640001 1645000 1,641,500 0.1341
1 1645001 1650000 1,649,700 0.1348
1 1705001 1710000 1,708,900 0.1396
1 1805001 1810000 1,808,600 0.1477
1 1910001 1915000 1,912,812 0.1563
1 1935001 1940000 1,936,000 0.1581
2 1995001 2000000 4,000,000 0.3267
1 2005001 2010000 2,005,311 0.1638
1 2195001 2200000 2,200,000 0.1797
1 2275001 2280000 2,276,102 0.1859
1 2345001 2350000 2,348,870 0.1919
1 2390001 2395000 2,394,492 0.1956
1 2445001 2450000 2,448,940 0.2000
1 2520001 2525000 2,523,300 0.2061
1 2645001 2650000 2,650,000 0.2165
1 2665001 2670000 2,668,800 0.2180
1 2785001 2790000 2,789,991 0.2279
1 2800001 2805000 2,803,919 0.2290
1 2990001 2995000 2,991,000 0.2443
1 3045001 3050000 3,050,000 0.2491
1 3150001 3155000 3,152,622 0.2575
1 3175001 3180000 3,180,000 0.2598
1 3225001 3230000 3,226,300 0.2635
1 3310001 3315000 3,310,948 0.2705
United Bank Limited266

Pattern of ShareholdingAs on December 31, 2020
NO. OF SHAREHOLDERS<---HAVING SHARES--->
SHARES HELD PERCENTAGEFrom To
1 3320001 3325000 3,321,071 0.2713
1 3645001 3650000 3,647,240 0.2979
1 3690001 3695000 3,693,000 0.3017
1 3770001 3775000 3,773,011 0.3082
1 3870001 3875000 3,872,600 0.3163
1 4080001 4085000 4,080,440 0.3333
1 4110001 4115000 4,111,257 0.3358
1 4145001 4150000 4,146,500 0.3387
1 4185001 4190000 4,186,912 0.3420
1 4290001 4295000 4,292,595 0.3507
1 4315001 4320000 4,316,760 0.3526
1 4610001 4615000 4,613,107 0.3768
1 4665001 4670000 4,665,956 0.3812
1 4760001 4765000 4,762,106 0.3890
1 5095001 5100000 5,099,463 0.4166
1 5410001 5415000 5,413,670 0.4422
1 5755001 5760000 5,755,145 0.4701
1 5775001 5780000 5,778,883 0.4721
1 6025001 6030000 6,030,000 0.4926
1 6060001 6065000 6,064,800 0.4954
1 6340001 6345000 6,343,700 0.5182
1 6420001 6425000 6,423,363 0.5247
1 6515001 6520000 6,515,046 0.5322
1 7150001 7155000 7,153,224 0.5843
1 7495001 7500000 7,498,622 0.6125
1 9475001 9480000 9,478,765 0.7743
1 9615001 9620000 9,615,800 0.7855
1 12440001 12445000 12,442,568 1.0164
1 13245001 13250000 13,247,370 1.0821
1 14950001 14955000 14,954,190 1.2216
1 17865001 17870000 17,869,600 1.4597
1 31160001 31165000 31,163,426 2.5457
1 41345001 41350000 41,346,443 3.3775
1 93645001 93650000 93,649,744 7.6500
1 631725001 631730000 631,728,895 51.6043
22,339 Total 1,224,179,687 100.00
267Annual Report 2020

Shares Trading (Sale / Purchase) by Directors, Executives of UBL and their Spouses and Minor ChildrenShares Trading ( Sale / Purchase ) By Directors, Executives of UBL
and their Spouses and Minor Children
During the period from January 01, 2020 to December 31, 2020
NAME Sale / Purchase No. of Shares Lord Zameer M. Choudrey Sale 93,500
Sale 4,400 Purchase 500
M.Umer Khan Sale 7,442 Aameer Mustaaly Karachiwalla Sale 50,000 Muhammad Naeem Javid Purchase 100 Aameer Mustaaly Karachiwalla Sale 20,000
Sale 1,400 Purchase 1,300 Purchase 2,500
Sale 2,500 Khadija Wajahat Spouse of Faraz Mehmood Azam Purchase 3,000
Purchase 350 Sale 100
Purchase 12,000 Sale 12,000
Muhammad Awais Purchase 2,000 Raja Imran Shoaib Sale 4,000
Purchase 100 Sale 100
Khadija Wajahat Spouse of Faraz Mehmood Azam Sale 3,000
Mian Ali Afzal
Muhammad Nauman Ghani
Aamir Kamal Sabzwari
Junaid Akhtar Butt
Syed Hyder Ali Zaidi
Irfan Masood
United Bank Limited268

Directors / Memberships in other Corporate Bodies - Sir Mohammed Anwar Pervez, OBE, HPk Position as of 31 December 2020
S. No. Directorships / Memberships of Bodies Corporate Position held in other Undertaking(s)
1 Bestway (Holdings) Limited, UK Chairman
2 Bestway Northern Limited, UK Chairman
3 Buybest Limited UK Director
4 Bestway Foundation, UK Chairman
5 Bestway Foundation, Pakistan Patron-in-Chief
6 Bestway Group Limited, UK Director
7 Bestway Panacea Holdings Limited, UK Director
Directors / Memberships in other Corporate Bodies - Lord Zameer M. Choudrey, CBE, SI Pk Position as of 31 December 2020
S. No. Directorships / Memberships of Bodies Corporate Position held in other Undertaking(s)
1 Bestway Group Limited, UK Director 2 Bestway (Holdings) Limited Chief Executive 3 Bestway Northern Limited, UK Chief Executive 4 Bestway Wholesale Limited, UK Chief Executive 5 Batleys Properties Limited, UK Chief Executive 6 Bestway Retail Limited, UK Chief Executive 7 Euroimpex Limited, UK* Chief Executive 8 Bestway Retail Limited, UK Chief Executive 9 MAP Trading Limited, UK Chief Executive
10 Palmbest Limited, UK Chief Executive 11 Bestway Cement Limited, Pakistan Chief Executive 12 Bestway Wholesale Holdings Limited, UK Director 13 UBL Insurers Limited, Pakistan Director 14 Bestway Panacea Holding, UK Director 15 Buybest Limited, UK Director 16 Bestway UK Holdco Limited, UK Director 17 Bestway Foundation, UK Trustee 18 Bestway Foundation, Pakistan Chairman 19 Crimestoppers, UK Trustee 20 British Asian Trust UK Advisory Council Chairman 21 Conservative Friends of Pakistan Chairman 22 Bestway Northern Holdings Limited UK Director 23 Oakleaf Limited UK Director 24 5 Lake Investment Company, UK Director 25 Bestway Limited UK* Director 26 Bestway Power Limited Pakistan* Director 27 Bestway Spinning Limited Pakistan* Director
* Dormant
269Annual Report 2020

Directors / Memberships in other Corporate Bodies - Haider Zameer Choudrey Position as of 31 December 2020
S. No. Directorships / Memberships of Bodies Corporate Position held in other Undertaking(s)
1 Bestway Cement Limited, Pakistan Director
2 Bestway Group Limited, UK Director
3 Bestway (Holdings) Limited, UK Director
4 Bestway Securities Limited, UK Director
5 Bestway UK Holdco Limited, UK Director
6 Bestway Wholesale Holdings Limited, UK Director
7 Bestway Panacea Holdings Limited, UK Director
8 Bestway Northern Holdings Limited, UK Director
9 Oakleaf Limited, UK Director
10 5 Lake Investment Company, UK Director
Directors / Memberships in other Corporate Bodies – Rizwan Pervez Position as of 31 December 2020
S. No. Directorships / Memberships of Bodies Corporate Position held in other Undertaking(s)
1 Bestway (Holdings) Limited Director
2 Bestway Northern Limited, UK Director
3 Bestway Wholesale Limited, UK Director
4 Bestway Wholesale Holdings Limited, UK Director
5 Betleys Properties Limited, UK Director
6 Palmbest Limited, UK Director
7 Bestway Retail Limited, UK Director
8 Bestway Securities Limited, UK Director
9 MAP Trading Limited, UK Director
10 UBL Insurers Limited, Pakistan Director
11 RP Investment Limited, UK Director
12 RP Property Trading Limited, UK Director
13 Buybest Limited, UK Partner
14 Bestway Foundation, UK Trustee
15 Bestway Group Limited, UK Director
16 Bestway Northern Holdings Limited, UK Director
17 Oakleaf Limited, UK Director
18 Bestway UK Holdco Limited, UK Director
United Bank Limited270

Directors / Memberships in other Corporate Bodies - Arshad Ahmad Mir
Position as of 31 December 2020
Directorships / Memberships of Bodies Corporate Position held in other Undertaking(s)
NIL NIL
Directors / Memberships in other Corporate Bodies - Amar Zafar Khan Position as of 31 December 2020
Directorships / Memberships of Bodies Corporate Position held in other Undertaking(s)
Ecopack Limited Chairman
At Tahur Ltd Director
Directors / Memberships in other Corporate Bodies - Tariq Rashid Position as of 31 December 2020
Directorships / Memberships of Bodies Corporate Position held in other Undertaking(s)
Nil Nil
Directors / Memberships in other Corporate Bodies - Shazia Syed Position as of 31 December 2020
Directorships / Memberships of Bodies Corporate Position held in other Undertaking(s)
Pukka Private Limited Chairperson
Pepsi Lipton International Member
271Annual Report 2020

Directors / Memberships in other Corporate Bodies - Shazad G. Dada Position as of 31 December 2020
S.No. Directorships / Memberships of Bodies Corporate Position held in other
Undertaking(s)
1 UBL Switzerland AG Director/Chairman
2 UBL Bank (Tanzania) Ltd. Director/Chairman
3 United Bank, UK Director
4 Pakistan Business Council Nominated Representative
5 Karachi Education Initiative Director
6 Institute of Bankers Pakistan Council Member
7 Development in Literacy Chairman, Board of Trustees, Pakistan
8 British Business Centre Pakistan Member, Board of Directors
United Bank Limited272

Notice of 62nd Annual General Meeting of United Bank Limited
Notice is hereby given that the 62nd Annual General Meeting (“AGM”) of the Shareholders of United Bank Limited (the “Bank” or “UBL”) will be held on Wednesday, 31 March 2021 at 11:00 a.m. at registered office, UBL Building, Jinnah Avenue, Islamabad to transact the following business: Ordinary Business:
1. To confirm the minutes of the 61st Annual General Meeting held on 25 March, 2020.
2. To receive, consider and, if thought fit, adopt the Annual Audited Financial Statements (consolidated and unconsolidated), Statement of Compliance with the Listed Companies (Code of Corporate Governance) Regulations, 2019 of the Bank for the year ended 31st December, 2020 together with the Directors’ Report and Auditors’ Reports thereon.
3. To consider and, if thought fit, approve and declare as recommended by the Board of Directors, final cash dividend at the rate of Rs. 9.50 per share i.e. 95%, in addition to 25% interim cash dividend already declared/paid for the year ended 31 December 2020.
4. To consider and, if thought fit, appoint External Auditors to hold office from this AGM till the conclusion of the next AGM of the Bank and to fix their remuneration. The retiring External Auditor namely, M/s. A.F. Ferguson & Company, Chartered Accountants have consented to be so appointed and the Board of Directors has recommended its appointment.
Special Business:
5. To consider and, if thought fit, approve/ratify the amount of remuneration paid to the Non-Executive Directors including independent Directors of the Bank for attending the Board and/or Committees meetings and in that connection to pass the Ordinary Resolution as proposed in the Statement of Material facts annexed to Notice.
6. To transact any other business with the permission of the Chairman.
By order of the Board
Sd/-Aqeel Ahmed NasirCompany Secretary &Chief Legal Counsel
Karachi, 10 March 2021
Attached to this Notice is a Statement of Material Facts covering the above mentioned Special Business, as required under Section 134(3) of the Companies Act, 2017.
273Annual Report 2020

Notice of 62nd Annual General Meeting of United Bank Limited
Notes:
1. The Share Transfer Books of the Bank shall remain closed from 23 March 2021 to 31 March 2021 (both days inclusive). Transfers received at M/s. THK Associates (Pvt.) Limited, Plot No. 32-C, Jami Commercial Street 2, D.H.A., Phase VII, Karachi-75500. Pakistan., the Registrar and Share Transfer Agent of the Bank, by the close of the business on 22 March 2021 will be treated in time for the purpose of the above entitlement.
2. A member entitled to attend and vote at this AGM is entitled to appoint a person as a proxy to attend and vote for and on his/her behalf. A proxy need not be a member. The instrument appointing a proxy and the power of attorney/Board Resolution or other authority (if any) under which it is signed or a notarized certified copy of the power or authority shall be deposited at the office of M/s. THK Associates (Pvt.) Limited, Plot No. 32-C, Jami Commercial Street 2, D.H.A., Phase VII, Karachi-75500, the Registrar and Share Transfer Agent of the Bank, not later than forty-eight (48) hours before the time of holding the AGM, and must be duly stamped, signed and witnessed.
3. The CDC Account Holders and Sub-Account Holders, whose registration details are available in the Share Book Details Report, shall be required to produce their respective original Computerized National Identity Card (CNIC) or original Passport at the time of attending the Annual General Meeting to facilitate identification. Such Account Holders and Sub-Account Holders should also bring / know their respective participation I.D. No. and the CDC Account No. and in case of proxy, he/she must enclose an attested copy of his/her CNIC or Passport. Representative(s) of corporate member(s) should bring attested copy of Board Resolution / Power of Attorney and/ or all such documents that are required for such purpose under Circular No.1 dated 26 January 2000 issued by the Securities and Exchange Commission of Pakistan (“SECP”).
4. Members are requested to timely notify any change in their addresses and provide copies of their CNIC /NTN (if not provided earlier) to Bank’s Registrar / Share Transfer Agent, M/s. THK Associates (Pvt.) Limited, Plot No. 32-C, Jami Commercial Street 2, D.H.A., Phase VII, Karachi-75500.
5. Deduction of Withholding Tax on the Amount of Dividend:
As per the provisions of Section 150 of the Income Tax Ordinance, 2001 (“Ordinance”), different rates are prescribed for deduction of withholding tax on the amount of dividend paid by the companies. The current withholding tax rates are as under:
(a) For filers of income tax returns: 15.00%(b) For non-filers of income tax returns: 30.00%
To enable the Bank to make tax deduction on the amount of cash dividend @ 15.00% instead of 30.00%, all the shareholders whose names are not entered into the Active Taxpayers List (ATL) provided on the website of the Federal Board of Revenue (“FBR”), despite the fact that they are filers, are advised to make sure that their names are entered into ATL before the date of issuance of Dividend Warrants, otherwise tax on their cash dividend will be deducted @ 30.00%.
The corporate shareholders having CDC account are required to have their National Tax Number (NTN) updated with their respective participants, whereas corporate physical shareholders should send a copy of their NTN certificates to the Bank or Bank’s Share Registrar and Share Transfer Agent, M/s. THK Associates (Pvt.) Limited, Plot No. 32-C, Jami Commercial Street 2, D.H.A., Phase VII, Karachi-75500. The shareholders while sending NTN or NTN certificates, as the case may be, must quote company name and their respective Folio numbers.
As per FBR’s clarification letters C.No. 1(29) WHT/2006 dated June 30, 2010 and C.No.1(43) DG(WHT)/2008-Vol-II.664 17-R dated May 12, 2015, a valid Exemption Certificate under Section 159 of the Ordinance is mandatory to claim exemption of withholding tax under Clause 47(B) of Part-IV of Second Schedule to the Ordinance. Those who fall in the category mentioned in above Clause must provide valid Tax Exemption Certificate to our Registrar and Share Transfer Agent, otherwise tax will be deducted on dividend amount as per rates prescribed in Section 150 of the Ordinance.
For shareholders holding their shares jointly as per the clarification issued by the FBR, withholding tax will be determined separately on “Filer / Non-Filer” status of principal shareholder as well as joint-holder(s) based on their shareholding proportions. Therefore, all shareholders who hold shares jointly are required to provide shareholding proportions of principal shareholder and Joint-holder(s) in respect of shares held by them to the Registrar and Share Transfer Agent in writing as follows:
United Bank Limited274

Notice of 62nd Annual General Meeting of United Bank Limited
Folio / CDC Account No.
Total shares
Principal Shareholder Joint Shareholder(s)
Name and CNIC No. Shareholding Proportion
(No. of Shares)
Name and CNIC No. Shareholding Proportion (No. of
Shares)
For any query/difficulty/information, the members may contact the Bank’s Share Registrar and Share Transfer Agent, at the following address, phone/fax numbers or e-mail address:
THK Associates (Pvt.) Limited Plot No. 32-C, Jami Commercial Street 2, D.H.A., Phase VII, Karachi-75500 UAN: 021-111-000-322 Direct: 021- 35310187 Fax: 021-35310190 Email: [email protected] Web: www.thk.com.pk
6. Urgent Provision of Valid CNIC Copy (Mandatory)
In pursuance with the SECP’s Notification No. SRO.831 (I)/2012 of July 05, 2012, SECP has directed all listed companies to mention CNIC numbers of the registered members on the dividend warrants. Corporate entities are requested to provide NTNs. Please note that in case of non-availability of valid copy of CNIC in respect of members having physical shareholding, their dividends could be withheld.
You are therefore requested to submit a copy of your valid CNIC/NTN/Passport Number within ten (10) days from the date of this Notice to the Bank’s Registrar and Share Transfer Agent. In case you have already provided copy of your valid CNIC, please ignore this instruction.
7. Submission of Bank Mandate with International Bank Account Number (IBAN) for payment of Cash Dividend Electronically into the Bank Accounts of the Shareholders (Mandatory Requirement)
All shareholders of the Bank are hereby informed that under the provisions of Section 242 of the Companies Act, 2017, all listed companies including UBL are required to pay cash dividends declared on or after January 2018 only through electronic mode directly into the designated bank accounts of the entitled shareholders. Therefore, under the new law, physical dividend warrants are not being issued to the shareholders.
In view of foregoing, all the shareholders are again requested to provide their Bank Mandate details including International Bank Account Number (IBAN) along with copy of valid CNIC at the earliest. In case of non-provision of Dividend Mandate, cash dividend(s) could be withheld according to SECP directives.
For providing Dividend Mandate details to CDC/Registrar and Share Transfer Agent, the Form placed on Bank’s website and is enclosed with this Notice may be used. The link to get the said Form is as under:
https://www.ubldigital.com/Portals/0/InvestorRelation/Bank%20Mandate%20Form.pdf
In this connection, CDC shareholders may submit their Dividend Mandate details to their investor account services or their brokers where shares are placed electronically. In case of physical holding, the shareholders are requested to submit their bank mandate details to the Registrar and Share Transfer Agent of the Bank at the following address.
275Annual Report 2020

Notice of 62nd Annual General Meeting of United Bank Limited
THK Associates (Pvt.) Limited, Plot No. 32-C, Jami Commercial Street 2, D.H.A.,Phase VII, Karachi-75500.
UAN # 021-111-000-322Fax # 021-35310191
Dividend Mandate Form
I , _____________________________________ S/o, D/o, W/o, _____________________________________ hereby authorize United Bank Limited to directly credit cash dividends, declared by it, in my bank account as detailed below:
i) Shareholder’s DetailName of CompanyName of ShareholderFolio No. / CDC Participants ID A/c No.CNIC No.Passport No. (in case of foreign shareholder)Land Line Phone NumberCell NumberE-mail addressMailing address
ii) Shareholder’s Bank DetailTitle of Bank AccountInternational Bank Account Number (IBAN) – Mandatory
P K
Bank’s Name
Branch Name and Address
It is stated that the above-mentioned information is correct and I will intimate any changes in the above-mentioned information to the Registrar and Share Transfer Agent of the Bank and / or Central Depository Company (“CDC”) as soon as any change occurs.
_______________________ (Signature of shareholder)
KINDLY NOTE: COMPANY COULD WITHHOLD THE PAYMENT OF DIVIDEND OF A MEMBER WHERE THE MEMBER HAS NOT PROVIDED THE COMPLETE INFORMATION OR DOCUMENTS AS SPECIFIED.
The shareholders who hold shares in CDC are requested to submit the above mentioned Dividend Mandate Form, duly filled-in, to the relevant Broker/Participants/Investor Account Services of the CDC where member’s CDC account is being dealt.
The shareholders who hold shares in physical form are requested to submit the above-mentioned Dividend Mandate Form, duly filled-in, to Company’s Registrar and Share Transfer Agent, as mentioned below:
United Bank Limited276

Notice of 62nd Annual General Meeting of United Bank Limited
M/s THK Associates (Pvt.) LimitedPlot No. 32-C, Jami Commercial Street 2, D.H.A.,Phase VII, Karachi-75500.
For any query, you may please contact on Tel # 021-111-000-322 or email us at [email protected]
8. Consent for Video Link Facility:
Members can attend and participate in the AGM through video-link. The Bank will provide the facility of video-link on demand of members residing in a city, collectively holding 10% or more shareholding in the Bank. Members who wish to avail this facility are requested to fill the below Video Link Form and submit it to the Company at its registered office at least seven (7) days prior to date of the AGM.
The Bank will intimate members regarding venue of video-link facility at least five (5) days before the date of the AGM along with complete information necessary to enable them to access such facility.
Video-Link Form
I/We, __________________________________ of ____________________________, being a member of United Bank Limited, holder of ___________________________ Ordinary Share(s) as per Register Folio No./CDC Account No.__________________ hereby opt for video-link facility at _____________________
____________________Signature of the Member
9. Participation of Shareholders through Online Facility:
The shareholders are encouraged to participate in the AGM through an online platform/ facility being provided in the shape of webinar/webex. The shareholders will be able to login and participate in the AGM proceedings through their smartphones or computer devices from their homes or any convenient location after completing all the formalities required for the verification and identification of the shareholders.
The login facility will be opened at 10:30 a.m. on 31 March, 2021 enabling the participants to join the proceedings which will start at 11:00 a.m. sharp
The shareholders interested in attending the 62nd AGM of UBL through webinar/webex are requested to get themselves registered with the Company Secretary at least 24 hours before the time of AGM at the following e-mail address:
Email address: [email protected]
277Annual Report 2020

Notice of 62nd Annual General Meeting of United Bank Limited
The shareholders are requested to provide the information as per the below format. The link to the webinar/ webex will be sent to the shareholders on the email address provided in the below table:
S. No. Name of the Shareholder
CNIC Number Folio Number Cell Number Email address
The shareholders are also encouraged to send their comments and suggestions, related to the agenda items of the AGM, to the Company Secretary at the above mentioned email address.
10. Placement of Financial Statements on Website:
The financial statements of the Bank for the year ended December 31, 2020 along with reports have been placed on the website of the Bank:
https://ubldigital.com/Investor-Relations/Financial-Statements
Statement of Material Facts Under Section 134(3) of the Companies Act, 2019, concerning to the Special Business:This statement sets out the material facts pertaining to the special business to be transacted at the Annual General Meeting of United Bank Limited (“the Bank”) to be held on 31st March, 2021.
Item No. 6: REMUNERATION OF THE NON-EXECUTIVE DIRECTORS OF THE BANK
Further as required under the Prudential Regulations and SBP guidelines total amount of remuneration paid to the non-executive directors including the Chairman for attending the Board meetings and/or Committees meetings during the year 2020 is submitted for the approval of the shareholders.
If deemed fit, the following Resolution may be passed:
“RESOLVED that the remuneration paid to the Non-Executive Directors of UBL including the Chairman during the year 2020, for attending the Board and / or Board Committees meetings as disclosed in the Note 40 of the Audited Financial Statements of the Bank for the year ended 31st December 2020, be and is hereby confirmed and approved on post facto basis.”
United Bank Limited278

Form of Proxy 62nd Annual General Meeting of United Bank Limited I/We, _______________________________________of ______________ being a member of United Bank Limited (“UBL”) and holder of _________________ ordinary shares as per Share Register Folio No. ______________ and / or CDC Participation I.D. No. _________________________ and Account No._____________________ hereby appoint _____________________________________________________ of ________________________ or failing him / her ________________________________ of ___________________ as my/our proxy to vote for me/us and on my / our behalf at the 62nd Annual General Meeting of UBL scheduled to be held on Wednesday, 31 March 2021 at 11:00 a.m. at United Bank Limited, 13th Floor, UBL Building, Jinnah Avenue, Islamabad and at any adjournment thereof. Signed this _______________ day of ________ 2021 Witness 1: Signature: ___________________________________
Name: _____________________________________
CNIC No. or Passport No: _____________________
Address: ___________________________________
___________________________________________ Witness 2: Signature: ___________________________________
Name: _____________________________________
CNIC No. or Passport No: ______________________
Address: ____________________________________
___________________________________________
_________________________
(Signature should agree with the specimen signature
registered with the Registrar)
NOTE: A. General: 1. A member entitled to attend and vote at a General Meeting is entitled to appoint a person as proxy to attend and
vote instead of him/her.
2. The instrument appointing a proxy should be signed by the member or his/her attorney duly authorized in writing. If the member is a corporation (other than Government of Pakistan), its common seal should be affixed on the instrument.
3. The instrument appointing a proxy, together with Power of Attorney, if any, under which it is signed or a notarially
certified copy thereof, should be deposited, with our Registrar/ Share Transfer Agents, M/s. THK Associates (Pvt.) Limited, Plot no. 32-C, Jami Commercial Street-2, D.H.A. Phase VII, Karachi not less than 48 hours before the time of holding the meeting.
4. If a member appoints more than one proxy, and more than one instrument of proxy are deposited by a member with the Registrar, all such instruments of proxy shall be rendered invalid.
B. For CDC Account Holders:
1. The proxy form shall be witnessed by two persons whose names, addresses and CNIC / Passport No. shall be
mentioned on the form.
2. Attested copies of CNIC or the Passport of the beneficial owners of the proxy shall be furnished with the proxy form.
3. The proxy shall produce his/her original CNIC or original Passport at the time of the meeting.
5 . Applicable stamp duty shall be paid/affixed on the proxy form in accordance with the place of execution.
279Annual Report 2020
Form of Proxy62nd Annual General Meeting of United Bank Limited

United Bank Limited280
AffixCorrectPostage
RegistrarM/s. THK Associates (Pvt.) LimitedPlot No. 32-C, Jami Commercial Street 2, D.H.A.,Phase VII, Karachi-75500Pakistan.

62
" UBL " /
/ / /
/ / /
2021 / / 62 13th
2021 1
2
/ 48 75500 VII- 2 C-32#
/
C:\Users\CS\Downloads\PROXY FORM ( URDU)final.INP 2/27/2021 11:07 PM PAGE 1 (1,1)
62
" UBL " /
/ / /
/ / /
2021 / / 62 13th
2021 1
2
/ 48 75500 VII- 2 C-32#
/
C:\Users\CS\Downloads\PROXY FORM ( URDU)final.INP 2/27/2021 11:07 PM PAGE 1 (1,1)
281Annual Report 2020
صبحبدھ 3111:00

United Bank Limited282
ر رجسٹراایٹس )پرائیویٹ( لمیٹڈ، ایسوسی کے ایچ ٹی میسرز
اسٹریٹ 2، کمرشل نمبر C-32، جامی پلاٹ ،VII ے۔، فیز ا ایچ۔ ڈی۔
کراچی۔75500پاکستان
ڈاک درست چسپاں ٹکٹ
کریں


UNITED BANK LIMITEDUBL Head OfficeI.I. Chundrigar Road, Karachi - 74000, Pakistan.UAN: 111-825-888 Website: www.ubldigital.com
ANNUAL REPORT 2020
In Touchwith Tomorrow