in the summer of 1988 36% of yellowstone national park was burned by forest fires
TRANSCRIPT
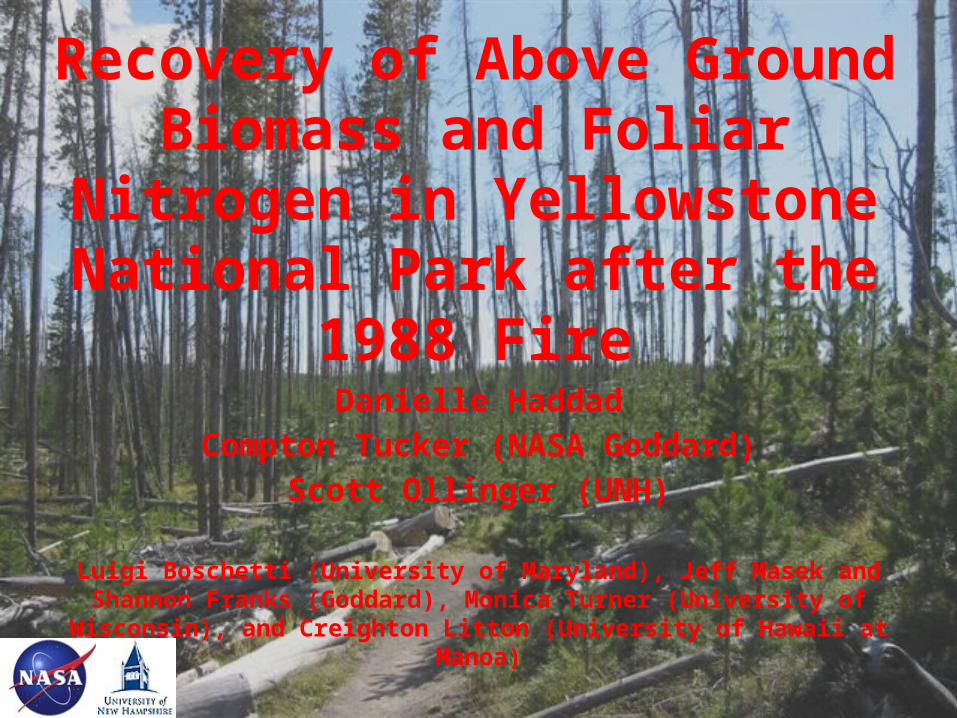
Recovery of Above Ground Biomass and
Foliar Nitrogen in Yellowstone National Park
after the 1988 FireDanielle Haddad
Compton Tucker (NASA Goddard)Scott Ollinger (UNH)
Luigi Boschetti (University of Maryland), Jeff Masek and Shannon Franks (Goddard), Monica Turner (University of Wisconsin), and Creighton Litton (University of Hawaii at
Manoa)

In the summer of 1988 36% of Yellowstone National Park was burned by Forest Fires

Objective• To use a time series of Landsat images to
estimate changes in above ground biomass and foliar nitrogen over time after major disturbance by fire.
• How long does it take the forest to recover from a major forest fire?
– How long does it take for the carbon and nitrogen pool to recover?
– Do they recover at the same rate?
– Could nitrogen limitation slow down the forest recovery?

Why is this important• Fires are becoming more frequent in
Yellowstone.
• Field studies can only look at a limited number of sites.
• A time series also lets us look at the past and the present, while field studies only give you a snap shot of one point in time.
• Limited nitrogen availability can limit plant growth and fire burns foliage and soil organic matter resulting in nitrogen losses.
• It is important to know what long term impacts fire has on Yellowstone’s ecosystem.
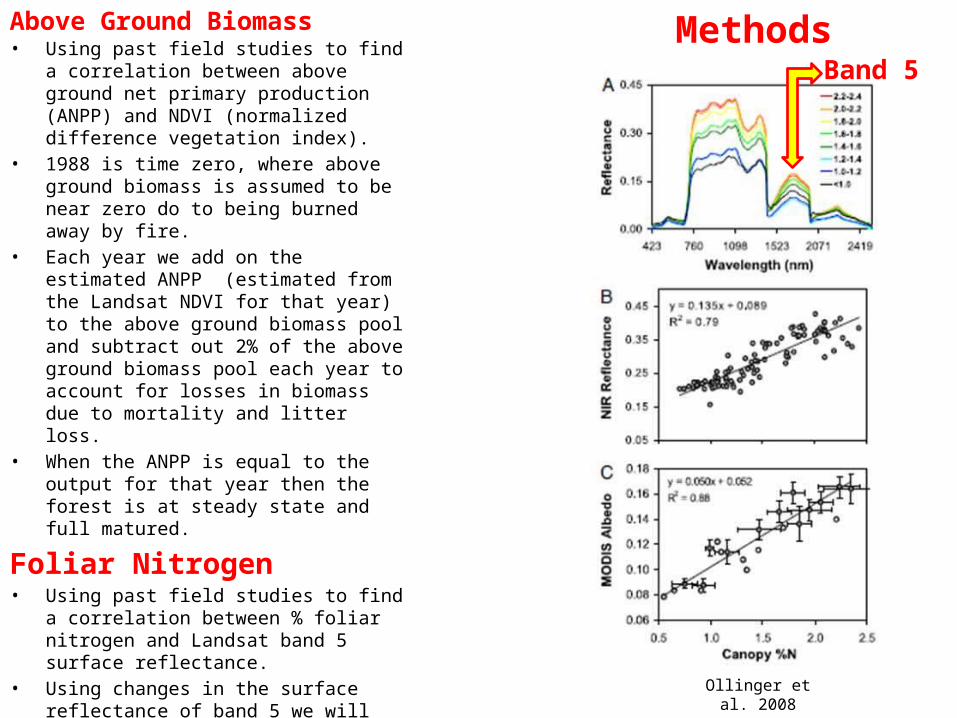
MethodsAbove Ground Biomass• Using past field studies to find a
correlation between above ground net primary production (ANPP) and NDVI (normalized difference vegetation index).
• 1988 is time zero, where above ground biomass is assumed to be near zero do to being burned away by fire.
• Each year we add on the estimated ANPP (estimated from the Landsat NDVI for that year) to the above ground biomass pool and subtract out 2% of the above ground biomass pool each year to account for losses in biomass due to mortality and litter loss.
• When the ANPP is equal to the output for that year then the forest is at steady state and full matured.
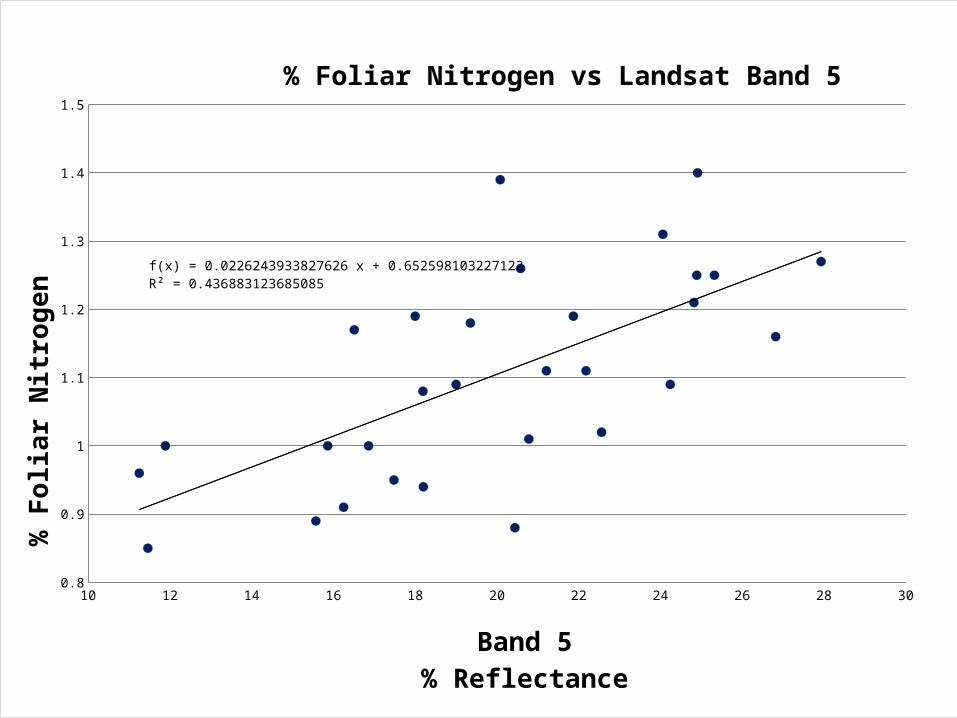
Foliar Nitrogen• Using past field studies to find a
correlation between % foliar nitrogen and Landsat band 5 surface reflectance.
• Using changes in the surface reflectance of band 5 we will track how % foliar nitrogen changes over time.
• By looking at Landsat images before and after the 1988 fire we will see how long it takes for % foliar nitrogen to reach prefire levels.
Ollinger et al. 2008
Band 5
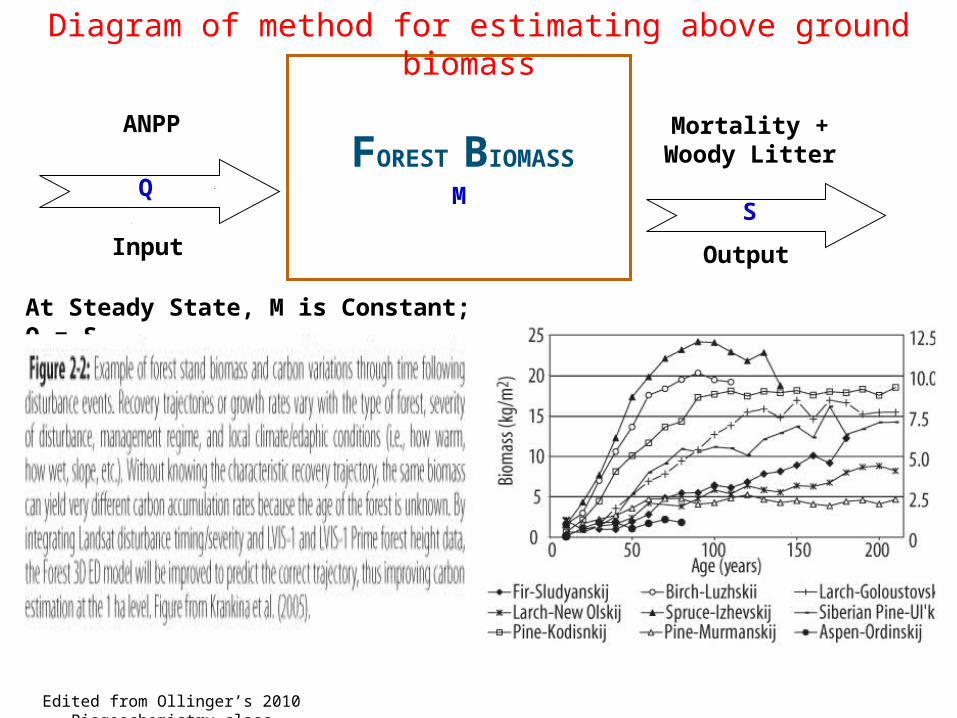
FOREST BIOMASS
ANPP Mortality + Woody Litter
Edited from Ollinger’s 2010 Biogeochemistry class
Input Output
Diagram of method for estimating above ground biomass
At Steady State, M is Constant; Q = S
Q MS

0.25 0.3 0.35 0.4 0.45 0.5 0.55 0.6 0.65 0.70
2
4
6
8
10
12f(x) = 78.3863092147629 x^4.26822708671434R² = 0.628789887145038
Above Ground Net Primary Production vs Normalized Difference Vegetation Index
NDVI
ANPP
(Mg/
ha/y
r)
10 12 14 16 18 20 22 24 26 28 300.8
0.9
1
1.1
1.2
1.3
1.4
1.5
f(x) = 0.0226243933827626 x + 0.652598103227122R² = 0.436883123685085
% Foliar Nitrogen vs Landsat Band 5
Band 5% Reflectance
% F
olia
r Nitr
ogen
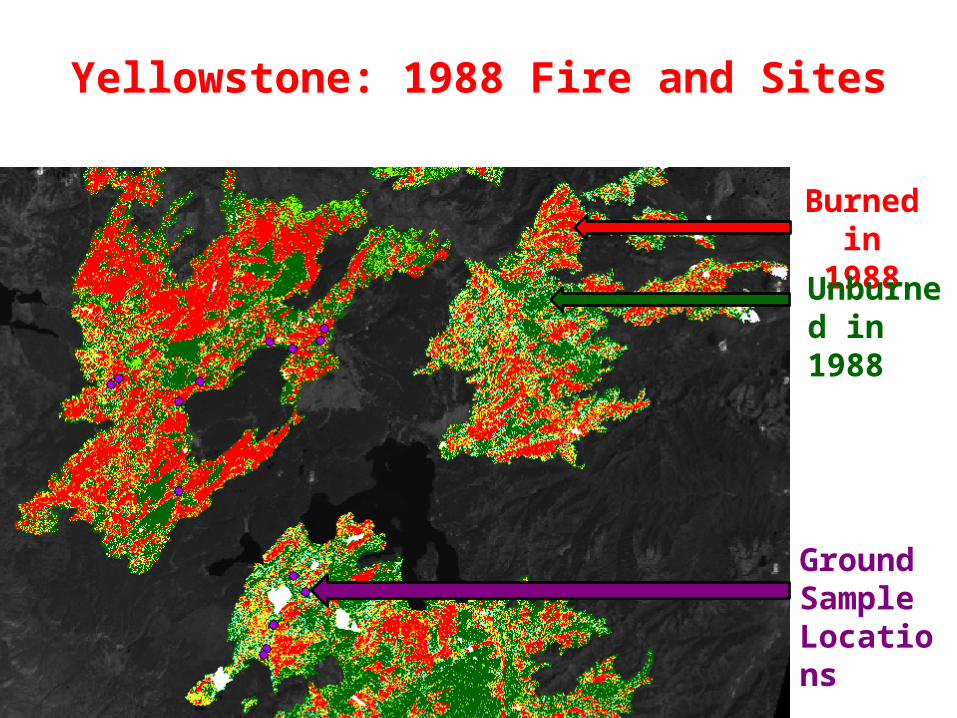
Yellowstone: 1988 Fire and Sites
Burned in 1988
Unburned in 1988
Ground Sample Locations

19861988
19901992
19941996
19982000
20022004
20060.80
0.90
1.00
1.10
1.20
1.30
% Foliar Nitrogen Over Time Following the 1988 Fire at Yel-lowstone
Cascade Meadows North
Lewis Canyon
Pitchstone Hobo
Firehole Loop South
Biscuit Basin
Riddle High
South Lewis Canyon
84 Blowdown
Cascade Meadows South
Cygnet Lakes North
Fountain East
Gravel Pit
Heart Lake Trail
Gibbon Falls
% F
olia
r N
19891990
19911992
19931994
19951996
19971998
19992000
20012002
20032004
20052006
20070
2
4
6
8
10
12
14
16
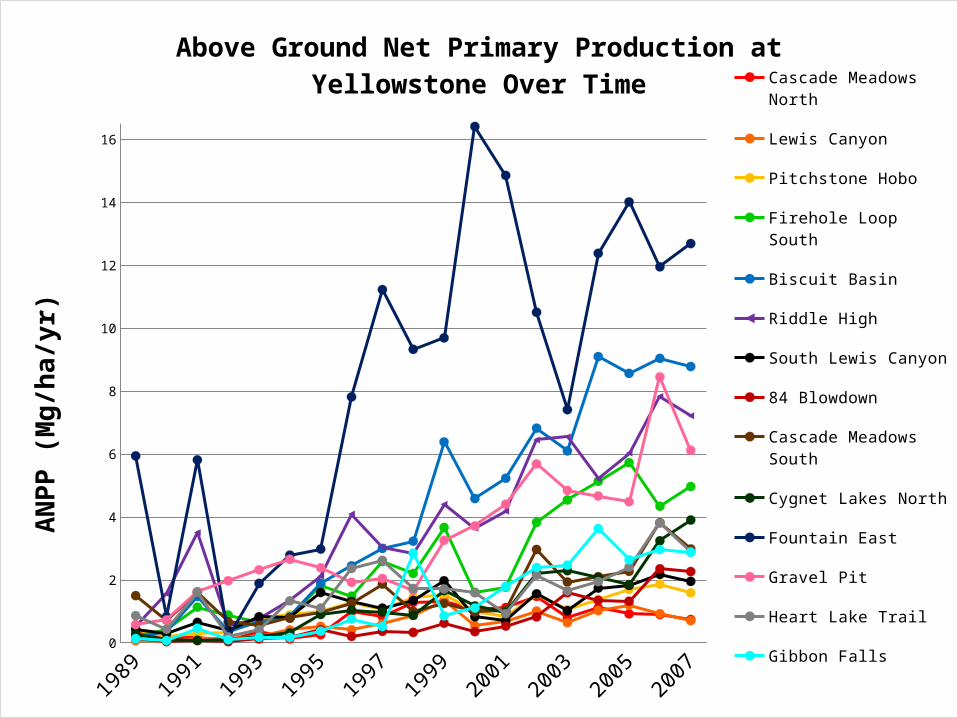
Above Ground Net Primary Production at Yellowstone Over TimeCascade Meadows North
Lewis Canyon
Pitchstone Hobo
Firehole Loop South
Biscuit Basin
Riddle High
South Lewis Canyon
84 Blowdown
Cascade Meadows South
Cygnet Lakes North
Fountain East
Gravel Pit
Heart Lake Trail
Gibbon Falls
ANPP
(Mg/
ha/y
r)
19891990
19911992
19931994
19951996
19971998
19992000
20012002
20032004
20052006
20070
20
40
60
80
100
120
140
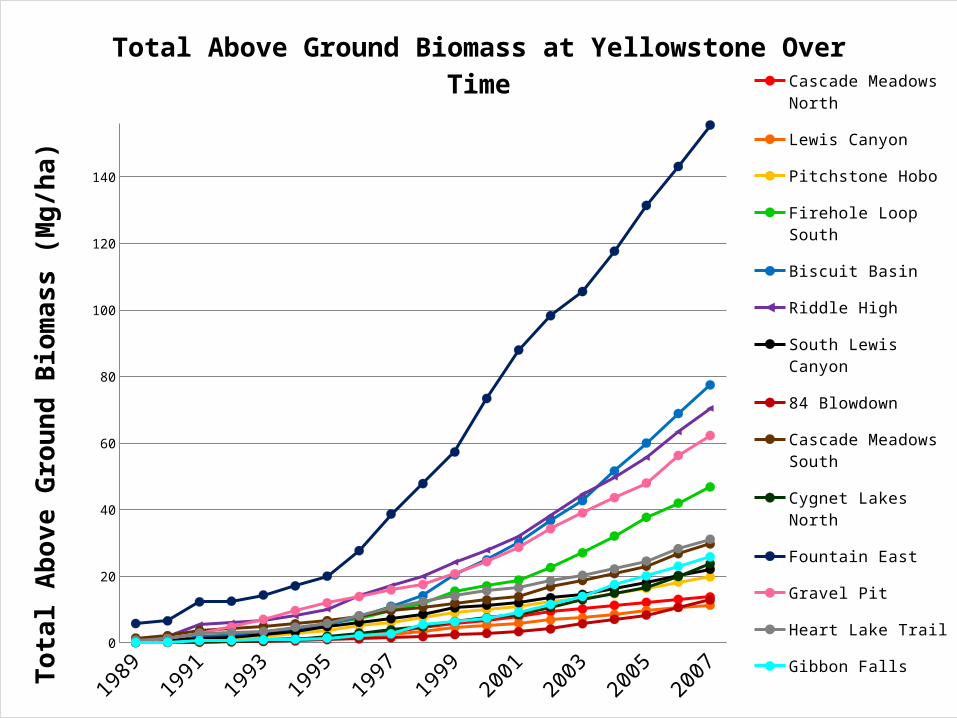
Total Above Ground Biomass at Yellowstone Over Time
Cascade Meadows North
Lewis Canyon
Pitchstone Hobo
Firehole Loop South
Biscuit Basin
Riddle High
South Lewis Canyon
84 Blowdown
Cascade Meadows South
Cygnet Lakes North
Fountain East
Gravel Pit
Heart Lake Trail
Gibbon Falls
Tota
l Abo
ve G
roun
d Bi
omas
s (M
g/ha
)
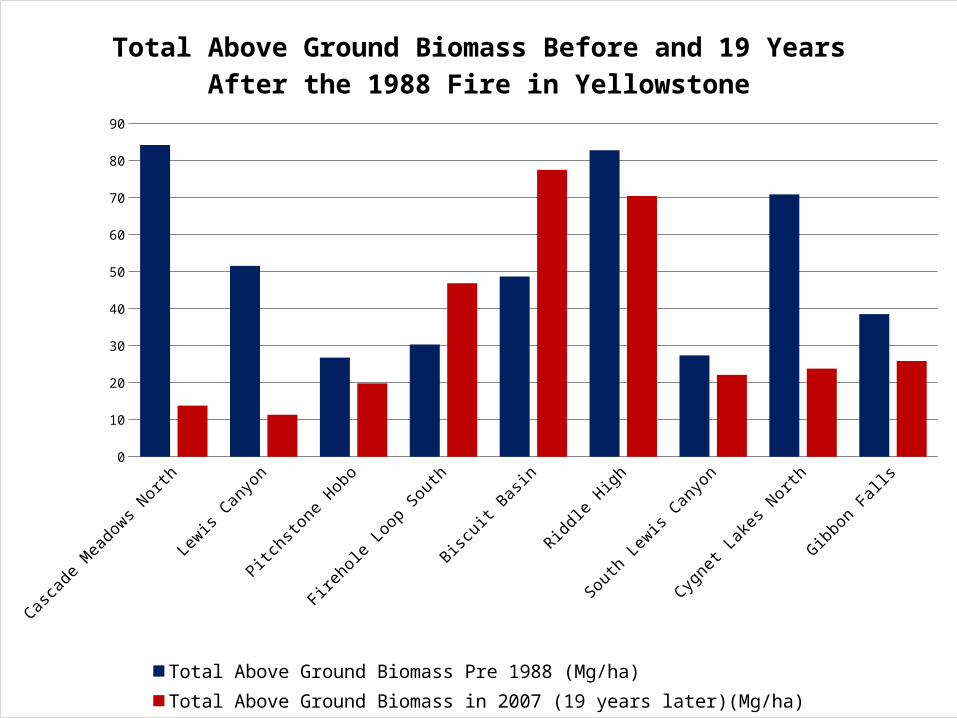
Cascade Meadows
North
Lewis Canyon Pitchstone Hobo
Firehole Loop South
Biscuit Basin Riddle High South Lewis Canyon
Cygnet Lakes North
Gibbon Falls0
10
20
30
40
50
60
70
80
90
Total Above Ground Biomass Before and 19 Years After the 1988 Fire in Yellowstone
Total Above Ground Biomass Pre 1988 (Mg/ha)Total Above Ground Biomass in 2007 (19 years later)(Mg/ha)

0.9 0.95 1 1.05 1.1 1.15 1.2 1.25 1.30.04
2.04
4.04
6.04
8.04
10.04
12.04
14.04
16.04
Above Ground Net Primary Production vs Foliar Nitrogen: Estimated Values
% Foliar N
AN
PP (M
g/ha
/yr)
0.8 0.9 1 1.1 1.2 1.3 1.4 1.50
5
10
15
20
f(x) = 2.60767691364525 x -̂4.33199691731827R² = 0.358231819868765
Above Ground Net Primary Production vs Foliar Nitrogen: Field Data
% Foliar N
AN
PP (M
g/ha
/yr)
P value = <0.0001*
Works CitedKrankina et al. (2005) Effects of climate, disturbance, and species on forest biomass across Russia. Canadian Journal of Forest Research 35: 2281 – 2293
Litton, Creighton M., Above- and Belowground Carbon Allocation in Post-fire Lodgepole Pine Forests: Effects of Tree Density and Stand Age, Ph.D., Department of Botany, December, 2002.
Ollinger et al. (2008) Canopy nitrogen, carbon assimilation, and albedo in temperate and boreal forest: Functional relations and potential climate feedbacks. PNAS 105: 19336 -19341
Turner et al. (2004) Landscape Patterns of Sapling Density, Leaf Area, and Aboveground Net Primary Production in Postfire Lodgepole Pine Forest, Yellowstone National Park (USA). Ecosystems 7: 751 – 775
Turner et al. (2009) Variation in foliar nitrogen and aboveground net primary production in young post fire lodgepole pine. Can. J. Res. 39: 1024 - 1035
Wildland Fires in Yellowstone. National Park Service: http://www.nps.gov/yell/naturescience/wildlandfire.htm
ImagesLandsat Thematic Mapper (TM) onboard Landsat 4 and 5: http://glovis.usgs.gov
LEDAPS: Landsat Ecosystems Disturbance Adaptive Processing Systems, Jeff Masek: http://ledaps.nascom.nasa.gov
Regional Burn Severity Mosaics from Monitoring Trends in Burn Severity (MTBS) by USGS and the Forest Service: http://www.mtbs.gov