in the dance studio: an art and engineering exploration of...
TRANSCRIPT
In the Dance Studio: An Art and EngineeringExploration of Human Flocking∗†
Naomi E. Leonard, George F. Young, Kelsey Hochgraf, Daniel T. Swain,Aaron Trippe, Willa Chen, Katherine Fitch, and Susan Marshall
Princeton University, Princeton, NJ 08544, USA
Abstract. Flock Logic was developed as an art and engineering projectto explore how the feedback laws used to model flocking translate whenapplied by dancers. The artistic goal was to create choreographic toolsthat leverage multi-agent system dynamics with designed feedback andinteraction. The engineering goal was to provide insights and design prin-ciples for multi-agent systems, such as human crowds, animal groups androbotic networks, by examining what individual dancers do and whatemerges at the group level. We describe our methods to create danceand investigate collective motion. We analyze video of an experiment inwhich dancers moved according to simple rules of cohesion and repul-sion with their neighbors. Using the prescribed interaction protocol andtracked trajectories, we estimate the time-varying graph that defines whois responding to whom. We compute status of nodes in the graph andshow the emergence of leaders. We discuss results and further directions.
Keywords: Collective motion; dance; choreography; feedback; social in-teraction; networks; leadership; human groups; animal groups
1 Flock Logic
The Flock Logic project [1] was conceived by engineering professor/control the-orist Naomi Leonard and dance professor/choreographer Susan Marshall. Mar-shall approached Leonard in 2010 about the possibility of an investigation tofind out what would happen if a group of dancers were in possession of therules governing the motion of groups of flocking animals. The project was ini-tiated as a joint exploration with professional dancers in July 2010 and thensubsequently as a semester-long Princeton University Atelier course co-taughtby Leonard and Marshall in Fall 2010. The professional dancers and the students,most of whom had previous dance training, participated in collaborative artistic
∗ This effort was supported in part by Princeton University’s Essig Enright Fund,Lewis Center for the Arts, Keller Center for Innovation in Engineering Education,and Mechanical and Aerospace Engineering Department, and by NSF grant ECCS-1135724, AFOSR grant FA9550-07-1-0-0528 and ONR grant N00014-09-1-1074.† In Controls and Art: Inquiries at the Intersection of the Subjective and the Objective,
eds. A. Laviers, M. Egerstedt, Springer, New York, 2014.

2 An Art and Engineering Exploration of Human Flocking
and scientific investigations and experiments inspired by the complex and beau-tiful group motion that emerges in bird flocks and fish schools. The aim wasto explore artistically and scientifically how individual rules of interaction andresponse within a network of dancers yield complex emergent collective motionof the group.
The emergent nature of flocking and schooling was a central driver for theproject: the remarkable collective motion of flocks and schools results not froma prescribed choreography nor even from a designated leader, but rather fromsimple rules of response that each individual obeys [2]. These feedback rulesgovern how each individual moves in response to the relative position or motionof its close neighbors. For instance, basic flocking rules typically have a cohesiveelement and a repulsive element [3]. The cohesive element requires that whileeach individual moves around it should remain a comfortable distance from afew others; the repulsive element requires that each individual should move awayfrom others that get too close. An active area of research is focused on explain-ing how the observed complex collective motion of animal groups emerges from,and is influenced by, the feedback rules, the dynamics of the social interactionswithin the group, the distribution of information across the group, the features inthe spatial surrounding, the differences among individuals, the noise in measure-ments, and the uncertainty in decision-making [4, 5]. Analytical and numericalstudies and laboratory and field experiments have all been used to investigate;for example, see [6–8] for a range of studies on flocking of starlings.
Flock Logic explored what happens when a group of dancers apply these andrelated feedback laws as they move around a space together. In the Flock Logicexplorations the flocking rules were prescribed, but neither how the dancersapplied the rules nor how faithfully they followed the rules were controlled. Forexample, the number of neighbors and the distance from neighbors to maintainin the coherence rule were prescribed, but the dancers were not instructed howto choose with whom to cohere, how to prioritize among neighbors moving indiverging directions, nor how to handle conflicts such as when cohering withone dancer meant getting too close to another dancer. It was also possible thatdancers broke the rules at times. Thus, the emergent human flocking resultedfrom both prescribed and individualized, and thus unknown, features of dancers’choices and dynamics. In this way the Flock Logic project provided a frameworkfor exploring emergent collective behavior somewhere between studying animalaggregations in the wild, with all that is unknown, and examining computersimulated flocking, with its exclusive reliance on a prescription.
This aspect of Flock Logic made it particularly well suited to an integratedart, engineering and science agenda. On the one hand, the Flock Logic frame-work made it possible to observe the influence on collective motion of naturalbiases, in this case human biases, and heterogeneity across the group. Dancerswith different physical features, personalities, dance training, etc., would responddifferently to one another and would prioritize rules and resolve conflicts differ-ently. This would affect how information would pass through the group and howthe group as a whole would respond to external forces. On the other hand, the

An Art and Engineering Exploration of Human Flocking 3
Flock Logic framework made it possible to systematically examine the influenceon collective motion of parameters of the prescribed rules. This applied to theparameters of rules and environments meant to represent animal groups, e.g.,number of others with whom to cohere, total population of the group, availabil-ity of information or preferences across the group, as well as the shape, size andplacement of obstacles. This also applied to the parameters of rules and environ-ments not necessarily intended to represent animal groups but rather motivatedby artistic and engineering design goals. By varying rules and environmental fea-tures beyond what one would expect in animal groups, it was possible to explorehow individual-level behaviors connect more generally to the aesthetics and thefunctionality of the emergent group-level behaviors. And this led to the creationof a wide range of artistic and engineering design possibilities.
The engineering goal was to use the explorations with dancers to gain insightinto the mechanisms of animal group and human crowd dynamics and into designprinciples for control of natural and robotic groups. Could the dance studiobe viewed as an experimental test-bed in this regard? Could the human datacollected be used to help explain a range of collective behaviors? The dancerscould represent a human crowd moving in a bounded space, trying to avoidcolliding. Likewise, dancers moving in a studio, responding to local neighbors andthe environment, provide a reasonable approximation to the collective motion ofa herd. The walls of the studio are like trees or topography, and the heterogeneityamong the dancers (experience, height, confidence) is similar to that in a herd[9]. Further, dancers are particularly well suited to these kinds of explorationsbecause they are trained to be physically aware and can comfortably handlea number of feedback rules. Thus, the setting provided enormous flexibility inthe kinds of questions that could be addressed. For example, in the presentchapter, the human motion data are used to rigorously study how influenceamong individuals in the network is distributed and how that is reflected inthe changing spatial distribution of individuals and in the group-level shapeand motion dynamics. This could, for example, lead to insights on how humancrowds move in cluttered spaces and how animals organize themselves to reducevulnerability to predators [10]. This could also lead to bio-inspired methods fordesigning robust and responsive networks of heterogeneous robots [11].
There are a number of motivating and complementary scientific studies ofhuman collective motion, many of which focus on crowd dynamics. Experimentson leadership and decision-making in human crowds were described in Dyeret al.[12]. In Moussaid et al. [13] analysis of natural pedestrian group motionrevealed the influence of social interactions on crowd dynamics. In Funes et al.[14] a design method for human collective behaviors used evolutionary dynamics.Simplified models described in Silverberg et al. [15] predicted collective behaviorof humans in mosh and circle pits as observed from video data of heavy metalconcerts. Altenberg [16] developed a set of rule-based movement experiments asa concrete way of teaching emergence.
In Flock Logic, the engineering goal was tightly integrated with the artisticgoal, where the idea was to see how applying work on decentralized control

4 An Art and Engineering Exploration of Human Flocking
of collective motion, to dancers, could potentially result in choreographic toolsor training tools for developing individual and group awareness. It was alsoimagined that a site-specific large group performance work could be developedwith little more than a site and the rules.
The artistic interest centered on a desire to translate flocking rules suchas those related to group cohesion and response to external pressures into im-provisational instructions for dancers. Could these rules support unexpected andcomplexly orchestrated collective motion to emerge from individual interactions?How might the local sensing rules be altered choreographically to make emer-gent choreography that didn’t resemble the familiar look of organic flocking?Could these rules be learned quickly by non-dancers to create a kind of flashmob performance?
In theater and dance, there is a long history of movement practice and per-formance based on structured improvisation and rules and games [17]. Con-temporary choreographer Forsythe has studied synchrony and pattern in dance,as in, for example, “Synchronous Objects” [18]. Choreographer Sgorbati hasexplored dance through “Emergent Improvisation,” which is modeled after or-dering principles observed in nature [19]. Hagendoorn [20] designed rules fordancers to explore complexity, emergent patterns and emergent choreography.Carlson [21] introduced constraints in movement generation to study creativedecision-making in choreographic practice.
Often in improvisational dance work, the individual has a wide range ofchoices open to them and takes compositional responsibility for the entire stageas well as their own body. The Flock Logic rules tend to limit the individual’schoices to their immediate neighbors and to ask the individual to relinquishgroup choreographic responsibility; nonetheless, rich group choreography results.Could rules be designed that would allow dancers, ignorant of any overarchingchoreographic goals, to create complex and organized patterns using these tools?
In Flock Logic, to generate human flocking, the dancers were asked to moveabout a space and follow rules that were defined in advance. To enable cohesion,each dancer was given the rule to keep m of their neighbors at a distance ofarm’s length with the selection of the m neighbors freely changeable. To enablerepulsion, each dancer was asked to avoid letting any dancer get closer than arm’slength. To prevent tripping, the dancers were asked to avoid moving backwards.
These three rules (cohesion, repulsion, backwards avoidance) were among themost fundamental rules examined. Variations on the three fundamental ruleswere prescribed as well as a range of additional and alternative rules. For exam-ple, rules for alignment with neighbors, response to obstacles and walls, optionsto initiate or imitate specific movements, etc., were implemented. More complexinformational structures were imposed – for example, two or three dancers inthe group were secretly given additional rules, such as to move to a particularlocation or according to a particular pattern. The dancers also performed rulesfor other kinds of behaviors such as dynamic coverage and pursuit and evasion.In part because each dancer’s motion was relatively under-prescribed, there wasconsiderable room for variation among individuals, e.g., in speed, facing direc-

An Art and Engineering Exploration of Human Flocking 5
tion relative to motion, selection of neighbors, positioning relative to neighbors,and response to walls or obstacles.
Complex and artistically satisfying collective behaviors were routinely ob-served. As part of the 2010 Princeton University Atelier course, approximatelyfifty volunteers participated in two flocking performances, each at a different site,after having been briefly instructed in a few local rules of cohesion, repulsion andalignment as well as responses to obstacles, to walls, and to “predators”. Fromboth artistic and engineering perspectives, these were highly satisfying perfor-mances. A snapshot from one of the performances is shown in Figure 1. Videoclips from the events are publicly available and can be accessed from the FlockLogic website [1] or directly at the following links:http://vimeo.com/19361231 (Peter Richards);http://www.princeton.edu/main/news/archive/S29/62/38K80/ (Evelyn Tu);http://www.youtube.com/watch?v=Mg29hawdcMw (Jeffrey Kuperman).
Fig. 1. Snapshot from a Flock Logic performance at Princeton University in December2010.
In this chapter, we describe the Flock Logic explorations and the tools usedfor our artistic and engineering investigations. As an illustration, we examineone experiment with thirteen dancers who followed the flocking rules of cohesionand repulsion as they moved around the dance studio. Using the trajectoriestracked from an overhead video camera and the prescribed interaction rules, weestimate the time-varying graph that encodes who is sensing whom as a functionof time. We compute the time-varying status of each node in the graph, defininghow much attention a dancer receives from the rest of the dancers, and use these
6 An Art and Engineering Exploration of Human Flocking
to infer emergent leaders. We discuss implications, open questions, and furtherdirections both artistic and scientific.
The work described in this chapter connects with the work described in sev-eral other chapters in this collection. In Chapter 7, Heupe et al. [22], similarlyinspired, investigate how flocking dynamics can be used to generate music, andthey use performance to explore the rich interplay between coherence and deco-herence. In Chapter 9, LaViers et al. [23] also use performance to study danceand address engineering design questions similar to ours by investigating how totranslate information about human dance styles into design for robotic motion.Although in our work, we only track dancers offline after an event, real-timetracking of humans offers the potential for more complex interactions betweenhumans and machines, as shown in Chapter 8 by Godbehere and Goldberg [24].The work in Chapter 6 of Tsiotras and Castro [25] further demonstrates the rich-ness of multi-agent geometries that can result from modifications to the basicrules of flocking.
In Section 2 we describe our human flocking explorations, including our on-line FlockMaker software tool, and the human flocking experiments. Trajectorytracking is described in Section 3. In Section 4 we review graphs and FlockGra-pher, our tool for visualizing graphs. In Section 5, we estimate the time-varyinggraph of the network. In Section 6 we estimate node status and discuss the influ-ence of individuals. We conclude with a discussion of the results and a reflectionon further artistic and engineering opportunities that build on the Flock Logicproject in Section 7.
An earlier version of this paper appeared in the proceedings of the AmericanControl Conference, held in Montreal, Canada in June 2012 [26]. At this sameconference, a special interactive session was held in which 100 conference atten-dees participated in a human flocking performance event. For this event, originalaccompanying music was composed and performed live by Cristian Huepe.
2 Human Flocking
2.1 Explorations
A typical Flock Logic exploration involved on the order of 10 to 15 dancerswho moved around the dance studio for a few minutes applying flocking rulesprescribed in advance. Many of these explorations were run in series during asingle session, with a wide variety of flocking rules prescribed. The dancers weregiven frequent opportunities to watch the group from the outside, and to discusshow it felt from within the group and how it looked from without the group.The process was highly collaborative: dancers made suggestions routinely andduring a number of sessions small groups of dancers would design a set of rulesfor themselves and for the rest of the group.
The explorations evolved over time as the dancers gained more experiencewith moving according to the rules of flocking. This meant that level of experi-ence played into the emergent collective motion, especially later in the semester

An Art and Engineering Exploration of Human Flocking 7
when volunteers were briefly “trained” and joined the group for flocking. Byadding dancers to the group, the role of the number of dancers was also explored.As many as 24 dancers participated in some of the experiments in the studio,described in Section 2.3. In one of the Flock Logic performances in December2010 more than 50 people were involved and in later flocking events, such as atthe special session in Montreal at the American Control Conference, as manyas 100 people participated. Sessions were also held outdoors which provided theopportunity for explorations in a space without boundaries.
The basic flocking rules of cohesion, which meant keeping m neighbors atarm’s length, repulsion, which meant moving away from anyone closer than arm’slength, and backwards avoidance, formed the basis of many explorations. Two-person cohesion (m = 2) was enough to create what looked like a planar schoolor flock. With m = 2 the dancers were regularly spaced and exhibited polarizedmotion, i.e., everyone moving together in a single direction, as well as circularmotion, i.e., the group moving around a circle. The circular motion sometimesdrifted and sometimes remained fixed about a single stationary dancer. Thegroup also experienced fissions and fusions as well as significant changes in mo-mentum. When m was decreased to m = 1, i.e., one-person cohesion, the resultwas a lot more “parading” and much less of the distributed look of a naturalflock.
Explorations made use of the presence of walls and the introduction of ob-stacles. With no special rules attached to walls or obstacles, the dancers treatedthem much as animals would likely treat them, i.e., they deftly avoided collidingwith them. In one case a row of chairs was extended in a line from one wall intothe middle of the room. When the dancers moved into the smaller space createdby the chairs and the parallel wall, they would remain there temporarily, as ifcaught in a tidal pool, and only move out once they had reversed direction. Whenrules were prescribed with respect to walls and obstacles, all sorts of interesting,and less biologically motivated, collective behavior emerged. For example, thewalls were given an attractive pull as well as a “stickiness”. As a result, dancersgetting close to a wall got pulled away from the group and stuck there (see Fig-ure 1). They were released from the wall by cohesion to other dancers when atsome later point the group passed by them. This looked like the peeling off andadhering back of dancers in an ordered way since these dancers still applied thecohesion and repulsion rules among themselves.
In another case, a round table was moved into the open space and endowedwith the properties of a sling shot. When dancers got close to the table theywould circle around it in a fixed direction, e.g., counter-clockwise, at an increasedspeed and then get “flung off.” This led to a variety of different outcomes sincedifferent dancers resolved conflicts differently. For example, in early runs with theround table, the first few dancers moved around the table at elevated speed, butthen they tended to slow down and congregate in a slow moving flock nearby. Thedancers who went around the table subsequently either stopped short to avoidcutting through this congregating group or broke the repulsion rule and charged

8 An Art and Engineering Exploration of Human Flocking
right through it. In the performance events in December 2010, a “waterfall”effect was sustained with two slingshot tables (see Figure 1).
The ability to prescribe individualized preferences and objectives was also ex-plored. These explorations were motivated by an interest in understanding therole of heterogeneity in preference and objective in groups, if and how individualscan exert leadership through motion, and the range of emergent collective mo-tion patterns that can result. Individualized objectives were typically prescribedsecretly: all dancers were told to follow the three basic flocking rules and 2 or 3of the dancers, unbeknownst to the others, were directed to follow certain addi-tional rules. For example, the 2 or 3 selected dancers were sometimes given thesame additional rule, such as to head for one corner of the room or out a door.Alternatively, the 2 or 3 dancers were given conflicting rules, such as one toldto aim for one corner of the room and another to aim for the opposite corner.Or the 2 or 3 dancers were given a joint objective such as to split the group intosubgroups. How dancers attempted to attain their additional objectives was ex-plored, and it was observed and discussed how some dancers were successful andsome were not successful in influencing the other dancers through their motion.
In some explorations, 1 or 2 dancers were instructed to behave as a predatoror pursuer by waving a hand or t-shirt or flashing a bicycle light. In this casethe dancers were given the rule to keep a safe distance from the pursuers, e.g.,5 or 10 feet depending on the size of the studio. The pursuers could thus putpressure on the group and create a variety of beautiful patterns by trapping theflock, shaping the flock, and restricting the flock’s motion to changing corridorsof space in the studio. Cyclic pursuit and evasion was also explored in which caseevery dancer was assigned one other dancer to pursue so that the group madea closed cycle with each dancer having one person to pursue and one personto evade. The motion patterns were constantly changing loops with multipleintersections, with qualitative features as predicted in [27]. Figure 2 shows asnapshot of 24 dancers in a cyclic pursuit experiment in the dance studio.
It was also found that adding an optional alignment rule created furtherartistic variation and options. Many other rules were explored in place of thebasic flocking rules; these contributed significantly to artistic, engineering andscientific goals. For example a rule was applied in which each dancer moved withoscillating speed, i.e., accelerating and decelerating repetitively, and such thatthe oscillations were out of phase with others nearby. This was motivated by theoscillating speed observed in fish schools and the rich family of motion patternsthat could be designed using this rule [28]. In another example, rules for dynamiccoverage were explored; these rules were motivated by problems of foraging overspaces of distributed resource [29].
2.2 FlockMaker
FlockMaker is a Java WebStart application developed to aid the Flock Logicproject and designed for simulation and exploration of collective motion [30].FlockMaker is inspired by the original work of Reynolds [31] on rule-based sim-ulation of flocking particles. It is similar in spirit to the “Counterpoint Tool”

An Art and Engineering Exploration of Human Flocking 9
Fig. 2. Snapshot of a cyclic pursuit experiment with 24 dancers. The position of eachdancer is marked with a green dot and a dashed line connects each pair of pursuer andpursued. The collection of dashed lines shows that the dancers move around a singleclosed curve that loops around, intersecting itself three times.
10 An Art and Engineering Exploration of Human Flocking
in Synchronous Objects [18], in which the dynamic motion of widgets are ani-mated and the user can modify the number and scale of widgets as well as theparameters that define the extent of their alignment and synchrony of motion.
FlockMaker is intuitive for a curious layperson, and it can be used to modelcomplex combinations of flocking rules and initial configurations. Each danceris represented as a single particle, modeled as a colored dot with a directionalarrow, moving in the horizontal plane with variable velocity. Speed and facingangle (but not acceleration) are taken to be approximately continuous in time.
The user can assign a variety of flocking rules to the dancers, such as “PursueSomeone,” “Repel Neighbors,” and “Slow Down Near Neighbors.” To furthercontrol behavior, the user can set values for a wide range of parameters pertainingto a dancer’s rules or initial configuration, including radius of sensing, number ofneighbors sensed, maximum speed of rotation, and magnitude of additive randomnoise. Different rules can be assigned to different dancers. Furthermore, eachdancer can be assigned to follow multiple rules at a time, each rule potentiallycarrying a different relative weight representing its level of priority.
Dancers interact not only with one another, but also with the room in whichthey are moving, represented as a rectangular space contained within four walls.The FlockMaker user can change the size of the room, add obstacles to the room,and add rules applicable only within certain zones of the room.
After several weeks of work in the studio, the students in the PrincetonUniversity Atelier course spent time using FlockMaker, both to test ideas thathad been tried in the studio and to investigate new ideas. Several of the rule setsand emergent behaviors investigated in FlockMaker were subsequently exploredin the studio.
2.3 Experiments
A series of human flocking experiments was run in mid December 2010 in the62’ 7” x 28’ 4” New South dance studio at Princeton University. Groups ofdancers carried out the three basic rules of flocking with manipulations on initialconditions, number of dancers N (either 13 or 24), and number of neighbors mfor cohesion (either 1 or 2). Alignment with neighbors was tested as was theassignment of an additional rule to two of the dancers (of which the others werenot aware), which was to try to split the group. Several experiments were alsorun with dancers implementing the rules for cyclic pursuit; see Figure 2.
Six Trendnet IP-600 cameras, synchronized over a local wired network, wereset up in fixed locations to record the motion of the dancers. Two cameras werehung on the ceiling near either end of the studio, facing inward towards eachother, and four were mounted high up on one side wall. Camera views coveredthe majority of the space in the studio and overlapped significantly. Using built-in software, the cameras recorded video and stored it on a laptop. The videoprovided 640 x 480 resolution and 20 frames per second.
For the December 2010 series of experiments, part of the room was blockedoff so that the motion of all of the dancers could be fully captured by one of
An Art and Engineering Exploration of Human Flocking 11
the six cameras (one of the two fixed to the ceiling). The dancers wore brightcolored hats, black clothing and bare feet to aid trajectory tracking.
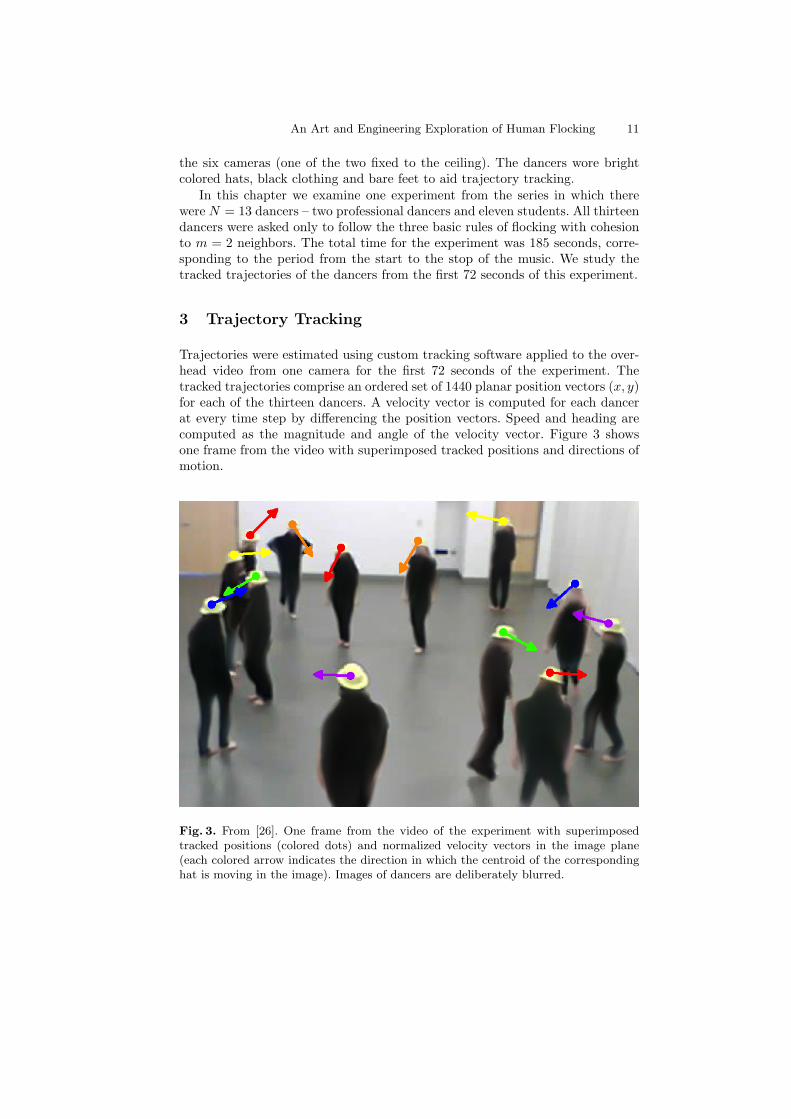
In this chapter we examine one experiment from the series in which therewere N = 13 dancers – two professional dancers and eleven students. All thirteendancers were asked only to follow the three basic rules of flocking with cohesionto m = 2 neighbors. The total time for the experiment was 185 seconds, corre-sponding to the period from the start to the stop of the music. We study thetracked trajectories of the dancers from the first 72 seconds of this experiment.
3 Trajectory Tracking
Trajectories were estimated using custom tracking software applied to the over-head video from one camera for the first 72 seconds of the experiment. Thetracked trajectories comprise an ordered set of 1440 planar position vectors (x, y)for each of the thirteen dancers. A velocity vector is computed for each dancerat every time step by differencing the position vectors. Speed and heading arecomputed as the magnitude and angle of the velocity vector. Figure 3 showsone frame from the video with superimposed tracked positions and directions ofmotion.
Fig. 3. From [26]. One frame from the video of the experiment with superimposedtracked positions (colored dots) and normalized velocity vectors in the image plane(each colored arrow indicates the direction in which the centroid of the correspondinghat is moving in the image). Images of dancers are deliberately blurred.
12 An Art and Engineering Exploration of Human Flocking
The custom tracking software uses a modified version of a real-time trackingalgorithm that was developed at Princeton and used successfully for experimentsinvolving multiple fish and robots [32]. The algorithm is implemented using theMADTraC C++ library [33], which in turn relies upon OpenCV [34] for low-level image processing routines. The original tracking software was designed toaddress the challenges of tracking potentially densely distributed objects thatare very similar to one another in appearance. It was therefore applicable to thetask of estimating dancers’ trajectories.
The tracking algorithm follows three steps that are iterated for each videoframe, and described in greater detail in [32]. In the first step, image segmenta-tion produces a set of “blobs”, such that each blob is a collection of contiguouspixels with high likelihood of belonging to any dancer’s hat. Likelihood is deter-mined by thresholding each pixel’s value in HSV color space and mapping to abinary image. Blobs are extracted from the binary image using OpenCV’s built-in blob labelling algorithm, which is based on [35]. A blob is often associatedwith more than one dancer because of the physical proximity of dancers to oneanother, the proximity of dancers in the image due to the angle of the camera,and noise in the image.
In the second step, the blobs are analyzed in order to extract a noisy mea-surement for the position of each dancer. If a single dancer is associated witha blob, then the measurement of that dancer’s position is taken as the cen-troid of all pixels in that blob. Otherwise, to resolve multi-dancer blobs or clus-ters of densely-spaced blobs, an expectation-maximization mixture-of-gaussian(EMMG) algorithm is used, which iteratively adjusts dancer positions for a givencluster and provides position measurements as output.
In the third step, the noisy position measurements are used with an unscentedKalman filter (UKF) for each dancer to provide a more accurate estimated posi-tion (x, y) in the current frame and to predict the position in the next frame. Theestimated position of each dancer is stored as the current point in the dancer’stracked trajectory. The predicted positions are used to inform the next trackingiteration. The (x, y) position vector is expressed in a coordinate frame that isparallel to the floor. The transformation to these coordinates from image planecoordinates was determined by applying camera calibration techniques to an im-age of several objects placed at known locations in the scene. The average heightof each dancer is assumed to be 1.65 meters.
4 Graph Theory and Visualization
4.1 Background on Graphs
Let N be the number of dancers. For each dancer i we define the set of neighbors,Ni, to be the set of dancers whose positions are observed and used for cohesionby dancer i.
We associate to the system a sensing graph G = (V, E , A), where V ={1, 2, . . . , N} is the set of nodes, E ⊆ V × V is the set of edges and A is the
An Art and Engineering Exploration of Human Flocking 13
N ×N adjacency matrix with ai,j = 1 when edge (i, j) ∈ E and ai,j = 0 other-wise. Every node in the graph corresponds to a dancer, and the graph containsedge (i, j) when j ∈ Ni. An edge (i, j) ∈ E is said to be undirected if (j, i) is alsoin E ; otherwise it is directed. A graph is undirected if every edge is undirected,that is, if A is symmetric; otherwise it is directed.
A graph can be represented visually by drawing a dot for each node and aline between the appropriate pair of nodes for each edge. An undirected edge istypically drawn as a simple line, while a directed edge (i, j) will have an arrowhead pointing from node i to node j.
A path in G is a (finite) sequence of nodes containing no repetitions and suchthat each node is a neighbor of the previous one. The length of a path is givenby the number of edges traversed by the path. The distance, di,j , between nodesi and j in a graph is the shortest length of any path from i to j. If no such pathexists, di,j is infinite. This distance is not a metric since di,j is not necessarilyequal to dj,i.
The graph G is connected if it contains a globally reachable node k; i.e. thereis a path in G from i to k for every node i. G is said to be strongly connected ifthere is a path between every pair of nodes in the graph. A strongly connectedcomponent of G is a maximal subset of nodes such that there is a path in Gbetween every pair of nodes in the subset. G is weakly connected if it is connectedwhen every directed edge is replaced by an undirected edge. A weakly connectedcomponent is a maximal subset of nodes that forms a connected componentwhen every directed edge in G is replaced by an undirected edge.
The status, sk, of a node k is the average inverse distance between everyother node and k. That is, sk = 1
N−1
∑j 6=k
1dj,k
. sk will be maximum (equal to1) if there is an edge from every other node to node k, and minimum (equal to0) if there are no edges leading to node k.
4.2 Visualization of Graphs
FlockGrapher is a Matlab tool developed to compute, visualize and evaluate dif-ferent kinds of graphs derived from flock position data. Using a graphical userinterface, the tool accepts tracked position and direction of motion data for in-dividuals in a flock in two or three dimensions. It can visualize data from onespecific instant in time or create a time series animation of data sets correspond-ing to successive time steps. The user can create graphs from the data by definingan individual’s neighborhood in terms of either a prescribed number of nearestneighbors or a prescribed sensing radius. For data that includes the directionof motion of nodes, FlockGrapher can incorporate a limited viewing angle, as-sumed to be symmetric about the individual’s direction of motion. In the caseof a fixed number of nearest neighbors and a limited viewing angle, if there arefewer than the required number of neighbors visible to a node, the viewing anglewill be rotated with respect to the direction of motion until enough neighborsare visible. Edge weights can be automatically manipulated, e.g., as a functionof distance between nodes, or they can be prescribed by the user.

14 An Art and Engineering Exploration of Human Flocking
Once a sensing graph has been computed, FlockGrapher can evaluate a rangeof graph properties, including number of strongly and weakly connected com-ponents, algebraic connectivity, speed of convergence and node status. The toolalso displays some properties on the graph visualization; for example, directedand undirected edges can be distinguished with different colors. For sets of datacorresponding to successive time steps, the time-varying values of these proper-ties will be displayed as the graph visualization changes. In the case of the humanflocking experiment, this dynamic graph visualization can be run at the sametime as the video of the dancers to compare computed and observed behavior.FlockGrapher can save all the computed data to allow for further analysis. Ascreenshot of FlockGrapher is shown in Figure 4; the graph and its propertiescorrespond to the frame from the video shown in Figure 3.
Fig. 4. Screenshot of FlockGrapher using dancer data corresponding to the instantshown in Figure 3. Nodes are shown as small green circles connected by edges. Directededges are blue with arrow heads and undirected edges are red. The number next toeach node is its status. Other computed graph properties are displayed on the left.
5 Sensing Model and Graph Computation
Since each dancer was given the same specific rules to follow, it is in principlepossible to apply the same rules to the tracked data and reconstruct the sensinggraph used by the dancers. However, certain aspects of both the rules and human
An Art and Engineering Exploration of Human Flocking 15
behavior make this task challenging. Although the dancers were each told to stayarm’s length from two other dancers, no instruction was given for how they wereto choose these two neighbors. In addition, although humans have a field of viewof up to 200◦ [37], there was no compulsion for the dancers to keep both of theirneighbors visible at all times.
Given these limitations, two key assumptions were made in order to estimatethe dancers’ sensing graph. First, it was assumed that each dancer only choseneighbors from within a limited angular range centered about the direction theywere travelling. Since no dancer was observed to be rapidly moving their head,the direction of motion was assumed to be a reasonable proxy for direction ofthe head and therefore for center of viewing range. Although this assumption isgenerally applicable to the data, there were instances observed in which a dancerwould either move in a different direction to where they were facing, or movewith their head turned at a constant angle to their body. These occurrences areimpossible to detect with our point-tracking approach, but could be accountedfor with a more sophisticated tracker with the ability to detect the orientationof each dancer’s face. Second, it was assumed that each dancer was applyingthe cohesion rule with the two nearest neighbors within this range. Since everydancer was trying to keep two neighbors at arm’s length (and let no dancerscloser than arm’s length), a dancer’s neighbors would naturally be among theclosest of the other dancers.
With these assumptions we used FlockGrapher to estimate the sensing graphat each time (frame) by computing the two-nearest neighbor graph with a lim-ited viewing angle. When fewer than two other dancers were visible using thedirection of motion to center the viewing region, this region was allowed to ro-tate until two dancers became visible. However, it was not known a priori whatviewing angle to choose to best represent the dancers’ behavior.
For collective behavior, it is impossible to guarantee that a group will remaintogether if the communication graph is not connected [38]. When the graphis disconnected, there is nothing to prevent different subgroups from movingin different directions and splitting the group. However, other features of theenvironment (such as the limited space in the room) can drive the group backtogether. Since fissions and fusions of the group were observed, we selected theviewing angle for our sensing model as the one that produced a graph that wasdisconnected when the group of dancers was observed to split and remainedconnected when the group of dancers was observed to be cohesive.
Table 1 shows the results of estimating the sensing graph across the wholetracked period using different viewing angles. It can be seen that reducing theviewing angle from 360◦ to 270◦ significantly improves the amount of time thegraph is connected, with the maximum connectedness occurring with a viewingangle of 120◦. However, our goal was not simply to maximize connectedness butrather to match the observed behavior of the group.
Early in the experiment, between about 1 and 3 seconds, a small group offour dancers split from the rest of the group. The dancers within this groupappeared to be observing only one another. Eight of the remaining dancers also

16 An Art and Engineering Exploration of Human Flocking
formed a group, only observing one another. The thirteenth dancer was originallyable to observe both groups before turning to face the larger group, but sinceno other dancer was observing this individual, the group was split during thiswhole period. Eventually, the dancers in the larger group turned and observedthe smaller group, leading to a single “flock” again. This disconnection eventwas reflected in the estimated graphs for viewing angles of 150◦ and greater,but not for the smaller angles. However, with a viewing angle of 150◦ the graphbecame connected at a few points within this interval when direct observationof the video suggests that the group was still split. This was not the case witha viewing angle of 180◦; thus, 180◦ was chosen as providing the best matchof the splitting behavior of the dancers. Figure 3 shows the group during thisdisconnection event and the graph in Figure 4 (corresponding to the frame ofFigure 3) is computed using a viewing angle of 180◦.
Table 1. Effects of viewing angle on graph connectedness over the whole tracked period
Total viewingangle
Percentage of timeconnected
Number of disconnectionevents
360◦ 59.58% 40
270◦ 91.67% 43
210◦ 97.5% 10
180◦ 98.47% 3
150◦ 98.68% 5
120◦ 99.65% 3
90◦ 99.58% 3
Although our first estimate of the sensing graph captures a split in the groupand stays connected during the rest of the tracked period, it remains a crudeapproximation to the true sensing graph. For example, some nodes change theirneighbors rapidly in our estimated graph, which is likely an overestimation ofthe rate at which dancers switch neighbors. Instead, if an individual has justbeen chosen as a neighbor, that individual is likely to stay a neighbor for aperiod of time rather than being immediately discarded as another individualcomes closer in view. Two steps were taken in an effort to reduce rapid neighborfluctuations. First, the tracked position data were passed through a low-passfilter, which consequently smoothed out node headings. Then, to account for anindividual’s reluctance to change neighbors soon after they are chosen, a termwas added to the estimation model representing the probability of switching froma current neighbor to a closer dancer. The lower was the probability the greaterwas the “inertia” of the dancer to switch to a closer dancer, equivalently, thegreater was the commitment of the dancer to its current neighbor. By allowingthis probability to reset to a low value whenever a new neighbor was chosen andthen increase with time, we could capture the inertia of edges in the sensinggraph.
An Art and Engineering Exploration of Human Flocking 17
6 Analysis of Individual Influence
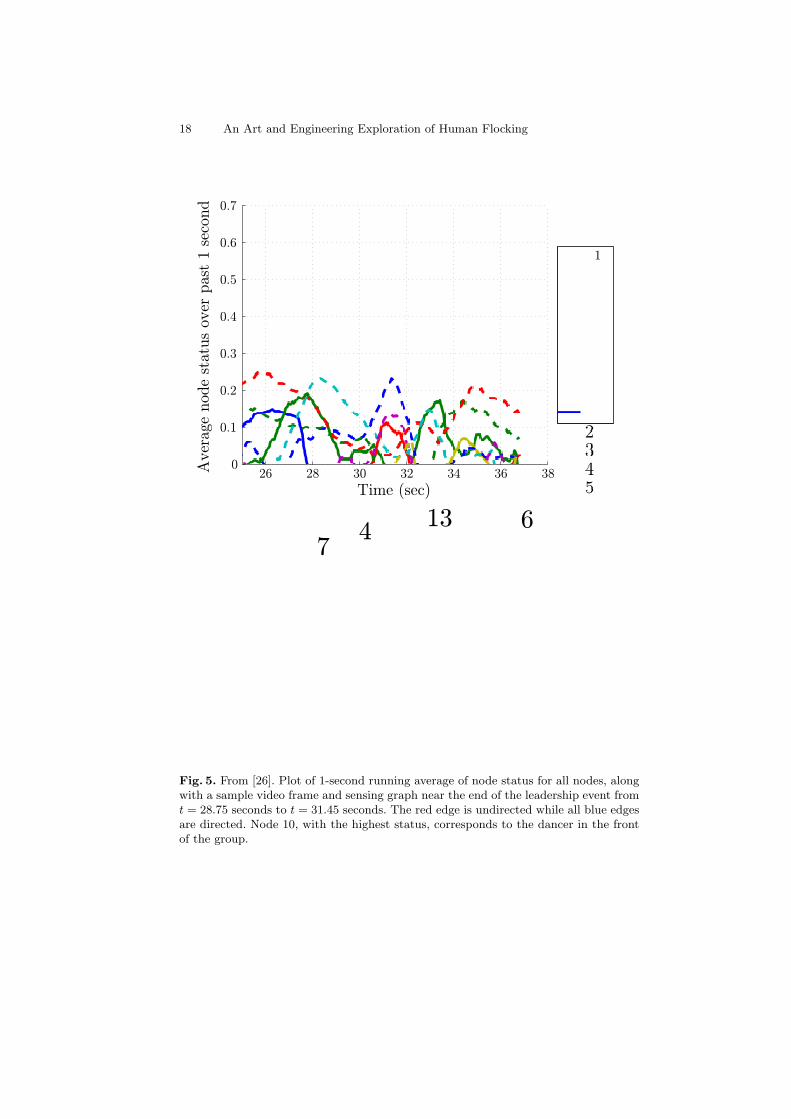
We used the estimated time-varying sensing graph to begin investigating theinfluence of each individual dancer within the group. Our method computesand compares node status for all dancers. Without knowing precisely how eachindividual implemented the flocking rules, node status can provide an estimateof an individual’s importance within the group. A dancer with a status of 0 hasno influence since no one else in the group is observing that dancer. A dancerwith a status of 1 has the maximum possible influence as every other individualis directly observing that dancer. However, due to the time-varying nature of thegraph, an individual’s importance depends not only on its current node statusbut also on its node status in the past. Therefore, we took as a first estimate ofinstantaneous importance each node’s average status over the past 1 second. Aplot of average node status for all nodes for part of the tracked period is shownin Figure 5.
Although node status provides a measure of an individual’s potential to in-fluence the group, it does not indicate whether that influence was actually exer-cised. Therefore, to examine if node status is indeed related to the influence of adancer in this data set, we investigated a quantitative measure of an individual’sinfluence on the rest of the group. This quantity is the time, referred to as leadtime, at which a peak occurred in the cross-correlation function between an in-dividual’s direction of motion and the direction of the group’s motion. Positivevalues for this lead time indicate that an individual tended to lead the group(i.e. change direction and then have the group follow) while negative values in-dicate that an individual tended to lag the group (i.e. change direction to followthe group after the group had changed). This lead time measure was found tocorrelate strongly with average node status, with the nodes with highest averagestatus having the largest lead times and the nodes with lowest average statushaving the largest lag times. Thus, we argue that node status computations doindeed provide insight into leadership roles within the group. Importantly, theability to calculate node status at any point in time allows for investigation ofinstantaneous and changing leadership throughout the flocking event.
By examining the plot of averaged node status, “leadership events” can beidentified, where one particular node achieved the greatest importance withinthe group (with a high status value) for an extended period of time. Figure 5reveals one such event when node 10 became a leader between approximately28.75 and 31.45 seconds. Looking at the video, it can be observed that duringthis time the group was moving from the back left corner of the room towardthe front right corner, with node 10 at the front of the group. This suggests thatthe node status measurements can capture emergent leadership.
Another leadership event can be observed from the data during a period whenone dancer stopped moving and the remaining dancers started circling aroundthis individual. However, the individual with the highest status during this eventwas not the stationary one, but rather one who was very close by the stationaryone and who kept moving in a circle. This seems particularly interesting sinceat other times (however not during our tracked period) one dancer would stop
18 An Art and Engineering Exploration of Human Flocking
Fig. 5. From [26]. Plot of 1-second running average of node status for all nodes, alongwith a sample video frame and sensing graph near the end of the leadership event fromt = 28.75 seconds to t = 31.45 seconds. The red edge is undirected while all blue edgesare directed. Node 10, with the highest status, corresponds to the dancer in the frontof the group.

An Art and Engineering Exploration of Human Flocking 19
and the whole group would eventually stop too. The difference between thesetwo kinds of events (circling versus stationary group motion) may be due to thedifferences between the status of the stationary and nearby dancers in the firstcase as compared to the second case.
By averaging each individual’s status over the whole tracked period, we eval-uated whether or not some individuals had a disproportionate influence on thegroup. Figure 6 shows the average of each node’s status over the tracked period.Nodes 12 and 10 had the highest average status, with values 1.9σ and 1.7σ higherthan the group mean, where σ is the standard deviation of the average statusvalues over all nodes.
Fig. 6. Average node status over the whole tracked period. The blue crosses representthe status values without any inertia term, while the red crosses represent the statusvalues with an inertia term where the probability resets to 0 when new neighbors arechosen and grows back to 1 with an increment of 0.14 per frame.
The average of an individual’s status over the whole tracked period canbe similarly computed in the case that the graph estimation model includesa probability-based reluctance to switch neighbors, as described above to modelswitching inertia or, equivalently, commitment to neighbors. Interestingly, whilethis inertia term does lead to a significant decrease in average neighbor changesper second, the overall structure of average node status values does not changesignificantly. Figure 6 displays the average status of each node both for the orig-inal model (blue) and the filtered model with the inertia term (red). Althoughthere is some variation between the average node status values for the two mod-els, the same nodes represent upper and lower outliers. This suggests that the

20 An Art and Engineering Exploration of Human Flocking
incorporation of reluctance to switch neighbors into the model does not alter theoverall sensing structure, notably the emergence of leaders, even as it potentiallysmooths out unrealistic fluctuations of node neighbors.
We hypothesize that the emergence of the outlier nodes in Figure 6, andin particular those with very high status, is due to human bias. To test this wedeveloped an agent-based flocking simulation which lacks any human bias. Givenour hypothesis, we would expect that the simulated agents, without human bias,would not exhibit outlier nodes. The simulation models particles that move inthe plane, in a space with boundaries like in the dance studio, and follow therules and parameter values close to those given to the dancers. The simulationwas run in Matlab with particle positions updated synchronously to move inthe direction to maintain one arm’s length (assumed to be 0.80 m) from its twoclosest nodes within a viewing angle of 180◦, while also repelling from all othernodes within an arm’s length. Additional functions were incorporated to providelimits on velocities, turning rates and response to boundaries. The correspondingnode status of each of these particles was calculated analogously to those of thedancers.
The simulated particle system was initialized with positions and headingsmatching those of the dancers in our experiment and then the average status ofeach node was calculated over the following 72 seconds. The average node statusover the first 72 seconds is shown in Figure 7 and can be compared to the plotin Figure 6. It can be seen in Figure 7 that both the mean and the standarddeviation are smaller than in the case of the human dancers and furthermorethere are no significant outliers. Every node in the simulation has a status inthe range of values below the human dancer that ranked eighth in terms ofhighest node status and above the human dancer that ranked tenth. Additionalsimulations were also run with random initial conditions. The average meanstatus and average standard deviation of 40 simulations run for 72 seconds eachwith random initial conditions was found to be approximately 0.352 and 0.0094,respectively. These mean and standard deviation values are very similar to thosefrom the simulation of Figure 7 with the dancers’ initial conditions (0.351 and0.0080, respectively) and are significantly smaller than what is computed fromthe tracked dancer data (0.377 and 0.043, respectively).
This comparison suggests that one consequence of human bias in the behaviorof the dancers is that some individuals were less influential and other individualssignificantly more influential as compared to a group of identical particles. Thisimplies that rather than leadership simply arising as a result of random mixingwithin the group, the behavior of some individuals makes them more likely toassume positions of high influence. We note that the dancers corresponding tonodes 10, 11 and 12 (the three nodes with highest average status) are three ofthe four dancers in the small disconnected group of Figures 3 and 4, suggestingfurther possible consequences of emergent leaders.

An Art and Engineering Exploration of Human Flocking 21
Fig. 7. Average node status, with no inertia, from a simulation over an equivalentperiod to the tracked dancer data.
7 Final Remarks
The Flock Logic project, conceived at the intersection of dance and control the-ory, produced a novel and generative framework for artistic, engineering andscientific investigation of collective motion. The project centered around explo-rations and experiments with the motion patterns that emerge when dancersapply feedback rules modeled after those attributed to flocking birds or school-ing fish. The framework combined the prescribed rules of individual behaviorand response with the unknown choices and actions of living agents, yielding op-portunities for exploration that was part systematic and part uncontrolled. As aresult, the Flock Logic framework proved useful for artistic exploration of danceand tools for choreography, for engineering exploration of decentralized controllaws for multi-agent system dynamics, as well as for scientific investigation ofcollective animal behavior and crowd dynamics.
The explorations built off of a set of basic “flocking” rules of cohesion andrepulsion: dancers were instructed to move around while maintaining an arm’slength distance from a prescribed number of other dancers and not letting anyonecome closer than arm’s length. Rules for walls, obstacles, and zones were added.Additional objectives and preferences were imposed selectively and secretly sothat a small subset of dancers were asked to influence the group only throughtheir motion and without explicit signaling. Dancers behaving as pursuers orpredators applied pressure dynamically on the group, often to beautiful effect.Synchrony and anti-synchrony of directionality were explored using alignmentrules. Many artistic explorations made use of different kinds of rules that wereoriginally motivated from observations or analysis of animal behavior or fromengineering design objectives, such as foraging and coverage. Other explorations
22 An Art and Engineering Exploration of Human Flocking
were motivated purely by artistic goals, such as designed responses to specificobstacles.
To address questions concerning the role of the heterogeneity of the groupof dancers and specifically the relative influence of the different dancers on thecollective motion, we analyzed video data of an experiment with thirteen dancersapplying the basic rules of flocking with two-person cohesion. From the videowe tracked the trajectories of the dancers over a 72-second segment. Then, weapplied the flocking rules to the data to estimate the network graph at eachframe of the video, that is, who was paying attention to whom at each timestep. From the resulting time-varying graph we computed node status for eachdancer at each frame; node status provides a measure of how much attentiona dancer received from the rest of the dancers. We discussed how node statuswas strongly correlated with lead time in turning, i.e., dancers with high statuswould typically turn before the rest of the group. From this we argued that highnode status suggests high influence and therefore leadership. By examining theaverage status of each dancer over the whole tracked segment, we found two ofthe dancers with status higher than the mean value by nearly twice the standarddeviation. We showed how this result is robust to the addition of an inertia termthat models a dancer’s commitment to its newly acquired neighbors. We alsoshowed evidence that human bias explains the large variation in influence amongthe dancers, and in particular the outliers, by comparing the data with analogousresults from a simulation of dancers modeled as particles without human bias.
These results raise many more interesting questions and possibilities for fu-ture investigation. For example, how does human bias produce leadership, whereno such leadership was assigned? Do certain dancers move in ways that attractthe attention of the others? Or do individuals who emerge as leaders break therules, for example, by paying less attention to others than instructed? The re-sults suggest the possibility of an interesting tension between following rules andbreaking rules. This could be explored scientifically using evolutionary game the-ory in which there is a benefit to breaking the rules associated with influencingthe group toward one’s own preferences but also a cost to breaking the rulesassociated with losing the advantages of group living.
Other questions concern the relationship between the rules and environmentand the resulting shape and momentum of the group. What accounts for polar-ized versus circular motion? What accounts for fissions and fusions of the group?What role do leaders play in these dynamic transitions? These questions addressthe fundamental interplay between how an individual influences the group andhow the group influences an individual. In [39] leadership in a dynamic networkevolves according to distributed adaptive dynamics driven by a metric that re-wards efficient tracking of an external signal; it can be shown in this context thatoptimal leader sets are defined by their joint centrality, a property of the net-work graph much like node status [40]. Our present results suggest an importantlink between the spatial distribution of more influential individuals, i.e., thosewith high node status, and the group-level dynamics. These results may informdesign of distributed multi-agent adaptive dynamics of rules, rule-breaking or
An Art and Engineering Exploration of Human Flocking 23
network interconnections, to control leadership and thus the collective behaviorof the multi-agent system.
Many further artistic, engineering and scientific investigations are possible,even extending the basic flocking rules into more abstract, non-spatial, domains.Such domains could include music (as shown in Chapter 7 [22]), personal pref-erences, styles, language and more. Human flocking for recreation or therapymight also be explored – participants in the Flock Logic performances describedfinding it calming to engage with a group without a goal and rewarding to bepart of creating something new.
8 Acknowledgments
The authors thank Alex Holness for his contributions to the study of the lead/lagtime and its correlation with node status.
References
1. Leonard, N. E., Marshall, S.: Flock Logic. (2010) [Online]. Available:http://www.princeton.edu/∼flocklogic
2. Parrish, J. K., Edelstein-Keshet, L.: Complexity, Pattern, and Evolutionary Trade-offs in Animal Aggregation. Science. 284:5411, 99–101 (1999)
3. Breder, J. C. M.: Equations Descriptive of Fish Schools and Other Animal Aggre-gations. Ecology. 35:3, 361–370 (1954)
4. Couzin, I. D., Krause, J.: Self-organization and Collective Behavior in Vertebrates.Advances in the Study of Behavior. 32, 1–75 (2003)
5. Sumpter, D. J. T.: Collective Animal Behavior. Princeton University Press, Prince-ton (2010)
6. Ballerini, M., Cabibbo, N., Candelier, R., Cavagna, A., Cisbani, E., Giardina, I.,Lecomte, V., Orlandi, A., Parisi, G., Procaccini, A. et al: Interaction Ruling An-imal Collective Behavior Depends on Topological Rather than Metric Distance:Evidence from a Field Study. Proceedings of the National Academy of Sciences.105:4, 1232–1237 (2008)
7. Young, G. F., Scardovi, L., Cavagna, A., Giardina, I., Leonard, N. E.: Starling FlockNetworks Manage Uncertainty in Consensus at Low Cost. PLoS ComputationalBiology. 9:1, 1–7 (2013)
8. Hildenbrandt, H., Carere, C., Hemelrijk, C. K.: Self-organized Aerial Displays ofThousands of Starlings: A Model. Behavioral Ecology. 21:6, 1349–1359 (2010)
9. Gueron, S., Levin, S. A., Rubenstein, D. I.: The Dynamics of Herds: From Indi-viduals to Aggregations. J. Theor. Biol. 182, 85–98 (1996)
10. Fischhoff, I. R., Sundareson, S. R., Cordingley, J., Rubenstein, D. I.: Habitat Useand Movements of Plains Zebra (equus burchelli) in Response to Predation Dangerfrom Lions. Behavioral Ecology. 18:4, . 725–729 (2007)
11. Leonard, N.E.: Multi-Agent System Dynamics: Bifurcation and Behavior of AnimalGroups. In: Proc. 9th IFAC Symposium on Nonlinear Control Systems, pp. 1-11.Elsevier (2013)
12. Dyer, J. R. G., Johansson, A., Helbing, D., Couzin, I. D., Krause, J.: Leadership,Consensus Decision Making and Collective Behaviour in Humans. Phil. Trans. R.Soc. B. 364, 781–789 (2009)

24 An Art and Engineering Exploration of Human Flocking
13. Moussaid, M., Perozo, N., Garnier, S., Helbing, D., Theraulaz, G.: The WalkingBehaviour of Pedestrian Social Groups and Its Impact on Crowd Dynamics. PLoSONE. 5:4, 1–7 (2010)
14. Funes, P., Orme, B., Bonabeau, E.: Shaping Collective Behavior: An ExploratoryDesign Approach. In: Artificial life IX: Proc. Ninth Int. Conf. on the Simulationand Synthesis of Artificial Life, pp. 232 - 237. MIT Press (2004)
15. Silverberg, J. L., Bierbaum, M., Sethna, J. P., Cohen, I.: Collective Motion of Hu-mans in Mosh and Circle Pits at Heavy Metal Concerts. Physical Review Letters.100:228701, 1-5 (2013)
16. Altenberg, L.: Emergent Movement: Group Experiments in Emergent Propertiesfrom Simple Rules. In: Short Courses on the Mathematics of Biological Com-plexity, University of Tennessee. (2000) [Online]. Available: http://dynamics.org/Altenberg/TALKS/UTK 2000/EmergentMovement.html
17. Clemente, K.: Playing with Performance: The Element of the Game in Experimen-tal Dance and Theater. The Journal of Popular Culture. XXIV, 1–10 (1990)
18. Forsythe, W., Palazzi, M., Shaw, N. Z: Synchronous Objects. (2009) [Online].Available: http://synchronousobjects.osu.edu/
19. Sgorbati, S.: Emergent Improvisation. (2005) [Online]. Available: http://emergentimprovisation.org/essay.html
20. Hagendoorn, I.: Emergent Patterns in Dance Improvisation and Choreography. In:Unifying Themes in Complex Systems IV. pp. 183-195. Springer (2008)
21. Carlson, K.: Exploring Creative Decision-Making in Choreographic Practice: APhenomenological Study of Situated Cognition. MSc Thesis, Simon Fraser Univer-sity. (2011)
22. Huepe, C., Colasso, M., Cadiz, R. F.: Generating Music from Flocking Dynamics.In: Controls and Art. Chapter 7. Springer (2014)
23. LaViers, A., Teague, L., Egerstedt, M.: Syle-based Robotic Motion in Contempo-rary Dance Performance. In: Controls and Art. Chapter 9. Springer (2014)
24. Godbehere, A. B., Goldberg, K.: “Are We There Yet?” Visual Tracking of VisitorsUnder Variable-Lighting Conditions for a Responsive Audio Art Installation. In:Controls and Art. Chapter 8. Springer (2014)
25. Tsiotras, P., Castro, L. I. R.: Generation of Intricate Geometric Patterns on PlaneSurface Using Consensus Protocols. In: Controls and Art. Chapter 6. Springer(2014)
26. Leonard, N. E., Young, G., Hochgraf, K., Swain, D., Trippe, A., Chen, W., Mar-shall, S.: In the Dance Studio: Analysis of Human Flocking. In: Proc. AmericanControl Conference, pp. 4333–4338. IEEE (2012)
27. Pais, D., Leonard, N. E.: Pursuit and Evasion: Evolutionary Dynamics and Collec-tive Motion. In: Proc. AIAA Guidance, Navigation, and Control Conference, pp.1-14. AIAA (2010)
28. Swain, D. T., Leonard, N. E.: On the Trajectories and Coordination of Steered Par-ticles with Time-Periodic Speed Profiles. In: Proc. American Control Conference,pp. 1286–1291. IEEE (2009)
29. Caicedo-Nunez, C. H., Leonard, N. E.: Symmetric Coverage of Dynamic MappingError for Mobile Sensor Networks. In: Proc. American Control Conference, pp.4661-4666. IEEE (2011)
30. Chen, W., Leonard, N. E., Marshall, S.: FlockMaker: Simulator for Collective Mo-tion. (2010) [Online]. Available: http://dcsl.princeton.edu/dance
31. Reynolds, C. W.: Flocks, Herds, and Schools: A Distributed Behavioral Model.In: SIGGRAPH ’87 Proc. 14th Annual Conference on Computer Graphics andInteractive Techniques, pp. 25-34. ACM (1987)

An Art and Engineering Exploration of Human Flocking 25
32. Swain, D. T., Couzin, I. D., Leonard, N. E.: Real-time Feedback-Controlled RoboticFish for Behavioral Experiments with Fish Schools. Proceedings of the IEEE. 100:1,150-163 (2012)
33. Swain, D. T.: MADTraC Framework Source Documentation. (2011) [Online]. Avail-able: https://github.com/leonard-lab/MADTraC
34. Bradski, G.: OpenCV (Open Computer Vision) Library. (2011) [Online]. Available:http://opencv.willowgarage.com/wiki/Welcome
35. Chang, F., Chen, C.-J., Lu, C.-J.: A Linear-Time Component-Labeling AlgorithmUsing Contour Tracing Technique. Computer Vision and Image Understanding.93:2, 206–220 (2004).
36. Mohar, B.: The Laplacian Spectrum of Graphs. Graph Theory, Combinatorics andApplications. 2, 871–898 (1991).
37. Werner, E., Rossi.: Manual of Visual Fields. Churchill Livingstone, New York(1991)
38. Ren, W., Beard, R., Atkins, E.: A Survey of Consensus Problems in Multi-Agent Coordination. In: Proc. American Control Conference, pp. 1859–1864. IEEE,(2005)
39. Pais, D., Leonard, N. E.: Adaptive Network Dynamics and Evolution of Leadershipin Collective Migration. Physica D. (2013) [Online]. Available: http://dx.doi.org/10.1016/j.physd.2013.04.014
40. Fitch, K., Leonard, N. E.: Information Centrality and Optimal Leader Selection inNoisy Networks. In: Proc. IEEE Conference on Decision and Control. IEEE (2013)