in situ forming formulation: development, evaluation, and optimization using 33 factorial design
TRANSCRIPT
Research Article
In Situ Forming Formulation: Development, Evaluation, and Optimization Using33 Factorial Design
Ramesh C. Nagarwal,1 A. Srinatha,2,3 and Jayanta K. Pandit1
Received 1 January 2009; accepted 2 July 2009; published online 28 July 2009
Abstract. The present investigation concerns with the development and optimization of an in situ formingformulation using 33 full factorial design experimentation. Metformin, an antidiabetic drug with upperpart of gastrointestinal tract as absorption window was used as a model drug. The formulations weredesigned with an objective to retain in stomach for an extended time period. The effect of threeindependent factors—concentrations of sodium alginate (X1), gellan gum (X2), and metformin (X3) on invitro drug release were used to characterize and optimize the formulation. Five dependent variables—release exponent (Y1), dissolution efficiency (Y2), drug release at 30 min (Y3), 210 min (Y4), and 480 min(Y5) were considered as optimization factors. The data were statistically analyzed using ANOVA, and ap<0.05 was considered statistically significant. Three dimensional surface response plots were drawn toevaluate the interaction of independent variables on the chosen dependent variables. Of the prepared 27formulations, the responses exhibited by batch F17 containing medium level sodium alginate (X1), lowlevel gellan (X2), and medium level metformin (X3) were similar to the predicted responses.
KEY WORDS: alginate; diffusion; factorial design; in situ forming; metformin.
INTRODUCTION
Gellan gum (commercially available as Gelrite® orKelcogel®) is an anionic deacetylated polysaccharide secret-ed by Pseudomonas elodea. Gellan has the characteristicproperty of cation-induced gelation wherein the gelationinvolves formation of double helical junction zones followedby aggregation of the double helical segments to form athree-dimensional network by complexation with cations andhydrogen bonding with water (1–3). Sodium alginate is alinear copolymer composed of two monomeric units, D-mannuronic acid, and L-guluronic acid and is widely used inpharmaceutical formulations in beads, matrix tablets, micro-capsules, etc. Gelation of dilute solutions of sodium alginateoccurs in presence of di- and trivalent metal ions by a processinvolving consecutive guluronic residues in the guluronic acid(G) blocks of the alginate chain (4–6). When formulated foruse in sustained drug delivery, the alginate is usually in theform of a matrix (7,8).
Metformin is the only currently available oral antidia-betic or hypoglycemic agent which acts predominantly byinhibiting hepatic glucose release with an absolute oralbioavailability of 40% to 60% (9). Gastrointestinal absorptionoccurs mainly in the upper intestine with peak plasma
concentrations (Cmax) reaching after 2 to 3 h (10). In viewof its physicochemical and pharmacokinetic properties, it isworth using metformin as a model drug in development ofgastroretentive systems.
With progressive research for development of newerdrug delivery systems, it has become apparent to assess thefactors influencing formulation and drug release in a shorttime. It is very important to develop and optimize aformulation with a few experiments and at a low cost inorder to overcome the rapidly increasing cost of experiments(11–14). Optimization of formulations using statistical exper-imental designs is a powerful and efficient tool in thedevelopment of pharmaceutical dosage forms. The experi-mental design allows for studying various processing param-eters influencing the selected responses with the lowestnumber of experiments, thereby reducing the time requiredin the development work (15–18).
In situ gel forming formulations present a novel idea ofdelivering drugs to patients as a liquid dosage, yet achievesustained release of drug for the desired duration. Althoughthere have been a few reports on the development of in situforming formulation, development of the system with gastro-retentive property has been less reported. In a preliminarystudy, we had reported the formulation and evaluation of insitu forming system with floating characteristics (19).
The present study was designed with an objective offurther evaluating the influence of concentration of threeindependent variables: sodium alginate, gellan gum, andmetformin on various selected responses. Further, it wasaimed at optimizing independent variables using statisticallydesigned experiment to achieve selected dependent response
1Department of Pharmaceutics, Institute of Technology, BanarasHindu University, Varanasi 221005, India.
2 Department of Pharmaceutics, National College of Pharmacy,Shimoga 577201, India.
3 To whom correspondence should be addressed. (e-mail: [email protected])
AAPS PharmSciTech, Vol. 10, No. 3, September 2009 (# 2009)DOI: 10.1208/s12249-009-9285-3
977 1530-9932/09/0300-0977/0 # 2009 American Association of Pharmaceutical Scientists

equivalent to that of marketed product. The selected depen-dent responses were: release exponent (Y1), dissolutionefficiency (Y2), drug release at 30 min (Y3), 210 min (Y4),and 480 min (Y5). The constraints on dependent variableswas, Y3=21–26%, Y4=62–65%, and Y5=91–94%. The opti-mization target and the constraints were set based on thedissolution data of MELMET-SR, a commercially availabletablet of metformin.
MATERIALS AND METHODS
Materials
Metformin was a gift from Ranbaxy Research Labora-tories, Gurgaon, (India). Sodium alginate (viscosity of 2% w/vsolution 250 cps at 25°C) was procured from Sigma chemicals,St Louis, MO, USA. Gellan gum (Kelcogel®) was procuredfrom CP Kelco, San Diego, CA, USA. MELMET-SR tabletswere purchased commercially from market for comparativestudy. All other reagents and chemicals were of analyticalgrade and used as received.
Methods
Preparation of Formulations
Solution of sodium alginate and gellan, alone, or incombination (Tables I and II) was made in deionized water.
The solution was heated to 60°C with constant stirring on amagnetic stirrer (Remi Instruments Ltd. Mumbai, India). Thesolution was allowed to cool to 40°C, when the drug andcalcium carbonate (1.5% w/v) were dissolved and dispersed,respectively, in the resulting solution and finally stored inamber color bottles until further use (20).
Experimental Design
The present study consisted of a three-level three-factorial(33) design for experimentation. Statistical experimental designwas performed using a software DESIGN EXPERT® version7.0.2.8 (Stat-Ease Inc., Minneapolis, USA). Response surfacegraphics were used to show the factor interaction between theconsidered variables. Selected independent variables studiedwere the concentration of sodium alginate (X1); gellan gum(X2); and metformin (X3) added to the formulation. Threefactorial levels coded for low, medium, and high settings (−1, 0and +1, respectively) were considered for three independentvariables (21,22). The selected dependent variablesinvestigated were the “n” value (Y1), dissolution efficiency at8 h (Y2), percentage of drug released at 30 min (Y3), 210 min(Y4), and 480 min (Y5). The number of trials required for thestudy is based on the number of independent variablesselected. A total of 27 experimental runs were required foranalyzing the interaction of each level on formulationcharacters and to optimize. Tables I and II show the factorschosen and different factor level settings. The response (Yi) in
Table I. 33 Full Factorial Design of In Situ Forming Formulation
Batch
Variable in coded value Independent variablesa
X1 X2 X3 Y1 Y2 (%) Y3 (%) Y4 (%) Y5 (%)
F1 −1 −1 −1 0.47±0.03 74.88±1.96 35.79±0.73 73.78±1.19 98.29±1.46F2 0 −1 −1 0.52±0.02 68.34±0.91 27.43±0.96 65.75±0.73 96.57±0.33F3 +1 −1 −1 0.60±0.11 69.87±0.99 22.80±3.61 70.11±1.24 92.61±0.79F4 −1 0 −1 0.50±0.04 71.77±1.08 32.55±2.90 67.24±0.69 94.46±1.24F5 0 0 −1 0.52±0.05 69.51±1.85 26.06±1.45 62.17±0.48 89.81±1.22F6 +1 0 −1 0.54±0.04 68.98±1.33 23.50±1.19 56.65±0.49 82.09±1.71F7 −1 +1 −1 0.54±0.06 73.38±0.86 24.70±1.93 71.76±0.95 91.89±1.46F8 0 +1 −1 0.57±0.03 73.32±1.41 22.14±1.20 67.11±1.19 86.28±1.92F9 +1 +1 −1 0.56±0.03 67.04±1.95 20.94±0.95 51.47±1.93 80.80±0.05F10 −1 −1 0 0.52±0.03 80.61±1.38 48.58±0.55 83.26±0.74 98.57±0.76F11 0 −1 0 0.55±0.10 73.59±2.10 40.43±0.92 73.87±0.76 97.70±0.40F12 +1 −1 0 0.55±0.02 71.78±1.83 37.15±0.73 66.75±1.48 94.93±0.40F13 −1 0 0 0.44±0.02 71.19±1.55 32.86±0.56 68.47±0.57 95.58±0.53F14 0 0 0 0.45±0.02 69.62±0.90 29.97±0.93 64.74±0.91 92.68±0.74F15 +1 0 0 0.46±0.03 69.05±1.36 28.00±1.10 58.00±0.38 86.34±0.95F16 −1 +1 0 0.44±0.01 71.77±1.44 29.06±1.11 69.10±1.46 94.12±0.74F17 0 +1 0 0.49±0.05 68.58±1.87 25.25±0.92 64.05±1.88 93.70±1.16F18 +1 +1 0 0.48±0.01 66.58±1.34 24.32±0.74 54.12±0.92 84.36±0.57F19 −1 −1 +1 0.59±0.02 80.85±1.93 41.27±1.04 84.64±0.72 99.52±0.73F20 0 −1 +1 0.62±0.03 78.35±1.46 37.09±0.98 77.12±1.87 94.75±0.95F21 +1 −1 +1 0.62±0.01 74.91±1.09 25.31±0.64 70.61±0.98 91.64±0.87F22 −1 0 +1 0.52±0.02 77.05±1.30 37.45±3.39 75.00±2.04 97.23±1.58F23 0 0 +1 0.54±0.02 74.87±1.52 30.82±0.80 70.22±0.61 93.09±0.85F24 +1 0 +1 0.59±0.02 70.34±1.47 22.82±0.99 59.64±0.21 87.54±1.43F25 −1 +1 +1 0.67±0.04 72.37±1.05 35.93±0.70 73.33±0.99 98.12±1.07F26 0 +1 +1 0.66±0.03 73.68±1.34 32.08±0.99 70.91±1.21 94.93±0.65F27 +1 +1 +1 0.58±0.01 67.56±1.69 31.52±0.59 60.37±0.80 88.57±0.42
a n=3, Mean±SDX1 sodium alginate; X2 gellan gum; X3 metfomin
978 Nagarwal, Srinatha, and Pandit

each trial was measured by carrying out a multiple factorialregression analysis using the quadratic model:
Yi ¼ b0 þ b1X1 þ b2X2 þ b3X3 þ b4X1X2 þ b5X1X3
þ b6X2X3 þ b7X21 þ b8X
22 þ b9X
23
Where Yi is the dependent variable; b0 is the arithmeticmean response of all trials; and bi is the estimated coefficientfor factor Xi. The main effects, X1, X2, and X3, represent theaverage value of changing factor one at a time; X1X2, X1X3,and X2X3 represent the interaction terms and the polynomialterms (X2
1 , X22 , and X2
3 ) are used to assess nonlinearity.
In Vitro Gelation Study
The gelation studies were carried out in gelation cells,fabricated locally using Teflon®. The cells were cylindricalreservoirs capable of holding 10 mL of simulated gastric fluid asgelation solution (0.1 N HCl, pH1.2). Within the cells located atthe bottom is a transparent plastic cup to hold the gel sample inplace after its formation. Two milliliters of the formulation wascarefully placed into the cavity of the cup using a micropipette,and 6 mL of the gelation solution (SGF) was added slowly andthe rate of gelation was detected by visual examination.
In Vitro Buoyancy of In Situ Formed Gel
In vitro buoyancy lag time and duration was determined ina USP XXIII dissolution apparatus-II with 900 mL of SGF(0.1 N HCl, pH1.2) at 37±2°C with a paddle speed of 50 rpm.A measured sample of 10 mL was placed on a Petri dish, whichwas placed in the dissolution medium. The time taken by thegelled mass to reach to the top of the dissolution medium(onset of floating), and the duration of floating were noted.
In Vitro Drug Release Studies
The release of metformin from the gelled mass wasdetermined as described by Zatz and Woodford (23) withminor modification using USP XXIII dissolution test appara-tus (Cintex instruments, Mumbai, India) with a paddle speedat 50 rpm. Simulated gastric fluid (900 mL; 0.1 N HCl, pH1.2)maintained at 37±2°C was used as dissolution media. Tenmilliliters of the formulation was transferred on to a Petri dishusing a disposable syringe, and the dish containing formula-tion was placed in the dissolution vessel, carefully addeddissolution fluid without much disturbance. At a pre-identi-fied time interval, an aliquot was removed and replenishedwith fresh medium. The samples were assayed for metformin
at 233 nm using spectrophotometer (Jasco 7800, Japan) aftersuitable dilution. A concurrent dissolution was performedwith preparation devoid of drug to record the interferencefrom excipients, if any. All the studies were conducted intriplicate, and the average was recorded.
Mechanism of Drug Release
The drug release data were fit to Korsmeyer–Peppas’power equation (24,25):
Mt=M1 ¼ Ktn
Where, Mt=M1 is the fraction of drug released in time t,K is constant, and n represents the release exponentindicative of mechanism of drug release. When n=0.5 meansFickian diffusion, 0.5>n<1.0 non-Fickian diffusion, and n=1.0Case II diffusion (25).
RESULTS
Preparation and Characterization of the Formulation
The preparation of in situ forming system is simple,reliable, and reproducible involving dissolving of metormin inpolymeric solution (sodium alginate and gellan). Differentformulations were prepared at various coded values for drug,sodium alginate, and gellan (Tables I and II). However, forease of administration and handling, the preparation remainsas liquid formulation but on ingestion undergoes gelation dueto the availability of liberated Ca2+. Excepting a few,formulations have shown an instantaneous gelation (<60 s).Among the others, the time required for complete gelationwas 2–5 min. The buoyancy study was done in simulatedgastric fluid (0.1 N HCl, pH1.2). Buoyancy lag time variedfrom 3 to 9 min, and the duration of buoyancy was >24 hirrespective of various formulation variables. The buoyancylag time decreased with increasing concentration of calciumcarbonate. However, increasing of calcium carbonateconcentration >1.5% w/v did not impart any marked changein buoyancy lag time. Therefore, for further studies, 1.5% w/vcalcium carbonate was used.
In Vitro Drug Release Studies
A preliminary study was conducted to optimize theconcentration of CaCO3. A few formulations containing calciumcarbonate (1–2% w/v) was prepared to investigate its effect ondrug release from the formulation. The insoluble calciumcarbonate solubilizes in acidic pH, releasing the calcium ionsand carbon dioxide. The study had shown that the drug releasefrom the formulation decreased with increase in the concen-tration of calcium carbonate. Formulation containing 1% w/vCaCO3was completely depleted of drug (~99.07±1.45%)within6 h; however, CaCO3 at 1.5% w/v sustained the drug release asonly 89.12±0.38% of drug was released at the end of 8 hdissolution study. Further increment in CaCO3 (2%w/v) did notalter drug release significantly (p>0.05).
Drug release profiles from the formulations at variousconcentrations of sodium alginate are shown in Figs. 1, 2, 3,and 4. The drug release deceased with increase in the
Table II. 33 Full Factorial Design of In Situ Forming Formulation
Coded value
Actual values
X1 (% w/v) X2 (% w/v) X3 (% w/v)
High (+1) 2.25 0.50 5.0Medium (0) 1.75 0.25 3.75Low (−1) 1.25 0 2.5
All batches contained 1.5% w/v of calcium carbonateX1 sodium alginate; X2 gellan gum; X3 metfomin
979Optimization of an In Situ Forming Formulation

concentration of sodium alginate. Formulations containedsodium alginate and gellan as anionic polymers. The influ-ence of gellan on drug release can be observed from the drugrelease profiles. Incorporation of gellan gum as anothersource of anionic polymer exhibited a decrease in the bursteffect. The drug release decreased as gellan to sodiumalginate ratio was increased. The formulation containedmetformin at three levels, i.e., low (2.5% w/v), medium(3.75% w/v), and high (5% w/v). As evident from differentdrug release profiles shown (Figs. 1, 2, 3, and 4), drug releaseincreased with increase in the drug loading.
Mechanism of Drug Release
The mechanism of drug release was determined usingKorsemeyer–Peppas equation (24,25). The release exponent(n) for all the formulations was in the range of 0.44±0.02–0.67±0.04 (Table I).
Experimental Designing and Analysis of Variance
A 33 full factorial design was used to investigate effect ofthree factors-sodium alginate, gellan, and drug loading-on
drug release from in situ forming systems of metformin. Thefactorial design was carried out using the software DESIGNEXPERT® version 7.0.2.8 (Stat-Ease Inc., Minneapolis,USA). Table I shows the data obtained for the experimenttrails after the factorial design.
Analysis of variance (ANOVA) was applied for estima-tion of significance of the model. Using a 5% significancelevel, a model was considered significant if the p<0.05. It wasfound that for responses Y1 and Y2, quadratic contributionand linear contribution model were significant (p<0.001),respectively. Response Y3 showed more significant linearityto both linear and cubic contribution model. However, forresponses Y4 and Y5, all models except 2F1 and cubiccontribution model, respectively, were significant.
Estimation of Quantitative Effects of Factors
ANOVA was performed for estimation of quantitativeeffects of the factors. Response surface regression analysiswas performed using coded values of factor levels (−1, 0, +1)for each factor to determine the significance. Table III showsthe factor effects of the quadratic model and associatedp values for all five responses. Figures 5, 6, and 7 show the
Fig. 1. Drug release profiles from the formulations (F1–F6) preparedfollowing 33 factorial experimentation
Fig. 2. Drug release profiles from the formulations (F7–F12) designedaccording to 33 factorial experimentation
Fig. 3. Drug release profiles from the formulations (F13–F18) preparedfollowing 33 factorial experimentation
Fig. 4. Drug release profiles from the formulations (F19–F27) preparedfollowing 33 factorial experimentation
980 Nagarwal, Srinatha, and Pandit

response surface plots of the effect of sodium alginate (X1),gellan (X2), and metformin (X3) on the dependent variableY5.
DISCUSSION
Preparation and Characterization of the Formulation
The preparation of in situ forming system being simpleand reliable showed an excellent reproducibility. In thisformulation, sodium alginate and gellan were used which,on gelation, forms a matrix barrier and sustain drug release.The calcium ions interact with anionic polymer (alginic acidand/or gellan) in the formulation causing instantaneousgelation; during this process, the liberated CO2 is entrappedwithin the gel matrix attributing to the buoyancy of the mass(26). Both CaCO3 and NaHCO3 have been reported as gas-generating agents in formulations (26). However, in thisstudy, NaHCO3 was excluded since it is soluble in neutralpH giving rise to Na+ which induces premature gelation ofalginate and gellan gum.
In Vitro Drug Release Studies
On the basis of the preliminary study, concentration ofcalcium carbonate was fixed at 1.5% w/v. Drug release wasnot significantly modified when the concentration of calciumcarbonate was increased to 2% w/v. This critical calcium levelmay corresponds to a state in which the number of calciumions was barely adequate to link the anionic sites in thejunction’s zones and, thus, increase the gel strength of the gel(26). Above that level, additional ions may occupy the anionicsites, linkages forming between adjacent polymer chains, andintroduce repulsive forces in the junction zone resulting inweakened gel structure. Therefore, for further studies, thecalcium carbonate level was fixed at 1.5% w/v.
The observed decrease of percentage drug release fromthe alginate gels with increase of alginate concentration is dueto the concomitant increase in gel strength (27). In vitrorelease of metformin from gel was determined in simulatedgastric fluid (0.1 N HCl, pH1.2).When formulation containingsodium alginate comes in contact with SGF, the calciumcarbonate break down and releases free Ca2+ ions that inducegelation due to dimeric association of G-block regions of
sodium alginate (5). The controlled availability of calciumions leads to formation of insoluble alginate gel formation(28). With low levels of calcium, temporary associations areobtained, giving rise to highly viscous, thixotropic solutions.At higher calcium levels, precipitation or gelation results frompermanent associations of the chains. Similar to aliginic acid,the reactions also proceeds with anionic gellan gum giving riseto gel matrix. Gellan, an exopolysaccharide, was incorporatedas an anionic polymer in the formulation. It being anionicreadily cross-links with free calcium ions. The observeddecrease in drug release with increase in gellan to sodiumalginate ratio could be explained by the fact that the diffusioncoefficient through gellan is of similar magnitude to that ofsodium alginate despite the use of gellan in smaller proportion(20). With increase in drug loading, the matrix of gel formedwould become more relaxed allowing easy solvent penetrationleading to enhanced drug diffusion (29); this could be thereason for increased drug release while increasing drugconcentration.
Dissolution efficiency (i.e., area under the dissolutioncurve between 0 to time t) decreased with increase theconcentration of sodium alginate and gellan (Tables I and II).Highest percentage dissolution efficiencies, 80.61±1.38% and80.85±1.93%, were observed for batches F10 and F19,respectively. This may be due to low concentration of sodiumalginate, and formed gel may be weak or not sufficient tosustain the release of high dose of metformin. The combina-tion of sodium alginate and gellan caused about a 14%decrease of dissolution efficiency in relation sodium alginatealone (~93.73%).
Mechanism of Drug Release
Metformin release from the formulations showed line-arity towards Higuchi’s square root model (30), indicating therelease mechanism to be diffusion based. The releaseexponents (n) of the formulations suggest that depending onthe formulation variables the metformin release followedeither Fickian or non-Fickian mechanism. The drug diffusionthrough most types of polymeric systems is often bestdescribed by Fickian diffusion, but there is also a relaxationof the polymer chains, which influences the drug releasemechanism. This process is described as non-Fickian oranomalous diffusion (29). The observed deviation from
Table III. The Quantitative Factor Effects and Associated P Value for all Five Responses
Factor
Y1 Y2 Y3 Y4 Y5
Factor effect p Value Factor effect p Value Factor effect p Value Factor effect p ValueFactoreffect p Value
X1 +0.016 0.0687 −2.66 <0.0001 −4.52 <0.0001 −6.59 <0.0001 −4.38 <0.0001X2 −4.111E−003 0.6266 −2.16 <0.0001 −4.37 <0.0001 −4.65 <0.0001 −2.86 <0.0001X3 +0.032 0.0004 1.83 <0.0001 2.77 <0.0001 3.10 <0.0001 1.83 <0.0001X1X2 −0.020 0.0587 0.29 0.4478 2.32 0.0012 −1.17 0.0487 −1.10 0.0014X1X3 −0.015 0.1483 −0.28 0.4637 −0.70 0.3013 −0.65 0.2631 0.17 0.5986X2X3 +3.333E−004 0.9743 −1.76 <0.0001 0.47 0.4827 −0.70 0.2277 2.05 <0.0001X2
1 −7.833E−003 0.5926 0.011 0.0211 0.37 0.6945 −0.97 0.2387 −1.29 0.0012X2
2 +0.051 0.0012 1.27 0.0211 1.38 0.1510 4.64 <0.0001 2.23 <0.0001X2
3 +0.079 0.0001 1.20 0.0282 −3.89 0.0002 1.27 0.1269 −0.96 0.0407
981Optimization of an In Situ Forming Formulation
Fickian mechanism, in the present study, could be attributedto the reason that the formulations during gelation usuallyimbibe a large amount of dissolution fluid leading to aswollen state of the gel. This might have resulted in thepolymeric chain relaxation resulting in non-Fickian mecha-nism of drug release.
Experimental Designing and Analysis of Variance
The factorial design was carried out using the softwareDESIGN EXPERT® version 7.0.2.8 (Stat-Ease Inc., Minne-apolis, USA). Response surface graphs were used to deter-mine the factor of interaction between the consideredvariables. A quadratic model was obtained after analyzingdata. Values of p<0.05 indicate model terms are significant. Inthis case, X3, X2
2 , and X23 are significant model terms. The
statistical model comprising incorporated interactive and
polynomial terms was utilized to evaluate the response. Oncethe uncoded values of factor levels were applied and responsequadratic model was performed using DESIGN EXPERT®
version 7.0.2, equations were obtained. The resulted equa-tions for all five dependent variables—Y1 (n value), Y2 (%DE), Y3 (X30 min), Y4 (X210 min), and Y5 (X480 min)—in termsof coded factors are presented below:
Y1 ¼þ 0:46þ 0:016X1 � 4:111E� 003X2 þ 0:032X3
� 0:020X1X2 � 0:015X1X3 þ 3:333E� 004X2X3
� 7:833E� 0X21 þ 0:05X2
2 þ 0:07X23
Y2 ¼þ 70:56� 2:66X1 � 2:16X2 þ 1:83X3 þ 0:29X1X2
� 0:28X1X3 � 1:76X2X3 þ 0:011X21 þ 1:27X2
2 þ 1:20X23
Y3 ¼þ 31:68� 4:5X1 � 4:37X2 þ 2:7X3 þ 2:32X1X2
� 0:70X1X3 þ 0:47X2X3 þ 0:37X21 þ 1:38X2
2 þ 3:8X23
Y4 ¼þ 64:50� 6:59X1 � 4:65X2 þ 3:10X3 � 1:17X1X2
� 0:65X1X3 � 0:70X2X3 � 0:97X21 þ 4:64X2
2 þ 1:27X23
Y5 ¼þ 92:48� 4:38X1 � 2:86X2 þ 1:83X3 � 1:10X1X2
þ 0:17X1X3 þ 2:05X2X3 � 1:29X21 þ 2:23X2
2 � 0:96X23
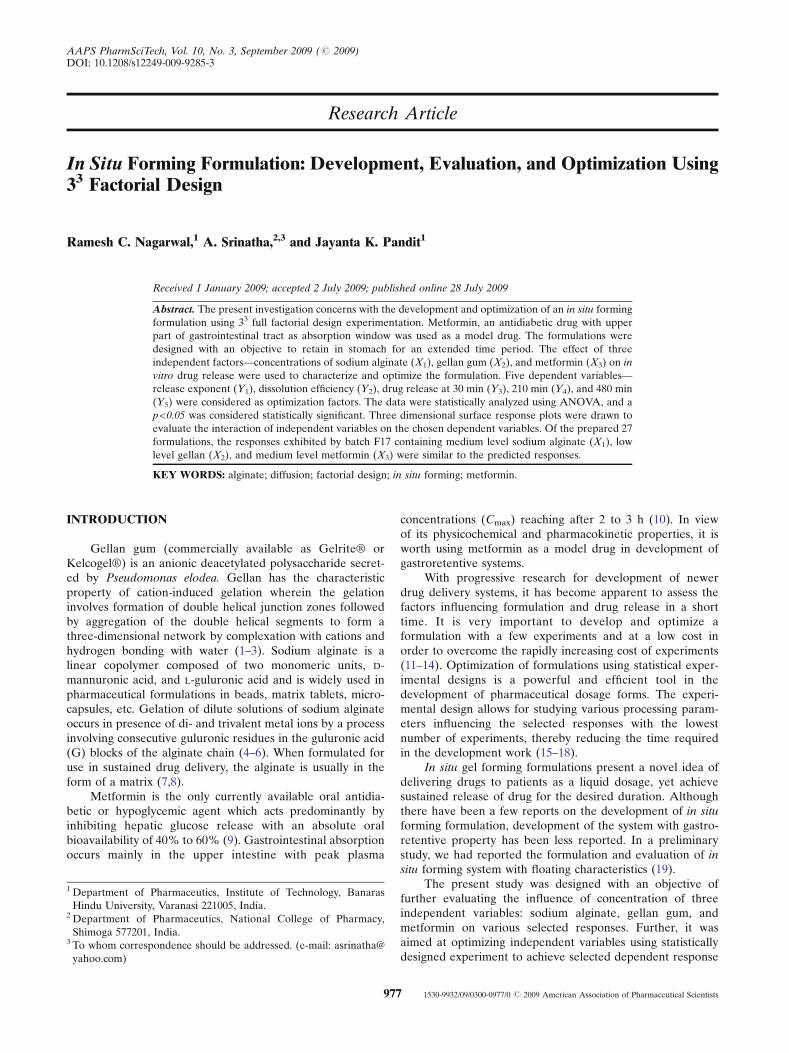
Fig. 5. Surface response plot showing the influence of interaction ofsodium alginate and gellan on dependent variable Y5
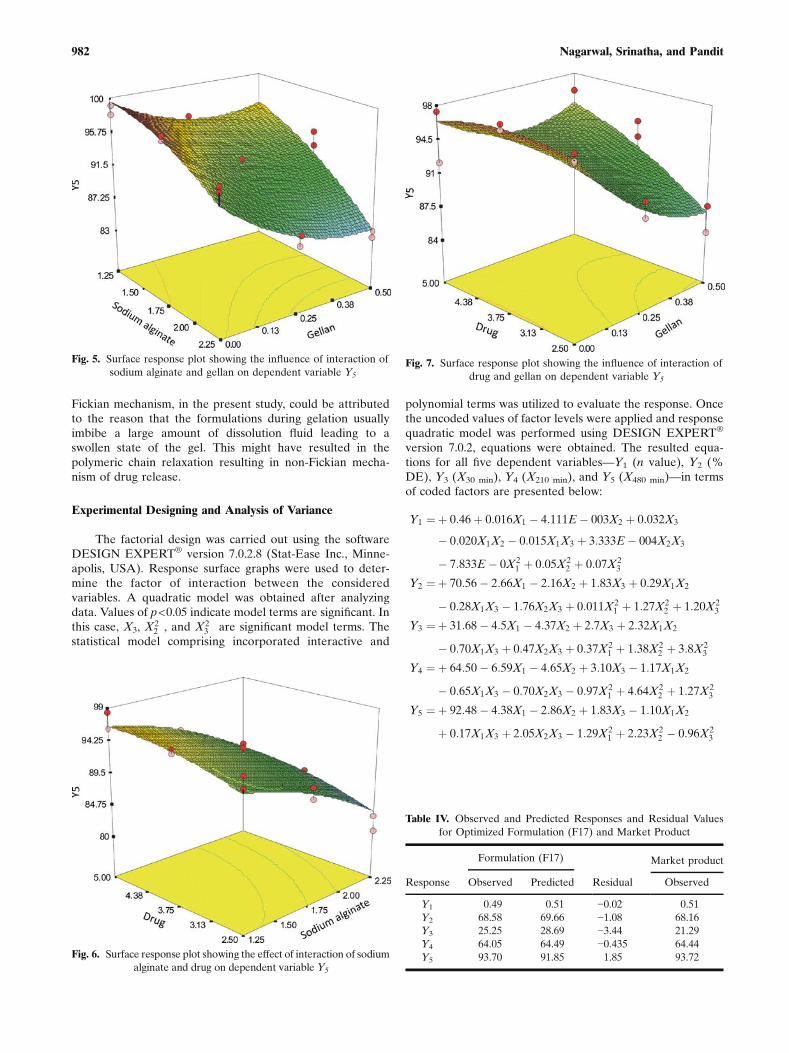
Fig. 7. Surface response plot showing the influence of interaction ofdrug and gellan on dependent variable Y5
Fig. 6. Surface response plot showing the effect of interaction of sodiumalginate and drug on dependent variable Y5
Table IV. Observed and Predicted Responses and Residual Valuesfor Optimized Formulation (F17) and Market Product
Response
Formulation (F17)
Residual
Market product
Observed Predicted Observed
Y1 0.49 0.51 −0.02 0.51Y2 68.58 69.66 −1.08 68.16Y3 25.25 28.69 −3.44 21.29Y4 64.05 64.49 −0.435 64.44Y5 93.70 91.85 1.85 93.72
982 Nagarwal, Srinatha, and Pandit

Estimation of Quantitative Effects of Factors
A factor was considered to influence the response if theeffects are significant (p<0.05). A positive value indicates asynergistic effect that favors optimization, while a negativesign represents an antagonistic effect or inverse effect of thefactor on the selected response. It is shown in Table III thatresponse Y1 (release exponent) was significantly influencedby the synergistic effect of drug concentration (X3), quad-ratic term of gellan (X2
2 ), and metformin (X23 ) with a
respective probability value of 0.0004, 0.0012, and 0.0001.For second response Y2 (percentage dissolution efficiency),the significant factors were identified as sodium alginate(X1), gellan (X2), metformin (X3), quadratic terms X2X3,X2
2 ; and X23 with a p value of <0.0001 for all factors except
quadratic term X22 (p=0.0211) and X2
3 (p=0.0282). FactorsX3, X2
2 , and X23 had synergistic influence on optimization,
while X1, X2, and X1X2 had antagonistic effect on responseY2. Significant influence for factor Y3 was shown by X1, X2,X3, X1X2, and X2
3 with p values of 0.0001 (for first threefactors), 0.0012, and 0.0002 for other two factors, respec-tively. On responses Y4 and Y5, factors X1, X2, X3, X1X2,and X2
2 showed significant influence. Among these factors,X1, X2, and X1X2 have antagonistic effect. Additionally, forresponse Y5, factor X2
3 has showed significant but synergisticeffect (p<0.0001).
Three-dimensional plots for the measured responseswere formed to assess the change of the response surface.Also, the relationship between the dependent and indepen-dent variables can be further understood by these plots(Figs. 5, 6, and 7). Based on the model quadratic equationsdeveloped, the formulation was optimized on the basis ofobserved and predicted values for five responses. Theoptimal factors were determined as sodium alginate 1.75%(w/v), gellan 0.50% (w/v), and metformin 3.75% (w/v).Further, the observed and predicted values of batch F17correlated significantly with the observed values of marketedmetformin tablet (Table IV).
CONCLUSION
In the present investigation, an in situ forming formula-tion for targeting metformin release at upper GIT wasdeveloped. Using 33 full factorial design, the effect ofinteraction of three independent variables—sodium alginate,gellan gum, and metformin—on five responses was studiedand optimized. Further, the study showed that all threedependent variables had significant effect on the selectedresponses. The optimized formulation can very well be usedas an alternative to the single unit solid dosage form as theformer is easy to administer by both geriatric and pediatricpatients who constitute a large proportion of diabetic patientsin the world.
ACKNOWLEDGEMENT
The authors would like to express their sincere gratitudeto University Grants Commission, Government of India forproviding Senior Research Fellowship to Srinatha andScholarship for Ramesh Nagarwal.
REFERENCES
1. Crescenzi V, Dentini M, Coviello T. Solution and gellingproperties of microbial polysaccharides of industrial interest:the case of gellan. In: Dawes EA, editor. Novel biodegradablemicrobial polymers. Netherlands: Kluwer Academic Publishers;1990. p. 227–84.
2. Grasdalen H, Smidsord O. Gelation of gellan gum. CarbohydrPolym. 1987;7:371–93.
3. Chandrasekaran R, Thailambal VG. The influence of calciumions, acetate and l-glycerate groups on the gellan double helix.Carbohydr Polym. 1990;12:431–42.
4. Grant GT, Morris ER, Rees DA, Smith PJA, Thorn D.Biological interaction between polysaccharides and divalentcations: the egg-box model. FEBS Lett. 1973;32:195–8.
5. Morris ER, Rees DA, Thom D, Boyd J. Chiroptical andstoichiometric evidence of a specific, primary dimerisationprocess in alginate gelation. Carbohydr Res. 1978;66:145–54.
6. Liang JN, Stevens ES, Frangou SA, Morris ER, Rees DA. Cation-specific vacuum ultraviolet circular dichronism behavior of alginatesolutions, gels and solid films. Int J Biol Macromol. 1980;2:204–8.
7. Nicholson SJ, Horder R, Attwood D, Collett JH. Investigation ofdrug release from sodium alginate–sodium calcium alginatematrices. J Pharm Pharmacol. 1990;42:2–5.
8. Yotsuyanagi T, Ohkubo T, Ohhashi T, Ikeda K. Calcium-inducedgelation of alginic acid and pH sensitive re-swelling of dried gels.Chem Pharm Bull. 1987;35:1555–63.
9. Scheen AJ. Clinical pharmacokinetics of metformin. Clin Phar-macokinet. 1996;30:359–71.
10. Sambol NC, Brookes LG, Chiang J, Goodman AM, Lin ET, LiuCY, et al. Food intake and dosage level, but not tablet vs solutiondosage form, affect the absorption of metformin HCl in man. BrJ Clin Pharmacol. 1996;42:510–2.
11. Bolton S. Pharmaceutical statistics: practical and clinical appli-cations. New York: Marcel Dekker; 1990.
12. Bloomfield MS, Butler WC. Robustness testing using exper-imental design of a flow through dissolution method for aproduct where the actives have markedly differing solubilityproperties. Int J Pharm. 2000;206:55–61.
13. Parojcic J, Duric Z, Jovanovic M, Ibric S, Nikolic L. Influence ofpH and agitation intensity on drug dissolution from tabletsevaluated by means of factorial design. Pharm Ind. 2001;63:774–9.
14. Kincl M, Vrecer F, Veber M. Application of experimental designmethodology in development and optimization of drug releasemethod. Int J Pharm. 2005;291:39–49.
15. Furlanetto S, Cirri M, Maestrelli F, Corti G, Mura P. Study offormulation variables influencing the drug release rate frommatrix tablets by experimental design. Eur J Pharm Biopharm.2006;62:77–84.
16. Schwartz JB, O’Connor RE. Optimization techniques in phar-maceutical formulation and processing. In: Banker GS, RhodesCT, editors. Modern pharmaceutics. New York: Marcel Dekker;1997. p. 727–52.
17. Lewis GA, Mathieu D, Phan-Tan-Luv R. Pharmaceuticalexperimental design. New York: Marcel Dekker; 1999.
18. Lunstedt T, Seifert E, Abramo L, Thelin R, Nystrom A,Pettersen J, et al. Experimental design and optimization. ChemIntell Lab Sys. 1998;42:3–40.
19. Pandit JK, Srinatha A, Thilek Kumar M, Ridhurkar DN. Gastro-retentive in situ gelling system of amoxicillin. Proceedings of 57thIndian Pharmaceutical Congress, Hyderabad; 2005.
20. Kubo W, Miyazaki S, Attwood D. Oral sustained delivery ofparacetamol from in situ gelling gellan and sodium alginateformulations. Int J Pharm. 2003;258:55–64.
21. Montgomery DC. Design and analysis of experiments. NewYork: Wiley; 1991.
22. Singh KS, Dodge J, Durrani MJ, Khan MA. Optimization andcharacterization of controlled release pellets coated with anexperimental latex-I: anionic drug. Int J Pharm. 1995;125:243–55.
23. Zatz JL, Woodford DW. Prolonged release of theophylline fromaqueous suspensions. Drug Dev Ind Pharm. 1987;13:2159–78.
24. Korsmeyer RW, Gurny R, Doelker EM, Buri P, Peppas NA.Mechanisms of solute release from porous hydrophilic polymers.Int J Pharm. 1983;15:25–35.
983Optimization of an In Situ Forming Formulation

25. Peppas NA. Analysis of Fickian and non-Fickian drug releasepolymers. Pharm Acta Helv. 1985;60:110–1.
26. Choi BY, Park HJ, Hwang SJ, Park JB. Preparation of alginatebeads for floating drug delivery system: effects of CO2 gas-forming agents. Int J Pharm. 2002;239:81–91.
27. Miyazaki S, Kawasaki N, Kubo W, Endo K, Attwood D.Comparison of in situ gelling formulations for the oral deliveryof cimetidine. Int J Pharm. 2001;220:161–8.
28. Sriamornsak P, Kennedy RA. Development of polysaccharidegel-coated pellets for oral administration-2. Calcium alginate.Eur J Pharm Sci. 2006;29:139–47.
29. Baumgartner S, Kristl J, Vrecer F, Vodopivec P, Zorko B.Optimisation of floating matrix tablets and evaluation of theirgastric residence time. Int J Pharm. 2000;195:125–35.
30. Higuchi T. Mechanism of sustained action medication. J PharmSci. 1963;52:1145–9.
984 Nagarwal, Srinatha, and Pandit