in silico design and in vivo implementation of yeast gene ...10.1186/1754-1611-8-6... · in silico...
TRANSCRIPT

In silico design and in vivo implementation of yeast gene
Boolean gates
Additional file 1Supplementary Material
Mario A. Marchisio1,21 Department of Biosystems Science and Engineering (D-BSSE),
ETH Zurich, Mattenstrasse 26, 4058 Basel, Switzerland2 Current address:
School of Life Science and Technology, Harbin Institute of Technology (HIT),
2 Yikuang Street, Nan Gang District, 150080 Harbin, P. R. China
email: [email protected]

2

Introduction
Promoter Coding region Terminator
Standard Biological Parts
RNA polymerase Ribosome Chemicals sRNAs Transcription factors
Signal Carriers’ Pools
mRNAReporter proteins
Other Pools
Spliceosome
Boolean gates
AND NOT YES
Transcription activation
Transcription repression
Inactive repressor
Interactions
Translation
Bidirectional exchange of fluxes
Figure S1: Symbols. Summary of the symbols used in this work.
3

A
CNF-POS Boolean formula:
NOT((A AND C) OR (a AND B))
a b c O0 0 0 00 0 1 10 1 0 01 0 0 00 1 1 11 0 1 01 1 0 11 1 1 1
Truth table
DNF-SOP Boolean formula:
(A AND c) OR (a AND b)
Negated literal: NOT gate
Positive literal: YES gate
Clause (operation in brackets):
AND gate
Karnaugh Map
Input number: 3a: inducer + Rab: corepressor + Aac: inducer + Ai
B
a
b
c
Ra
Aa
Ai
a
b
c
Ra1
Aa
Ai
Ra2
Circuit: Final gate architecture
Circuit:Distributed output architecture
(A AND c) OR (a AND b) NOT((A AND C) OR (a AND B))
Figure S2: Automatic gene digital circuit design. A) Our software requires: a truth table,the input chemicals (inducers/corepressors), and chemicals’ targets (in the figure: Ra, activerepressor; Aa, active activator; Ai, inactive activator). The truth table is converted both into theDNF-SOP and the CNF-POS formulas via the Karnaugh map method. B) Formulas are translatedinto circuits organized into two (distributed output architecture) or three (final gate architecture)layers of gates and Pools of common signal carriers.
4
Materials and Methods
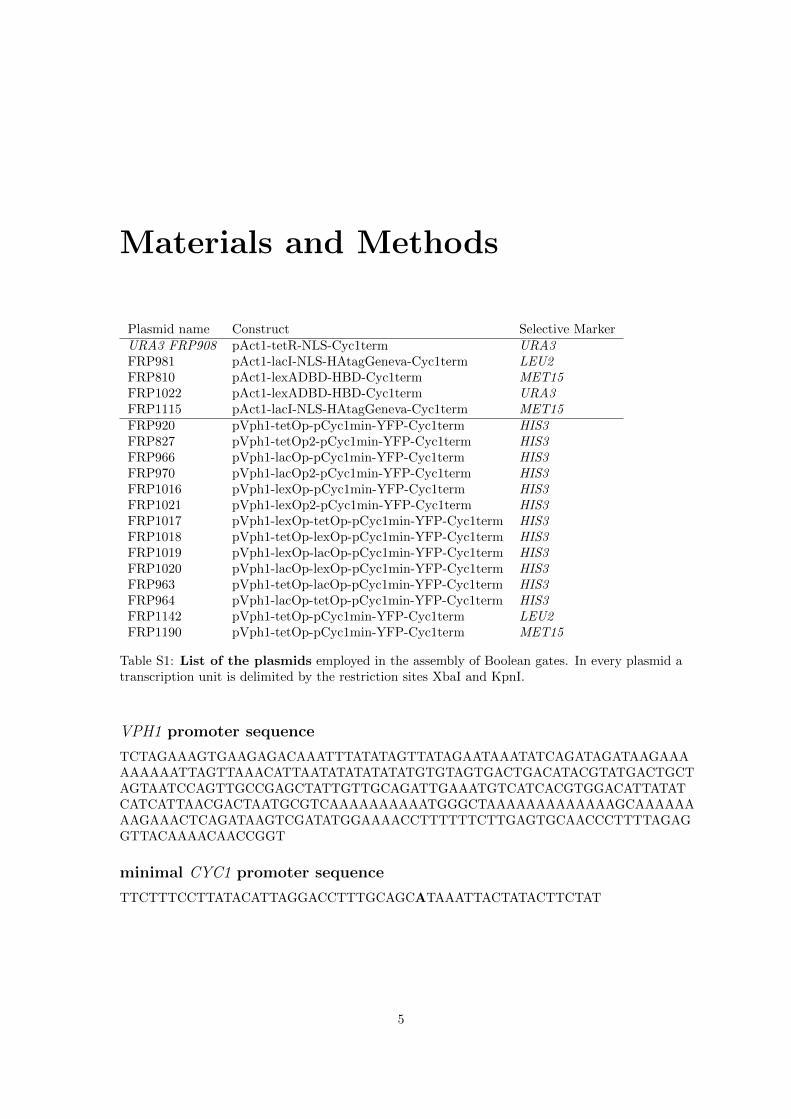
Plasmid name Construct Selective MarkerURA3 FRP908 pAct1-tetR-NLS-Cyc1term URA3FRP981 pAct1-lacI-NLS-HAtagGeneva-Cyc1term LEU2FRP810 pAct1-lexADBD-HBD-Cyc1term MET15FRP1022 pAct1-lexADBD-HBD-Cyc1term URA3FRP1115 pAct1-lacI-NLS-HAtagGeneva-Cyc1term MET15FRP920 pVph1-tetOp-pCyc1min-YFP-Cyc1term HIS3FRP827 pVph1-tetOp2-pCyc1min-YFP-Cyc1term HIS3FRP966 pVph1-lacOp-pCyc1min-YFP-Cyc1term HIS3FRP970 pVph1-lacOp2-pCyc1min-YFP-Cyc1term HIS3FRP1016 pVph1-lexOp-pCyc1min-YFP-Cyc1term HIS3FRP1021 pVph1-lexOp2-pCyc1min-YFP-Cyc1term HIS3FRP1017 pVph1-lexOp-tetOp-pCyc1min-YFP-Cyc1term HIS3FRP1018 pVph1-tetOp-lexOp-pCyc1min-YFP-Cyc1term HIS3FRP1019 pVph1-lexOp-lacOp-pCyc1min-YFP-Cyc1term HIS3FRP1020 pVph1-lacOp-lexOp-pCyc1min-YFP-Cyc1term HIS3FRP963 pVph1-tetOp-lacOp-pCyc1min-YFP-Cyc1term HIS3FRP964 pVph1-lacOp-tetOp-pCyc1min-YFP-Cyc1term HIS3FRP1142 pVph1-tetOp-pCyc1min-YFP-Cyc1term LEU2FRP1190 pVph1-tetOp-pCyc1min-YFP-Cyc1term MET15
Table S1: List of the plasmids employed in the assembly of Boolean gates. In every plasmid atranscription unit is delimited by the restriction sites XbaI and KpnI.
VPH1 promoter sequence
TCTAGAAAGTGAAGAGACAAATTTATATAGTTATAGAATAAATATCAGATAGATAAGAAAAAAAAATTAGTTAAACATTAATATATATATATGTGTAGTGACTGACATACGTATGACTGCTAGTAATCCAGTTGCCGAGCTATTGTTGCAGATTGAAATGTCATCACGTGGACATTATATCATCATTAACGACTAATGCGTCAAAAAAAAAATGGGCTAAAAAAAAAAAAAGCAAAAAAAAGAAACTCAGATAAGTCGATATGGAAAACCTTTTTTCTTGAGTGCAACCCTTTTAGAGGTTACAAAACAACCGGT
minimal CYC1 promoter sequence
TTCTTTCCTTATACATTAGGACCTTTGCAGCATAAATTACTATACTTCTAT
5

Strain name Genotype GateFRY630 FRY11 FRP920::HIS3 open YES tetOpFRY651 FRY11 FRP920::HIS3 FRP908::URA3 YES tetOpFRY511 FRY11 FRP827 open YES tetOp2FRY605 FRY11 FRP827::HIS3 FRP908::URA3 YES tetOp2FRY697 FRY11 FRP966::HIS3 open YES lacOpFRY872 FRY11 FRP966::HIS3 FRP981::LEU2 YES lacOpFRY713 FRY11 FRP970::HIS3 open YES lacOp2FRY854 FRY11 FRP970::HIS3 FRP981::LEU2 YES (lacOp2)FRY714 FRY11 FRP9702::HIS3 open YES lacOp2-DIFRY1052 FRY11 FRP9702::HIS3 FRP981::LEU2 YES lacOp2-DIFRY795 FRY11 FRP1016::HIS3 open NOT lexOpFRY819 FRY11 FRP1016::HIS3 FRP810::MET15 NOT lexOpFRY797 FRY11 FRP1021::HIS3 open NOT lexOp2FRY821 FRY11 FRP1021::HIS3 FRP810::MET15 NOT lexOp2FRY799 FRY11 FRP1017::HIS3 open AND lexOp-tetOpFRY831 FRY11 FRP1017::HIS3 FRP908::URA3 FRP810::MET15 AND lexOp-tetOpFRY801 FRY11 FRP1018::HIS3 open AND tetOp-lexOpFRY832 FRY11 FRP1018::HIS3 FRP908::URA3 FRP810::MET15 AND tetOp-lexOpFRY677 FRY11 FRP963::HIS3 open AND tetOp-lacOpFRY851 FRY11 FRP963::HIS3 FRP908::URA3 FRP981::LEU2 AND tetOp-lacOpFRY679 FRY11 FRP964::HIS3 open AND lacOp-tetOpFRY853 FRY11 FRP964::HIS3 FRP908::URA3 FRP981::LEU2 AND lacOp-tetOpFRY680 FRY11 FRP9643::HIS3 open AND lacOp-tetOp-TIFRY968 FRY11 FRP9643::HIS3 FRP908::URA3 FRP981::LEU2 AND lacOp-tetOp-TIFRY802 FRY11 FRP1019::HIS3 open AND lexOp-lacOpFRY856 FRY11 FRP1019::HIS3 FRP1022::URA3 FRP981::LEU2 AND lexOp-lacOpFRY803 FRY11 FRP1020::HIS3 open AND lacOp-lexOpFRY977 FRY11 FRP1020::HIS3 FRP1022::URA3 FRP1115::MET15 AND lacOp-lexOpFRY1041 FRY11 FRP1142::LEU2 FRP908::URA3 YES tetOpFRY1089 FRY11 FRP1142::LEU2 FRP908::URA3 FRP1016::HIS3 FRP810::MET15 OR (tetOp+lexOp)FRY1110 FRY11 FRP1190::MET15 FRP908::URA3 YES tetOpFRY1109 FRY11 FRP1190::MET15 FRP908::URA3 FRP966::HIS3 FRP981::LEU2 OR (tetOp+lacOp)
Table S2: List of yeast strains whose genome was modified via gene Boolean gate’s integration.Upper indexes indicate multiple integrations. Plasmids are described in Table 1.
6

A
9900#
9950#
10000#
10050#
10100#
10150#
10200#
10250#
10300#
10350#
10400#
FRY651#
FRY605#
FRY854/872#
FRY1052#
FRY819/821#
FRY831/832#
FRY851/853#
FRY968#
FRY856/977#
FRY1041#
FRY1089#
FRY1110#
FRY1109#
Fluo
rescen
ce*(A
U)*
4th*peak*
start#
end#
B
70500$
71000$
71500$
72000$
72500$
73000$
73500$
74000$
74500$
FRY651$
FRY605$
FRY854/872$
FRY1052$
FRY819/821$
FRY831/832$
FRY851/853$
FRY968$
FRY856/977$
FRY1041$
FRY1089$
FRY1110$
FRY1109$
Fluo
rescen
ce*(A
U)*
6th*peak*
start$
end$
Figure S3: 8 peaks alignment beads fluorescence. For every experiment (labelled with one ortwo yeast strain corresponding to closed gates) the initial and final values of the mean fluorescenceof the 4th (A) and the 6th (B) peak are reported. Within a single experiment, the biggest variationwe observed was of 2.1% (4th peak) and 2.0% (6th peak) of the initial mean fluorescence value.
7

8

Experimental results
Three different YES tetOp gate implementation
Strain name Marker 1 max(0) σ ρ ϕ 0/1 th.FRY651 HIS3 6500 1899 4601 3.42 0.96 4000FRY1041 LEU2 5675.5 1978 3697.5 2.87 0.90 4000FRY1110 MET15 5904.5 1443 4461.5 4.09 1.20 4000
Table S3: Comparison of the performance of the three YES tetOp gates implemented in thiswork. Fluorescence levels are expressed in arbitrary units. The last column refers to the chosenlow/high output threshold.
9

A
●● ●
● ●●
●
●
●
020
0040
0060
0080
00
tetracycline (uM)
Flu
ores
cenc
e (A
U)
●● ●
● ●●
●
●
●
0
0.3
0.6
1.2
2.5 5 10 20
FR
Y63
0
B
● ●●
●
●
●
●
●
●
020
0040
0060
0080
00
IPTG (mM)
Flu
ores
cenc
e (A
U)
● ●●
●
●
●
●
●
●
0
0.6
1.1
2.5 5 10 20 40
FR
Y69
7
C
●
●
●
●
●
●
●●
● ●
●
020
0040
0060
0080
00
beta estradiol (nM)
Flu
ores
cenc
e (A
U) ●
●
●
●
●
●
●●
● ●
●
0
7.8
15.6
31.2
62.5
125
250
500
1000
2000
FR
Y79
5
Figure S4: Titration curves. A) tetracycline-TetR (YES tetOp gate). B) IPTG-LacI (YESlacOp gate). c) β-estradiol–LexA-HBD (NOT lexOp gate). For each curve, the correspondingopen gate–indicated with the yeast strain name–was taken as positive control.
10

Computational analysis
YES lacOp2-DI analysis
YES gate IPTG=0 IPTG=1 open
lacOp 0.67 3.31 2.71lacOp* 0.67 2.68 2.71lacOp2 0.01 0.26 1.00lacOp2* (k2ref=0.1) 0.01 0.26 1.00lacOp2-DI 0.02 0.50 2.56lacOp2-DI* 0.02 0.53 2.00lacOp2* (k2=0.218) 0.02 0.50 2.00
Table S4: Comparison of experimental and computational (*) relative fluorescence ofYES lacOp, YES lacOp2, and YES lacOp2-DI gates.
AND lacOp-tetOp-TI analysis
AND gate 00 01 10 11 open
lacOp-tetOp 0.10 0.42 0.14 0.51 1.00lacOp-tetOp* (k2ref=0.1) 0.07 0.43 0.10 0.55 1.00lacOp-tetOp-TI 0.00 0.35 0.12 0.85 3.12lacOp-tetOp TI* 0.20 1.28 0.30 1.64 3.00lacOp-tetOp-TI with lacI-TI* 0.07 0.69 0.10 0.94 3.00lacOp-tetOp with lacI-TI* (k2=0.3166) 0.06 0.62 0.09 0.86 3.00
Table S5: Comparison of experimental and computational (*) relative fluorescence ofAND lacOp-tetOp, and AND lacOp-tetOp-TI. The first input digit refers to tetracycline, thesecond one to IPTG.
Parameter values
VOLUME Value Referencevcell 42 · 10−15l [4]vnucleus 2.9 · 10−15l 7% vcell [3]vcytoplasm 39.1 · 10−15l
Protein decay rates kdp is the same for free and DNA-bound proteins. Their values are listedbelow (nuclear protein Pools).Notice that kel = gene length/vpol and krel = gene length/vrib. The mRNA decay rate kd is definedby the terminator.
11

POOLS Value Referencepolfree 5000 arbitraryY free 5000 arbitraryribfree 23000 arbitrary
PROMOTERS-common Value Referencek1 106M−1s−1 RNA polymerase-promoter binding rate constant [6]k−1 1s−1 RNA polymerase-promoter unbinding rate [6]klk2 5 10−5s−1 transcription initiation rate due to leakage[6]
PROMOTER-pAct1 Value Referencek2 1.53s−1 transcription initiation rate
PROMOTER-pLacOp Value Referencek2 0.284s−1 transcription initiation rateα 7.8 106M−1s−1 LacI-DNA binding rate constantβ 9s−1 LacI-DNA unbinding rateγ 6800M−1s−1 IPTG-LacI (on the DNA) binding rate constant
PROMOTER-pLacOp2 Value Referencek2 0.1s−1 transcription initiation rateαs 7.1 107M−1s−1 LacI-strong operator binding rate constantαw 7.8 106M−1s−1 LacI-weak operator binding rate constantαc 7.1 107M−1s−1 LacI-weak operator binding rate constant with cooperativityβs 9s−1 LacI-strong operator unbinding rateβw 224s−1 LacI-weak operator unbinding rateβc 20s−1 LacI-weak operator unbinding rate with cooperativityγ 50M−1s−1 IPTG-LacI (on the DNA) binding rate constant
PROMOTER-pLacOpTetOp Value Referencek2 0.1s−1 transcription initiation rateαlac 1.75 107M−1s−1 LacI-DNA binding rate constantαtet 106M−1s−1 TetR-DNA binding rate constantβlac 9s−1 LacI-DNA unbinding rateβtet 9s−1 TetR-DNA unbinding rateγlac 100M−1s−1 IPTG-LacI (on the DNA) binding rate constantγtet 104M−1s−1 tetracycline-TetR (on the DNA) binding rate constant
CODING REGIONS and mRNA Pools Value ReferenceYFP length 726ntLacI length 1208ntTetR length 684ntvpol 23.3nt/s polymerase speed [5]vrib 24nt/s ribosome speed [5]k1y 1500M−1s−1 spliceosome-mRNAbinding rate constant [5]k−1y 0.0017s−1 spliceosome-mRNA unbinding rate [5]k2y 0.033s−1 splicing rate [5]km 0.00055s−1 (30min) mRNA maturation rate [5]k1r 106M−1s−1 ribosome-mRNA binding rate constant [5]k−1r 0.01s−1 ribosome-mRNA unbinding rate [5]k2r 0.02s−1 translation initiation rate [5]ζr 0.5s−1 protein synthesis rate [5]ktr 8.3 · 10−3s−1 (2 min) nuclear import rate [5]
12

TERMINATORS Value Referencekd 5.7 10−4s−1 20.1 min mRNA decay rate [9]ζ 31.25s−1 RNA polymerase-DNA unbinding rate [5]
Repressor POOLS-common Value Referencekdp 2.7 10−4s−1 (43 min) decay rate [1]δ 109M−1s−1 dimerization rate constant [6]ε 10s−1 dimer separation rate [6]
LacI POOL Value Referenceλ 2180M−1s−1 IPTG-LacI binding rate constantl [6]µ 10s−1 IPTG-LacI unbinding rate [6]
TetR POOL Value Referenceλ 106M−1s−1 tetracycline-TetR binding rate constantl [6]µ 10s−1 tetracycline-TetR unbinding rate [6]
tetracycline POOL Value Referencesfree 0/20 10−6M initial concentrations
IPTG POOL Value Referencesfree 0/0.04M initial concentrations
13

14

Modeling
In silico, both YES lacOp2 and AND lacOp-tetOp gate have been realized by composing eukaryoticParts and Pools [7]. Composable Parts are DNA segments with a well-defined function either intranscription or translation [2]; Pools are the hypothetical places where free molecules (i.e. notbound to the DNA or the mRNA ) are stored. Eukaryotic Parts and Pools present substantialdifferences from the bacterial ones presented in [6]: 1) Promoters, Coding Regions (for proteinsand small RNAs), and Terminators are the only types of Parts that make up a circuit, ribosomebinding sites (RBS) are no longer present ; 2) mature mRNAs corresponding to different genes arestored into separate Pools; 3) mRNA maturation is taken into account and a spliceosome Pool isused; 4) RNA interference replaces simple base pairing between small RNAs and mRNA; 5) Partsand Pools are placed into two communicating compartments: nucleus and cytoplasm. However,the principles of modeling and designing synthetic gene circuits with eukaryotic composable Partsand Pools are the same as in bacterial cells. Parts and Pools are described independently via fullmass-action kinetics. This allows to define an interface made of fluxes of Common Signal Carriersand other molecules. Common Signal Carriers are RNA polymerases (flux: PoPS, PolymerasesPer Second), ribosomes (RiPS, Ribosomes Per Second), transcription factors (FaPS, Factors PerSecond), small RNAs (RNAPS, RNAs Per Second), and chemicals (SiPS: Signals Per Second).PoPS and RiPS fluxes are either the input/output of Parts (the former along the DNA, the latteron the mRNA) or they are exchanged between the Polymerase Pool and each promoter in thenucleus (PoPSb) or the Ribosome Pool and any mRNA Pool in the cytoplasm (RiPSb) . Theindex b stands for balance and indicates a bidirectional communication. FaPS and RNAPS fluxesallow interactions among transcription units whereas SiPS is a currency exchanged by the wholecircuit and the environment.
YES lacOp2
Figure shows the schematic for the YES lacOp2 gate with eukaryotic Parts and Pools. The twoboxes in the nucleus are the transcription units employed in the circuit: one producing LacI andthe other Citrine i.e. the yellow fluorescent protein (YFP). Graphically, the LacI Pool in thenucleus plays the role of an interface between the two transcription units and the IPTG (isopropil-β-D-1-tiogalattopiranoside) Pool outside the cell is the interface between the Boolean gate andthe environment. In the following, we give a model for each gate’s Part and Pool where a listof biochemical reactions is accompanied with the calculation of the fluxes received or sent by thecircuit component. Notice that the symbol =⇒ means that a flux of molecules ends entirely intoa species.
15

PoPS PoPS
FaPS, Ra free
RiPS, ribfree
FaPS
Cytoplasm
Nucleus
Cell
PoPS, polfree
SiPS, Sfree
pAct1 lacI Cyc1termYPS, YfreeLacI Pool
pLacOp2 yfp Cyc1term
IPTG Pool
YFP Pool
lacI mRNA Pool
yfp mRNA Pool
Polymerase Pool
Spliceosome Pool
Ribosome Pool
Figure S5: YES lacOp2 scheme. Schematic of the Boolean gate YES lacOp2. RNA PolymerasePool is connected to both transcription units. In particular, this Pool exchanges a PoPSb fluxwith each promoter and receives a PoPSin flux from every terminator (for the sake of simplicity,we traced a single straight line between the Pool and each transcription unit and indicated asPoPS the information exchanged). The two promoters are also constantly informed (during asimulation) about the amount of RNA Polymerase available in the Pool (polfree). An analogousdescription holds for the ribosome Pool (double connection to each mRNA Pool) whereas thespliceosome Pool has a single link to every Coding region. The IPTG Pool is connected to boththe LacI Pool and the pLacOp2 promoter since IPTG can bind and inactivate LacI molecules bothon the DNA and far from it. Therefore, the LacI Pool–which receives a flux of proteins (FaPSin
from the cytoplasm–exchange with the pLacOp2 promoter a flux of active (FaPSba) and inactive
(FaPSbi ) LacI and informs the promoter with the amount of currently available active repressors
(Ra). Finally, the YFP Pool permits to read the circuit output during a computer simulation.
16

Constitutive pAct1 promoter
Species and fluxes
p0f free promoter (RNA polymerase binding site)p0t promoter taken by RNA polymerasesPolfree RNA polymerases available in the Polymerase PoolPolcl RNA polymerase in the promoter cleaning phase. Sent as PoPSout to the lacI coding regionPoPSb exchanged with the Polymerase PoolPoPSout sent to LacI coding region
Notice that Polcl is a fictitious species [8] since it does not appear explicitly into the circuit SBMLfile but it is replaced by the PoPSout flux.
Reactions
Polfree + p0f ←→ p0t k1, k−1
p0t −→ p0f + Polcl k2
Fluxes calculation
PoPSout = k2p0t
PoPSb = k1Polfreep0f − k−1p0
t
LacI and YFP coding region
Species and fluxes
PoPSin from the adjacent promoterY free available spliceosome molecules into their Pool[PolA] RNA polymerase bound to the DNA before starting the elongation phasePolel RNA polymerase in the promoter elongation phase. It is a fictitious species replaced by PoPSout
umRNA unspliced mRNA[Y umRNA] spliceosome molecules bound to umRNA
nmRNA nuclear mRNAmmRNA mature mRNA. It is a fictitious species replaced by RNAPSout
RNAPSout flux of mature mRNA sent to the corresponding mRNA Pool in the cytoplasmPoPSout sent to the adjacent terminator
Reactions
PoPSin =⇒ [PolA]
[PolA] −→ umRNA + Polel kel
Y free + umRNA ←→ [Y umRNA] k1y, k−1y
[Y umRNA] −→ Y free + nmRNA k2y
nmRNA −→ mmRNA km
umRNA −→ kd
17

nmRNA −→ kd
[Y umRNA] −→ Y free kd
Fluxes calculation
RNAPSout = kmnmRNA
PoPSout = kel[PolA]
Y PSb = k1yYfreeumRNA − (k−1y + k2y + kd)[Y umRNA]
Cyc1 terminator
Species and fluxes
PoPSin from the adjacent coding region[PolT ] RNA polymerase bound to the terminatorPolfree RNA polymerase leaving the DNA. Sent to the Polymerase Pool as PoPSout
PoPSout sent to the Polymerase Pool
Reactions
PoPSin =⇒ [PolT ]
[PolT ] −→ Polfree ζ
Fluxes calculation
PoPSout = ζ[PolT ]
The LacI and YFP mRNA Pool
Species and fluxes
RiPSb exchanged with the ribosome PoolRNAPSin flux of mature mRNA from the corresponding coding regionPoPSin
lk flux of RNA polymerase due to a promoter leakage
rf0 free mature mRNAribfree free ribosomes available in their Poolrt0 mature mRNA taken by ribosomes[ribSTART ] ribosomes bound to the START codon[ribSTOP ] ribosomes bound to the STOP codonproteinc proteins in the cytoplasmproteinn proteins in the nucleus. It is a fictitious speciesRiPSout sent to the ribosome PoolFaPSout LacI or YFP flux sent to the corresponding Pool in the nucleus
18

Reactions
RNAPSin =⇒ rf0
PoPSinlk =⇒ rf0 (only for YFP)
ribfree + rf0 ←→ rt0 k1r, k−1r
rt0 −→ rf0 + [ribSTART ] k2r
[ribSTART ] −→ [ribSTOP ] krel
[ribSTOP ] −→ ribfree + proteinc ζr
rf0 −→ kd
rt0 −→ ribfree kd
proteinc −→ kdp
proteinc −→ proteinn ktr
Fluxes calculation
RiPSb = k1rribfreerf0 − k−1rr
t0
RiPSout = ζr[ribSTOP ] + kdrt0
FaPSout = ktrproteinc
The LacI Pool
Species and fluxes
FaPSin from the corresponding mRNA Pool in the cytoplasmRm LacI monomersRa LacI dimers (active i.e. not bound to IPTG)Ri LacI dimers (inactive i.e. bound to IPTG)Sfree available IPTG molecules in their corresponding PoolSiPSb exchanged with the IPTG Pool
Reactions
FaPSin =⇒ Rm
2Rm ←→ Ra δ, ε
Rm −→ kdp
Ra −→ kdp
Sfree +Ra ←→ Ri λ, µ
Ri −→ Sfree kdp
IPTG is supposed to bind only LacI dimers.
Fluxes calculation
SiPSb = λSfreeRa − (µ+ kdp)Ri
19

Regulated pLacOp2 promoter
Species and fluxes
Polfree RNA polymerases available in their PoolRa free active LacI molecules available in their PoolRi free inactive LacI moleculesSfree IPTG molecules available in their Pool
p0fOf1O
f2 completely free promoter
p0tOf1O
f2 RNA polymerase bound to the promoter (p0 is the polymerase binding site)
p0fOt1O
f2 LacI bound to the strong operator O1 (close to the TATA box)
p0fOf1O
t2 LacI bound to the weak operator O2 (close to the TSS)
p0fOt1O
t2 LacI bound to both operators
Polcl RNA polymerase in the promoter cleaning phasePolcllk RNA polymerase in the cleaning phase due to promoter leakage. This is a fictitious speciesPoPSb exchanged with the polymerase PoolPoPSout sent to the YFP coding regionPoPSout
lk sent to the YFP mRNA Pool in the cytoplasmFaPSb
a flux of active LacI exchanged with the LacI PoolFaPSout
i flux of inactive LacI sent to the LacI PoolSiPSin from the IPTG Pool
Reactions
Polfree + p0fOf1O
f2 ←→ p0tOf
1Of2 k1, k−1
p0tOf1O
f2 −→ p0fOf
1Of2 + Polcl k2
Ra + p0fOf1O
f2 ←→ p0fOt
1Of2 αs, βs
Ra + p0fOf1O
t2 ←→ p0fOt
1Ot2 αs, βs
Ra + p0fOf1O
f2 ←→ p0fOf
1Ot2 αw, βw
Ra + p0fOt1O
f2 ←→ p0fOt
1Ot2 αc, βc
Sfree + p0fOt1O
f2 −→ p0fOf
1Of2 +Ri γ
Sfree + p0fOt1O
t2 −→ p0fOf
1Ot2 +Ri γ
Sfree + p0fOf1O
t2 −→ p0fOf
1Of2 +Ri γ
Sfree + p0fOt1O
t2 −→ p0fOt
1Of2 +Ri γ
p0fOt1O
f2 −→ p0fOf
1Of2 kdp
p0fOt1O
t2 −→ p0fOf
1Ot2 kdp
p0fOf1O
t2 −→ p0fOf
1Of2 kdp
p0fOt1O
t2 −→ p0fOt
1Of2 kdp
Fluxes calculation
PoPSout = k2p0tOf
1Of2
PoPSoutlk = klk2 (p0fOf
1Ot2 + p0fOt
1Of2 + p0fOt
1Ot2)
PoPSb = k1Polfreep0fOf
1Of2 − k−1p0
tOf1O
f2
20

FaPSba = αsR
a(p0fOf1O
f2 + p0fOf
1Ot2) +
+ αwRap0fOf
1Of2 + αcR
ap0fOt1O
f2 +
− βs(p0fOt
1Of2 + p0fOt
1Ot2)− βwp0fOf
1Ot2 +
− βcp0fOt
1Ot2
FaPSouti = γSfree(p0fOt
1Of2 + 2p0fOt
1Ot2 + p0fOf
1Ot2)
SiPSin = −FaPSouti
The YFP Pool
Species and fluxes
FaPSin flux of YFP from the corresponding mRNA PoolY FP YFP monomers
Reactions
FaPSin =⇒ Y FP
Y FP −→ kdp
Polymerase, ribosome, spliceosome, and IPTG Pools
These Pools do not contain any reaction. They store molecules not bound to the DNA or themRNA. The RNA Polymerase Pool exchanges a balance flux with each promoter in the nucleusand gets an input flux from every terminator; the ribosome Pool exchanges a balance flux and getsan input flux from each mRNA Pool in the cytoplasm; the spliceosome Pool exchanges a balanceflux with each coding region, the IPTG Pool exchanges a balance flux with the LacI Pool andsends an output flux to the pLacOp2 promoter. Since a balance flux is the sum of an input andan output flux, the dynamics of the free molecules stored in these Pool is given by the followingordinary differential equation:
dmoleculesfree
dt= fluxin − fluxout = fluxb
AND lacOp-tetOp
The AND lacOp-tetOp gate differs from the YES lacOp2 gate for the presence in the nucleusof a third transcription unit producing TetR and the promoter leading the synthesis of Citrine(pLacOpTetOp). Here, we give the modelling of the only pLacOpTetOp promoter since the modelsof the other Parts and Pools in the circuit are identical to the ones presented above.
21

Regulated pLacOpTetOp promoter
Species and fluxes
Polfree RNA polymerases available in their PoolRa1 free active LacI available in their PoolRi1 free inactive LacIRa2 free active TetR available in their PoolRi2 free inactive TetRS1 IPTG molecules available in their PoolS2 tetracycline molecules available in their Pool
p0fOf1O
f2 completely free promoter
p0tOf1O
f2 RNA polymerase bound to the promoter
p0fOt1O
f2 LacI bound to its target operator O1
p0fOf1O
t2 TetR bound to its target operator O2
p0fOt1O
t2 LacI bound to O1 and TetR bound to O2
Polcl RNA polymerase in the promoter cleaning phasePolcllk RNA polymerase in the promoter cleaning phase due to promoter leakagePoPSb exchanged with the polymerase PoolPoPSout sent to the YFP coding regionPoPSout
lk sent to the YFP mRNA Pool in the cytoplasmFaPSb1
a flux of active LacI exchanged with the LacI PoolFaPSb2
a flux of active TetR exchanged with the TetR PoolFaPSout1
i flux of inactive LacI sent to the LacI PoolFaPSout2
i flux of inactive TetR sent to the TetR PoolSiPSin1 flux of IPTG molecules from their PoolSiPSin2 flux of tetracycline molecules from their Pool
Reactions
Polfree + p0fOf1O
f2 ←→ p0tOf
1Of2 k1, k−1
p0tOf1O
f2 −→ p0fOf
1Of2 + Polcl k2
Ra1 + p0fOf1O
f2 ←→ p0fOt
1Of2 αlac, βlac
Ra1 + p0fOf1O
t2 ←→ p0fOt
1Ot2 αlac, βlac
Ra2 + p0fOf1O
f2 ←→ p0fOf
1Ot2 αtet, βtet
Ra2 + p0fOt1O
f2 ←→ p0fOt
1Ot2 αtet, βtet
S1 + p0fOt1O
f2 −→ p0fOf
1Of2 +Ri1 γlac
S1 + p0fOt1O
t2 −→ p0fOf
1Ot2 +Ri1 γlac
S2 + p0fOf1O
t2 −→ p0fOf
1Of2 +Ri2 γtet
S2 + p0fOt1O
t2 −→ p0fOt
1Of2 +Ri2 γtet
p0fOt1O
f2 −→ p0fOf
1Of2 kdp
p0fOt1O
t2 −→ p0fOf
1Ot2 kdp
p0fOf1O
t2 −→ p0fOf
1Of2 kdp
p0fOt1O
t2 −→ p0fOt
1Of2 kdo
22

Fluxes calculation
PoPSout = k2p0tOf
1Of2
PoPSoutlk = klk2 (p0fOf
1Ot2 + p0fOt
1Of2 + p0fOt
1Ot2)
PoPSb = k1Polfreep0fOf
1Of2 − k−1p0
tOf1O
f2
FaPSb1a = αlacR
a1(p0fOf1O
f2 + p0fOf
1Ot2) +
− βlac(p0fOt
1Of2 + p0fOt
1Ot2)
FaPSb2a = αtetR
a2(p0fOf1O
f2 + p0fOt
1Of2 ) +
− βtet(p0fOf
1Ot2 + p0fOt
1Ot2)
FaPSout1i = γlacS
1(p0fOt1O
f2 + p0fOt
1Ot2)
FaPSout2i = γtetS
2(p0fOf1O
t2 + p0fOt
1Ot2)
SiPSin1 = −FaPSout1i
SiPSin2 = −FaPSout2i
Notice that the model for the pLacOp promoter used in our computational analysis is the sameas the one for pLacOpTetOp after removing the O2 operator.
23

24

Bibliography
[1] A. Belle, A. Tanay, L. Bitincka, R. Shamir, and E. K. O’Shea. Quantification of protein half-lives in the budding yeast proteome. Proc Natl Acad Sci U S A, 103(35):13004–13009, Aug2006.
[2] D. Endy, I. Deese, and the MIT Synthetic Biology Working Group. Adventures in SyntheticBiology. Appeared in Foundations for engineering biology p449, Nature 438, 449-453, 2005.
[3] P. Jorgensen, N. P. Edgington, B. L. Schneider, I. Rupes, M. Tyers, and B. Futcher. The sizeof the nucleus increases as yeast cells grow. Mol Biol Cell, 18(9):3523–3532, Sep 2007.
[4] P. Jorgensen, J. L. Nishikawa, B.-J. Breitkreutz, and M. Tyers. Systematic identification ofpathways that couple cell growth and division in yeast. Science, 297(5580):395–400, Jul 2002.
[5] M. A. Marchisio, M. Colaiacovo, E. Whitehead, and J. Stelling. Modular, rule-based modelingfor the design of eukaryotic synthetic gene circuits. BMC Syst Biol, 7:42, 2013.
[6] M. A. Marchisio and J. Stelling. Computational design of synthetic gene circuits with com-posable parts. Bioinformatics, 24(17):1903–1910, Sep 2008.
[7] M. A. Marchisio and J. Stelling. Simplified computational design of digital synthetic genecircuits. In K. R. G.-B. Stan, V. Kulkarni, editor, System Theoretic and Computational Per-spectives in Systems and Synthetic Biology (in press). Springer-Verlag, 2013.
[8] T. T. Marquez-Lago and M. A. Marchisio. Synthetic biology: Dynamic modeling and con-struction of cell systems. In M. Georgiadis, J. Banga, and E. Pistikopoulos, editors, DynamicProcess Modeling, volume 7 of Process Systems Engineering., pages 493–544. WILEY-VCH,2010.
[9] S. E. Munchel, R. K. Shultzaberger, N. Takizawa, and K. Weis. Dynamic profiling of mrnaturnover reveals gene-specific and system-wide regulation of mrna decay. Mol Biol Cell,22(15):2787–2795, Aug 2011.
25