in-flight performance analysis of direct rf sampling
TRANSCRIPT
978-1-5386-2014-4/18/$31.00 ©2018 IEEE
1
In-Flight Performance Analysis of Direct RF Sampling
Architecture Applied to VHF Band Avionics Anh-Quang Nguyen, Abdessamad Amrhar, Alireza Avakh Kisomi, Xiaoxing Fang, René Jr Landry
Department of Electrical Engineering, École de Technologie Superieure (ÉTS) Laboratory of Space Technologies, Embedded Systems, Navigation and Avionic (LASSENA)
Montreal, QC, CANADA, H3C 1K3 514-396-8506
[email protected], [email protected], [email protected], [email protected], [email protected]
Abstract—For the future aviation industry, one of the most important requirements is simplifying the RF avionics, whilst increasing the security and performance of the current systems. Among the solutions, Direct RF Sampling (DRFS) architecture can be considered as one of the most promising. With the advantages of Local Oscillator (LO) mixer reduction and multi-system architecture compatibility, Direct RF architectures can significantly reduce the RF components between the antenna and the receiver, while at the same time support multiple avionics in parallel in just one single platform. As part of the AVIO-505 project, applications of DRFS architecture in VHF band avionics have been studied, specifically in VHF Omnidirectional Range (VOR), Instrument Landing System (ILS), VHF Radio, Emergency Locator Transmitter (ELT) and ACARS. Along with the laboratory experiments in a controlled environment using certified equipment (Aeroflex IFR-4000), a series of flight tests on a Cessna 172 have been conducted. As the main objectives of this paper, the results of these tests are presented and analyzed, which demonstrate the feasibility and capability of this innovative architecture in avionics. Furthermore, the potential of this architecture in other bands is discussed with an example in Automatic Dependent Surveillance-Broadcast (ADS-B)-In application, in which the jitter problem and its solution are presented in detail.
TABLE OF CONTENTS
1. INTRODUCTION ....................................................... 1 2. DRFS ARCHITECTURE IN RX AND TX ................. 3 3. TESTS PREPARATION AND CONDUCTION .............. 4 4. SIGNAL PROCESSING FLOWCHART ....................... 8 5. PERFORMANCE ANALYSIS ..................................... 9 6. DRFS ADS-B INTEGRATION AND ANALYSIS ...... 15 7. CONCLUSION......................................................... 16 APPENDIX .................................................................. 17 ACKNOWLEDGEMENTS ............................................ 18 REFERENCES ............................................................ 18 BIOGRAPHY .............................................................. 19
1. INTRODUCTION
In the recent years, avionics, and aviation industries in general, have become one of the main technology development focus, in order to respond to the significant increasing demands of the market and to self-adapt with new security requirements and new applications. The development of avionics leads to many side effects, one of
which is the complexity of the RF Front-End. The current avionics spectrum covering the Communication, Navigation and Surveillance systems spreads from HF, VHF (Marker Beacon, VOR, Localizer, VHF Data Broadcast), to UHF (Glide Slope, Emergency Locator Transmitter, Universal Access Transceiver, ADS-B, Global Positioning System, etc.) and even higher (Radar, SatCom, WiMAX, ). Due to the natural difference in characteristics of each system, and with the limitation of current-in-use architecture (Zero-IF or Superheterodyne), a unique specific RF Front-End is assigned for each avionics. Consequently, a complete RF avionics in modern aircraft is heavy and complicated, requires a lot of space , and thus reduces the general efficiency in Size, Weight, Power and Cost (SWAP-C). According to some well-known aircraft design documents [1, 2], RF avionics, in general, occupy up to 4 to 5 % of total weight and 8 to 10 % of total basic cost of an airplane (up to 30 to 35 % for modern and combat aircraft).
Aware of this problem, various efforts have been made to increase the SWAP-C efficiency of the RF avionics. For example, the concept of Integrated Modular Avionics (IMA) has been introduced in avionics since 2000, aiming at increasing the ratio of resources sharing and multi-system integration in one single platform [3]. However, due to the nature of the RF architecture, each system still requires a separated filter, LO mixer to down-convert/up-convert the signals and a unique Analog-Digital Converter (ADC) to sample the Signal-of-Interest (SOI). As a result, a complete avionics multimode receiver in one architecture cannot be fully achieved.
With the latest available high sampling rate/ high-resolution ADC and Digital-Analog Converter (DAC), a new RF architecture has been studied. In its first publication, Akos et al. showed that their receiver based on “direct bandpass sampling”, as they named it, successfully captured both GPS and GLONASS signals [4]. Several years later, also in GPS applications, Psiaki et al. demonstrated that the Direct RF architecture could have an equivalent performance compared with the conventional Superheterodyne [5, 6]. Recently, this conclusion was confirmed by G. Lamontagne, with the first real-time DRFS GNSS receiver prototype. As mentioned in his thesis [7] and summarized in [8], although suffering from the jitter problem, the performance of the DRFS receiver can meet some state-of-the-art commercial GNSS receivers.

2
As discussed and described in the above studies and others [9-11], the advantages of DRFS can be summarized into three main points. First of all, since LO mixer is replaced by Digital Down Converter (DDC) for down-converting the SOI, DRFS architecture avoids the well-known problems at this stage, namely DC offset, IQ imbalance, LO leakage, etc. Secondly, since no particular RF components are needed to achieve this state of performance, while reducing the IF stages, the RF Front-End of this architecture can be significantly simplified. Figure 1 presents an overview of this major difference between the conventional architecture and the one using DRFS technique. Thirdly and more importantly, using the “folding effect” [10], the wide 1st Nyquist zone after sampling can contain multiple aliases of different SOIs. As long as there is no collision between these aliases and interference, they can be processed simultaneously downstream in digital domain. Therefore, DRFS is completely compatible with a multi-SOI-in-one RF platform.
For the first time in 2015, Yeste-Ojeda and Landry proposed the utilization of Direct RF Architecture in avionics [12]. As described in their work, a combination between Software Defined Radio (SDR) and DRFS with an ADC at 140 MHz can cover most of the avionics in VHF bands, including, but not limited to VOR, ILS, ACARS, and VHF Radio. Following this study, different efforts have been made to evaluate and verify the feasibility of the utilization of DRFS in avionics. In a recent series of publications [13-15], they have demonstrated that the DRFS approach could meet the required sensitivity of the VHF avionics targets. Furthermore, the DRFS architecture can also offer advantages in transmission as well, as shown for Emergency Locator Transmitter (ELT 121.5 MHz and ELT 406.025 MHz) and VHF Radio. A summary of the laboratory results related to all of the VHF avionics developed in DRFS platform can be found in Table 1. It is important to note that all of the RX results can be obtained simultaneously in reception using just one ADC at 140 MHz.
Even though the laboratory results showed promising capabilities of DRFS in avionics, they are not enough to conclude the real performance of the proposed architecture. The lack of different types of interferences, from out-of-interested signals to multipath, fading and Doppler effects, is one of the limitations of these experiments. Also, these in-lab results cannot show the compatibility of this DRFS architecture with the currently in-use avionics components. Therefore, flight tests should be taken as a crucial requirement in this research. Since the first publication in 2015 and after integrating the fundamental functions, a series of ground and flight tests have been done, using a Cessna 172 as the flight test airplane. The objectives of this paper are focused on analyzing the results of these real-world tests, concentrating on VOR, LOC, GS, VHF Radio and analog ELT. Following the description of the developed platform, the system installation in the airplane, the flight tests scenarios and the procedure for flight data post-processing, the flight tests results show the feasibility and robustness of the DRFS avionics in the real world flight scenarios.
Antenna + Filters +
Combiner
DDCDDC
FPGA
General Purpose Processing Unit
(GNU Radio)
Pre-Processing Unit
DRFS architecture
ADC
Antenna + Filters
General Purpose Processing Unit
Pre-Processing Unit
IF Filters
ADC
DDCDDC
DDCDDC
Conventional architectureConventional architecture
ADC
MixerMixer
LO Mixer
IF Stages
Antenna + Filters +
Combiner
DDC
FPGA
General Purpose Processing Unit
(GNU Radio)
Pre-Processing Unit
DRFS architecture
ADC
Antenna + Filters
General Purpose Processing Unit
Pre-Processing Unit
IF Filters
ADC
DDC
DDC
Conventional architecture
ADC
Mixer
LO Mixer
IF Stages
Figure 1. Conventional and DRFS architectures (Adapted from [15])
Table 1. Laboratory DRFS Architecture Performance [13-15]
System Parameters Standard Result
VOR
Sensitivity −93 dBm −94 dBm
Dynamic Range 66 dB 69 dB
Localizer (LOC)
Sensitivity −87 dBm −78 dBm
Dynamic Range 54 dB 54 dB
Glide Slope (GS)
Sensitivity −78 dBm −82 dBm
Dynamic Range 45 dB 57 dB
Marker Beacon
Sensitivity −61 dBm −68 dBm
Dynamic Range 25 dB 35 dB
ACARS
Sensitivity (RX)
−100 dBm
−85 dBm
SINAD (TX) 6 dB 21.22 dB
VHF Radio
Sensitivity (RX)
−100 dBm
−85 dBm
SINAD (TX) 6 dB 21.22 dB
ELT 121.5 MHz
Verified by IFR-4000
ELT 406.025 MHz
Verified by IFR-4000

3
In this paper, the next section presents the concept of the DRFS architecture in transmission and reception modes, and the developed RF Front-End used during both ground and flight tests. In Section 3, a summary of the flight test configuration and flight test scenarios are provided. Section 4 focuses on the post-test analysis procedure, including the estimation of the radial (VOR), the difference in modulation (ILS), received power estimation (VOR, ILS, VHF Radios), error analysis (VOR, ILS), etc. Based on these procedures and metrics, Section 5 analyzes the obtained results of each system from each flight. From the GPS data, the reference corresponding to VOR Radial, LOC, and GS can be calculated, and will be compared with the measured values of DRFS to verify the performance of the latter. After showing the feasibility of the current VHF DRFS system, this paper will demonstrate the possibility of expanding the results to other avionics bands, with ADS-B In as the first candidate. Section 6 will, therefore, explain the integration of ADS-B into DRFS, with some laboratory results using Aeroflex IFR-6000. The limitation of this integration due to clock jitter and the folding effect is also analyzed in this Section, as a reference for further research. Finally, Section 7 will conclude the paper based on the previous sections and provide the future work possibilities to imporve further the performance of the DRFS avionics architecture.
2. DRFS ARCHITECTURE IN RX AND TX
As one of the most well-known theories of digital signal processing (DSP), the Nyquist sampling theory states that to avoid losing information when sampling a signal with a frequency of �, the sampling rate �� needs to be at least twice this value, i.e. �� ≥ 2�. For a long time, this theory had set a limitation for the advance of DSP and led to the development of various RF receiver architectures, such as Heterodyne, Zero-IF, Superheterodyne, Low-IF, etc. Even though each of these receivers has their own advantages and disadvantages, their performance strongly depends on the LO mixer, which down-converts/up-converts between baseband and high transmitted frequency. Depending on the architecture, some problems related to this component can be identified, including, but not limited to, DC offset, frequency offset, LO leakage, IQ imbalance [16, 17]. Various efforts have been made to compensate these problems, however, as a rule, the higher the requirements of a system has, the more complicated it will be.
The appearance of high sampling rate/high-resolution ADC/DAC introduced a new theory for sampling technique. Bandpass Nyquist criterion states that the signal in a carrier of �, with a bandwidth of � can be extracted correctly in digital domain as long as the sampling rate �� is twice the bandwidth, i.e. �� ≥ 2� [4]. This criterion is remarkable, since in general the bandwidth of an SOI compared to its carrier is significantly small. Thus, it reduces the required minimum sampling rate of the ADC in receiver. This is the fundamental of a technique known as under-sampling (sub-sampling). More importantly, thanks to the folding effect, after sampling, the alias of the SOI in any Nyquist zones can
be located in the first zone, and can be processed to get the carried data. With a sampling rate of ��, the bandwidth of this first Nyquist zone will be ��/2. Without collision between the aliases of the SOI and the interference, a high sampling rate ADC can offer a wide enough first Nyquist zone to cover multiple SOI at the same time. In digital domain, Digital Mixers will separate these aliases into channels, and the process downstream can be done in parallel for each channel. As a result, a multi-system architecture can be implemented without the need of complicated analog supporting RF components and IF-stages. Figure 2 illustrates the above-mentioned idea, taking an example of three SOI f1, f2 and f3 in 1st, 2nd and 4th Nyquist zone, respectively.
Unlike the reception part, which offers a one-ADC-multiple-parallel-application approach, the transmission in DRFS architecture is still limited by the number of DAC in each platform. However, instead of using LO mixer to up-convert analog signal from baseband to transmitted frequency, DRFS also has a LO mixer free approach [15]. In this innovative architecture, these analog components are replaced by Digital Mixer/Interpolation filters in FPGA, before the DAC. After the DAC, in order to eliminate the unwanted aliases, a bandpass filter is required with proper amplification, if necessary.
Figure 3 shows a general view of the proposed DRFS architecture, with three most important components namely General Purpose Processor (GPP), SDR platform with high sampling rate ADC/DAC, and the analog components (antenna, filters, and combiners).
fs/2 fs 3fs/2 2fs
f1
f2
f3
f’1
f’3f’2
1st Zone 2nd Zone 3rd Zone 4th Zone
0
1st Zone
f’1
f’3f’2
0 fs/2
After mixing with f’1
After mixing with f’2
f’3-f’1
0
f’2-f’1
Low-pass filter
f’1-f’2
f’3-f’2
0
Low-pass filter
Figure. 2. Fundamentals of DRFS in reception

4
In this work, GNU Radio 1 is the core of the GPP, where all of the signal processing, logging, and control is done. Depending on the characteristics of each channel/application, different procedures should be designed. Detail descriptions of these procedures are presented in [14, 15].
3. TESTS PREPARATION AND CONDUCTION
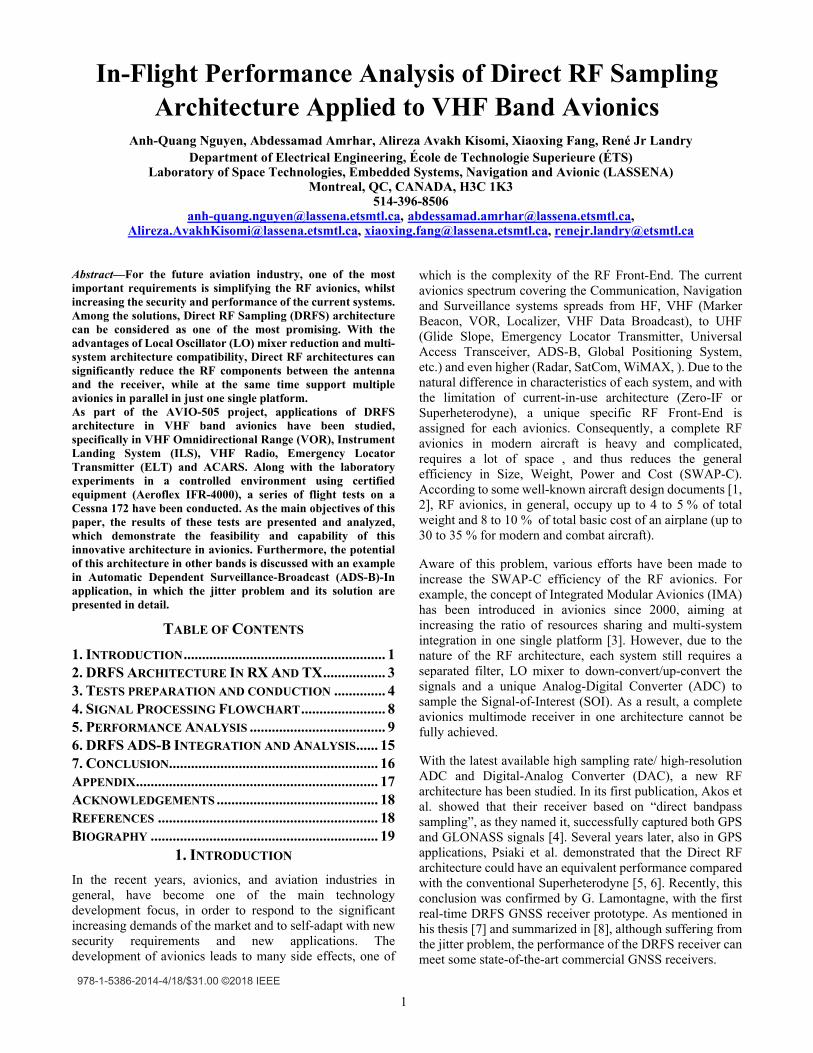
System Installation
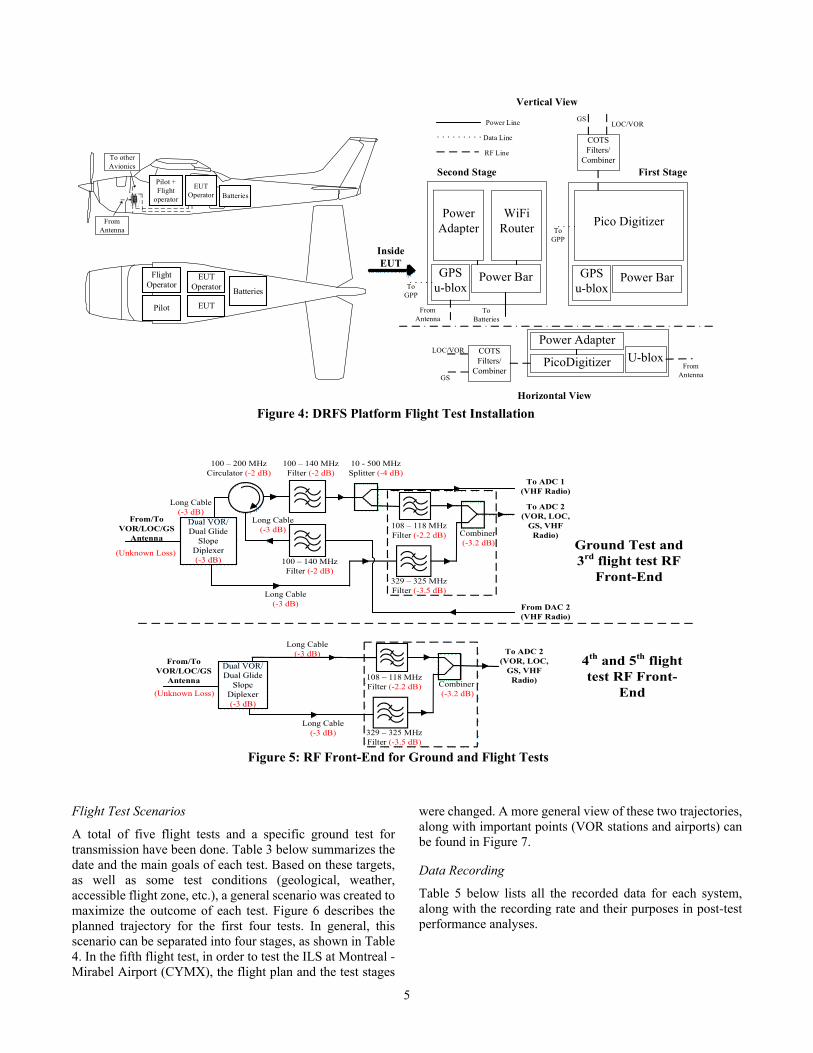
Figure 4 presents the position of the Equipment Under Test (EUT) and operators in the Cessna 172 for the flight tests. This configuration was carefully calibrated to make sure that the flight duration of each test is at least 90 minutes, and there should be no effect on the normal operating conditions of this plane. During the flight test, GPS data is provided by a u-blox M8-T receiver. Four of the most important parameters, which are latitude, longitude, altitude, and UTC, are recorded every second in the GPP as a part of the main system. The RF inputs of the EUT, which should be VOR, LOC, Glide Slope, VHF Radio are the corresponding VOR/LOC and GS output of a standard avionics duplexer (Comant Dual VOR / Dual Glide Slope Diplexer CI 1125). The RF losses of these analog components have been measured and are presented in Figure 5. Among these components, the narrow band filters (MCL BPF-A113, BPF-A332 for VOR/ILS and Glide Slope, respectively) and the combiners are crucial, since they will affect the performance of the system directly. As it can be seen in Figure 5, no amplifier is used, except a Low Noise Amplifier of 6 dB integrated into the SDR platform. In the transmission ground test, a second RF Front-End was
1 GNU Radio is a popular and widely used open-source SDR. Home site: https://www.gnuradio.org/
designed, as presented in Figure 5. This setup is used specifically for VHF Radio TX and ELT 121.5 MHz test, in which the output signal will be emitted through the antennas of the Cessna. A standard portable VHF/UHF Radio is used as a receiver to validate these output signals. The main difference between the two RF front-ends is the presence of a circulator to separate the TX from RX in the Ground Test. As it can be seen, this configuration is not optimized for this kind of test, since a great amount of loss can be predicted, concentrating on the duplexer, the circulator, and the antenna (VOR/LOC antenna). Therefore, the result of this test can only be used to validate the functionality of the testing system and its compatibility with the standard current-in-use avionics components. Table 2 below summaries the parameters related to the system in these flight test.
Table 2. DRFS System Summary
Parameters
ADC ADS62P49 @ 14 bits
DAC DAC5682Z @ 16 bits
Sampling Rate
140 MHz for ADC/DAC, FPGA
200 kHz for GPP
SDR Gain 6 dB of the embedded LNA
Antenna Antenna VOR/ILS default of Cessna 172,
with 3-5 dB gain omnidirectional.
Filters MCL BPF-A113, BPF-A332, Comant
CI125
Figure. 3. DRFS Avionics Transceiver Architecture
5
Flight Test Scenarios
A total of five flight tests and a specific ground test for transmission have been done. Table 3 below summarizes the date and the main goals of each test. Based on these targets, as well as some test conditions (geological, weather, accessible flight zone, etc.), a general scenario was created to maximize the outcome of each test. Figure 6 describes the planned trajectory for the first four tests. In general, this scenario can be separated into four stages, as shown in Table 4. In the fifth flight test, in order to test the ILS at Montreal - Mirabel Airport (CYMX), the flight plan and the test stages
were changed. A more general view of these two trajectories, along with important points (VOR stations and airports) can be found in Figure 7.
Data Recording
Table 5 below lists all the recorded data for each system, along with the recording rate and their purposes in post-test performance analyses.
Power Adapter
WiFi Router
Power BarGPS u-blox
To Batteries
From Antenna
To GPP
PicoDigitizer U-blox
Power AdapterLOC/VOR COTS
Filters/Combiner
GS
From Antenna
Pico Digitizer
Power BarGPS u-blox
LOC/VOR
COTS Filters/
Combiner
GS
To GPP
Power Line
Data Line
RF Line
Horizontal View
First StageSecond StagePilot + Flight
operator
EUT Operator Batteries
To other Avionics
From Antenna
Flight Operator
Pilot
EUT Operator
EUT
Batteries
Inside EUT
Vertical View
Figure 4: DRFS Platform Flight Test Installation
From/To VOR/LOC/GS
Antenna
(Unknown Loss)
Dual VOR/Dual Glide
Slope Diplexer(-3 dB)
100 – 140 MHz Filter (-2 dB)
10 - 500 MHz Splitter (-4 dB)
100 – 200 MHz Circulator (-2 dB)
108 – 118 MHz Filter (-2.2 dB) Combiner
(-3.2 dB)
329 – 325 MHz Filter (-3.5 dB)
Long Cable (-3 dB)
Long Cable (-3 dB)
To ADC 1 (VHF Radio)
To ADC 2 (VOR, LOC,
GS, VHF Radio)
From DAC 2 (VHF Radio)
100 – 140 MHz Filter (-2 dB)
Long Cable (-3 dB)
From/To VOR/LOC/GS
Antenna
(Unknown Loss)
Dual VOR/Dual Glide
Slope Diplexer(-3 dB)
Long Cable (-3 dB)
Long Cable (-3 dB)
108 – 118 MHz Filter (-2.2 dB) Combiner
(-3.2 dB)
329 – 325 MHz Filter (-3.5 dB)
To ADC 2 (VOR, LOC,
GS, VHF Radio)
Ground Test and 3rd flight test RF
Front-End
4th and 5th flight test RF Front-
End
Figure 5: RF Front-End for Ground and Flight Tests

6
Table 3. DRFS Flight Test Summaries
Date Objectives Results
12/2015 - Verify the COTS filters and combiner. - Check for interference and alias after sampling for a 250 MHz sampling rate ADC.
- Collision after sampling was detected. Therefore, an ADC at 250 MHz is not suitable.
3/2016
- Check for interference and alias after sampling for a 140 MHz sampling rate ADC. - Check the new FPGA using Infinite Impulse Response Filter. - Test integrated VOR.
- VOR signal of St. Jean Station (YJN) received. However, the results were unstable.
10/2016
- Test new FPGA using Infinite Impulse Response Filter for an ADC sampling at 140 MHz. - Test the modified VOR receiver in GPP. - Test the new integrated VHF Radio receiver. - Test the ILS at St. Hubert airport (CYHU).
(Analyzed and presented below) - VOR1 results for YJN were stable. - VHF Radio received and outputted the audio correctly. - VOR signals for other stations (YUL, YMX, etc) were too weak to have correct results. - ILS could not have reliable results.
4/2017
- Test new FPGA using CIC/FIR Filter with 140 MHz.ADC. - Test new FPGA with recently integrated Carrier Frequency Offset Tracker. - Test new version of FR Front-End. - Test 2 VORs, 2 VHF Radios, ILS.
(Analyzed and presented below) - VHF Radio audio for both systems. - VOR outputs for both systems. - No ILS detected for CYHU (under maintenance at that time)
5/2017
- Test new FPGA with modified DAGC. - Test 2 VORs, 2 VHF Radios. - Test ILS with CYUL when passing the area and with CYMX using normal and abnormal approach.
(Analyzed and presented below) - VHF Radio audio for both systems. - VOR outputs for both systems. - LOC results when passing CYUL. - LOC and GS results at CYMX
Table 4. Flight test scenario
Stage Duration Objectives
1. Take off and head to YJN
~20 min
- Test backward ILS (if possible). - Get maximum distance for VOR system and corresponding channel level. - Test VHF with ATIS and other VHF Radio channels
2. Holding at YJN
~45 min
- Holding in the area near YJN with different altitude (from 2000 to 5500 ft depending on the weather condition) - VOR1 fixed to YJN, and VOR2 varied between other nearby stations (YUL, YMX, BTV, YSC, MPV, BML, etc.)
3. Return to CYHU
~20 min
- Continue the test with VOR1 and VOR2 - Get maximum distance for VHF Radio and corresponding channel level.
4. ILS Test and Landing
~10 min
- Test ILS with normal and abnormal approaches. - Test VHF with ATIS and other VHF Radio channels
Fig. 6. 1st – 4th flight test plan

7
Table 5. Recorded data
System Data Recording rate (Hz)
Purposes
GPS - Ublox
Longitude 1 Position of the
plane synchronized with
UTC.
Latitude 1
Altitude 1
UTC Time 1
VOR
VOR 1 Frequency 4
Reference for VOR 1 Station
VOR 1 Radial 4
DRFS VOR 1 result
VOR 2 Frequency 4
Reference for VOR 2 Station
VOR 2 Radial 4
DRFS VOR 2 result
VOR 1, VOR 2
AGC lock 4
Verify the output of VOR 1
ILS
LOC Frequency 4
Reference for the Airport
Glide Slope
Frequency 4
LOC DDM 4 DRFS LOC result
Glide Slope DDM
4 DRFS GS result
ILS AGC lock 4
Verify the output of the ILS
VHF Radio
VHF 1, VHF 2
Frequency 4
Reference of VHF 1 output source
VHF 1 data 48 000
DRFS VHF 1 result
VHF 2 data 48 000
DRFS VHF 2 result
Other
VOR 1, VOR 2 level
1 Channel power
estimation
LOC level 1 Channel power
estimation Glide
Slope level 1 Channel power
estimation
VHF 1, 2 level 1
Channel power estimation
Fig. 7.DRFS Platform Flight Test Installation (Terrain view from Google Earth)

8
As it can be seen, besides the calculated output of each system and the corresponding frequency, some additional measurements are also recorded. For example, in order to calculate the signal input power in post-test processing (after the loss of the RF Front-End, as shown above), its level (1) is recorded. A reference table of these values as a function of real input power is created for each system, using a signal generator. With these data, the channel power for each frequency can be estimated when analyzing the results.
����� = 10 log�� ������ + ����� (1)
Moreover, in order to detect whether or not the received signal is above the noise level, an Automatic Gain Control (AGC) system is used. Inspired by the work of F. Bastide et al. [18] and Borowski et al. [19], a digital AGC in GNU Radio was modified and developed to detect the fluctuation of the gain in the channel. The output values are determined as reliable (lock) just when the variation of the gain in the AGC is in a specific range, calibrated for each system. In case of ILS, the output is marked as locked only when the channel power of both LOC and GS is above the ground noise.
4. SIGNAL PROCESSING FLOWCHART
Figure 8 describes the signal processing procedure from the recorded measurements to the results. It is categorized into three stages, namely pre-processing, processing and analyzing, with Python and MATLAB as the main programming languages.
Since the Cessna 172 does not support digital avionics to log the necessary data, the reference values are estimated from the GPS data (latitude, longitude, altitude) and the position of the reference points (VOR station, LOC, GS antenna, airport, etc.). The algorithms to calculate these references, along with other major equations, are presented below.
Latitude, Longitude, Altitude to distance
This calculation is inspired by the work of M. Sohrabinia2, with a modification to take into account the altitude values.
VOR
In order to analyze the performance of the VOR, the procedure below is developed: - From the recorded frequency, get the required data from the corresponding station (coordinates, inclination, etc.) and separated the input into different matrices based on these frequencies. Only the values with AGC lock as True are extracted. They are also decimated and synchronized with UTC to create 1 Hz output data. - Make the conversion between Geodetic and Earth Center Earth Fix (ECEF) Coordinate.
2 https://www.mathworks.com/matlabcentral/fileexchange/38812-latlon-distance?focused=5250973&tab=function
- Calculate the FROM radial, as shown in Figure 36 in the Appendix section of this paper. These radials are the estimated references for VOR. - Calculate the absolute difference (error) between the estimated radial and the measured one. The 3o is the limit of this difference, as indicated in the standards [20]. - Calculate the distribution, mean and standard deviation of the errors. - Analyze the results and make conclusions.
ILS
The procedure below is used to evaluate the performance of LOC/GS: - Locate the Latitude and Longitude of the antenna of the LOC (GS) system for the tested runway. The reference point is the middle point of the antenna array, using the database of Google Map. - From these positions, using the inclination value and the recommended track, calculate the desired radial of an ideal approach (LOC). In case of GS, from the reference point, a 3o line of desired altitude vs. distance can be created. - The two abovementioned steps are repeated with each recorded LOC frequency. The input data are then separated into multiple matrices using these frequencies, which will be processed independently afterward. They are also decimated and synchronized with UTC to create 1 Hz output data. - From the coordinates of the plane, calculate the radial to the ideal approach line. Then, the differences between this radial and the ideal radial can be calculated, which is then converted into DDM and/or dot (a standard unit for ILS, as used in the commercial indicator) to compare with the standard. - In case of GS, based on the distance and the altitude, one can calculate the current slope of the airplane with the reference point. The differences between these values and desired slope (normally 3o) are then converted into DDM and dot to compare with the standard. - Analyze the results and make conclusions.
VHF Radio
Unlike the two systems above, in the Equipement Under Test, VHF is recorded as audio files at a rate of 48 kHz, 10 minutes/file. In order to separate the period of voice data from the one with noise only, the procedure below is developed: - Analyze the data using Fast Fourier Transformation (FFT), detect those with the level above the threshold. - Estimate the Signal-to-Noise Ratio (SNR) of the level in each file using MATLAB functions. - Synchronize these files with level data and position using UTC and epoch time. - Analyze the results and make conclusions.

9
5. PERFORMANCE ANALYSIS
3rd Flight Test (October 25th, 2016)
In this flight test, during the holding stage at YJN (white path in Figure 7), four different altitude levels (2000, 2500, 3000, and 3500 feet) were tested.
Figure 9 shows the VOR1 results of this test, with the blue line as estimated references and red crosses as DRFS EUT outputs. It is important to note that these data are only the ones with lock AGC, as mentioned in Section 3. From these preliminary results, as well as the experience from the flight, some conclusions can be made: - DRFS has a robust performance, since the output of the system follow the estimated reference value. - During some short duration, normally when the plane crossing the uncertainty zone (0-360 degrees, 180 degree and From-To zone), the results need a few seconds to get back to the correct value. Even though this behavior is acceptable for the current-in-use system, some mechanisms need to be developed to reduce this effect. - Also, as observed by the Operator using FFT output in GNU Radio, there is an offset in frequency between the transmitted output of the station and the assigned frequency. A mechanism to track the correct frequency is a must to increase the performance of the system.
Further analysis of these results is shown in Figure 10, in which the absolute differences between the estimated reference and the measured output are calculated (red crosses). Comparing to the 3° standard (blue circles), it can
be seen that although the output of the DRFS avionics is acceptable (below 3o) in most of the time, in general, accept those in the uncertainty zones. For example, the sudden radical change, due to 0-360 degree crossing or frequency change, results in a drift of the outputs, increasing the error rate. Figure 11 presents the distribution of the errors in Figure 10 (dash line), showing a possibility of 28.054 % acceptable results (below 3o difference from the reference value), comparing to the requirements of 95 % [20, 21]. However, after eliminating the values in the uncertainty area (around 11 % of the database), this value rises up to around 40 % (black line in Figure 11).
Fig. 8. Data Management and Processing Procedures
Fig. 9. VOR1 Reference and DRFS Results (FT3)

10
Using the GPS coordinates and the channel input level data, Figure 12 can be created. As it can be seen, the maximum distance of the DRFS architecture to YJN station in this flight test as marked by the AGC is around 14.5 NM, with the corresponding channel level around −80 dBm. The small cover distance of DRFS system in this test can be explained by the RF Front-End before the ADC of the SDR. In fact, this test used the Ground Version of the RF Front-End, as presented in Section 3, resulting in a loss of at least 20 dB from the VOR/ILS/GS Diplexer to the ADC. The 6 dB gain from the LNA in the SDR is therefore not enough to compensate the loss, affecting the final performance of the system. This problem is also the reason for the bad results of VOR2 (no AGC lock was recorded) since the distance from the test zone to other VOR stations is at least 35.1 NM (YJN to YUL).
4th Flight Test (April 25th, 2017)
From the results of the 3rd test, various modifications had been made to increase the performance of the system. First of all, a new FFT Carrier Frequency Offset tracker was developed and installed [13]. This integration increased the general performance of all the developed avionics, in particular, it helped the VOR to reach the required sensitivity in laboratory test (as shown in Table 1). Secondly, new digital filters and algorithms were developed in GNU Radio to increase the robustness of the system, for example, a median filter. Furthermore, the IIR filters in FPGA of the 3rd test were replaced by new designed CIC/FIR to make places for the new FFT module and to increase the stability of the system. Finally, the problem of loss due to RF components was significantly reduced by simplifying the Front-End. By getting rid of the circulator and splitter shown in Figure 5, this new Front-End focused only on the RX of the DRFS system, reduce the unwanted loss in reception.
In this flight test, five flight levels were tested, from low to high as 2000, 3000, 4000, 5000, and 5500 feet. From the GPS
data, as well as the recorded outputs, using the same method of 3rd test, VOR1 results can be analyzed, as shown in Figure 13. Comparing to the previous results, it is worth noting an increase in performance of DRFS architecture, since now the measured output is more stable and followed the estimated reference closely. During the holding period with different flight levels, no unlock AGC was detected even in the From/To uncertainties zone. The two short discontinuous periods at the end of the curve is when the Engineer-In-Flight changed the VOR1 frequency to other stations. Right after changing back to YJN station, the system immediately went back to stable mode, without any fluctuation as the 3rd test.
Figure 14 and Figure 15 show the absolute difference distribution, respectively. The latter shows a possibility of 66.3 % value with an error less equal or below the 3° standards (dash line in Fig. 15). After eliminating the values
Fig. 11. Difference Distribution (FT3)
Fig. 12. VOR1 Estimated Input Level and Distance
(FT3)
Fig. 10. Differences between DRFS Outputs and References (FT3)

11
from the uncertainty zone (around 13 % of the data), this value reached 85 %. Even though the result is still below the requirements, there has been an improvement from the last flight, thanks to the new frequency offset tracker and the new filters. The new configuration of the DRFS architecture increases the maximum distance to 15.5 NM, with the minimum lock channel power for VOR1 YJN around −90 dBm, as it can be seen in Figure 16 and Figure 17. More importantly, AGC also marked as locked for VOR2 for YUL and YMX in certain periods during the tests, which are around 35 and 45 NM from the test zone, respectively. Figures 17 and 18 show the results of VOR2 for these stations. Although the accuracy is lower compared to VOR1, due to the low input level, there are some periods in which the outputs are stable and follow closely the estimated reference.
In this flight test, VHF Radio was also tested in two channels, namely VHF1 and VHF2. Depending on the current position of the airplane during the test, the frequency of these systems was changed between Automated Terminal Information Service (ATIS), Air Traffic Control (ATC), Approach and
VHF Ground Radio of CYHU and CYUL. With a threshold of −75 dBm and using the estimated channel level values, Figure 19 presents the points whereas these values above the threshold. Using the function “SNR” of MATLAB (sampling rate 48000, 1000-sample window size with a rolling of 500 samples), the max and min SNR of understandable output is ~15 dB and ~3 dB respectively.
5th Flight Test (May 25th, 2017)
Unlike the two abovementioned tests, the trajectory of the 5th test was changed to test the LOC and GS at Montreal – Mirabel International Airport (CYMX). Consequently, in this test, VOR1 was fixed to YUL VOR station at 116.3 MHz. Meanwhile, VOR2 frequency was varying between YMX and YJN. Figure 20 shows the trajectory of this test, with CYHU, CYUL, and CYMX represented by blue, red and cyan star, respectively.
Using the same procedure as the two tests above, the result of the 5th tests for VOR1 and VOR2 can be found in Figures 21 to 26. From these figures, it can be concluded that:
Fig. 14. Differences between DRFS Outputs and References (FT4)
Fig. 13. VOR1 Reference and DRFS Results (FT4)
Fig. 16. VOR1 Estimated Input Level and Distance (FT4)
Fig. 15. Difference Distribution (FT4)

12
- The DRFS measured results were very close to the estimated values. The possibility of errors equal or less than 3° is around 89 %, with the maximum distance of 24 NM and minimum channel power around −92 dBm. This real-world sensitivity is only 2 dB different from that of the control environment in Laboratory. Without the uncertainty results (~4 % of recorded data), the acceptable results rises up to 97 %, from the point AGC marked as locked. This value means that the VOR using DRFS architecture finally met the standards (95%) for a commercial VOR receiver. - VOR2 output is also improved, as shown for YMX. In case of YJN, the output is only acceptable with the distance is below 30 NM. Hence, 30 NM can be considered as the maximum distance of the current EUT using DRFS technique, unless integrating an LNA to increase the input level of the interested signal. - In case of VHF, as can be seen in Figure 27, the EUT properly detected and recorded the voice messages around CYHU and CYUL. The SNR of the understandable messages varies about 3 to 18 dB, estimated using MATLAB as mentioned above. Figure 39 in the Appendix presents the SNR result in one of the recorded file from the VHF Radio.
In this test, the LOC and GS integrated into the EUT were also tested, with the recorded data for both CYUL RWY 24R
and CYMX RWY 11. Figure 28 presents the measured LOC for the first when the plane is passing the runway on the route to CYMX. Figure 29 shows a detailed analysis of these results, with absolute error and distance. It can be seen that, at a distance of 14 NM, the EUT received and measured the DDM of LOC signal very stably. No GS signal was detected in the recorded data corresponding to this LOC.
Fig. 19. VHF Radios Detection (FT4)
Fig. 17. VOR2 Results for YUL (FT4)
Fig. 20. Flight Path with Important Stations (FT5)
Fig. 18. VOR2 Results for YMX (FT4)
Fig. 21. VOR1 Reference and DRFS Results (FT5)

13
After passing CYUL, as shown in the trajectory, the test was continued at CYMX. Using the GPS data, and with radial 113° reference for a standard approach, as mentioned in the document of Canada Air Pilot, Figure 30 can be calculated. As can be seen with the dark red circle, two approaches were made, with a duration around 300 seconds/approach. These values will be used to calculate the estimated reference for the measured values. Figure 31 shows the recorded results of the LOC during the ILS testing duration at CYMX for RWY 11. A more detail analysis between these outputs and the estimated reference is shown in Figure 31. Even though the DRFS (dark red circles) is fluctuated, they still follow the trend of the reference (blue circles). From these data, error can be estimated, as showed in the bottom left plot. On the right, the distance from the position of the airplane to the LOC antenna is shown. For two approaches, the result has an average absolute error around 0.2 – 0.3 degree, corresponding to 0.05 Difference in Depth of Modulation (DDM). This value for CYUL in Figure 29 is 0.025 DDM. This difference is above the standard for an airborne receiver (≤0.00455 DDM), however, considering the fact that the input level is lower than the laboratory sensitivity, it is understandable.
Using the GPS coordinates of the u-blox receiver, along with a standard 3° glide slope for an approach, one can estimate the reference GS value in degree. Figure 32 shows this result,
together with the measured outputs of DRFS EUT. Using these values, the absolute difference can be calculated, as shown at the bottom left. The estimated channel power at the corresponding time is displayed at the right. As it can be seen, the loss in GS band of the RF components discussed in Section 3 reduced the detection range of the receiver. In fact, before the point 14.75 (Hour), corresponding to a distance of 3 NM from the transmitter, the input power is below the ground noise, which is around −90 dBm. However, as it can be seen, when the input starts to go above the noise floor, the EUT results
Fig. 22. Differences between DRFS Outputs and References (FT5)
Fig. 23. Difference Distribution (FT5)
Fig. 25. VOR2 Results for YMX (FT5)
Fig. 26. VOR2 Results for YJN (FT5)
Fig. 24. VOR1 Estimated Input Level and Distance (FT5)

14
Fig. 27. VHF Radios Detection (FT5)
Fig. 28. CYUL LOC RWY 24R Results (FT5)
Fig. 29. CYUL LOC Performance Analysis (FT5)
Fig. 30. Estimated Radial for LOC Test at CYMX (FT5)
Fig. 31. CYMX LOC Performance Analysis (FT5)
Fig. 32. GS Error Analysis Results for YMX (FT5)
15
outputted are close to the reference, with an error of around 0.06 ° or 0.015 DDM, corresponding to a level of −88 dBm. This input level is below the requirement sensitivity (-77 dBm), and even below the sensitivity in laboratory of the EUT (-82 dBm), which can explain the low accuracy of the result.
Ground Test for VHF Radio TX and ELT 121.5 MHz (April
25th, 2017)
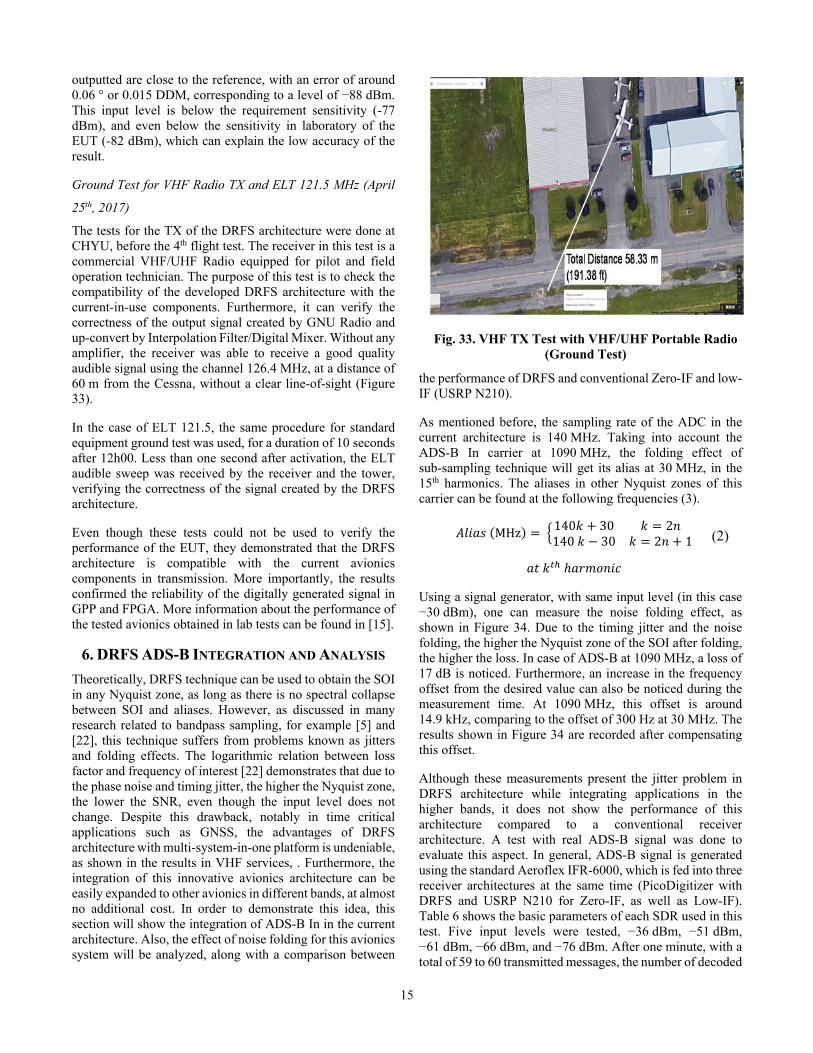
The tests for the TX of the DRFS architecture were done at CHYU, before the 4th flight test. The receiver in this test is a commercial VHF/UHF Radio equipped for pilot and field operation technician. The purpose of this test is to check the compatibility of the developed DRFS architecture with the current-in-use components. Furthermore, it can verify the correctness of the output signal created by GNU Radio and up-convert by Interpolation Filter/Digital Mixer. Without any amplifier, the receiver was able to receive a good quality audible signal using the channel 126.4 MHz, at a distance of 60 m from the Cessna, without a clear line-of-sight (Figure 33).
In the case of ELT 121.5, the same procedure for standard equipment ground test was used, for a duration of 10 seconds after 12h00. Less than one second after activation, the ELT audible sweep was received by the receiver and the tower, verifying the correctness of the signal created by the DRFS architecture.
Even though these tests could not be used to verify the performance of the EUT, they demonstrated that the DRFS architecture is compatible with the current avionics components in transmission. More importantly, the results confirmed the reliability of the digitally generated signal in GPP and FPGA. More information about the performance of the tested avionics obtained in lab tests can be found in [15].
6. DRFS ADS-B INTEGRATION AND ANALYSIS
Theoretically, DRFS technique can be used to obtain the SOI in any Nyquist zone, as long as there is no spectral collapse between SOI and aliases. However, as discussed in many research related to bandpass sampling, for example [5] and [22], this technique suffers from problems known as jitters and folding effects. The logarithmic relation between loss factor and frequency of interest [22] demonstrates that due to the phase noise and timing jitter, the higher the Nyquist zone, the lower the SNR, even though the input level does not change. Despite this drawback, notably in time critical applications such as GNSS, the advantages of DRFS architecture with multi-system-in-one platform is undeniable, as shown in the results in VHF services, . Furthermore, the integration of this innovative avionics architecture can be easily expanded to other avionics in different bands, at almost no additional cost. In order to demonstrate this idea, this section will show the integration of ADS-B In in the current architecture. Also, the effect of noise folding for this avionics system will be analyzed, along with a comparison between
the performance of DRFS and conventional Zero-IF and low-IF (USRP N210).
As mentioned before, the sampling rate of the ADC in the current architecture is 140 MHz. Taking into account the ADS-B In carrier at 1090 MHz, the folding effect of sub-sampling technique will get its alias at 30 MHz, in the 15th harmonics. The aliases in other Nyquist zones of this carrier can be found at the following frequencies (3).
����� (MHz) = �
140� + 30 � = 2�140 � − 30 � = 2� + 1
�� ��� ℎ�������
(2)
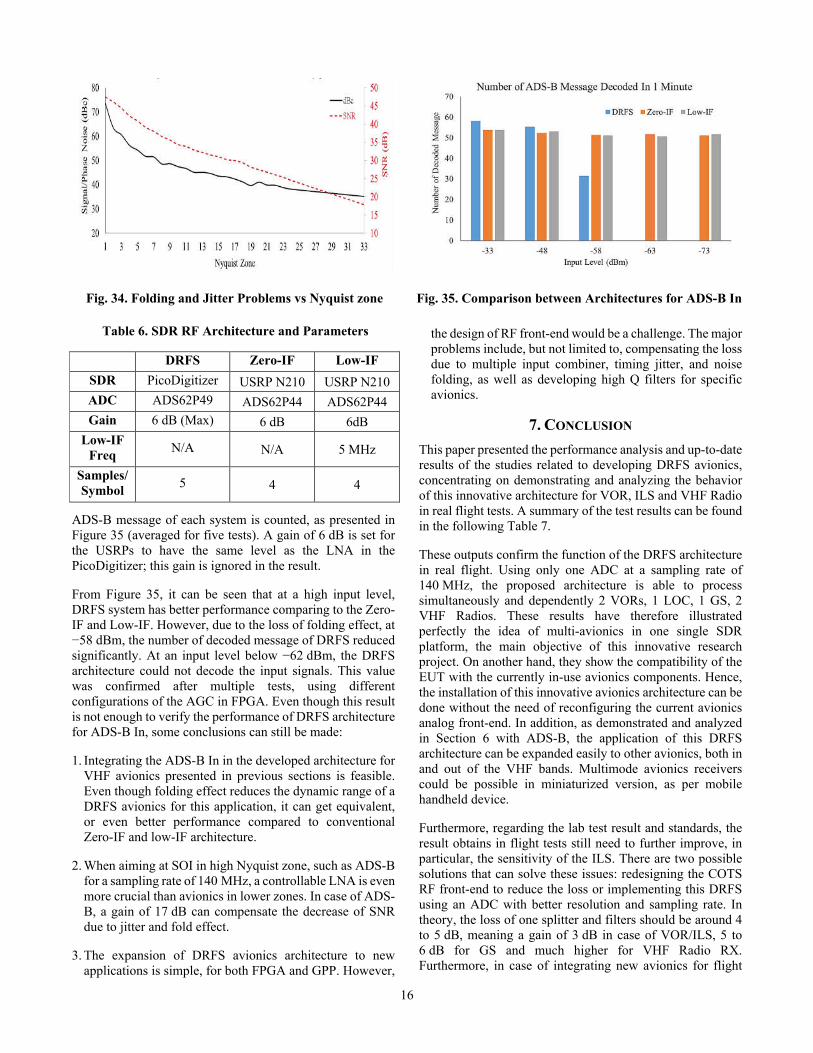
Using a signal generator, with same input level (in this case −30 dBm), one can measure the noise folding effect, as shown in Figure 34. Due to the timing jitter and the noise folding, the higher the Nyquist zone of the SOI after folding, the higher the loss. In case of ADS-B at 1090 MHz, a loss of 17 dB is noticed. Furthermore, an increase in the frequency offset from the desired value can also be noticed during the measurement time. At 1090 MHz, this offset is around 14.9 kHz, comparing to the offset of 300 Hz at 30 MHz. The results shown in Figure 34 are recorded after compensating this offset.
Although these measurements present the jitter problem in DRFS architecture while integrating applications in the higher bands, it does not show the performance of this architecture compared to a conventional receiver architecture. A test with real ADS-B signal was done to evaluate this aspect. In general, ADS-B signal is generated using the standard Aeroflex IFR-6000, which is fed into three receiver architectures at the same time (PicoDigitizer with DRFS and USRP N210 for Zero-IF, as well as Low-IF). Table 6 shows the basic parameters of each SDR used in this test. Five input levels were tested, −36 dBm, −51 dBm, −61 dBm, −66 dBm, and −76 dBm. After one minute, with a total of 59 to 60 transmitted messages, the number of decoded
Fig. 33. VHF TX Test with VHF/UHF Portable Radio (Ground Test)
16
ADS-B message of each system is counted, as presented in Figure 35 (averaged for five tests). A gain of 6 dB is set for the USRPs to have the same level as the LNA in the PicoDigitizer; this gain is ignored in the result.
From Figure 35, it can be seen that at a high input level, DRFS system has better performance comparing to the Zero-IF and Low-IF. However, due to the loss of folding effect, at −58 dBm, the number of decoded message of DRFS reduced significantly. At an input level below −62 dBm, the DRFS architecture could not decode the input signals. This value was confirmed after multiple tests, using different configurations of the AGC in FPGA. Even though this result is not enough to verify the performance of DRFS architecture for ADS-B In, some conclusions can still be made:
1. Integrating the ADS-B In in the developed architecture for VHF avionics presented in previous sections is feasible. Even though folding effect reduces the dynamic range of a DRFS avionics for this application, it can get equivalent, or even better performance compared to conventional Zero-IF and low-IF architecture.
2. When aiming at SOI in high Nyquist zone, such as ADS-B for a sampling rate of 140 MHz, a controllable LNA is even more crucial than avionics in lower zones. In case of ADS-B, a gain of 17 dB can compensate the decrease of SNR due to jitter and fold effect.
3. The expansion of DRFS avionics architecture to new applications is simple, for both FPGA and GPP. However,
the design of RF front-end would be a challenge. The major problems include, but not limited to, compensating the loss due to multiple input combiner, timing jitter, and noise folding, as well as developing high Q filters for specific avionics.
7. CONCLUSION
This paper presented the performance analysis and up-to-date results of the studies related to developing DRFS avionics, concentrating on demonstrating and analyzing the behavior of this innovative architecture for VOR, ILS and VHF Radio in real flight tests. A summary of the test results can be found in the following Table 7.
These outputs confirm the function of the DRFS architecture in real flight. Using only one ADC at a sampling rate of 140 MHz, the proposed architecture is able to process simultaneously and dependently 2 VORs, 1 LOC, 1 GS, 2 VHF Radios. These results have therefore illustrated perfectly the idea of multi-avionics in one single SDR platform, the main objective of this innovative research project. On another hand, they show the compatibility of the EUT with the currently in-use avionics components. Hence, the installation of this innovative avionics architecture can be done without the need of reconfiguring the current avionics analog front-end. In addition, as demonstrated and analyzed in Section 6 with ADS-B, the application of this DRFS architecture can be expanded easily to other avionics, both in and out of the VHF bands. Multimode avionics receivers could be possible in miniaturized version, as per mobile handheld device.
Furthermore, regarding the lab test result and standards, the result obtains in flight tests still need to further improve, in particular, the sensitivity of the ILS. There are two possible solutions that can solve these issues: redesigning the COTS RF front-end to reduce the loss or implementing this DRFS using an ADC with better resolution and sampling rate. In theory, the loss of one splitter and filters should be around 4 to 5 dB, meaning a gain of 3 dB in case of VOR/ILS, 5 to 6 dB for GS and much higher for VHF Radio RX. Furthermore, in case of integrating new avionics for flight
Fig. 34. Folding and Jitter Problems vs Nyquist zone
Fig. 35. Comparison between Architectures for ADS-B In
Table 6. SDR RF Architecture and Parameters
DRFS Zero-IF Low-IF
SDR PicoDigitizer USRP N210 USRP N210
ADC ADS62P49 ADS62P44 ADS62P44
Gain 6 dB (Max) 6 dB 6dB
Low-IF Freq
N/A N/A 5 MHz
Samples/Symbol
5 4 4

17
test, for instance, ADS-B In, LNA is a must to compensate the loss of combiners and folding effect.
As a second solution, the loss due to noise folding and time jitter can be minimized by using an ADC with higher resolution and sampling rate. For example, in case of a 16-bit ADC at 1 GHz sampling rate, all of the VHF applications will be located in the first Nyquist zone, which means no loss due to the folding. Moreover, UHF application, such as ADS-B will fall into the 3rd zone, resulting a gain around 12 dB in case of SNR and 17 dB for signal/phase noise, as shown in Figure 34. This gain, along with the two extra resolution bits, will provide a boost to improve further the performance of the proposed architecture. This innovative DRFS avionics will be then not only meet the requirements of corresponding systems but promising to pass over the performance level of current commercial modules.
Table 7. General Result Summary
VOR LOC GS VHF Radio
RX
Max Range (NM)
30 12 3 15
Error Distribution
~97 %
(< 3°)
~60 %
(< 0.05 DDMo)
~30 %
(< 0.015 DDMo)
N/A
Max Input Level (dBm)
−35 −60 −75 −65
Min Input Level (dBm)
−92 −88 −80 −79
Audible Output
N/A N/A N/A SNR≈ 3- 15 dB
APPENDIX
Fig. 36. From GPS Position to From Radial
Fig. 37. LOC (from CYUL) during the 5th flight
Fig. 38. VOR (from YUL) at 5000 ft
Fig. 39. Audio Result In of VHF Radio

18
ACKNOWLEDGEMENTS
The work presented in this paper is a part of the AVIO 505 project at LASSENA, ÉTS. It is supported by the Natural Sciences and Engineering Research Council of Canada (NSERC), the Consortium for Research and Innovation in Aerospace in Quebec (CRIAQ) as well as three main strategic partners, namely Bombardier Aerospace, MDA, and Marinvent Corporation.
REFERENCES
[1] J. Roskam, Airplane Design: Preliminary sizing of airplanes. DARcorporation, 1985.
[2] A. K. Kundu, "Aircraft Design," Cambridge University Press, 2010.
[3] P. J. Prisaznuk, "Integrated modular avionics," in Proceedings of the IEEE 1992 National Aerospace and Electronics Conference@m_NAECON 1992, 1992, pp. 39-45 vol.1.
[4] D. M. Akos, M. Stockmaster, J. B. Y. Tsui, and J. Caschera, "Direct bandpass sampling of multiple distinct RF signals," IEEE Transactions on Communications, vol. 47, no. 7, pp. 983-988, 1999.
[5] M. L. Psiaki, D. M. Akos, and J. Thor, "A Comparison of Direct Radio Frequency Sampling and Conventional GNSS Receiver Architectures," Navigation, vol. 52, no. 2, pp. 71-81, 2005.
[6] M. L. Psiaki, S. P. Powell, J. Hee, and P. M. Kintner, "Design and practical implementation of multifrequency RF front ends using direct RF sampling," IEEE Transactions on Microwave Theory and Techniques, vol. 53, no. 10, pp. 3082-3089, 2005.
[7] G. Lamontagne, "Conception et mise en oeuvre d'une tête de réception à échantillonnage direct RF pour les signaux de radionavigation par satellites - Design and Implementation of a Direct RF Sampling Receiver for GNSS," Master Thesis, Department of Electrical Engineering, École de Technologie Supérieure, Montreal, 2009.
[8] G. Lamontagne, R. J. Landry, and A. B. Kouki, "Direct RF sampling GNSS receiver design and jitter analysis," Positioning, vol. 3, pp. 46-61, 2012.
[9] G. Hill, "The benefits of undersampling," Electronic Design, pp. 69 - 79, July 1994.
[10] R. G. Lyons, Understanding Digital Signal Processing. Pearson Education, 2010.
[11] T. Neu, "Direct RF conversion: From vision to reality," Texas Instruments, Texas Instruments, White Paper May 2015 2015, Available: http://www.ti.com/lit/wp/slyy068/slyy068.pdf.
[12] O. A. Yeste-Ojeda and R. J. Landry, "Integrated direct RF sampling front-end for VHF avionics systems," in 2015 Integrated Communication, Navigation and Surveillance Conference (ICNS), 2015, pp. L1-1-L1-11.
[13] A.-Q. Nguyen, A. A. Kisomi, A. Amrhar, and R. J. Landry, "Integrated Avionics Frequency Tracking In Direct RF Sampling Front-End Using FFT," presented at the 2017 Integrated Communication, Navigation and Surveillance Conference (ICNS), 18-21 April 2017, 2017.
[14] A. Q. Nguyen, A. A. Kisomi, and R. J. Landry, "New architecture of Direct RF Sampling for avionic systems applied to VOR and ILS," in 2017 IEEE Radar Conference (RadarConf), 2017, pp. 1622-1627.
[15] A.-Q. Nguyen, A. A. Kisomi, A. Amrhar, and R. J. Landry, "Direct RF Sampling Transceiver Architecture Applied to VHF Radio, ACARS, and ELTs," in Digital Avionics Systems Conference (DASC), 2017 IEEE/AIAA 36th, 2017.
[16] S. Mirabbasi and K. Martin, "Classical and modern receiver architectures," IEEE Communications Magazine, vol. 38, no. 11, pp. 132-139, 2000.
[17] H. Pekau and J. W. Haslett, "A comparison of analog front end architectures for digital receivers," in Canadian Conference on Electrical and Computer Engineering, 2005., 2005, pp. 1073-1077: IEEE.
[18] F. Bastide, Akos, D., Macabiau, C., Roturier, B., "Automatic Gain Control (AGC) as an Interference Assessment Tool," presented at the 6th International Technical Meeting of the Satellite Division of The Institute of Navigation (ION GPS/GNSS 2003), Portland, OR, September 9 - 12, 2003, 2003.
[19] O. I. Holly Borowski, Fredrik Marsten Eklof, Sherman Lo, Dennis Akos, "Detecting False Signals with Automatic Gain Control," GPS World, vol. 23, no. 4, pp. 38-43, 2012.
[20] RTCA Special Committee 153, "DO-196 Minimum Operational Performance Standards for Airborne VOR Receiving Equipment Operating within the Radio Frequency Range of 108-117.95 MHz," ed. Washington, DC: RTCA, Inc, 1986.
[21] International Civil Aviation Organization (ICAO), Annex 10 - Aeronautical Telecommunications. ICAO, 2006.
[22] A. Brown and B. Wolt, "Digital L-band receiver architecture with direct RF sampling," in Position Location and Navigation Symposium, 1994., IEEE, 1994, pp. 209-216.

19
BIOGRAPHY
Anh-Quang Nguyen is a 2nd-year master student at École de Technologie Supérieure (ETS) in Montreal, Canada. He received his B.E degree in Aeronautical Engineering from Ho Chi Minh University of Technology (Vietnam), with a diploma addendum from ISAE-ENSMA
(France). As a member of the AVIO-505 project at Laboratory of Space Technologies, Embedded Systems, Navigation and Avionic (LASSENA), he studies the application of Software Defined Radio in future avionics, in particular, the possibility of integrating Direct RF Sampling architecture.
Abdessamad Amrhar is currently a graduate research student at École de Technologie Supérieure of Montréal (Canada) and a member of LASSENA laboratory. He has a bachelor of science in electrical engineering and computer science from Ecole National des Science Appliquées of Marrakech (Morocco). His research interests are: embedded systems, avionics,
and digital communication. And he is working on design and implementation multi-mode software defined radio system for avionics.
Alireza Avakh Kisomi received his B.Sc. in Electrical Engineering from Iran University of Science and Technology, Tehran, Iran, in 2013. He received his Master’s degree in Electrical Engineering focusing on design of Biomedical Devices from Laval University, Quebec City, Canada, in 2017. As a
member of Laboratory of Space Technologies, Embedded Systems, Navigation and Avionic (LASSENA, ETS) he was the Project Manager of the AVIO-505 project, working on Software Defined Radio in future avionics.
Xiaoxing Fang is a Postdoctoral Research Fellow in the Department of Electrical Engineering at the École de Technologie Supérieure (ETS). She received her Bachelor degree in automation in 2002, her Master degree and Ph.D. degree in Navigation, Guidance and Control from Beihang University
(P.R. China). At the same time, she worked as an engineer of GNC in Research Institute of Unmanned Aerial Vehicle in Beihang University, which brings her years of design and development experiences in aerospace engineering, especially in flight management system, flight control law and flight simulation system. Currently, she works in the LASSENA laboratory. Her research focuses on Navigation and Guidance of Autonomous Vehicles for Application Safety.
René.Jr Landry received an electrical engineering degree at École Polytechnique of Montreal in 1992, a Master of Science in Satellite Communication engineering in 1993, a DEA in microwave in 1994 and a Ph.D. in GNSS anti-jamming at SupAero in 1998. Since 1999, he is professor at the department of electrical
engineering at École de Technologie Supérieure (ÉTS), and the director of LASSENA laboratory. His expertise in embedded systems, navigation and avionics is applied notably in the field of transport, aeronautic, and space technologies.

20