in extracellular dopamine concentration in freely...
TRANSCRIPT

Measurement of Phasic Dopamine with FSCV 443
443
From: Methods in Molecular Medicine, vol. 79: Drugs of Abuse: Neurological Reviews and ProtocolsEdited by: J. Q. Wang © Humana Press Inc., Totowa, NJ
31
Real-Time Measurements of Phasic Changesin Extracellular Dopamine Concentration in Freely Moving Rats by Fast-Scan Cyclic Voltammetry
Paul E. M. Phillips, Donita L. Robinson, Garret D. Stuber,Regina M. Carelli, and R. Mark Wightman
1. IntroductionRapid, transient changes in extracellular dopamine concentrations following
salient stimuli in freely moving rats have recently been detected using fast-scan cyclic voltammetry (1,2). This type of neurotransmission had not been previously observed (for any neurotransmitter), but has been implicated by electrophysiological studies. Schultz et al. (3) reported synchronous burst firing of midbrain dopaminergic neurons following presentation of liquid reinforcers or associated cues. Such firing patterns would predictably produce transient (lasting no more than a few seconds), high concentrations (high nanomolar) of extracellular dopamine in terminal regions. This phasic dopaminergic neurotransmission has been heavily implicated in associative learning and reward processing, and therefore may prove essential in understanding the reinforcing actions of drugs of abuse.
Fast-scan cyclic voltammetry is a real-time electrochemical technique that can detect dopamine by its redox properties. It is capable of monitoring monoaminergic neurotransmission in the brain on a subsecond time scale while providing chemical information on the analyte. This chapter describes how the properties of fast-scan cyclic voltammetry make it uniquely suitable for making chemical measurements of phasic dopaminergic neurotransmission in freely moving animals. To emphasize the potential of this technique, three examples of its use are highlighted. First we describe experiments testing

444 Phillips et al.
intracranial self-stimulation that provide information on dopamine’s role in reward. Next we show transient dopamine signals evoked by natural stimuli, and finally, we present preliminary data demonstrating transient dopaminergic neurotransmission during cocaine self-administration behavior.
2. Materials2.1. Electrochemistry
1. Multifunction input/output card: PCI-6052E (16 bit, 333 kHz) (National Instru-ments, Austin, TX).
2. Virtual instrumentation software: Locally written in LabVIEW (National Instru-ments).
3. Potentiostat: EI-400 (Cypress Systems, Lawrence, KS). 4. Headstage: Miniaturized current-to-voltage converter (UNC-CH Electronics
Design Facility, Chapel Hill, NC). 5. Swivel: CAY-675-12 (12 electrical and 1 fluid channel) (Airflyte, Bayonne, NJ).
The software we use for fast-scan cyclic voltammetry and data analy-sis will be marketed with data acquisition hardware and a potentiostat for fast-scan cyclic voltammetry: FAST-FSCV16, Quanteon, Lexington, KY (http://quanteon.cc/).
2.2. Electrical Stimulation
1. Digital-to-analog card: PCI-6711 (National Instruments). 2. Constant-current stimulator: Neurolog NL800 (Harvard Apparatus, MA).
2.3. Electrode Fabrication
1. Carbon fiber: T-650 (Thornel, Greenville, SC). 2. Capillary glass: 6245 (0.6 mm outer, 0.4 mm inner diameter) (A-M Systems,
Carlsborg, WA). 3. Vertical electrode puller: PF-2 (Narishige, Tokyo, Japan). 4. Micromanipulator (Fig. 2) (UNC-CH Machine shop). 5. Silver paint: 22-0202-0000 (Silver Print) (GC Electronics, Rockford, IL). 6. Heat shrink tubing: KYNAR 3/64-inch diameter, (3 M Electronics, Austin, TX). 7. Activated carbon: 102489 (NORIT A decolorizing carbon) (ICN Biomedicals,
Aurora, OH). 8. Silver wire: 32,702-6 (0.5 mm diameter) (Sigma, St. Louis, MO). 9. Gold connector: 46N6790 (socket pin terminal) (Newark Electronics,
Chicago, IL).
2.4. Surgery
1. Anesthetic: K-113 (ketamine HCl/xylazine HCl solution) (Sigma). 2. Stereotaxic frame: Model 900 Small Animal Stereotaxic (David Kopf Instru-
ments, Tujunga, CA).

Measurement of Phasic Dopamine with FSCV 445
3. Guide cannula: MD-2251 (locking, with stylet) (Bioanalytical Systems, West Lafayette, IN).
4. Anchor screws: O-80 × 1/8 (stainless steel, 3.2 mm) (Plastics One, Roanoke, VA). 5. Cranioplastic cement: 675571/2 (Grip Cement) (DENTSPLY Caulk, Mil-
ford, DE). 6. Stimulating electrode: MS303/2 (stainless steel, 0.2 mm, bipolar) (Plastics One).
2.5. Experiment
1. Video character generator (UNC-CH Electronics Design Facility).
2.6. Electrode Calibration
1. Dopamine HCl (Sigma H6,025-5). 2. Flow injection apparatus (Rheodyne, Rohnert Park, CA). 3. Tris-HCl buffer solution: 12.0 mM Tris-HCl, 140 mM NaCl, 3.25 mM KCl,
1.20 mM CaCl2, 1.25 mM NaH2PO4, 1.20 mM MgCl2, 2.00 mM Na2SO4,pH 7.40. Store at room temperature.
2.7. Data Analysis
1. Software: Locally written in LabVIEW (National Instruments).
2.8. Verification of Electrode Placement
1. Stainless steel electrode: 5725 (0.5 mm, 8° taper, 12 MΩ) (A-M Systems). 2. Stimulator: A360R/A362/PRO4 (World Precision Instruments, Sarasota, FL). 3. Paraformaldehyde: 4% Paraformaldehyde in phosphate buffer (80 mM Na2HPO4,
20 mM NaH2PO4), pH 7.4. Refrigerate. 4. Thionin stain: 1.75 mM Thionin acetate, 450 mM sodium acetate in 3.5% acetic
acid. Store at room temperature. 5. Potassium ferricyanide solution: 150 mM potassium ferricyanide in 10% HCl.
Make up fresh.
3. Methods3.1. Electrochemistry
Using real-time electrochemical techniques, dopamine can be monitored in brain tissue on the millisecond time scale (see Note 1). It can be electro-chemically detected at carbon fiber microelectrodes because at physiological temperature and pH it is oxidized by application of a relatively modest potential to the electrode. This reaction converts dopamine to its o-quinone by oxidation of the two hydroxyl groups of the catechol, thus liberating two electrons from each dopamine molecule. These electrons are measured at the electrode as (faradaic) current.
With fast-scan cyclic voltammetry, the carbon fiber microelectrode (see Note 2) is held at a nonoxidizing potential and then periodically driven to an
446 Phillips et al.
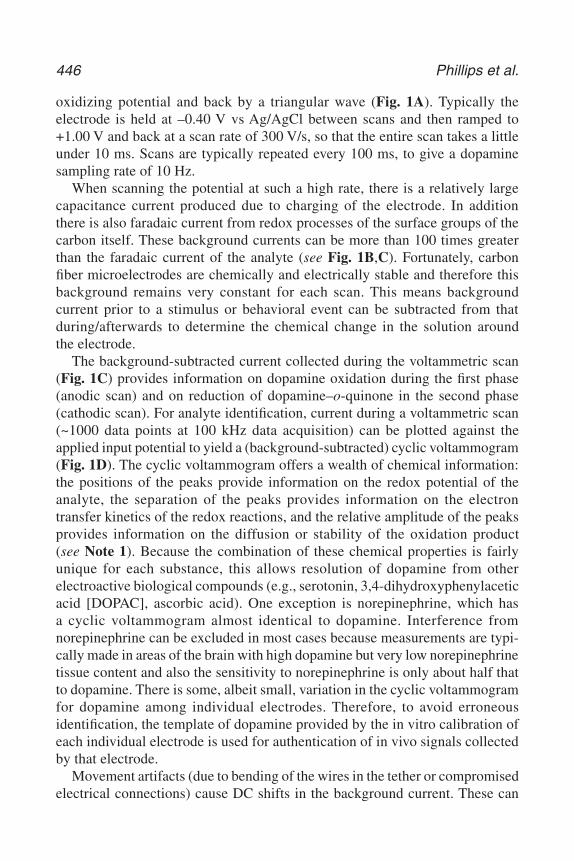
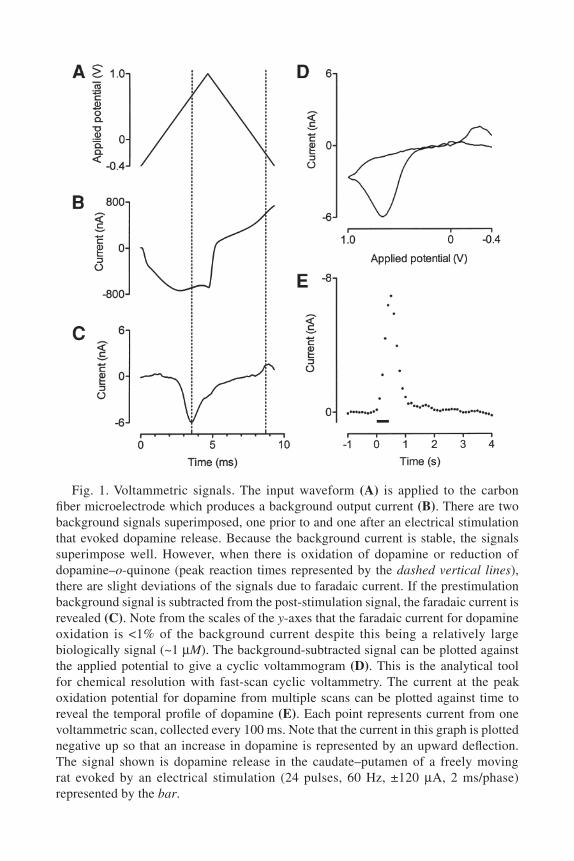
oxidizing potential and back by a triangular wave (Fig. 1A). Typically the electrode is held at –0.40 V vs Ag/AgCl between scans and then ramped to +1.00 V and back at a scan rate of 300 V/s, so that the entire scan takes a little under 10 ms. Scans are typically repeated every 100 ms, to give a dopamine sampling rate of 10 Hz.
When scanning the potential at such a high rate, there is a relatively large capacitance current produced due to charging of the electrode. In addition there is also faradaic current from redox processes of the surface groups of the carbon itself. These background currents can be more than 100 times greater than the faradaic current of the analyte (see Fig. 1B,C). Fortunately, carbon fiber microelectrodes are chemically and electrically stable and therefore this background remains very constant for each scan. This means background current prior to a stimulus or behavioral event can be subtracted from that during/afterwards to determine the chemical change in the solution around the electrode.
The background-subtracted current collected during the voltammetric scan (Fig. 1C) provides information on dopamine oxidation during the first phase (anodic scan) and on reduction of dopamine–o-quinone in the second phase (cathodic scan). For analyte identification, current during a voltammetric scan (~1000 data points at 100 kHz data acquisition) can be plotted against the applied input potential to yield a (background-subtracted) cyclic voltammogram (Fig. 1D). The cyclic voltammogram offers a wealth of chemical information: the positions of the peaks provide information on the redox potential of the analyte, the separation of the peaks provides information on the electron transfer kinetics of the redox reactions, and the relative amplitude of the peaks provides information on the diffusion or stability of the oxidation product (see Note 1). Because the combination of these chemical properties is fairly unique for each substance, this allows resolution of dopamine from other electroactive biological compounds (e.g., serotonin, 3,4-dihydroxyphenylacetic acid [DOPAC], ascorbic acid). One exception is norepinephrine, which has a cyclic voltammogram almost identical to dopamine. Interference from norepinephrine can be excluded in most cases because measurements are typi-cally made in areas of the brain with high dopamine but very low norepinephrine tissue content and also the sensitivity to norepinephrine is only about half that to dopamine. There is some, albeit small, variation in the cyclic voltammogram for dopamine among individual electrodes. Therefore, to avoid erroneous identification, the template of dopamine provided by the in vitro calibration of each individual electrode is used for authentication of in vivo signals collected by that electrode.
Movement artifacts (due to bending of the wires in the tether or compromised electrical connections) cause DC shifts in the background current. These can
Measurement of Phasic Dopamine with FSCV 447
Fig. 1. Voltammetric signals. The input waveform (A) is applied to the carbon fiber microelectrode which produces a background output current (B). There are two background signals superimposed, one prior to and one after an electrical stimulation that evoked dopamine release. Because the background current is stable, the signals superimpose well. However, when there is oxidation of dopamine or reduction of dopamine–o-quinone (peak reaction times represented by the dashed vertical lines), there are slight deviations of the signals due to faradaic current. If the prestimulation background signal is subtracted from the post-stimulation signal, the faradaic current is revealed (C). Note from the scales of the y-axes that the faradaic current for dopamine oxidation is <1% of the background current despite this being a relatively large biologically signal (~1 µM). The background-subtracted signal can be plotted against the applied potential to give a cyclic voltammogram (D). This is the analytical tool for chemical resolution with fast-scan cyclic voltammetry. The current at the peak oxidation potential for dopamine from multiple scans can be plotted against time to reveal the temporal profile of dopamine (E). Each point represents current from one voltammetric scan, collected every 100 ms. Note that the current in this graph is plotted negative up so that an increase in dopamine is represented by an upward deflection. The signal shown is dopamine release in the caudate–putamen of a freely moving rat evoked by an electrical stimulation (24 pulses, 60 Hz, ±120 µA, 2 ms/phase) represented by the bar.
448 Phillips et al.
be distinguished from faradaic current by their cyclic voltammogram because the change in current for such artifacts is in the same direction for the anodic and cathodic scans (unlike for a redox couple). Ionic changes in the media can also produce background shifts. These give current in opposite directions for the anodic and cathodic scans (like genuine redox couples). Their cyclic voltammograms have broad features, particularly at inflection points of the background current, and so they can be distinguished from electroactive analytes which generate sharp peaks.
Once dopamine has been chemically verified, the current at its peak oxida-tion potential (approx +0.60–0.70 V vs Ag/AgCl) can be plotted against time to reveal the temporal profile of dopamine concentration changes (Fig. 1E). This current is directly proportional to the concentration of dopamine at the electrode and can be converted to concentration by a factor obtained by in vitro calibration of the electrode with a dopamine stock solution (see below).
Because of the requirement for background subtraction, fast-scan cyclic voltammetry is a differential technique and therefore best suited for monitoring chemical changes that take place over seconds rather than minutes or hours. For this reason, it is not good at monitoring slow, tonic changes in dopamine concentration (unlike microdialysis). However, owing to its exquisite temporal resolution, along with its chemical resolving power, it is the foremost technique for the measurement of fast, phasic changes in dopamine concentration.
Waveform generation and electrochemical data acquisition are carried out on a personal computer with a multifunction input/output card using software locally written in LabVIEW. The waveform is applied to the carbon fiber microelectrode via a potentiostat. Current generated at the carbon fiber microelectrode is converted to voltage (200 nA/V) by a head-mounted current-to-voltage converter (headstage; Fig. 2), sent to the potentiostat where it is ampli-fied (2–10×) and low-pass filtered (2 kHz), and then acquired (100–333 kHz)on the personal computer. Connections between the potentiostat and the headstage are made through an electrical swivel.
3.2. Electrical Stimulation
By electrically stimulating dopaminergic neurons, a “snapshot” of the status of dopamine release and uptake can be taken. This strategy has been particularly useful for determining the neurochemical mechanisms involved in behavior following pharmacological manipulations (4,5). In experiments in which we wish to measure behaviorally evoked dopamine release, we employ electrical stimulations for optimization of the carbon fiber microelectrode placement into a dopamine-rich region. In addition, by electrically stimulating dopamine release before and after the experiment we not only get an in vivo template of dopamine at the carbon fiber microelectrode, but also verify that

Measurement of Phasic Dopamine with FSCV 449
the properties of the carbon fiber electrode and the recording site integrity have not changed during the course of the experiment. Electrical stimulation trains are generated on a personal computer with a digital-to-analog card using the data acquisition software. The stimulation is delivered to a stimulating electrode implanted in the rat brain (Fig. 2) using an optically isolated, constant-current stimulator (see Note 3). Connections between the stimulator and stimulating electrode are made through the swivel.
3.3. Electrode Fabrication
3.3.1. Carbon Fiber Microelectrodes
1. A single carbon fiber should be carefully inspected, and any noticeable debris removed (see Notes 4 and 5). The fiber is then aspirated into a borosilicate glass capillary, so that it extends from both ends.
2. The carbon fiber-filled capillary is pulled in an electrode puller. The magnet and heat settings should be optimized to ensure that the pulled glass forms a fluid-tight seal around the carbon fiber.
Fig. 2. Head-mounted apparatus for fast-scan cyclic voltammetry in freely moving rats. The left panel shows a rat that has been prepared for an experiment. A microma-nipulator containing a carbon fiber microelectrode is coupled to the guide cannula, the stimulator cable is connected, and the carbon fiber microelectrode and reference electrodes are connected to the headstage. In the right panel, the experimental apparatus was removed from the rat and a stylet inserted into the guide cannula. This is the state in which the rat is housed after surgery.

450 Phillips et al.
3. The exposed carbon fiber then needs to be cut with a sharp scalpel under a light microscope (~400× magnification) to a length of 75–150 µm. The electrode should also be inspected under the microscope for visible cracks or abnormalities in the fiber or glass seal, and discarded if any are present.
4. Trimmed carbon fiber microelectrodes are loaded into micromanipulators that can interface with the guide cannula implanted in the rat brain (Fig. 2). The electrode is inserted into the manipulator and a small diameter stainless steel wire, dipped in silver paint, is fed into the back of the capillary to make an electrical connection with the carbon fiber. The wire and capillary are then secured to the micromanipulator with heat shrink tubing.
5. The microelectrode is soaked in isopropanol for at least ten minutes, and then before use, the fidelity of the glass seal and the carbon fiber should be inspected once again under a light microscope.
3.3.2. Ag/AgCl Reference Electrodes
1. A piece of silver wire is cut to ~10 mm, inserted into the socket of a gold connector, and fixed with epoxy.
2. Once this has cured, the positive terminal of a 1.5-V battery is connected to the gold pin on the silver wire (anode) and the negative terminal to a stainless steel wire (cathode) immersed in a concentrated solution of hydrochloric acid (37%).
3. The silver wire is dipped into the hydrochloric acid for about 30 s until its surface becomes dark gray (bubbles should appear as gas is evolved during this process).
3.4. Surgery
3.4.1. Guide Cannula and Reference Electrode Implantations
1. The rat is anesthetized with intramuscular ketamine (80 mg/kg) and xylazine(12 mg/kg) and placed in a stereotaxic frame. The scalp is incised and retracted to reveal a 15–20 mm (longitudinal) and 10–15 mm (lateral) area of cranium.
2. Holes are drilled for the guide cannula, stimulating and reference electrodes and three anchor screws. The stimulating electrode can be positioned either in the dopaminergic cell bodies region (substantia nigra/ventral tegmental area;1.0 mm lateral and 5.2 mm caudal from bregma, ~8.5 mm ventral from dura mater) or the ascending fibers in the medial forebrain bundle (1.4 mm lateral and 4.6 mm caudal from bregma, ~8.5 mm ventral from dura mater). The guide cannula and stylet are trimmed to 2.5 mm past the plastic hub and positioned above the target area (e.g., 1.3 mm lateral and 1.3 mm rostral from bregma would be above the caudate–putamen and the core of the nucleus accumbens). The reference electrode is placed in the contralateral hemisphere opposite the guide cannula.
3. Once the guide cannula, reference electrodes and anchor screws are in place, they are secured with cranioplastic cement, leaving the stimulating electrode hole exposed.

Measurement of Phasic Dopamine with FSCV 451
3.4.2. Stimulating Electrode Implantation
1. The stimulating electrode is prepared by separating the tips by 0.8–1.0 mm and cutting (or filing) them to a uniform length. Dura mater is thoroughly cleared from the stimulating electrode hole and the electrode is stereotaxically lowered into the tissue oriented so that the tips of the electrode are splayed in the coronal plane (see Note 6). The electrode is lowered to 1 mm above the target, taking care that it does not deflect against bone at the side of the hole. The stylet is now removed from the guide cannula and replaced with a micromanipulator containing a carbon fiber microelectrode. The carbon fiber microelectrode is then lowered to the target dopaminergic terminal region.
2. The stimulating electrode is connected to the stimulator and the carbon fiber and reference electrodes to the headstage. The voltammetric waveform is then switched on. After allowing the carbon fiber to stabilize for several minutes, an electrical stimulation (60 biphasic pulses, 60 Hz, ±120 µA, 2 ms/phase) is applied through the stimulating electrode while dopamine is monitored at the carbon fiber microelectrode. The stimulating electrode is then lowered in 0.2-mm increments until dopamine efflux is detected following a stimulation. It is then lowered further in 0.1-mm increments until dopamine release is maximal.
3. Finally, cranioplastic cement is applied to the part of the cranium that isstill exposed, carefully covering the stimulating electrode and lower half of its plastic hub.
3.5. Experiment
3.5.1. Connecting the Tether
On the experiment day (see Note 7), all connectors are cleaned and the stylet is removed and replaced with a micromanipulator containing a carbon fiber microelectrode. The stimulator cable (on which the headstage is mounted) is connected and secured onto the stimulating electrode and the carbon fiber and reference electrodes are connected to the headstage (Fig. 2).
3.5.2. Positioning the Carbon Fiber Microelectrode
1. The carbon fiber microelectrode is slowly lowered into the brain and its output is observed on an oscilloscope. When the carbon fiber enters tissue the background current will be seen. The electrode is slowly lowered to just above the target tissue and allowed to stabilize for several minutes. If the electrode breaks, it will be apparent by a sudden change in the shape of the background current to a more resistive profile (approximating a triangular wave), and it should be removed and replaced with a fresh carbon fiber microelectrode.
2. An electrical stimulation (24 biphasic pulses, 60 Hz, ±120 µA, 2 ms/phase) is applied to the stimulating electrode while dopamine is monitored at the carbon fiber microelectrode. The behavioral reaction to the stimulation is usually a head turn to the ipsilateral side followed by sniffing. The carbon fiber microelectrode

452 Phillips et al.
is then lowered by small increments until electrically evoked dopamine release is optimized. The electrode can be secured in position by the locking device on the micromanipulator. At this time the rat is allowed to habituate to the environment (~30 min) before commencing the experiment (see Note 8).
3.5.3. Synchronization of Electrochemical Data with Behavior
The electrochemical and behavioral data must be synchronized for precise correlation of neurochemistry and behavior. A video character generator superimposes the file and scan number from the data acquisition computer onto the behavioral video recording in real time (see Note 9).
3.6. Electrode Calibration
Carbon fiber microelectrodes are calibrated in vitro with known concentra-tions of dopamine (see Note 10). Electrodes are lowered via the micromanipula-tor into the flowstream of a flow injection apparatus, perfused with Tris-HCl buffer. The flow injection apparatus is equipped with an injection loop, in which the analyte of interest (dopamine) is loaded. The carbon fiber microelectrode and a reference electrode (submerged in the buffer) are connected to the headstage and the voltammetric waveform is applied. The timing of the injec-tion of dopamine into the flowstream is controlled by the data acquisition software. Because of the linearity of the response, one or two concentrations of dopamine (~1–2 µM) are sufficient to calibrate the electrode. Calibrations are done in triplicate and the average value for the current at the peak oxidation potential is used to normalize in vivo signals to dopamine concentration.
3.7. Data Analysis
Data analysis is carried out using software locally written in LabVIEW. The chemical integrity of each signal is checked from the cyclic voltammogram. Once a signal is confirmed to be dopamine, the concentration is determined from the current at the peak oxidation potential (see Notes 11–13).
3.8. Verification of Electrode Placement
To obtain unequivocal evidence of placement, histological methods must be used to verify the sampling site. Because the fiber is so small, a noticeable tract will not be seen using standard histological methods. However, a lesion can be made at the tip of the electrode that can be visualized using histological techniques (see Note 14).
1. The rat is anesthetize’d with 160 mg/kg of intramuscular ketamine and 24 mg/kg of xylazine, and an electrolytic lesion is made with a stimulator (100 µA, 5 s;anode connected to the carbon fiber microelectrode, cathode connected to a rectal probe).

Measurement of Phasic Dopamine with FSCV 453
2. The rat is immediately transcardially perfused with saline followed by 4% para-formaldehyde. The whole brain is then removed and stored in paraformaldehyde. Once the brain tissue is adequately fixed, it is rapidly frozen in an isopentane bath (~5 min).
3. The brain is then blocked, sliced on a cryostat (50-µm coronal sections, –20°C) and placed on slides. To aid visualization of anatomical structures, slices are stained with thionin.
4. Notes4.1. Electrochemistry
1. The preeminent electrochemical techniques used to make real-time biological measurements in situ are constant-potential amperometry, high-speed chrono-amperometry, and fast-scan cyclic voltammetry (6). In constant-potential amperometry (7), the electrode is continually held at an oxidizing potential (typically +0.30–0.65 V vs Ag/AgCl) so that any molecule at the electrode surface oxidized by this potential will produce faradaic current at the electrode. This technique provides measurements in absolute real time; the sampling rate is limited only by data acquisition. However, other than excluding molecules that are not electroactive, constant-potential amperometry has no chemical selectivity. It is also unable to resolve movement artifacts or ionic changes from faradaic current produced by analytes, and therefore is not ideally suited for making measurements in freely moving animals. High-speed chronoamperometry (8) is a pulsing technique, whereby the potential at the electrode is rapidly shifted to an oxidizing potential (typically +0.55 V vs Ag/AgCl), held for a period of time (typically 100 ms) and then returned to its resting potential (0.00 V). Faradaic current is provided by all molecules at the electrode surface that are oxidized by the change in potential in the first step, and current in the opposite direction is produced on the second step when the oxidized products are returned to their reduced state. Therefore, two data points are obtained for each pulse, one measurement of oxidative and one of reductive current. Together these data can provide a level of chemical selectivity. The ratio of reductive to oxidative current can provide information on the stability of the oxidized species or its diffusion from the electrode. Oxidized species generated at the electrode that rapidly diffuse away will not be available during the reductive phase and produce lower reductive-to-oxidative current ratios. Likewise, if the oxidized species is unstable (e.g., dehydroascorbic acid formed from oxidation of ascorbic acid), it will not be available during the reductive phase and will produce a reductive-to-oxidative current ratio of zero. High-speed chronoamperometry can exclude movement artifacts because they result in a change in current in the same direction for the oxidative and reductive phase. However, ionic changes cannot easily be distinguished from analytes with this technique. Fast-scan cyclic voltammetry (9) also utilizes reduction as well as oxidation reactions. However, rather than increasing the potential in a single step, the potential is more gradually ramped to an oxidizing potential and back which generates a whole array of data for each

454 Phillips et al.
voltammetric sweep (approx 1000 data points using 100-kHz data acquisition). This provides chemical information about the analyte, and allows selectivity of dopamine from other electroactive biological compounds. In addition, it allows analytes to be easily distinguished from movement artifacts or ionic changes (such as pH) that change the background signal to produce apparent faradaic current. The latter is most important because although many electroactive species can be excluded by other means (e.g., anatomical specificity, stimulation of specific pathway, use of ion-exchange polymers: see below), the brain of the freely moving rodent is not a beaker and ionic changes occur regularly, particularly under conditions of changing metabolic demand. Thus, fast-scan cyclic voltammetry offers the most reliable real-time electrochemical detection of dopamine in freely moving animals.
2. Carbon fiber microelectrodes can be coated with the perfluorinated ion-exchange polymer Nafion (10) to improve their selectivity for dopamine. Because of its negative charge, Nafion allows dopamine and other positively charged molecules to diffuse to and preconcentrate at the electrode surface, while excluding negatively charged species (e.g., DOPAC, ascorbic acid). Electrochemical sensitivity to dopamine is enhanced by its adsorption to the carbon fiber microelectrode (11). This occurs between voltammetric scans when the electrode is held at a negative potential (typically –0.40 V vs Ag/AgCl), probably by elec-trostatic attraction of dopamine to the carbon surface. The use of extended voltam-metric waveforms (typically with a more positive anodic limit, up to +1.40 Vvs Ag/AgCl) has been shown to improve the sensitivity to dopamine (12). It is speculated that this augmentation is due to increased adsorption capacity of the electrode. However, this process may also slow the dynamic response to dopamine and lower the chemical selectivity.
4.2. Electrical Stimulation
3. To apply biphasic-current stimulations, we use two stimulators (each one provides current in one direction). Because they are not necessarily matched (i.e., the input–output characteristics may not be equal), we use a potentiometer to divide the input, so we can balance the outputs.
4.3. Electrode Fabrication
4. For easy handling of carbon fibers without damaging them, watchmakers’ forceps with the tips encased in either heat-shrink or the insulator from an electrical wire can be used.
5. If carbon fiber microelectrodes are soaked in isopropanol for at least 10 min prior to use, their sensitivity can be improved by more than threefold. This is thought to clean the electrode and perhaps modify its surface functional groups. If the isopropanol is “cleaned” by loading it with activated carbon and then filtering before use, the sensitivity can be improved further by another twofold (11).

Measurement of Phasic Dopamine with FSCV 455
4.4. Surgery
6. To provide adequate space between the stimulating electrode and the guide cannula, the stimulating electrode wires should be bent at a 90° angle from the plastic hub and then bent back down at another 90° angle, to give a horizontal distance of ~2 mm between the hub and the main axis of the wires. Following surgery, the animal should be monitored daily and gently handled to facilitate experimental procedures. While handling, the stylet should be removed from the guide cannula, cleaned with an alcohol wipe, and reinserted.
4.5. Experiment
7. Experiments should be conducted 2–10 d after surgery. The earliest post-surgical day that experiments can be carried out on is dependent on the rat’s well being. Full recovery usually takes 2 d, but it can be as many as 5. The latest day that experiments can be carried out is dependent on a number of factors concerning the integrity of each of the electrodes. After a period of time in the brain, reference electrodes can drop their holding potential by approx 0.20 V. This is most likely due to dechlorination of the silver wire. After this occurs, all applied potentials will be 0.20 V lower than anticipated. This problem is easily identifiable to the trained eye by the shifted appearance of the background current on the oscilloscope. The occurrence of this problem potentially could be avoided with the use of removable reference electrodes. The stimulating electrode may also lose its functionality after several days implanted in the brain, resulting in both a lack of behavioral and neurochemical response to stimulation. Lastly, an accumulation of dried blood or perhaps gliosis at the tip of the guide cannula can cause carbon fiber microelectrodes to break as they are lowered into the brain. This problem can sometimes be resolved by inserting a stylet cut to extend past the tip of the guide cannula, but not as far as the target tissue to clear a path for the electrode. However, the problem becomes more prolific and the remedy less effective as post-surgical time increases.
8. During the initial period that voltammetric scans are applied to a fresh carbon fiber microelectrode, the background current tends to drift. This may be due to adsorption of brain material to the electrode surface (see notes on electrode calibration) and other surface changes. Therefore the electrode should be left to equilibrate (while applying voltammetric scans) for about 30 min before the start of the experiment. This time can also be used to habituate the rat to the environment.
9. Although fast-scan cyclic voltammetry has the best chemical selectivity of the real-time electrochemical techniques, it is not definitive. Therefore, in addition to confirming that cyclic voltammograms obtained in vivo correlate well with those from in vitro calibrations of dopamine, a set of identification criteria is used (13). First, the anatomy should support the presence of the analyte, that is, the electrode must be in a dopamine-rich region. This is readily evaluated with common histological techniques. Next, the physiology should be consistent with

456 Phillips et al.
the release of the analyte, for example, stimulation of dopaminergic pathways should evoke release, and the known dopaminergic electrophysiology should be appropriate to sustain the release of the purported concentrations. In addition, a pharmacological approach should be used. This is generally in the form of a characterization rather than a routine experimental procedure. For instance, the electrochemical signal measured in the caudate–putamen following electrical stimulation of the medial forebrain bundle, was characterized many years ago (14), and so we can be confident that under identical conditions (and where an appropriate cyclic voltammogram is obtained), a signal will always be dopamine. The most commonly used pharmacological agents for characterization are selective uptake blockers (e.g., GBR 12909), biosynthesis inhibitors (e.g., α-methyl-p-tyrosine), metabolism inhibitors (e.g., pargyline), and drugs that interfere with vesicular storage (e.g., Ro 4-1284). It is important to remember that the characterization is specific to the circumstances: for example, a pharmacologi-cal characterization for electrically evoked dopamine does not confirm the identity of an analyte evoked by a behavioral task. Systemic pharmacology may be a concern in freely moving animals, particularly when characterizing behaviorally evoked signals, because drugs that alter dopaminergic neurotransmission may modify the perception of a stimulus or the behavior itself. Therefore, the best way to carry out a pharmacological characterization in a behavioral context is by local application of drugs around the carbon fiber microelectrode so as to alter the immediate environment without grossly affecting the global behavior of the animal.
4.6. Electrode Calibration
10. In vitro calibration of the carbon fiber microelectrode may be performed before or after the experiment. The sensitivity of the electrode decreases when it is exposed to brain tissue (15). We believe that this is due to adsorption of substances (including proteins) in the brain, which compete with dopamine for the surface of the electrode. Therefore we consider that post-experimental calibration gives a better estimate of the in vivo state. In addition, some pharmacological agents (dopamine uptake inhibitors) have also been shown to affect adversely the sensitivity of fresh carbon fiber microelectrodes (16). In our hands, these did not alter the sensitivity if the electrode had previously been used in vivo. We assume that, like the endogenous material of the brain, these adsorb to the electrode to compete with dopamine. However, once the sensitivity has already been decreased by adsorption of contaminants in vivo, the pharmacological agents will have no further effect.
4.7. Data Analysis
11. To be confident that the signals purported to relate to specific behaviors are not simply ongoing changes in dopamine concentration, unrelated to that behavior, it is important to know the baseline level of occurrence of dopamine transients. As discussed previously, we cannot simply assume that all fluctuations in the current
Measurement of Phasic Dopamine with FSCV 457
at the peak oxidation potential for dopamine are due to changes in dopamine: pH and movement artifacts can also contribute to this signal. Therefore, the cyclic voltammogram of every voltammetric scan from the entire behavioral session (typically 72,000 scans in a 2-h experiment) must be checked for dopamine. To facilitate this process we developed a computerized scanning method with template matching. Systematically, each scan in the session has a background subtracted from it (typically 10 scans, 0.5–1.5 s prior to the foreground scan). This is then statistically compared to a template for dopamine. The template is a background-subtracted cyclic voltammogram from an in vitro calibration or electrically evoked dopamine release at the same electrode. The statistical comparison can be least squares analysis of normalized signals or linear regres-sion. For either method, a confidence score of dopamine is obtained for every sample in the session. Signals exceeding a confidence threshold are then reexamined manually by an experienced investigator to verify their validity.
12. Plots of voltammetric current for a single applied potential (e.g., at the peak oxidation potential for dopamine) provide temporal information, but no chemical resolution (c.f., constant-potential amperometry). Examination of individual cyclic voltammograms provides chemical information for any point in time. However, it is much more desirable to be able to map temporal changes concur-rently with chemical information. For this reason, it is useful to plot voltammetric data in three dimensions: time on the x-axis, applied potential on the y-axis, and current on the z-axis. This can be done either by plotting a “landscape” of consecutive cyclic voltammograms (17) or displaying the current in pseudo-color (18). Color plots are generated in the data analysis software and can help an experimenter to identify quickly and reliably chemical changes of the species of interest. In addition they allow identification of any interference that may be altering the apparent temporal response (e.g., pH, see below).
13. Local ionic changes, including pH, occur in the brain, particularly at times of changing metabolic demand (e.g., during neurotransmitter release or changes in postsynaptic neuronal firing rate). As discussed previously, these can alter the voltammetric signal by producing current over a large range of applied potentials. If changes in pH and dopamine occur at the same time, the pH can potentially mask the signal at the peak potential for dopamine. This scenario is readily identified from a color plot (see above). To correct for this (18), current from a potential that is affected by pH but not dopamine (e.g., 0.0–+0.1 V on the anodic scan; a measure of pH alone) is subtracted from current at the peak oxidation potential for dopamine (a measure of dopamine plus pH). This process can be automated in the data analysis software.
4.8. Verification of Electrode Placement
14. The passage of sufficient current across the carbon fiber microelectrode to gener-ate a lesion will render it unsuitable for calibration. Because most experiments require post-experimental calibration, we have adopted an alternative approach. The carbon fiber microelectrode is removed at the end of the experiment and

458 Phillips et al.
replaced with a stainless steel electrode. This is lowered to the depth of the carbon fiber microelectrode during the experiment (using an identical micromanipula-tor), and the lesion is made by passing current (100 µA, 5 s) through it. It is possible to make several lesions in a single animal to demonstrate electrode placement from multiple experiments. During histological preparation, slices are stained with potassium ferricyanide (in addition to thionin) to aid visualization of the electrode-induced lesion.
5. Applications5.1. Intracranial Self-Stimulation
Intracranial self-stimulation is a behavioral paradigm whereby subjects carry out an operant task to receive direct electrical stimulation of specific regions of their brains (19). Stimulation of the regions including the mesencephalic dopaminergic cell bodies or of the lateral hypothalamus that includes the ascending dopaminergic pathways are both reinforcing in this paradigm. It is believed that dopamine is involved in the reinforcing properties of this behavior, as it can be abolished by selective lesion of dopaminergic neurons (20). To investigate further the role of dopamine, fast-scan cyclic voltammetry was used to monitor dopamine in terminal regions during intracranial self-stimulation of the ventral tegmental area/substantia nigra.
Rats were allowed free access to a lever, depression of which caused an electrical stimulation (24 pulses, 60 Hz, ~120 µA) to be applied across the stimulating electrode on a fixed-ratio 1 schedule. Within 1 d, rats usually learned to freely lever-press for intracranial self-stimulation. Dopamine was monitored using fast-scan cyclic voltammetry throughout the training and test sessions.
In animals in which the stimulating electrode was positioned such that stimulation produced detectable dopamine release, intracranial self-stimulation behavior was acquired. However, in those in which the stimulating electrode did not evoke dopamine release, the animals did not acquire the behavior, suggesting that activation of dopaminergic neurons is required for intracranial self-stimulation to be reinforcing.
In animals that did acquire intracranial self-stimulation behavior, the nor-mally robust evoked dopamine signals disappeared as the animal acquired thelever-pressing for intracranial self-stimulation. This attenuation occurred despite the fact that experimenter-delivered electrical stimulation evoked dopamine release prior to the intracranial self-stimulation session. Furthermore, detectable dopamine release could be evoked, once again, by experimenter-delivered stimulations at the end of the session. Finally, if a lever-press record during an intracranial self-stimulation session from one animal was “played back” to another animal, as a yoked control, dopamine release could be detected

Measurement of Phasic Dopamine with FSCV 459
for a significant part of the session. These data are highly indicative that there is higher, executive attenuation of dopamine release during contingent responses. This phenomenon has been observed in both the core and shell of the nucleus accumbens (21) and in the caudate–putamen (22).
These results seem to be consistent with the proposed role of dopamine in the prediction error theory for reward (23) in which only unanticipated responses produce dopaminergic responses. Evidence for the source of the attenuation may be provided by the work of Henriksen and co-workers, who have recently shown that during intracranial self-stimulation session in trained rats, a group of γ-aminobutyric acid-ergic (GABAergic) neurons in the ventral tegmental area increase their firing rates just prior to the lever-press (24). These neurons may interact with dopaminergic neurons to inhibit propagation of the stimulus and/or dopamine release.
5.2. Natural Stimuli
As well as being suitable for the measurement of transient dopamine concentrations produced by electrical stimulation of dopaminergic neurons, fast-scan cyclic voltammetry can also be used to measure changes in dopamine levels resulting from endogenous neuronal activity. Specifically, the burst firing of dopaminergic neurons, synchronized by gap junctions (25), is likely to produce extracellular dopamine transients that achieve high concentrations (>100 nM). Electrophysiological studies demonstrate that such burst firing occurs during the presentation of rewards and associated stimuli (3) and various alerting stimuli (26).
The first chemical measurement of a rapid dopaminergic response to a natural stimulus was by Rebec et al. (1) using fast-scan cyclic voltammetry. An increase in extracellular dopamine concentration (indicated by the cyclic voltammogram), lasting <10 s, was measured in the shell of the nucleus accumbens of rats at free-choice entry into a novel environment. Neither subsequent exploratory behavior nor reentry to the environment was associated with further increases in dopamine concentrations, emphasizing the role of novelty as opposed to locomotion in eliciting the neurochemical response. The response was also regionally specific, as it was not observed in the core of the nucleus accumbens or the caudate–putamen.
We recently measured faster dopamine transients in the core of the nucleus accumbens of male rats during sexual interaction (2). In the first experiment, we monitored dopamine during introduction of a receptive female into the test cage. Dopamine transients occurred during the initial interaction with the female, that is, approach and sniffing behaviors, but not during copulatory behaviors such as mounting, intromission, or ejaculation. Additional experi-ments addressed whether this phasic dopamine response is specific for recogni-

460 Phillips et al.
tion of receptive females. Preliminary data suggest that similar responses occur with presentation of males (Fig. 3), suggesting a nonsexual role for this signal. The transients tended to occur at the initial interaction with the target rat and are followed by intense sniffing and often locomotion. These results and those
Fig. 3. Extracellular dopamine transient in the nucleus accumbens core of a male rat at investigation of another male. The voltammetric trace at the peak oxidation potential for dopamine is shown at the top, and the arrows indicate the time points of the cyclic voltammograms and video stills. Each point represents current from one voltammetric scan, collected every 100 ms. The test rat (on the right in each video frame with a tether) approaches the target rat (left panel) and at the point he makes contact (middle panel), there is a rapid but transient rise in the voltammetric signal. On further interaction (right panel), there is no further change in the voltammetric signal. The background-subtracted voltammograms indicate that the rise in the voltammetric signal was due to an increase in dopamine concentration (middle), and that there was no change in dopamine concentration either 2 s before (left; before initial contact) or 2 s after (right; during further interaction) the transient. The concentration of dopamine was estimated from in vitro post-experimental calibration of the carbon fiber microelectrode, and is shown in the scale bar.

Measurement of Phasic Dopamine with FSCV 461
of Rebec et al. (1) are consistent with a role for phasic dopamine in alerting and attention processes.
5.3. Cocaine Self-Administration
Extracellular dopamine has previously been measured during cocaine self-administration with both electrochemical (27) and microdialysis techniques (28). The preliminary data presented here were obtained by monitoring extracellular dopamine using fast-scan cyclic voltammetry with much better temporal resolution (25–12,000+ times greater) than previous studies.
Rats (n = 3) were surgically implanted with indwelling jugular catheters. Following 1 wk of recovery, they were trained to self-administer cocaine over a 2-h behavioral session. Each active lever-press response (fixed-ratio 1 schedule with 20 s time out) resulted in a 0.33 mg of intravenous infusion of cocaine (6 s)paired with a tone/houselight stimulus (20 s). Once stable self-administration behavior was seen for at least 3 consecutive days, voltammetry surgery was performed. Following recovery, rats were allowed to self-administer cocaine until stable behavior was reestablished (1–2 d). On the experimental day, a carbon fiber microelectrode was lowered into the core of the nucleus accumbens and dopamine was monitored throughout the session. Electrically stimulated (24 pulses, 60 Hz) release of dopamine was monitored before and after rats were allowed to self-administer cocaine to verify that the working electrode was in a dopamine-rich area. At the beginning of the cocaine self-administration session rats typically lever-pressed two to four times in quick succession (termed load-up behavior) and then approx every 5 min for the remainder of the session.
Transient (~5 s) increases in dopamine concentration (75–150 nM) were seenimmediately following lever-presses for cocaine (Fig. 4). These were concur-rent with the onset of the tone and houselight (paired with cocaine delivery). Because the observed dopamine transients ended within 1–5 s of the onset of cocaine delivery, they are probably not related solely to a direct pharmacologi-cal effect of cocaine. Indeed, preliminary findings indicate that they are still present for a lever-press when the cocaine pump is switched off. Instead, these transient changes in dopamine are likely related to the goal-directed behaviors for intravenous cocaine, as well as associative factors operating within the self-administration context.
5.4. Conclusions
These data establish that fast-scan cyclic voltammetry can measure rapid, transient dopaminergic events in behaving rats on a physiological time scale, and invite research on phasic dopaminergic transmission during a variety of experimental paradigms, including motivation and learning. The time resolution

462 Phillips et al.
of the technique, along with the ability to identify signals chemically, provide an unprecedented ability to monitor dopamine in real time within a behavioral context. In particular, investigation of phasic dopamine release with fast-scan cyclic voltammetry in freely moving rats may prove important in aiding the understanding of the reinforcing properties of drugs of abuse.
References 1. Rebec, G. V., Christensen, J. R., Guerra, C., and Bardo, M. T. (1997) Regional
and temporal differences in real-time dopamine efflux in the nucleus accumbens during free-choice novelty. Brain Res. 776, 61–67.
Fig. 4. Transient increase in extracellular dopamine concentration in the core of the nucleus accumbens following a lever-press for cocaine. The voltammetric trace at the peak oxidation potential for dopamine is shown. Each point represents current from one voltammetric scan, collected every 100 ms. Immediately following the lever-press (vertical arrow) there is a rapid rise in the voltammetric signal. The cyclic voltammogram (inset) is indicative that this is an increase in dopamine concentration. The concentration of dopamine was estimated from in vitro post-experimental calibra-tion of the carbon fiber microelectrode (peak response is ~100 nM). The open bar rep-resents the time of the cocaine infusion and the filled bar shows the period of the tone/houselight stimulus (note that this lasts for 20 s and so continues beyond the time window shown).

Measurement of Phasic Dopamine with FSCV 463
2. Robinson, D. L., Phillips, P. E. M., Budygin, E. A., Trafton, B. J., Garris, P. A., and Wightman, R. M. (2001) Sub-second changes in accumbal dopamine during sexual behavior in male rats. NeuroReport 12, 2549–2552.
3. Schultz, W. (1992) Activity of dopamine neurons in the behaving primate. Semin. Neurosci. 4, 129–138.
4. Budygin, E. A., Kilpatrick, M. R., Gainetdinov, R. R., and Wightman, R. M. (2000) Correlation between behavior and extracellular dopamine levels in rat striatum: comparison of microdialysis and fast-scan cyclic voltammetry. Neurosci. Lett. 281, 9–12.
5. Budygin, E. A., Phillips, P. E. M., Robinson, D. L., Kennedy, A. P., Gainetdinov, R. R., and Wightman, R. M. (2001) Effect of acute ethanol on striatal dopamine neurotransmission in ambulatory rats. J. Pharmacol. Exp. Ther. 297, 27–34.
6. Michael, D. J. and Wightman, R. M. (1999) Electrochemical monitoring of biogenic amine neurotransmission in real time. J. Pharm. Biomed. Anal. 19, 33–46.
7. Kawagoe, K. T. and Wightman, R. M. (1994) Characterization of amperometry for in vivo measurement of dopamine dynamics in the rat brain. Talanta 41, 865–874.
8. Gerhardt, G. A. and Hoffman, A. F. (2001) Effects of recording media composition on the responses of Nafion-coated carbon fiber microelectrodes measured using high-speed chronoamperometry. J. Neurosci. Methods 109, 13–21.
9. Kawagoe, K. T., Zimmerman, J. B., and Wightman, R. M. (1993) Principles of voltammetry and microelectrode surface states. J. Neurosci. Methods 48, 225–240.
10. Gerhardt, G. A., Oke, A. F., Nagy, G., Moghaddam, B., and Adams, R. N. (1984) Nafion-coated electrodes with high selectivity for CNS electrochemistry. Brain Res. 290, 390–395.
11. Bath, B. D., Michael, D. J., Trafton, B. J., Joseph, J. D., Runnels, P. L., and Wightman, R. M. (2000) Subsecond adsorption and desorption of dopamine at carbon-fiber microelectrodes. Analyt. Chem. 72, 5994–6002.
12. Hafizi, S., Kruk, Z. L., and Stamford, J. A. (1990) Fast cyclic voltammetry: improved sensitivity to dopamine with extended oxidation scan limits. J. Neurosci. Methods 33, 41–49.
13. Marsden, C. A., Joseph, M. H., Kruk, Z. L., et al. (1988) In vivo voltamme-try—present electrodes and methods. Neuroscience 25, 389–400.
14. Millar, J., Stamford, J. A., Kruk, Z. L., and Wightman, R. M. (1985) Electrochemi-cal, pharmacological and electrophysiological evidence of rapid dopamine release and removal in the rat caudate nucleus following electrical stimulation of the median forebrain bundle. Eur. J. Pharmacol. 109, 341–348.
15. Logman, M. J., Budygin, E. A., Gainetdinov, R. R., and Wightman, R. M. (2000) Quantitation of in vivo measurements with carbon fiber microelectrodes.J. Neurosci. Methods 95, 95–102.
16. Davidson, C., Ellinwood, E. H., Douglas, S. B., and Lee, T. H. (2000) Effect of cocaine, nomifensine, GBR 12909 and WIN 35428 on carbon fiber microelectrode

464 Phillips et al.
sensitivity for voltammetric recording of dopamine. J. Neurosci. Methods 101, 75–83.
17. Phillips, P. E. M. and Stamford, J. A. (1999) Voltammogram “landscapes” aid detection and identification of in vivo electrochemical signals. Electroanalysis 11, 301–307.
18. Michael, D., Travis, E. R., and Wightman, R. M. (1998) Color images for fast-scan CV. Analyt. Chem. 70, 586A–592A.
19. Olds, J. and Milner, P. M. (1954) Positive reinforcement produced by electrical stimulation of septal area and other regions of the rat brain. J. Comp. Physiol. Psychol. 47, 419–427.
20. Fibiger, H. C., LePiane, F. G., Jakubovic, A., and Phillips, A. G. (1987) The role of dopamine in intracranial self-stimulation of the ventral tegmental area. J. Neurosci. 7, 3888–3896.
21. Garris, P. A., Kilpatrick, M., Bunin, M. A., Michael, D., Walker, Q. D., and Wight-man, R. M. (1999) Dissociation of dopamine release in the nucleus accumbens from intracranial self-stimulation. Nature 398, 67–69.
22. Kilpatrick, M. R., Rooney, M. B., Michael, D. J., and Wightman, R. M. (2000) Extracellular dopamine dynamics in rat caudate–putamen during experimenter-delivered and intracranial self-stimulation. Neuroscience 96, 697–706.
23. Schultz, W., Dayan, P., and Montague, P. R. (1997) A neural substrate of prediction and reward. Science 275, 1593–1599.
24. Steffensen, S. C., Lee, R. S., Stobbs, S. H., and Henriksen, S. J. (2001) Responses of ventral tegmental area GABA neurons to brain stimulation reward. Brain Res. 906, 190–197.
25. Grace, A. A. (1991) Phasic versus tonic dopamine release and the modulation of dopamine system responsivity: a hypothesis for the etiology of schizophrenia. Neuroscience 41, 1–24.
26. Overton, P. G. and Clark, D. (1997) Burst firing in midbrain dopaminergic neurons. Brain Res. Rev. 25, 312–334.
27. Gratton, A. and Wise, R. A. (1994) Drug- and behavior-associated changes in dopamine-related electrochemical signals during intravenous cocaine self-administration in rats. J. Neurosci. 14, 4130–4146.
28. Wise, R. A., Newton, P., Leeb, K., Burnette, B., Pocock, D., and Justice, J. B., Jr. (1995) Fluctuations in nucleus accumbens dopamine concentration during intravenous cocaine self-administration in rats. Psychopharmacology 120, 10–20.