in-depth assessment of the medicines supply...
TRANSCRIPT

IN-DEPTHASSESSMENT OF THE MEDICINES SUPPLY SYSTEM IN TANZANIA

Published by the Ministry of Health and Social Welfare, Dar es salaam, Tanzania
© 2008 Ministry of Health and Social Welfare, Tanzania
Printed by:
Jamana Printers Limited, Dar es Salaam, Tanzania
Any part of this document may be reproduced in any form without the prior permission of the
publisher provided that this is not for profit and that due acknowledgement is given.
Any reproduction for profit must be made with the prior permission of the publisher
Copies may be obtained from:
The Permanent Secretary,
Ministry of Health and Social Welfare,
PO Box 9083, Dar es Salaam
Tel: 255 22 2120261
Fax: 255 22 2139951

Acknowledgements/Disclaimer
This document has been produced with the financial assistance of the European Community and
the technical support of the World Health Organization. The views expressed herein are those of
the authors and can therefore in no way be taken to reflect the official opinion of the European
Community or the World Health Organization

IN-DEPTH ASSESSMENT OF THE MEDICINES SUPPLY SYSTEM IN TANZANIA4

IN-DEPTH ASSESSMENT OF THE MEDICINES SUPPLY SYSTEM IN TANZANIA i
TABLE OF CONTENTS
LIST OF FIGURES iiiLIST OF TABLES ivABBREVIATIONS vACKNOWLEDGEMENTS vi
1. EXECUTIVE SUMMARY 1
2. INTRODUCTION 2 2.1 Country Profile 2 2.2 Structure of National Health & Pharmaceutical System 2 2.3 Pharmaceutical services 3 2.4 Rationale of the assessment 4
3. STUDY DESIGN AND METHODOLOGY 5 3.1 Survey purpose 5 3.2 Methodology 5 3.2.1 Sampling and survey population 6 3.2.2 Training of the Survey Teams 7 3.2.3 Data collection 7 3.2.4 Data entry and analysis 7 3.2.5 Scope and limitation of the assessment 8
4.0 RESULTS AND ANALYSIS 9 4.1 Structure of medicines supply system in Tanzania 9 4.2 Categories of products managed at various level of care 9 4.3 Key medicines management functions at different levels of Health care 10 4.4 Customers at various levels of PSM 11 4.4.1 Turn over at MSD 12 4.5 Selection of Products 12 4.5.1 Availability of EML and STG 12 4. 5.2 Use of NEMLT in procurement 12 4.6 Quantification / Forecasting 13 4.7 Procurement 16 4.7.1 Sources of procured products at the Central Store 18 4.8. Ordering 20 4.9 Delivery 21 4.9.1 Indicators used for assessing products delivered 21 4.10. Storage/Stock Management 22 4.10.1 Adequate storage capacity 22 4.10.2 Storage conditions 23 4.10.3 Stock management techniques used 23 4.10.4 Availability of tracer products 24 4.10.5 Stock out days 25 4.10.6 Expiry of stocks 25 4.11. Distribution 26 4.11.1 Frequency of distribution for the various levels 26 4.11.2 Types, numbers and capacities of various means of transport 27 4.12 Quality Assurance system 28 4.12.1 The structures used for quality control 28 4.13 Rational Use 29 4.14 Financing 30 4.15 Information Management 32 4.16 Monitoring and evaluation 33 4.16.1 Performance Indicators 34 4.17 Human resource 35
IN-DEPTH ASSESSMENT OF THE MEDICINES SUPPLY SYSTEM IN TANZANIAii
5.0 DISCUSSIONS 36 5.1 Selection of products and order placement 36 5.2 Structure 37 5.3 Health facility Pharmacies 37 5.4 Procurement of medicines 37 5.5 Quantification of needs 38 5.6 Procurement methods 38 5.7 Products storage and stock management 39 5.8 Availability of medicines and medical supplies at Health Facilities 39 5.9 Quality Assurance system 40 5.10 The impact of Vertical Programs 40
6.0 CONCLUSION 41
7.0 RECOMMENDATIONS 43
8.0 RECOMMENDATIONS OF THE STAKEHOLDERS WORKSHOP 44
9.0 REFERENCES 50
10 ANNEXES 51
Annex 1: Data Collection Points 51Annex 2: List of names of Data Collectors for the Assessment 51Annex 3: List of Tracer Medicines 52

IN-DEPTH ASSESSMENT OF THE MEDICINES SUPPLY SYSTEM IN TANZANIA iii
LIST OF FIGURESFigure 1 Key medicines management functions
Figure 2 Supply functions performed by vertical programs
Figure 3 Reasons for non compliance with EML at facility level
Figure 4 Procurement methods and lead time
Figure 5 Procurement sources and their frequency of use
Figure 6 Percentage use of indicators for assessing products delivered
Figure 7 Percentage adequacy of storage capacity at all levels
Figure 8 Percentage median availability of 20 tracer medicines
Figure 9 Use of revenues collected at MSD
Figure 10 Activities carried out during supervision
Figure 11 Performance indicators regularly evaluated
Figure 12 Level of initial training offered to staff in procurement
Figure 13 Level of regular training offered to staff in procurement at health facilities

IN-DEPTH ASSESSMENT OF THE MEDICINES SUPPLY SYSTEM IN TANZANIAiv
LIST OF TABLESTable 1 General Health Indicators
Table 2 Levels of Health Service Delivery
Table 3 Facilities visited
Table 4 Formation of Zonal Stores
Table 5 Categories of products managed at various levels of care
Table 6 Customers at various levels of the procurement and supply management
Table 7 Total sales in USD and percentage mark up of MSD 04-06
Table 8 Reasons for non compliance with the NEMLIT in procurement
Table 9 Information used in quantification of needs
Table 10 Responsibilities and tools used in quantification
Table 11 Tendering methods, percentages of application and lead times in days
Table 12 Criteria considered when awarding contracts
Table 13 A summary of award contracts in USD for the year 2006
Table 14 Frequency of ordering
Table 15 Indicators used in measuring suppliers performance
Table 16 Volume of imports by central store in 2006
Table 17 Delivery types at all levels
Table 18 Adherence to storage conditions
Table 19 Adherence to stock management techniques
Table 20 Reasons for stock outs at all levels
Table 21 Causes of expiry of stocks
Table 22 Frequency of distributions
Table 23 The number and capacity of vehicles for distribution
Table 24 Criteria used to assure quality of products procured
Table 25 Standard operating procedures available at MSD
Table 26 Medicine information sources
Table 27 Amount of expenditure in USD and sources of funding
Table 28 Activities supported by donor funding
Table 29 Administration fees on selected category of products
Table 30 Type of information monitored regularly
Table 31 Processes monitored
Table 32 Professional category of staff and their function
Table 33 Areas needing improvement identified during a workshop to disseminate results of the
assessment

IN-DEPTH ASSESSMENT OF THE MEDICINES SUPPLY SYSTEM IN TANZANIA v
ABBREVIATIONSAIDS Acquired Immunodeficiency Syndrome
ARVs Anti-retrovirals
C & F Cost and Freight
CIF Cost Insurance and Freight
CPT Carriage Paid To
DDP Delivered Duty Paid
DDU Delivered Duty UnPaid
EML Essential Medicines List
FEFO First Expiry first Out
FIFO First In First Out
FOB Free on Board Vessel
GDP Gross Domestic Product
GOT Government of Tanzania
HF Health Facility
HIV Human Immunodeficiency Virus
HTC Hospital Therapeutic Committee
ILS Integrated Logistics System
MOHSW Ministry of Health and Social Welfare
MSD Medical Stores Department
NEDLIT National Essential Drugs List for Tanzania
NEMLIT National Essential Medicines List for Tanzania
NGO Non-Governmental Organization
OI Opportunistic Infection
PHF Primary Health Facility
PORALG Prime Minister’s Office Regional Administration and Local Government
PT Pharmacy Technicians
SOP Standard Operating Procedures
STG Standard Treatment Guidelines
TFDA Tanzania Food and Drugs Authority
WHO World Health Organization

IN-DEPTH ASSESSMENT OF THE MEDICINES SUPPLY SYSTEM IN TANZANIAvi
ACKNOWLEDGEMENTSThe Ministry of Health would like to express its gratitude to the World Health Organization (WHO) whose
financial support made it possible to conduct this survey. The Ministry would also like to acknowledge all
people who contributed their time and expertise to carry out this survey. In particular we would like to mention
the following: The Director for Hospital Services Ministry for Health, Dr Z. Berege; the Chief Pharmacist and
Assistant Director of Pharmaceutical Services, Mr Joseph Muhume and Mrs. A. Sillo for the administrative
support they offered during the assessment period and while preparing this report. Special thanks go to Ms
Rose Shija, the WHO Country Office Essential Medicines and Medicine Policy National Professional Officer
(EDM NPO) for her technical support throughout the whole process of the assessment.
The Ministry is also grateful to all health workers in the surveyed facilities for facilitating the data collection
process. The Ministry is grateful for the cooperation given by the Director General of MSD for setting aside
his time during interviews. The support extended by the entire management team of MSD and the individual
staff is highly appreciated.
The close cooperation and guidance received from the Regional Medical Officers and District Medical officers,
Regional and District Pharmacists of Dar es Salaam, Moshi, Mwanza, Tabora, Mbeya, and Mtwara regions
are highly appreciated. The Medical Directors of Bugando, K.C.MC, Mbeya and Muhimbili hospitals are
acknowledged for providing access to useful information pertaining to medicines supply in their hospitals.
Special gratitude is extended to staff of all sectors who volunteered to respond to the lengthy questionnaires
during the whole time of the survey.
The use of the database and the modules developed to capture information in a structured manner posed quite
a challenge. The efforts and the enthusiasm experienced in using this software have been overwhelming. We
thank Mr. James Annan the Temporary Advisor from the Ministry of Health Ghana for his support on the use of
the data analysis software. We also thank Mrs Helen Tata and Mrs Magali Babaley from WHO Headquarters
who coordinated and facilitated the data analysts and principal investigators training in Ghana.
Lastly but not least, the valuable work done by the data collectors who devoted their time and commitment
to collect the data for this survey is acknowledged. These include: Prof. Dr. M. Justin-Temu, Dr. M. Jande,
Dr. G. Rimoy, Mr F. Nicolaus, Mr. A. Malisa, Mr. N. Mhadu, Ms. C. Muzaga, Ms. C. Magege, Mr. E. Ngaimisi,
Mr. W. Shango and Ms. R. Tumbo. Not forgetting Mr. C. Makwaya and Mr. H. Mchunga who compiled and
analyzed the data. We thank the entire Tanzanian Team who has demonstrated exceptional skills and ability
of team spirit and skills. It is our hope that this spirit of support and cooperation will be the modus operandi
for future works and assignments.
Finally, the Ministry of Health and Social Welfare wishes to acknowledge Mr. C. Msemo for coordinating this
assessment.

IN-DEPTH ASSESSMENT OF THE MEDICINES SUPPLY SYSTEM IN TANZANIA 1
1. EXECUTIVE SUMMARYA well functioning medicines supply management system is vital in assuring an un-interrupted supply of
essential medicines that are efficacious and of good quality, physically and financially accessible and used
rationally. Carrying out an in-depth assessment of the system provides information for targeted interventions
in strengthening the system. In the light of the above, WHO supported Tanzania mainland in August 2007 to
undertake an in-depth assessment of the supply management systems of essential medicines and medical
supplies in the public health. The survey was carried out using the WHO draft tool for the in-depth assessment
of the medicines supply management system (June 2007 version).
The Medical Store Department which is the structure responsible for procurement and distribution at the
national level is a semi- autonomous, public, non-for-profit organization created in 1993. It operates a self
sustaining revolving drug fund with 8 zonal stores. Data from the study found that stock availability of twenty
(20) tracer medicines was at an average of 79% at the dates of evaluation in the Zonal Stores. The stock out
situation measured by the number of days the item has been out of stock in a year ranged between one (1)
and one hundred eighty three (183) days. Lead times for delivery by sea on the average were long taking up
to 8 months. In addition the time used to clear products from the port to the central warehouse was also long.
Stock management techniques also were found to be weak except for traceability of batches (though this had
been rated poor by the TFDA in previous quality inspections) and the definition of minimum stock levels. This
could have contributed highly on the number of expired medicines and supplies which was found to be 3.7%
of sales for the year for 2006 at the central store.
The assessment also found that, most facilities studied had a functioning Pharmacy system (88.9%) and
kept Essential Medicines (92.9%). However, in most of the Pharmacies, a general inadequacy of storage
space, storage equipment and facilities for controlling temperatures were found. For example only 33% of
Pharmacies reported to have adequate storage capacity, only 52% had facilities for cold storage and only
22% had adequate storage equipment. Important parameters in stock management such as maximum and
minimum levels of stock were not determined in almost all facilities. The assessment showed the level of
stock management in almost all of the Pharmacies needed to be improved. Although availability of tracer
medicines was high at health facilities, the same facilities also presented a considerable number of stock-out
days. Some medicines were out of stock for 4 months.
Tanzania has about 640 registered Pharmacists, 352 Pharmacy Technicians (PT) and 312 Pharmacy
Assistants. With more than 5400 health facilities in the country, it is evident that there are inadequate
pharmaceutical human resources at health facilities, districts and regions.
The assessment also found that there were more areas in the health facilities management systems that
required improvement. This was in comparison with how the supply chain management was managed in the
regional, central and national levels. The assessment showed that there were challenges with regards to the
quantification processes and staff interviewed did not have a unified system for determining what to order
from the Central Store. The forecasting ability was still low, and Health facility staff (78%) affirmed that very
minimal initiatives were in place to provide continuous training. Only 11% of facilities used data on donation
supplied by partners. Results showed that only 33% facilities procured exclusively from MSD, the national
procurement agent while 45% procured from other sources.
At the Medical Stores Department (MSD), procurement was done predominantly through a competitive tender
system, and the medicine price survey conducted in 2004 indicated that the medicines procurement prices
were below the international reference prices with an overall medicines availability of 72 %.

IN-DEPTH ASSESSMENT OF THE MEDICINES SUPPLY SYSTEM IN TANZANIA2
2. INTRODUCTION
2.1 Country Profile
The United Republic of Tanzania is a union of between Tanganyika (Tanzania Mainland) and Zanzibar. It
has a total Area of 945,000 square kilometers, of which 883,000 square kilometers are land; 881,000 square
kilometers in the mainland and 2,000 square kilometers in Zanzibar. Projections for 2009 indicate Tanzania’s
total population of 41.9 millions, of which 44.4% (18.6 million) are children under 15 years. The population
of
Zanzibar is estimated to be 1.2 million (63 % in Unguja and 37% in Pemba Island)1.
The country’s economy is based mainly on agriculture and tourism, which accounts for 75-78% of the total
export earnings, yet meet only one third of Tanzanians imports.
Table 1: General and health indicators2
Estimated Population July 2008 37,990,5563
Estimated % Population living under the poverty line of 1 USD 57.8%
Life expectancy at birth (M/F) years , 2008 Male 51.4 yrs
Female 53.6 yrs
Under five mortality per 1000 live births 112
Infant mortality per 1000 live births 68
HIV prevalence rate among adults 5.8
Per capita public health spending in US$, 2001. 6
% of the population within 5 km of a facility, 2005 70
% of population within 10 km of a facility, 2005. 90
Medicines budget 2002, US$, million 18.3
Medicines budget 2007, US$, million 28.5
2.2 Structure of National Health & Pharmaceutical System
The health system in Tanzania has two major components; the public and the private sector. The public share
is 56%; the private share is 44% (which includes Faith Based Organizations (NGOs) 30% and private for
profit 14 %). The system works at four levels; the community, the ward where there is a dispensary and a
health centre at the division level. As one moves further there is the district and regional hospitals at district
and regional levels respectively. At the zonal and national levels, are the consultant/ referral hospitals.
1Population and Housing Census General Report, Central Census Office, National Bureau of Statistics. 20032Source UN population division (http://esa.un.org/unpp)

IN-DEPTH ASSESSMENT OF THE MEDICINES SUPPLY SYSTEM IN TANZANIA 3
Table 2: Levels of Health Service Delivery
Level Type of health
facility
Service
population
Remarks
Country National Hospital,
MSD, Private
wholesalers
36 million There is only one national hospital, serves
36 million because it offers some specialized
services not generally available in other
consultant hospitals
Zone Consultant Hospital,
ZMS
8 million Serve as the referral centre for the hospitals
in the surrounding regions in the zone.
There are four consultant hospitals in total
including the national hospital
Region Regional Hospital,
Pharmacy
1-1.5 million 17 regional hospitals
District District Hospital,
Pharmacy
250-500,000 A number of NGO hospitals function as
designated district hospitals (DDH). More
than one hospital may be available in
each district, usually run by NGOs (219
hospitals)
Division Health centre 50-100,000 481 health centers
Ward/ Village Dispensary, Medical
stores
5-10,000 More than one dispensary may be available
in a ward (4679)Community Health post, ADDO 2-5,000
Currently in Tanzania there are a total of 5,379 health facilities geographically distributed so that 70% of the
population is within 5 km of a facility and 90% is within 10 km as at the end of 20053.
Administratively, the health system is largely decentralized. The MoHSW has direct responsibility for the referral
and regional hospitals, and regulatory power over all health facilities. The district facilities are independently
run by the Prime Minister’s Office Regional Administration and Local Government (PORALG).
2.3 Pharmaceutical services
In improving the Pharmaceutical sector, the government endorsed the first National Drug Policy, the Standard
Treatment Guidelines (STG) and the National Essential Drug List for Tanzania (NEDLIT) in 1991. The STG
and NEDLIT were later revised in 1997. These documents are crucial in medicine quantification, procurement
and supply to achieve therapeutically better outcomes to the patients, a most important objective of all health
care systems. The Ministry of Health and Social Welfare is currently in the process of revising the NEDLIT,
STG and the NDP and has produced drafts in 2007.
The overall objectives of the NDP are to make available to all Tanzanians at all times safe, efficacious and
quality essential medicines at affordable price to an individual and the community, when these are needed
to prevent, cure or reduce illness and suffering. The NDP set up a master plan for Pharmaceutical sector
to further improve the sector between 1992 and 2000, with clear objectives, strategies, time frame and
budget required to achieve development in key areas of the pharmaceutical sector. It provides a framework
to coordinate activities by the various actors in the pharmaceutical sector: the public, private and mission
sectors, donors and other interested parties.
3 MOH&SW, Second Health Sector Strategic Plan (HSSP), July2003-June 2008, April 2003

IN-DEPTH ASSESSMENT OF THE MEDICINES SUPPLY SYSTEM IN TANZANIA4
Implementation of the NDP Pharmaceutical Master plan is coordinated by the Pharmaceutical Services Unit
(PSU) at Ministry of Health (MOH&SW). Some of the key roles of the PSU are to:
• Ensure that MSD performs according to the MSD Act of 1993
• Ensure that adequate funds to procure drugs and medical supplies are provided to MSD
• Assist health facilities with capacity to quantify drugs requirements
• Establish effective strategies for improving rational drugs use
• In collaboration with TFDA ensure the quality of medicines
• Establish effective drug management and monitoring systems at health facility level and reduce drug waste
and pilferage
• Ensure an appropriate allocation of resources to health facilities for drugs that takes into account equity,
patient load, morbidity and drug needs.
Provision of medicines and medical supplies in Tanzania is through the public non-for-profit system (56%)
and private-for-profit sector (44%). All public facilities receive their supply shares by either using allocated
financial budgets or draw supplies for use against established budget ceilings.
The total medicine budget disbursed for the public sector for the year 2000, 2001 and 2002 and 2007 in US$
was 14.1million, 16.2 million, 18.3 million, 28.5million respectively. The budget for year 2007/08 was US$
28.46 million. Although the budget has been increasing every year this however is not enough to meet the
national medicine needs.
The Tanzania Food and Drugs Authority (TFDA) is responsible for the regulation of medicines and conducts
inspections of the private and public drugs outlets in Tanzania.
Tanzania has about 640 registered Pharmacists, 352 Pharmacy Technicians (PT) and 312 pharmacy
Assistants4. The Pharmacy Council is responsible for regulating the pharmacy profession and for registering
the pharmaceutical personnel in the country.
2.4 Rationale of the assessment
The increase of scope of activities within the past few years has seen an increase in the number of partners
involved in the procurement and supply management of essential medicines, especially those for priority
diseases such as HIV/AIDS, TB and malaria. This increase in roles and upsurge in funding from both the
government and partners to service the health facilities have affected the way the central supply system
operates as it puts more demands for reporting, coordination and accountability with all stakeholders and in
particular funding agencies. These challenges have spilled over to health facilities where parallel reporting is
also still needed despite the inadequate human resources.
It is against this background that Tanzania decided to do an in-depth assessment of procurement and supply
management system as well as mapping of the partner’s coordination within the procurement and supply
management system.
4Source –Pharmacy Council

IN-DEPTH ASSESSMENT OF THE MEDICINES SUPPLY SYSTEM IN TANZANIA 5
3. STUDY DESIGN AND METHODOLOGY
3.1 Survey purpose
The objective of this assessment was to carry out an in-depth assessment of the country medicine supply
management systems and also the financial flows for essential medicines and medical supplies. Subsequently
it aims at providing a situation analysis of the strengths and weaknesses of existing medicines supply systems
and to propose recommendations and strategies on how to improve them.
Specific objectives were:
To undertake an in-depth assessment of medicines financing and financial flows for the existing
systems for procurement and distribution of essential medicines including medicines for HIV/AIDS,
TB, malaria, opportunistic infections, contraceptives, vaccines, condoms, HIV/AIDS test kits, medical
devices and laboratory products.
To identify and analyse at each level of the medicines supply management cycle (selection,
procurement, distribution, and use), the actors involved in each category of product.
To determine the strengths and weaknesses of existing medicines supply systems and to propose
recommendations and strategies on how to improve them.
To disseminate results to stakeholders to help develop a coordinated, coherent and efficient national
medicines supply plan or strategy.
3.2 Methodology
The assessment focused mainly on the Public health facilities’ medicines supply system. The survey was
carried out using the WHO draft tool for the in-depth assessment of the medicines supply management
systems (June 2007 version). The survey tool consisted of questionnaires for the following level of health
care:
Questionnaire N° 2 Ministry of health
Questionnaire N° 3 Priority disease programs
Questionnaire N° 4 Central Medical Stores
Questionnaire N° 5 District stores
Questionnaire N° 6 Health facilities
For each level, the questionnaire addressed medicines supply management issues around:
Structure
Selection
Quantification
Procurement
Ordering
Storage & stock management
Distribution
Quality assurance
Rational use
Resource allocation0
Information management
Monitoring and evaluation, and
Human resource

IN-DEPTH ASSESSMENT OF THE MEDICINES SUPPLY SYSTEM IN TANZANIA6
3.2.1 Sampling and survey population
The assessment assessed the procurement and supply management systems in six geographical areas
representing the Eastern, Western, Central, Northern, and Southern parts of Tanzania. Dar es Salaam was
purposely chosen as the capital city of Tanzania mainland and the other five administrative regions also
purposely chosen were Mwanza, Tabora, Moshi, Mbeya and Mtwara.
The criteria for selection of the sites was based on the intensity of the health service activities carried out,
the geographical and economical distribution and the presence of a comprehensive health system structure,
comprised of primary, secondary and tertiary levels of health care. Presence of a functioning medical store
and operating distribution system was a prerequisite.
The areas are economically different with Dar es salaam and Mwanza being more economically vibrant
followed by Mbeya and Moshi. Tabora and Mtwara represented the least developed regions.
Dar es Salaam region is the commercial capital of Tanzania. Mwanza city is on the shores of Lake Victoria
and is economically vibrant with activities such as mining, fishing industries and farming. Mbeya is an
agricultural town with increasing trade activities along its borders with Zambia and Malawi. Moshi on the
other hand is an emerging tourist center. Its economy is dependent on the service industry, tourism and
agriculture of cash crops for export. Tabora and Mtwara represent the economically unstable regions with
some activities of subsistent farming as their major source of income.
The selected sites took into account the six Medical Stores Zonal branches of Mwanza, Tabora, Mbeya,
Mtwara, Moshi and Dar es Salaam. The Ministry of Health and Social Welfare (MOHSW) provided the list of
health facilities. Those closest to the regions/ districts and zonal medical stores were chosen for the survey.
Since the sampling was representative, the results can be generalized to the country.
In each region, the following units were surveyed:
At the central level:
The Medical Store Department as well as the following vertical programs were surveyed:
1 Eye Care Services
2 National TB& Leprosy
3 National Malaria Control
4 National Aids Control
5 Reproductive and Child Health
6 Extended Program on Immunization
At the Regional level, a total of five zonal medical stores and twenty seven Health facilities were surveyed
as follows:

IN-DEPTH ASSESSMENT OF THE MEDICINES SUPPLY SYSTEM IN TANZANIA 7
Table 3: Facilities visited
AREA MTWARA MBEYA TABORA MOSHI MWANZA DAR ES
SALAAM
Type of facility
Regional Store or Zonal Medical
Store
1 1 1 1 1 1
Referral Hospital 0 1 0 1 1 1
Regional Hospital 1 1 1 1 1 0
District Hospital 1 1 1 0 1 1
Health Center 1 0 2 1 1 1
Dispensary 1 2 0 2 1 1
Sub Total 5 6 5 6 6 5
Grand Total 33
3.2.2 Training of the Survey Teams
The survey team comprised of numbers 12 data collectors, one data analysts and a coordinator. The data
collectors consisted of pharmaceutical staff from the public as well as the private sectors as well as members
from the academia.
The training of data collectors took place in Dar e s Salaam, Tanzania from 25th -27th July 2007. A field test
of the data collection instrument was carried out at the training location. After the training, each region was
assigned a team of two data collectors.
Later on, three data analysts from Tanzania participated at a three day workshop on data entry and analysis
that was organized by WHO in Accra- Ghana from 21st – 23rd August 2007. The training equipped the
participants with basic knowledge on handling the software programs.
3.2.3 Data collection
Data was collected from health facilities in the six regions between 30th July 2007 and 3rd August 2007. Face
to face interviews using structured questionnaires were used to collect data and information.
The coordinator for the assessment and two data collectors gathered information on policy issues affecting
the medicines supply management system at the ministry of health level and vertical disease programs.
3.2.4 Data entry and analysis
Data collected for all sites surveyed was entered into a software and analysed by the data analysts. To
ensure accuracy of the data, the national Coordinator counterchecked all data entered against the original
filled-in questionnaires. During this exercise, data entry errors were corrected. Where there were technical
problems in correcting data entry errors, communication to the Software Engineer commissioned by WHO in
Accra was made via email.

IN-DEPTH ASSESSMENT OF THE MEDICINES SUPPLY SYSTEM IN TANZANIA8
3.2.5 Scope and limitation of the assessment
The findings of the assessment are limited to the questionnaire tool used to collect information and data.
Some data could not be obtained. For example, the financing and funding flows of the health facilities could
not be captured with precision, since most of the facilities do not control any funds and staff interviewed had
no direct access to information and records of the budgets for their health facilities. Most of the financial
information is kept at the Administration office and in Accounts sections and time was not adequate to gather
the information from those other sources. The Health centers and Dispensaries in particular were not able
to provide adequate information on funding since they receive medicines and medical supplies against an
allocated budget line which is managed by the Medical Stores Department.

IN-DEPTH ASSESSMENT OF THE MEDICINES SUPPLY SYSTEM IN TANZANIA 9
4.0 RESULTS AND ANALYSIS
4.1 Structure of medicines supply system in Tanzania
The Medical Stores Department, created in 1993, is a semi-autonomous unit under the ministry of health. It
operates a self sustaining revolving drug fund and its main customers are the Zonal Medical Stores which
supply products to regional and districts hospitals, health centers and dispensaries. The Central store and
the zonal stores together form an institution known as the Medical Stores Department, which has a governing
Board of Trustees. This Board appoints directors of MSD. A management committee comprising of all directors
meets regularly to discuss issues pertaining to the management of the organization.
The five zonal stores visited (see table below) reported to not having independent Boards but rather had
management committees comprising of stores managers, warehouse officers and accountants and other
professionals. Each store operated a separate Bank Account that serves as a collection account for earnings
on sales as well as for servicing the operational business.
Table 4: Formation of Zonal Stores
Name of the store Name of region Distance in Km from
the MSD
Date of creation
MWANZA MWANZA 1164 JULY 1994
TABORA TABORA 1023 JULY 1994
MTWARA MTWARA 580 JULY 1994
MBEYA MBEYA 850 JULY 1998
MOSHI KILIMANJARO 562 JULY 2000
All health facilities visited had pharmacy sections which are under the leadership of the Medical Officer in
Charge.
4.2 Categories of products managed at various level of care
The table below shows the category of products managed at each level. It can be seen that not all products
are managed by all the facilities. For HIV products for example, only 48% health facilities reported to manage
them.
IN-DEPTH ASSESSMENT OF THE MEDICINES SUPPLY SYSTEM IN TANZANIA10
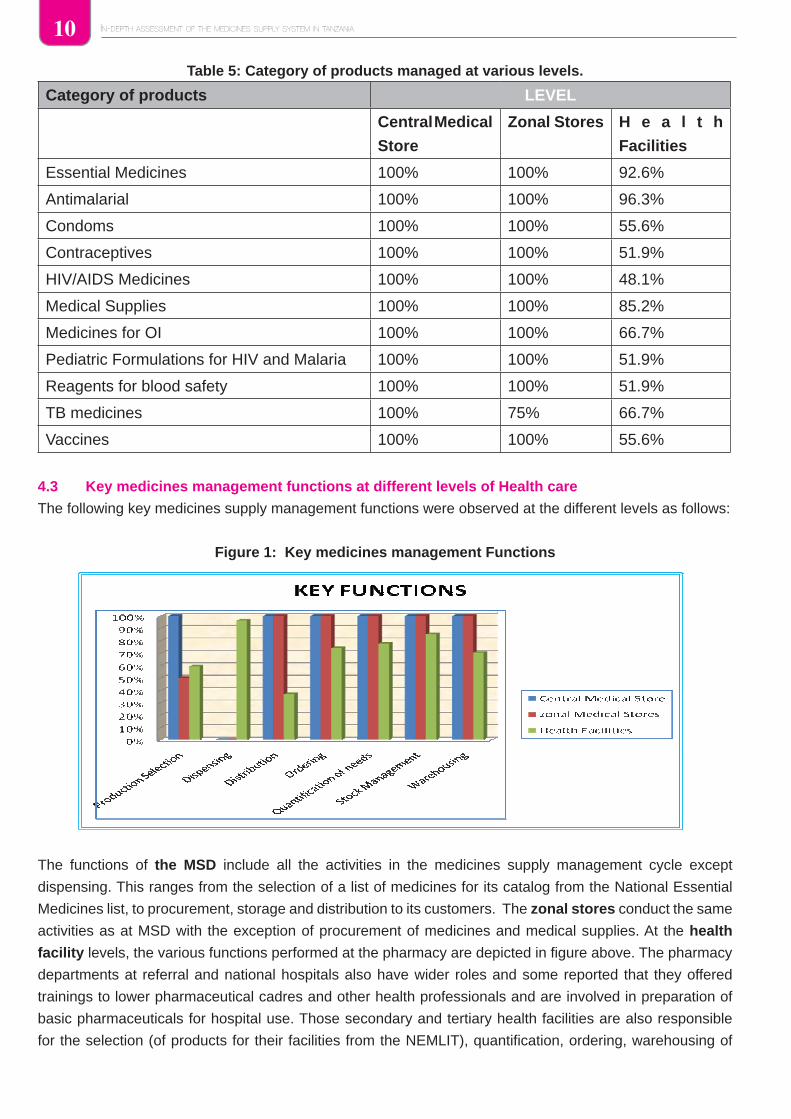
Table 5: Category of products managed at various levels.
Category of products LEVEL
Central Medical
Store
Zonal Stores H e a l t h
Facilities
Essential Medicines 100% 100% 92.6%
Antimalarial 100% 100% 96.3%
Condoms 100% 100% 55.6%
Contraceptives 100% 100% 51.9%
HIV/AIDS Medicines 100% 100% 48.1%
Medical Supplies 100% 100% 85.2%
Medicines for OI 100% 100% 66.7%
Pediatric Formulations for HIV and Malaria 100% 100% 51.9%
Reagents for blood safety 100% 100% 51.9%
TB medicines 100% 75% 66.7%
Vaccines 100% 100% 55.6%
4.3 Key medicines management functions at different levels of Health care
The following key medicines supply management functions were observed at the different levels as follows:
Figure 1: Key medicines management Functions
The functions of the MSD include all the activities in the medicines supply management cycle except
dispensing. This ranges from the selection of a list of medicines for its catalog from the National Essential
Medicines list, to procurement, storage and distribution to its customers. The zonal stores conduct the same
activities as at MSD with the exception of procurement of medicines and medical supplies. At the health
facility levels, the various functions performed at the pharmacy are depicted in figure above. The pharmacy
departments at referral and national hospitals also have wider roles and some reported that they offered
trainings to lower pharmaceutical cadres and other health professionals and are involved in preparation of
basic pharmaceuticals for hospital use. Those secondary and tertiary health facilities are also responsible
for the selection (of products for their facilities from the NEMLIT), quantification, ordering, warehousing of

IN-DEPTH ASSESSMENT OF THE MEDICINES SUPPLY SYSTEM IN TANZANIA 11
medicines and medical supplies. Vertical programs also performed some of supply management functions
as shown below:
Figure 2: Supply functions performed by vertical programs
The figure above illustrates involvement of the vertical disease programs in the medicines supply management
system in Tanzania. As part of the health sector reforms in the country, the procurement and supply
management activities of the vertical programs are supposed to be integrated within the one system of the
MOHSW used for all medicines.
4.4 Customers at various levels of PSM
With regards to customers of the stores, the Central Store serves all Zonal Stores as well as the national
hospital and some facilities in Dar es Salaam. The zonal stores are geographically distributed to provide
medicines and supplies closest to the population. The Table below shows the customers of MSD and its
Zones.
Table 6: Customers at the various level of the supply system
Customers LEVEL
Central Medical Store Zonal Stores Health Facilities
District Facilities 100% 100% No responses
District warehouses 100% 50% -
Faith-based HF 100% 100% -
Health Facilities 100% 100% -
NGOs 100% 50% -
Patients 100% 0% -
Private pharmacy 0% 0% -
Regional health facilities 100% 75% -
Schools - 25% -
Armed Forces - 25% -
Responsibility of programmes
0%20%40%60%80%
100%
Pro
du
ctse
lect
ion
Dis
trib
uti
on
Qu
anti
fica
tio
no
f n
eed
s
War
eho
usi
ng
Dis
trib
uti
on
Sto
rag
e
% o
f p
rog
ram
mes
th
at p
erfo
rm
fun
ctio
n

IN-DEPTH ASSESSMENT OF THE MEDICINES SUPPLY SYSTEM IN TANZANIA12
The MSD and its zones therefore supply products to health facilities at the central level i.e. national referral
hospitals, regional health facilities, district health facilities, health centers and dispensaries, faith based health
facilities, approved non-governmental organizations, armed forces, schools and other training institutions
that have medical services within their establishment. However, health facilities do not supply to any lower
levels.
4.4.1 Turnover at MSD
The figure below states the total sales and percentage mark-up at the MSD in three consecutive years:
Table 7: Total sales in Us Dollar and percentage mark-up of MSD 2004-2006
Year 2004 2005 2006
Turnover in US$ of the MSD 38,417,481 52,000,000 86,980,000
% mark-up of total sale 17% 17% 15.5%
The Zonal stores and health facility pharmacies do not sell products but rather distribute further the products
to lower levels.
4.5 Selection of Products
Selection of products is done in accordance to the National Essential Medicines List for Tanzania (NEMLIT).
The selection of products for the National Essential Medicines List for Tanzania (NEMLIT) is done at the level
of ministry of health. The MSD further selects a list of medicines and medical supplies for its price catalogue.
Facilities use MSD price catalogue as a guide to place orders with MSD.
4.5.1 Availability of EML and STG
The draft 2007 revised version of NEMLT was available at the MSD. There were no treatment guidelines
found except those for tuberculosis the version last reviewed in 2005/06.
The draft EML was available in 80% of the Zonal stores. There were no STGs found in Zonal Stores.
With respect to health facility pharmacies, 38% only had the EML, and the ones in use were last revised in
2006 and were in a draft form.
4. 5.2 Use of NEMLT in procurement
Results showed that at the MSD, procurement of essential medicines is not limited to the EML. It was
reported that there are medicines for tertiary care procured under request of health institutions offering care
and management. Reasons for non compliance with the NEMLIT are as follows:
Table 8: Reasons for non-compliance with the NEMLT in procurement
Reasons for procuring out of the EML Ranking of priority
(No 1 is the most important and 3 the
least)
a. The prescribers do not agree with the STG 1
b. The EML does not address local needs or demand 2
c. The products on the EML are not available from the suppliers
(CMS, regional warehouse, district warehouse…)
3

IN-DEPTH ASSESSMENT OF THE MEDICINES SUPPLY SYSTEM IN TANZANIA 13
Reasons for Non compliance with EML at facility level
0.00%
5.00%
10.00%
15.00%
20.00%
25.00%
30.00%
35.00%
Limitin
g is n
ot de
fined
in ph
arma.
.
EML d
oes n
ot ad
dres
s loc
al ne
ed ..
EML n
ot re
vised
and n
ot co
nform
...
Last
vers
ion of
EML
not a
vaila
ble
Pres
cribe
rs no
t fam
iliar w
ith S
TGs
Presc
riber
do n
ot ag
ree
with S
TGs
Produ
cts fr
om E
ML no
t ava
ilable
% of facilities
Similarly at the health facility level, only about 52% of facilities procured medicines within the EML. The
main reasons for non compliance are that the EML does not address local needs (33% of facilities) and that
products from EML are not available (22%). Other reasons are shown in Figure below:
Figure 3: Non compliance with EML at facility level
4.6 Quantification / Forecasting
At the Central Medical Store there is a special committee responsible for forecasting and quantification
of essential medicines. Other category of products such as HIV/AIDS medicines, anti-malarias etc. are
forecasted and quantified by their respective vertical programs. At the health facilities it was found that seven
health facilities out of twenty seven conducted quantification exercises on an annual basis; four indicated that
they do not do quantification while sixteen did not respond to the question.

IN-DEPTH ASSESSMENT OF THE MEDICINES SUPPLY SYSTEM IN TANZANIA14
The information used in the quantification at the different levels is shown in the table below:
Table 9: Information used in the quantification of needs
Information Used LEVEL
Central Medical
Store
Zonal Medical
Stores
Health Facilities Program
1st Consolidating
distribution data
(100%)
Consolidating
distribution data
(100%)
Dispenser
to user data
(77.8%)
Demographic data
(83.33%)
2nd Consolidating
decentralized
forecasts (100%)
Expiry dates of
stock on hand
(100%)
Stock on hand at
all level (59.3%)
Consolidating
decentralized
forecasts
(66.67%)
3rd Donations provided
by partners/donors
(100%)
Stock out
duration (75%)
Available finance
(51.9%)
Standard
Treatment
Guidelines
(66.67%)
4th Seasonal and
regional variations
(100%)
Available finance
(50%)
Standard
Treatment
guidelines
(51.9%)
Dispenser to user
data (66.67%)
5th Standard Treatment
guidelines (100%)
Consolidating
decentralized
forecasts (50%)
Demographic
data (51.9%)
6th Stock on hand at all
level (100%)
Seasonal
and regional
variations (50%)
7th Expiry dates of stock
on hand (100%)
Stock on hand at
all level (50%)
The following factors were important in determining quantification needs: Consumption or distribution pattern,
available finances and stock on hand as well as expiry dates of stock at hand, all of which are widely used
across all the four levels. At the CMS, other information is also used, such as donations, Standard Treatment
Guidelines and Seasonal variations. Zonal stores also took into account available finances and seasonal
variation, while health facilities do consider available finances and standard treatment guidelines as well as
demographic data. The latter data are also commonly used at program level.
The table below explains the various categories of staff involved in the quantification of different categories of
products at different levels. The table also shows the tools used in quantification and forecasting of medicines.
With regards to this, the Central Medical Store uses an Enterprise Resource Planning (ERP) tool (Orion) in
the quantification of essential medicines and medical supplies. Quantification of needs for medicines and
medical supplies is performed once in a year. The medical store has a procurement plan developed by the
procurement management unit of the department. The plan includes medicines and supplies financed by
partners.

IN-DEPTH ASSESSMENT OF THE MEDICINES SUPPLY SYSTEM IN TANZANIA 15
As for health facilities, quantification of needs is done manually. Use of computer programs is much less
common and excel is the most used program.
Table 10: Responsibilities & tools use in quantification
Level of Care Category of products Responsible staff Tool used
MSD Essential medicines Forecast Committee Orion
Programs HIV/AIDS Team comprising JSI, NACP, Clinton
Foundation
Excel
Paediatric formulations
for HIV/AIDS and
Malaria
Team comprising JSI, NACP, Clinton
Foundation
Excel
OI Team comprising JSI, NACP, Clinton
Foundation
TB Supplies Officer MS Access
Malaria Excel
Vaccines UNICEF None
Reagents for blood
safety including HIV/
AIDS
'Team comprising JSI, NACP, Clinton
Foundation
Excel
Condoms Supplies Officer Excel, Papiline
Contraceptives Supplies Officer Papiline
Zonal stores Essential medicines,
Antimalarials,
Area managers, pharmacist and
warehouse officers
Support Manual
Condoms, Area managers, pharmacist and
warehouse officers, Program Manager
Support Manual
Contraceptives Pharmacist, Area manager, nurse,
warehouse officer, Program Manager
Support Manual
HIV/AIDS medicines Area managers, pharmacist and
warehouse officers, Program Manager
Support Manual
Medical supplies Area managers, pharmacist, warehouse
officers and nurses,
Medical
Supplies
OI National AIDS Control Programme,
pharmacists, manager
Support Manual
Paediatric Formulations
HIV and Malaria
National AIDS Control Programme,
warehouse officers, pharmacist,
manager
Support Manual
Reagents Advanced Diploma in Medical Laboratory
Technology, National AIDS Control
Programme, Pharmacist
TB medicines TB and Leprosy Coordinator, Medical
doctor, pharmacist
Vaccines Medical doctor, environmental health
officer, pharmacist, manager.

IN-DEPTH ASSESSMENT OF THE MEDICINES SUPPLY SYSTEM IN TANZANIA16
Level of Care Category of products Responsible staff Tool used
Health
Facilities
Essential Medicines Hospital pharmacist, Clinical Officer,
Health Facility in charge, Medical Doctor,
pharmaceutical assistant, AMO, Supply
Officer.
Excel, Support
Manual, Manual
ledger book
Antimalarial Hospital pharmacist, Clinical Officer,
Nurse Assistant
Excel, Support
Manual
Condoms Peer educator, Medical doctor, Regional
AIDS Coordinator, Head of general Store,
Nursing Officer, RCH Coordinator, MCH,
Clinical Officer
Support Manual
Contraceptives Peer educator, Medical Doctor, MCHCO,
Nurse, Nursing officer, RCH coordinator,
MCH, Clinical Officer
Support Manual
HIV/AIDS Medicines Hospital Pharmacist, Excel, Support
Manual
Medical Supplies Hospital Pharmacist, Supplies officer,
Pharmaceutical technician, AMO, Head
of Facility, Clinical Officer
Support Manual
OI Hospital Pharmacist, Clinical Officer Support Manual
Paediatric Formulations
HIV and Malaria
Hospital Pharmacist, Support Manual
Reagents Laboratory technologist, Hospital
therapeutic committee
TB medicines Regional TB coordinator, Medical Doctor,
District TB and leprosy coordinator,
Clinical Officer
Support Manual
Vaccines Hospital Pharmacist, Health officer,
Nursing Officer, RCH coordinator,
Regional Cold chain coordinator, District
cold chain coordinator
Support Manual
The assessment also found that only six out of twenty seven facilities reported to have procurement and
supply management plans. Copies of the plans were provided, however in all of them the procurement plan
did not include medicines and supplies financed by partners. All facilities with the procurement plan affirmed
that they had a committee for the development of the plan.
4.7 Procurement
At the Central Store, procurement of essential medicines and all other categories of products are procured
by the MSD Tender Board. The tender board membership is comprised of people with different qualifications
including, Pharmacists, Financial experts, Material Management staff and Logisticians.
The area managers are responsible for procurement at the zonal levels, while at the health facility level,
different people procure medicines. This could be the supplies officer, Nursing Officer, Head of Facility,
Pharmacist or RCH coordinator depending on the facility in question.

IN-DEPTH ASSESSMENT OF THE MEDICINES SUPPLY SYSTEM IN TANZANIA 17
The most common tendering methods include the following:
Table 11: Tendering methods percentages of application and lead times in days
Central Medical Store Health Facilities
Average
lead time
Average
lead time
Responsible for procurement Tender
Board
Supplies officer, Nursing
Officer, Head of Facility,
Pharmacist, RCH
coordinator
Procurement Methods
International Competitive Bidding 80% 150 0%
National Competitive Bidding 100% 45 3.7% 75
Negotiated Tender 0% 30 3.7% 90
Selective Bidding 10% 90 3.7%
Direct Procurement 2% 18 22% 16.7
Shopping 3% 7 -
For the central medical stores, lead times for the procurement are further graphically displayed below:
Figure 4: Procurement Methods and Lead Times
As can be seen, procurement through international competitive bidding is the slowest procurement method
as it has a lead time of 150 days. Selective bidding is also slow (90 days), while direct procurement and
shopping are the fastest methods (respectively 18 and 7 days).
Lead time for procurement CMS
020406080
100120140160
Intern
ational
Compe
ti tive
Bidding
National
Compe
titive
Bidding
Negotia
ted T
ende
r
Selecti
ve Bidd
ing
Direct
Procurem
ent
Shopp
ing
Length in days

IN-DEPTH ASSESSMENT OF THE MEDICINES SUPPLY SYSTEM IN TANZANIA18
The Central Store applies the following Incoterms during procurement ie CIF, DDP, FOB, DDU and CPT/
C&F.
The Medical Store Department reported that it considered all the criteria in the questionnaire when awarding
contracts. There is a technical committee responsible for analyzing tenders; the award of tenders is made by
its tender board. The results of the tender are publicly declared before participating bidders. Results of the
tender are only read out during the opening of bids, but are not published. The frequency of procurement is
once a year but there is in between emergency purchases that follow the same procedures.
At the Health Facility level, the criteria in the questionnaire are not widely used. The most commonly used
criteria are price (19% of facilities), performance of supplier (15%) and quality of product (11%). It was
found that SOP documents for call of tenders were used in few facilities (3.7%) and the rest had none. Pre-
selection of suppliers was practiced by 11% only of the facilities surveyed. Most procurement of medicines
done by health facilities sources supplies from within the country as such INCOTERMS are not applied in
purchase contracts.
Table 12: Criteria Considered when awarding contracts
Criteria Central Medical Store Health Facilities
1st National preference Price (18.5%)
2nd Performance of Supplier Performance of supplier (14.8%)
3rd Price Quality of product (11.1%)
4th Quality of product
5th Stated delivery time
6th Supplier terms of payment
4.7.1 Sources of procured products at the Central Store
At CMS, the greatest percentage of expenditure is for products purchased from International Suppliers.
In particular, international suppliers account for all the expenditure on antimalarial and vaccines. Local
manufactures account for the largest share of essential medicines, while international manufactures provide
the greatest part of HIV medicines. Local distributors account for the largest shares of medical supplies,
medicines for opportunistic infections and reagents.

IN-DEPTH ASSESSMENT OF THE MEDICINES SUPPLY SYSTEM IN TANZANIA 19
Procurement sources
33%
45%
22%
Exclusively from MSDOther sources
No response
Table 13: A summary of award Contracts in US $ for the year 2006
Category of Products
Sources of Procurement
International
supplier
US$
International
manufacturer
US$
Local
Distributor
US$
Local
Manufacturer
US$
Others
Specify
US$
Essential Medicines 5,163,633 2,237,051 11,774,583
HIV/AIDS medicines 2,547,538 68,347
Antimalarials 14,865,324.26
TB medicines
Medicines for opportunistic
infections
959,674.94
Pediatric formulations for
HIV/AIDS and malaria
Vaccines 269,364
Contraceptives 1,565,950 912,012
Condoms 967,050
Medical supplies 5,185,089 7,680,927 1,529,303
Reagents for blood safety
including HIV test kits
187,541
With regards to health facilities, results show that only 33% of them procure products exclusively from the
MSD which is the national procurement agent. Some health facilities however, procure medicines and
supplies from other sources as indicated below:
Figure 5: Procurement sources and their frequency of use

IN-DEPTH ASSESSMENT OF THE MEDICINES SUPPLY SYSTEM IN TANZANIA20
4.8. Ordering
Ordering at CMS is strictly performed on an annual basis, while zonal stores order according to their needs. As
for Health Facilities, about half of them place their orders every three months, while the rest order according
to needs. Not many responses were obtained from programs, but annual ordering and ordering according to
needs seem to be the most common options
Table 14: Frequency of Ordering
Frequency CMS ZMS HF Program
Quarterly 0% 0% 44.4% 0%
Semi-annual 0% 0% 0% 0%
Annual 100% 0% 0% 16.7%
According to the needs 0% 100% 44.4% 16.7%
For the Central store, the average lead time for deliveries is 5-8 months by sea and 90 -120 days by air and
within 90 days by land. The central Store is 80 km, 3 km and 700 km from the airport, sea port and border
respectively. The average time taken to remove products from the port, airport and border is 21 days, 7 days
and 3 days respectively. The main problems encountered during the customs clearance of products are:
a) From the sea port - lengthy clearing and customs procedures
b) From the airport - lengthy inspection time and
c) At the border points - lengthy documentation processes.
The average time it takes to transport products to the central Store from the sea port and airport is one hour
while from the border is one day.
Performance of the supplier is measured using the following performance indicators:
Table 15: Indicators used in measuring Suppliers` performance
Performance Indicators Rel. Freq.
Products delivered conform to order 70
Respect of storage conditions 56
Quality of service after sales 30
Respect of agreed delivery time schedule 30
Damages and losses 4
Volume of supplies handled by the Central Store in the year 2006 is as follows:
Table 16: Volume of Imports by Central Store in 2006
Volume of Imports in 2006
Number of 40 feet
containers
Number of 20 feet
containers
Volume in m3 for the
maritime or surface
shipping
Volume in m3 by
airfreight
70 115 600 350

IN-DEPTH ASSESSMENT OF THE MEDICINES SUPPLY SYSTEM IN TANZANIA 21
The Zonal stores however, place their orders with the Central store according to needs. There is an internal
policy of replenishing their stocks fortnightly. All products are delivered by the Central Store to the zones.
Average lead time to receive products ordered from a higher level is fourteen (14) days.
4.9 Delivery
At zonal stores most of the deliveries are performed by the supplier, while at the health facilities level, it is
quite common for facilities to collect items themselves (48% of facilities do so).
Table 17: Delivery types at all levels
CMS ZMS HF
Delivery
By the supplier - 100% 59.3%
Collected by the store - 25% 48.1%
Delivered by office of DMO 4%
4.9.1 Indicators used for assessing products delivered
The CMS uses all the indicators which were given in the questionnaire. Zonal stores and health facilities
however tend to use product conformity to order and respect of storage conditions, but they are less likely
to use quality of service after sales and respect of agreed delivery time schedule as indicators for quality
delivery of products. In general, Health Facilities are less likely to assess products delivered than CMS and
zonal stores.
Figure 6: Percentage use of indicators for assessing product delivered
Indicators used for assessing product delivered
0%
20%
40%
60%
80%
100%
120%
Product conforms to order
Quality of services after sales
Respect of agreed delivery time
schedule
Respect of storage conditions
CMS ZMS HF

IN-DEPTH ASSESSMENT OF THE MEDICINES SUPPLY SYSTEM IN TANZANIA22
4.10. Storage/Stock Management
4.10.1 Adequate storage capacity
Storage capacity at the Central Store in Dar es Salaam in year 2006 was 20,000 cubic meters. This amount of
storage space was considered adequate for storing forecasted quantities of medicines and medical supplies.
The store had clearly demarcated areas as shown below:
Storage area Yes
Reception of products a
Quarantine of products a
Storage of dangerous products a
Product requiring cold chain <8°C a
Main storage a
Products returned from customers a
Expired/damaged products a
Delivery of products a
Products from various partners(programs) a
The storage capacities in cubic meters of the following Zonal stores are: Mwanza (1305), Mbeya (10660),
Mtwara (11000), Tabora (526) and Moshi (5051). Only half of zonal stores reported to have adequate storage
capacity. Also some of the stores however had clearly demarcated areas as shown below:
Storage area Yes (%)
Reception of products 60
Quarantine of products 0
Storage of dangerous products 80
Product requiring cold chain <8°C 100
Main storage 100
Products returned from customers 40
Expired/damaged products 60
Delivery of products 20
Products from various partners(programs) 60
In the facility pharmacies however, storage space was found to be 622.85 cubic meters. The storage space
for forecasted quantities of medicines and medical supplies was inadequate and this was affirmed by 56% of
facilities surveyed. Only 33 % of the health facilities had adequate storage space. Pharmacies that had a
separate and demarcated area for delivery of products were only 33%. Expired stocks did have a separate
storage space in only 41% of the pharmacies. Most pharmacies (71%) had a main storage place. As regards
products requiring cold storage of between < 80C, only 52% of the pharmacies had the facilities. Also it
was found that products from various partners and programs had no separate storage space. This was a
challenge for most pharmacies (63%). Products returned from customers had no separate place for their
storage and this was affirmed by (77%) of the pharmacies. Reception of products, quarantine and storage of

IN-DEPTH ASSESSMENT OF THE MEDICINES SUPPLY SYSTEM IN TANZANIA 23
dangerous products were evaluated to be 33%, 30% and 37% respectively in the pharmacies evaluated. The
other storage parameters are generally good in most of the facilities studied as indicated below:
Figure 7: Percentage adequacy of storage capacity at all levels
Adequacy of storage capacity
0%
50%
33%
0%
10%
20%
30%
40%
50%
60%
CMS ZONAL HF
Facility with adequatecapacity
4.10.2 Storage conditions
Storage conditions seemed to be excellent at the CMS since they satisfied all the criteria included in the
questionnaire. Conditions were also extremely good at zonal stores, where all the criteria were satisfied by all
stores. Only one zonal store – Mtwara reported shortage of storage equipment. As regards health facilities,
the storage conditions were less good than in the two previous levels. The main problems encountered at the
facility level included inadequate storage equipment (only 22% have adequate equipment) and temperature
control (only 33% of facilities have cold chain storage with chart and only 41% have some method to control
temperature.
Table 18: Adherence to storage conditions
Indicator CMS ZMS HF
Adequate Storage equipment 100% 75% 22.2%
Area is free from moisture 100% 100% 88.9%
No direct sunlight on products 100% 100% 85.2%
Products no on the floor 100% 100% 63%
Products stored in a systematic way 100% 100% 55.6%
Security measures to avoid burglary 100% 100% 81.5%
Storage equipment available 100% 100% 70.4%
Doors with adequate locks and keys 100% 100% 92.6%
Windows can be opened 100% 100% 77.8%
Method to control temperature 100% 100% 40.7%
Cold chain storage with chart 100% 100% 33.3%
No evidence of pest 100% 100% 63%
4.10.3 Stock management techniques used
At the CMS the maximum level was defined and the ‘first expires, first out rule’ was respected; traceability of
IN-DEPTH ASSESSMENT OF THE MEDICINES SUPPLY SYSTEM IN TANZANIA24
batches was also assured. At zonal stores the ‘first expires, first out’ rule was always followed, stock cards
were usually available and the traceability of batches was assured in the majority of stores. As for health
facilities, the ‘first expires, first out’ rule was usually followed by the majority (89%) and stock.
Table 19: Adherence to stock management techniques
Technique CMS ZMS HF Program
Maximum stock level defined 0% 25% 25.9% -
Minimum stock level defined 100% 25% 29.6% -
Other method 0% 25% 14.8% -
Specific tools exist for products financed by partners 0% 0% 11.1% -
Stock cards available 0% 75% 74.1% -
Stocks renewed on scheduled dates 0% 50% 44.4% -
First expires, first out 100% 100% 88.9% 16.7%
Replenishing when minimum level is reached 0% 25% 37% -
Traceability of batches assured 100% 75% 40.7% -
Inventory controls were conducted once a year during the stock taking session. However, there were
perpetual inventory controls counts made periodically as deemed necessary. But there were no regular
inventory controls in most health facilities.
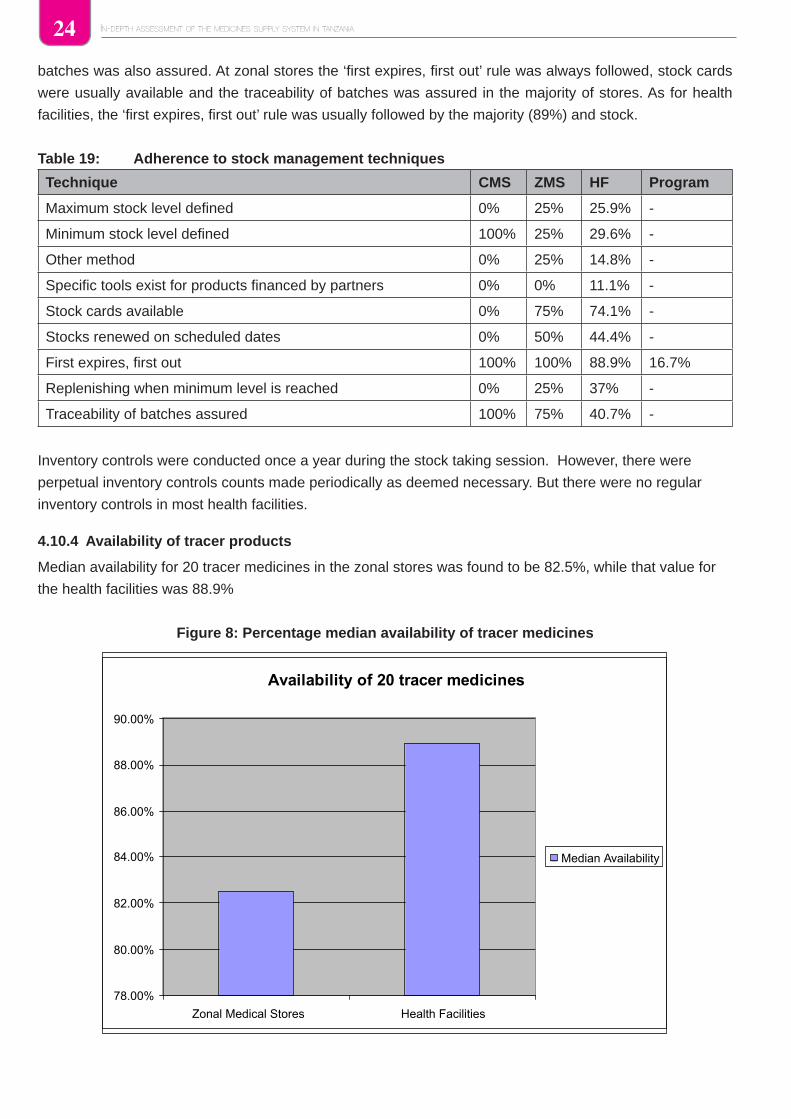
4.10.4 Availability of tracer products
Median availability for 20 tracer medicines in the zonal stores was found to be 82.5%, while that value for
the health facilities was 88.9%
Figure 8: Percentage median availability of tracer medicines
Availability of 20 tracer medicines
78.00%
80.00%
82.00%
84.00%
86.00%
88.00%
90.00%
Zonal Medical Stores Health Facilities
Median Availability

IN-DEPTH ASSESSMENT OF THE MEDICINES SUPPLY SYSTEM IN TANZANIA 25
4.10.5 Stock out days
Although availability of tracer medicines was high at health facilities, the same facilities also presented a
considerable number of stock-out days. Some medicines were out of stock for 4 months. In fact, the median
number of stock-out for the 20 tracer medicines was 135.6. Conversely, the median number of stock-out days
for zonal stores was 0, as there were no stock-out days for more than half of the medicines considered.
Main causes of stock out
The main causes of stock out at CMS were delays in delivery, errors in forecasting and maximum and
minimum not regularly updated. At zonal stores, delays in delivery was the most commonly cited cause of
stock-out (75%) together with quantities delivered not in conformity with quantity ordered. Error in forecasting
also played a part at zonal stores. As for health facilities, the main causes of stock-out were unavailability of
funds and non conformity of quantities delivered to orders (41%). Delays in delivery and errors in forecast
were also not uncommon at the Health Facilities.
Table 20: Reasons for stock outs at all levels
Cause CMS ZMS HF
1st Delay in delivery Delay in delivery (75%) Funds not available for the
order (40.7%)
2nd Error in forecast Quantities delivered not
in conformity with quantity
ordered (75%)
Quantities delivered not in
conformity with quantity ordered
(40.7%)
3rd Maximum and minimum
not regularly updated
Errors in forecast (50%) Delay in delivery (33.3%)
Error in forecast (33.3%)
4.10.6 Expiry of stocks
The amount of medicines and supplies that expired in 2006 at the central store was 3.7% of sales for the year.
Percentage of the products that expired at the stores were reported by only three stores mainly Mwanza,
Mbeya and Moshi and the value of expired products varied from 0.02-6% of annual sales for the year.
Not many data were obtained on the percentage of product expired in 2006 in health facilities but
something can be said on the main causes of expiring.

IN-DEPTH ASSESSMENT OF THE MEDICINES SUPPLY SYSTEM IN TANZANIA26
Table 21: Causes for expiry of stocks
CMS ZMS HF
% of products expired in 2006 3.7% 0.02-6% -
Main causes of expiring
1st Non respect of the
rule “first expired,
first out”
Short expiring products
provided by central store
(50%)
Errors in forecast
(37%)
2nd Modification of the
STG in the course of
the financial year
Error in the forecasts
(25%)
None compliance
to the STG by
prescribers (22.2%)
3rd Error in the
forecasts
Modification of the STG in
the course of the financial
year (25%)
Donations (14.8%)
Donations from
partners are not
limited to EML
No stock control (25%)
Unqualified staff (25%)
Supplies in excess of
orders (25%)
4.11. Distribution
4.11.1 Frequency of distribution for the various levels
The frequency of distribution of products at both the CMS and the zonal stores vary from time to time but
also distribute upon requests from their customers. Programs however tend to distribute every three or six
months.
Table 22: Frequency of distribution
Frequency of
distribution
CMS ZMS Program
Upon request 100% for hospitals and
approved NGOS
75% for hospitals and approved
NGOS
16.7%
Weekly 0% 0% 0%
Twice a month 100% for Zonal stores 0% 0%
Monthly 100% for dispensaries/HC
under Kit system
50% for dispensaries/HC under
Kit system
0%
Quarterly 100% for dispensaries/HC
under indent system
25% for dispensaries/HC under
indent system
50%
Every two months - 25% dispensaries/HC under
Kit system (due to seasonal
variations)
0%
Twice a year - - 33.3%

IN-DEPTH ASSESSMENT OF THE MEDICINES SUPPLY SYSTEM IN TANZANIA 27
4.11.2 Types, numbers and capacities of various means of transport
The Central Store uses its own transport fleet but compliments it with the hired private fleet from private
companies and their service is considered satisfactory. Supply orders are generally delivered within the
deadlines. The zonal stores also use their own fleet of vehicles for the distribution of supplies to the districts
and to some facilities that request such service. They do not use private vehicles.
Three Zonal stores mainly Mbeya, Tabora and Moshi (60%) reported that there is adequate transport to
distribute medicines and medical supplies while two others Mwanza and Mtwara stores (40%) said it is
inadequate. It was reported by 60% of the zonal stores that orders are delivered to customers within the
deadlines. The three main problems encountered during delivery/pick-up of medicines and medical supplies
in ranking order are:
Climatic problems1
Poor condition of vehicles2
Poor road network3
At the Zonal Stores there is a specific distribution system financed by partners for commodities such as HIV/
AIDS medicines, Pediatric HIV/AIDS and malaria medicines, TB and Leprosy medicines, Contraceptives and
Vaccines.
Some health facilities had means of transport for collecting and distributing medicines. Only seven (25%) of
health facilities had adequate means of transport for collection and distribution of medicines. The three main
challenges seen during collection of supplies from medical stores to health facilities in ranking order are:
(1) Lack of vehicles
(2) High cost of transportation and
(3) Poor condition of vehicles where there is one.
Table 23: The number and capacity of transport for distribution
Type of car Central Store Zonal HF HF
Number (Total
capacity)
Mwanza Mbeya Mtwara Tabora m3
Scania 24 (732m3) 2(10 ton) 2 (10
ton)
1(168CBM) 2 (10
ton)
1 (10 m3)
Isuzu CVR 2 (36 m3)
Mitsubishi canter 3 (24m3) 2 (4 m3)
Land cruiser pickup 2 (8m3) 2(2.25 ton) 1(78 CBM) 1(2.25
ton)
1 (1 m3)
Pick up van 1 (10
ton)
1 (140
CBM)
2 (2.5 m3)
Toyota escudo 1 (0.6 m3)
Toyota station wagon 1 (1 m3)
Toyota minibus 1 (3 m3)
Toyota Pick up 2 (2 m3)
Motorbike 1 (0.5 m3)

IN-DEPTH ASSESSMENT OF THE MEDICINES SUPPLY SYSTEM IN TANZANIA28
4.12 Quality Assurance system
All the criteria for assuring quality of products procured that were put into the questionnaire were used by
the CMS. For example all categories of medicines had been registered with the Tanzania Foods and drugs
Authority (TFDA). Conversely, quality assurance was much less common at the Facility and Zonal level,
where only a minority of stores controlled quality of products.
Table 24: Criteria used to assure quality of products procured
Criteria used CMS ZMS HF Program
Products from pre-selected suppliers 100% - 18.5% 16.7%
Products pre-qualified by WHO 100% - 14.8% -
Products registered in a country with high pharmaceutical regulation
(ICP/ICH)
100% - 7.4% -
Products registered in the country 100% 25% 22.2% 16.7%
4.12.1 The structures used for quality control
The central store has a mini lab facility that compliments the quality assurance system in place. The National
quality control laboratory operating under the drug regulatory authority (TFDA) performs the regular controls
and in exceptional cases an external laboratory may be contracted to perform quality checks. There is no
sub-regional quality control lab that is used.
As a quality control measure, samples of various batches are taken for analysis. The percentage of batch
failure could not be ascertained during the assessment, but it was revealed that the commonest parameter
that causes failure was deviation in weight and disintegration time of some hard dosages.
Pharmaceutical inspection by the regulatory authority has been performed in the last three years. The
positive remarks given were presence of a good storage and system flow in the facility whereas batch
tracking was rated poorly.

IN-DEPTH ASSESSMENT OF THE MEDICINES SUPPLY SYSTEM IN TANZANIA 29
The medical store has written procedure for the following processes:
Table 25: Standard operating procedures available at MSD
Processes Yes No
Selection of the products a
Quantification of needs a
Placing of order a
Reception a
Storage a
Stock management a
Inventory control a
Destruction of expired/damaged products a
Returned products a
Redistribution of products in overstock a
Distribution a
Dispensing a
Quality assurance a
Financial management a
Monitoring/evaluation/supervision a
Recruitment of personnel a
With regards to the zonal stores, samples of each batch were not systematically taken up for analysis. In
situations where the samples from facilities are drawn, the TFDA mini lab at the zonal centers are used to do
the screening tests, and then taken further for quality analysis at the National quality control laboratory. In
three years before 2006 only one (1) facility out of twenty one (21) facilities had a pharmaceutical inspection
conducted. The facilities visited had no written SOP’s.
4.13 Rational Use
Pharmaceutical information available in the Central Store is as shown below:
Table 26: Medicine Information sources
Information Sources Yes No
British National Formulary a
Donation Guidelines a
Essential Medicines List a
Internet a
Manufacturers information a
Martindale a
National Formulary a
Standard Treatment Guidelines a

IN-DEPTH ASSESSMENT OF THE MEDICINES SUPPLY SYSTEM IN TANZANIA30
4.14 Financing
Table 27 below shows the amount of expenditure in US $ and sources of financing for various category of
medicines and medical supplies.
Table: 27 Amount of expenditure in US $ and sources of financing
Category of Products
Sources of
Funds
2006
Expenditure
US$
2007
Budget
US$
%
budget
2007
Type of
financing
Essential Medicines Government 17,060,000 16,424,218 Drug
Revolving
HIV/AIDS medicines Global Fund,
Govt, CIDA,
SIDA
2,615,885 12,748,000 77.6 Grant
Antimalarial Global Fund 14,865,324 20,344,000 123.8 Grant
TB medicines - - -
Medicines for opportunistic
infections
Global Fund 959,674 2,881,000 17.5 Grant
Pediatric formulations for HIV/
AIDS and malaria
- - -
Vaccines Government 289,364 390,625 2.37 GRANT
Contraceptives Government 2,345,080 11,253,000 68.5 GRANT
Condoms Global Fund 967,050 1,848,000 11.25 GRANT
Medical supplies Global Fund 13,456,304 GRANT
Reagents for blood safety
including HIV test kits
Government 187,541 5,475,000 33.33 GRANT
During the year 2006 adequate financing was available for procurement of all categories of medicines and
medical supplies shown above. In Tanzania the government allocates 1.3% of the budget of medicines and
medical supplies for distribution and storage management purposes.
Vertical disease programs provide funding as seen in the table 28 below:
Table 28: Activities supported by Donor funding
Activities financed
Name
GFATM CDC CIDA
Yes No % Yes No % Yes No %
Warehousing/storage modernization a a a
Medicines distribution (vehicle…) a a a
Staff training a a
The government’s allocation supplements the real costs of storage and distribution. CIDA offered its support
in training MSD staff, distribution and rehabilitating and modernization of one of the MSD warehouses.
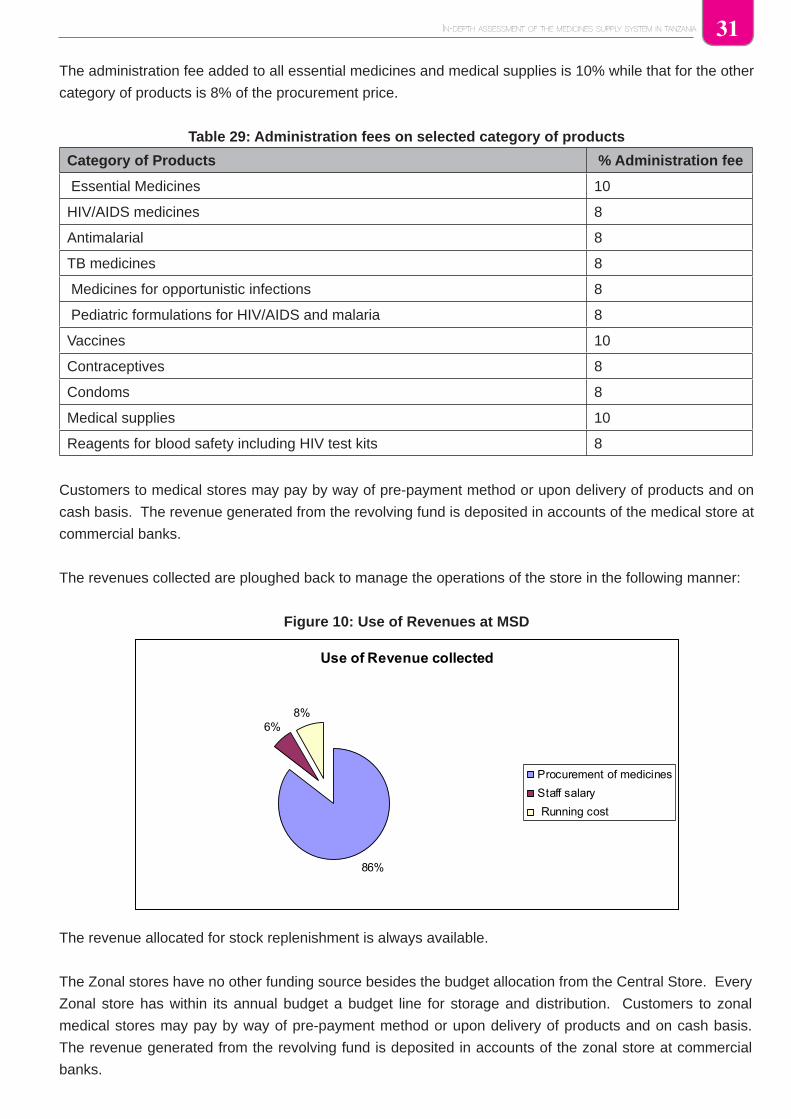
IN-DEPTH ASSESSMENT OF THE MEDICINES SUPPLY SYSTEM IN TANZANIA 31
The administration fee added to all essential medicines and medical supplies is 10% while that for the other
category of products is 8% of the procurement price.
Table 29: Administration fees on selected category of products
Category of Products % Administration fee
Essential Medicines 10
HIV/AIDS medicines 8
Antimalarial 8
TB medicines 8
Medicines for opportunistic infections 8
Pediatric formulations for HIV/AIDS and malaria 8
Vaccines 10
Contraceptives 8
Condoms 8
Medical supplies 10
Reagents for blood safety including HIV test kits 8
Customers to medical stores may pay by way of pre-payment method or upon delivery of products and on
cash basis. The revenue generated from the revolving fund is deposited in accounts of the medical store at
commercial banks.
The revenues collected are ploughed back to manage the operations of the store in the following manner:
Figure 10: Use of Revenues at MSD
Use of Revenue collected
86%
6%8%
Procurement of medicinesStaff salary Running cost
The revenue allocated for stock replenishment is always available.
The Zonal stores have no other funding source besides the budget allocation from the Central Store. Every
Zonal store has within its annual budget a budget line for storage and distribution. Customers to zonal
medical stores may pay by way of pre-payment method or upon delivery of products and on cash basis.
The revenue generated from the revolving fund is deposited in accounts of the zonal store at commercial
banks.
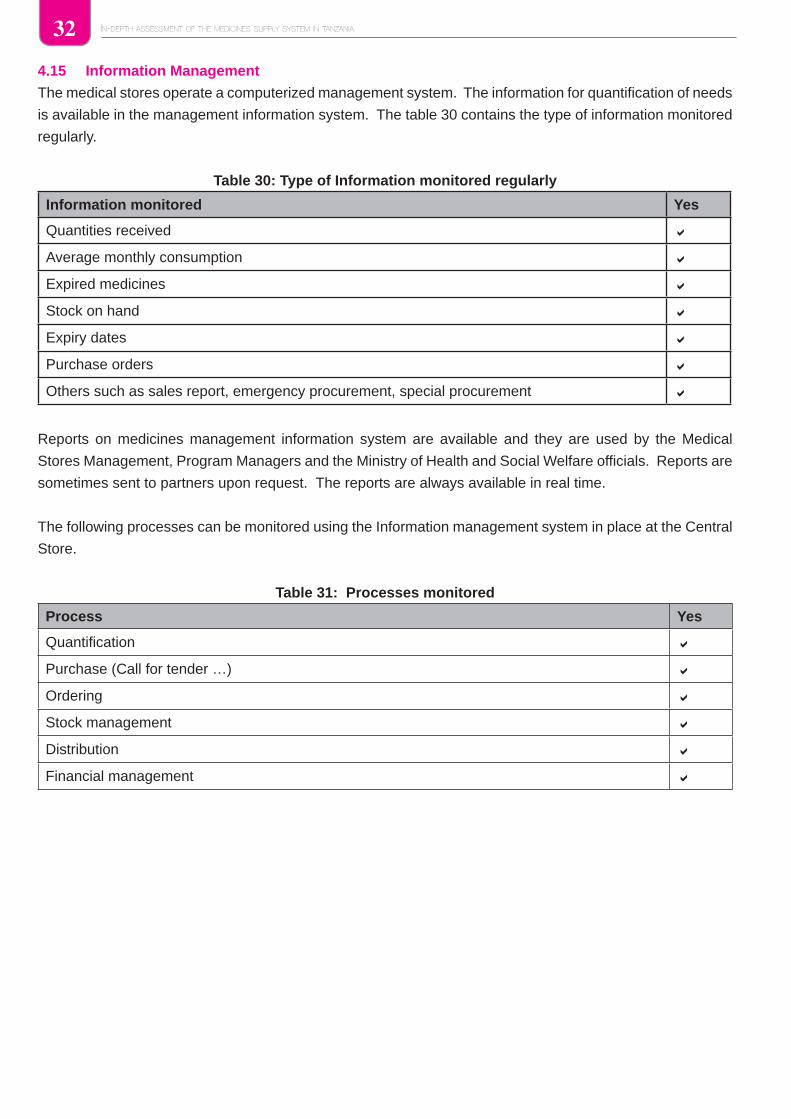
IN-DEPTH ASSESSMENT OF THE MEDICINES SUPPLY SYSTEM IN TANZANIA32
4.15 Information Management
The medical stores operate a computerized management system. The information for quantification of needs
is available in the management information system. The table 30 contains the type of information monitored
regularly.
Table 30: Type of Information monitored regularly
Information monitored Yes
Quantities received a
Average monthly consumption a
Expired medicines a
Stock on hand a
Expiry dates a
Purchase orders a
Others such as sales report, emergency procurement, special procurement a
Reports on medicines management information system are available and they are used by the Medical
Stores Management, Program Managers and the Ministry of Health and Social Welfare officials. Reports are
sometimes sent to partners upon request. The reports are always available in real time.
The following processes can be monitored using the Information management system in place at the Central
Store.
Table 31: Processes monitored
Process Yes
Quantification a
Purchase (Call for tender …) a
Ordering a
Stock management a
Distribution a
Financial management a

IN-DEPTH ASSESSMENT OF THE MEDICINES SUPPLY SYSTEM IN TANZANIA 33
Information used for quantification of needs is available in the information management system. The following
logistic information is monitored regularly at the zonal stores.
Process Yes Rel. Freq
Quantities received a 100
Expiry a 100
Stock on hand a 100
Expiry dates a 100
Average monthly consumption a 80
Damages a 20
Purchase orders a 20
Expired medicines a 20
At the zonal stores there are reports on medicines management information system. Reports are submitted to the central Store management and Heads of health facilities. Reports are distributed on a quarterly basis and they are delivered in time.
The Muhimbili National Hospital has a management information system for medicines by the name of JEEVA and they use it for quantification, Ordering, Stock management and distribution. There is no specific management system for products financed by partners.
4.16 Monitoring and evaluationThe medical store carries out supervision visits to her customers on a quarterly basis and as need arises. During supervision visits at CMS, there is no checking of stock cards, no financial monitoring and no training takes place. Checking cards is also not done at the zonal level and zonal stores are unlikely to have physical inventory performed during supervision visits. As for programs, no financial monitoring take place and training also is uncommon.
For the CMS, The schedules for supervision are normally respected. Other supervisory visits are carried out by either PSU staff of the MOH&SW or supervisors from regional or district health management teams. The vertical programs have a monitoring and evaluation component within their plan of activities.
The figure below is a summary of the activities carried out during supervision by all levels:
Figure 11: Activities carried out during supervision

IN-DEPTH ASSESSMENT OF THE MEDICINES SUPPLY SYSTEM IN TANZANIA34
At the CMS level, stock out rate, percentage of expiry, percentage of late deliveries and percentage of
products not in conformity are regularly evaluated. At the zonal level, the majority (75%) regularly measure
stock out rate and percentage of incomplete delivery. As regards facilities, performance indicators are less
evaluated. In fact, the most commonly measured is stock out rate, but only 40% of facilities evaluate. Not
many data are available on Programs, but it can be said that the most commonly measured indicators are
the number of stock out days and the percentage of expiry.
Figure 12: Performance indicators regularly evaluated
4.16.1 Performance Indicators
The assessment identified the following as key performance indicators for regular evaluation of a facility
Pharmacy.
Indicator Rel Freq. Rank order
Stock out rate 41 1
Number of stock out days 37 2
% of Expiry 33 3
% of incomplete delivery 22 4
% of late delivery 22 5
% of non conformity to order placed 3.7 6
There are no specific tools for monitoring procurement of products financed by partners.

IN-DEPTH ASSESSMENT OF THE MEDICINES SUPPLY SYSTEM IN TANZANIA 35
4.17 Human resource
The table below shows the professional category of staff, their functions, and numbers and whether they are
adequate to fulfill procurement and supply management roles at the medical stores.
Table 32: Professional category of staff and their functions
Professional category Functions Numbers Adequate Civil
servant
Yes Not Yes
Pharmacist Procurement
Specialists
5 a a
Nurse Quality Assurance 1 a a
Computer specialist 3 a
Administrative officer 2 a
Lab. Technologist Quality Assurance 1 a a
Materials Management staff Purchasing 15 a a
At the Central store and regional stores of MSD staff involved in procurement and supply management
receive initial training whereas in the health facilities they are offered training while on their job placement and
regular and continuous training is offered but on a lesser scale as shown in the figures below:
Fig 13: Level of initial training offered to staff in Procurement
Fig 14: Level of regular training offered to staff in Procurement at Health facilities
Initial training offered to staff in Procurement in Health facilities
44%
15%
41% YesNoNo comment
Regular continuos training conducted to staff in Procurement in Health facilities
15%
78%
7.40%
YesNo
No comment

IN-DEPTH ASSESSMENT OF THE MEDICINES SUPPLY SYSTEM IN TANZANIA36
5.0 DISCUSSIONS
5.1 Selection of products and order placement
The process of selection of medicines and medical supplies in Tanzania is done at four levels in the health
delivery system. The lowest level where selection of drugs is done is at a dispensary or health centre where
indent or ILS mode of ordering is operational. The second level is at Hospital level, where the hospital
management has the responsibility of selecting and placing orders. The third level is at the regional stores
where the area manager selects products from the MSD catalogue that he/she would like to stock at his area
of work. The fourth level is at the National level where PSU is responsible for selection of EML. At these
levels selection of products is made from the list of essential medicines currently in use.
The delay in the review of the EML at the central level obviously would have an impact on the medicines
procured by MSD as well as medicines available in health facilities. This would explain why MSD`s procurement
is not limited to the EML. The reasons given i.e. prescribers do not agree with STG and EML does not
address local needs or demands shows that the timely review of the EML is very important not only for the
procurement and supply system but also in the correct management of patients. The assessment also found
that the NEMLIT and STG were not available at the MSD.
All drug ordering, supervision and access to supplementary financing for drugs starts and ends with the
DMO Office, as far as the PHFs are concerned. Furthermore, many DMOs perceive themselves as active
players in the process of drug ordering at the District Hospitals (DHs) and some actually work in the hospitals
in a clinical capacity due to staff shortages. Since the DMOs have a huge range of duties to perform, their
priorities for drug delivery is bound to influence the efficiency of drug delivery and drug availability (i.e. they
are often stretched in having to manage the district (PHFs) and the hospital). In this assessment for example
only 4% of health facilities for example reported to have their products delivered by the office of the DMO
in spite of the fact that districts are supposed to have frequent distribution and supervision schedules for all
health facilities.
The Area Managers of a Zonal Medical Store (Regional Store) using their experience, past sales trends and
distribution figures generate forecast data that they use to determine quantities to order from the central
store. The manager acts cautiously when placing orders with the central store avoiding possible losses
resulting from expiry of products. In so doing only those items that have a well established demand forecast
are ordered. However since drug management techniques eg determination of minimum and maximum stock
levels have not being integrated into the procurement and supplies management system from all levels,
levels of expired medicines are high, stock out levels and durations are long.
The level of stock availability at a regional store is influenced by various factors that take place at the central
store. Some of which are inadequate stock to distribute to regional stores, lack of transport, long tendering
procedures, supplier performance, uneconomical order quantities, computer system hang-ups and at times
lack of due diligence on the part of central store staff among other issues. The many factors mentioned
invariably affect the availability of medicines and medical supplies at the health facilities as well.
It has been reported that there are supplier performance indicators used by the Central Store. One of the
indicators measure how the agreed delivery time schedule is respected by suppliers. This indicator was
ranked fourth in the order of priority after products conforming to order (1), respect of storage conditions (2)
and quality of service after sales (3) respectively. It is nonetheless important to explore the impact caused by

IN-DEPTH ASSESSMENT OF THE MEDICINES SUPPLY SYSTEM IN TANZANIA 37
supplier delays in delivering the products beyond the agreed time schedule. Furthermore, it is desirable to
know whether there is a tool in the ERP software of MSD that is active and able to capture this information.
It is strongly felt that delays in delivering supplies beyond the contracted dates contributes to stock outs at
both the Zonal stores and Health facilities level.
Another factor that affects the availability of stock at regional and health facilities include the time taken by
the central store in completing sales entry after the products have been physically delivered to the regional
store. This has been identified as a systemic challenge where sales to customers can only be done when
a complete entry in the computerized management system is completed. The presence and use of the
computerized system in MSD operation should in principle eradicate all the noted shortfalls in ordering since
one can see the whole country’s stock from a single workstation. Follow-ups of the orders and deliveries can
then be made through phone calls and e-mails. Lack of adequate stock of essential medicines and supplies
at regional and central stores of MSD remain a challenge to date. A closer look as to why there is no vivid
improvement in this area merits a separate assessment.
Tanzania has about 640 registered, 352 Pharmacy Technicians (PT) and 312 Pharmacy Assistants. There is
a serious lack of pharmaceutical human resources at health facilities, districts and regions. Even if posts are
available in rural areas, it is very difficult to find pharmacy professionals willing to fill them. Moves are being
made to increase the number of Pharmacy Technicians, but it is not clear if this alone will have any impact
on the staffing problems
5.2 Structure
Results show that the MSD and its zonal stores perform all its core functions which are quantification of
needs, ordering, warehousing and distribution. Other functions include stock management, and providing
customer services
The medical stores serve health facilities at the central level i.e. national referral hospitals, regional health
facilities, District health facilities, health centers and dispensaries, faith based health facilities, approved non-
governmental organizations.
MSD has 8 zonal stores which each serves 2 to 4 regions. Distances from the MSD to the Zonal stores differ
and some stores e.g. Mwanza and Tabora have almost twice the distance to MSD compared to other zones
despite the fact that these stores serve the large populations in the country. While geographical equality with
regards to the distribution of the stores may have been achieved, equity in access to medicines has not.
5.3 Health facility Pharmacies
All health facilities visited have pharmacy sections whose core functions are to manage pharmaceutical stock
and supplies and dispense medicines and medical supplies to in and out patients. Most facility pharmacies
keep all essential medicines including anti-malaria medicines and those for opportunistic infections. However,
in most health center and dispensaries, they do not have stocks of HIV medicines for both adults and children,
reagents for blood safety including HIV test kits and no anti-Tuberculosis medicines. These medicines are
found at the level of District hospitals and above.
5.4 Procurement of medicines
Procurement of Essential medicines was found not to be limited to the EML. This is understandable for
referral and regional hospitals where medicines for tertiary care can be procured under request of the

IN-DEPTH ASSESSMENT OF THE MEDICINES SUPPLY SYSTEM IN TANZANIA38
health institutions offering specialized care and management of their patients. It was however cited that
some prescribers do not agree with what is in the current edition of the STG. Only in 38% of health facility
pharmacies there were EML, and the ones in use were last revised in 2006 and were in a draft form. Fifty
two (52%) of facility pharmacies did not have any EML. This situation calls for fast printing and distribution of
the revised STG and Essential Medicines List. There is also a need for more efforts to teach the concept of
essential medicines not only to pharmacists but to all health care workers.
5.5 Quantification of needs
The Central medical Store and its zones use an Enterprise Resource Planning (ERP) tool (Orion) in the
quantification of essential medicines and medical supplies. Quantification for needs of medicines and
medical supplies is performed once in a year. The quantities determined forms the basis for the development
of Tenders that are advertised at different periods of the year in accordance to the Procurement and Supply
plan developed by a procurement management unit of the department. The plan includes medicines and
supplies financed by partners. The function of forecasting and quantification of needs of medicines managed
under Vertical programs is performed by Program Managers. Such commodities are ARVs, ACTs (Alu) and
anti-tuberculosis medicines, Vaccines, medicines for managing OIs. This signifies that no full integration is in
effect practiced at this level. This trend should be corrected in the earliest possible time to enable the MSD
to have full control in the Supply Chain management of all medicines.
Zonal Stores determines their supply needs in the same manner as the central Store but they do not have the
procurement plan aspect as all their supplies are obtained from the Central Store on requisition. At the health
facilities however, it was found that only 25% of the health facilities surveyed conducted quantification exercise
on an annual basis of which only 22% of the facilities had procurement and supply management plans and
the rest did not have one. All facilities with the procurement plan affirmed that they have a committee for the
development of the plan. The assessment has found that staff of health facilities of Mwanza and Mtwara
regions had undergone training in Indenting but the others of Mbeya, Tabora, Dar es Salaam and Moshi
regions had not. The absence of quantification skills by most health facilities explains in part why there are
frequent stock outs at these levels. On the other hand the quantification exercise of medicines and medical
supplies in most facilities is done by a mix of professionals comprised of pharmacists and pharmaceutical
technicians, medical doctors, nursing officers, laboratory technologists, supplies officers etc. There is a need
to integrate this activity to be done by a person or group of persons who are well versed with the process in
order to improve coordination at the Health facilities, the district and regional levels.
5.6 Procurement methods
Most essential medicines and supplies stocked at MSD (80%) are procured by tender through International
Competitive Bidding. Procurement using selective and national competitive bidding is at the rate of 10%
and 5% respectively. Whereas, there are many advantages of using tenders, particularly with regard to
transparency, fairness and accountability in the use of public funds, one major drawback is long lead-time
associated to the tendering processes. Dependence on public tenders with a lead time ranging between
90 and 150 days , or more as the major means of replenishing stock, even with a good forecasting tool, will
inevitably adversely affect the availability of supplies. Results of the tender are only read out during the
opening of bids, but are not published
Procurement prices are compared with standard reference prices such as IDA and MSH price guide. The
public procurement prices were found on the average to be below those in the International market. This is
also the finding of the Survey of Medicines Prices in Tanzania.

IN-DEPTH ASSESSMENT OF THE MEDICINES SUPPLY SYSTEM IN TANZANIA 39
Health facilities have a possibility of procuring medicines and supplies from other sources other than the MSD.
Of all health facilities only 33% procure products exclusively from the MSD which is the national procurement
agent. Some health facilities however, procure medicines and supplies from private pharmaceutical
wholesalers and private pharmacies. There are no official guidelines guiding HF on how and when they
are to procure from other sources besides the public entities, especially as the most used method is direct
procurement and very few use tendering system
5.7 Products storage and stock management
The assessment has found that products storage and stock management operations at the central and
regional stores are performed well. At every MSD warehouse visited stocks were securely placed, fully
protected from light, placed in properly ventilated areas, well organized and cleanly kept, functional systems
for cold storage were present and a functioning ICT system which manages stock was in place. The system
of Storage and stock management at health facilities were to the contrary of what is in the regional and
central stores. In some of the facilities visited it was found that medicines and some other medical supplies
risk loosing their efficacy due to poor storage conditions. For example only 52% of the pharmacies had cold
storage areas.
5.8 Availability of medicines and medical supplies at Health Facilities
The availability of medicines and supplies at the facility level is largely influenced by either the budget allocation
of that facility or availability of the products at the regional and central stores or the way the facility adheres to
the rational use of medicines. When the facility has run out of its allocated budget, it will inevitably register
low stock levels as it can not order replenishment supplies from the stores. On the other hand, when the
regional and central stores lack stock the situation will cascade down to all facilities that would request stock
from those stores. The assessment has found that the availability of stock at facility level at the time of survey
ranged between 96% and 52% per category of products with an overall availability of 65%. This however,
needs to be interpreted with caution as the average is not computed from similar items but rather from a
range of supplies. Of the twenty tracer items it was found that 50% were out of stock for a period ranging
from one day up to one hundred and twenty days. This implies that the stock management parameters such
as determination of Min / Max levels are not strictly followed.
The assessment has found that reasons for procuring medicines out of the EML are in the order of priority,
1) The prescribers do not agree with the STG, 2) The EML does not address local needs demands and 3)
The products on the EML are not available from the Suppliers (Central Stores and Zonal Stores). It has
further been found that 52% of facility pharmacies did not have any EML. The situation explains in part why
EML and STG are not relied upon by prescribers in making choices of medicines. Since the EML and STG
currently in use were last revised in 1997, most practitioners had lost confidence in its use. In this regard
there is a need for a regular update of the EML and STG and these documents have to be widely distributed
to all HFs. Furthermore, there is need to incorporate the EML & STG concept in all health training institutions
in the country to create awareness to students and inculcate a culture of rational use of medicines during
their practices.
Most facilities visited do not have transport facilities and some that are in place are old. The assessment
has established that total lack of transport, high cost of it and poor conditions of vehicles are major setbacks
at facility levels, when it comes to collecting medicines and medical supplies from stores. In addressing
this challenge alternative means such as entering into contract with private transporting agents can be
explored.

IN-DEPTH ASSESSMENT OF THE MEDICINES SUPPLY SYSTEM IN TANZANIA40
The assessment has also found that factors such as error in forecasting non adherence to FEFO lead to
both un-availability of medicines at facility level and expiry of the same. These along other factors such as
receiving supplies excess of order, or with short expiry dates or supplies not based on what was demanded
can be eliminated or greatly reduced if training workshops are conducted involving both health facility and
MSD staff.
5.9 Quality Assurance system
During a survey conducted by TFDA in some of the HFs under this assessment, inadequacies in the batch
tracking system of pharmaceutical products was noted. The weakness needs to be addressed at the
earliest possible date and must be initiated from the Central Store management. Its importance cannot be
overemphasized as it is a central issue in ensuring that medicines distributed and dispensed to patients are
effectively monitored. The presence of a working batch tracking system offers assurance that a product can
be recalled for evaluation or from use at any stage in the supply chain process.
Inspection is not conducted regularly at HFs and this situation leads to compromising of standards. Frequent
supervision of HFs is essential in ensuring that management of facilities and services to patients are kept at
the highest standards possible. As part of ensuring that standards are maintained all HFs pharmacies need
to have SOP’s documents in place. The on-going MSD Customer visits should be improved to accommodate
elements of improvement of standards the facilities visited.
5.10 The impact of Vertical Programs
The size of the Vertical Programs budget relative to the core drug budget, , is an issue which merits
discussion to make sure that access to essential medicines particularly to diseases which affect the majority
of the population is given precedence. One reason for the concern with the relative size of VP-spending
on pharmaceutical is that these VPs distort relative priorities, as the large size of the VPs appears to be
driven by the availability of donor resources for a specific vertical program rather than by the health sector’s
priorities. This means that non-donor funded core drug spending is ‘crowded out’, as it receives proportionately
inadequate attention and funding.
Furthermore, setting up parallel mechanisms causes duplication and inefficiencies in the provision of
pharmaceuticals, as identified in the previous chapters. It also places a greater administrative burden on
DMOs and facility Pharmacists and Pharmacy Technicians to manage the parallel funding flows.

IN-DEPTH ASSESSMENT OF THE MEDICINES SUPPLY SYSTEM IN TANZANIA 41
6.0 CONCLUSION The condition of most of the lower health facilities (Health Centers and Dispensaries) visited requires a face
uplift and improvement in terms of working tools. Most facilities do not have conducive and adequate storage
space. Medicines are stored in areas that may lead to fast deterioration.
There are notable shortages of qualified Human resource and almost all that are in place are civil servants
who have been at their stations for a considerable period of time without continuous training courses and are
not well versed with the current dynamism of improvement of quality of health care.
Stock management knowledge has been found to be quite a challenge in most facilities studied. The
assessment noted that the FIFO principle is the most widely used parameter during dispensing. This may
lead to letting other medicines expire on the shelves. This is further compounded by a fact that some
medicines are received from the zonal stores with a short remaining shelf-life.
The assessment has found that medicines in the Zonal and Central store are stored according to good
storage practice whereby stocks are under secure systems, fully protected from sunlight, properly ventilated,
well organized and clean. There is a functioning system for cold storage, Information and Telecommunication
system is in place which manages the stocks for both MSD and vertical programs across the country.
It has been established that there are challenges with the quantification process and staffs interviewed do not
have a unified system of determining what to order from the Central Store. This has been noted as one of the
reasons why there are frequent stock outs that cascades down to the facility levels. The forecasting ability
is still low, and this assessment has found that (78%) of the respondents affirm that very minimal initiatives
are in place to provide continuous training to Health facility staff. This calls for a need to institute a program
of continuous training through the zonal training institutions for all health facilities especially in forecasting
and quantification, Stock Management system and Stores Record keeping. While both the public health
facilities and medical stores are public entities within the MOHSW structure and especially when it is comes
to handling and use of medicines and medical supplies, there is room for improving the shortfalls noted at
facility levels by using MSD sites as training centers for HF staff. This is one area that has opportunity for
continuous training to be offered to HF staff at minimum cost and PSU of the MOHSW is best placed to
coordinate this activity.
Though there are elements of performance monitoring at both the facility and at the Regional Stores levels,
the performance indicators are yet to be used routinely to improve the levels of service delivery. There is a
need for the MOHSW to take up the issue and design a mechanism of conducting close follow-ups at both
the health facilities and regional stores. The monitoring component should provide feedback to ensure that
all the players of service delivery are made aware of the outcomes.
The phasing-out of the kit system and shift to the indent/ILS system may partially explain the increasing
emergence of Vertical Programs in recent years. Perhaps more importantly is the availability of external
funds for specific, targeted health sector objectives, within the areas of HIV/AIDS, malaria, STI, maternal
and child health, and other health issues. However, negative effects of the emergence of VPs has been (i)
the creation of duplicative resource channels for drug resources, (ii) the ‘crowding-out’ of resources for the
essential drug budget, and (iii) distributing drugs (or VP-defined kits) through vertical programs preempts the
prioritization of drug resources in favor of priorities felt at the local level. It is thus desirable to integrate drug
resources for Vertical Programs into essential drug budget whenever possible

IN-DEPTH ASSESSMENT OF THE MEDICINES SUPPLY SYSTEM IN TANZANIA42
As regards stocks situation at all levels, innovative way in improving stock availability at the MSD stores and
at health facility levels throughout the year need to be explored. Dependence on public tenders with long
lead time as the only major means of replenishing stock is not ideal. The possibility of introducing framework
contracts especially with manufacturers of essential medicines and supplies on one hand and frequent use of
direct procurement method and or placement of repeated orders for items recently procured through tender
on the other can improve the stock availability at both the stores and at health facilities.
Similarly Hospital facilities need to be given more flexibility in accessing medicines from other suppliers in the
country. The idea of availing a certain percentage of the hospitals’ medicines budget (30%) to be managed
by the Hospital administration for procurements outside MSD’s arrangement needs to be experimented.
This assessment has brought to the fore much useful information on the performance of major elements of
the medicines and medical supplies management system in the public sector of Tanzania mainland. The
information thus obtained can be used to improve the operating mechanisms of the supply chain and at the
same time be used as a guide in conducting future assessments of the same facilities studied with a view to
assessing the extent of their improvement in providing services of medicines and medical supplies.

IN-DEPTH ASSESSMENT OF THE MEDICINES SUPPLY SYSTEM IN TANZANIA 43
7.0 RECOMMENDATIONS
There is a need for equity in access to medicines by Zone, Region and District.1)
More facilities needs to be upgraded to qualify for keeping stocks of HIV medicines for both adults 2)
and children, reagents for blood safety including HIV test kits, anti-Tuberculosis medicines as well as
other essential medicines.
The MoHSW and the PMORALG must ensure that Hospitals and Health facilities have adequate cold 3)
storage facilities for medicines to minimize the risk medicines losing their efficacy due to poor storage
conditions.
EML and STG documents need to be regularly updated, printed and widely distributed to all HFs. 4)
Health Training Institutions should incorporate the EML & STG concept their training curricula to 5)
create awareness to students and inculcate a culture of rational use during their practices.
Forecasting and quantification of medicines need should be integrated and be done by a person or 6)
group of persons who are well versed with the process.
PSU and MSD to ensure that Batch tracking system of pharmaceuticals and medical supplies is 7)
operational. Staff training on its usefulness has to be emphasized.
PSU of the MOHSW should institute frequent supervision of HFs to ensure that management of 8)
facilities and services to patients are provided at the highest standards possible.
PSU to develop a quality management system which will include guidelines and SOP’s for HF 9)
pharmacies as well as the regional and district supervisors and they should be distributed and used.
Integrate all supply management activities of selection, procurement and distribution of VP products 10)
into MSD to avoid duplication of efforts.
MSD should continue the use of framework contracts especially with manufacturers of essential 11)
medicines and supplies, and also frequent use of direct procurement method and or placement of
repeated orders for items recently procured through tender to improve the stock availability at both
the stores and at health facilities.
PSU/ MOHSW to avail a certain percentage of the hospitals’ medicines budget (20%-30%) to be 12)
managed by the Hospital administration for procurement of medicines from either MSD or other
sources.

IN-DEPTH ASSESSMENT OF THE MEDICINES SUPPLY SYSTEM IN TANZANIA44Ta
ble
33:
Are
as n
eed
ing
imp
rove
men
t id
enti
fied
du
rin
g a
wo
rksh
op
to
dis
sem
inat
e re
sult
s o
f th
e as
sess
men
tTo
pic
Issu
e to
be
add
ress
edR
eco
mm
end
ed A
ctio
ns
Act
ivit
ies
to b
e C
om
ple
ted
Wh
o is
res
po
nsi
ble
or
invo
lved
?
Wh
en d
oes
this
nee
d t
o b
e
com
ple
ted
by?
Str
uct
ure
Inad
equa
te d
ecen
tral
ized
func
tions
to th
e zo
nal o
ffice
s.
Dec
entr
aliz
atio
n of
key
func
tions
to
the
zone
to in
crea
se e
ffici
ency
To d
ecen
tral
ize
key
func
tions
to z
one
offic
e fo
cusi
ng o
n th
e st
akeh
olde
r’s
need
s to
incr
ease
cus
tom
ers’
satis
fact
ion.
CM
SJu
ne 2
009
Lack
of h
arm
oniz
atio
n an
d
coor
dina
tion
of p
rogr
ams
carr
ying
out
var
ious
func
tions
rela
ted
to s
uppl
y of
med
icin
es
sim
ilar
to M
SD
.
Har
mon
izat
ion
and
coor
dina
tion
of th
e
prog
ram
s
To d
evel
op p
olic
y st
atem
ent,
regu
latio
ns a
nd g
uide
lines
on
prop
er m
anag
emen
t of p
rogr
ams
rela
ted
to s
uppl
y of
med
icin
es
to th
e G
over
nmen
t, F
aith
bas
ed
orga
niza
tion
etc.
Est
ablis
h a
unit
unde
r th
e P
SU
for
coor
dina
tion
of a
ll pr
ogra
ms
rela
ted
to s
uppl
y of
med
icin
es
MO
HS
W (
PS
U)
Dec
embe
r 20
09
Mon
opol
y of
MS
D in
the
supp
ly
syst
em
Intr
oduc
e co
mpe
titiv
e su
pplie
rs
Con
duct
sta
keho
lder
s m
eetin
g a
nd
intr
oduc
e th
e id
ea, d
raw
out
str
ateg
ies
intr
oduc
ing
com
petit
ive
supp
liers
of
med
icin
es a
nd im
plem
ent t
hem
MO
HS
WJu
ne 2
009
Lack
of p
rogr
am s
uppo
rt fo
r
war
ehou
sing
and
sto
rage
Dev
elop
a p
rogr
am s
uppo
rt fo
r
phar
mac
eutic
al w
areh
ousi
ng a
nd
good
sto
rage
pra
ctic
e.
Con
trac
t out
a c
onsu
ltant
to
perf
orm
ass
essm
ent o
f the
exi
stin
g
phar
mac
eutic
al w
areh
ouse
s an
d
stor
age
faci
lity
in p
ublic
hos
pita
ls.
Con
stru
ct o
r re
nova
te
phar
mac
eutic
al w
areh
ouse
s an
d
inst
all p
rope
r st
orag
e fa
cilit
ies
Dev
elop
gui
delin
es fo
r go
od s
tora
ge
cond
ition
s, d
istr
ibut
e to
all
hosp
itals
and
trai
n th
e ph
arm
acy
pers
onne
l.
MO
SH
W &
Prim
e
Min
iste
r’s
offic
e, R
egio
nal
Adm
inis
trat
ion
and
loca
l
Gov
ernm
ent
(PM
OR
ALG
)
June
201
0
EM
L no
t bei
ng u
sed
cons
iste
ntly
at m
ost h
ealth
faci
lity
leve
l
Ens
ure
use
of E
ML
for
sele
ctio
n of
med
icin
es a
t all
leve
ls is
per
form
ed
cons
iste
ntly
as
per
the
heal
th fa
cilit
y
need
s
To p
repa
re a
nd d
istr
ibut
e E
ML
book
lets
spec
ific
for
each
cat
egor
y of
hea
lth
faci
lity.
PS
U a
nd M
SD
June
200
9
Sel
ecti
on
The
ST
G &
EM
L no
t rev
iew
ed
regu
larly
The
ST
G &
EM
L to
be
rev
iew
ed
bian
nual
ly
To c
ondu
ct a
sta
keho
lder
s m
eetin
g
bian
nual
ly fo
r re
view
of t
he S
TG
and
EM
L
MO
HS
WJu
ne 2
010
8.0
R
EC
OM
ME
ND
AT
ION
S O
F T
HE
STA
KE
HO
LD
ER
S W
OR
KS
HO
P

IN-DEPTH ASSESSMENT OF THE MEDICINES SUPPLY SYSTEM IN TANZANIA 45
Top
icIs
sue
to b
e ad
dre
ssed
Rec
om
men
ded
Act
ion
sA
ctiv
itie
s to
be
Co
mp
lete
dW
ho
is r
esp
on
sib
le o
r
invo
lved
?
Wh
en d
oes
this
nee
d t
o b
e
com
ple
ted
by?
Hu
man
Res
ou
rce
Inad
equa
te n
umbe
r of
phar
mac
y pr
ofes
sion
s in
the
field
To in
crea
se o
utpu
t of p
harm
acy
prof
essi
ons
To c
ondu
ct s
take
hold
ers
mee
ting
to d
evel
op s
trat
egie
s fo
r pr
omot
ing
publ
ic a
nd p
rivat
e se
ctor
to in
vest
in
phar
mac
y sc
hool
s
To in
crea
se n
umbe
r of
stu
dent
inta
ke to
the
exis
ting
phar
mac
y
scho
ols.
To r
eins
tate
sch
ool o
f
phar
mac
eutic
al a
ssis
tant
s
MO
HS
WJu
ne 2
010
Qu
anti
fica
tio
nIn
adeq
uate
ski
lls o
n fo
reca
stin
g
and
quan
tific
atio
n
Impa
ct k
now
ledg
e an
d
skill
s on
fore
cast
ing
quan
tific
atio
n.
Dev
elop
trai
ning
mat
eria
ls fo
r
fore
cast
ing
and
quan
tific
atio
n
WH
O, P
MO
RA
LG a
nd
MO
HS
W.
July
200
9
Con
duct
Zon
al tr
aini
ng
wor
ksho
ps o
n qu
antif
icat
ion
to h
ealth
per
sonn
el
invo
lved
in p
harm
aceu
tical
man
agem
ent.
WH
O, P
MO
RA
LG a
nd
MO
HS
W.
Dec
embe
r 2
009
Inad
equa
te to
ols
for
fore
cast
ing
and
quan
tific
atio
n
Pro
visi
on t
ools
for
fore
cast
ing
and
quan
tific
atio
n
Pur
chas
e co
mpu
ter
and
softw
are
for
drug
man
agem
ent s
yste
m.
Con
duct
trai
ning
on
com
pute
r
prog
ram
.
WH
O, P
MO
RA
LG a
nd
MO
HS
W.
Dec
embe
r 20
10
Str
engt
hen
the
role
of
ther
apeu
tic
Com
mitt
ee (
TC
)
Re
orie
nt T
C o
n th
eir
role
s
and
resp
onsi
bilit
y
Con
duct
orie
ntat
ion
sess
ion
and
prov
ide
rele
vant
guid
elin
es
MO
HS
W a
nd P
MO
RA
LGJu
ly 2
009
Pro
cure
men
t A
dher
ence
to P
ublic
Pro
cure
men
t Act
and
its
regu
latio
n.
Adv
ocac
y o
n P
ublic
Pro
cure
men
t A
ct a
nd it
s
regu
latio
n
Con
duct
trai
ning
on
Pub
lic
Pro
cure
men
t A
ct a
nd it
s
regu
latio
n
MO
HS
W ,
PP
RA
and
PM
OR
ALG
July
200
9
Par
tner
s ha
ve d
iffer
ent
proc
urem
ent p
olic
ies
Har
mon
izin
g pa
rtne
rs to
proc
ure
unde
r go
vern
men
t
polic
y
Con
duct
orie
ntat
ion
sess
ion
and
prov
ide
rele
vant
guid
elin
es to
par
tner
s
MO
HS
W ,
PP
RA
and
PM
OR
ALG
July
2009

IN-DEPTH ASSESSMENT OF THE MEDICINES SUPPLY SYSTEM IN TANZANIA46To
pic
Issu
e to
be
add
ress
edR
eco
mm
end
ed A
ctio
ns
Act
ivit
ies
to b
e C
om
ple
ted
Wh
o is
res
po
nsi
ble
or
invo
lved
?
Wh
en d
oes
this
nee
d t
o b
e
com
ple
ted
by?
Ord
erin
gIr
ratio
nal o
rder
ing
of
phar
mac
eutic
al s
uppl
ies
due
to in
adeq
uate
pro
cure
men
t
plan
ning
Pre
para
tion
of p
rocu
rem
ent
plan
invo
lvin
g al
l key
stak
ehol
ders
Est
ablis
h pr
ocur
emen
t nee
ds
to a
lign
with
app
rove
d bu
dget
(MT
EF
)
MO
HS
W a
nd P
MO
RA
LGJu
ly 2
009
Sto
rag
e1-
Lack
and
non
-res
pect
of
SO
Ps
SO
P s
houl
d be
dev
elop
ed a
t all
leve
ls a
nd b
e re
spec
ted
Dev
elop
and
dis
trib
ute
SO
Ps
Tra
in o
n us
e of
SO
Ps
Mon
itor
and
eval
uate
the
use
of S
OP
s
PS
U
PS
U/R
HM
T/D
HM
T
Fac
ility
man
agem
ent t
eam
2008
/200
9
2-In
adeq
uate
sto
rage
faci
litie
s
for
med
icin
es a
nd m
edic
al
supp
lies
Pro
visi
on o
f ade
quat
e st
orag
e
faci
litie
s an
d eq
uipm
ent
Ren
ovat
ion
and
cons
truc
tion
of
med
icin
es s
tore
s
Pro
cure
men
t of c
old
chai
n eq
uipm
ent
Inst
alla
tion
of a
ir co
nditi
oner
s
Inst
all s
helv
es, p
alle
ts
Inst
all f
ire e
xtin
guis
hers
.
Fac
ility
Man
agem
ent T
eam
(RA
S/D
MO
/DE
D)
2008
/200
9
2009
/201
0
3-La
ck o
f sta
ndar
ds s
truc
ture
for
med
icin
es s
tore
s
Est
ablis
h a
desi
gned
sta
ndar
d
stru
ctur
e fo
r m
edic
ines
sto
res
Des
ign
a st
anda
rd s
truc
ture
for
med
icin
es s
tore
s
Dis
sem
inat
e th
e st
anda
rd d
esig
n
Pro
vide
fina
ncin
g fo
r co
nstr
uctio
n/
reno
vatio
n
PS
U/M
OH
SW
PS
U/M
OH
SW
Fac
ility
Man
agem
ent T
eam
(RA
S/D
MO
/DE
D)
Aug
200
9
2009
/201
0

IN-DEPTH ASSESSMENT OF THE MEDICINES SUPPLY SYSTEM IN TANZANIA 47
Top
icIs
sue
to b
e ad
dre
ssed
Rec
om
men
ded
Act
ion
sA
ctiv
itie
s to
be
Co
mp
lete
dW
ho
is r
esp
on
sib
le o
r
invo
lved
?
Wh
en d
oes
this
nee
d t
o b
e
com
ple
ted
by?
Qu
alit
y
Ass
ura
nce
Inad
equa
te p
ost m
arke
ting
surv
eilla
nce
and
qual
ity
assu
ranc
e.
To in
trod
uce
SO
Ps
in s
urve
illan
ce
and
qual
ity a
ssur
ance
at a
ll le
vels
Dev
elop
SO
Ps
for
surv
eilla
nce
and
qual
ity a
ssur
ance
.
Dis
sem
inat
e S
OP
s to
sta
keho
lder
s
Tra
in S
taff
on u
se o
f SO
Ps
TF
DA
and
PS
UJu
ne _
Oct
ober
,
2008
.
Nov
embe
r,200
8
June
, 200
9
Is q
ualit
y as
sura
nce
bein
g
carr
ied
out a
t all
leve
ls?
To e
nsur
e po
st m
arke
ting
surv
eilla
nce
and
qual
ity a
ssur
ance
is
carr
ied
out a
t all
leve
ls
To e
nsur
e av
aila
bilit
y of
equ
ipm
ent
for
carr
ying
out
pos
t mar
ketin
g
surv
eilla
nce
and
qual
ity a
ssur
ance
at o
ut a
t all
leve
ls
Car
ry o
ut m
edic
ines
and
med
ical
supp
lies
insp
ectio
n at
ent
ry
poin
ts, w
areh
ouse
s an
d ou
tlets
.
Pre
pare
and
sub
mit
repo
rt q
uart
erly
To in
trod
uce
min
ilabs
at r
egio
nal a
nd
Dis
tric
t lev
els
PS
U
TF
DA
RH
MTs
CH
MTs
Rou
tine
as r
equi
red
Qua
rter
ly
Sub
stan
dard
or
coun
terf
eit
supp
lies.
Str
engt
hen
and
supp
ort m
edic
ine
insp
ectio
n at
all
leve
l
Iden
tify
pros
pect
ive
insp
ecto
rs
Bud
get f
or tr
aini
ng c
ondu
ctin
g
insp
ectio
n
Con
duct
trai
ning
to in
spec
tors
Car
ry o
ut s
urve
illan
ce
PS
U
TF
DA
RH
MTs
CH
MTs
July
, 200
9

IN-DEPTH ASSESSMENT OF THE MEDICINES SUPPLY SYSTEM IN TANZANIA48
FIN
AN
CIN
GH
arm
oniz
atio
n of
don
or
and
Gov
ernm
ent f
unds
Hea
lth B
aske
t Fun
d fo
r al
l ver
tical
pro
gram
sE
stab
lish
a st
eerin
g co
mm
ittee
Iden
tify
all d
onor
s an
d pa
rtne
rs
Con
duct
sta
keho
lder
s m
eetin
g
(Don
ors
and
Gov
t) fo
r
sens
itiza
tion
and
advo
cacy
Est
ablis
h th
e ba
sket
fund
The
GoT
thro
ugh
the
MO
HS
W
Sep
tem
ber
2008
Har
mon
izin
g re
port
ing
syst
em
Est
ablis
h a
repo
rtin
g to
ol to
ser
ve fo
r al
l
vert
ical
pro
gram
s
Pre
para
tion
of th
e to
ol
Pre
test
the
tool
Con
duct
trai
ning
The
GoT
thro
ugh
the
MO
HS
W
Dec
embe
r 20
08
Har
mon
izin
g D
onor
finan
cing
pol
icy
Est
ablis
h a
unifi
ed fi
nanc
ing
polic
y C
ondu
ct s
take
hold
ers
mee
ting
The
GoT
thro
ugh
the
MO
HS
W
Mar
ch 2
009
Fun
ds r
emitt
ance
Est
ablis
h a
disb
urse
men
t pla
nId
entif
y fa
ctor
s as
soci
ated
with
fund
s de
lays
Pre
pare
a d
isbu
rsem
ent p
lan
by c
onsi
derin
g fa
ctor
s id
entif
ied
abov
e
The
GoT
thro
ugh
the
MO
HS
W
Dec
embe
r 20
08
Info
rmat
ion
man
agem
ent
Util
izat
ion
of r
epor
tsS
tren
gthe
ning
rep
ortin
g sy
stem
Mer
ging
of t
he e
xist
ing
repo
rtin
g
tool
s to
hav
e co
mpr
ehen
sive
and
sim
plifi
ed fo
rm
Dis
trib
ute
man
agem
ent t
ools
to
HF
s
Tra
in h
ealth
wor
kers
on
how
to
repo
rt
Put
in p
lace
a fe
edba
ck
mec
hani
sm
PS
U, R
HM
T, C
HM
TO
ctob
er 2
008
Doc
umen
tatio
n sy
stem
Str
engt
hen
the
docu
men
tatio
n sy
stem
Dis
sem
inat
e do
cum
enta
tion
tool
s
to a
ll H
Fs
Con
duct
a r
efre
sher
trai
ning
on
inve
ntor
y m
anag
emen
t
Con
duct
follo
w u
p vi
sits
to H
Fs
Intr
oduc
e so
ftwar
e fo
r
phar
mac
eutic
al m
anag
emen
t
Con
duct
trai
ning
on
the
use
of
softw
are
PS
U, R
HM
T, C
HM
TO
ctob
er 2
008
June
200
9
Top
icIs
sue
to b
e ad
dre
ssed
Rec
om
men
ded
Act
ion
sA
ctiv
itie
s to
be
Co
mp
lete
dW
ho
is r
esp
on
sib
le o
r
invo
lved
?
Wh
en d
oes
th
is n
eed
to b
e co
mp
lete
d b
y?
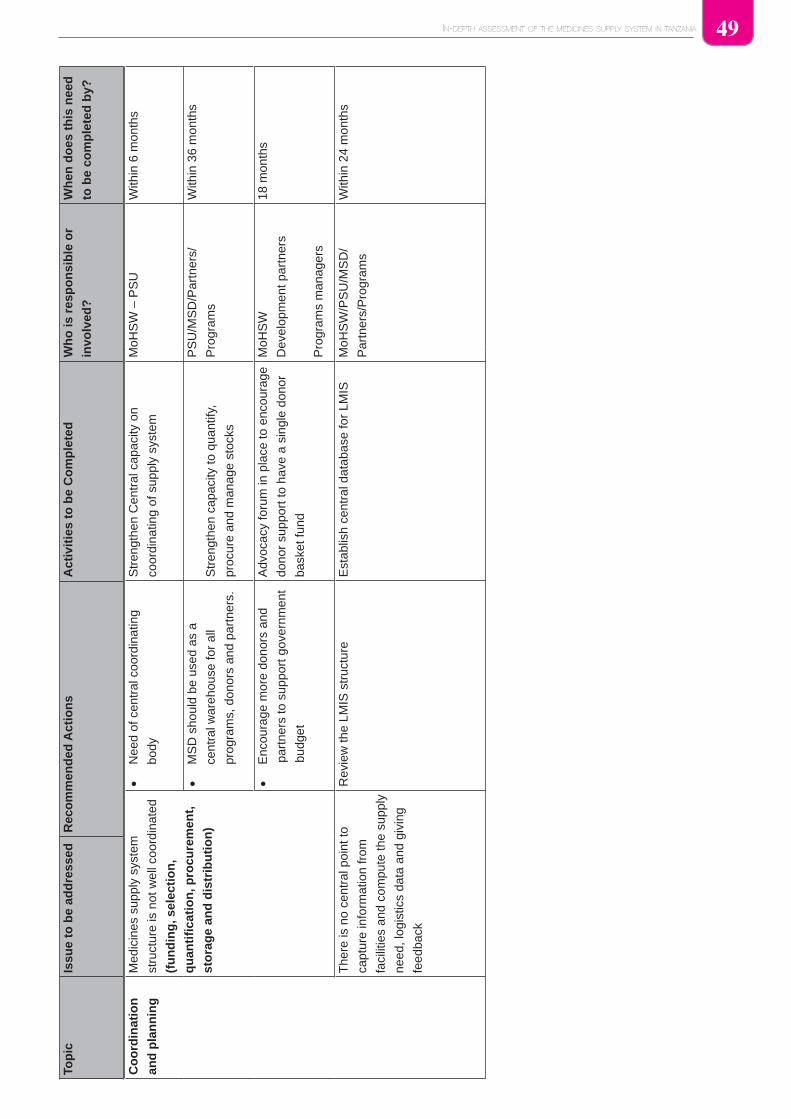
IN-DEPTH ASSESSMENT OF THE MEDICINES SUPPLY SYSTEM IN TANZANIA 49
Co
ord
inat
ion
and
pla
nn
ing
Med
icin
es s
uppl
y sy
stem
stru
ctur
e is
not
wel
l coo
rdin
ated
(fu
nd
ing
, sel
ecti
on
,
qu
anti
fica
tio
n, p
rocu
rem
ent,
sto
rag
e an
d d
istr
ibu
tio
n)
Nee
d of
cen
tral
coo
rdin
atin
g
body
Str
engt
hen
Cen
tral
cap
acity
on
coor
dina
ting
of s
uppl
y sy
stem
MoH
SW
– P
SU
With
in 6
mon
ths
MS
D s
houl
d be
use
d as
a
cent
ral w
areh
ouse
for
all
prog
ram
s, d
onor
s an
d pa
rtne
rs.
Str
engt
hen
capa
city
to q
uant
ify,
proc
ure
and
man
age
stoc
ks
PS
U/M
SD
/Par
tner
s/
Pro
gram
s
With
in 3
6 m
onth
s
Enc
oura
ge m
ore
dono
rs a
nd
part
ners
to s
uppo
rt g
over
nmen
t
budg
et
Adv
ocac
y fo
rum
in p
lace
to e
ncou
rage
dono
r su
ppor
t to
have
a s
ingl
e do
nor
bask
et fu
nd
MoH
SW
Dev
elop
men
t par
tner
s
Pro
gram
s m
anag
ers
18 m
onth
s
The
re is
no
cent
ral p
oint
to
capt
ure
info
rmat
ion
from
faci
litie
s an
d co
mpu
te th
e su
pply
need
, log
istic
s da
ta a
nd g
ivin
g
feed
back
Rev
iew
the
LMIS
str
uctu
reE
stab
lish
cent
ral d
atab
ase
for
LMIS
MoH
SW
/PS
U/M
SD
/
Par
tner
s/P
rogr
ams
With
in 2
4 m
onth
s
Top
icIs
sue
to b
e ad
dre
ssed
Rec
om
men
ded
Act
ion
sA
ctiv
itie
s to
be
Co
mp
lete
dW
ho
is r
esp
on
sib
le o
r
invo
lved
?
Wh
en d
oes
th
is n
eed
to b
e co
mp
lete
d b
y?

IN-DEPTH ASSESSMENT OF THE MEDICINES SUPPLY SYSTEM IN TANZANIA50
9.0 REFERENCESMOHSW/ EHG/MSH ;Tanzania Drug Tracking Study, 2007 1.
MSD price catalogue of essential medicines and hospital supplies, 2006-072.
MOHSW/WHO/EC; Survey of the medicine Prices in Tanzania, 20043.
MSD /WHO/ PHASUMA; Improving Stock Control and Forecasting, , October 20064.
Preparation of MSD Medium Term Strategic Plan, Assessment Report, Sep 20065.
Rational Pharmaceutical Management – An Indicator Approach (MSH/RPM 1995/97)6.
Resources Allocation Formula for Health Block Grant and Basket Funds7.
Review of the Accredited Drug Dispensing Outlets (ADDO), Roll out Program inTanzania, HERA, 16 8.
March 2006
MOH; The Tanzania National Drug Policy, 19909.
Master Plan for the Pharmaceutical Sector 1992-2000, 10.
Hospital Therapeutic Committees, Feb 199311.
The United Republic of Tanzania 2003: The Tanzania Food, Drugs and Cosmetics Act 2003; 12.
Government Printer, Dar es Salaam, 2003
Monica Fletcher; Continuing education for health professionals - time to prove its worth. Primary 13.
healthcare Journal (2007) 16(3) 188-190

IN-DEPTH ASSESSMENT OF THE MEDICINES SUPPLY SYSTEM IN TANZANIA 51
10.0 ANNEXES
Annex 1: Data Collection Points
DAR MWANZA TABORA MTWARA MOSHI MBEYA
MSD -DAR MSD-MWANZA MSD-TABORA MSD-MTWARA MSD-
MOSHI
MSD-MBEYA
Muhimbili
National Hospital
BMC Kitete Ligula KCMC Rufaa-Mbeya
Mwananyamala Sekou Toure Sikonge Hosp Tandahimba Mawenzi Rmo-Mbeya
Magomeni Dmo Magu Puge Hc Nanguruwe Hc Majengo Hc Rungwe
Sinza Makongoro Clinic
Hc
Anglican Disp Ziwani Disp Mbalizi- Hc
Sangabuye Disp Iziwa Dsp
Annex 2: List of names of Data Collectors for the Assessment
S/N Name Place of Work Place of
Assignment
Phone number
1 Dr. Mary Jande Depart. of Pharmacology, School of
Medicine, MUCHS
MZA 0754 298978
2 Dr. Gerald Rimoy Depart. Pharmacology, School of
Medicine, MUCHS
Moshi 0713 223 433
3 Mr. Fredric
Nicolaus
Depart. Of Quality Control, MSD- Mtwara 0713 454 445
4 Dr. Veronica
Mugoyela
Depart. of Medicinal Chemistry, School of
Pharmacy MUCHS
MZA 0754 2610532
5 Mr. Elford Ngaimisi Depart. Pharmaceutics, School of
Pharmacy MUCHS
Mbeya 0713 256 396
6 Ms Consolata
Muzaga
MSH Mbeya 0754 677 976
7 Winna Shango MOH & SW Tabora 0754 303 733
8 Ms. Magege Private Pharmacist DSM Tabora 0754 618 245
9 Prof. Dr. Mary
Justin-Temu
Depart. Pharmaceutics, School of
Pharmacy, MUCHS
Moshi 0784 320 558
10 Mr. A. Malisa Hospital Pharmacist –Morogoro Regional
Hospital
Dar 0754 820 378
11 Ms Rose Tumbo Muhimbili National Hospital Dar 0784 357 141
12 Noel Mhadu PO –SH Office Mtwara 0713 569 509

IN-DEPTH ASSESSMENT OF THE MEDICINES SUPPLY SYSTEM IN TANZANIA52
Annex 3: List of Tracer Medicines
No Tracer Products
1 Alu (Artemisinin + Lumefantrine) in four different pack
sizes
30 x 6's
30 x 12's
30 x 18's
30 x 24's
2 QUININE pack of 1000 tabs
3 SP pack of 1000
4 ERYTHROMYCIN TABS pack of 1000
5 AMOXYCILLIN CAPS pack of 1000
6 AMOXYCILLIN SYRUP pack of 100 ml
7 COTRIMOXAZOLE TABS pack of 1000
8 COTRIMOXAZOLE SUSPENSION pack of 100ml
9 BENZYL PENICILLIN 5 MU pack of 1 vial
10 ORS –sachet
11 METRONIDAZOLE SUSP
12 DOXYCYCLINE TABS pack of 1000
13 CIPROFLOXACIN TABS pack of 100
14 PARACETAMOL TABS pack of 1000
15 NITROFURANTOIN TABS pack of 1000
16 GRISEOFULVIN TABS pack of 1000
17 CLOTRIMAZOLE CREAM pack of 10 ml
18 METRONIDAZOLE TABS pack of 1000
19 CEFTRIAXONE INJ 250 mg pack of 1 vial
20 MEBENDAZOLE TABS pack of 1000

IN-DEPTH ASSESSMENT OF THE MEDICINES SUPPLY SYSTEM IN TANZANIA 53
