in continuous processing liquid
TRANSCRIPT

-i:- R:a
t6 -e ^ot
Thermat Sterilisation Kinetics of Bacteria as
Influenced by Combined Temperature and pH
in Continuous Processing of Liquid
by
Juliana Chiruta
Thesis submitted for the degree of
Doctor of PhilosoPhY
tn
The UniversitY of Adelaide
Department of Chemical Engineering
FacultY of Engineering
September 2000

Errata
Additional references to be included:
Page Line Reference¡r
104
r05
I
7
Ceri O. (1977) Tailing of survival curves. Journal of Applied Bacteriologv 42: l-l
n7 21
Daudin' J. D. and cerf, o. (1977) Influence of sudden changes of remperarureswhen bacterial cells are subjected to almost instantaneous ireating or cooling.L e b e n s m i tt e l - W i s s e ns c h aft u nd T e c h no I o gi e l0 : 203 _207
!9r*:.' J., Begue, P. and cerf, o. (r975) The combined effect of heat shock andRTD. Journal of Dairy Research 42:437-444
Buchanan, R. L. and Ederson, s, G. (1999) Effect of pH-dependenr, starionaryphase acid resistance on the thermal tolerance of Escherichia coli Ol57:Hi. FoodM icrobiology 16: 447 -458


lil
SUMMARY
The thermal sterilisation of various bulk liquids is an essential process step in the food and
fermentation industries. However present models for process simulation of the continuous
sterilisation of liquid are limited in that they are based on gross assumptions regarding the
kinetics of bacterial inactivation. Of particular interest are kinetic models that can be
reliably used to predict the combined effect of process parameters, principally, exposure
temperature and pH (f-pH), in addition to exposure time (r), and; which are of a form that
can be readily integrated with equations describing liquid rheology and hydrodynamics of
liquid flow. An adequate kinetic model is essential to process optimisation, and longer
term, to optimal processing in real time.
Analysis of carefully obtained sets of bench-scale survivor data of selected bacteria with
the combined effect of T-pH and limited published continuous steriliser data (n7 = 708) has
demonstrated that assumptions of first-order (ie log-linear) kinetic dependence are largely
inadequate. This finding challenges widely held views. Two new, non-linear kinetic model
forms were synthesised from these data. These new model forms are titled "nOE"
(nth order rate equation) and "CDT" respectively. Both involve a time dependent rate for
thermal inactivation. The CDT form was selected following validation tests on bench-scale
data and the rejection of the nOE model. A pilot-scale continuous steriliser was built to
experimentally test the underlying hypothesis of the new CDT model. Extensive analyses
of residuals were used together with the per cent variance eccounted for (VoV) and mean
square enor (MSE) as criteria of goodness of fit for validation tests of the log-linear, nOE,
CDT and other selected model forms.
The carrier liquid used throughout was a 2 kg m-3 mucilage of Carbopol@ 934. this
mucilage was selected because of the stability of its viscosity over the range of temperature
and pH values of interest and its resistance to bacterial attack and growth. The viscosity
and value of the pseudoplastic index of this mucilage closely simulates that of a wide range
of liquid foods. It is transparent and therefore suitable for dye-trace studies to investigate
the adequacy of hydrodynamic flow assumptions in the continuous steriliser.

Three vegetative bacteria were selected: Escherichia coli (ATCC 25922), Listeria
monocytogenes (SLCC 5764) and Pseudomonas fluorescens (I72)' These represent
common micro-organisms known to spoil liquid and solid food. The thermal sensitivity of
vegetative bacteria conveniently permitted exposure temperatures below liquid boiling (and
consequent high pressures) thereby simplifying the pilot steriliser' Findings however can be
extrapolated to behaviour of thermally less sensitive contaminant micro-organisms' up to
six levels of exposure temperature (52oC, 54oC, 56oC, 58oc, 60"c and 62'c) in
combination with up to eight levels of pH (4.0, 4.5,5.0, 5.5, 6'0, 6'5, 7'0 and 7'5) with
exposure times ranging from 10 s to 5 min, were used in experimental designs to cover a
wide bio-kinetic range of interest. The effect of pH on the rate of thermal inactivation was
significant for all three bacteria, especially at the lower exposure temperatures' concave-
up tails appeared in the survival data for P. fluorescens and E- coli and both concave-up
and concave-down tails appeared in the survival data for L. monocytoSenes' These findings
indicate a departure from log-linear kinetics'
The noE model for. combined T-pH was assessed using the data determined for
L. monocytogenes.This model form is new in that it does not appear to have been applied
previously to bacterial survivor kinetics. The model explained an overall 89'5Vo of the
variance accountedfor compared with7l.SToVfor the log-linear form' The noE model has
two terms 0 I r and pH), and permits a practical procedure for the evaluation of the
microbiological safety of liquid foods processed at a mild temperature regime in
combination with different pH. A major drawback with noE model however is that it is of
a form that is not readily integrated with equations describing liquid rheology and
hydrodynamics of liquid.
The new CDT form explained between 82.9vo and 93.0vo of the variance across all the
Z-pH data and 94.6Vo for the published T only data from a continuous steriliser- Because of
this good fit of the model, together with no apparent systematic features in the plots of
residuals and its easier integration with other equations, it was selected for pilot steriliser
studies.

The continuous steriliser was sized using predictions of the CDT model for E. coli.Ditect
steam injection heating was employed. The experimental design for the tubular steriliser
involved three levels of T (54oC, 56oC and 58"C) in combination with three levels of pH
(4.5, 6.0 and 7.5) and inactivation times ranging from 61.1 s to 181.4 s. Careful effort was
made to ensure all the assumptions of the CDT model were practically implemented in the
experimental steriliser. This included photographic evidence to confirm velocity profiles
and an absence of steam bubbles (ie condensation of the steam), and the effect of dilution
by the condensing steam on rheology of the carrier carbopol liquid.
At low values of 7 (54"C) inactivation of E. :oli numbers in the (dynamic) flow of the
continuous steriliser was greater than in the (static) bench data at all levels of pH. As I
increased (56"C and 5g"c) however the reduction in bacterial numbers was greater in the
capillary tubes than in the pilot continuous steriliser. The thermal inactivation kinetics of E
coli in the Carbopol carrier liquid differed significantly therefore depending on whether
samples were heated in the capillary tubes (sraric) or in the continuous steriliser (dynamic).
A significant portion of this difference between the CDT model predictions of reduction in
the number of viable bacteria and that which was experimentally observed in the pilot
continuous steriliser is ascribed to the effects of dispersion of viable bacterial cells.
Established steriliser performance equations include consideration of both the liquid flow
hydrodynamics and rheology of the carrier liquid but do not presently include a term for
dispersion. 'With increasing steriliser length and consequent holding time, the effects of
dispersion become significant. The effect of dispersion has been quantitatively estimated to
give rise to one additional order of magnitude in predicted reductions in the number of
viable bacteria in the continuous steriliser'
The systematic synthesis and testing of the new CDT model outlined in this thesis
importantly points to the need for a directional rethink in both static and flow systems and
away from widely used logJinear approaches that imply constant thermal rates of
inactivation over a range of combined T-pH. Because shear conditions that normally
pertain to processing of liquid foods were used, findings should be of interest to larger-
commercial scale sterilisation by heat'

vl
ACKNOWLEDGMENTS
The work presented in this thesis was supported by an Australian Postgraduate Award.
Accordingly, I am deeply indebted to the university of Adelaide's Department of chemical
Engineering.
Particular gratitude goes to my supervisors (listed here in no particular order)' Dr Ken
Davey and Dr Connor Thomas for giving me this opportunity' I am grateful to Dr Ari
Verbyla for his most valuable suggestions in mathematical modelling'
other colleagues I wish to thank are Ben Daughtry, chris Mansell, Department of
chemical Engineering, Rebecca Pinyon and Mark webster, Department of Microbiology
and ImmunologY
Special thanks to my parents Constanta and Octavian Brinzei, who have given me so much'
and for the help and advice of my uncle Prof' Mircea Rauta, Faculty of Technology and
chemistry of Food Products and Pisciculture, university of Galati.
To my husband Roberto, and our two sons, Phillip and victor, thank you for your patience'
understanding and encouragement, and for enduring me over these years of study'

vil
TABLE OF CONTENTS
SUMMARY
ACKNOWLEDGMENTS{'
CHAPTER I- INTRODUCTION
CHAPTER 2 LITERATURE REVIEW2.1 Introduction2.2 Principles of Continuous Sterilisation Design
2.3 Process Model Development2.3.1 Process Models2.3.2 Performance Equations2.3.3 Liquids with a Yield Stress
2.3.4 Effect of Combined Temperature and pH2.4 Summary
VI
lll
5
6
7
8
8
t214
l5l6
CHAPTER 3 MATERIALS AND METHODS3.1 Introduction3.2 Test Liquid3.3 TestMicro-organisms
3.3.1 Selection Criterion3.3.2 Selected Strains
3.3.3 General Characteristics3.3.3.I Pseudomonasfluorescens3.3.3.2 ListeriamonocYtogenes3.3.3.3 Escherichia coli
3.4 Thermal Inactivation Kinetics3.4.1 Maintenance of Bacterial Strains
3.4.2 Production and Harvesting of the Bacteria
3.4.3 Micro-Method for Heat Treatment3.4.4 Enumeration of Viable Bacteria3.4.5 Experimental Design
3.5 Criteria for an Adequate Model3.6 Concluding Remarks
CHAPTER 4 INACTIVATION KINETICS OF BENCH-SCALE DATA 29
4.1 Introduction 30
4.2 Results 30
4.2.1 Survivor Curves 30
4.2.2 Value of the Rate Coefficient (k) at Each Temperature 3l4.2.3 Corresponding D"6,p¡¡ Values at Each Temperature 3l4.2.4 Value of k at each T-pH 3l
4.3 Value of k for Combined T-pH 32
4.4 Discussion 32
4.5 Conclusions 37
t819
l92l2t2t22222223
2425
252626272728
vt ll
CHAPTER 5 SYNTHESIS AND VALIDATION OF TWO NON.LINEARTHERMAL INACTIVATION KINETIC MODELS
5.1 Introduction5.2 Validation Tests for Mathematical Models5.3 An nth Order Inactivation Model for the Thermal Inactivation
of Listeria monocytogenes in Liquid with Combined T-pH5.3.1 Synthesis5.3.2 Fit of the nOE Model to Data for Listeria monocytogenes
5.3.3 Discussion5.3.4 Concluding Remarks and Rejection of the nOE Model
5.4. Synthesis of a New CDT Model for Thermal Inactivation of Liquidwith Combined I-pH5.4.I Introduction5.4.2 Synthesis5.4.3 Validation of the CDT Model for the Effect of Temperature
5.4.4 Validation of the CDT Model for the Effect of Combined ?-pH5.4.5 Discussion5.4.6 Concluding Remarks and Acceptance of the CDT Model
for Testing in a Pilot Continuous Steriliser
5.5 Conclusions
CHAPTER 6 PILOT CONTINUOUS STERILISER STT]DY6.t Introduction6.2 ContinuousSteriliser
6.2.1 Selection of Test Micro-Organism6.2.2 Sizing of the Pilot Continuous Steriliser6.2.3 Flow Diagram6.2.4 Steam Injector6.2.5 Experimental Method6.2.6 Practical Implementation of Inherent Assumptions
of Steriliser Performance Equations
6.3 Results and Discussion6.3.1 Results Summary6.3.2 Comparison with Theoretical Predictions
6.3.3 A Comparison between Survivor Kinetics in the Continuous
Steriliser with the Capillary Data6.3.4 Analysis of the Continuous Steriliser Survivor Curves
6.3.5 Analysis of the Assumptions Inherent in the Continuous
Steriliser Trials6.3.6 Experimental Testing of the Holding Tube Hydrodynamics
6.3.7 Effects of Dispersion6.4 Summary
CHAPTER 7 CONCLUSIONS7.1 Recommendations
464748
495051
5252
54545457
6480
8l82
94959599
99103
110
l1lt14tt9
t20r23
8485868686879l93
APPENDIX A Definition of Some Important Terms Used in this Study I24

tx
APPENDIX B Refereed Publications from this Thesis8.1 International Refereed Journals
8.2 International Refereed Conferences
8.3 Australasian Refereed Conferences
t27128t28129
130
l3l135
t42
141
148
148
t49150
151
152
152
155
156
159
162
APPENDIX C
c.1c.2c.3
APPENDIX D
D.lD.2D.3D.4
APPENDIX E
E.18.2
8.4
E.5
8.6
P. fluorescensL. monocytogenesE. coli
Summary of Raw Bench-Scale Experimental Data as
Affected by Combined T-pH
Summary of Linear Regression Analysis for Linear-Arrhenius-Davey Equation to Bench-Scale Data as
Affected by Combined T-pHIntroductionLinear Regression Analyses for P. fluorescensLinear Regression Analyses for L. monocytogenes
Linear Regression Analyses for E. coli
Summary of Linear Regression Analysis for Log-Linear,nOE and CDT Models to Bench-Scale Data as Affectedby T and Combined ?-pH
E.3
IntroductionLinear Regression Analyses for Log-Linear and CDT Modelsto Continuous Survivor Data for E coli as Affected by TLinear Regression Analyses for nOE Model to Bench-Scale
Survivor Data for L. monocytogenes as Affected by Combined Z-pHLinear Regression Analyses for Log-Linear and CDT Modelsto Bench-Scale Survivor Data for P. fluorescens as Affected by
Combined T-pHLinear Regression Analysis for Log-Linear and CDT Modelsto Bench-Scale Survivor Data for L. monocytogenes as Affectedby Combined T-pHLinear Regression Analysis for Log-Linear and CDT Models to Bench-
Scale Survivor Data for E. coli as Affected by Combined I-pH
Sizing the Continuous Steriliser Length from Bench-Scale Data Using the CDT Model for E. colilnactivationas Affected by Combined T-pH
APPENDIX F
F.1F.2
IntroductionCalculation of the Critical Coefficients for the CDT Model for E. colifor Combined I-pH Based on Bench-Scale DataPredicted Iængth of Pilot Continuous Steriliser Using the CDT-Dynamic Model for Combined I-pH
165
t66
t66F.3
168

x
APPENDIX H Sizing the Steam Injector for the Pilot Continuous Steriliser 178
H.l Notation Used in this Appendix 179H.2 Analytical Development l8l
H.2.1 Steam-Side 181
H.2.2 Liquid-Side 182
H.2.3 Design Equations 183
H.3 Solution of Equations at the Conditions of Experimental Steriliser 183
H.3.1 Liquid-Side 183
H.3.1.1 First Approximation 184
H.3.1.2 Second Approximation 185
H32 Steam-Side 186
HA Mass and Energy Balance for Steam Injector 188
APPENDIX G Summary of Continuous Steriliser Raw Data and CDTModel Predictions
G.l IntroductionG.2 Continuous Steriliser Experimental Data for Combined Î-pHG.3 Predictions of the CDT-Hydrodynamic Model for Combined T-pH
APPENDIX I ThermocouplesI.1 Measurement ErrorI.2 Calibration of Thermocouples
APPENDIX J Equations for Concentration of the Test Liquid inContinuous Steriliser
IntroductionEquations
APPENDIX K A Procedure to Estimate the Effects of DispersionK.1 IntroductionK.2 DerivedCalculations
APPENDIX L Safety Operational Procedures (SOP's) for PilotContinuous Steriliser
NOTATION
REFERENCES
171
172
172
174
190
191
t91
194195
195
t97198
198
J.1
1.2
200
205
208

CHAPTER
ONE
INTRODUCTION
1

\¡ t:
il.{¿
ri ìì'l
The food industry is generally a nation's largest manufacturing sector and one of its
stable (Davey 1993a). World-wide media reporting of food poisoning outbreaks has
increased public awareness and consumer expectations of a safe and wholesome food
supply. Thermal sterilisation is an essential tool that is widely employed to ensure the
microbiological safety of a wide range of foods. Thermal processing is more reliable,
flexible and economical than other means of sterilisation, such as filtration and chemical
disinfection (Aiba, Humphrey and Millis 1973, Hugo 1991). Thermal sterilisation can be
carried out as either a batch or continuous process for a wide variety of bulk liquid media.
The advantages of a continuous process over a batch process include an improved product
quality (because of a greater nutrient retention), a greater production rate with simplified
quality control, aseptic handling and reduced costs (Aiba, Humphrey and Millis 1973,
Bailey and Ollis 1986). These advantages result from steady-state operation in which
greater control of process temperature and exposure time is possible than with batch
processes.
A typical continuous steriliser consists of three main sections: a heating section, a holding
section and a cooling section (Bailey and Ollis 1986, Aiba, Humphrey and Millis 1973).
Sterilisatior.t ir d"fined as "that process where an apparent death of the cells may be due to
the inability of the cells to germinate or, after germination, the inability for outgrowth to
occur with the production of more cells" (Banwart 1979). A working definition however is
"a reduction in the number of viable cells to some specified number" which is referred to
as a sterility requirement.
The objective of sterilisation is to achieve a necessary sterility requirement with minimum
concomitant thermal damage to food quality. Because of the risks of a public health
significance associated with error, sterilisation processing is generally conservative. This
results in over treatment however that is wasteful in both costs and damage to food quality,
especially vitamins (Davey and Cerf 1996).
2
¡ see Appendix A for a definition of important terms used in this study
Formulation of adequate mathematical models describing thermal inactivation of bacteria
therefore has a central place in planning and design and is an essential pre-requisite to
process optimisation. In addition to the exposure temperature (I) and holding time (r), the
pH of liquid foods is known to significantly affect sterilisation effectiveness.
Mathematical models for predicting the combined effect of these two process variables
T andpH in addition to time are therefore of major interest. Current analyses are limited to
the effect of temperature alone, or, are fragmented in that predictions are based on
unrelated values of physical properties selected from a range of values given in the
literature.
The principal aims of this study are to evaluate and develop mathematical models for
sterilisation, undertake experimental studies for determining thermal inactivation effects on
continuous processing of a liquid containing contaminant bacteria and compare the data
obtained with those predicted by a selected model. The bacteria, methods and liquid are
chosen with a view to applying findings to realistic problems related to commercial
sterilisation by heat.
A logical and stepwise approach was adopted as a research strategy.
The relevant literature is reviewed and a summary appraisal is presented in Chapter 2. A
major shortcoming identified is the widespread, and usually untested, assumption of
log-linear thermal kinetics. Based on this review a systematic approach to testing of
assumptions in bacterial survivor data is proposed which involves testing of model forms
against published and experimentally derived survivor data determined using standard
microbiological techniques in capillary (ie batch) studies and limited continuous
(ie dynamic) flow data.
Chapter 3 outlines the selection and characterisation and maintenance of three selected
bacteria, choice of carrier liquid and experimental procedures for determining essential
inactivation data.
3

In Chapter 4 a shift from widely assumed log-linear kinetics of thermal inactivation is
proposed and demonstrated following analysis with the derived experimental data and data
taken from the literature.
In Chapter 5 a number of selected alternative mathematical models are synthesised and
presented for predicting the effect of combined T-pH on inactivation kinetics. Two are
selected for validation tests on the bench-scale data. One of these, a newly synthesised
CDT model, is selected for experimental testing in a pilot continuous steriliser.
Chapte: 6 describes the continuous steriliser and presents a comparison between the
experimental results and the predictions of the selected model for thermal inactivation
kinetics with combined process Z-pH. The kinetics of thermal inactivation in this flow
(dynamic) system are compared with those from the bench-scale (static) studies.
Chapter 7 is a summary of the findings and conclusions of this investigation together with
suggestions for further studies.
The definitions of some important terms used in this study are given in Appendix A and all
notation used is listed at the back of this thesis. A list of refereed publications arising from
this study are presented in Appendix B.
4
CHAPTER
TWO
LITERATURE REVIEW
Parts of this chapter have been published as:
Chiruta, J., Davey, K. R. and Thomas, C. J. (1997b) Thermal inactivation kinetics of threq
vegetative bacteria as influenced by combined temperature and pH in a liquid medium,
Transactions of the Institution of Chemical Engineers, Part C, Bioproducts and Food
Processing, 7 5: 17 4-l8O
5

2.1 INTRODUCTION
The general principles for continuous thermal sterilisation and practical operation of plant
have been reviewed in a number of major texts (Aiba, Humphrey and Millis 1973, Bailey
and Ollis 1986). The design of a steriliser is similar to that of a continuous flow reactor in
which the relevant reaction is the thermal inactivation of contaminating micro-organisms.
Continuous sterilisation, since its inception some 46 years ago (Whitmarsh 1954), has been
seen to be an efficient process for treating large quantities of liquids including fermentation
media and foods. Mathematical models of this important process however have only
latterly appeared in the literature. One reason for this later development in modelling is
attributable to the multidisciplinary nature of the problem, involving as it does biochemical
engineering, mathematics and statistics in addition to microbiology.
In the mathematical modelling of thermal sterilisation processing, process parameters
describing the resistance of micro-organisms to heat and thermal denaturation of food
quality, must be combined with parameters describing the rheology and hydrodynamics of
flow of the carrier liquid. Historically, these aspects have been widely studied in separate
investigations.
In this chapter the principles involved in continuous sterilisation design and the
development of models are examined. The generalised performance equations in
continuous sterilisation of homogeneous liquid are then appraised. The model form of Lin
(1976) and Davey and 'Wood (1984) is selected as the most suitable for theoretical
extension, modification and experimental testing. Shortcomings in the literature are
identified, and the need for a comprehensive evaluation of the effect of combined exposure
temperature and pH (T-pH) is highlighted along with inadequacies in the applicability of
the log-linear model for thermal inactivation.
6
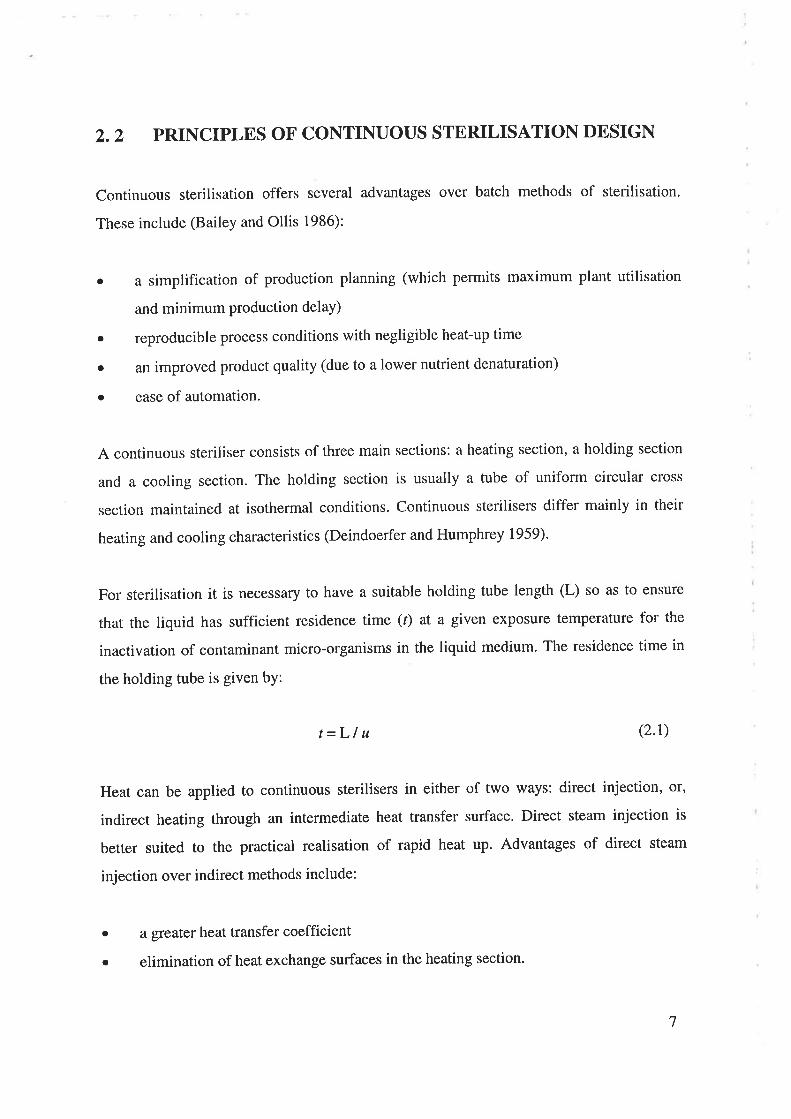
2.2 PRINCIPLES OF CONTINUOUS STERILISATION DESIGN
Continuous sterilisation offers several advantages over batch methods of sterilisation.
These include (Bailey and Ollis 1986):
. a simplification of production planning (which permits maximum plant utilisation
and minimum production delaY)
. repfoducible process conditions with negligible heat-up time
o an improved product quality (due to a lower nutrient denaturation)
. ease of automation.
A continuous steriliser consists of three main sections: a heating section, a holding section
and a cooling section. The holding section is usually a tube of uniform circular cross
section maintained at isothermal conditions. Continuous sterilisers differ mainly in their
heating and cooling characteristics (Deindoerfer and Humphrey 1959).
For sterilisation it is necessary to have a suitable holding tube length (L) so as to ensure
that the liquid has sufficient residence time (t) at a given exposure temperature for the
inactivation of contaminant micro-organisms in the liquid medium. The residence time in
the holding tube is given bY:
t=Llu (2.r)
Heat can be applied to continuous sterilisers in either of two ways: direct injection, or,
indirect heating through an intermediate heat transfer surface. Direct steam injection is
better suited to the practical realisation of rapid heat up. Advantages of direct steam
injection over indirect methods include:
. agreater heat transfer coefficient
o elimination of heat exchange surfaces in the heating section.
7

The value of the heat transfer coefficient for a number of injected media - including air,
water, and condensing steam - are given by Jones and Larner (1968).
Condensing steam acts to dilute the liquid. Model analyses must therefore take account of
this, especially as dilution effects the rheological properties of the liquid and consequent
hydrodynamics of liquid flow and residence times. Steam injection can also introduce
instabilities in the flow of liquid in the holding tube if not all the steam bubbles condense
rapidly. Generally however, well-designed direct injection systems may be used for
products such as milk and fresh dairy (de Jong 1997).
2.3 PROCESS MODEL DEVLOPMENT
2.3.1 Process Models
Process models for continuous sterilisation have developed from contributions by various
investigators. A chronological listing is given in Table 2.1. All investigators have,
reasonably, implied that the contaminating micro-organism will be uniformly distributed
throughout the liquid. Further, all have employed the power law equation (Skelland 1967,
Holdsworth l97l) - see equation 2.2 - to describe the rheology and residence time
distribution of the carrier liquid.
The analysis of Deindoerfer and Humphrey (1959) is perhaps the earliest attempt at
modelling continuous sterilisation. This analysis was based on an assumption of turbulent
flow of liquid in the holding section. Changes in temperature were allowed for through use
of an overall heat transfer coefficient.
For many liquid foods however, laminar flow is the only economical regime as noted by
Manson and Cullen (1974) because of prohibitive pumping costs associated with viscous
liquids. Importantly, because a velocity gradient occurs in laminar flow not all portions of
the liquid will be subjected to the same thermal exposure.
8

Table 2.1 Summary of model development for bacterial survival in batch and
continuous sterilisation of liquid
Authors Year Proposal / Model
Esty & Meyer
Deindoerfer & Humphrey
Charm
Ruyter & Brunet
Manson & Cullen
Simpson & Williams
Lin
Han,Zhang & Krochta
Lin
Davey, Lin & Wood
Guariguata, Barreiro &Guariguata \
Ashley
Davey & V/ood
Davey
Coker, Davey & Kristall
Cole et al
Davey, Hall & Thomas
Cerf, Davey & Sadoudi
Davey & Cerf
Log-linear thermal batch survival data
Turbulent flow analysis
Integration of lethal effects with laminar flowvelocity profile
Heterogeneous food processing
Foods with discrete particulate matter
HTST heating with laminar flow and intermediateheat transfer surface
I dependent-dispersion model
Batch model for innate heterogeneity theory
HTST analysis
T-pH dependent HTST analysis
Laminar flow of Bingham plastic
Design optimisation
Comprehensive experimental testing ofcontinuous steriliser
Generalised sterilisation chart for T-pH effect
Combined T-pH dependent denaturation ofaccompanying vitamin
Combined T-pH non-linear batch-kinetic model
Combined T-pH thermal inactivation - need fornon-linear survivor kinetics
Predictive model for combined T-pH-ø* effect
Concomitant vitamin denaturation influenced by
combined T-pH
t922
t959
1966
1973
r914
1914
r975
1916
1976
t978
t979
) 1982
1984
r993b
r993
t993
1995
1996
t996
HTST High - Temperature - Short - Time
9
Charm (1966) first demonstrated the concept of integrating parameters that describe
thermal inactivation kinetics with the effect of laminar velocity profile through a steriliser
holding tube. Procedures for calculations were reported and a final process evaluation was
expressed in terms of probability of product spoilage. The analysis is applicable to the
isothermal flow of a homogeneous liquid with instantaneous heating and cooling.
Instantaneous heating can be practically realised with direct steam injection. Flash cooling
- ie a sudden drop in process pressure - can be employed to practically realise rapid cool
down of the heated liquid.
The presence of a residence time Cistribution in continuous flow reactors has been
thoroughly investigated and is well documented by, among others, lævenspiel (19]2).
de Ruyter and Brunet (1973) outlined the theory on which the processing of liquid
containing discrete particulate matter could be based, but the effect of residence time
distribution was not considered.
In a comprehensive study, Simpson and \Williams (1974) analysed the indirect heating and
cooling of a liquid in a shell and tube heat exchanger. A shortcoming is that this type of
design relies on conductive heating of the liquid with its low value of overall heat transfer
coefficient when compared to the direct injection method. The analysis is applicable to
sterilisation of homogeneous liquids in laminar flow. Simpson and Williams concluded
that optimisation of product quality required the smallest possible diameter holding tubes
and a compact heat exchanger design. However a short length of holding tube of a large
diameter is a better practical compromise because of the resulting lower liquid velocities
and shear stresses. Too great a shear could rapidly result in a time dependency of the liquid
known as liquid aging.
Dispersion of the bacterial cells during thermal sterilisation in a long holding tube was
investigated by Lin (1975). An allowance was made for variation in temperature (earlier
models had assumed a constant temperature in the holding tube). In such models, the
mixing characteristics of the molecules of the liquid apply equally to the behaviour of the
10

a
o
bacteria suspended in the liquid'
Lin (1976) later proposed an instantaneous heating and isothermal holding model similar to
thar of Charm (1966). The model is applicable to the High Temperature / Shot Time
(HTST) sterilisation of a homogeneous liquid in laminar flow. Illustrative predictions were
made for total steriliser length (holding and cooling sections) at different processing
temperatures, pseudoplastic indices and sterility requirements for the pathogen spores of
Clostridium botulinum. Process evaluation was based on the average or bulk concentration
of viable cells at the end of the steriliser'
Two proposals for cooling of the sterilised liquid were made
instantaneous cooling
non-instantaneous cooling modelled on the shell and tube exchanger type of Simpson
and Williams (1974).
Guariguata, Barreiro and Guarigvata (1979) developed a model for continuous sterilisation
of foods displaying Bingham plasticity properties, with laminar, isoviscous and no-
isoviscous flow. Ashley (1982) discussed design optimisation of the continuous steriliser.
The analysis inferred log-linear inactivation kinetics of the contaminant micro-organism
and an Arrhenius dependence on exposure temperature'
Davey and V/ood (1934) presented a detailed review of the relevant theory and a
comprehensive experimental evaluation of an experimental continuous steriliser based on
the instantaneous heating and cooling model of Lin (1916). Escherichia coli American
Type Culture Collection (ATCC) 25922 was selected as the indicator micro-organism.
Direct steam injection heating was used to practically achieve instantaneous heating of a
flowing liquid stream containing the bacteria. Flash cooling was used for near-
instantaneous cooling of the liquid.
Coker, Davey and Kristall (1993), Davey (1993a) and later Davey and Cerf (1996)
l1

developed a model for simulating the combined thermal and pH effect on concomitant
vitamin denaturation during sterilisation. This model was based on a linear-Arrhenius
kinetic equation for thermal inactivation of a bacterium and, the residence time distribution
of a non-Newtonian liquid. The pH of the food was shown to significantly affect the
denaturation of both thiamin (Br) and ascorbic acid (C) vitamins.
Of interest, but not the direct thermal inactivation of contaminant micro-organisms, is the
work of McKellar et al (1994) and Muriana (1997) in approaching thermal denaturations.
McKellar et al (1994) developed an analysis that described the inactivation of alkaline
phosphatase in whole milk in a pilot plant HT.QT steriliser. Listeria monocytogenes was tbe
bacterial contaminant. A computer program was presented to calculate the integrated lethal
effect of exposure temperature in the holding tube. For model development, a standard
alkaline phosphatase assay was used. The thermal inactivation of alkaline phosphatase was
used to simulate inactivation of bacterial cells.
A bench-top flow-injection steriliser was used by Muriana (1997) to investigate the
combined effect of pH and hydrogen peroxide on the inactivation L. monocytogenes in egg
white at a fixed time-temperature regime. The results were graphically presented and
discussed. However, no mathematical models were synthesised or appropriated for the
experimental data to predict thermal inactivation and the proportion of surviving bacteria.
2.3.2 PerformanceEquations
From the viewpoint of experimental testing of steriliser performance equations, Davey and
Wood (19S4) have pointed out that the near instantaneous heating and cooling model is the
most convenient. Both Charm (1966) and Lin (1976) proposed this model form. Because
the model of Lin (1976) is based more strictly on chemical reactor principles and fluid
mechanics it is selected as suitable for theoretical modifications and experimental testing.
The Lin model in its most simple form involves a coupling of the equations for the:
t2

a
a
isothermal velocity distribution of a power law liquid in laminar flow in a tube of
circular and constant cross section
thermal inactivation of viable bacterial cells carried on streamlines of the laminar.
Process evaluation is based on the resulting average (ie bulk) concentration (number) of
viable bacterial contaminants at the end of the steriliser.
The isothermal velocity distribution for a power law liquid in laminar flow in a tube of
circular cross section is well established in the literature and is given by (Wilkinson 1960,
Lin 1976):
u / <u>= [(3 n + I) l(n + l)] (1 - R(n+r)/n¡ (2.2)
The number of viable bacterial cells at the end of an isothermal holding tube as derived by
Lin (1976) with laminar flow is given by:
<N> l(No) = 2 exp (- kL I u) (u l<ø>) R d R (2.3)
The laminar flow assumption requires that the velocity in the radial direction is zero. Any
deviation from laminar flow will alter the residence time distribution. Any increase in the
residence time will decrease the number of viable bacterial cells at the end of the steriliser.
Bulk sampling of sterilised liquid is practical to implement. Standard microbiological
methods can readily be applied for enumeration of viable bacterial cells in the bulk samples
of control (unheated) and sterilised liquid.
Equation 2.2 implies that as the pseudoplastic index, n, decreases the local velocity near the
centre of the holding tube decreases and the velocity near the tube wall increases. In the
limiting case where n = 0, plug flow results and the equation reduces to an expression for
conversion in a plug flow reactor (lævenspiel 1972):
J0
t3

<N> / <No) = exp (- kL I <u>) (2.4)
The reader should note that equations 2.3 and 2.4 do not permit prediction of viable cell
numbers to zero survlvors.
The effect of temperature on the rate of thermal inactivation, k, is widely expressed in an
Arrhenius form, that was used both by Lin (1976) and Charm (1966), namely:
k=Aexp(-E/RT) (2.s)
In this study the factors A and E are considered independent of temperature.
The concept of a thermal death time, D, is used in thermal sterilisation processes. D is the
time required to reduce the number of viable cells to 1/10th of the original number (Aiba,
Humphrey and Millis L973,Bailey and Ollis 1986). The decimal reduction time is given by
the relation:
D =2.3031k (2.6)
The decimal reduction time is therefore merely a fbrm of the reciprocal of k. As D has the
dimension of time, it is often more readily understood, especially in industry, than the rate
(time-I¡ of k.
2.3.3 Liquids with a Yield Stress
Many liquid foods such as fruit juices and purees (Charm 1966, Holdsworth I97L),
margarine and chocolate mixes (Skelland 1967), and mustard and sauces (Holdsworth
lgTl) exhibit a yield stress. The yield stress is the value of shear that must be exceeded
before a liquid flows (and is non-directional). This phenomenon can be accounted for in
models of heat inactivation in sterilisers.
t4

For example, Davey, Lin and V/ood (1979) outlined a procedure to modify the Lin (1916)
continuous steriliser model to include predictions for liquid foods with a yield stress based
on the Herschel-Bulkley equation. This provided a flexible, hydrodynamic model to
include a wide range of time-independent liquids. Consideration of liquids with a yield
stress is outside the scope of this study however and is not considered further.
2.3.4 Effect of Combined Temperature and pH
Davey, Lin and Wood (1978) demonstrated a theoretical model for the rate coefficient for
thermal inactivation to account for the combined effect of temperature and pH on survivor
kinetics in a continuous steriliser.
Predictions of the number of surviving viable cells at the end of a steriliser were based on
selected data from Xezones and Hutchings (1965) for the thermal behaviour of the
pathogen Clostridium botulinum. Simulation indicated the significant effect of low values
of pH in reducing the exposure time at a given temperature and stated sterility requirement
for a range of foods.
Importantly, no experimental studies were carried out however
More recent theoretical work of Davey (1993a), and Coker, Davey and Kristall (1993) and
Cole et al (1993) has aimed at illustrating the inadequacy of the present industry
sterilisation models, which are temperature dependent only, to a range of liquid foods. A
modified Arrhenius equation has been successfully widely applied to sterilisation of a
range of bacteria and foods (Coker, Davey and Kristall 1993, Davey, Hall and Thomas
1995, Davey and Cerf 1996) and is of the form:
ln (k) = Co+ Ct I T + CzPH + G PH2 (2.7)
In an attempt to provide sufficient experimental data for the combined effect of process
temperature and pH on sterilisation kinetics for model synthesis, Davey, Hall and Thomas
15

(1995) experimentally investigated heating of samples in capillaries of small diameter. A
block experimental design consisting of five exposure temperatures and eight pH values
together with five exposure times was used. The test liquid selected had a value of the
pseudoplastic index comparable to a range of liquid foods (Davey and Wood 1984). The
test micro-organism was E coli ATCC25922. The effect of pH on inactivation was shown
to be highly significant.
A modified Arrhenius model of the form of equation 2.7 was formulated to fit these data.
However model predictions at the greater exposure times consistently under predicted the
number of surviving bacterial cells. This is apparently due to the occurrence of tails in the
bench-scale survivor data. It was concluded that the formulation of an adequate non-linear
(ie other than first order) inactivation model that includes the dependence of combined
exposure temperature and liquid pH on inactivation rates should be studied and the
implications for performance of a continuous steriliser investigated.
2.4 SUMMARY
From the revierv of the literature the following important factors emerge which are relevant
to this study:
A number of rnathematical models have been proposed to simulate continuous
sterilisation of liquids and allow for the effects of changing process parameters,
principally the exposure temperature and holding time. Because the values of the
parameters used in predictions with the generalised steriliser performance equations
have been considered in isolation, these published models are of limited value. Such
models can only be used as a guide for broad comparative purposes.
Limited theoretical studies of continuous sterilisation and very limited published
experimentally determined bench-scale survivor data have highlighted the highly
significant effect of pH in addition to exposure temperature (Q and holding time on
1
2
t6

J
the thermal inactivation kinetics of contaminating bacteria. With two exceptions,
Davey, Hall and Thomas (1995) and Cole et al (1993) there are not many published
data that demonstrate the combined effect of both process temperature and liquid pH
(7"-pH) on the survival of vegetative bacteria that are amenable to steriliser design
and optimisation. Reasons for this limited data include the "... monumental amount
of work..." and the "... painstaking effort required..." to generate the data
(McMeekin et al 1993) and the move worldwide to in confidence tesealch results.
Comprehensive experimental evaluation of process models for the combined T-pH
effect that would permit a comparison of experimental results with predictions in a
dynamic system are not available in the published literature. An evaluation of the
effect of combined exposure temperature and pH is an essential step to process
understanding and process optimisation'
published models imply first-order or log-linear inactivation kinetics of
contaminating bacterial cells. Limited bench-scale data of the combined effect of
T-pH suggest non-linear inactivation kinetics. The implications of this in the
generalised steriliser performance equations have not been investigated.
5. Because the model form of Lin (1976) and Davey and Wood (1984) is based on
chemical reactor principles and fluid mechanics it is selected for theoretical
extension, modification and experimental testing.
In the following two chapters, the inactivation kinetics of bacteria as effected by combined
process T-pH are reviewed in detail and an extensive experimental investigation is
undertaken to determine sufficient bench-scale data to asses the nature of the kinetics of
survival of a number of typical liquid food contaminants. The implications of possible
confirmation of non-linear inactivation kinetics on the generalised performance equations
for sterilisation are investigated and suitable criteria to test for an adequate model are
established.
4
t7

THREECHAPTER
MATERIALS AND METHODS
Parts of this chapter have been published as:
Chiruta, J., Davey, K. R. and Thomas, C. J. (I997b) Thermal inactivation kinetics of three
vegetative bacteria as influenced by combined temperature and pH in a liquid medium'
Transactions of the Institution of Chemical Engineers, Part C, Bioproducts and Food
Processing, 7 5: l7 4-180
18

3.1 INTRODUCTION
This chapter describes a bench-scale apparatus and experimental procedures used to
determine new survivor data of the kinetics of thermal inactivation of two selected bacteria
as affected by combined exposure temperature and pH (T-pH). These data, together with
available published data for a third micro-organism, are analysed for an appropriate model
form for thermal inactivation kinetics'
The aim is to determine the value of rnodel parameters that can be used in the generalised
performance equations for continuous sterilisation to predict the length of holding tube of a
pilot steriliser in which the thermal effects on liquid containing bacteria can be observed.
The implications of possible confirmation of non-linear inactivation kinetics on the
generalised are investigated. suitable criteria to test for an adequate kinetic model for
thermal inactivation are established'
Consequently this chapter deals with:
1. selection and rheological characterisation of a suitable carrier liquid
2. selection of test micro-organisms
3. establishing criteria for testing for an adequate kinetic model'
3.2 TEST LTQUID
A sterile (autoclaved), aqueous mucilage of 2kgm-3 Carbopol@ 934 resin neutralised with
AR sodium hydroxide was selected as the test liquid. This liquid has a number of
characteristics advantageous to this study as pointed out by Davey' Hall and Thomas
(1995) and Davey and Wood (1984), that include it:
is not bactericidal and is non-toxico
a is resistant to degradation by bacteria and does not support the growth of bacteria
t9
a
o
c
exhibits an appropriate value of the pseudoplastic index (n) that simulates a wide
range of time-independent liquid foods
is transparent and therefore suitable for dye-trace studies to investigate the adequacy
of hydrodynamic flow assumptions in the proposed continuous steriliser
has an excellent product uniformity and well defined rheological properties and does
not exhibit aging effects associated with carboxymethylcellulose solutions (Naik, I.ee
and Richardson 1977)
is available in quantity.o
The pseudoplastic index of the mucilage is n = 0.37 as determined from some 1470 shear
stress shear rate data pairs, each the mean of 2l data points with 14 applied shear rates at
each of five temperatures (Davey and Wood 1984). This value is approximately a
mid-range value between 0.25 and 0.65 that characterises a wide range of liquid foods
(Holdsworth 197 I, 1992, 1993).
Mucilages with a range of pH values for study were obtained with selected adjustment
using a (sterile) solution of (AR) sodium hydroxide (l\Vo wlv), or by the addition of
hydrochloric acid or sodium chloride. Rheological testing of the mucilage has shown that
the viscosity did not differ significantly across the entire selected pH range (Davey, Hall
and Thomas 1995, Davey 1980). Mucilages were prepared using the protocol established
by Davey and Wood (1984) and Davey, Hall and Thomas (1995) who reported that the
viscosity of the mucilage was not effected by the presence of dispersed bacterial cells of
E. coli.
Results obtained in this carrier liquid would therefore be applicable to interpretation for the
processing of a wide range of liquid foods. Other test liquids might have included tomato
puree, condensed milk or orange juice. These were not used because of short shelf life, cost
in quantity, irreproducible liquid uniformity, ability to support micro-organism growth and
the impracticality for dye-trace studies.
20

3.3 TEST MICRO.ORGANISMS
3.3.1 Selection Criterion
The strains of microorganism selected for the experimental tests would necessarily have to
satisfy a number of essential requirements, namely:
o be well documented
o have a significant sensitivity to temperature
. exhibit simple growth requirements
. be easily dispersed as individual cells'
3.3.2 Selected Strains
pure strains of three vegetative bacteria were selected as the test micro-organisms:
Escherichia coli, 'seattle strain' American Type Culture Collection (ATCC) 25922,
Listeria monocytogenes, Seelieger Listeria Culture Collection (SLCC) 5764, and
pseurJomonas fluorescens I72, obtained from the Department of Microbiology and
Immunology, University of Adelaide. These represent common micro-organisms known to
spoil liquid and solid food. They are non-spore forming and are characterised as thermo-
tolerant to mild thermal processes.
The thermal sensitivity of these bacteria conveniently permitted exposure temperatures
below liquid boiling (and avoided high pressures) thereby simplifying the consequent pilot
continuous steriliser. Findings however can be extrapolated to behaviour of thermally less
sensitive contaminant cells in the hydrodynamics of a continuous steriliser as pointed out
by Davey and Wood (1934) and Davey, Hall and Thomas (1995)'
2l

3.3.3 General Characteristics
3.3.3.1 Pseud.omonas fluorescens
pseudomonas spp. are ubiquitously distributed in soil and water and are commonly
associated with spoilage of foods including milk. They are strictly aerobic, Gram-negative
bacteria. Microscopically, they appear as straight or curved rods and cocci shapes. The cell
has a diameter of 0.7pm to 0.8 pm and a length of 2 pm to 3 pm. Pseudomonøs spp. have
an optimum temperature of growth of 25oC to 30oC. However, they grow over the
temperature range of 4oC to 43oC. They are motile by one or more polar flagella and never
fermentative. Some species produce;'ellow-orange cellular pigments (Palleroni 1984).
The heat resistance of Pseudomonas spp. is not well documented. Dabbah, Moats and
Mattick (1969) and Moats (1971) reported that some cells could recover post thermal
exposure and grow in a suitable liquid medium.
Most of the recent literature associated with P. fluorescens however is related to lability
and stability of extra-cellular lipases and proteases (Tsuji et al 1982). Kalchayanand et al
(1ggg) investigated the effect of interactions of hydrostatic pressure, time and temperature
on inactivation of P. fluorescens. They found that in general cell death increased as the
pressure, time, or temperature increased. However, the death rate at high pressure and high
temperature (50"C) combination followed first-order kinetics, and at lower pressure and
temperature combinations it showed a tailing effect'
3.3.3.2 Listeria monocYtogenes
Members of the genus Listeria are facultatively anaerobic to microaerophilic (growth
enhanced under reduced oxygen and 57o to lOVo COz), Gram-positive bacteria'
Microscopically they appear as rod shaped with rounded ends and measure 0.4 pm to
0.5 pm in diameter by 0.5 pm to 2.0 pm in length. The rods have a tendency to produce
chains of three to five or more cells. They are motile by flagella when grown at 22oC to
25"C. Growth occurs between 4oC and 38oC, particularly when the medium contains small
amounts of glucose (Seeliger and Jones 1986).
22

L. monocytogenes is reported to be more thermally resistant than many other non-sporing
pathogens associated with food such as Salmonella (Mackey and Bratchell 1989, Farber
1989). A large outbreak of listeriosis associated with the consumption of pasteurised milk
initiated efforts to obtain accurate D values for thermal inactivation of L. monocytogenes in
milk in order to assess the margin of safety for different pasteurisation regimes (Mackey et
al 1990). Karaioannoglou and Xenos (1980), Harrison and Carpenter (1989a,b), Carpenter
and Harrison (1989) showed that L. monocytogenes can survive in red meat or poultry
cooked to temperatures as high as 82oC. The work of Cole et al (1993) indicated that the
heat resistance of L. monocytogenes is affected by a wide variety of environmental
conditions. The micro-organism tolerates widely ranging salt concentrations (up to TCVo to
l2To),pH (5.5 to 9.5) and a wide temperature range (-0.4"C to about 44'C).It is, however,
capable of growing well at ordinary refrigerator temperatures, and this property gives it a
competitive advantage over any accompanying mesophilic micro-flora (Varnham and
Evans 1991).
Usually infection ranges from a mild influenzalike condition to severe infections in the
blood and brain. The consequences of infection with L. monocytogenes are abortions,
encephalitis and meningitis in animals and humans (Grau 1996).
3.3.3.3 Escherichia coli
E. coli is a well documented and a widely studied bacterium. Most of the information about
the genetic organisation of procaryotic cells is derived from studies with E- coli. The
bacterium is facultative, Gram-negative and appears as a colourless rod about lpm to 2 pm
in liquid media. It is a component of the normal intestinal flora and gives rise to disease
only under exceptional circumstances. This bacterium is often used as an indicator strain
for fecal contamination of waters and foods.
The effect of heat and other environmental factors on thermal inactivation of this bacterium
can be found in literature over many years. Jordon, Jacobs and Davies (1947) studied the
lethal effect of different temperatures on E. coli at pH 7.0. They found different
combinations of temperature and exposure time that had a99.997o (ie logro4) lethal effect
23
on E. coli. Their study showed that the lethal temperature for a particular micro-organism
depends on the time of exposure (Hawker and Linton 1979). Earlier, Jordon and Jacobs
(1944, lg45) had studied the relationship between the logarithms of survivors and time
when exposed to various concentrations of phenol (between 3.5 g l-t and 6.01 g l-l¡ at a
temperature of 35oC.
Aiba, Humphrey and Millis (1913) presented experimental data fot E. coli in buffer, as
proportion of survivors against time over a range of temperatures between 54oC and 60oC.
The observations suggest that a 5-logro reduction of survivors was obtained at 60oC and
about 3.5 min, or at 58oC for about 6.5 min (Bailey and ollis 1986). The decimal reduction
time value calculated from the data of Aiba, Humphrey and Millis (1913) is D = 16.25 s at
60oC, this compared with about D = 3.8 s from the data of Davey, Hall and Thomas (1995).
These differences might be attributed to both differences in the strains used in the different
studies. I-emaire, Cerf and Audurier (1989) also reported differences in the heat resistance
among the strains of L. monocytogenes.
The effect of the suspending carrier medium should also not be ignored. It is noteworthy in
this context however that for E. coli, the decimal reduction time values obtained in the
study of Davey, Hall and Thomas (1995) were in very good agreement with those reported
by Davey (1980) and Davey and'Wood (1984), who used identical strain and carrier.
3.4 THERMAL INACTIVATION KINETICS
Because the data for E. coli in the study of Davey, Hall and Thomas (1995) were in very
good agreement with those reported by Davey and Wood (1984) and Davey (1980) these
published data were confidently appropriated to be used for analyses of survivor kinetics as
influenced by combined T-pH. Comparative data were similarly experimentally determined
for both P. fluorescens and L. monocytogenes'
24

The thermal inactivation kinetics of both P. fluorescens and L. monocytogenes in the
selected carrier liquid were determined using the method described by Davey, Hall and
Thomas (1995) which was itself a modified form of that outlined by Stern and Proctor
(1954). This method uses samples in small diameter glass capillary tubes. The advantage is
the rapid heating and cooling of a number of samples that can be treated simultaneously.
The investigation involved the:
r maintenance of the bacterial cultures
o production and harvesting of the cells
o heat exposure using the micro-method
. counting of viable cells by the spread plate technique
3.4.1 Maintenance of Bacterial Strains
Stock cultures of bacteria were routinely maintained as suspensions in glycerol at -70oC.
3.4.2 Production and Harvesting of the Bacteria
p. fluorescens wete routinely cultivated on nutrient agar or nutrient broth (Oxoid@).
L. monocytogenes was cultivated on brain heart infusion agar or broth (Difco@¡. Cells of
p. fluorescens wefe sub-cultured from stock cultures and grown in 50 ml of Nutrient Broth
with incubation with shaking at37oC for 18 hours, and,25oC for 48 hours, respectively.
L. monocytogenes was routinely cultivated in Difco Brain-Heart Infusion broth (BHI) and
incubated with shaking at37"C for 18 hours'
The overnight cultures were harvested by centrifugation (4000 x g for 10 minutes), washed
and re-suspended in sterile, distilled water (Davey and Wood 1984). All cell suspensions
were subjected to the same environmental conditions before and after experiments. To
minimise the influence of the age of cells, the experiments were conducted within a short
time (about 2 hours) of harvesting. In this way any differences in the number of cells
25

inactivated during heating can be attributed to the effect of temperature, or other
environmental factors.
3.4.3 Micro-Method for Heat Treatment
Harvested cells were added aseptically to a solution of pH-adjusted Carbopol (see section
3.2) to achieve cells densities of between 107 - 108 cells per ml. Volumes (10 pl) of these
cell suspensions were loaded into the centre of sterile, thin-walled glass micro hematocrit
tubes (1.1 mm inner diameter with a 1.5 mm outer diameter and a length of 75 mm, Clay
Adams, parsipanny, Nj, USA) using an auto piJrette. The ends of the tubes were heat-sealed
in the flame of Bunsen-Burner (Davey, Hall and Thomas 1995). Hematocrit tubes were
used because of the combination of thin glass wall (0.2 mm) and small suspension volume
that gave a practical negligible time for heat up and cool down.
Sealed tubes carrying test suspensions were chosen at random and immersed in a
temperature controlled water bath. After exposure the treated tubes were placed in an ice
bath for rapid cooling.
The experiments at a given temperature were carried out in random order. Control tubes
were treated in an identical manner but without exposure. The numbers of viable bacteria
in the heat-treated and control tubes were then determined.
3.4.4 Enumeration of Viable Bacteria
The content of each capillary tube was flushed into sterile plastic tubes using 200 pl of
sterile diluent (o.BSVo w/v sodium chloride). This fluid was serially diluted and 100 pl
volumes of each dilution plated on nutrient medium'
P. fluoresc¿t?s was plated on nutrient agar. L. monocytogenes was plated on BHI agar'
Inoculated plates were then incubated at 37oC for 24 hours. Plates with between 30-300
colonies were counted and these counts used to determine the number of surviving bacteria
26
(Meynell and Meynell 1970). Counts of bacteria present in unheated suspensions were also
determined to two replicates of each raw sample counted. Any (occasional) contaminant
was easily differentiated on the basis of colonial morphology and was not therefore
counted.
3.4.5 Experimental Design
For each of the selected bacteria, an experimental block design that covered up to six levels
of exposure temperature in the range of 52oC to 62oC (52, 54,56, 58, 60, 62"C), and up to
eight levels of pH values (4.0, 4.5,5.0, 5.5, 6.0, 6.5, L0,7 .5), together with exposure times
from 10 s to five minutes, was employed. The experiments at each exposure temperature
and time were carried out in a random order. This design permitted quantification at the
extreme rates of thermal inactivation'
3.5 CRITERIA FOR AN ADEQUATE MODEL
An adequate mathematical model is an essential step to longer-term process control and
process optimisation (Davey 1993a). The criteria for an adequate model include:
accurate predictions against observed data
relative complexity (ie parsimony see McMeekin et al 1993)
ease of use
and, arguably, the potential for physiological significance and interpretation of model
parameters (Davey I993a).
a
o
a
27
3.6 CONCLUDING REMARKS
The apparatus and experimental procedures described in this chapter have been used to
provide robust bench-scale thermal inactivation data for testing of appropriate survivor
kinetics. The criteria adopted for testing has been established.
The following chapter presents the evaluation of thermal inactivation kinetics of the test
micro-organisms in the test liquid. These data are analysed for an appropriate model form
for thermal inactivation kinetics, together with available published data for a third micro-
organism. The aim is to determine value: of an appropriate kinetic model that can be used
to size a pilot continuous steriliser.
28

CHAPTER
FOUR
INACTIVATION KINETICS OF BENCH.SCALE DATA
The findings of this chapter have been published as:
Chiruta, J., Davey, K. R. and Thomas, C. J. (1997b) Thermal inactivation kinetics of three
vegetative bacteria as influenced by combined temperature and pH in a liquid medium,
Transactions of the Institution of Chemical Engineers, Part C, Bioproducts and Food
P roce ssing, 7 5: 17 4-l8O
29
4.I INTRODUCTION
Results obtained from the experimental investigation described in Chapter 3 of the bench-
scale thermal inactivation data for P. fluorescens and L. monocytogenes, as affected by
combined temperature and liquid pH (f-pH), are presented. These data are analysed
together with published data for the bench-scale thermal inactivation of a third micro-
organism, E. coli, as affected by combined temperature and liquid pH.
Thermal survival kinetics are examined using all three data sets in a comparative study.
The effect of pH is shown to be highly statisticaliy significant and a decimal reduction time
D"c,ps is defined.
Major findings are summarized and the need for non-linear kinetic models for thermal
inactivation is highlighted. The implications arising from the use of non-linear survivor
kinetics as influenced by combined exposure temperature and liquid pH to food processing
are discussed
In the following chapter, Chapter 5, the data are analysed for an appropriate model form for
thermal inactivation kinetics
4.2 RBSULTS
4.2.I Survivor Curves
The experimental designs used to derive bench-scale thermal inactivation data resulted in
20 survivor curves for P. fluorescens and 48 for L. rnonocytogenes. These compare with the
40 survivor curves for E. coli of the data of Davey, Hall and Thomas (1995)'
However the number of survivor curves for P. fluorescens is targeted over a naffower range
of pH that is specific to liquid foods (eg purees, juices)'
30

Sample raw data for P. fluorescenr are presented in Table 4.1 for a mid-range exposure
temperature of 56'C. Presented in Table 4.2 is a sample set for L. monocytogenes for a
(approximate) mid-range exposure temperature of 58'C.
The complete raw data for P. fluorescens and L. monocytogenes, and E. coli are presented
in Appendix C.
4.2.2 Value of the Rate Coefficient (/c) at Each Temperature
The value of the rate coefficient,k, was determined for each survivor curve from a linear
regression (Snedecor and Cochran 1969) of a plot of logro <N>/<No> versus time (r)
(equation 2.4) at each Î-PH.
4.2.3 Corresponding D'ç,p¡¡ Values at Each Temperature
Corresponding values of a decimal reduction time defined by both exposure temperature
("C) and pH, D"c,ps, were calculated using equation 2.6. These results are presented in
Table 4.3 andTable 4.4, respectively, for P. fluorescens and L. monocytogenes'
For comparison, decimal reduction times for E. coli reported by Davey, Hall and Thomas
(1995) are summarised in Table 4'5.
4.2.4 Value of katEach T-PH
Figures 4.1 to 4.3 show the dependence of the rate coefficient for thermal inactivation
expressed as ln k versus pH at each exposure temperature over the experimental
temperature range of 52"C to 62"C for P. fluorescens, L. monocytogenes and E. coli'
respectively.
3l

4.3 VALUE OF ft FOR COMBINED T-PH
The value of the coefficients for the model for combined temperature and pH (equation
2.7) were obtained from a standard linear regression of the survivor data for each bacterium
to give, respectivelY, for P. fluorescens and L. monocytogenes :
ln (k) = 116 - 41685 lT +2.56pH - 0.250 pH2
ln (k) = 130 - 41160 I T - 2.73 pH + 0. 194 pH2 (4.2)
Substitution for ldegree absolute gives the rate coefficient for thermal inactivation in s-1.
Equations 4.1 and 4.2,respectively, explain 94.3 VoV and 85.8 ToV.For E. coli, Davey, Hall
and Thomas (1995) reported the following model:
ln (k) = l3g - 44908 I T - 1.52 pH + 0.124 plHz
(4.1)
(4.3)
where substitution for T absolute, gives the rate coefficient for thermal inactivation in s-l
with 92 VoV explained.
These apparent high values of VoV suggested by equations 4.1, 4.2 and 4.3 are however
misleading and must not be used in isolation. The misleading nature of the apparent good
fit is clear from directly comparing predictions with the raw data as detailed in the
following discussion.
4.4 DISCUSSION
The use of decimal reduction time (D) was criticised by Davey (1932) because this, and
other commonly used industry definitions, "confuse, or at least obscure, what should be the
... simple mathematics of a first order equation, where the inactivation kinetics are ...
32
totally, defined by fr and the activation energy. An additional statement about the range of
(temperature) and Ns from which they were determined may also be very important to the
designer as the thermal kinetics are often pseudo-first-order from which extrapolation
might not be confidently done".
Further, because either degree Fahrenheit or Celsius may be used, a careful check on the
calculation is necessary. Davey, Hall and Thomas (1995) demonstrated that in
sterilisations, both the pH and temperature are necessary in defining values of the decimal
reduction time.
Assuming first-order kinetics for inactivation, an apparent good fit - implied through the
high values of VoV, equations 4.1,4.2 and 4.3 - is obtained for k. However, this is very
misleading because a good fit to k does not imply, especially with these data, a good fit to
the survival level expressed as logro (N / Nù. This is revealed clearly in Figures 4.4 and
4.5, respectively, for P. fluorescens and L. monocytogenes, where a direct comparison of
predictions with the raw data is made.
Consequently, the decimal reduction time (D.ç,0¡¡), and thereby k (equation 2.6), is of little
practical use for the three bacteria studied. This is because there is no systematic variation
in the difference between predicted and observed reductions (residuals) in viable cell
numbers. This can be seen for P. fluorescens where, from Table 4.3 at a mid-range
temperature of 56"C and pH 6.0, Dsø, ø.o= 142.9 s' From the raw data of Table 4.1,
however, the actual reduction at 143 s would be about 0.51logro (obtained through
interpolation) - and not the one logro, (9OVo), reduction implied by D. The result is an
under-treated sample with possible implications of a public health significance. However,
at T = 56"C and pH 6.5, Dsø, a.s= 200.0 s, whereas from Table 4.1 with f = 200.0 s the
actual reduction would be greater at about 1.26-lo9ro. The result of using D is an over-
treatment of the liquid that is wasteful in energy and denatured quality (eg vitamin
retention) (Davey and Cerf 1996).
33
For L. monocytogenes at I = 58"C and pH 6.0, Table 4.4 gives a value Dss, o.o = 22J.3 s
whereas from the raw data of Table 4.2 an actual reduction of 1.24-lo9¡6 would be
expected. In this case there is an over-treatment that would result in a conservative thermal
treatment of the contaminated Carbopol liquid. At the same temperature of 58'C but at a
pH 5.0, Dss, s.o = 73.5 s (from Table 4.4). The raw data of Table 4.2 however shows that a
0.29-logro reduction in viable cells would be obtained, implying a serious under-treatment
of the liquid.
At a T of 56'C and pH 5.0, the reduction in log¡s (N / N0) survivors of P. fluorescens
ranged between 0.116-lo9ro and about 5 lo9¡6 (with l5 s ( exposure time < 300 s) (Table
4.1), and for Z. monocytogenes at 58'C and pH 5.0, between 0.03-logro and about 4-lo916
(with 10 s ( / ( 240 s) (Table 4.2). These reductions compared with reductions of about
1.90-logro to 5.41-log1e for the more thermally sensitive (ie more easily inactivated) E. coli
at 58'C and pH 5.0 (with 8 s < r < 40 s) of Davey, Hall and Thomas (1995). This reduction
in viable cell number for E coli is obtained in the much shorter exposure of 40 s compared
with the longer times of between 240 s and 300 s, respectively, for the more thermally
resistant L. monocytogenes and P. fluorescens.
Inspection of the plots of raw data (logro (N/N0) versus exposure time) of Figures 4.4 and
4.5, reveals that survivor data cannot be regarded as first-order as implied in equations 2.4
and 2.6. Davey, Hall and Thomas (1995) demonstrated this for the bacterium E. coli.
Figure 4.4 shows concave-up tails in the survivor curve for P. fluorescens. Figure 4.5
shows concave-down tail deviations and concave-up tails for L. monocytogenes. Some
curves in these figures however appear not to cover a wide enough range to give definitive
information about the shape of the survival curve. This is especially true for the survival
data obtained at lower temperatures - where reductions are small compared with those
obtained at higher temperatures. Nevertheless the survival data taken for all log-reductions
at both the higher temperature - where reductions are greater - and lower temperatures at
various T-pH oombinations clearly do not conform to classical first-order kinetics. The
assumption of log-linear (ie first order) inactivation kinetics is not valid therefore for these
three bacteria.
34

For all three data sets therefore, the survivor curves deviate significantly from first-order, ie
log-linear kinetics. This finding taken together with that from Cole et al (1993) for the
bacterium L. monocytogenes - the only other published data for the combined effect of both
exposure temperature and liquid pH on thermal survivor kinetics - demonstrates the need
for a re-assessment of the assumptions of the kinetics of thermal inactivation as was
outlined by Davey, Hall and Thomas (1995).
In this circumstance the use of the decimal reduction time D, or k, the rate of coefficient of
thermal inactivation, are not appropriate (unless restricted to demonstrated linear sections
of the survivor curve) because of a non-systematic deviation in predictions from
experimental values. However, the overall mean value of decimal reduction time shown in
Tables 4.3,4.4 and 4.5, can be used to rank the three bacteria in order of thermal resistance
ie P. fluorescens (D."on = 267 .18 s) is more thermally resistant than E. coli (D*"on = 18.6 s)
and less thermally resistant than L. monocytogenes (D^"on = 490.5 s)'
It is of interest to note that for L. monocytogenes these D values are significantly lower at
the higher temperatures studied than those reported in the literature. For example, Farber et
al (1989) studied the heat resistance of a mixture of 10 different strains of
L. monocytogenes inoculated into ground meat and ground meat plus cure. They reported
that D values for ground meat ranged from 1.01 min at 62oC to 13.18 min at 56oC.
Comparative values from our study (at pH 5.0 to pH 6.0) are similar at the lower
temperature of 56oC (12.82 min,769.2 s Table 4.4, cf 13.18 min) but appreciably lower at
the higher temperature (21.3 s cf 60.6 s). That is, at the higher temperature the published D
value is about three times greater than obtained in the present study with
L. monocytogenes.
Ben-Embarek and Huss (1993) reported a study of the heat resistance of two strains of
L. monocytogenes in sous-vide cooked fillets of cod and salmon. D values at 60oC ranged
between 1.95 min and 4.48 min - depending on the strain and fish type (cod or salmon).
Both strains were one-four times more heat-resistant in salmon than in cod. Differences in
35
D value were attributed to a higher fat content in salmon as compared to cod. These values
are about 3.7 to 8.5 times greater than values shown in Table 4.4 for L. monocytogenes.
Using the graphical data of Aiba, Humphrey and Millis (1973) for E. coli - ptesented as k
versus T - it is possible to show from equation (2.6) that the D value at 60oC is 16.25 s.
This compares with about 3.8 s shown in the data of Table 4.5. Therefore the published D
value of Aiba, Humphrey and Millis (1913) appears to be about four times than reported
earlier (Davey, Hall and Thomas 1995). These differences might be attributed to the
behaviour of the suspending canier medium in the strains used in the different studies.
l,emaire, Cerf and Audurier (1989) report "a significant difference in thermal resistance
among strains" of L. monocytogenes. This appears certainly the case with the effect of the
fat content of the two fish species of Ben-Embarek and Huss (1993). The Carbopol carrier
medium used in the present study appears less protective than the sausage and fish meats of
Farber et al (1989) and Ben-Embarek and Huss (1993). It is noteworthy in this context
however that for E. coli the D values obtained in the present study are in very good
agreement with those reported by Davey (1980) and Davey and Wood (1984) who used
identical strains and carrier fluids. At 60"C for example, respectively, D values are 3.8 s
and 4.3 s. Because the mechanism of inactivation of the cell is likely to be a concert of
complex interactions involving mechanisms for protein repair and unfolding as well as
molecular systems designed to help, the bacterial cell survive under conditions different
from the optimum. It is therefore unlikely that one mechanism of inactivation prevails.
There are significant implications for non-logarithmic survival for food processing. These
uncertainties mitigate against long term optimisation. Formulation of nonlinear models is
therefore seen as necessary for accurate prediction and process control of thermal
sterilisations. It would appear that, as a first step to formúlation, the rate coefficient for
thermal inactivation might be regarded as time-dependent'
This study's findings have a direct application to minimally processed foods, including
fruit juices, milk and purees where over-treatment will result in lower product quality
36

I
2
because of concomitant denaturation of nutrient, such as vitamin, and caramelisation of
sugars with consequent fouling of heat exchange surfaces.
4.5 CONCLUSIONS
The effect of pH on the rate coefficient for thermal inactivation is significant for all
three bacteria, especially at the lower exposure temperatures.
The survivor curve for all three bacteria showed tailing. Concave-up tails appeared
for P. fluorescens and E. coli and, concave-down for L. monocytogenes. The
assumption of log-linear (ie first-order) inactivation kinetics is therefore not valid
over the entire curve for these three bacteria. Consequently, widely used D values
and ft values, calculated using the log-linear model, are therefore not appropriate for
these data, unless used judiciously in demonstrated linear sections of the survivor
data.
Formulation of a model for non-linear survivor data should be undertaken and
demonstrated. This might involve a model form with a time-dependent rate of
inactivation.
In the following chapter, the bench-scale data for the effect of combined T-pH on thermal
inactivation of the three test micro-organisms in the test liquid, together with the published
data of Davey and'Wood (1984) that were obtained in continuous steriliser (but with the
effect of T only), are analysed for an appropriate non-liner model form for thermal
inactivation kinetics.
3
37

Table 4.1 Sample raw data for P. fluorescens: lo9¡6 (N / Nù (mean of two
replicates) at a mid-range value of exposure temperature of 56'C and a
range of exposure times and PH
log (N / No)Exposuretime
(s) pH 5.0 pH 5.4 pH 6.0 PH 6.5
15
30456090r20180
240300
-0.116-0.220-0.221-0.453-0.431-0.511-0.921-2.t41-5.3r7
-0.t92-0.202-0.209-0.230-0.333-0.203-0.435-1.870-4.921
-0.141-0.r74-0.210-0.217-0.300-0.413-0.695-t.577-2.889
-0.o14-0.096-0.150-0.158-0.289-0.516-1.300-t.203-t.426
Table 4.2 Sample raw data for L. monocytogenes: logrc (N / N0) (mean of two
replicates) at a mid-range value of exposure temperature of 58oC and a
range of exposure times and PH
Exposuretime(s)
tog (N / No)
pH 4.0 pH 4.5 pII5.0 pH 5.5 pH 6.0 pH 6.5 pH 7.0 pH 7.5
10
203060t20180240
-0.630-0.714-0.691-1.400-4.O53-5.727-6.427
-0.613-0.686-1.432-1.158-2.r56-3.531-5.501
-0.030-0.060-0.158-0.207-0.577-2.089-4.326
-0.103-0.136-0.339-0.433-0.619-2.022-2.617
-0.106-0.099-0.168-0.107-0.305-0.430-1.464
-0.028-0.087-0.079-0.141-o.2t9-0.831-0.618
-0.040-0.142-0.178-0.335-0.698-r.329-t.794
-0.045-0.214-0.405-0.566-0.821-1.159-2.172
38

Table 4.3 Decimal Reduction Time for P. fluorescens (expressed in second) as
affected by combined exposure temperature and liquid pH
T("c)
DG)
pH 5.0 pH 5.4 pH 6.0 pH 6.5
D MeanG)
5254565860
454.5370.483.3
52.6
3t.3
500.0434.8100.066.7
40.0
55s.5400.0r42.945.5
32.3
1190.5526.3
200.077.040.0
675.t432.9l3 1.6
60.535.9
Table 4.4
D Mean 198.4 228.3 2.35.2 406.8 267.2
Decimal Reduction Time for L. monocytogenes (expressed in second) as
affected by combined exposure temperature and liquid pH
T("c)
D(s)
pH6.5
pH6.0
pH5.5
pH4.5
pH4.0
D MeanG)
PII5.0
pH7.0
pH7.5
525456586062
214.t58.332.234.218.010.1
47r.779.959.547.233.218.8
900.0t27.9357.173.551.829.5
826.4167.5
92.098.039.523.1
1960.6613.5769.2227.331.519.5
2381.0294.1344.8434.864.5
2r.3
r410.6t123.6294.1
138.9
95.218.1
8333.3666.7185.1
126.644.8
18.2
2069.839t.4266.8r47.647.319.8
D Mean 61.2 118.4 256.8 207 .8 603.6 590.1 523.4 1562.5 490.46
39

Table 4.5 Decimal Reduction Time for E. coli (expressed in second) as affected by
combined exposure temperature and liquid pH
T("c)
D(s)
pH6.5
pH6.0
pH5.5
pH5.0
pH4.0
D Mean(s)
pH4.5
pH7.0
pH7.5
5456586062
t9.612.3
4.23.1
2.0
31.013.3
5.63.82.O
43.3
15.2
6.03.02.0
71.4t8.26.83.72.0
93.120.26.73.82.0
t32.3t9.65.73.32.0
83.511.l6.1
3.62.0
49.1
t3.25.03.1
2.1
65.516.1
5.83.42.0
D Mean 8.2 11.1 13.9 20.4 25.3 32.6 22.5 14.5 L8.6
40
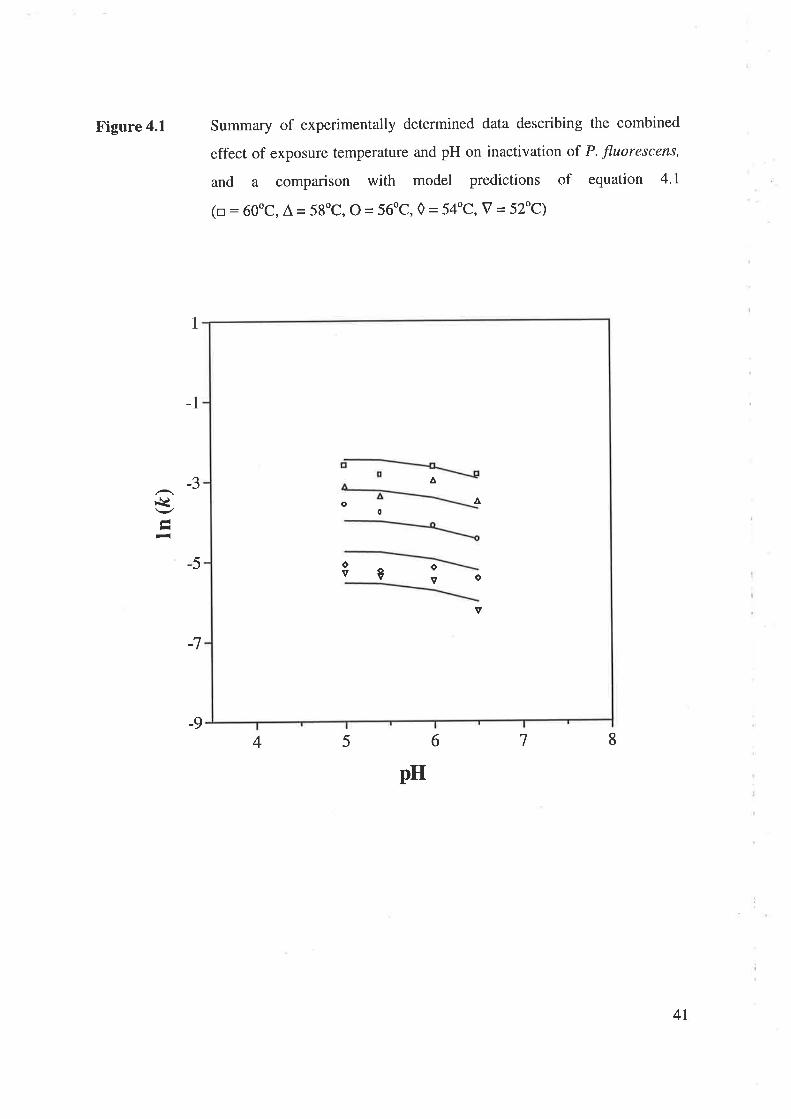
Figure 4.1 Summary of experimentally determined data describing the combined
effect of exposure temperature and pH on inactivation of P. fluorescens,
and a comparison with model predictions of equation 4.1
(o : 60oc, Â= 58oC, O= 56oC, 0 = 54oC, Y = 52"C)
1
-3
-1
5
-7
*¿
H
-
-98754
pH
6
ov o
v
A
Ào0
s o
v
4l

Figure 4.2 Summary of experimentally determined data desciibing the combined
effect of exposure temperature and pH on inactivation of
L. monocytogenes, and a comparison with model predictions of equation
4.2(l=62oC, o:60oc, À = 58oc, o= 56oc,0 = 54oC, v = 52"C)
1
1
*¿
¡r-
3
5
-7
-94 875
pH
6
I
E
trs o
tro
trÂ
o ov
o
vv o
v I
v
42

Figure 4.3 Summary of experimentally determined data describing the combined
effect of exposure temperature and pH on inactivation of E. colí, and a
comparison with model predictions of equation 4.3 (from Davey, Hall
and Thomas 1995) (l= 62oC,tr : 60oC, Â = 58oC, O = 56oC, 0 = 54"C)
1
-3
-1
-5
:7
'¡fÅ--
-98754
pH
6
trA
tr
ÂAÂ AAA
0o o ooo
oo 0o
o
tr
A
43

Figure 4.4 Selected plots of lo9¡6 (N/No) versus exposure time for P. Jluorescens at
an exposure temperature of 56oC and four values of medium-range pH
compared with log-linear predictions (0 = pH 5.0, tr : pH 5.4,
 = pH 6.0, O = pH 6.5)
50 100 150 200 250 300 350
k3â0o-
0
Time (s)
44

Figure 4.5 Selected plots of logr0 (N / N0) versus exposure time for
L. monocytogenes at four different exposure temperatures and medium-
range values of pH compared with log-linear predictions
(Q = 62oCpH 5.0, o : 60oC pH7.5,A = 58oC pH 5.5, O = 56oC pH a.5)
0 50 100 150 200 250
Tlme (s)
0
kk-6ä0o-
-3
-9
-t2
45

FIVECHAPTER
SYNTHESIS AND VALIDATION OF T\ryO NON.LINEAR THERMAL
INACTIVATION KINETIC MODELS
The results presented in this chapter have been published as:
Chiruta, J., Davey, K. R. and Thomas, C. J. (1999) A new non-linear kinetic model for survival of bacteria in
liquid as affected by combined temperature - pH in continuous sterilisation, Transactions of the Institution ofChemical Engineers, Pait C, Bioproducts and Food Processing (submitted)
Davey, K. R., Thomas, C. J. and Chiruta, J. (1998a) Mathematical evaluation and design for a new time-
dependent thermal inactivation of bacteria in liquid as influenced by combined temperature and pH, l4th
Australasian Biotechnology Conference, 19-23 Aprll, Adelaide, Australia (in press)
Davey, K. R., Thomas, C. J. and Chiruta, J. (1998b) A new non-linear kinetic model for design of thermal
inactivation of bacteria in liquid as effected by combined temperature and pH in a continuous steriliser, 2ólå
Australasian Chemical Engineering Conference, CHEMECA '98, 28-30 September, Port Douglas,
Queensland, Australia, Paper 68 (ISBN I 85825 683 5)
Chiruta, J., Davey, K. R. and Thomas, C. J. (1997a) Combined effect of temperature and pH on microbial
death in continuous sterilisation of liquids, 7th Internstional Congress on Engineering and Food, Aprll,
Brighton, UK,A.109-4112 (ISBN 85075 814 X)
Chiruta, J., Davey, K. R. and Thomas, C. J. (1997b) Thermal inactivation kinetics of three vegetative bacteria
as influenced by combined temperature and pH in a liquid medium, Trqnsactions of the Institution ofChemical Engineers, Part C, Bioproducts and Food Processing,TS: 174-l8O
Chiruta, J., Davey, K. R. and Thomas, C. J. (1997c) An ¿th order reaction model for thermal inactivation of
Listeria monocytogenes in liquid with combined temperature and pH, Proceedings of the 3rd International
Conference on Modelling and Simulqtion, October 29 - 31, Victoria University of Technology, Melbourne,
Australia, 343-346 (ISBN 1 86 272 4903)
Chiruta, J., Davey, K. R. and Thomas, C. J. (1996a) Modelling the combined effect of temperature and pH on
continuous thermal sterilisation of liquids, The 2nd Intemqtional Conference of Predictive Microbiology,
February 18 - 22, Hobart, Australia, Paper 6
Chiruta, J., Davey, K. R. and Thomas, C. J. (1996b) Modelling the combined effect of process temperature
and pH in continuous sterilisation of liquids, 24th Austrølian and New Zealsnd Chemical Engineering
Conjerence, CHEMECA'96, September 30 -October 2, Sydney, Australia, 3: 129-L34 (ISBN 0 85825 658 4)
46

5.1 INTRODUCTION
In this chapter the synthesis of an appropriate non-linear model form for the thermal
inactivation kinetics of bacteria is undertaken. The bench-scale T-pH data presented in
Chapters 3 and 4 for the three test micro-organisms in the test liquid, namely
P. fluorescens, L. monocytogenes and E. coli, together with the published data of Davey
and'Wood (1984) that were obtained in continuous steriliser (but with the effect of T only),
are used.
The log-linear kinetic equation for thermal inactivation is employed as a convenient
starting point in synthesis, and a number of selected alternative models are synthesised for
predicting the effect of combined Z-pH on bacterial inactivation kinetics.
The aim is to determine an adequate but significant non-linear kinetic model form, and the
appropriate values of the coefficients of the model that can be reliably used to size a pilot
continuous steriliser for later experimental validation.
Two new models are selected for validation tests on the survival data. The first of these is
titled /¿OE (nth order reaction model). The alternative, titled CDT, is selected for
experimental testing in a pilot continuous steriliser.
A key conclusion of this chapter is that the thermal inactivation of bacteria does not follow
the generally applied log-linear (ie first-order) model and that the rate coefficient of
thermal inactivation is time dependent. This finding represents an important change in the
direction of development of models for thermal sterilisation.
The following chapter, Chapter 6, describes the sizing and experimental testing carried out
in a pilot continuous steriliser and presents a comparison between the experimental results
and the predictions of the selected CDT model for thermal inactivation kinetics with
combined process T-pH. The kinetics of thermal inactivation in this flow (dynaruic) system
is compared with those from the bench-scale (static) studies.
47

5.2 VALIDATION TESTS FOR MATHEMATICAL MODELS
The criteria established for an adequate model is given in Chapter 3.5. A particular
criterion is that the model should be of a form that can be easily used.
The practical understanding of this criterion is that the model form for thermal inactivation
kinetics must be readily integrated with those equations describing the rheology and
hydrodynamics of flow ie the performance equations for the sterilisation unit operation that
appear in section 2.3.2.
The fit of mathematical models to experimental data is determined from linear regression
analyses (Snedecor and Cochran 1969).
A widely used test of goodness of fit of kinetic models in the literature is the per cent
variance accounted for, %oV (Snedecor and Cochran 1969). This is a measure of the
difference between the observed and the predicted value and is given by:
VoV = tl - (1 - /) (nr- l) I (nr-Nr- 1)l x 100 (5.1)
The 7oV is considered a stringent test of goodness of fit when there are few data, or, a large
number of terms in the model, and in which case the multiple regression coefficient (r2)
gives the appearance of a better than actual fit (see Davey and Cerf 1996).
From equation 5.1 it can be seen that as the number of terms increases (N), the VoV
decreases and at n7 )) Ny, ToV approximates ,'. As a result, a high value fot f does not
show a necessary good fit of an actual model but VoV uiterion helps to do so.
An alternative measure of goodness of fit that is also widely used is given the Mean Square
Error (MSE) (Snedecor and cochran 1969). The MSE is defines as:
MSE = X (observed - predicted)2 I nr (s.2)
48

An additional important test in model validation is the analyses of any systematic features
in the plots of residuals (Weisberg 1985) where:
Residual Value = Observed Value - Predicted Value (s.3)
Plots of observed value versus predicted value and plots of predicted value versus residual
value are extremely useful in diagnosing and highlighting the effectiveness of inherent
assumptions in models.
Together, all four tests for valiCrtion outlined above are demonstrably comprehensive and
are used in the following sections in assessing the two new model forms for non-linear
thermal inactivation kinetics as effected by combined T-pH. The first of these models is the
r¿th order inactivation model (nOE).
5.3 AN Nth ORDER INACTIVATION MODEL FOR
THE THERMAL INACTIVATION OF LISTERIA
MONOCYTOGENES IN LIQUID WITH COMBINED ?-pH
Because of the widely used assumption of first-order reaction (n = l) kinetics for thermal
inactivation of bacteria, the significance of the implied order of has not been fully
investigated.
In this section a non-linear, empirical nth order rate equation (nOE) is investigated as a
possible alternative model form to describe accurately thermal inactivation of kinetics of
bacteria as influenced by T-pH.The thermal inactivation data for the vegetative pathogen
L. monocytogenes are used for model validation tests. The implications of r¿OE for process
sterilisations with liquids are briefly discussed.
49

5.3.1 Synthesis
Assuming the thermal inactivation of bacteria follows a law of general irreversible reaction
of dissociation - where the mechanism of reaction is not known - the change in number of
viable bacterial cells is given by an empirical rate equation of n'h order (Aiba and Toda
!967,I-evenspiel 1912), that can be written as:
dN,ldt=-kNtn+et
where e¡is aresidual error. The model assumes that et is a statistically independent error at
each time point and distributed as normal with zero mean and et - N (0, ot)'
Separation and integration of equation 5.4 yields for all values except n = 1 (Aiba and Toda
1967, Aris 1969):
N,t-n -N¡l-n = (n - l) k t + e, (s.s)
(s.4)
(s.7)
of
N= No [1 + kNo'- l @ - D tf -t t(n't) + e, (s.6)
The rate coefficient for thermal inactivation, as affected by combined T-pH, can be defined
in terms of a reduced linear-Arrhenius model (Cole et al 1993, Davey, Hall and Thomas
lggs,Daughtry etal1997) such that:
ln (k) = Co+ Ct lT + CzPH+ eG)
where T is in degree absolute.
Taking logarithms of both sides of equation 5'4 yields
50
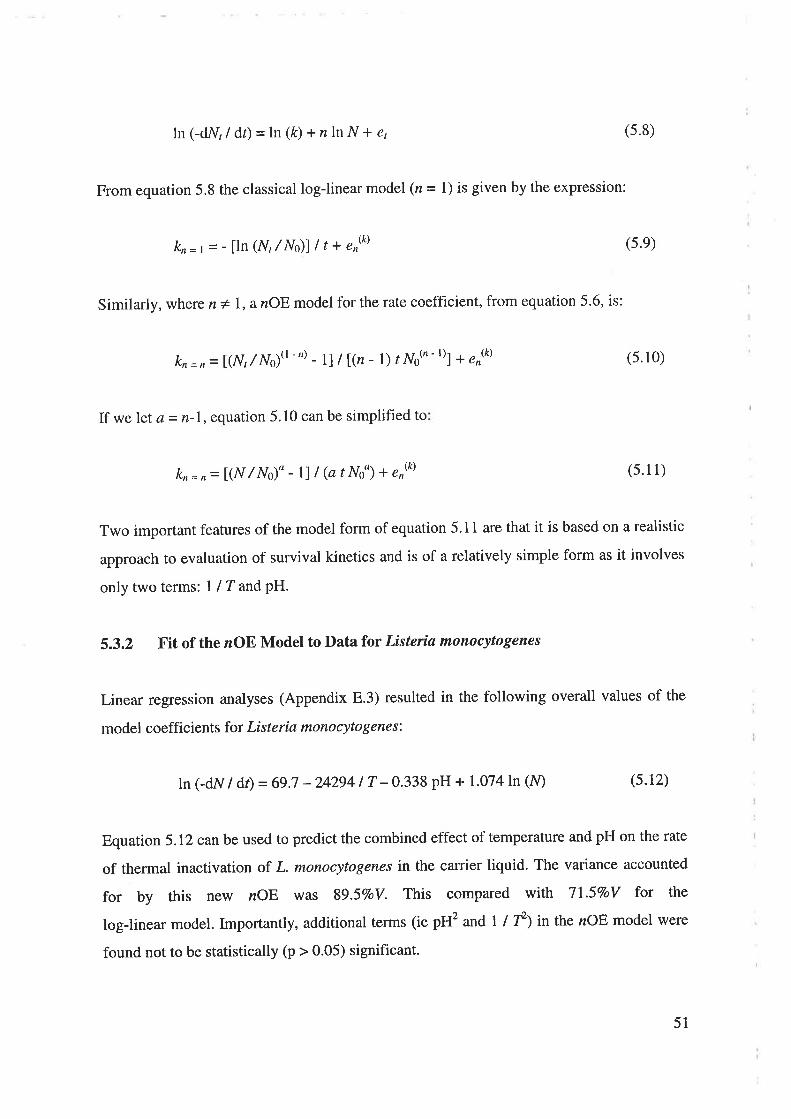
ln (-dNr I dt) = ln (k) + nln N + et
From equation 5.8 the classical log-linear model (n = I) is given by the expression:
k,= 1 =- tln (N, / Nùl I t + en&)
Similarly, where n* l, anOBmodel for the rate coefficient, from equation 5.6, is:
kn = n = t(N, /N0)(' - n) - 1l / l@ - I ) r No(' - t)1 ¡ sn&)
(s.8)
(s.e)
(s.10)
(s.r2)
If we let a = n-1, equation 5.10 can be simplified to
kn=,= l(N / Nù" - ll I (a t No\ * enk) (s.1 1)
Two important features of the model form of equation 5.1 I are that it is based on a realistic
approach to evaluation of survival kinetics and is of a relatively simple form as it involves
only two terms: I lT andPH.
5.3.2 Fit of the n oE Model to Data for Listeria monocytogenes
Linear regression analyses (Appendix E.3) resulted in the following overall values of the
model coefficient s for Listeria monocyto genesi
ln (-dN/ dt) = 69.7 -242941 T -0338 pH + 1.074 ln (Ð
Equation 5.12 canbe used to predict the combined effect of temperature and pH on the rate
of thermal inactivation of L. monocytogenes in the carrier liquid. The variance accounted
for by this new nOF' was 89.5VoV. This compared with 7l.5VoV for the
log-linear model. Importantly, additional terms (ie pH2 and I I f¡ in the nOE model were
found not to be statistically (p > 0.05) significant.
51
5.3.3 Discussion
Table 5.1 presents a comparison of the average values of r for the nOE model on a range of
pH at each of the five temperatures. The value of nor.ror" varies between 1.08 and 2.26. The
range of values for n in Table 5.1 suggests that n might be both temperature and pH
dependent - with Z being more significant than pH. Table 5.2 presents a comparison
between experimentally observed reductions at 58oC and pH 5.0 against predictions from
both the log-linear and nOE models. Calculations from the models show that the nOE
model gives a better fit to the observed survival levels of L. monocytogenes.
The value of MSE of 0.56 for nOE model (compared with that of 1.74 for log-linear)
further suggests that the log-linear form is inappropriate for these experimental data. Other
predictions in addition to those of Table 5.2 can be generated for a range of Z and pH
values eg at 56"C-pH 7.0 MSE values are 0.80 and 1.68 for, respectively, nOE and
log-linear models. (A comparison of the observed data with predictions from the log-linear
model is shown, for L. monocytogenes, in Figure 4.5 of Chapter 4).
5.3.4 Concluding Remarks and Rejection of the nOE Model
The nOE model is a better predictor for the time necessary for sterilisation of
L. monocytogenes than the log-linear model. It permits a practical procedure for the
evaluation of the microbiological safety of liquid foods processed at mild thermal
conditions and pH, and highlights the evidence of non-linearity of survivors. Further work
with additional survival data is necessary to determine whether the nOE model form is
applicable to pathogens universally.
Although the nOE model does give a better fit to the experimental data for
L. monocytogenes than does the log-linear model form, it is seen that a draw back is that it
is not readily integrated with the performance equations for the sterilisation unit operation.
For this reason synthesis of an alternative non-linear model was investigated (Chapter 5.4).
52

Table 5.1 Values of n and r for the fit of the nOE (n + l) model for
L. monocytogenes at each of five temperatures
Tcc)
n llave"age faverage
pH4.0 4.5 5.0 5.5 6.0 6.5 7.0 7.5
54
56
58
60
62
1.16
0.98
r.25
0.93
1.18
l.l22.23
1.56
1.29
r.20
0.92
0.93
r.24
0.55
1.78
0.99
1.04
t.o4
2.13
t.49
1.29
1.38
t.40
3.00
0.88
0.86
1.15
7.14
2.Ol
1.03
1.07
r.t4
2.31
2.53
t.2r
0.99
1.r4
2.26
1.83
1.08
r.2l
1.24
0.72
0.88
0.86
0.95
0.96
1.11
fiaver¡Ee 1.13 I.4O l.l2 1.08 I.l2 1.46 2.60 1163 1.52 0.88
Table 5.2 Comparison between experimentally observed reductions at Z = 58oC and
pH 5.0 with predictions from both the log-linear and noE models
(No=3.27 x 10⁸ number ml-r¡
ú (s) ln (- dN/ df)
58"C / pH 5.0 observed predicted
log-linear nOE
10
20
30
60
120
180
t6.t9
16.03
t4.20
14.99
14.67
tt.20
16.19
15.87
15.27
13.94
12.03
10.11
T6.31
16.Qe
15.86
15.73
t4.82
tt.o7
MSE r.74 0.56
53
5.4 SYNTHESIS OF A NEW CDT MODEL FOR THERMAL
INACTIVATION OF LIQUID WITH COMBINED T.PH
5.4.L Introduction
The synthesis of a new, empirical and non-linear model for predicting bacterial survival
kinetics as influenced by combined process ?-pH is presented. Synthesis is based both on
published continuous steriliser data of Davey and 'Wood (1984) fot T only effect and the
batch bench-scale data described in Chapter 3 for three vegetative bacteria as affected by
combined T-pH.
Synthesis of the new CDT model form is evolved from testing of selected models in a
logical progression. The starting point was the classical log-linear model. Other models
included that of Han, Zhang and Krocht a (1976) (HZK) and a proposed exponential model
(EXP) (Table 5.3).
The rate coefficient for thermal inactivation is shown to be time dependent. Predictions of
the new CDT model are contrasted with those of the selected models. Extensive analysis of
resicluals is used together with VoV as criteria of the goodness of fit for comparison and
validation of models.
5.4.2 Synthesis
The first-order, log-linear model (equation 2.4) for thermal inactivation can, on integration,
be written as:
ln (N/ ÀIo) = -k r (5. r 3)
54

Temperature Effect
The effect of temperature (Ð only on the rate coefficient for thermal inactivation (k) can be
predicted from either of two model forms.
1. The more widely used of these is the empirical Arrhenius, or, more aptly titled linear-
Arrhenius model (Davey 1993a, Holdsworth l99Z,Davey, Hall and Thomas 1995) where:
lnk=Co+Ct/T (s.14)
The Arrhenius equation 5.14 can be written in the more familiar form, using activation
energy:
k= A exp Í-E / (RT)l (s.15)
2. A general form of the temperature dependence of k was developed by Eyring
(Daughtry, Davey and King 1991) and is given by:
k=AT expl-E/(RT)I
Equation 5.16 can be expressed more generally as:
lnk= Co+Ct/T+Czln(7')
For n = -1 equation 5.17 becomes:
ln fr = Co + Ct I T + Czln (I I T)
(s.16)
(s.17)
(s.18)
55
Combined Temperature-PH Effect
The effect of combined l-pH on the rate coefficient for thermal inactivation has been
modelled by the Davey linear-Arrhenius equation (Davey, Lin and Wood 1978, Davey
1993b, Davey l994,Davey, Hall and Thomas 1995, McMeekin et al 1993), namely:
ln k= Co+ Ct I T + Ct I t' +C¡ pH + CapH2 (s.1e)
A generalised model form for two or more combined environmental factors was illustrated
by Cerf, Davey and Sadoudi (1996) for the combined effect of three environmental factors
using the extensi ve T-pH-a* data of Reichart (1994) for E. coli. The generalised model is
.t
given by: ln k = Co +\Qr¡-tF¡ t C,F,'). This model suggests that in addition toi=l
inactivation T, another environmental factors (Ð, pH, a*, etc, act in combination and affect
cell destruction.
New Model
An empirical non-linear equation of the following general form was selected from initial
study of the data to describe a time-dependent rate coefficient for the thermal inactivation
of bacteria in liquid:
y=r+o/(r) +Ç¿f(t)2 (5'20)
where
Y = ln [1 - log(N/ No)J (s.2r)
and it is assumed ro and Ç) can be modelled by the Davey linear-Arrhenius equation to give:
(ù=Co'tCl lT+Cz'lf (s.22)
l) = Co" t Cl' I T + C2" I f +C:" PH + Ca" PlH2 (s.23)
56
The function f (t) is characterised by the natural logarithm of sterilisation time:
f (t) =ln t (s.24)
From equations 5.20 through to 5.24 a time-dependent rate coefficient for thermal
inactivation of viable bacteria, k(t), can be expressed as:
k(t) = -2.3 ll - exp (e + crl ln (r) + dt (ln t)21 I t (s.2s)
The new model form of equation 5.25 is titled the CDT model.
Based on the above, four generalised model forms can be used to predict survival kinetics
(Table 5.3).
The reader should note that for computational convenience in fitting of these model forms,
temperature is expressed in degree Celsius throughout.
5.4.3 Validation of the CDT Model for the Effect of Temperature
The models presented in Table 5.3 can be re-written as stochastic equations as illustrated in
Table 5.4 for the effect of I only. The models described in Tables 5.3 and 5.4 arc
deterministic equations that imply a stochastic element (e¡) and therefore involve specific
assumptions, namely:
. on a logarithmic scale the errors are additive
o the "noise" components are independent at each time, /
o there is equal variance at each time point (ie o2 is not dependent on f).
The fitting of a non-linear model to experimental data necessitates sophisticated procedures
and, generally, such models have associated problems with inference (Daughtry et al 1997).
To obviate this, the fitting of models was carried out in a single process using linear
57
regression analyses where the patterns of inactivation rate, k, ate linear and dependent on I
(or combined T-PH).
A summary of the goodness of fit of each of the model forms to the data of Davey and
Wood (19S4) for the inactivation of E. coli in a continuous steriliser is given in Table 5.5.
As is seen from Table 5.5 the log-linear and CDT model forms appear to give a better fit to
these data than the ]HZK or EXP forms - with between 89.07o and 94.6Vo of the variance
accounted for (Vofi. The HZK model, however, has not previously been assessed for
thermal inactivation data obtained in a flow system such as a continuous steriliser'
Table 5.6 summarises and compares the predictions of the log-linear and new CDT model
against the experimental data of Davey and'Wood (1984) for the sterilisation of E' coli in a
continuous steriliser with the effect of z only over each of the four process temperatures
(53.5.C, 54.5"C,56oC and 59"C). The CDT model is seen to give a better fit at each data
point than the log-linear model. Table 5.7 presents a summary of the value of the Mean
Square Error (MSE) for both the log-linear model and new CDT model fit to these' The
new CDT model is seen to give a better fit than the log-linear model to these data
expressed as MSE'
The lfZK and EXP models were therefore rejected and the log-linear and CDT forms
examined further for predicting thermal inactivations with combined z-pH.
58
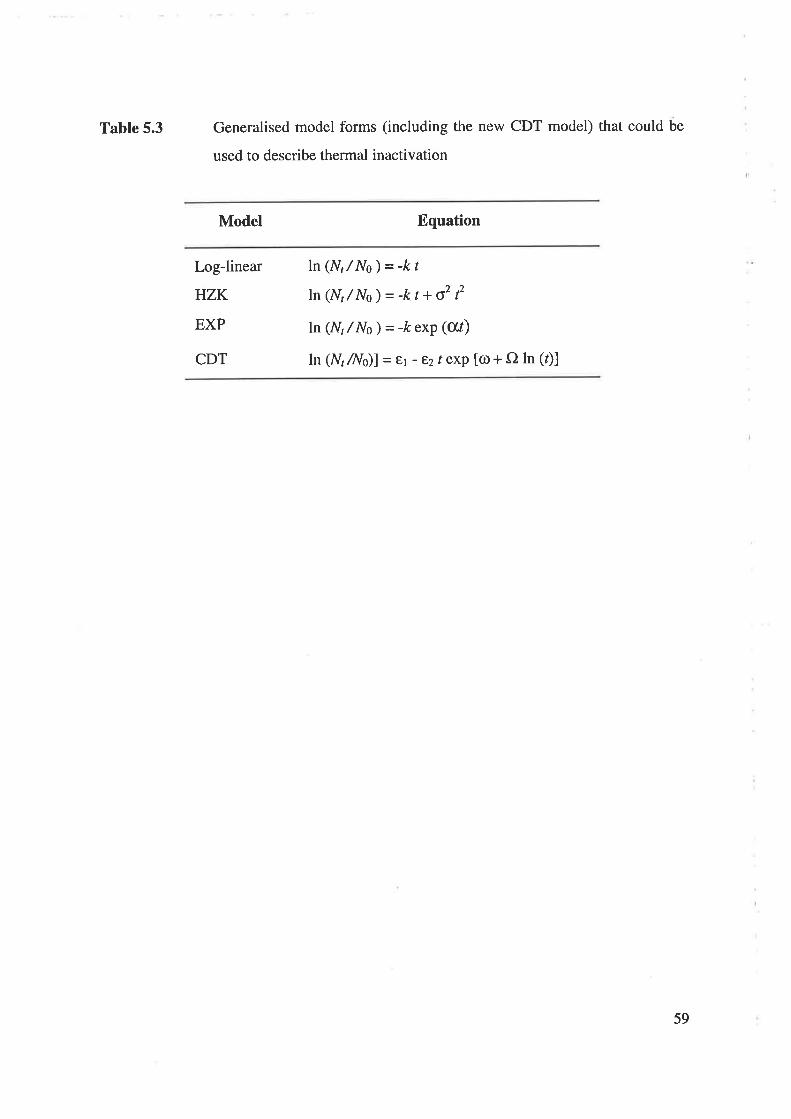
Table 5.3 Generalised model forms (including the new CDT model) that could be
used to describe thermal inactivation
Model Equation
Log-linear
HZK
EXP
CDT
ln (NrlNo ) = -k t
ln(¡/,/No)=-kt+o2í'
ln (NrlNo ) = -k exp (c[/)
ln (Nr /{o)l - €1 - E2 t exp [<o + O ln (r)]
59

Table 5.4 Model forms of thermal inactivation kinetics for temperature dependent
only data
Model Equation Critical coefficients
Log-linearl ln (Nt / No) = -k t + et
Log-linear2 ln (N, /No)=-kt + er
HZKI ln(N, /No)=-kt+o2f +et
ln(N, /No)=-kt+o'f +",
ln (N, / No) = -k eo' + ",
ln (N, / No) = -k eot + ,,
ln [l- log(N/No )] = orr *o.tlnt * et
ln [1-log (N/Ng)] = e * ú)2ln(Ð + [Qz(nr)2]
l€t
ln [lJog(N/No)] = e + o ln (Ð + tO (ln Ð21
lêt
HZK2
EXPl
EXP2
CDTI
CDT2
CDT
lnk=Co+CtlT
lnk= Cs+C1lT+Czln(1/Ð
lnk=Co+Ct/T
lno2 = Cs+ C1 I T + Czln (1/Ð
ln k= Co + Ct / T + Czln(llT)
lno2 = Cs+ C1lT + Czln(1/Ð
lnk=Co+Ct/T
ln c¡( = Co + Ct / T + Czln (1/T)
ln ft = Co + Ct I T + Czln (Il7)
ln cx, = Coi Ct I T + Czln (I/7)
(Ùr=Co+CtlT+C21t'
Or = constant
Tjz=co+ctlT+cz/fÈ, {22- constant
o=Co+CtlT+Czlt'C)=Co+CtlT+C2lf
60
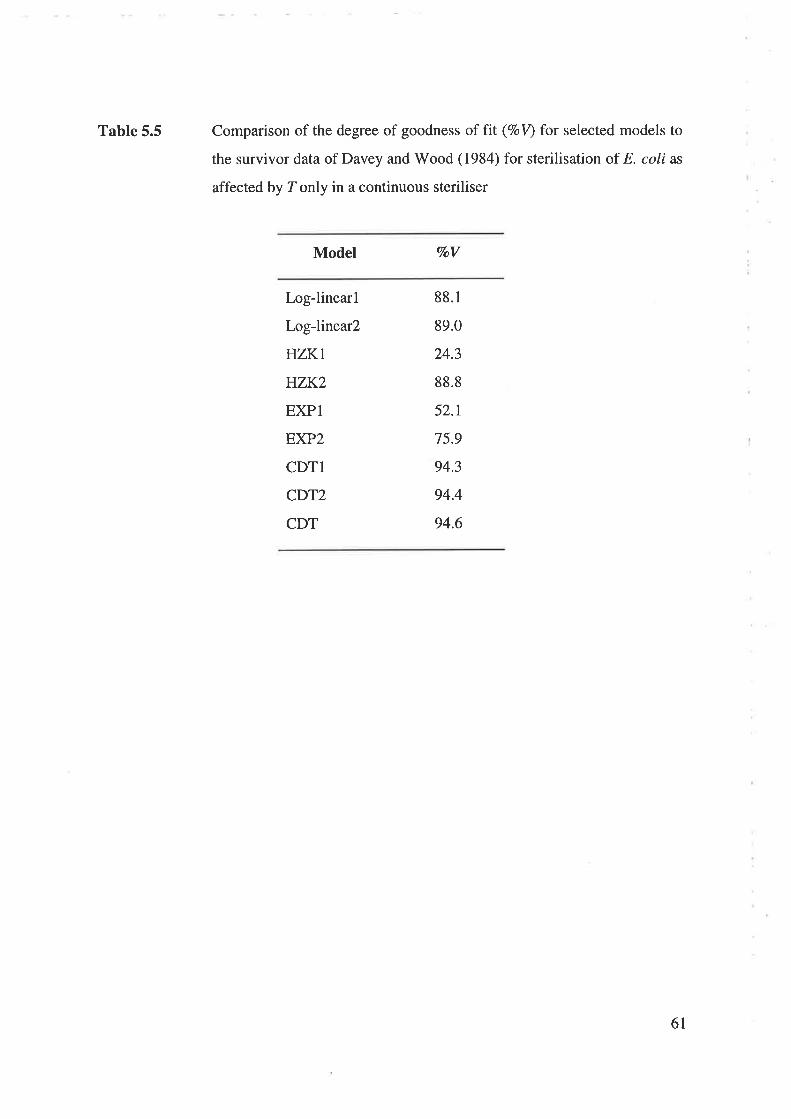
Table 5.5 Comparison of the degree of goodness of fit (%oV) for selected models to
the survivor data of Davey and Wood (1984) for sterilisation of E. coli as
affected by T only in a continuous steriliser
Model %oV
Log-linearl
Log-linear2
HZKI
HZK2
EXPl
EXP2
CDTl
CDT2
CDT
88.1
89.0
24.3
88.8
52.t
75.9
94.3
94.4
94.6
6l
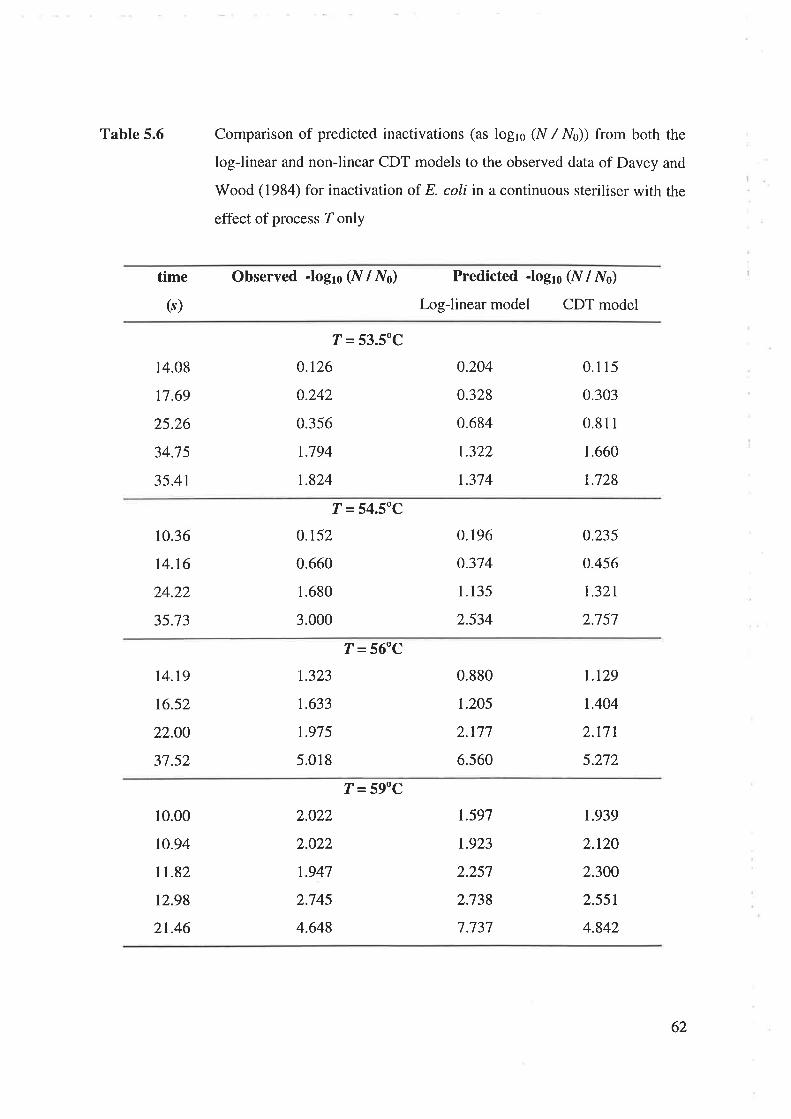
Table 5.6 Comparison of predicted inactivations (as log¡s (N / N0)) from both the
log-linear and non-linear CDT models to the observed data of Davey and
Wood (1984) for inactivation of E. coli in a continuous steriliser with the
effect ofprocess Zonly
time
(s)
Observed Jogto W/No) Predicted -logto (N/No)
Log-linear model CDT model
14.08
t7.69
25.26
34.75
35.41
T = 53.5oC
0.126
0.242
0.356
r.794
t.824
0.204
0.328
0.684
1.322
1.374
0.1 15
0.303
0.811
1.660
1.728
10.36
14.16
24.22
35.73
T = 54.5"C
0.r52
0.660
1.680
3.000
0.196
0.374
1.135
2.534
0.235
0.456
t.321
2.757
T = 56"C
14.r9
t6.52
22.O0
37.52
1.323
1.633
r.975
5.018
0.880
r.205
2.t77
6.560
1.129
1.404
2.t71
5.272
T= 59oC
10.00
10.94
T1,82
12.98
2r.46
2.022
2.022
r.947
2J45
4.648
1.597
t923
2.257
2.738
7.737
t.939
2.t20
2.300
2.551
4.842
62
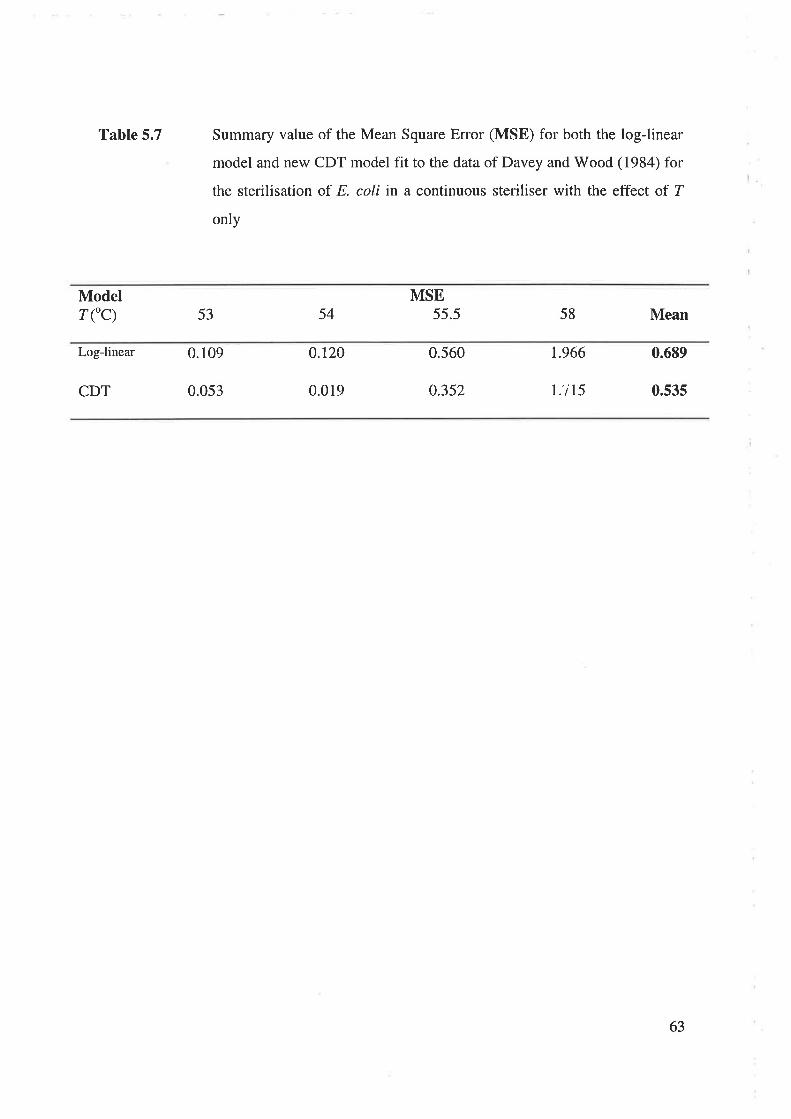
Table 5.7 Summary value of the Mean Square Error (MSE) for both the log-linear
model and new CDT model fit to the data of Davey and Wood (1984) for
the sterilisation of E. coli in a continuous steriliser with the effect of T
only
Modelr("c) 53 54
MSE)).5 58 Mean
Log-linear 0.109
CDT 0.053
0.120
0.019
0.560
0.352
1.966
l;¡15
0.689
0.535
63

5.4.4 Validation of the cDT Model for the Effect of combined T-pH
The selected models (log-linear, CDT1, CDT2 and CDT) were assessed against the three
sets of experimental data for the combined effect of temperature and pH on the survival of:
p. fluorescens, L. monocytogenes and E. coli described in Chapter 3. The resulting fits are
presented in Table 5.8 together with the overall mean VoV on the three data sets. The table
shows the CDT form gives a better fit to each of the three data sets. Also, it can be seen
that a greater overall mean value of VoV of 89.2Vo for the CDT model demonstrates a better
fit than that of the log-linear, CDTl and CDT2 forms, with respectively, 7J.}Vo,'73'3Vo and
8O.OVoV.
Table 5.9 presents a summary comparison of the degree of goodness of fit of the selected
model forms to survivor data of all three sets of bacteria at a mid-range value of T = 58'C.
Table 5.10 compares the goodness of fit between the two models using the statistical
parameter Mean Square Error (MSE) over a range of four values of pH.
Table5.1I providesasummaryof thevaluesobtainedforeachof thecoefficientsof the
newly derived CDT model for each of the three sets of inactivation data for combined
T-pH, respectively for, P. fluorescens, L. monocytogenes and E. coli. Substitution of the
values of the coefficients from Table 5.1 1 into the kinetic model for thermal inactivation
permits prediction of the numbers of surviving bacteria as effected by combined T-pH.
The model summarised in Table 5.11 can therefore be used together with the steriliser
performance equations to size a pilot continuous steriliser for the thermal inactivation of
the bacteria with the effect of combined T-pH.
plots of observed vah.re versus predicted value and plots of predicted value versus residual
value were important to the synthesis and appraisal of the CDT (and loglinear) model and
in diagnosing and highlighting the effectiveness of inherent assumptions in the model. A
summary of these analyses is presented below.
64
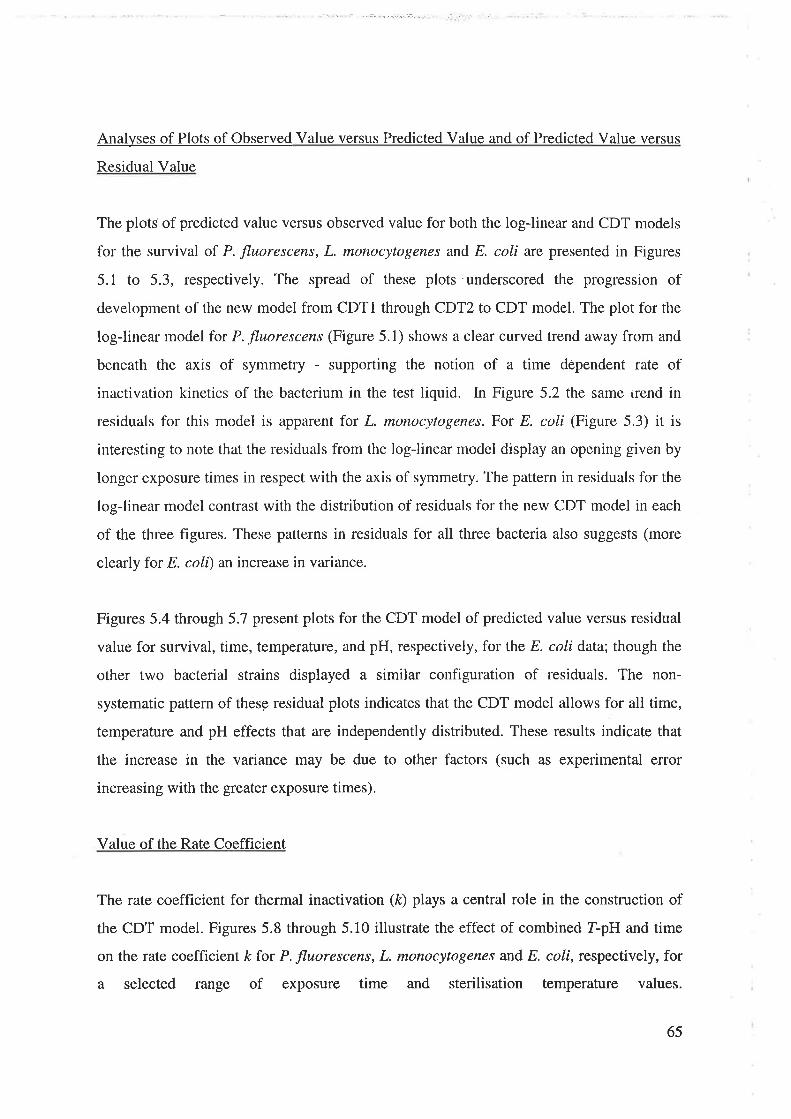
Analyses of Plots of Observed Value versus Predicted Value and of Predicted Value versus
Residual Value
The plots of predicted value versus observed value for both the log-linear and CDT models
for the survival of P. fluorescens, L. monocytogenes and E. coli are presented in Figures
5.1 to 5.3, respectively. The spread of these plots underscored the progression of
development of the new model from CDTI through CDTZ to CDT model. The plot for the
log-linear model for P. fluorescens (Figure 5.1) shows a clear curved trend away from and
beneath the axis of symmetry - supporting the notion of a time dependent rate of
inactivation kinetics of the bacterium in the test liquid. In Figure 5.2 the same rrend in
residuals for this model is apparent for L. monocytogenes. For E. coli (Figure 5.3) it is
interesting to note that the residuals from the log-linear model display an opening given by
longer exposure times in respect with the axis of symmetry. The pattern in residuals for the
log-linear model contrast with the distribution of residuals for the new CDT model in each
of the three figures. These patterns in residuals for all three bacteria also suggests (more
clearly for E. coli) an increase in variance.
Figures 5.4 through 5.7 present plots for the CDT model of predicted value versus residual
value for survival, time, temperature, and pH, respectively, for the E. coli data; though the
other two bacterial strains displayed a similar configuration of residuals. The non-
systematic pattern of these residual plots indicates that the CDT model allows for all time,
temperature and pH effects that are independently distributed. These results indicate that
the increase in the variance may be due to other factors (such as experimental error
increasing with the greater exposure times).
Value of the Rate Coefficient
The rate coefficient for thermal inactivation (k) plays a central role in the construction of
the CDT model. Figures 5.8 through 5.10 illustrate the effect of combined I-pH and time
on the rate coefficient fr for P. fluorescens, L. monocytogenes and E. coli, respectively, for
a selected range of exposure time and sterilisation temperature values.
65

Table 5.8 Summary comparison of degree of goodness of fit of selected model
forms to survivor data for P. fluorescens, L. monocytogenes and E. coli as
affected by combined process Z-pH in bench-scale (batch) experiments
Bacterium T-pH tt7 VoV
Log-linear CDT1 CDT? CDT
P. fluorescens
L. monocytogenes
E. coli
5x4 1,72 15.8 64.0 77.5 93.0
6x8 310 74.0 66.5 77.2 82.9
5r8 208 81.3 89.4 88.4 92.3
Mean VoV 77.0 73.3 80.0 89.2
66

Table 5.9 comparison of predicted inactivations (as logro (N / N0)) of the log-linear
and non-linear cDT models to the observed data for, respectivery,
P. fluorescens, L. monocytogenes and E. coli for combined r-pH effect at
a mid-range value of Z = 58oC
time
(s)
pH
Observed -logto (N/No)
5.0 5.5 6.0 6.5
Predicted -logro (N/No)
Log-linear model CDT model
5.0 5.5 6.0 6.5 5.0 5.5 6.0 6.5
P. fluorescens
45
15
30
0.267
0.35s
0.452
0.529
1.094
3.068
4.016
4.t485.625
o.240
o.222
0.438
0.5 r0
0.780
1.231
29244.386
4.060
0.103
0.1 36
0.321
o.416
0.615
2.020
2.592
0.201
0.300
0.442
0.517
0.532
2.674
4.317
6.1 13
6.317
0.106
0.099
0.168
0.106
0.302
0.430
1.463
0.088
0.1 87
0.343
0.418
0.833
0.842
t.824
3.3'r9
4.583
0.028
0.086
0.079
0.140
0.2r80.827
0.425
0.285
0.570
0.855
1.140
t.7 to2.280
3.420
4.560
5.700
0.225
0.450
0.675
0.900
1.350
1.800
2.100
3.600
4.500
0.330
0.660
0.990
1.320
1.980
2.640
3.960
5.280
6.600
0.1 95
0.390
0.58s
0.780
t.1701.560
2.340
3.120
3.900
1.203
1.528
0.1 30
0.231
0.324
0.576
LO24
0.212
0.296
0.479
0.694
t.175
1.709
2.915
4.300
5.867
0.t270.2tt0.393
0.608
t.0921.636
2.882
4.339
6.010
0.104
0.t740.340
0.538
0.986
1.486
2.627
3.952
5.464
0.t750.218
0.360
0.530
0.911
t.329
2.256
3.298
4.453
6090t20180240300
10
203060120180240
8
t6243240
-0.03
0.059
o.t52o.205
0.573
2.089
4.325
1.899
2.701
6.047
5.t145.4t5
0.1 87
0.32r0.470
0.904
t.715
2.494
3.263
o.r4t0.236
0.349
0.682
1.293
1.863
2.4r5
0.113
0.1 84
o.277
0.553
1.055
l 518
t.959
0.100
0.162
0.246
0.498
0.956
t,376
1.774
2.254
2.213
3.553
5.000
5.51 1
2.312
2.533
5.308
4.329
5.073
2.632
2.934
3.879
4.480
7.812
L. monocytogenes
3.920 2.491 1.433
0.507 0.280 1.820
0.901 0.498 0.377
1.262 0.698 0.443
2.244 1.240 0.788
3.988 2.205 1.401
5.584 3.087 t.962
E. coli
1.027
1.840
2.588
3.296'3.977
1.213
2.172
3.055
3.89r
4.694
1.069
1.915
2.693
3.430
4.1 38
t.076r.926
2.7lt3.453
4.166
2.254
3.406
4,174
4.756
5.226
2.156
3.172
3.816
4.286
4.653
2.138
3.130
3.752
4.202
4.552
2,118
3.083
3.682
4.1 11
4.441
67

Table 5.10 Comparison of the value of the Mean Square Error (MSE) for both the
log-linear and CDT models to the fit of the batch, bench-scale data for
P. fluorescens, L. monocytogenes and E. coli at a mid-range temperature
of 58oC and four pH values (5.0, 5.5, 6.0 and 6.5)
Micro-organism MSElos-linear / CDT
pH 5.0 5.5 6.0 6.5
P. fluorescens
L. monocytogenes
E. colí
0.423
5.093
2.344
0.277
4.437
0.978
0.314
1.301
T,3T7
0.181
1.224
1.004
0.802
1.257
2.360
1.436
0.904
0.962
0.334
0.781
3.830
0.122
0.954
0.874
68

Table 5.11 summary of values obtained for each of the coefficients of the newly
derived cDT model for each of the three sets of inactivation data forcombined T-pH, respectively for, p. fluorescens, L. monocytogenes and
E. coli
ln ll-log(N/No)l = e + al ln (r) + o (ln t)2
ú)=Co'+Cl /T+Cz'/fC2 = Co" I Cl' /T + Cz" lf + G" pH + Ca,, pH2
Coefficient P. fluorescens7oV=93.0nr=I72
L. monocytogenesVoV=82.9n =310
E. coliVoV=92.3nr=208
e
Co'
Ct'Cz'Co"Ct"Cz"C3"C4"
1.84
9.771.39 E34.36F4
L19-58.71
0x0.015
-0.0017
0.51
7.32-8.92822.58F.4
0.76-25.85
0-0.0700.0052
0.0567-6.49
t.39 E3-5.69E.4
-t.4499.40
0-0.1040.0086
x not significant if p > 0.05
69
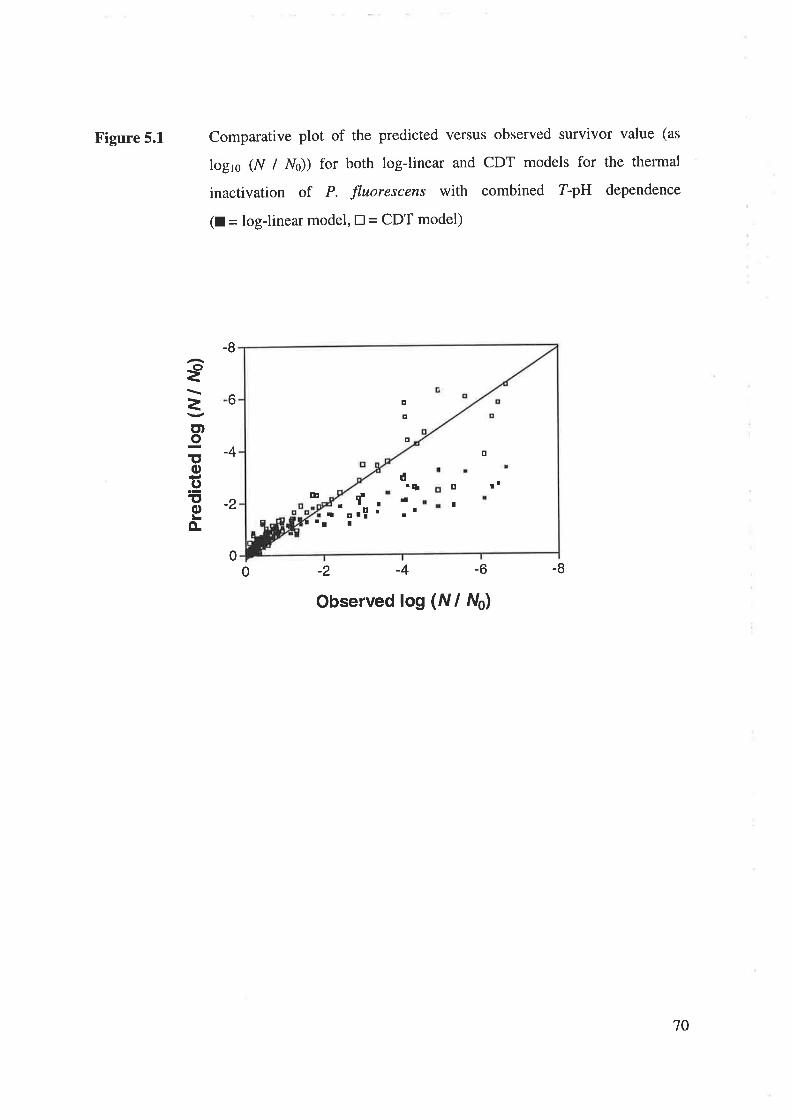
Figure 5.L Comparative plot of the predicted versus observed survivor value (as
logro (N / N0)) for both log-linear and CDT models for the thermal
inactivation of P. fluorescens with combined T-pH dependence
(l = log-linear model, tr = CDT model)
Observed log (w/ No)
€
=C')oItooõoLo.
-8
6
-4
-2
0-8-6-4-20
tb
E
E
E
rl
E
d
!
tr ¡
¡ìE
ür¡la
II
fr.E'
70
Figure 5.2 Comparative plot of the predicted versus observed survivor value (as
logro (N / N0)) for both log-linear and CDT models for the thermal
inactivation of L. monocytogenes with combined T-pH dependence
(l = log-linear model, ! = CDT model)
Observed log (N / tro)
-8
€¿-6ct)o;'4ooEôO-¿Lo.
0-8-6-4-20
E
f
E
¡E
.rE o
Þ
Uo
rjlll
I
tEIû
I
lË"!t -
a:4"ttg
7l

Figure 5.3 Comparative plot of the observed versus predicted survivor value (as
logro (N / N0)) for both loglinear and CDT models for thermal
inactivation of E. coli with combined T-pH dependence
(l = log-linear model, Ú = CDT model)
1 4
0
-6
-4
-2
€¿ct)of,o.9ttoLo-
-12
1
0 -2 -4 -6 -8 -10 -12 -14
Observed log (N/ No)
¿t
t
tII
I
IÞIaEI¡¡ r
72

Figure 5.4 Plot of residuals versus predicted survival for the CDT model for the
thermal inactivation of E. coli with combined T-pH dependence
Fitted values of surv¡vors
0.50
0.25
0.00
-0.25
-n5
L(úJpØoÉ,
¡
aI
I ttI
II
I
T
II
lt I
TaI
'¡
Ir!
frt
!t
II
t
+
rl r1ir' ¡l T. t
T
l.nf¡¡...TT
!a¡
II
73

Figure 5.5 Plot of residuals versus time for the CDT model for the thermal
inactivation of E. coli with combined T-pH dependence
Time
I(!¿prnoÉ
0.5
o.25
0.00
-o.2
-n 5n
IIr!l
I3b 6p
I
I
¡¡tl
I
I
I
II
II¡II
¡
I
ItII
II
I
I
II
lr!
I¡:T
IIrr
74

Figure 5.6 Plot of residuals versus temperature for the CDT model for thermal
inactivation of E. coli with combined T-pH dependence
Temperatu re
I(úJpU'oÉ
0.50
0.25
0.00
-0.25
-n 6n
52.5 55.0 0
I
6
T
¡
I T
III
TI
II
5 65.0 67.5
IIT
¡
I
IIT
57.5IIIIt
75

tr'igure 5.7 Plot of residuals versus pII for the CDT model for thermal inactivation of
E. coli with combined Z-pH dependence
pH
g)(E¿pØoÉ
0.50
0.25
0.00
-0.25
-o 5n
IItII
III
I
II¡r
¡II
I
I
I
II¡I
II
II
IT
¿tII
!!
I
III
I
76

Figure 5.8 Summary plot of the predicted value of the rate coefficient for thermal
inactivation versus time for P. fluorescens for combined T-pH effect
(n = pH 5.0, 0 = pH 5.5, A = PH 6.0, O = pH 6.5)
100 200 300
Time (s)
'(r)
tr.9+.(E
'.E()(E
,=
EELo.c+.
Lol|-+ttr.9o
btl-oooo+t(úÉ
o.12
0.08
0.0
0.00
600
5goc
560C
77

Figure 5.9 Summary plot of the predicted value of the rate coefficient for thermal
inactivation versus time for L. monocytogenes for combined T-pH effect
(f =pH 4.0,a =pH4.5, != pH 5.0,0 = pH 5.5, Â = PH 6.0, O = PH
6.5,l.=pH7.0,f=pH7.5)
0.08'oç.9+t(E
.=+t()G.=(E
ELo!+t
Lorl-+.tr.9oIF{-oooo+t(EÉ
0
0.00
60 120 180 240
Time (s)
600C
78

Figure 5.L0 Summary plot of the predicted value of the rate coefficient for thermal
inactivation versus time for E. coli for combined T-pH effect
(tr = pH 5.0,0 - pH 5.5, Â = PH 6.0, O = pH 6'5)
40 60
Time (s)
tÃl
b ':,
q-CH- .9-u.9 aú
.9 .>EËo,ioT3+.F(úEÉ.b
.C+.
2
1
0200
620c
5goc
540c
79

5.4.5 Discussion
The new CDT model clearly gives a very good fit to the data for combined effect of I-pH
for each of the three test bacterial strains with per cent variance accounted for (%oV)
ranging from 82.9Vo to 93.0Vo, and with an overall mean over the three of 89.4Vo
(Table 5.8).
The model is appropriate for the range of combined Z-pH for, respectively, P. fluorescens
(nr= ll2) 52"C < f < 60oC and 5.0 < pH < 6.5; L. monocytogenes (n7= 310) 52oC <T <
62oC and 4.0 < pH <7 -5, and; E' coli (n7= 208) 54"C < T < 62"C and 4.0 < pH <7 '5, and
for T only for E. coli (ny= 18) 53.5"C <T < 59.0"C (pH = 7.0).
It is clear that the data sets are sufficiently large (nr>> 30) and varied (ie three bacteria) as
to underscore a high level of confidence in the analyses and model synthesis despite the
CDT form involving eight coefficients (Table 5.11).
Although the CDT model gives a very good fit to each of the data sets, predictions should
be extrapolated with care.
Analysis of predictions of thermal inactivation with the effect of combined ?"-pH generated
using the log-linear and CDT models (Table 5.9) demonstrates that reliance on the classical
log-linear form would both over- and under-predict the reduction in numbers of viable
contaminants following exposure of a suspension in a liquid in a continuous steriliser. At a
mid-range temperature of 58'C and pH 5.0 and after 30 s residence (exposure) time the
reductions in viable cells (as logls (N / N0)) predicted by the log-linear model are: -0.570
for P. fluorescens, -0.901 for L. monocytogenes, and -3.891 for E. coli; compared with the
CDT model of -0.296, -0.470 and -4.756, respectively. The corresponding reductions in
viable cell number for the experimental data are: -0.355,
-0.I52, and -5.1 14, respectively. These figures imply significant over-treatment (37 .77o) for
both P. fluorescenr, and fot L. monocytogenes (83.lVo) and under-treatment for E. coli
(23.9Vo) of the liquid in using the logJinear model.
80

These results together (and other similar predictions with the models) clearly have
implications in the delivery of a safe product, without concomitant waste in energy and
damage to end-product quality (eg vitamin denaturation or denaturation of colour or
structure).
Analysis of the thermal inactivation data of Davey and Wood (1984) from studies in a
continuous steriliser with the effect of T only (Table 5.7) confirm the better overall fit of
the newly synthesised CDT model where a mean value of MSE of 0.535 was obtained
compared with that of 0.689 for the log-linear model.
In Table 5.10 for the effect of combined T-pH on the batch, bench-scale data, the overall
mean value of MSE can be shown to be 0.504, 1.880 and 0.955 respectively, for
P. fluorescenes, L. monocytogenes and E. coli compared with 0.468,2.108 and 2.463 for
the less appropriate log-linear model.
It is interesting to note from Table 5.1 1 that the value of the coefficient C2" is zero for each
of the three data sets. This is consistent with other findings (Davey 1993a). Sterilisation
happens relatively quickly (seconds) when compared with growth (days).
5.4.6 Concluding Remarks and Acceptance of the CDT Model for Testing in a
Pilot Continuous Steriliser
It appears from the very good fit of the new CDT model to experimental data from the
continuous steriliser of Davey and IV'ood (1984) for the effect of T only, and to those
experimental data for the combined effect of T-pH from batch, bench-scale experiments
with the three bacteria, that time plays a significant role in the kinetics of thermal
inactivation.
It would be very interesting (and necessary) to test the fit of the new, nonlinear CDT
model to a wider range of data to assess whether the model hæ a general, or universal,
81
application to thermal inactivation kinetics of bacteria suspended in liquid. A bacterium-
liquid interaction might be expected if (eg Carbopol, versus fruit juices, purees, milk, etc).
Importantly, the form of the new CDT model can be readily integrated with a wide range of
equations that characterise the hydrodynamics of liquid flow in a steriliser and with
parameters describing the viscous and flow properties of the liquid.
The CDT model therefore was selected for evaluation in a continuous steriliser together
with the steriliser performance equations.
5.5 CONCLUSIONS
The combined effect of process temperature and pH (f-pH) on (static) bench-scale
data for the thermal inactivation of Listeria monocytogenes SLCC 5764 at neat
instantaneous heating has been modelled using an empirical nth order rate equation
(nOE). The nOE model is a significant departure from usual first-order (n = l)
models and appears to be a new form for bacterial survivor kinetics.
The nOE model gave a very good correlation with experimental data with an overall
89.57o of the variance accounted for. This compared with Tl.sEoV for a first-order
model. The nOE model has two terms (l I T and pH). It permits: a practical
procedure for the evaluation of the microbiological safety of liquid foods processed
at mild thermal T-pH, a general principle that can be used to describe bacterial
inactivation for the higher temperatures, and; a basis for more realistic process
optimisation. A drawback appears to be however that the model cannot be readily
integrated with a wide range of equations that characterise the hydrodynamics of
liquid flow in a steriliser and with parameters describing the viscous and flow
properties of the liquid.
A new non-linear, empirical model for the thermal inactivation of bacteria titled CDT
has been synthesised from experimental survivor kinetics of three sets of bench-scale
2
3
82

4.
data of vegetative bacteria - Escherichia coli (ATCC 25922), Listeria monocytogenes
(SLCC 5164) and Pseudomonas fluorescens (172) - as affected by combined T-pH in
which inactivation has been hypothesised as time-dependent. The new CDT model
explained between 829 VoV and 94.6 VoV. This compared with the log-linear form
which accounted for between 74.0 VoV and88.I %oV.
The improved fit of the CDT form over the classical log-linear form appears to
support the hypothesis that the rate of thermal inactivation of viable bacteria is time-
dependent. A time-dependent rate coefficient for thermal inactivation will effect
important changes in design, nutrient losses and minimising of operating costs in
steriliser operations.
Synthesis of the new model is an important directional change in the development of
models for thermal sterilisations. Importantly, the CDT model can be readily
integrated with a wide range of equations that characterise the hydrodynamics of
liquid flow in a steriliser and with parameters describing the viscous and flow
properties of the liquid.
The CDT model therefore was selected for evaluation in a continuous steriliser
together with the steriliser performance equations.
The following chapter describes the sizing and experimental testing carried out in a pilot
continuous steriliser and presents a comparison between the experimental results and the
predictions of the selected CDT model for thermal inactivation kinetics with combined
process ?-pH. The kinetics of thermal inactivation in this flow (dynamrc) system are
compared with those from the bench-scale (static) studies.
5
6
83

CHAPTER
SIx
PILOT CONTINUOUS STERILISER STUDY
84

o
6.I INTRODUCTION
This chapter describes the sizing and experimental testing of a pilot continuous steriliser
and presents a comparison between the experimental results and the predictions of the
selected CDT model for thermal inactivation kinetics with combined process ?-pH.
The main aims of the pilot continuous steriliser were to:
observe thermal effects on bacteria as effected by combined process temperature and
pH (f-pH) in the test liquid
compare the kinetics of thermal inactivation in this flow (dynarulc) system with those
from the bench-scale (static) studies.
Consequently the experimental program focussed on
(1) selection of a suitable micro-organism from those studied
(Z) sizing of the pilot steriliser based on the CDT model (equation 5.25) together with
the steriliser performance equations developed by Lin (1976) and Davey and Wood
(1984) (see equations 2.2 and2.3)
(3) construction of the steriliser in which the integrated model for the unit steriliser
operation based on thermal inactivations predicted from the CDT model could be
adequately tested
(4) production of adequate experimental data from trials with the continuous steriliser.
The major findings are summarised and an analysis of differences between the predicted
and experimental data is presented. The implications arising from the use of a simple flow
model for sterilisation are discussed.
a
85

a
a
6.2 CONTINUOUS STERILISER
6.2.1. Selection of Test Micro-Organism
Escherichia coli was selected as the test micro-organism because:
it is a particularly well documented micro-organism
there was sufficient bench-scale data (static) to compare with results obtained in a
pilot continuous (dynarn lc) steriliser
a direct compdrison could be made with the published continuous steriliser datafor T
only of Davey and Wood (1984).
6.2.2 Sizing of the Pilot Continuous Steriliser
A range of lengths of continuous steriliser holding tube were calculated on the basis of the
CDT kinetic model synthesised from bench-scale data for E. coli inactivation as effected
by combined Z-pH. These calculations are presented in Appendix F: Sizing the continuous
steriliser length from bench-scale data using the CDT model for E. coli inactivation as
affected by combined Z-pH. A reduction in numbers of viable cells of 10-5 was selected as
a practical steriliser design criterion. Clearly, sufficient numbers of viable cells (102 ml-lto
103 ml-l) needed to remain after heat treatment in the continuous steriliser to provide a
practical basis for reliable plate counts.
A maximum pilot steriliser holding tube length of 15 metre (inclusive of Swagelok@
connective fittings) was selected based on an overall average length predicted for all
temperatures (54oC to 58"C) at one median pH value (pH 6.0). Steam injection heating was
selected as a practical means of realising the (near) instantaneous temperature rise implied
in the steriliser performance equations.
Tube of 316 stainless steel, with a smooth bore and internal diameter 9.5 mm, was used for
the holding tube. A required length was made by coupling a number of sections of 980 mm
(15 in total) together with Swagelok fittings. As well as enabling the lengths and steam
86
a

injector (see below) to be easily connected, the Swagelok fitting produces an aseptic seal
and avoids gaps between matching tube ends. The holding tube was thermally insulated
using 13 mm thick Thermotec@ insulation.
6.2.3 Flow Diagram
Figure 6.1a is a flow diagram of the steriliser used in the validation trials. Figure 6.1b is a
photograph of the actual steriliser.
The carrier liquid containing the bacterium was pumped from a continuously stirred
holding tank (15.7 litre), through a specially designed and constructed steam injector, and
into the insulated holding tube.
Total liquid flow - Carbopol solution and condensed steam - was controlled to give bulk
velocities within the range 0.05 m r-tto 0.15 m r-'in the holding tube. This range
corresponds to flow velocities used in commercial sterilisation (Pfiefer and Vojnovich
1952, Davey and Wood 1984). Corresponding volumetric flow are in the range
3.57 cm3 "-l
to 10.7 c*t ,-t. The total liquid flow rate was determined by weighing the
liquid at the end of the holding tube and recording the time needed for liquid to traverse the
15 m length.
The flow in the holding tube was set at the required rate using a variable speed,
magnetically coupled, stainless steel gear pump. The magnetic pump drive provided a flow
rate between 0.11 litre min-l and 2.80 litre min-l of water. Flow from this pump was
smooth and pulse free. Other advantages of using a variable speed pump were that: it
developed a sufficiently large head to create hydrostatic pressure in the holding tube, it
could be steam sterilised and cleaned in situ, has corrosion resistant wettable parts, and;
that it provided a flow rate that could be accurately controlled-
A section of glass tubing could be coupled (with Teflon@ fittings) to the holding tube. This
was used to check for the presence of uncondensed steam bubbles. Contaminated liquid
effluent was collected in a receiving drum that contained disinfectant (Hibicet@ 17o).
87

Temperatures were measured with copper-constantan thermocouples placed at I m
intervals along the holding tube. The thermocouples were attached to the wall of the tube,
between the tube and the insulation, and, to minimise heat conduction along the sheath,
were aligned so that 5 cm of each thermocouple was parallel with the holding tube.
Thermocouples were connected via a 10-way switch box (model Tracker 140), and a
Shimaden@ digital controller which displayed the temperatures recorded by the
thermocouples. The thermocouples were calibrated by immersing them in a constant
temperature water bath of known temperature and comparing their temperature reading
against the temperature reading of a standard thermometer (Appendix I).
Steam inlets were ananged to allow the whole apparatus to be steam-sterilised in situ. All
flow connections on the pump inlet were made with autoclavable silicone rubber tubing.
The Reynolds number (Re) in the holding tube was less than 1,100 (dimensionless) over
the range of exposure times and corresponding bulk velocities ranging between 8.43 cm s-l
(Re = 801) and It.46 cm ,-' (Re = 1,089). This indicates definite laminar flow and
corresponding laminar flow profile (Perry lgl3,Bailey and Ollis 1986, Holdsworth 1993)
as implied in the steriliser performance equations,2.2 and2.3.
The Standard Operating Procedures (SOP's) for safe start-up and operation of the pilot
continuous steriliser are given as Appendix L.
88

Figure 6.1a Flow diagram of the pilot continuous steriliser
Key to Symbols:
M
AF RV GR
PRDMainSteamInletSG
CV
SV TC TC
MP
SIHT D
(Hibicet IVo)
AF Air filter PRD Pressure relieve devices
CV Control valve (type needle) R Regulator for pressure
D Drum RV Relieve valve
G Pressure gauge SG Side glass
HT Holding tube SI Steam injector
M Motor driven stirrer SV Stop valve
MP Magnetically driven pump TC Digital Controller
89

Figure 6.1.b Photograph of the pilot continuous steriliser
90

6.2.4 Steam Injector
Of the methods available for heating, direct steam injection was deemed best suited to the
practical realisation of the instantaneous heating and cooling assumptions of the
performance equations derived for the continuous steriliser. This method gives a higher
overall heat transfer coefficient than indirect heating together with the elimination of heat
exchanger equipment in the heating section of the steriliser (Jones and Larner 1968, Lin
lg7í,Ruyter and Brunet l973,Davey and wood 1984, Holdsworth 1992).
However, with steam injection heating, dilution of the liquid flow with condensate occurs
and provision must be made for this in the design of the steriliser.
The equations developed for the design of a direct steam injector for heating liquid in a
flow system are based on the following assumptions, the:
o bulk temperature of the liquid should rise rapidly to the holding temperature at the
steam injector
o flow of the liquid in the holding tube should be laminar and free of vapour bubbles
o residence time of the liquid in the injector should be very short, because the thermal
inactivation of bacteria follow a complex kinetic equation and the corrections to the
holding time are difficult to estimate.
The equations solved to size the dimensions of the injector used in this investigation are
given in Appendix H.
Dilution of the Carbopol by steam condensate was predicted at 6.9Vo +.1.5 over the range
of flow and temperature conditions used and was assumed constant at 77o. A Bourdon
gauge indicted the steam pressure. A schematic diagram of the steam injector is presented
in Figure 6.2.
9l

Figure 6.2 The Steam Injector
.Þ 9.5 mm
o .2 mm
Õ 1.6 mm
LIQUID FROM TANK
S
TEAM
TO HOLDING TUBE
37 mm
47 mm
VälirtFlll'
92

6.2.5 Experimental Method
The holding tube of the continuous steriliser and carrier liquid were prepared as follows
The stainless steel holding tank was steam-sterilised i¿ situ and allowed to cool. Sufficient
Carbopol 934 powder was added to water to give a 2.I4 kg *-t concentration when the
volume of both the sodium hydroxide solution used for neutralisation and bacterial
suspension were taken into account (Appendix J). Dilution (7Vow/w) with condensed steam
during passage through the steam injector gave the specified 2 kg. m-3 Carbopol
concentration in the holding tube. The Carbopol solution was left at ambient temperature
over night. One hour prior to experimental trials, the sodium hydroxide was added to the
Carbopol solution and pH checked after another 30 min. During this time the pump, pump
lines and holding tube were steam-sterilised in sira. Immediately prior to experiments,
400 cm3 of bacterial suspension was added into the sterile Carbopol solution in the holding
tank and dispersed with continuous stirring. This resulted in between 108 to l0r0 viable
bacteria per ml in the Carbopol carier liquid The steam pressure to the steam injector and
the flow rate of liquid were set to the required levels. Temperatures and the steam pressure
were continuously monitored, until the system reached a steady-state. Different holding
tube lengths were used to coincide with different exposure times to thermal inactivation.
Samples of heated liquid in the holding tube were obtained from a series of sampling
valves placed at one metre intervals along the length of the steriliser. Sample volumes of
64 cm3 of the heated Carbopol were immersed in an ice-bath and rapidly cooled. Estimates
of the viable count of bacteria in control (unheated) and heated samples were determined
by standard plate count methods (Meynell and Meynell 1970). Importantly, the sampling
was started from the end of the steriliser towards the steam injector. This was done in order
to eliminate possible errors introduced by disturbing the laminar velocity flow of the
contaminated liquid in the holding tube.
93

6.2.6 Practical Implementation of Inherent Assumptions of Steriliser Performance
Equations
The design of the continuous steriliser is influenced by the thermal behaviour of the
contaminating micro-organism, and by both rheological and heat transfer characteristics of
the medium. The assumptions implied in the continuous steriliser performance equations
ate'.
1. The flow in holding tube is laminar, incompressible, and steady-state
2. There is no slip at tube wall, that is, the velocity of the liquid at the tube wall is equal
to the velocity of the wall surface which is zero
3. Isothermal conditions occur at every point in the holding tube
4. End effects and sampling effects are negligible
5. Bacteria are uniformly distributed in the liquid
6. There is no slip between bacteria and liquid, that is, the bacterial cells travel on the
laminar streamlines
7. The age of viable cells are the same for both bench-scale (static) and dynamic
continuous steriliser
8. The bulk temperature of the liquid is instantaneously raised to the holding
temperature and is instantaneously cooled to a non-lethal temperature
9. At the shear rates that pertain to food processing, and which are simulated in the pilot
steriliser (120 s-r to 706 r-'¡, the behaviour of the Carbopol solution may be described
by the power law equation
10. The pseudoplastic index of the carrier liquid is not significantly temperature
dependent (n = 0.37).
Assumptions I and 2 are usual in such analyses and are realistic for a liquid in laminar
flow. Assumptions 3 through 6 can be reasonably assumed to be practically implemented
for a well-mixed solution of test liquid and bacterial cells, and a steam injector with an
internal, highly turbulent flow. Assumption 7 is readily practically implemented with the
standardised protocols for the bench scale and continuous steriliser studies. The time for
heating in the steam injector will be very short and is estimated at 0.0183 s (Appendix H).
94

As the liquid is discharged some flash cooling will occur and together with the ice-bath it
is reasonably assumed assumption 8 is practically implemented. More than 1470 shear
stress / shear rate data sets (with 2I replicates) were used by Davey (1980) to determine the
rheological properties of a Carbopol 934 solution of 2 kg m-t in a Rheomat 15, Cone and
Plate viscometer with a vapour shield to prevent evaporation of water from the solution,
over a range of temperature of 25oC to 90oC. The rheological properties were not
significantly affected by the dispersion of bacterial cells, and the pseudoplastic index (n)
was not significantly affected over the temperature range 25oC to 90oC. Assumptions 9 and
l0 are therefore practically implemented.
6.3 RESULTS AND DISCUSSION
Results obtained from the pilot steriliser are summarised in this section. Because of the
large amount of labour involved in obtaining data, the experimental work was restricted.
Replicate data were determined for each of three selected sets of combined T-pH together
with a range of exposure times.
6.3.L Results Summary
Figures 6.3 to 6.5 summarise the thermal inactivation kinetics of the test bacterial strain in
the Carbopol carrier liquid in the pilot steriliser.
The data are presented as the logl6 of the fraction of bacteria that remained viable after
thermal exposure. Exposure temperatures of 54oC + 0.2,56oC + 0.2, and 58oC + 0.2, in
combination with a pH of 4.5,6.0 and7.5, and with immersion times between 8.73 s and
173.35 s were used. The data are the mean of two replicates. The standard deviation ranged
between lO.9Vo and39.OVo with an overall mean of 24.6Vo. The total number of individual
data sets wâs /17 = 218.
The initial concentration of E. coli,N6, ranged between 9.41 x 10⁶ ml-l and 1.32 x 10e ml-l
95

Figure 6.3
0
0
Summary of the continuous steriliser experimental data for thermal
inactivation of E. coli at pH 4.5 with three exposure temperatures
(A = 54oC, 0 = 56oC, o = 58oC) and a range of exposure times
20 40 60 80 100 120 't40
time (s)
-2
ozzE)o
-6
-8
AO
o
#tr tr
^tr
^ Aoo
A
ô
o
o
Â
Aq Aoao
o
A
96

Figure 6.4
0
-2
ozzot-9
-4
-6
40 60 80
Summary of the continuous steriliser experimental data for thermal
inactivation of E coli at pH 6.0 with three exposure temperatures
(A = 54oC, 0 = 56oC, o : 58oC) and a range of exposure times
200 100 120 140 160 lB0
-8
time (s)
oA
Âô
^ otr
^ A o
A
trA
ô
ôâ91 9oo
Âo
tro
ÂÉ
97

Figure 6.5
0
200
Summary of the continuous steriliser experimental data for thermal
inactivation of E. coli at pH 7.5 with three exposure temperatures
(À = 54oC, 0 = 56oC, o : 58oC) and a range of exposure times
40 60 80 100 120 140 160 180
time (s)
-2
ozz-4cD
-9
-6
-8
oo
A A
o
Ao
Ao
oA 60a
OAAAoa
åoooatra a
98

6.3.2 Comparison with Theoretical Predictions
A comparison of the predictions of the CDT-steriliser model with the experimentally
determined survivor data in the pilot steriliser are summarised in Figures 6.6a through 6.6i
for 54oC, 56oC and 58oC at ap}J 4.5,6.0 and 7.5, respectively.
These data are presented as a mean of the lo9¡6 of the fraction of survivors remaining
viable over a holding time t =L / <u>.
6.3.3 A Comparison between Survivor Kinetics in the Continuous Steriliser with
the Capillary Data
The fraction of survivors of E. coli suspended in the Carbopol carrier liquid survived
unexpectedly longer periods of heating when exposed in the capillary tubes of the bench
scale method at low temperatures (54"C) than in the pilot continuous steriliser. However, at
the higher temperatures (56oC and 58"C) bacterial cells were inactivated more rapidly in
the capillary tubes at any pH.
This is underscored through a comparison of the two experimental data sets. A comparison
of the experimental data, as fraction of survivors, obtained in the capillary tubes (sfaflc)
with the experimental data obtained in the continuous steriliser (dynamic) is presented in
Table 6.1 for a range of exposure times (40 s to 60 s) and temperatures (54"C to 58oC) and
pH (a.5 to 7.5). Table 6.1 shows that during the initial 60 s at 54oC, the reduction in
survivors in the continuous steriliser (dynamic) is greater than for the capillary tube data
(static) for all pH values (4.5, 6.0 and 7.5). At 56"C and 58oC, however, after the first 50 s
and 40 s, respectively, the reduction in survivor fraction is much less in the continuous
steriliser than in the capillary tubes. These findings demonstrate clearly that predictions
based on the capillary tube data do not agree with data obtained in the continuous steriliser
at equivalent sterilisation temperatures and exposure times for a given pH.
99
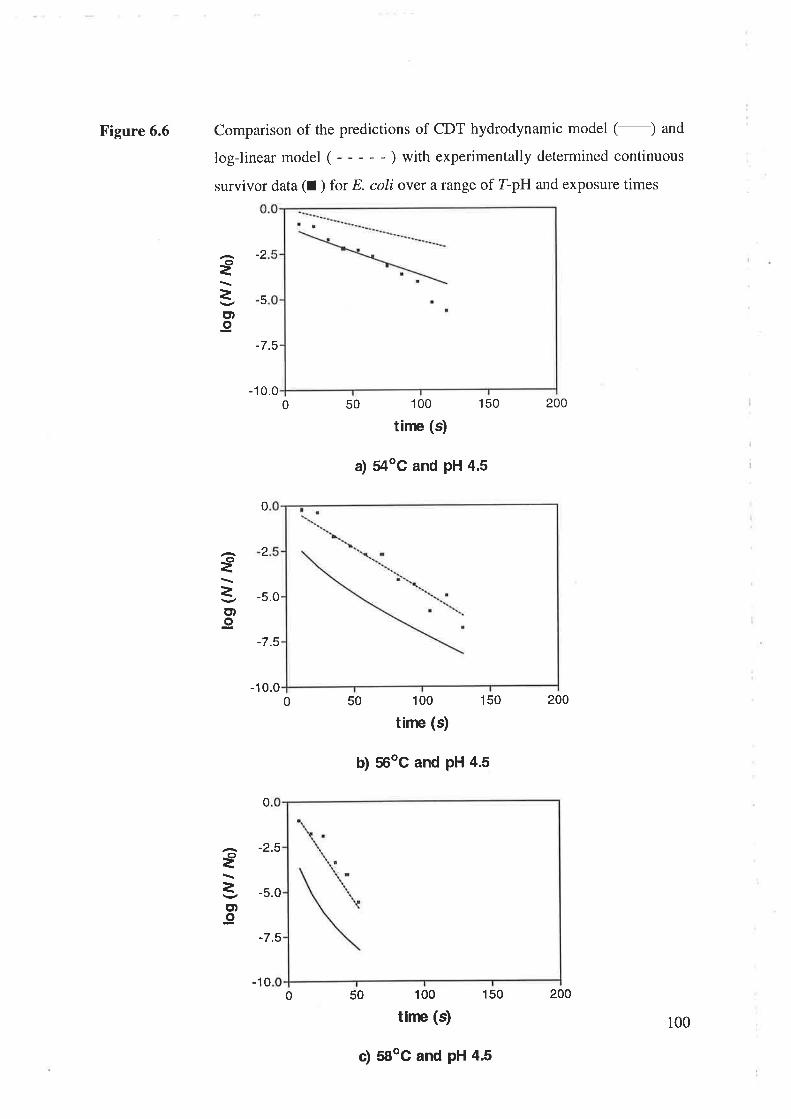
Figure 6.6 Comparison of the predictions of CDT hydrodynamic model (-) and
log-linear model ( - - - - - ) with experimentally determined continuous
survivor data (I ) for E coli over a range of I-pH and exposure times
-7.5
-10.00 50 100
time (s)
a) 54oG and pH 4.5
-5.0
-7.5
-10.0
-2
5
o¿Ict)o
0
2
100
tirc (s)
150 200
150 200
150
fIEt-9
0 50
0
b) 56oC and pH 4.5
50 100
tine (s)
ct
==ct)o
-2.5
-5.0
-7.5
0-10
c) 58oC and pH 4.5
200
100

0
100 150 200
time (s)
d) 54oC and pH 6.0
100 150 200
time (s)
e) 56oC and pH 6.0
50 100 150
Figure 6.6 continued
€¿E)-9
-2.5
-5.0
-7.5
-10.0
-2.5
7
0
-7.5
lo
=ct)-9
50
0 501
0
-2
-5.0
€
=ctto
tinæ (s)
I
-10.00
0 58oC and pH 6.0
200
101

€
=E)o
0.0
-2.5
-5.0
-10
0.0
-2.5
-5.0
-7.5
-1 0.
100
time (s)
g) 54oC and pH 7.5
100
ti¡re (s)
Figure 6.6 continued ...
150 200
150 200
150
7
0 50
50
50
h) 56oC and pH 7.5
100
tirre (s)
€
=E)o
0
5
€Ictt-9
0.0
-7.5
-10.00
D 58oC and pH 7.5
200
102

6.3.4 Analysis of the Continuous Steriliser Survivor Curves
All curves in Figures 6.6a through 6.6i display a typical shoulder, more or less pronounced,
depending of the environmental conditions in which bacterial cells were exposed. It is
suspected that Figures 6.6a through 6.6i show a new microbiological phenomenon of
bacteria in dynamic flow when compared with batch conditions.
This phenomenon might be related to:
1. denaturation of keY Proteins
2. stress proteins, that work to repair damaged proteins
3. heat and pH stresses, when damage occurs faster than repair
4. a bi-phasic behaviour of bacteria.
For example, as the T value increases, the CDT model predicts more bacteria are
inactivated than experimentally determined. Figure 6.4a through 6.6i show both concave-
up and concave-down curves. For a T of 54'C and pH 7.5 (Figure 6.6a), the CDT model
predictions follow the experimental data up to a time of 15 s; after this period of time, the
model predicts fewer bacteria are inactivated than found experimentally. A similar pattern
is observed at 54oC and pH 7.5 (Figure 6.6Ð. At 56oC and 5doC and the same inactivation
time, significantly fewer bacteria are inactivated than predicted especially true as the
exposure temperature increases.
Despite the significant difference in CDT prediction of the number of bacteria inactivated
and that determined experimentally, a positive aspect of these findings is that the
difference is apparently systematic. That is, the predicted inactivation is always greater
over the range of T-pH and exposure time that was used. The model predictions therefore
imply a greater sterilisation efficacy than was the actual case. Any liquid product processed
on the basis of the predictions of the CDT model would therefore contain many more
viable bacteria than assumed. This consequence would be of a serious public health
significance if used without caution. A short summary comparison between CDT model
predictions and the experimental continuous steriliser data reveals that:
103

I
2
continuous exporimental data indicate a distinctive pattern
continuous experimental survivor curves show concave trends, indicating non-linear
inactivation kinetics
the CDT model predicts more bacteria are inactivated than determined
experimentally.
A detailed investigation of Figure 6.6a through 6.6i shows an initial region where the
logarithm of the fraction of survivors is approximately linear with time, and a second
region of extreme tailing in which the fraction of survivors decreases with time. The time
where the survivor trend is turning into an apparent tail is illustrated in Table 6.2, and its
variation with f and pH shown in Figures 6.7, respectively. It should be clarified that all
the values presented in Table 6.2, and subsequently plotted as Figures 6.7 , have a trend of
subjectivity, as they have been judged graphically and estimated by eye using a ruler.
A plot of I versus these shoulder lag times is presented as Figure 6.7a. Results show a
clear variation of the shoulder lag with Z. These variations decrease rapidly as the Z
increases. For example, for a pH of 7.5,the shoulder lags vary from 135 s for 54oC, to
115 s for 56oC, and to 35 s for 58oC. At 58oC, regardless of the pH of the medium, the cells
apparently have less time to react and the shoulder is about 40 s. Most likely this is because
at the higher T the heat transfer to the cell will annihilate the abilities of cell self-
protection; whereas, at the lower temperature of 54oC the cells are influenced more by both
T and pH.
Although the data are limited, the relationship between shoulder lag variation and Iappears linear as shown in Figure 6.7a.
Figure 6.7b is a plot of pH versus the shoulder lags. This figure reveals that the length of
the linear region is also apparently linear with pH, and almost constant at temperatures of
56oC and 58oC. This behaviour indicates that at the higher temperature the effect of
temperature is dominant over pH.
-J
t04
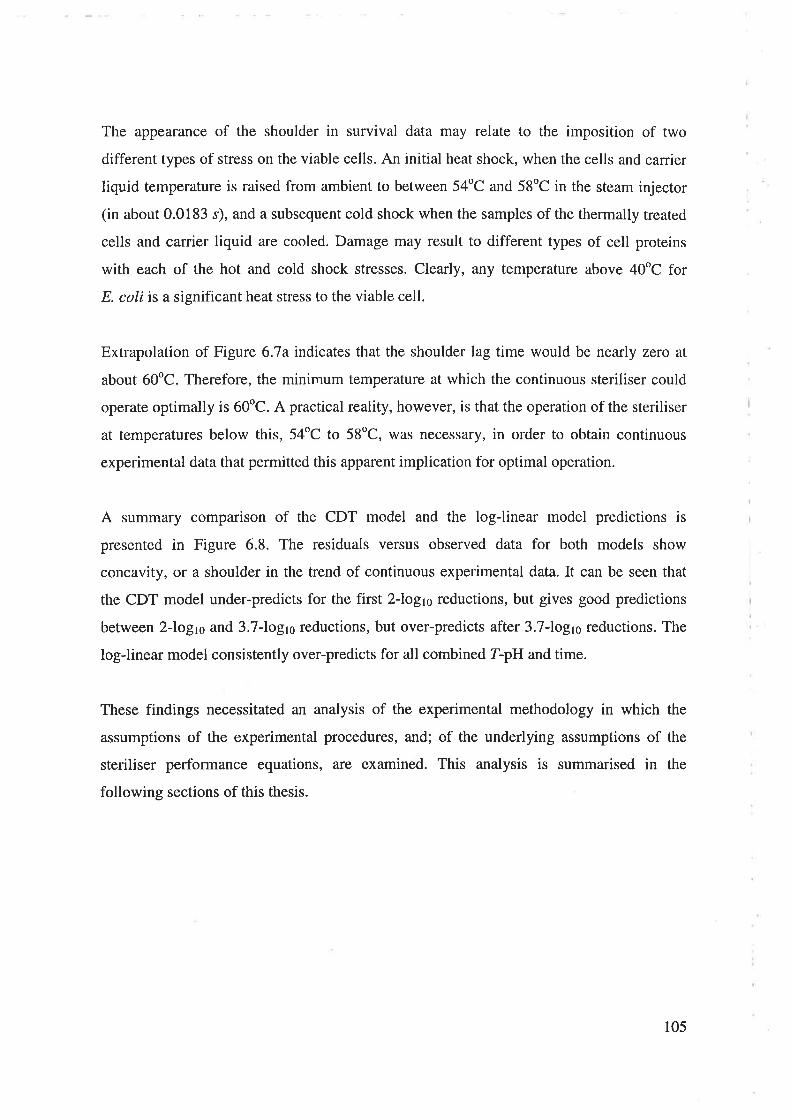
The appearance of the shoulder in survival data may relate to the imposition of two
different types of stress on the viable cells. An initial heat shock, when the cells and carrier
liquid temperature is raised from ambient to between 54oC and 58oC in the steam injector
(in about 0.0183 s), and a subsequent cold shock when the samples of the thermally treated
cells and carrier liquid are cooled. Damage may result to different types of cell proteins
with each of the hot and cold shock stresses. Clearly, any temperature above 40oC for
E. coli is a significant heat stress to the viable cell.
Extrapolation of Figure 6.Taindicates that the shoulder lag time would be nearly zero at
about 60oC. Therefore, the minimum temperature at which the continuous steriliser could
operate optimally is 60oC. A practical reality, however, is that the operation of the steriliser
at temperatures below this, 54oC to 58oC, was necessary, in order to obtain continuous
experimental data that permitted this apparent implication for optimal operation.
A summary comparison of the CDT model and the log-linear model predictions is
presented in Figure 6.8. The residuals versus observed data for both models show
concavity, or a shoulder in the trend of continuous experimental data. It can be seen that
the CDT model under-predicts for the first 2Jog1s reductions, but gives good predictions
between 2-logrc and 3.7Jogro reductions, but over-predicts after 3.7-logro reductions. The
log-linear model consistently over-predicts for all combined Z-pH and time.
These findings necessitated an analysis of the experimental methodology in which the
assumptions of the experimental procedures, and; of the underlying assumptions of the
steriliser performance equations, are examined. This analysis is summarised in the
following sections of this thesis.
105
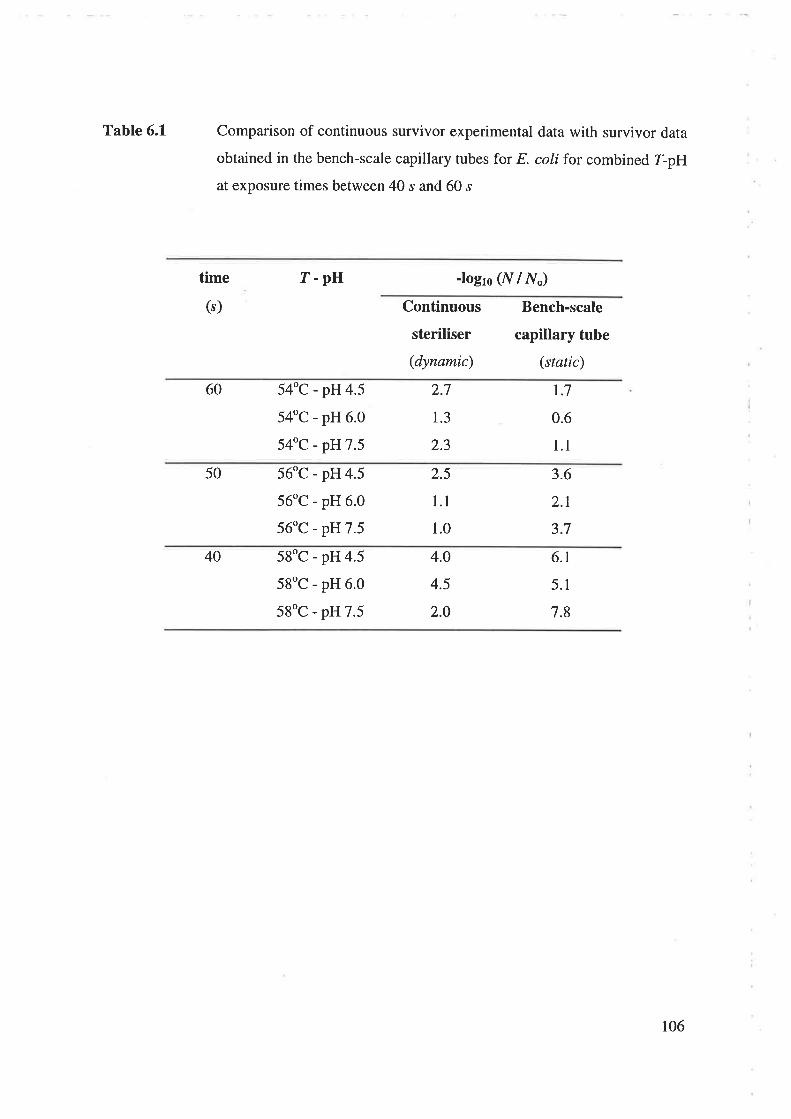
Table 6.1 Comparison of continuous survivor experimental data with survivor data
obtained in the bench-scale capillary tubes for E. coli for combined I-pH
at exposure times between 40 s and 60 s
time
(s)
1- pH -logto (N/N")
Continuous
steriliser
(dynamic)
Bench-scale
capillary tube
(static)
60 54oC - pH 4.5
54"C - pH 6.0
54oC - pH7.5
2.7
1.3
2.3
t.1
0.6
1.1
50 56oC - pH 4.5
56oC - pH 6.0
56oC - pH7.5
2.5
1.1
1.0
3.6
2.t
3.7
40 58oC - pH4.5
58oC - pH 6.0
58oC - p}J7.5
4.0
4.5
2.O
6.1
5.1
7.8
106
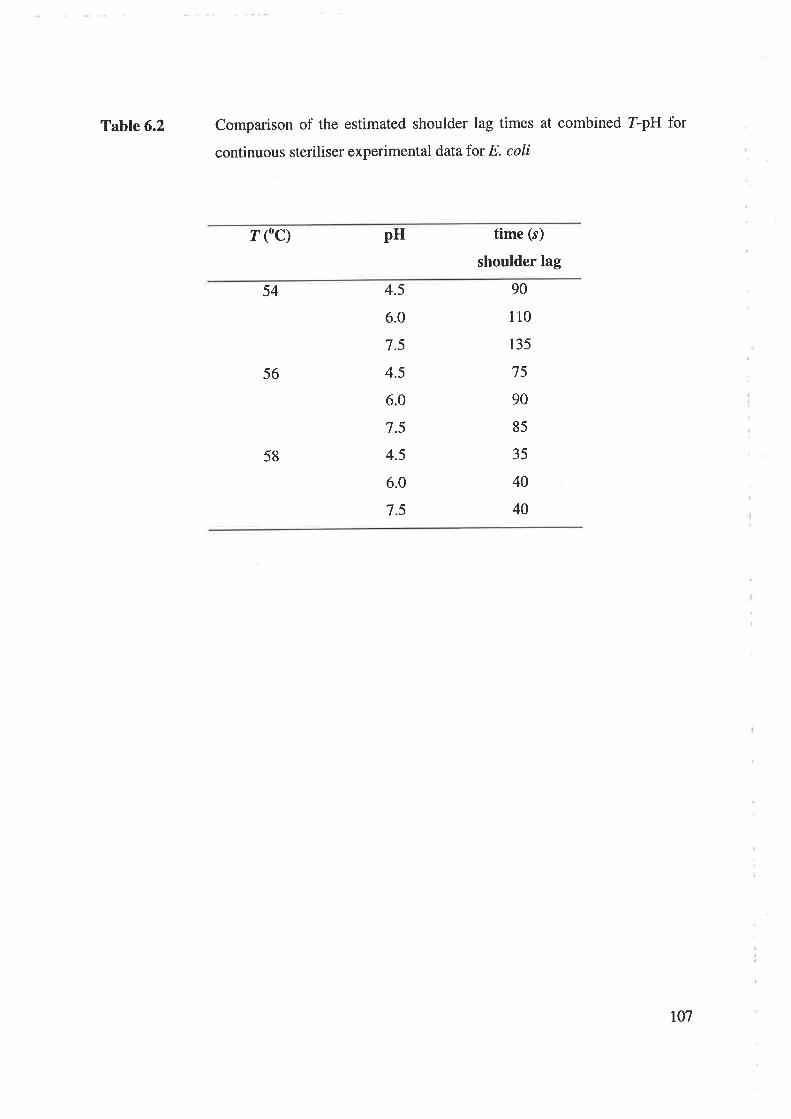
Table 6.2 Comparison of the estimated shoulder lag times at combined T-pH for
continuous steriliser experimental data for E. coli
? ("c) pH time (s)
shoulder lag
54
56
58
4.5
6.0
7.5
4.5
6.0
7.5
4.5
6.0
7.5
90
110
135
75
90
85
35
40
40
107

Figure 6.7 Variation of the shoulder lags of experimental survivors in continuous
steriliser for E coli as a function of T and pH
54 58 60
Temperature (oC)
a) T dependenoe at pH constant
4.O 4.5 5.0 5.5 6.0 6.5 7.0 7.5 8.0
pH
150
30
90
70
50
30
1U¡
Øct)-gl-o!t:to-co
110
5652
ro
U,E)-gLoIJo5Ø
130
110
150
90
70
50
30
pH7.5
pH6.0
pH4.5
540C
560C
5g"c
b) pH dependence at T constant108
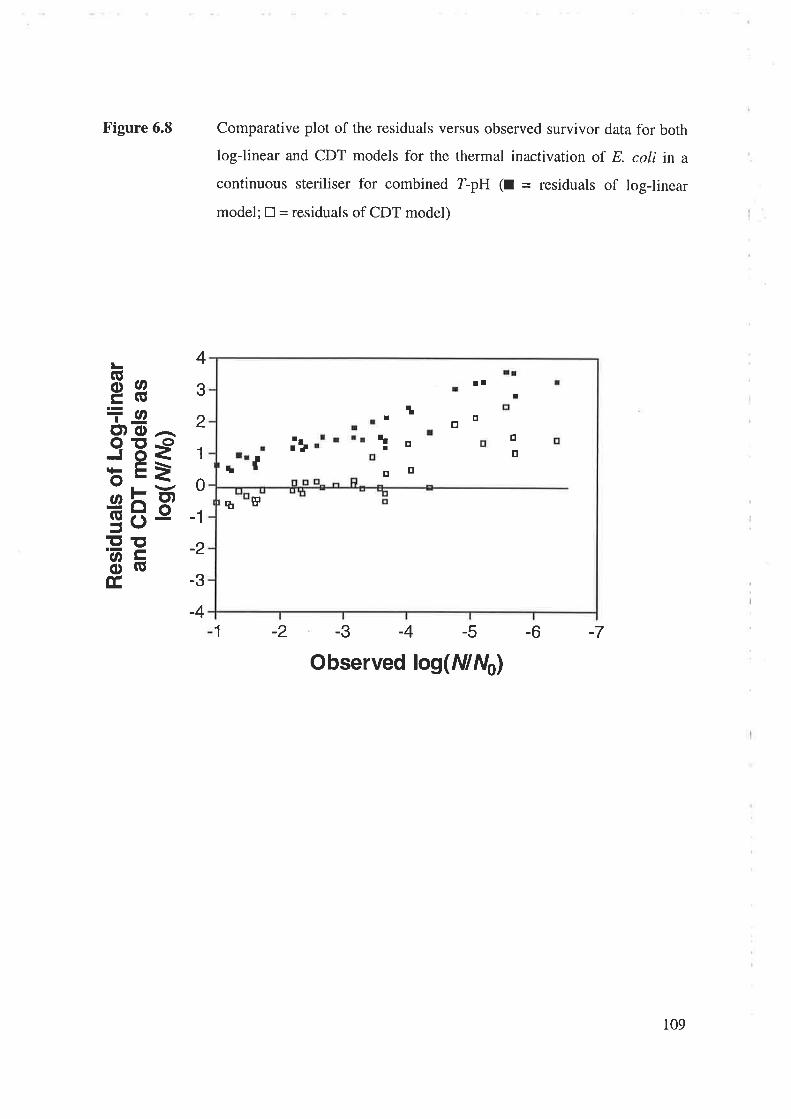
Figure 6.8 Comparative plot of the residuals versus observed survivor data for both
log-linear and CDT models for the thermal inactivation of E. coli in a
continuous steriliser for combined T-pH (l = residuals of log-linear
model; E = residuals of CDT model)
L
EEiøCD O .-.oE -gJ o<h E>*hE-\JttE'3'
FÉ,
4
3
2
1
0
-1
-2
-3
-41 -2 -3 -4 -5 -6 -7
Observed log(fVlNo)
tl
lrIt
gÉ
t
t
tr
tr
¡
tI
tr
tro
o
tr
109

I
2
3
6.3.5 Analysis of the Assumptions Inherent in the Continuous Steriliser Trials
Possible explanations for the deviation of the model predictions from the experimental data
obtained in the continuous steriliser may arise from a combination of errors inherent in:
sampling
significant temperature gradients along the holding tube
a cell population of a heat sensitive bacterium with a more thermally resistant micro-
organism (ie contaminated culture)
significant temperature gradients within the liquid in the holding tube
a failure to practically implement the hydrodynamic flow assumptions of the
steriliser performance equations.
The error in the sample volume measurement at the conditions used in the steriliser trials
was found to be less than 27o. This was determined by comparing the volumes of 30
control samples collected consecutively along the steriliser length. This small error does
not give rise to an approximately one order of magnitude in the experimental data.
Hypothesis 1 may therefore be rejected.
Acceptance of hypothesis 2 would imply a significant temperature gradient along the
steriliser holding tube. However, the temperature gradient along the length of holding tube
was much less than 0.5oC for any experimental trial. This is not sufficient to give rise to
the large differences between the predicted and experimental results obtained in the
continuous steriliser. Hypothesis 2 is therefore rejected.
Cultures of ATCC 25922 E. coli used in all experimental trials were derived from the same
stock suspension held at -70oC as used by Davey and Wood (1984) and Davey, Hall and
Thomas (1995). Consequently it is unlikely that the culture had become contaminated with
another strain that was thermally more resistant. The likelihood of a large variation of
thermal responses within the pure cell culture that would give rise to the magnitude of
differences in the predictions and experimentally determined numbers of bacterial
4
5
110

survivors is negligible. Further, the colonial morphology of both thermally exposed and
control (unexposed) samples was identical. Hypothesis 3 may therefore be rejected.
As the liquid and contaminant bacterial cells are heated in a highly turbulent regime inside
the steam injector the possible consequence of a temperature gradient within elements of
the liquid as it flows along the holding tube is highly unlikely. In any event, the
temperature gradient along the holding tube was negligible, and this reinforces the
hypothesis that a significant temperature gradient within elements of the liquid that may
favour greater numbers of survivors than was predicted, is unlikely. Hypothesis 4 was
therefore rejected.
Deviations from laminar flow (hypothesis 5) will alter the residence time of the elements
of the liquid and therefore of the contaminant bacterial cells that are assumed to travel on
the streamlines of the laminar flow of the liquid in the holding tube. A significant
breakdown in the residence time and assumed hydrodynamic flow in the holding tube
could give rise to deviations in the experimentally determined numbers of survivors and
those predicted from the CDT model and steriliser performance equations.
An experimental investigation of the hydrodynamic flow in the holding tube and its
significance in implementing the assumptions inherent in the predictions was therefore
undertaken.
6.3.6 Experimental Testing of the Holding Tube Hydrodynamics
To test that the experimental data in the continuous steriliser were obtained under
conditions that satisfy the assumptions inherent in the steriliser performance equations,
flow conditions inside the holding tube were examined experimentally.
A glass section of holding tube (1200 mm) was coupled to replace a length of steel holding
tube in the pilot steriliser and photographs were taken of the actual velocity profile and
hydrodynamic picture inside the holding tube. Dye traces were injected into the centre of
the steriliser holding tube immediately downstream of the steam injector (- 2.5 cm) during
lll

operation of the continuous steriliser. A suitably modified 2l-gauge hypodermic syringe
was used to inject methylene blue indicator in a 2 kg m-3 Carbopol solution of the test
liquid at room temperature (- 2O'C). The viscosity of the test liquid was known not to be
significantly affected by temperature over the range 25oC to 90"C (Davey 1980, Davey and
Wood 1984).
A number of these dye trace studies were carried out for a bulk liquid temperature of 54'C
and a bulk velocity of 1.8 cm s-|. Figure 6.7 shows a summary sample photograph of actual
velocity profiles.
From this summary photograph it is seen that full laminar flow was obtained in the holding
tube after a short distance (- 13 cm, ie 13.3 holding tube diameters) from the steam
injector outlet (Part l). Importantly, this finding confirms stable operation of the steam
injector and the condensation of all steam as no bubbles are observable.
Part 2 of the figure shows the laminar profile at a distance of 70 cm from the steam
injector. The profile is observed to be fully laminar. In Part 3, 150 cm from the steam
injector, the profile is seen to remain laminar. However this laminar profile has begun to
disappear in Part 4, a distance of 200 cm from the steam injector, and the effects of axial
dispersion have begun to make an impact. The extent of the effect of axial dispersion on
the liquid hydrodynamics cannot be quantitatively assessed however from visual studies
along the length of the steriliser holding tube.
Continued investigation using the glass section of holding tube was carried out however.
Progressive sections of the tube were replaced with the glass section and dye traces
observed to determine the holding tube dynamics at each section of all the 15 lengths.
These studies showed conclusively the gradual breakdown of the laminar profile in the
holding tube. The liquid profile slowly disappears through the effects of gradual
dispersion, that is, a superimposed backmixing or intermixing of the carrier liquid.
t12

Figure 6.7 Summary photograph showing the liquid profile of the carrier liquid in
the pilot continuous steriliser and effects of dispersion in the holding tube
I, t*'
¡Þl , ' rìr l, ':r .r :¡ê í"fi,¡2','lì¡t f
.r.Þ. 'i 1.. . ,r,
113

Hypothesis 5 - a failure to practically implement the hydrodynamic flow assumptions of
the steriliser performance equations - was therefore accepted as being a major contributor
to the observed differences between experimental data obtained in the continuous steriliser
and the predictions of the CDT model.
An attempt at a quantitative analysis of the likely magnitude of these unaccounted effects
of dispersion on the continuous steriliser performance equations as applied to the
experimental studies in the pilot continuous steriliser was therefore undertaken.
6.3.7 Effects of Dispersion
A literature search indicated that the seminal work on relevant effects of dispersion is that
of Levenspiel (1972). Aiba, Humphrey and Millis (1973) were to (briefly) apply the notion
of dispersion to microbiological reactors such as continuous sterilisers. Lin (1975)
investigated theoretically the thermal sterilisation of liquid with effective dispersion. He
allowed for a variation with temperature, whereas the earlier models assumed a constant
temperature. There are no reports of dispersion effects for combined I-pH.
Important to understanding the dispersion effects of backmixing and intermixing on the
gradual breakdown of a liquid velocity profile in a continuous steriliser is that the
behaviour of the bacterial cells suspended in the liquid are considered to follow closely the
hydrodynamic mixing characteristics of the particular steriliser. This assumption that
bacterial cells would follow the mixing characteristics is a reasonable one, and is implicit
in the steriliser performance equations presented in Chapter 2.3.2. That is, the bacterial
cells travel on the laminar layers of the velocity profile and that there is no "slip".
The effect of significant dispersion is to increase the holding time required for sterilisation.
In a practical sense, this means an added length of holding tube is required for a (fixed)
flow rate of liquid.
The treatment of dispersion in the literature appears to be limited to its effect on ideal plug
flow in a tubular reactor. This situation is much less complex than when considering the
It4

effects of dispersion on laminar flow in the pilot continuous steriliser. A deal of further
complexity is further added since the CDT model is not a simple first-order equation.
However any attempt at an appropriate quantification of the effects of dispersion could
provide useful information or insight and was therefore undertaken. If the effect of
dispersion is significant, an additional element might be needed in the steriliser
performance equations.
A convenient treatment of the effect of dispersion on plug flow in a continuous steriliser is
that provided by Lne (1992). It is convenient in that it is built from basic consirlerations of
a steady-state mass balance on viable bacterial cells contaminating a liquid in continuous
flow. Typically, the procedure to calculate effects of dispersion is to assume ideal plug
flow and determine a suitable length of holding tube (L) for a required reduction in viable
cell numbers (ie a design criterion logro <N>i<No>), then, determine the required
additional length of holding tube if the effect of axial dispersion is considered. However,
for the present purpose what is required is:
1. given L and I ogto <M>/<No>
Z. calculate the effect dispersion might have had on the extent of thermal inactivation
of the numbers of bacterial cells
3. moderate CDT model predictions for this effect
4. appraise the significance of dispersion in the experimental continuous steriliser.
A procedure was set up to do this, and is presented in detail in Appendix K. The effect of
axial dispersion is only indicative at this stage and results obtained are formulated on
estimates.
Holding tube lengths of between 6 m and 15 m were selected for comparison with and
without effects of dispersion and where survivor numbers of E. coli were large enough to
be easily identified. This gave a range of holding times of 52 s to 170 s.
Table 6.3 is a comparative summary. Three temperature values are considered at an
averaged range of pH 6.0. The table highlights that the CDT model under-predicts the
115

efficacy of sterilisation at T = 54"C, but over-predicts at greater temperatures' over this
range of temperature the effect of dispersion estimated appears controlling to give a fixed
reduction of logro =J.0. Significantly, it can be seen that, overall' the value predicted in
reduction of viable E coli cells by the dispersion model agrees better with the
experimental values obtained in the pilot continuous steriliser. This is especially true at the
greater logls reductions in viable cells and greater holding times (long sections of holding
tube).
A CDT-Dispersion model appears to give a better mechanistic view of the thermal
inactivation kinetics, accounting as it does for the effects of:
. environmental factors (T-PH)
o time (t)
o liquid rheologY (n)
o dispersion.
used log-linear model.
The work presented in this chapter has addressed some important issues that must be
considered when sterilisation is conducted in a (pilot scale) continuous steriliser' The
observed behaviour of bacteria heat-treated with different liquid pH demonstrates that
actual bacterial kinetics in continuous sterilisef are more complex than that implied in the
assumptions of the hydrodynamic performance equations'
This is a matter reported only very recently by McMahon et al (2000) for relevant
pathogens. For a study of the growth phase on induction of the heat shock response of
Yersinia enterocolitica and Listeria monocytogenes, they reported on exponential and
stationary preconditioned cultures that were heat shocked' Heat-shocked cells of these
pathogens were able to survive much longer than non-heat shocked cells when heated at
55"C - a temperature very similar to that used in this study. The increase in heat resistance
between heat-shocked and non-heat-shocked cells was greater for the exponential culture
significantly, the new cDT model predicted better the survival of bacteria than the widely
116

than the stationary. This is the overall relative thermal resistance of each pathogen was
dependent on cell growth Phase.
The work of McMahon et al therefore requires recognition of the presence of potentially
injured micro-organisms. It is imperative for accurate interpretation of microbiological
data. The public health consequences associated with failure to detect injured pathogens
that subsequently repair "could be substantial" (McMahon et al 2000).
Differences observed between the survivor kinetics in capillary (static) and continuous
steriliser (dynamic) heat treatments may therefore relate to the thermal history of the
bacteria. This effect might need to be quantitatively assessed in future studies of the
sterilisation of vegetative pathogens.
tt7
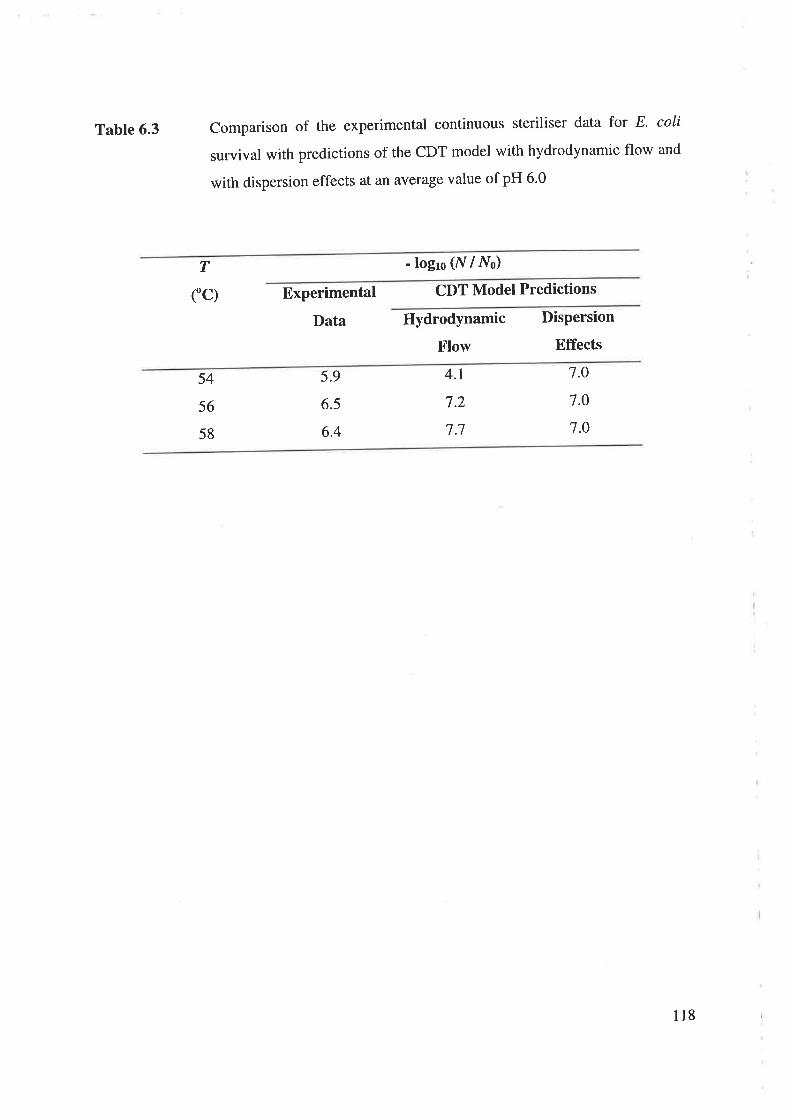
Table 6.3 Comparison of the experimental continuous steriliser data for E' coli
survival with predictions of the CDT model with hydrodynamic flow and
with dispersion effects at an average value of pH 6'0
- logto (N / No)
Experimental
Data
CDT Model Predictions
Hydrodynamic
Flow
T
("c)Dispersion
Effects
54
56
58
5.9
6.5
6.4
4.1
7.2
7.1
l.o
7.0
1.0
118

1
6.4 SUMMARY
Kinetic data obtained from bench-scale studies in capillary tubes (s/øflc) of thermal
inactivation of E. coli in a Carbopol carrier liquid did not satisfactorily agree with
those obtained in a pilot scale continto]us (dynaruic) steriliser.
A newly synthesised CDT model based on these capillary data and used to size the
continuous steriliser predicted a greater reduction in the number of viable cells in the
liquid than was actually realised, especially at higher temperatures.
A significant portion of the difference between predicted reductions in the number of
viable bacteria by the CDT model, based on data obtained from the capillary tubes,
and that which was experimentally realised in the pilot continuous steriliser is
associated to the effects of dispersion.
A model for the simulation of thermal inactivation of bacteria in liquid in a
continuous steriliser must involve a consideration of the likely significant effects of
dispersion, especially at longer holding tube lengths and corresponding holding
times.
2.
-1
4
rt9
CHAPTER
SEVBN
CONCLUSIONS
t20

1 Thermal inactivation curves from bench-scale (static) studies for three selected
bacteria, namely, Pseudomonas fluorescens, Escherichia coli and Listeria
monocytogenes, and continuous steriliser (dynamic) data for E. coli, showed tailing'
The assumption of log-linear kinetic dependence is therefore inadequate over the
entire survivor curve. Widely used D values are not appropriate to describe thermal
inactivation of these three bacteria unless used carefully and judiciously in
demonstrated linear sections of the survivor curve'
The effect of pH over the pH range 4.0 to 7.5 on the rate coefficient for thermal
inactivation is significant for all three selected bacteria, especially at lower exposure
temperatures of 54oC. Significant concave-up tails appeared in the survivor data for
P. fluorescens and E. coli, and both concave-up and concave-down tails appeared in
the survivor data of L. monocytogenes. The reason(s) for different tailing behaviour
exhibited by the bacteria is unknown, but this has important implications for
development of predictive models applicable to industry. For these data, a decimal
reduction time that is dependent on combined temperature and pH (?"-pH), D"6,0¡¡, has
therefore been defined for use with appropriate linear sections of the survivor curve'
An uncritical use of the log-linear model will result in a serious under- or ovef-
estimate of survivors for these three bacteria over a range of combined T-pH'
Two new and non-linear kinetic models, nth order rate equation (nOE) and CDT,
were therefore synthesised from these substantial experimental data (nr = 708) to
better predict the effect of combined I-pH on thermal survival kinetics. Both models
involve a time dependent rate for thermal inactivation. This contrasts sharply with the
time independent form of the log-linear kinetic model'
The noE model has two terms (l t T and pH) and explained an overall 89'5VoV'
compared wlth7l.57oV for the classical log.linear model. Although noE permits a
practical procedure for the evaluation of the microbiological safety of liquid foods
processed at mild T-pH, a major drawback is that it is of a form that is not readily
2.
3
4
t2l

5
integrated with equations that characterise liquid rheology and hydrodynamics of
liquid flow to simulate a steriliser process unit operation'
An advantage of the CDT form is that it can be readily integrated to simulate a
steriliser unit operation. This new model explained 94.67oV for the Z data, and
between 82..9VoV and 93.O7oV for combined I-pH data. This compares with,
respectively,SS.SToV and,74.O7oV and 81 .3VoV for the log-linear form.
outside a range of between Z-logto to 3.7-lo916 reduction in the number of viable
bacterial cells hov,'ever, the CDT model consistently under-estimated the extent of
thermal inactivation. A detailed and careful analysis suggests that these under-
estimates are primarily dependent on the effect of axial dispersion within the liquid
flow in the continuous steriliser. The effect of axial dispersion was highlighted
through visual and dye trace studies. It was shown to be more pronounced with
longer holding tube lengths and corresponding holding times. A contributing factor
also, to differences in predicted and observed sterilisation values, the magnitude
which is difficult to ascertain, is that bench-scale (static) data determined from glass
capillary studies appear limited in application to sizing and design of a continuous
steriliser (dynamic) at equivalent T-pH and r'
Bench-scale studies are therefore viewed as a necessary design approach but require a
more cautious application than implied in the literature'
Established performance equations for simulating continuous thermal sterilisation of
liquid are inadequate. Whilst these include consideration of thermal inactivation
kinetics of bacteria, liquid rheology and hydrodynamic and flow considerations, they
do not include a term for dispersion. The effect of dispersion has been quantitatively
estimated to give rise to an order of magnitude difference in predicted reductions in
the number of viable bacterial cells in a continuous steriliser. Dispersion is therefore
seen to be highly significant in thermal sterilisation of liquid.
6.
t22

1
7.I RECOMMENDATIONS
Studies should be carried out to further develop an accurate process model that
includes rigorous, quantitative effects of axial dispersion in the steriliser performance
equations.
2. Apparent differences in observed thermal inactivation kinetics of bacteria subjected
to heat in glass capillaries (static) compared with the continuous steriliser (dynamic)
at equivalent I-pH require further investigation.
123

APPENDIX A
DEFINITION OF SOME IMPORTANT TERMS USED IN THIS STT]DY
124

LOG.LINEAR
A mathematical model that describes the thermal inactivation of bacteria following a first-
order kinetic equation; the rate of the inactivation process is proportional to the number of the
viable cells present at a defined time
NON.LINEAR KINETIC MODEL
A mathematical model that describes the survivor curves for thermal inactivation which are
non-linear (ie curves that present tailing, shoulder, or are concave downwards)
RATE COEFFICIENT
The rate of reduction in the number of viable cells, measured in time-t to give an expected
survivor inactivation
STATIC / DYNAMIC
Static refers to data obtained in capillary tubes of small diameter. In contrast, dynamic refers
to data determined in the pilot continuous steriliser
STERILISATION
The process of inactivating completely all forms of microbial life. A working definition is the
survival level of a selected micro-organism at the point of minimum treatment. For vegetative
bacteria the requirement for thermal sterilisation of the liquid is a survival level of 10-4 - 10-5
STERILITY REQUIREMENT
A reduction in the number of viable cells to some specified number. This can be expressed as
any of the following: N l lys; logro (N / No); ln (N / No)
THERMAL INACTIVATION
A heating process that implies a loss of viability of the micro-organism, and hence, a reduction
in the number of viable cells
125

VEGETATIVE BACTERIA
A non-spore forming bacterium
VIABLE COUNT
The number of survivor cells in a defined volume (eg cell d-r). The working definition
equates viability "with the power to form a macroscopic colony on nutrient agar". Dilution is
used to obtain separate colonies
126

APPENDIX B
REFEREED PUBLICATIONS FROM THIS THESIS
127

8.1 INTERNATIONAL RBFEREED JOURNALS
Chiruta, J., Davey, K. R. and Thomas, C. J. (1999) A new non-linear kinetic model for
survival of bacteria in liquid as affected by combined temperature - pH in continuous
sterilisation, Transactions of the Institution of Chemical Engineers, Part C, Bioproducts and
F o od P ro c e s sing (submitted)
Chiruta, J., Davey, K. R. and Thomas, C. J. (1997b) Thermal inactivation kinetics of three
vegetative bacteria as influenced by combined temperature and pH in a liquid medium,
Transactions of the Institution of Chemical Engineers, Part C, Bioproducts and Food
P roces sing, 7 5: ll 4-l8O
8.2 INTERNATIONALREFEREEDCONFERENCES
Chiruta, J., Davey, K. R. and Thomas, C. J. (I99la) Combined effect of temperature and pH
on microbial death in continuous sterilisation of liquids, 7th International Congress on
Engineering and Food, April, Brighton, UK, 4109-All2 (ISBN 85075 814 X)
Chiruta, J., Davey, K. R. and Thomas, C. J. (1997c) An nth order reaction model for thermal
inactivation of Listeria monocytogenes in liquid with combined temperature and pH,
Proceedings of the 3rd International Conference on Modelling and Simulation, October
29 - 31, Victoria University of Technology, Melbourne, Australla,343-346 (ISBN I 86 272
4e03)
Chiruta, J., Davey, K. R. and Thomas, C. J. (1996a) Modelling the combined effect of
temperature and pH on continuous thermal sterilisation of liquids, The 2nd International
Conference of Predictíve Microbiology, February 18 - 22, Hobart, Australia, Paper 6
128

8.3 AUSTRALASIANREFEREED CONFERENCES
Davey, K. R., Thomas, C. J. and Chiruta, J. (1998a) Mathematical evaluation and design for a
new time-dependent thermal inactivation of bacteria in liquid as influenced by combined
temperature and p}J, I4th Australasian Biotechnology Conference, 19 - 23 Aprll, Adelaide,
Australia (in press)
Davey, K. R., Thomas, C. J. and Chiruta, J. (1998b) A new non-linear kinetic model for
design of thermal inactivation of bacteria in liquid as effected by combined temperature and
pH in a continuous steriliser, 26th Au.stralasian Chemical Engineering Conference,
CHEMECA '98,28 - 30 September, Port Douglas, Queensland, Australia, Paper 68 (ISBN I
85825 683 5)
Chiruta, J., Davey, K. R. and Thomas, C. J. (1996b) Modelling the combined effect of process
temperature and pH in continuous sterilisation of liquids, 24th Australian and New Zealand
Chemical Engineering Conference, CHEMECA '9ó, September 30 - October 2, Sydney,
Australia, 3: 129-134 (ISBN 0 85825 658 4)
t29

APPENDX C
SUMMARY OF RAW BENCH-SCALE EXPERIMENTAL DATA AS
AFFECTED BY COMBINED ?.PH
130

C.l P. FLUORESCENS
Pages l3l to 134 arc a summary of the raw bench-scale experimental datafor P.fluorescens
as affected by combined T-pH.
No. f ("c) pH time (s) Nl No log (fvl fVo)
15
30456090120180240300
1
234567I9
52
5252525252525252
5.0
5.05.05.05.05.05.05.05.0
0.7830.7440.6090.523o.4640.4600.3640.3380.281
-0.106-0.128-0.215-0.281-0.333-0.337-0.439-o.471
-0.551
1011
12131415161718
5.45.45.45.45.45.45.45.45.4
1530456090120180240300
525252525252525252
o.4790.695o.7490.7410.6810.5980.450o.3420.254
-0.320-0.158-0.'t26-0.130-0.167-0.223-0.347-0.466-0.595
525252525252525252
192021
222324252627
6.06.06.06.06.06.06.06.06.0
1530456090120180
240300
0.4220.4530.5240.5410.6150.4640.6030.570o.275
-0.375-0.344-0.281-0.267-o.211-0.333-o.220-o.244-0.561
28293031
3233343536
525252525252525252
6.56.56.56.5
6.56.56.56.56.5
15304560
90120180240300
0.473o.7490.8550.8950.8950.8550.7440.6380.547
-0.325-0.126-0.068-0.048-0.048-0.068-0.128-0.195-0.262
3738
5454
0.6890.666
-0.162-0.177
5.05.0
15
30
131
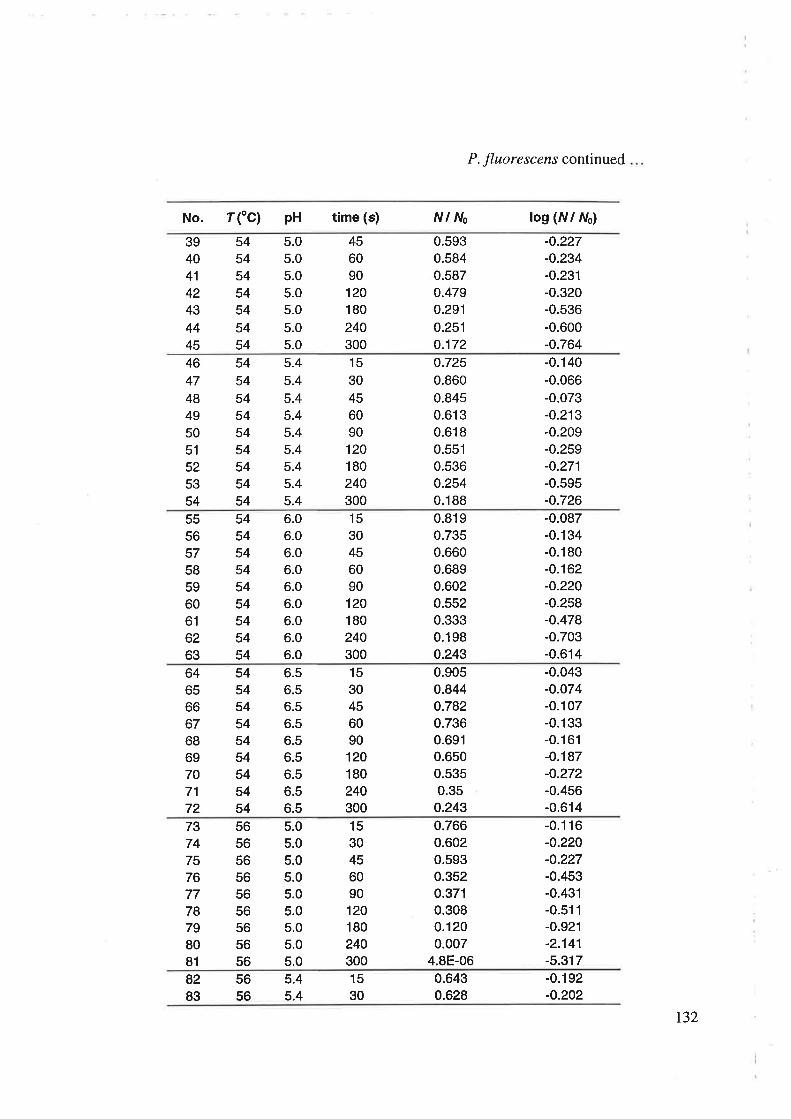
P. fluoresc¿ns continued
No. Ifc) pH time (s) N I No log (/v/ ruo)
456090120180
240300
394041
4243
4445
54545454545454
5.05.05.05.05.0
5.05.0
0.5930.5840.5870.4790.291
0.2510.172
-o.227-0.234-0.231-0.320-0.536-0.600-0.764
4647
48495051
525354
545454545454545454
5.4
5.4
5.45.45.45.45.45.45.4
15
30
456090120180240300
0.7250.8600.8450.6130.6180.5510.5360.2540.188
-0.140-0.066-0.073-0.213-0.209-0.259-0.271
-0.s95-0.726
545454545454545454
55565758596061
6263
6.06.06.06.06.06.06.06.06.0
15
30456090120180240300
0.8190.7350.6600.6890.6020.5520.3330.198o.243
-0.087-0.134-0.180-0.162-o.220-0.258-0.478-0.703-0.614
545454545454545454
6465666768697071
72
6.56.56.56.56.56.56.56.56.5
1530456090120180240300
0.905o.8440.7820.7360.6910.6500.5350.35
o.243
-0.043-0.o74-0.107-0.133-0.161-0.187-o.272-0.456-0.614
737475767778798081
565656565656565656
5.05.05.05.05.05.05.05.05.0
1530456090120180240300
-0.116-0.220-0.227-0.453-0.431-0.511-0.921-2.141-5.317
0.7660.6020.5930.3520.3710.3080.1200.007
4.8E-06
8283
5656
5.45.4
0.6430.628
-0.192-0.202
1530
r32

P. fluoresc¿¡¿s continued ...
No. r("c) pH time (s) Nl No log (M ruo)
84858687888990
56565656565656
5.45.45.45.45.45.45.4
456090120180240300
-0.209-0.230-0.333-0.203-0.435-1.870-4.921
0.6180.5890.4640.6260.3670.014
1.2E-05
6.06.06.06.06.06.06.06.06.0
565656565656565656
91
9293949596979899
1530456090120180240300
0.7230.6700.6170.6070.5010.3860.2020.0270.001
-0.141-0.174-0.210-0.217-0.300-0.413-0.695-1.577-2.889
100101
102103104105106107108
6.56.56.56.56.56.56.56.56.5
15
30456090120180240300
0.8440.8020.7080.6950.5140.3050.0500.0630.038
-0.o74-0.096-0.150-0.158-0.289-0.516-1.299-1.203-1.426
565656565656565656
109110111't12
113114115116117
155858585B
5858585858
5.05.05.05.05.05.05.05.05.0
30456090120180240300
0.541o.4420.3530.2960.081
8.6E-049.6E-057.1E-052.4E-06
-o.267-0.355-0.452-0.529-1.094-3.068-4.016-4.148-5.625
118119't20't2t122123't24125126
5.45.45.45.45.45.45.45.45.4
1530456090120180240300
-0.240-0.222-0.438-0.510-0.780-1.237-2.924-4.386-4.060
585858585858585858
0.5750.6000.3650.3090.1660.0580.002
4.1E-058.7E-05
t33

P. fluoresc¿ns continued
No. f ("c) pH time (s) Nl No log (w/ ruo)
127128129130131
132133134135
6.06.06.06.06,06.06.06.06.0
1530456090120180240300
-0.201-0.300-o.442-0.517-0.532-2.674-4.317-6.'1 13-6.317
585858585858585858
0.6290.5010.3610.3040.2940.002
4.8E-057.7E-074.8E-07
136137138139140141142143144
6.56.56.56.56.56.56.56.56.5
1530456090120180240300
585858585858585858
0.8170.65
o.4540.3820.1470.1440.015
4.2E-042.6E-05
-0.088-0.187-0.343-0.418-0.833-0.842-1.824-3.379-4.583
14s146't47148149150151
5.05.05.05.05.05.05.0
1530456090120180
-0.286-0.554-0.939-1.385-2.421-3.646-6.664
60606060606060
0.518o.2790.1 150.0410.004
2.38-O42.28-07
152153154155156157158
5.45.45.45.45.45.45.4
1530456090120180
-0.393-0.428-0.810-1.171-1.733-3.011-4.939
60606060606060
0.4050.3730.1550.0680.019
9.8E-041.2E-05
159160161
162163164165
6.06.06.06.06.06.06.0
1530456090120180
-0.157-0.406-0.770-1.194-2.205-3.413-6.460
60606060606060
0.6960.3930.1700.064
6.2E-033.9E-043.5E-07
166167168169170171172
6.56.56.56.56.56.56.5
1530456090120180
0.5830.425o.2250.0709E-039E-058E-05
-0.234-0.372-0.648-1.155-2.022-4.046-4.O97
60606060606060
134
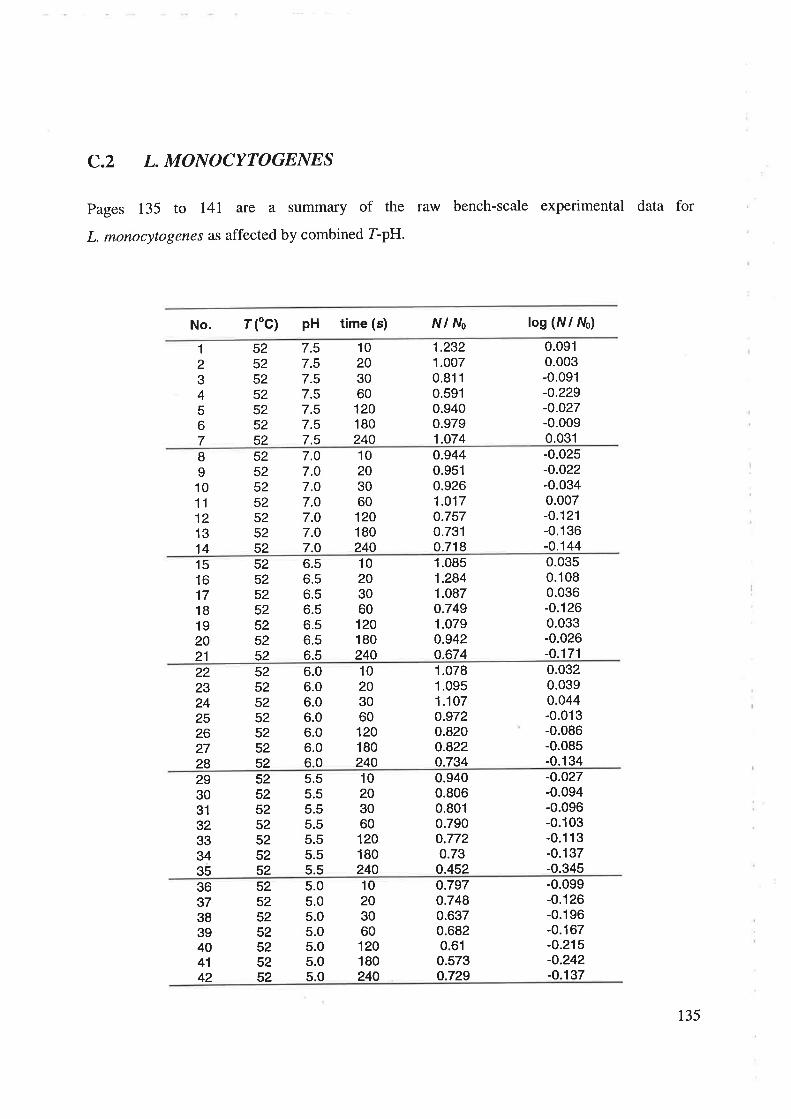
C.2 L. MONOCYTOGENES
pages 135 to I4l are a summary of the raw bench-scale experimental data for
L. monocytogenes as affected by combined T-pH.
No. rCC) pH time (s) N I No log (M wo)
1
234567
52525252525252
7.57.57.57.57.57.57.5
10203060120180240
1.2321.0070.8110.5910.9400.9791.074
0.0910.003-0.091-o.229-0.027-0.0090.031
891011
121314
7.07.07.O
7.07.O7.07.0
1052525252525252
203060120180240
o.9440.9510.9261.0170.7570.731o.718
-0.025-0.022-0.0340.007-0.121-0.136-0.144
15161718192021
52525252525252
6.56.56.56.56.56.56.5
10203060120180240
1.0851.2841.0870.7491.079o.942
0.0350.1080.036-0.1260.033-0.026-0.1710.674
52525252525252
22232425262728
6.06.06.06.06.06.06.0
10203060120180240
1.0781.0951.107o.9720.820o.822o.734
0.0320.0390.o44-0.013-0.086-0.085-0.134
29303132333435
52525252525252
5.55.55.55.55.55.55.5
10203060120180240
0.9400.8060.8010.790o.7720.730.452
-0.o27-0.094-0.096-0.103-0.1 13-0.137-0.345
36373839404142
52525252525252
5.05.05.05.05.05.05.0
10203060120180240
o.797o.7480.6370.6820.610.573o.729
-0.099-0.126-0.196-0.167-0.215-o.242-o.137
135
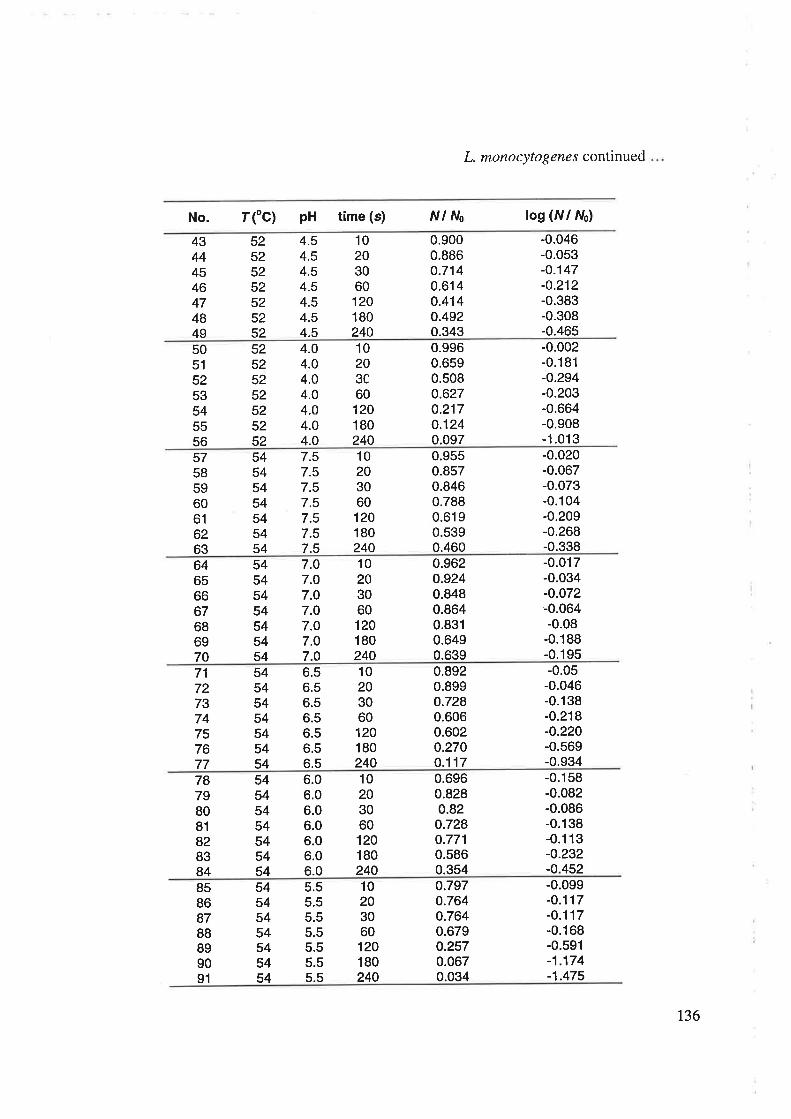
L. monocyto genes continued
No. rfc) pH time (s) N I No log (w/ fVo)
52525252525252
43444546474849
4.54.54.54.54.54.54.5
10203060120180240
0.9000.886o.7140.6140.4140.4920.343
-0.046-0.053-o.147-o.212-0.383-0.308-0.465
52525252525252
50515253545556
4.04.04.04.04.O4.04.0
10203C60120180240
0.9960.6590.5080.627o.2170.1240.097
-0.002-0.181-0.294-0.203-0.664-0.908-1.013
1054545454545454
57585960616263
7.57.57.57.57.57.57.5
203060120180240
0.9550.8570.8460.7880.6190.5390.460
-0.020-0.067-0.073-0.104-0.209-0.268-0.338
64656667686970
54545454545454
7.O7.07.07.07.O7.07.O
'10
203060120180240
0.9620.9240.8480.8640.8310.6490.639
-0.017-0.034-o.072'0.064-0.08
-0.188-0.195
71727374757677
54545454545454
6.56.56.56.56.56.56.5
10203060120180240
0.8920.899o.7280.6060.602o.270o.117
-0.05-0.046-0.138-0.218-0.220-0.569-0.934
54545454545454
7879808182B384
6.06.06.06.06.06.06.0
10203060't20180240
0.6960.8280.820.728o.7710.5860.354
-0.158-0.082-0.086-0.138-0.113-o.232-o.4s2
8586
54545454545454
87
5.55.55.55.55.55.55.5
10203060120180240
0.7970.7640.7640.6790.2570.0670.034
-0.099-o.117-0.117-0.168-0.591-1.174-1.475
88899091
136

L. mono cyto g enes continued
No. f fC) pH time (s) N I No log (w/ ^ro)
10203060120180240
92939495969798
54545454545454
5.05.05.05.05.05.05.0
0.6240.5610.5260.2630.1200.0800.009
-0.205-0.251-o.279-0.581-0.921-1.096-2.071
99100101102103104105
4.54.54.54.54.54.54.5
10203060120180240
0.9150.7700.7310.4190.1630.0035E-04
-0.039-0.114-0.136-0.378-0.788-2.505-3.312
54545454545454
106107108109110111
112
4.04.04.04.O4.04.O4.0
10203060120180240
0.5250.1870.1970.1460.0037E-041E-04
-0.28-0.729-o.707-0.837-2.519-3.137-3.837
54545454545454
113114115116117118119
7.57.57.57.57.57.57.5
10203060120180240
0.737o.5740.4350.3950.1220.1170.099
-0.133-0.241-0.362-0.403-0.915-0.931-1.004
56565656565656
120121122123124125126
7.07.07.07.07.07.07.O
10203060',20180240
0.8970.7110.6810.5650.3950.35s0.1 19
-0.047-0.148-0.167-0.248-0.403-0.450-0.924
56565656565656
127128129130131132133
10203060120180240
0.849o.7870.8630.5990.3500.3290.286
-0.071-0.104-0.064-0.223-0.456-0.483-o.544
6.56.56.56.56.56.56.5
56565656565656
134135136137138
6.06.06.06.06.0
10203060120
1.1030.8990.8470.770o.704
0.043-0.046-0.072-0.1 14-0.153
5656565656
139140
565656
5.55.55.5
102030
0.1800.0860.070
-0.745-1.065-1.154
137
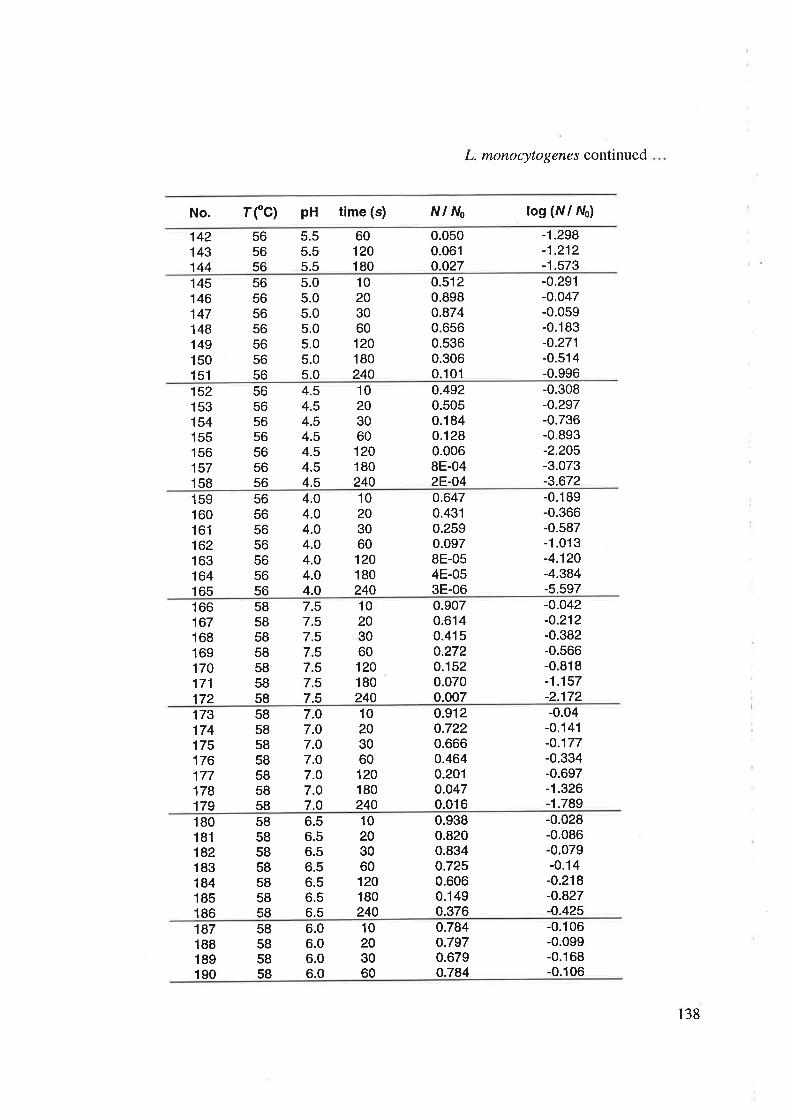
L. monocyto genes continued
No. rCC) pH time (s) N I No log (M fVo)
60120180
142143144
565656
5.55.55.5
0.0500.061o.o27
-1.298-1.212-1.573
145146147148149150151
5.05.05.05.05.05.05.0
10203060't20180240
0.5120.8980.8740.6560.5360.3060.101
-0.291-0.o47-0.059-0.183-0.271-0.514-0.996
56565656565656
152153154155156157158
4.54.54.54.54.54.54.5
10203060120180240
0.4920.5050.1840.1280.0068E-04zE-O4
-0.308-0.297-0.736-0.893-2.205-3.073-3.672
56565656565656
159160161162163164165
4.04.04.04.04.O4.04.O
10203060120180240
0.6470.4310.2590.0978E-054E-053E-06
-0.189-0.366-0.587-1 .013-4.120-4.384-5.597
56565656565656
166't67168169170171172
7.57.57.57.57.57.57.5
10203060120180240
0.9070.6140.4150.2720.1520.0700.007
-0.o42-0.212-0.382-0.566-0.818-1.157-2.172
58585858585858
173174175176177178179
7.07.07.07.07.07.07.0
10203060120180240
0.9120.7220.666o.4640.2010.o470.016
-0.04-0.141-0.177-0.334-0.697-1.326-1.789
58585858585858
180181182183184185186
6.56.56.56.56.56.56.5
10203060120180240
0.9380.8200.834o.7250.6060.1490.376
-0.028-0.086-0.079-0.14-0.218-0.827-0.425
58585858585858
't87188189190
6.06.06.06.0
0.7840.7970.6790.784
-0.106-0.099-0.168-0.106
10203060
58585858
138

L.monocyto genes continued .
No. rfc) pH time (s) N I No log (fVl wo)
191192193
585858
6.06.06.0
120180240
0.499o.3720.034
-0.302-0.430-1.463
194195196197198199200
5.55.55.55.55.55.55.5
10203060120180240
0.7890.732o.4780.3840.2430.0100.003
-0.103-0.136-0.321-0.416-0.615-2.O20-2.592
58585858585858
201202203204205206207
5.05.05.05.05.05.05.0
10203060120180240
1.0710.8730.705o.6240.2670.0085E-05
0.030-0.059-0.152-0.205-0.573-2.089-4.325
58585858585858
208209210211212213214
4.54.54.54.54.54.54.5
10203060120180240
0.2690.2130.0380.0690.0073E-043E-06
-0.571-0.672-1.421-1 .158-2.144-3.530-5.500
58585858585858
215216217218219220221
4.04.04.04.O4.04.04.0
10203060120180240
0.2360.2090.2090.0409E-052E-064E-07
-0.628-0.680-0.681-1.399-4.052-5.727-6.427
5858585858585860606060606060
222223224225226227228
7.57.57.57.57.57.57.5
10203060120180240
0.6840.4900.392o.3440.0108E-05
-0.165-0.310-o.407-0.464-1.992-4.083-5.9211
60606060606060
229230231232233234235
7.07.O7.07.O7.O7.07.0
10203060120180240
0.6460.5310.9090.5630.14o.o22
-0.190-0.275-0.041-0.249-0.854-1.652
1
10203060
60606060
236237238239
6.56.56.56.5
o.9770.6170.5890.269
-0.010-0.210-0.230-0.570
139

L. monocytogenes continued ...
No. rfo) pH time (s) N I No log (w/ rÚo)
-1.020-2.210-4.693
240241242
6.56.56.5
120180240
0.0950.0062E-05
606060
243244245246247248
6.06.06.06.06.06.0
10203060120180
0.4580.0770.0110.0070.0013.7E-6
-0.339-1.1 1 6-1.971-2.135-2.983-5.433
60606060606060606060606060
249250251252253254255
5.55.55.55.55.55.55.5
10203060120180240
o.7e10.4250.3310.2290.0068E-058E-08
-0.136-0.372-0.48-0.64-2.21-4.117-7.097
256257258259260261
5.05.05.05.05.05.0
203060120180
o.6740.6670.5160.1800.007zE-O4
-0.171-0.176-0.287-0.745-2.152-3.807
10606060606060
262263264265266267
4.54.54.54.54.5
10203060120180
0.458o.2520.1370.0145E-058E-06
-0.339-0.599-0.863-1.840-4.314-5.107
606060606060 4 .56060606060
268269270271272
4.04.O4.O4.04.O
10203060120
0.4580.5030.0260.0037E-08
-0.339-0.298-1.59-2.583-7.187
273274275276277
7.57.57.57.57.5
10203060120
0.6670.5780.3360.o221E-08
-0.176-0.238-o.474-1.660-7.886
62626262626262626262
278279280281282
7.O7.O7.07.O7.O
10203060120
0.4210.2020.0043E-051E-06
-0.376-0.696-2.374-4.583-5.884
283284285286287
6.56.56.56.56.5
10203060120
0.8010.5720.2670.0312E-07
-0.096-0.243-0.573-1.503-6.642
6262626262
140
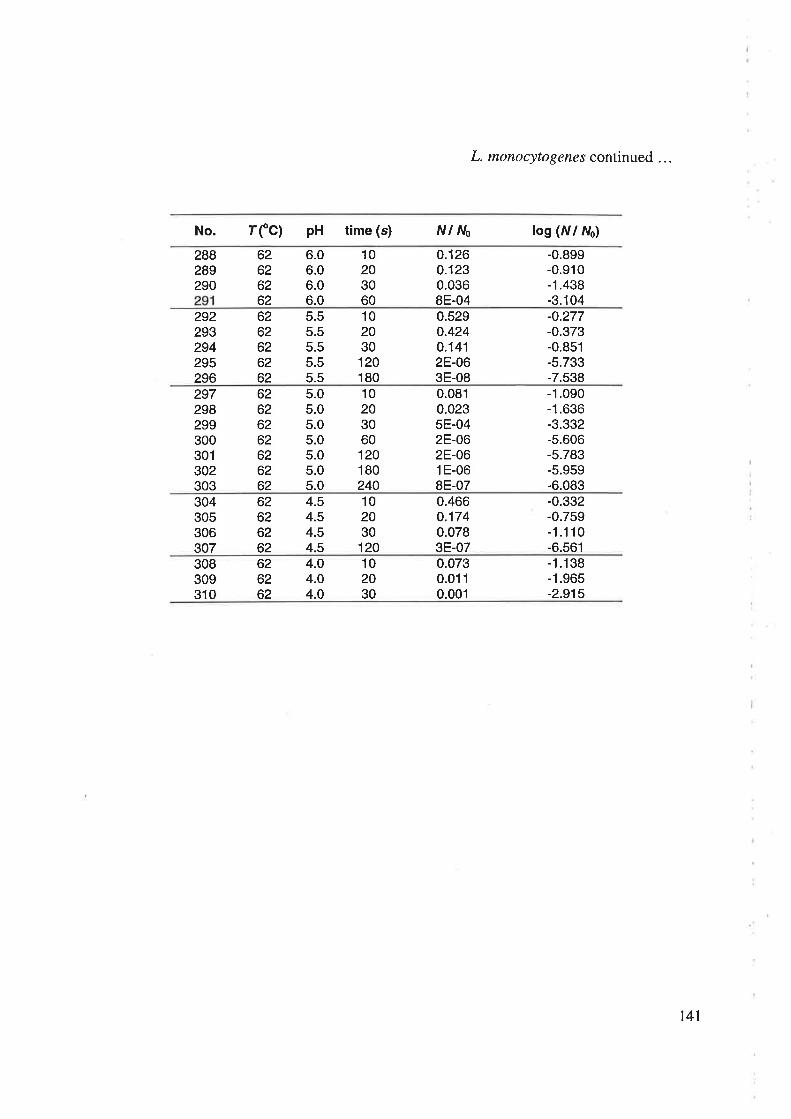
L. monocytogenes continued ...
No. rfc) pH time (s) N I No log (w/ ruo)
292293294295296
102030120180
0.1260.1230.0368E-040.5290.4240.1412E-063E-08
-0.899-0.910-1.438-3.104-0.277-0.373-0.851-5.733-7.538
62626262
288289290
6262626262
6.06.06.06.0
10203060
5.55.55.55.55.5
297298299300301302303
62626262626262
5.05.05.05.05.05.05.0
10203060120180240
0.0810.0235E-042E-062E-061E-06BE-07
-1.090-1.636-3.332-5.606-5.783-5.959-6.083
304305306307
4.54.54.54.5
2030120
10 0.4660.1740.0783E-07
-0.332-0.759-1.1 1 0-6.561
62626262
308309310
4.O4.04.0
0.0730.0110.00'l
-1.138-1.965-2.915
626262
102030
t4l
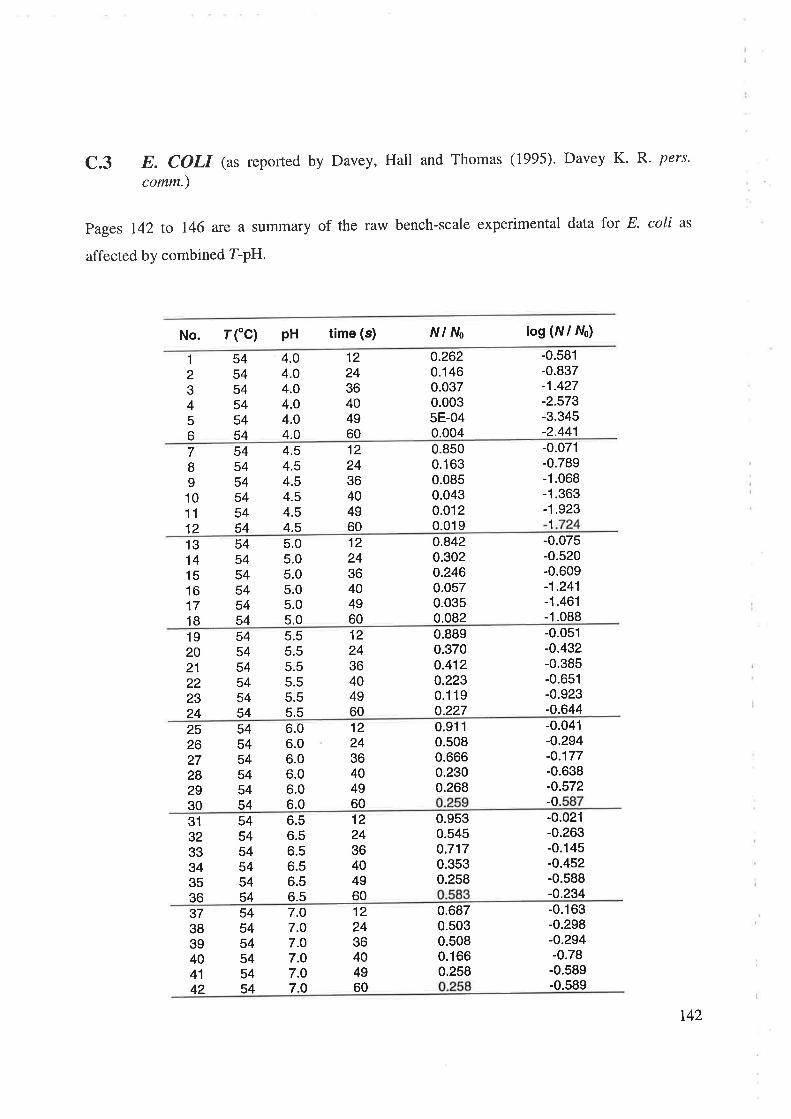
C.3 E. COLI (as reported by Davey, Hall and Thomas (1995). Davey K' R' pers'
comm.)
pages 142 to 146 are a summary of the raw bench-scale experimental data for E. coli as
affected by combined T-PH'
No. rcc) pH time (s) N I No log (w/ ^ro)
122436404960
545454545454
1
23456
4.04.04.04.O4.O4.O
0.2620.1460.0370.0035E-040.004
-0.581-0.837-1.427-2.573-3.345-2.441
7I91011
12
545454545454
4.54.54.54.54.54.5
0.8500.1630.0850.0430.0120.019
-0.071-0.789-1.068-1.363-1.923
't22436404960 1
131415161718
122436404960
545454545454
5.05.05.05.05.05.0
o.8420.302o.2460.0570.0350.082
-0.075-0.520-0.609-1.241-1.461-1.088
545454545454
192021222324
5.55.55.55.55.55.5
0.8890.3700.4120.2230.1 190.227
-0.051-0.432-0.385-0.651-0.923-0.644
1224364049601254
5454545454
252627282930
6.06.06.06.06.06.0
0.9110.5080.6660.2300.268
-0.041-0.294-0.177-0.638-o.572
2436404960 -0
12545454545454
313233343536
6.56.56.56.56.56.5
0.9530.5450.7170.3530.258
-0.021-0.263-0.145-0.452-0.588-o.234
2436404960
373839404142
122436404960
545454545454
7.O7.07.O7.07.O7.0
0.6870.5030.5080.1660.258
-0.163-0.298-0.294-0.78
-0.589-0.589
t42

E. coli continued
No. rfc) pH time (s) Nl No log (fvl No)
434445464748
122436404960
545454545454
7.57.57.57.57.57.5
0.621o.2640.1590.1260.106o.077
-0.207-0.578-0.799-0.899-0.974-1.116
1020304050
5656565656
495051
5253
4.04.04.04.O4.0
0.0040.0050.0060.0029E-05
-2.434-2.28-2.249-2.736-4.038
5656565656
5455565758
4.54.54.54.54.5
o.0420.1219E-040.0023E-04
-1.378-0.919-3.055-2.811-3.561
10203040501020304050
5656565656
596061
6263
5.05.05.05.05.0
0.0640.1880.0010.0076E-04
-1 .194-0.725-2.878-2.134-3.260
1020304050
5656565656
6465666768
5.55.55.55.55.5
0.1310.2149E-040.0300.003
-0.881-0.670-3.031-1.522-2.575
1020304050
5656565656
6970717273
6.06.06.06.06.0
0.2080.0830.0020.0350.008
-0.682-1.079-2.708-1.457-2.088
1020304050
5656565656
7475767778
6.56.56.56.56.5
0.166o.0720.0020.0310.006
-0.78-1.145-2.611-1.sl3
1
1020304050
5656565656
7980818283
7.07.O7.O7.O7.O
0.1850.0210.0030.0100.004
-0.733-1.670-2.585-2.003
1020304050
5656565656
8485868788
7.57.57.57.57.5
0.1210.0060.0030.0022E-04
-0.918-2.249-2.484-2.615
585858
899091
4.04.O4.0
I1624
0.0044E-05
-2.436-4.410
9E-09
t43

E. coli continued
No. rcc) pH time (s) w/M log (^r/ ^ro)
2E-082E-08
5858
9293
4.04.O
3240
-7.812-7.812
I16243240
5858585B58
9495969798
4.54.54.54.54.5
0.0140.0029E-072E-068E-07
-1.858-2.807-6.049-5.636-6.110
99100101102103
I16243240
5858585858
5.05.05.05.05.0
0.0130.0029E-078E-064E-06
-1.899-2.701-6.047-5.114-5.415
104105106107108
5.55.55.55.55.5
0.0060.0063E-041E-053E-06
-2.254-2.213-3.553-5.000-5.511
5858585858
I16243240
109110111112113
I16243240
5858585858
6.06.06.06.06.0
0.0050.0035E-065E-058E-06
-2.312-2.533-5.308-4.329-5.073
114115116117118
6.56.56.56.56.5
0.0020.0011E-043E-05
-2.632-2.934-3.879-4.480-7.8't2
I16243240
5858585858
119120121't22123
7.07.07.07.07.O
0.0024E-043E-061E-057E-06
-2.618-3.369-5.572-4.967-s.160
816243240
5858585858
124125126127't28
I16243240
5858585858
7.57.57.57.57.5
3E-045E-052E-052E-062E-08
-3.517-4.277-4.783-5.812-7.812
129130131132133
4.04.04.04.04.0
8E-041E-081E-081E-08
-3.099-7.870-7.870-7.967
6060606060
612182430 5 -6
134135136137138
4.54.54.54.54.5
9E-042E-067E-O72E-065E-07
-3.031-5.693-6.166-5.793-6.265
6060606060
612182430
139140
6060
5.05.0
-2.618612
0.002-5
144
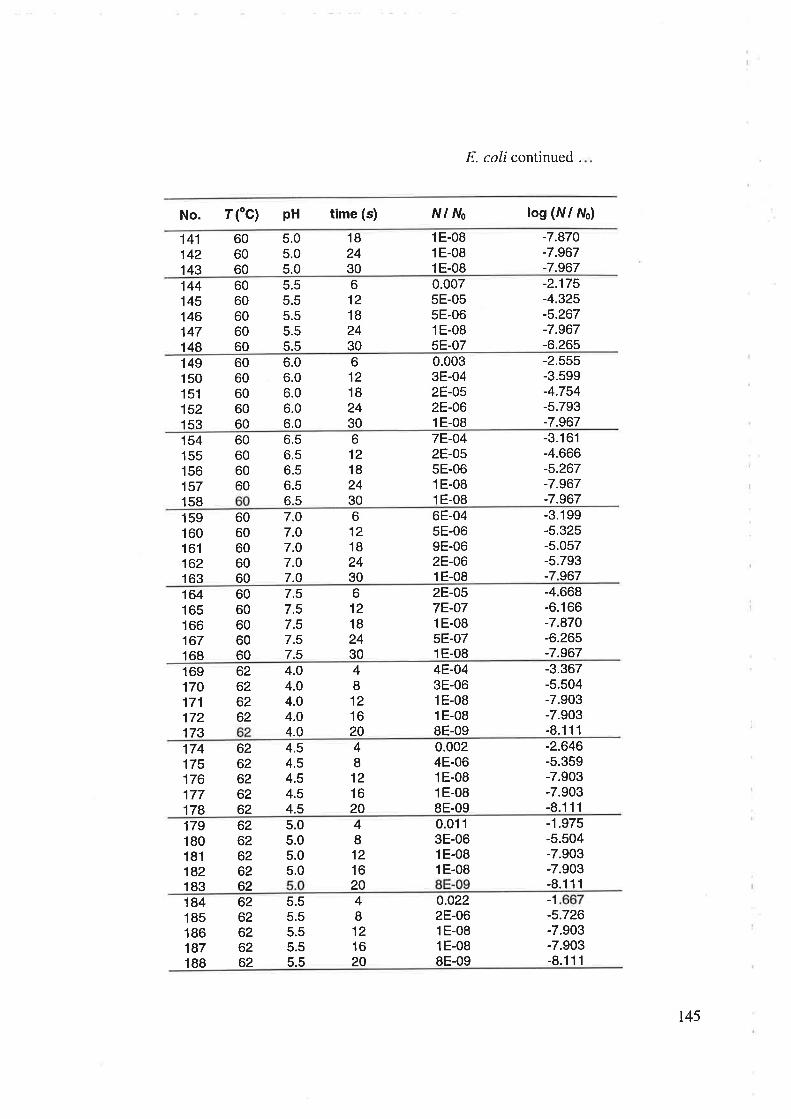
E. coli continued .
No. rfC) pH time (s) NlNo log (fvl ilo)
141142143
606060
5.05.05.0
182430
E-08E-08E-08
1
1
1
-7.870-7.967-7.967
144145146147148
5.55.55.55.55.5
0.0075E-055E-061E-085E-07
-2.175-4.325-5.267-7.967-6.265
6121B2430
6060606060
149150151152153
6.06.06.06.06.0
6060606060
612182430
0.0033E-042E-052E-061E-08
-2.555-3.599-4.754-5.793-7.967
154155156157158
612182430
60606060
6.56.56.56.56.5
7E-042E-055E-061E-081E-08
-3.161-4.666-5.267-7.967-7.967
159160161162163
7.07.07.07.07.0
6E-045E-069E-062E-061E-08
-3.199-5.325-5.057-5.793-7.967
6060606060
612182430
164165166167168
6060606060
7.57.57.57.57.5
612182430
2E-O57E-071E-085E-071E-08
-4.668-6.166-7.870-6.265-7.967
169170171172173
62626262
4.04.04.04.04.0
4E-043E-061E-081E-088E-09
-3.367-5.504-7.903-7.903-8.111
4I121620
174175176177178
4.54.54.54.54.5
0.0024E-061E-081E-088E-09
-2.646-5.359-7.903-7.903-8.111
6262626262
4I121620
179180181182183
5.05.05.05.0
5.55.55.55.55.5
0.0113E-061E-081E-08
0.o222E-061E-081E-088E-09
-1.975-5.504-7.903-7.903-8.111
184185186187188
4I1216204I121620
62626262626262626262
-1
-5.726-7.903-7.903-8.111
t45

E. coli continued
No. rfc) pH time (s) fvl l\r0 log (l{l t'ro)
4I121620
2E-047E-061E-081E-088E-09
189190191192193
6.06.06.06.06.0
0.0061E-051E-OB1E-088E-09
6262626262
-2.232-4.975-7.903-7.903-8.111
6262626262
9495969798
1
1
1
1
1
6.56.56.56.56.5
4I121620
-3.726-5.125-7.903-7.903-8.111
199200201202203
6262626262
7.07.07.07.07.0
4I't21620
1E-084E-066E-071E-088E-09
-7.967-5.426-6.200-7.903-8.111
204205206207208
6262626262
7.57.57.57.57.5
4I121620
sE-051E-081E-082E-068E-09
-4.269-7.903-7.903-5.726-8.111
146

APPENDIX D
SUMMARY OF LINEAR REGRESSION ANALYSIS FOR LINEAR'
ARRIIENIUS-DAVEY EQUATION TO BENCH-SCALE DATA AS
AFFECTED BY COMBINED T.PH
t47

D.1 INTRODUCTION
In this Appendix linear regression analyses are presented for all three bacteria studied as
affected by combined T-pH.
D.2 LINEAR REGRESSION ANALYSES FOR P. FLUORESCENS
Reeression Stttistics for Pseudomonas tluorescens (eq. 4.1)
Multiple R
R Square
Adjusted RSquareStandard ErrorObservations
0.9756240.951843
0.943
o.27814220
ANOVAdf ^ss
MS F F
Regression
Residual
Total
J
l619
24.46s731.237808
25.70354
8.1552430.o77363
105.4153 9.45F-tr
Cofficients StandardError
Lower95.07o
Upper95.}Vo
t Stat P-value Inwer 957o Upper 95Vo
Intercept 116.1818
2.557121-0.24988
-41684.9
lt.28223.03445
0.2635992319.757
t0.29780.842691
-0.94796-t'1.5164
l 82E-08
0.411819
0.3572517.3tB-12
92.26465-3.87563-0.80869
-46729.7
140.099
8.989867
0.308925
-36640
92.26465-3.87563-0.80869-46729.7
140.099
8.989867
0.308925
-36640
pHpHzVT
148
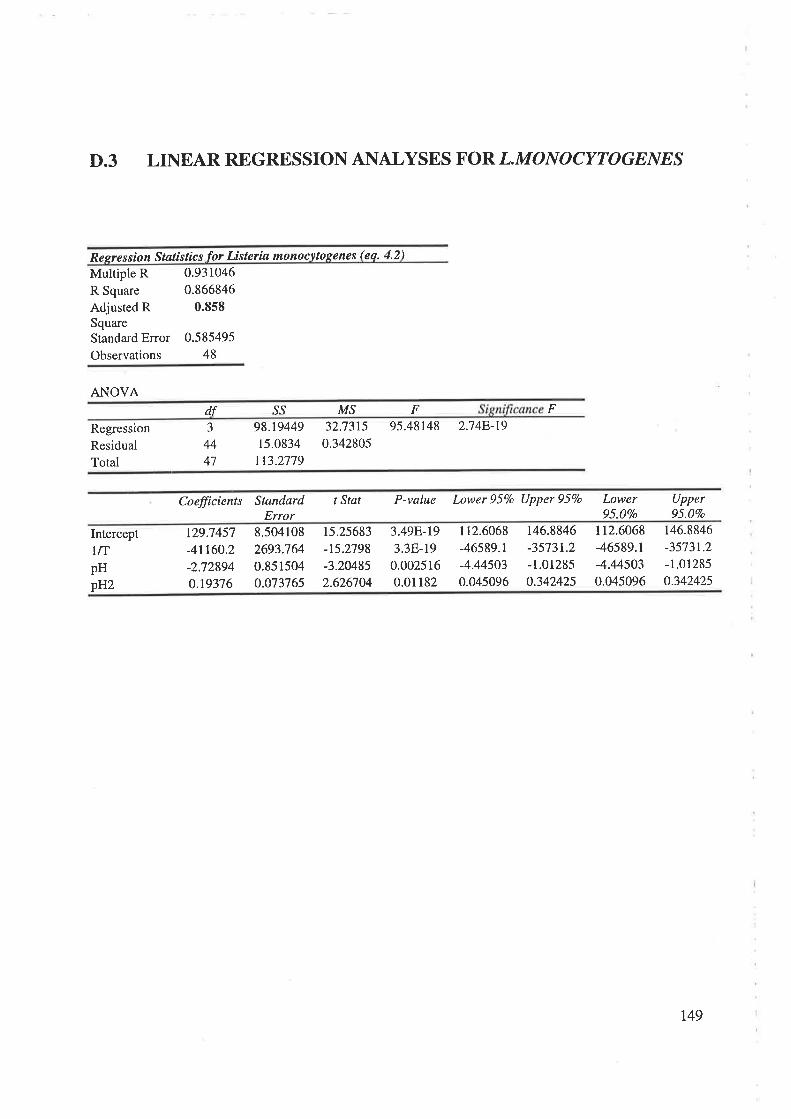
D.3 LINEAR REGRESSION ANALYSES FOR L.MONOCYTOGENES
Repression Statistics for Listeria monocvtogenes (eo.4.21
Multiple R
R Square
Adjusted RSquareStandard ErrorObservations
0,9310460.866846
0.858
0.585495
48
ANOVAdf .SS MS F F
Regression
Residual
Total
98.1944915.0834
113.2779
J
44
47
32.7315 95.48148 2.748-19
0342805
Cofficients StandardError
t Stat P-value htwer 95Vo Upper 957o lnwer95.}Vo
Upper95.07o
Intercept 129.7457
-41160.2
-2.728940.19376
8.504108
2693.764
0.8515040.o73765
15.25683
-15.2798
-3.204852.626704
3.49F-193.38-19
0.002516
0.01182
I12.6068-46589. I-4.445030.045096
146.8846
-35731.2
-1.01285
0.342425
112.6068
-46589.1
-4.445030.045096
146.8846
-3573r.2-1.01285
o.342425
tnpHpHz
r49

D.4 LINEAR REGRESSION ANALYSES FOR E. COLI
Reeression Støtistics for Escherichia coli kq. 4.31
Multiple R
R Square
Adjusted RSquareStandard ErrorObservations
0.963663o.928646
0.923
0.34243540
ANOVAdf ss MS F Sipnifrcance F
Regression
Residual
Total
54.93988
4.22141559. l6l3
J
36
39
18.31329 156.r7480.117262
1.08E-20
Cofficients StandardError
t Stat P-value Lower 95Vo Upper 95Vo Lower95.}Vo
Upper95.}Vo
Intercept 138.78 1
-44866.4
-t.523290.124435
6.516899
2096.977
0.5455460.04726
21.29557
-2t.3958-2.79222
2.632951
5.428-224.648-220.008328
o.012393
t25.5642-49119.3
-2.629710.028586
15t.9979-40613.6
-0.4t687o.220283
t25.5642-491t9.3-2.629710.028586
151.9979
-40613.6
-0.4t687o.220283
tnpHpHz
150
APPENDIX E
ST]MMARY OF LINEAR REGRESSION ANALYSES FOR LOG-
LINEAR, NO'E AND CDT MODELS TO BENCH.SCALE DATA AS
AFFECTED BY ? AND COMBINED T.PH
151

8.1 INTRODUCTION
This Appendix presents linear regression analyses for log-linear forms, CDT model and nOE
model, for data I and T-pH dependent, for all three bacteria studied.
8.2 LINEAR REGRESSION ANALYSES FOR LOG.LINEAR AND
CDT MODELS TO CONTINUOUS SURVIVOR DATA FOR
E. COLI AS AFFECTED BY f (as reported by Davey and Wood (1984) K R
Davey pers. comm.)
Regression Statistics for I'og-Iinear I model, T dependent
Multiple R 0.9460862
R Square 0.895079
Adjusted R 0.881SquareStandard Error 0.3806512
Observations 18
ANOVAdr ss MS Significance FF
Regression
ResidualTotal
2
15
t7
18.541498 9.2707488 63982379 4.534E-08
2.t734302 0.1448953
20.7t4928
Cofficients StandardError
Inwer95.}Vo
Upper95.0Vo
t Stot P-value I'ower 951o Upper 957o
Intercept 24.996288 2.6688495 9.3659412 Ll75E-07 t9.307766 30.684809 19307766 30.684809
-1698.5285 161.84344 -10.494886 2.637F.08 -2043.4898 -1353.5671 -2043.4898 -1353.567r
2.0659674 o.2333o}g 8.8553774 2.4128-07 1.568698 2.5632368 1.568698 2.5632368VÎlnt
152

E. coli continued...
Regression Stttistics for l-og'linear 2 model, T dependent
Multiple R 0.954348
R Square 0.9107801
Adjusted R 0.890SquareStandard Error 0.3595308
Observations l7
ANOVAdr ss MS Significance FF
Regression
ResidualTotal
3
t3l6
17.154064 5.7 180213 44.235776 4.3e 8E-07
1.6804108 0.1292624
18.834475
Cofficients Standard t Stat P-vqlueError
lnwer 957o Upper 957o lnwer95.}Vo
Upper95.]Vo
IntercepttnlntlnlÆ
I 120.51 15
-13891. l0l2.1314687
218.06578
1020.5395 l.09'796 0.2921422
1t264.r66 -1.2332117 0.2393311
0.2362403 9.0224622 5.854E-07
203.50184 l.A7ß667 0.3034056
-1084.2296 3325.2526-38225.847 10443.645
t.62llo28 2.6418347
-22r.57312 657.70468
-1084.2296 3325.2526
-38225.847 10443.645
I.6211028 2.6418341
-221.57312 657.70468
Regression Statistics for CDT I model, T dependent
Multiple R 0.976/,083
R Square 09533732
Adjusted R 0.943
SquareStanda¡d Error 0.1190062
Observations 18
ANOVAdÍ ss MS F Significance F
Regression
ResidualTotal
4.0540980.19827454.2523725
1.351366
0.0141625J
t4t7
95.418828 1.474F-09
Cofficients Standard t Stst P-valueError
Lower95Vo Upper957o Lower95.07o
Upper95.07o
tnIntercept
tn2
-40.0926165039.2611-161390.860.9559735
32.528183 -1.232550r O.23804t9
3611j633 1.3954675 0.1846162
100026.84 -1.6134756 0.1289474
o.o7352 I3.OO29L 3.316E.09
-109.85869 29.67346 -109.85869 29.67346
-2705.9207 12784.443 -2705.9207 12784.443
-375927.29 53145.562 -375927.29 53145.562
0.7982887 1.1136583 0.7982887 1.1136583lnt
153

E. coli continued .
Regression Statistics for CDT 2 model, T dependent
Multiple R 09782236R Square 09569215Adjusted R 0.944SquareStandard Error 0.1187065
Observations 18
ANOVAss MS F Significance F
Regression
ResidualTotal
4.0691866
0.r8318594.2523725
4t3t7
1.0172967'72.19364 9.5778-09
o.ot40912
Cofficients StandardError
t Stat P-value I'ower 95Vo Upper 957o Lower95.}Vo
Upper95.}c/o
InterceptlntlnlTlntfT2(lnt)2
2.3185103
-3.7480742480.62838
-20866.327
0.4835537
1.5817379
11.223853
1222.8813
33790.339
0.1787495
1.4657993
-0.3339383
0.3930294-0.6175235
2.705203
0.16646940.74375160.700667
0.54755450.0180143
-1.098626-27.995729
-2161.2456
-93865.9020.0973889
5.7356467
20.49958t3r22.502452133.248
0.8697185
-1.098626-27.995729
-216r.2456-93865.9020.0973889
5.7356467
20.499581
3122.5024
52133.248
0.8697185
Regression Statistics for CDT model, T dependent
Multiple R 0.9790413
R Square 0.9585219
Adjusted R 0.946SquareStandard Error 0.1164805
Observations 18
ANOVA
dl ss MS F Significance F
Regression
ResidualTotal
413
t7
4.0759924 1.0189981 75.104694 7.4998-09
0.1763801 0.0135677
4.2523725
Cofficients StandsrdError
Lower95.0Vo
Upper95.07o
t Stst P-value Inwer 957o Upper 957o
Interceptlntlnt/T(lnt)2(lnt)2/T
1.45544465.8655971
-396.02788-0.374908841.860578
1.7301821
3.0863078
129.54953
0.9118415
44.t82278
0.8412089
1.9005224
-3.0569611
-0.4111557
0.9474518
0.4154368
o.0797679
o.00917620.6876556
0.3606887
-2.2823859-0.8019642-67590258-2.3448222-53.589411
5.193275212.533158
-l 16.15319
1.5950046
137.31057
-2.2823859 5.1932752-0.8019642 t2.533158-675.90258 -116.15319-2.3448222 1.5950046
-53.58941t t37.31057
t54

8.3 LINEAR REGRESSION ANALYSES FOR NOE MODEL TO
BENCH-SCALE SURVIVOR DATA FOR L. MONOCYTOGENES
AS AFFECTED BY COMBINED T.PH
Regression Statistics for nOE, T'pH dependent (without
52'C)Multiple RR Square
Adjusted R Square
Standard Error
Observations
0.946554
0.895964
0.895
o.985024
236
ANOVAdf ss MS F Significance F
Regression
Residual
Total
J
232
235
1938.598
225.1032
2163.70r
646.1993 665.9978 1.lE-l l30.970272
Cofficients StandardError
t Stat P-value Lower 95Vo Upper 957o Lower95.0Vo
Upper95.0Vo
Intercept 69.72363
-24294.4
-0.3377
t.074025
7.9567452656.32t0.058206o.024467
8.762834-9.14588
-5.8018643.8965
4.098-163.tE-172.148-082.3F-tt4
54.04691
-29528
-0.452381.025818
85.40035
-19060.8
-o.22302
r.12223r
54.04691
-29528
-0.452381.025818
85.40035
-19060.8
-0.22302
1.t22231
tnpHn
155
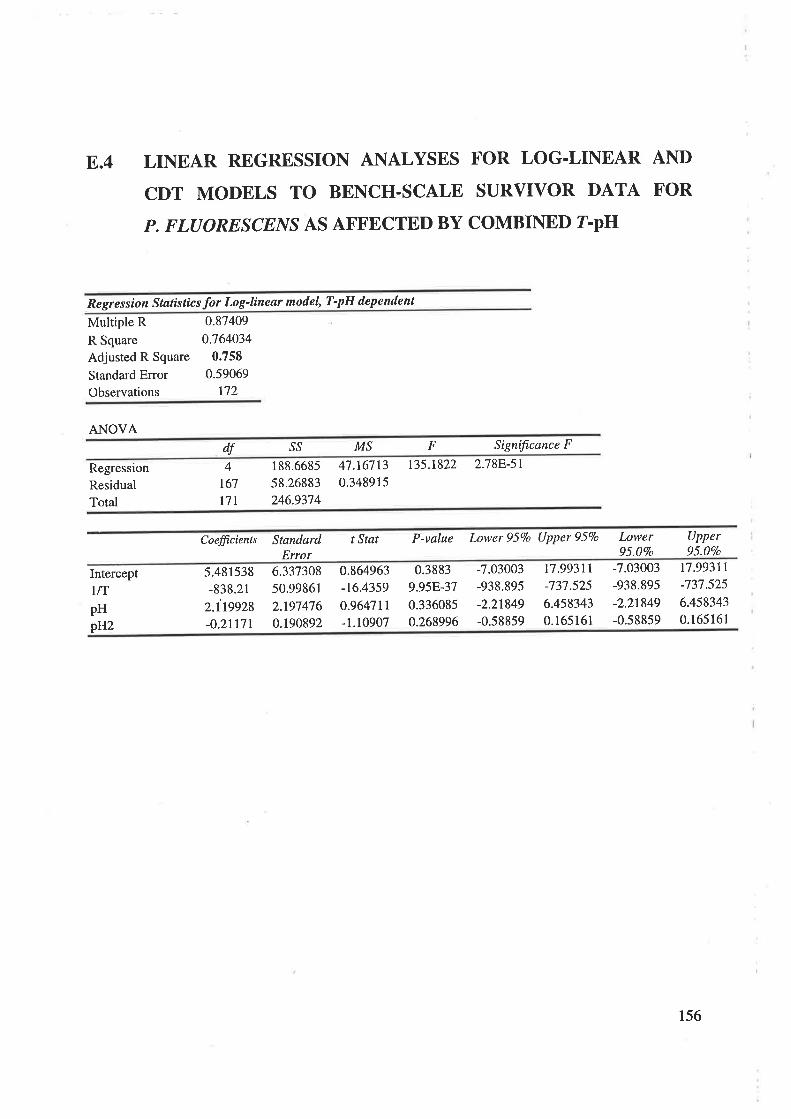
8.4 LINEAR REGRESSION ANALYSES FOR LOG.LINEAR AND
CDT MODELS TO BENCH.SCALE SURVIVOR DATA FOR
P. FLUORESCENS AS AFFBCTED BY COMBINED T.PH
Re gre s sion S latistic s for Lo g'line ar model, T-pH dependent
Multiple RR Square
Adjusted R Square
Standard ErrorObservations
0.87409
0.7640340.758
0.59069
172
ANOVAdf ss MS Significance FF
Regression
ResidualTotal
4
r67t7t
188.6685
58.26883
246.9374
47.167130.348915
135.1822 2.788-5t
Cofficients StandardError
t Stat P-value I'awer 957o Upper 95Vo Inwer95.07o
Upper95.07o
IntercepttnpHpIIZ
5.481538
-838.21
2.í1s928-o.2lL7t
6.33730850.99861
2.t974760.190892
0.864963
-t6.43590.9647rr-1.10907
0.3883
9958-370.336085
o.268996
-7.03003
-938.895
-2.2t849-0.58859
17.99311
-737.525
6.4583430.165161
-7.03003
-938.895
-2.21849-0.58859
17.99311
-737.525
6.4583430.165 l6 I
156

P. fluoresc¿r¿s continued ...
Regression Statistics for CDTI model" T-pH dependent
Multiple R
R Square
Adjusted RSquareStandard ErrorObservations
0.8047r50.647566
0.639
0.3r3413172
ANOVAss MS Significance FF
Regression
Residual
Total
4167
t7t
14098
16/040346.5450r
7.53s2450.098228
76.712 8.35E-37
Cofficients StandardError
Inwer95.0Vo
Upper95.}Vo
t Stat P-value I'ower 95Vo Upper 95Vo
InterceptInpHpHzlnt
4.688779-341.8190.265667
-0.030440337213
3.362497
2't.05923l.1659530.101285
0.025913
1.394434-12.6323o.227854-0.30057
13.0t349
0.165039
4.t9F-260.820038
0.7641193.52E-27
-1.9497
-395.242-2.03624
-o.23Mt0.286055
tl.32'726-288.397
2.5675760.169521o.388372
-1.9497
-395.242-2.03624-0.2304r0.286055
11.32726
-288.397
2.5675760.1695210.388372
Regression Statistics for CDT2 model' T'pH dependent
Multiple R
R Square
Adjusted RSquareStandard ErrorObservations
0.875998
0.767373
0.756
o.254629172
ANOVAdf ss MS Significance FF
Regression
ResidualTotal
5
167
t72
35.71739r0.8276246.54501
7.1434770.064836
tto.t775 7.288-5r
Cofficients t Stat P-vslue Lower95Vo Upper9íVo Lower UpperStanderdError 95 95.
Interceptlntlnt/TpHlnt(pHlnt)2lnt2
01.356301
-89.12420.016101
-0.00067
0.082754
#N/A0.265977
5.028908
0.0436360.000791
o.026733
#N/A5.099314-r7.72240.368978
-0.8525
3.095611
#N/A9.17E.-07
3.26E-40o.7t26ll0.395158
0.002304
#N/A0.83119
-99.0526-0.07005
-o.00224o.029976
#N/A1.881412
-79.1958o.1022490.000888
0.135531
#N/A0.83119-99.0526-0.07005
-o.00224o.029976
#N/A1.881412
-79.t958o.1022490.000888
0.13553 1
157

P. fluoresc¿ns continued .
Regression Statistics for CDT model, T-pH dependent
Multiple R
R Square
Adjusted RSquareStandard ErrorObservations
0.9658320.932831
0.930
0. I 3765 l172
ANOVA
dÍ ss MS F Significance F
Regression
Residual
Total
43.41864
3.t2636846.s4501
6
165
t7t
1.23644 381.9168 5.368-94
0.018948
Cofficients StandardError
Lower95.07o
Upper95.}Vo
t Stat P-value k¡wer 957o Upper 95Vo
Intercept
lntlnt/TlnüT2(lnt)2(lnt)2ffpH(lnt)2
r.84329.774723
-1388.7343597.77
1.250137
-58.7135
-0.00443
o.222774
L 153358
128.84123632.O22
0.06463
3.4296680.000861
8.27384
8.47501
-10.7786
12.00372t9.3431
-17.1193-5.14912
4.15F-14
1.258-14
7.628-212.928-242.8F-442.018-387.38F-07
t.403344
7.497481
-1643.12
36426.5s
1.t2253-65.4851
-0.00613
2.283056
t2.05197
-tt34.3450769
1.377745
-51.9418
-0.00273
1.403344
7.497481
-1643.12
36426.55
t.12253-65.4851
-0.006r3
2.283056
12.05t97
-1134.34
50769
t.37774s-51.94r 8
-o.00273
158

E.5 LINEAR REGRESSION ANALYSES FOR LOG.LINEAR AND
CDT MODELS TO BENCH.SCALE SURVIVOR DATA FOR
L. MONOCYTOGENES AS AFFECTED BY COMBINED T-pH
Re gre s s io n Støtis tic s fo r Log-Iineør model, T-pH dependent
Multiple R
R Square
Adjusted RSquareStandard ErrorObservations
0.861783
0.74267
0.739
o.773553310
ANOVAdf ,ss MS F Significance F
Regression
ResidualTotal
4
305
309
504.2768174.728r679.0048
126.06920.598384
210.6828 9.35E-85
Cofficients StandardError
Lower95.}Vo
Upper95.070
t Stat P-value Lower95Vo Upper95Vo
IntercepttnpHpHz
20.88214-932.38
-2.648830. l 89987
t.53526245.04359
0.4582460.03962
13.60168
-20.6995
-5.78036
4.79524
5.67F-333.27F-59
1.91E-08
2.59F-06
17.86056
-1021.03
-3.55071
0.1 t20l
23.90372-843.729
-1.746940.267964
17.86056
-102r.03-3.55071
0.11201
2390372-843.729
-t.746940.267964
r59
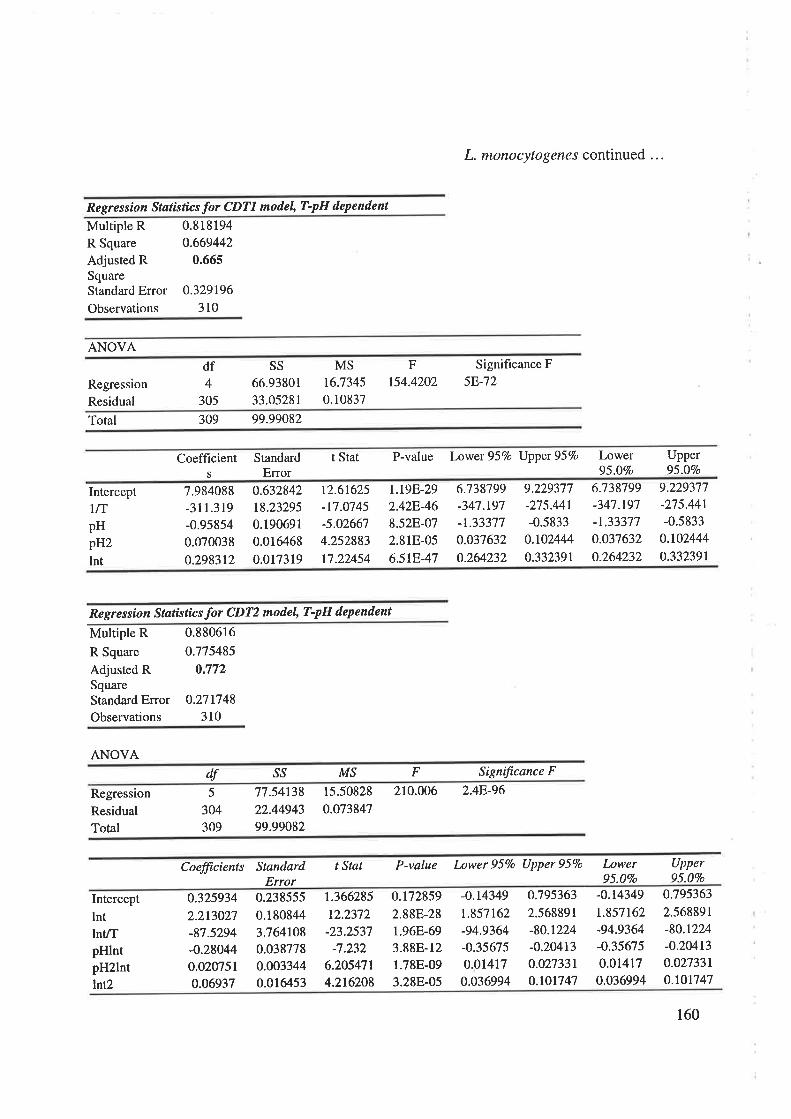
L. monocytogenes continued ...
Regression Støtistics for CDTI model, T'pH dependent
Multiple RR Square
Adjusted RSquareStandard ErrorObservations
0.8181940.669442
0.665
0.329196
310
ANOVA
Regression
Residual
df4
305
SS
66.93801
33.05281
F154.4202
Significance F5E-72
MS16.7345
0.10837
Total 309 99.99082
Coefficient Standards Error
t Stat P-value Lower 95Vo Upper 95Vo Lower95.OVo
Upper95.ÙVo
Intercept 7.984088
-311.319
-0.958540.070038
o.298312
0.63284218.23295
0.190691
0.016468
0.017319
12.61625
-17.0745
-5.02667
4.252883
t7.22454
t.t9E-292.428-468.52F-072.81E-05
6.518-47
6;t38799-347.r97-1.33377
0.037632
0.264232
9.229377-275.441-0.5833
0.102444
0.33239r
6;'t38799-347.t91-1.33377
o.o3'7632
0.264232
9.2293"Ì7-2',t5.441
-0_5833
0.t02444o.332391
tnpHpãzlnt
Regression Statßtics for CDT2 model, T'pH dependent
Multiple R
R Square
Adjusted RSquareStandard ErrorObservations
0.880616
o.775485
0.772
0.27r748310
ANOVAdr ss MS F Significance F
Regression
ResidualTotal
5
304309
77.54138
22.4494399.99082
15.50828
o.o7384'l
210.006 2.48-96
Cofficients StandardError
Lower95.0Vo
Upper95.}Vo
t Stet P-vqlue Lower 95Vo Upper 95%o
Intercept
lntlnlTpHlntpH2lntha
0.325934
2.213027
-87.5294-o.280440.0207510.06937
0.238555
0.180844
3.7641080.038778
0.003344
0.016453
1.366285
12.2372
-23.2537
-7.232
6.2054714.2t6208
0.t728592.88E-28
t.968-693.88E-121.78E-09
3.28E-05
-0.14349
1.857162-94.9364-0.35675
o.ot4t7o.036994
0.795363
2.568891
-80.1224
-0.204t30.027331o.tot74'l
-0.14349
t.857162-94.9364-0.35675
o.ot4t70.036994
0.795363
2.568891
-80.t224-o.2Mt30.0273310.101747
160

L. monocytogenes continued .
Regression Statßtics for CDT model' T'PH dependent
Multiple R
R Square
Adjusted RSquareStandard ErrorObservations
0.912368
0.832416
o.829
o.235555310
ANOVAdl ss MS Significønce FF
Regression
ResidualTotal
7
302309
83.23397
16.75685
99.99082
1 1.89057
0.055486
214.2975 4B-lt3
Coefficients StandardError
t Stat P-value I'ower 95Vo Upper 957o l¡¡wer95.}Vo
Upper95.}Vo
Intercept
lntlnt/Tlntfl2(lnt)2(lnt)21'r
pH(lnt)2(pH)2(lnt)2
0.506176
7.323082-891.765
25824.23
0.763473
-25.8543
-o.06972
o.005234
0.207672
1.138279
128. l 866
3654.0460.0684723.461394
0.00738
0.000636
2.437389
6.433471
-6.95677
7.067297
I l .1501 1
-7.46934
-9.44719
8.232792
0.01537r
4.88E-102.168-ll1.lE-11
2.07F-248.72E-13
9.968-t95.57E-15
0.09751
5.083r 19
-1144.02
18633.61
0.62873-32.6658
-0.08424
0.003983
0.91484
9.56304
-639.51333014.84
0.89822
-19.0428-0.05520
0.00648
0.09751
5.083119-1t44.o218633.61
0.62873-32.6658
-0.08424
0.003983
o.914843
9563045-639.51333014.84
0.898216
-19.0428
-0.0552
0.006484
161

8.6 LINEAR REGRESSION ANALYSES FOR LOG.LINEAR AND
CDT MODELS TO BENCH-SCALE SURVIVOR DATA FOR
E. COLI AS AFFECTED BY COMBINED T-pH (as reported by Davey,
Hall and Thomas (1995) K R Davey pers. comm')
Regression Støtistics for Log-lineør model, T'pH dependent
Multiple RR Square
Adjusted RSquareStandard ErrorObservations
0.903933
0.817095
0.813
0.502684208
ANOVAdr ss MS Significance FF
Regression
Residual
Total
229.1559
51.29622
280.452t
4
203207
57.28897 226.7r57
0.252691
t.tE-73
Cofficients StandardError
Lower95.07o
Upper95.0Vo
t Stat P-value Inwer 95Vo Upper 957o
Intercept 2936035-t444.71
-2.06438o.172587
1.24564249.48759
0.351194o.030424
23.57046-29.1934
-5.87817
5.672768
5.08E-60
1.368-74
1.68E-08
4.798-08
26.9043-1542.29
-2.75683o.tl26
31.81641
-1347.14
-1.371920.232574
26.90/3-1542.29
-2.75683o.tt26
31.8164r-1347.14
-1.37192
0.232574
tflpHpHz
r62

E. coli continued .
Regression Støtisti.cs for CDTI model' T'PH dependent
Multiple RR Square
Adjusted RSquareStandard Error
Observations
0.9463860.895646
0.894
0.213395208
ANOVAdf ss MS F Significance F
Regression
Residual
Total
4
203
207
79.339929.244093
88.58401
19.83498
0.045537
435.5755 2.28-98
Coefficients StandardError
Lawer95.0Vo
Upper95.0Vo
t Stat P-value Lower 957o Upper 95Vo
Intercept 17.80628
-850.237
-1.07567
0.090254
0.465294
0.528789
2r.008050.149086
0.012915
0.026242
33.67367
-40.4719
-7.2t5086.98816
t7.73062
4.958-853.8E-99
r.05E-113.928-lL4.ttB-43
16.76366
-891.659
-1.369620.0647890.413551
18.8489
-808.815
-0.78171
0. l 157 l90.517036
16.76366-891.659
-r.369620.064789
0.413551
18.8489
-808.815
-0.78171
0.1 15719
0.517036
tnpHpHzlnt
Regressíon Statistics for CDT2 model, T'pH dependent
Multiple RR Square
Adjusted RSquareStandard ErrorObservations
0.94378
o.89072
0.883641
o.218373208
ANOVAdr .s^s MS Signfficance FF
Regression
ResidualTotal
5
203208
78.90357
9.68M488.58401
15.78071
0.047687
330.9235 3.28F-95
Coefficients StandardError
Inwer95,0Vo
Upper95.07o
t Stat P-value Lower 95Vo Upper 95Vo
Intercept
lntlnt/TpHlnt(pHlnt)2lnt2
0
6.379356-278.858-0.351870.029176-0.01101
#N/A0.1782337.318847
0.049638
0.0043
0.010519
#N/A35.79214-38.1014
-7.08866
6.784895
-1.0468
#N/At.228-891.93E-942.19F.-IL1.258-100.29&35
#N/A6.027929-293.289-0.449740.020697
-0.03175
#N/A6.730783-264.427
-0.254
0.037655
o.oo9729
#N/A6.027929-293.289-o.44974o.020697-0.03175
#N/A6.730783-264.427
-0.254
0.037655o.009729
163
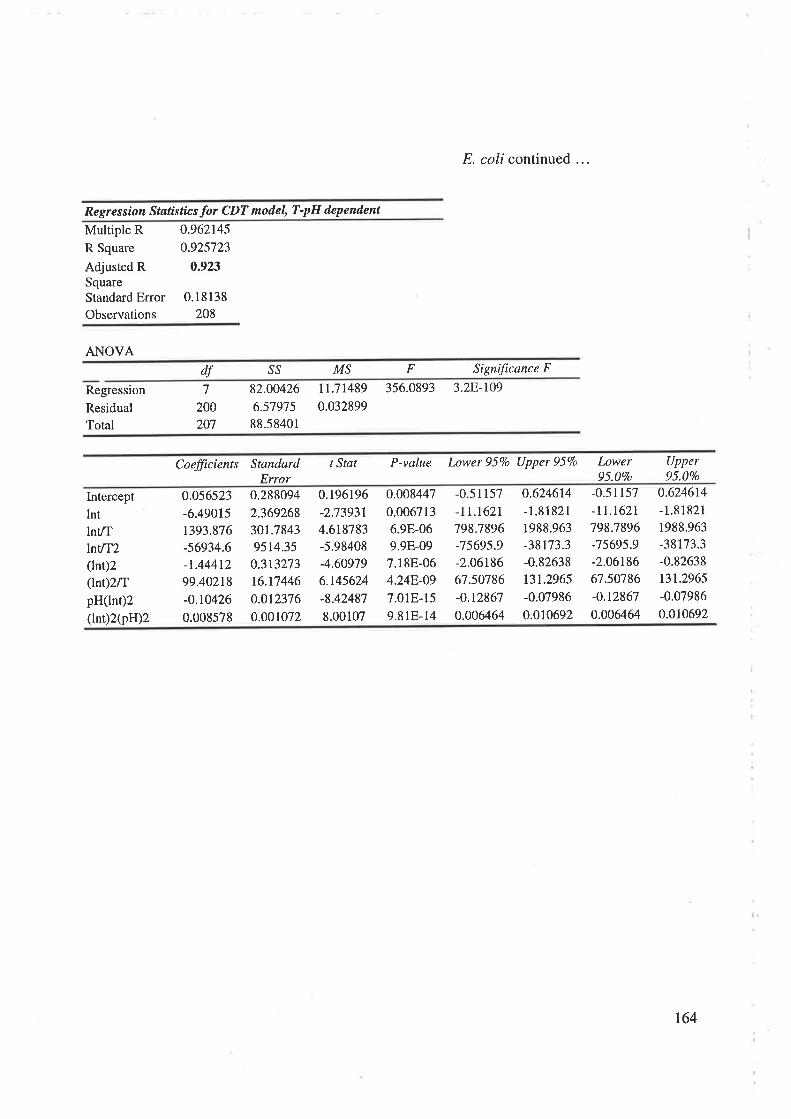
E. coli continued...
Regression Støtistics for CDT model, T-pH dependent
Multiple R
R Square
Adjusted RSquareStandard ErrorObservations
0.962t450.925723
0.923
0.1 8 138
208
ANOVAdl ss MS F Significance F
Regression
Residual
Total
82.00426
6.5797588.58401
7
200207
11.71489 356.0893 3.28-tO9
0.032899
Cofficients StøndardError
t Stat P-value I'ower 95Vo Upper 957o lnwer95.07o
Upper95.07o
Intercept
lntlnUTlnrtf2(lnt)2(lnt)2f|pH(lnt)2(lnt)2(pH)2
0.056523
-6.49015
1393.876
-56934.6
-r.4441299/0218-0.t04260.008578
0.288094
2.36926830t.78439514.35
0.3t3273t6.174460.012376
0.001072
0.196196
-2.739314.6t8783-5.98408
-4.60979
6.145624
-8.42487
8.00107
0.008447
0.006713
6.98-069.9F-097.18E-064.24E-09
7.01E-15
9.818-14
-0.51 157
-tt.t62t798.7896-75695.9
-2.0618667.50786
-o.t2867
0.006464
0.624614
-1.81821
1988.963
-38173.3
-0.82638
131.2965
-0.07986
0.010692
-0.51157
-tt.t62t798.7896-75695.9
-2.06186
67.50786
-0.12867
0.006464
0.6246t4-1.81821
r988.963
-38173.3
-0.82638
13t.2965
-0.07986
0.010692
r64
APPENDIX F
SIZING THE CONTINUOUS STERILISER LENGTH FROM BENCH.
SCALE DATA USING THE CDT MODEL FOR E. COLI
INACTIVATION AS AFFECTED BY COMBINED T.PH
165

F.1 INTRODUCTION
In this Appendix the critical coefficients are first calculated for E coli data, and the
performance equations for a continuous steriliser used to determine a value of the length of a
continuous steriliser for a lO-s reduction in number of viable cells for a range of temperature
and pH. A summary is given in Table F.3.
F.2 CeLCULATION OF THE CRITICAL COEFFICIENTS FOR THE
CDT MODEL FOR E. COLI FOR COMBINED T-pH BASED ON
BENCH.SCALE DATA
Calculation in the Tables below are based on the experimental data of Davey, Hall and
Thomas 1985).
t66

Table F.L Values of the critical coefficients of the CDT model for bench-scale data of
E. coli for combined effect T-pH
Temp pH 4.0ú)
pH 4.5 pH 5.0 pH 5.5("c) O ú) o ú.) O o o545658606270
-0.203o.2450.6180.9261.1801.803
o.l170.051-0.010-0.067-o.tzl-0.304
-0.2030.2450.6180.9261.1801.803
0.1010.035-0.026-0.083-0.136-0320
-0.2030.2450.61809261.1801.803
0.0900.024-o.037-0.094-0.148-0.331
-0.2030.2450.61809261.1801.803
0.0830.017-0.o44-0.101-0.155-0.338
(a) I range 54oC to 70oC; pH range 4.0 to 5.5
Temp pH 6.0 pH 6.5 pH 7.0 pH 7.5("c) (D O (r) o ú) O (ù ç)
545658606270
-0.2030.2450.6180.9261.1801.803
0.0800.014
-0.047-0.104-0.158-0.341
-0.2030.2450.6180.9261.1801.803
0.0810.016
-0.046-0.103-0.156-0.339
-0.2030.2450.6180926r.1801.803
0.0870.02r
-0.040-0.097-0.150-0.334
-0.2030.2450.6180.9261.1801.803
0.0970.031
-0.030-0.087-0.140-0.324
(b) Trange 54oC to 70oC; pH range 4.0 to 5.5
t67
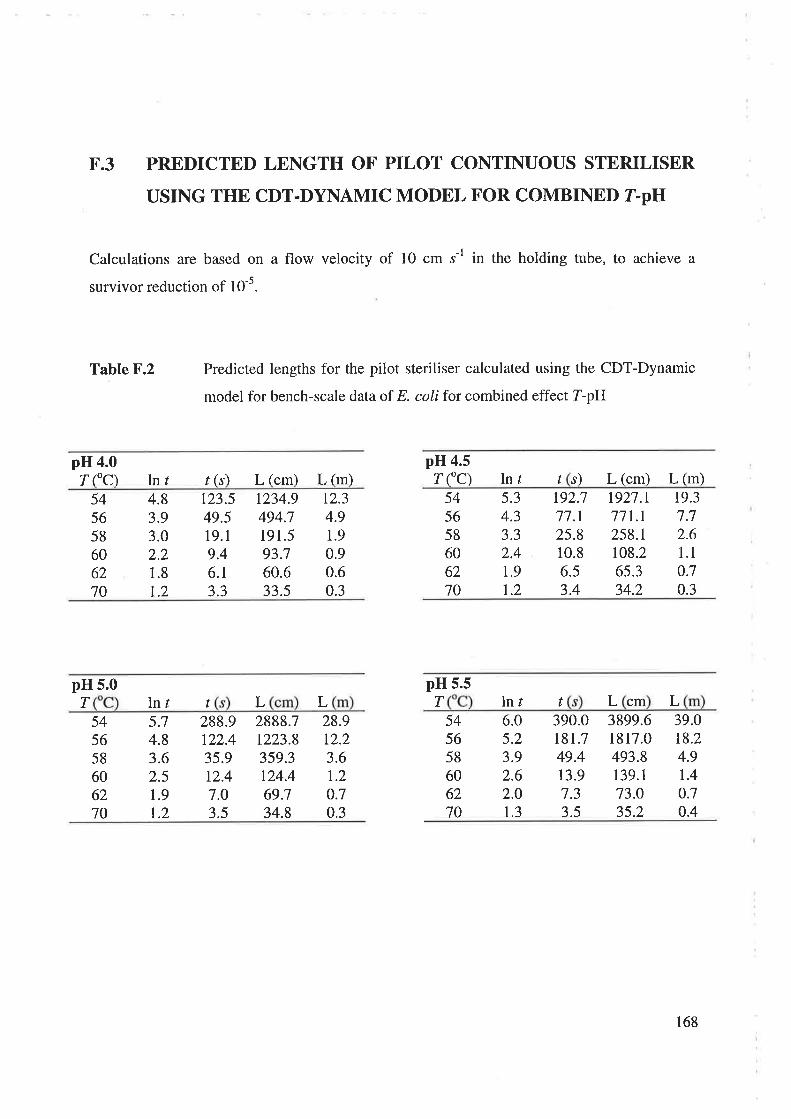
F.3 PREDICTED LENGTH OF PILOT CONTINUOUS STERILTSER
USING THE CDT.DYNAMIC MODEL FOR COMBINED T-PH
Calculations are based on a flow velocity of 10 cm "-' in the holding tube, to achieve a
survivor reduction of 10-5.
Table F.2 Predicted lengths for the pilot steriliser calculated using the CDT-Dynamic
model for bench-scale data of E. coli for combined effect Z-pH
pH 4.0r fc) lnt t(s) L(cm) L(m)
pH 4.5r cc) lnt t s) L(cm) L(m)
545658606270
4.83.93.02.21.8
1.2
t23.549.5
19.1
9.46.13.3
t234.9494.1191.593.160.633.5
t2.34.9t.90.90.60.3
5.34.33.32.4r.91.2
1,92.1
77.t25.810.8
6.53.4
1927.r711.r258.1
108.265.334.2
t9.37.12.61.1
0.70.3
545658606270
pH 5.0T ln/ t L
2888.1t223.8359.3r24.469.734.8
pH 5.5TL lnr t
6.05.23.92.62.01.3
cm LL545658
606270
545658606270
5.74.83.62.51.9t.2
288.9122.435.912.4
7.03.5
28.912.23.61.2
0.70.3
390.0l8l.l49.413.91.33.5
3899.61817.0493.8r39.173.035.2
39.01,8.2
4.91.4
0.70.4
168

Table F.2 continued
pH 6.0T CC) lnr /(s) L(cm) L (m)
pH 6.5r cc) lnf t ) L(cm) L(m)
545658606270
6.1
5.44.12.72.01.3
44.5
22.05.91.5
0.70.4
5456
58606270
6.05.34.02.72.01.3
41.519.85.3t.40.70.4
444.7220.258.9t4.77.53.5
4446.92202.3589.0t46.614.535.4
4t4.5t98.453.414.2
1.43.5
4t45.41983.8533.9142.5
73.735.3
pH 7.0r ("c) ln/ t ) L (cm) L (m)
pH 7.5T CC) lnr t(s) L(cm) L (m)
545658606270
5.84.93.72.62.01.3
32t.6140.139.9t2.97.13.5
3216.r1401.0398.6r29.370.935.0
32.214.04.01.3
0.10.3
5.44.53.42.4t.91.2
220.089.028.5I 1.3
6.73.4
2199.9890.3285.21 13.1
66.734.4
22.08.92.91.1
0.70.3
545658606270
169

A summary of the predicted steriliser holding tube length (L) for a range of combined T-pH
based on the CDT model derived from bench-scale inactivations of E coli in the selected
carrier liquid is given in Table F.3.
Table F.3 Predicted holding tube length for a range of combined I-pH for the
inactivation of E. coli in Carbopol carrier liquid from the newly synthesised
CDT model based on the bench-scale data
T('c)
L (m)pH 4.0 pH 4.5 pH 5.0 pH 5.5 pH 6.0 pH 6.5 pH 7.0 pII7.5
545658606270
12.3
4.91.90.90.60.3
19.3
7.72.61.1
0.70.3
28.912.2
3.6t.20.70.3
39.0t8.24.91.4
0.10.4
44.5
22.05.91.5
0.70.4
41.519.8
5.3t.40.7o.4
32.214.04.01.3
0.70.3
22.08.92.91.1
0.10.3
AverageL (m)
4 6 I4 10 79 13 15
170

APPENDIX G
SUMMARY OF CONTINUOUS STERILISER RAW DATA AND CDT
MODEL PREDICTIONS
r7l
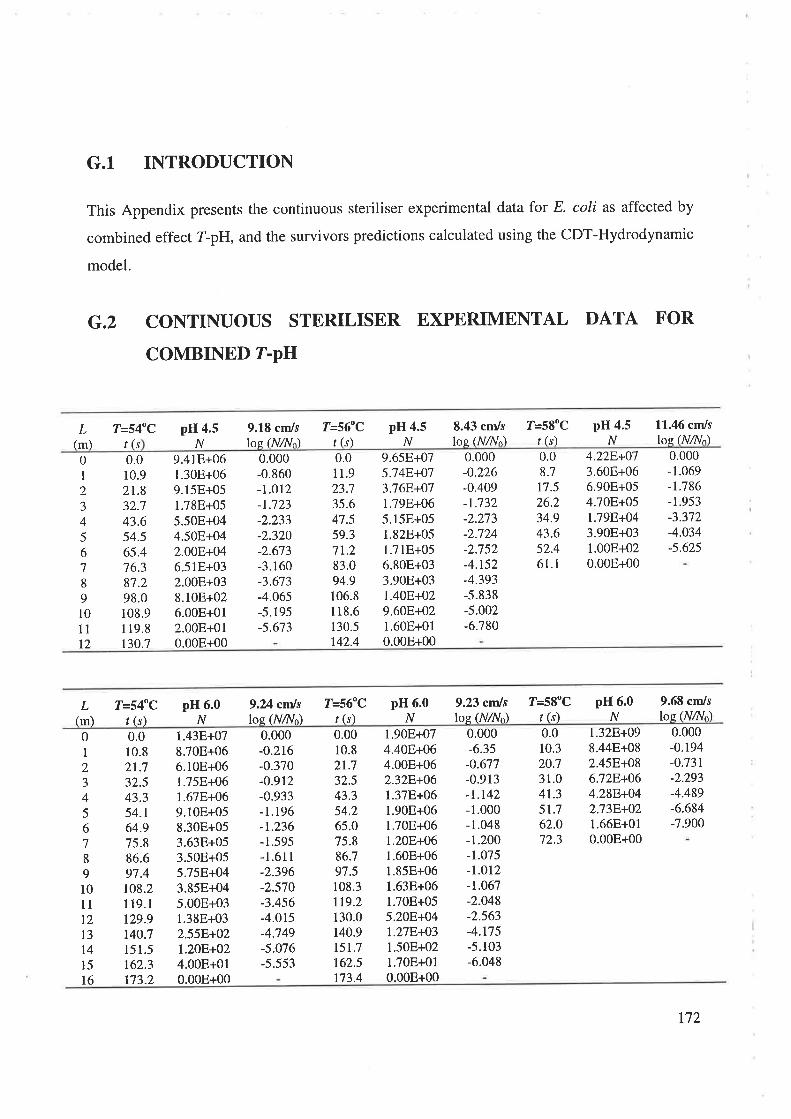
G.1 INTRODUCTION
This Appendix presents the continuous steriliser experimental data for E. coli as affected by
combined effect Z-pH, and the survivors predictions calculated using the CDT-Hydrodynamic
model.
G.2 CONTINUOUS STERILISER EXPERIMENTAL DATA FOR
COMBINED T'PH
L T=54"C pH 4.5N
9.18 cm/slos (N/No)
T=56"Cr (s)
pH 4.5N
8.43 cm/s T=58oCr (s)
pH 4.5N
11.46 cm/slos lNlNn)(m) t (s log (Nnl^)
0I23
45
678
9l0t1t2
0.010.921.832.743.654.565.416.381.298.0108.9119.8130.7
0.000-0.860-t.ol2-r;723-2.233-2.320-2.673-3.160-3.673-4.065-5.195-5.673
0.0I 1.9
23.735.647.559.3
71.283.094.9106.8118.6130.5142.4
0.000-0.226-0.409-1.732-2.273-2.724-2.752-4.t52-4.393-5.838-5.002-6.780
0.08.717.526.234.943.652.46l.l
0.000- 1.069-1.786-1.953-3.372-4.034-5.625
9.418+061.30E+069.15E+051.78E+055.50E+044.508+042.008+046.518+032.00E+038.108+026.00E+012.00E+010.00E+00
9.65E+075;748+073.768+071.798+065.15E+051.82E+05l.7lE+056.80E+033.90E+031.408+029.60E+021.60E+010.00E+00
4.228+0'73.60E+066.90E+054.70E+051.79F+043.90E+031.008+020.008+00
L T=54"C(m) I (s)
pH 6.0N
9.4 cmlsloe (N/No)
T=56"CI (s)
pH 6.0N
9.23 cmls T=58oCI (s)
pH 6.0N
9.68 cm/slos (N/No)log (N/¡{o)
0IzJ
45
678
9101tt2l3t415
l6
0.010.82t.732.543.354.164.975.886.697.4108.2119.1129.9140.7r51.5t62.3173.2
1.438+078.70E+066.10E+061.75E+061.67E+069.108+058.30E+053.638+053.50E+055.758+043.85E+045.00E+031.38E+032.558+O2l.2OE+024.00E+010.00E+00
0.000-o.216-0.370-0.912-0.933-t.196-t.236-1.595-1.611-2.396-2.570-3.456-4.O15-4.749-5.076-s.553
0.0010.821.732.543.354,265.075.886.797.5108.3119.2130.0140.9t51.7162.5r73.4
1.90E+074.408+064.00E+062.328+061.37E+061.90E+061.70E+061.208+O61.608+061.85E+061.63E+061.70E+055.208+041.27F+031.50E+021.70E+010.00E+00
0.000-6.35-o.677-0.913-1.142-1.000-1.048-1.200-1.075-t.ot2-t.067-2.048-2.563-4.t75-5.103-6.048
1.328+098.44E+082.45E+086.728+064.288+042.738+021.66E+010.00E+00
0.000-0.t94-0.731-2.293-4.489-6.684-7.900
0.010.320.731.04t.351.762.O72.3
t72
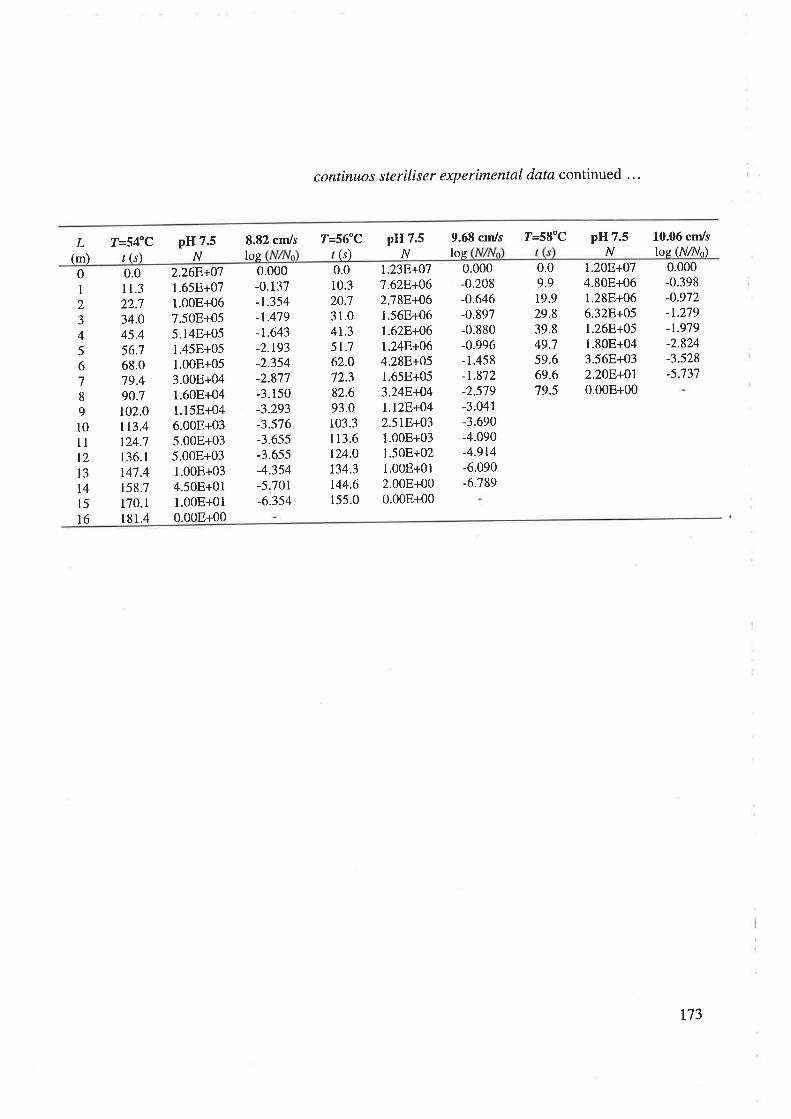
continuos steriliser experimental data continued ...
T=54"Cr (s)
pH 7.5N
pH 7.5N
1.0.06 cm/slos (N/Nn)
8.82 cm/s T=56oC 9.68 cm/s T=58oCpH 7.5N
L(m) log (s) log
0I2J
45
678
9l011
t2t3t4l5l6
0.011.322.734.045.456.768.079.490.7102.0113.4124.71 36.1
147.4158.7170. I181.4
0.000-0.137-1.354-1.479-1.643-2.r93-2.354-2.877-3.150-3.293-3.576-3.655-3.655-4.354-5.701-6.354
0.010.320.731.041.35t.162.072.382.693.0103.3I13.6124.0134.3144.6155.0
0.000-0.208-o.646-0.897-0.880-0.996- 1.458
-1.872-2.579-3.041-3.690-4.090-4.914-6.090-6.789
0.09.919.929.839.849.759.669.679.5
0.000-0.398-0.972-1.279
-t.979-2.824-3.528-5;137
2.26F+Oj1.65E+071.00E+067.50E+055. l4E+051.45E+05L00E+053.00E+041.60E+04l.l5E+046.00E+035.00E+035.00E+031.00E+034.50E+011.00E+010.00E+00
1.238+077.628+062.788+061.56E+061.62F+061.248+064.28E+051.65E+053.24E.+04l.l2E+O42.518+031.00E+031.50E+021.00E+012.00E+000.00E+00
l.2OE+074.80E+061.28E+066.328+O51.268+051.80E+043.56E+032.208+Ol0.00E+00
173
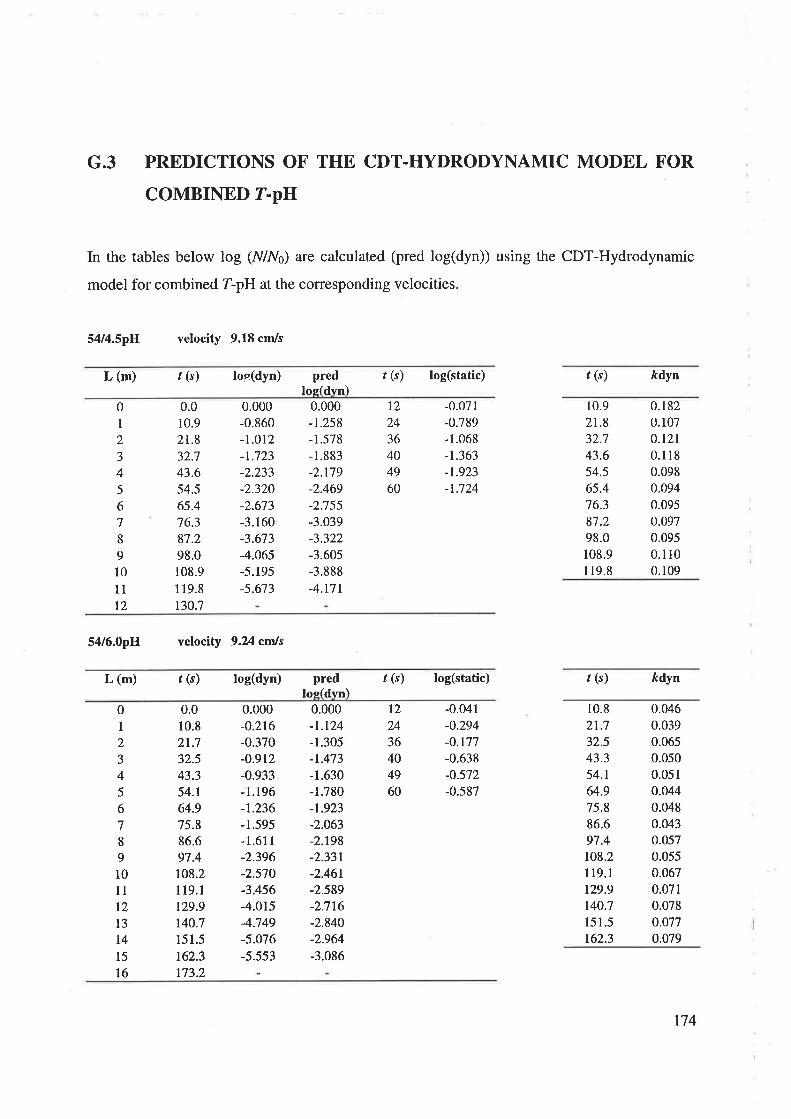
G.3 PREDICTIONS OF THE CDT.HYDRODYNAMIC MODEL FOR
COMBINED T-pH
In the tables below log (N/Ng) are calculated (pred log(dyn)) using the CDT-Hydrodynamic
model for combined Z-pH at the corresponding velocities.
5414.5pH velocity 9.18 cm/s
L (m) ú (s) los(dyn) predlosldvn)
ú (s) log(static) ú (s) kdyn
0I2J
45
6
7I910
l1t2
0.0
10.9
21.8
32.743.6
54.5
65.4
76.387.2
98.0108.9
119.8
r30.7
0.000-0.860-t.otz-1.723
-2.233-2320-2.673-3.160-3.673
-4.065-5.195
-5.673
0.000-1.258-1.578
- 1.883
-2.t79-2.469-2.755-3.039-3.322-3.605-3.888
-4.t71
-0.071-0.789- 1.068
-1.363-1.923
-1.724
10.9
zt.832.7
43.6
54.565.4
16.3
87.298.0108.9l19.8
0.1 82
0.107
0.1210.1180.098
0.094
0.0950.097
0.095
0.1100.r09
t224
36
404960
54/6.0pH velocity 9.A cmls
L (m) t (s) log(dyn) f (s) log(static) ú (s) kdynpredloglrlvn)
0I2J
45
6
7
8
9
10
llt2t3t415
t6
0.0
10.8
2t.732.5
43.3
54.1
64.9
75.886.6
97.4108.2119.1
129.9
140.7151.5
162.3173.2
0.000-o.216-0.370-0.912-0.933-1.196-1.236-r.595-1.611-2.396-2.570-3.456-4.015-4.749-5.076-5.553
0.000-t.t24-1.305
-t.473-1.630-1.780-t.923-2.063-2.198-2.331-2.46t-2.589-2.716-2.840-2.964-3.086
-0.041
-0.294-o.r77-0.638
-0.572-0.587
10.8
21.732.543.3
54.1
64.975.8
86.697.4108.2119.1
129.9r40.715r.5162.3
0.046
0.0390.0650.050
0.0510.044
0.0480.0430_057
0.055
0.0670.071
0.078
0.077o.079
t224
364049
60
174
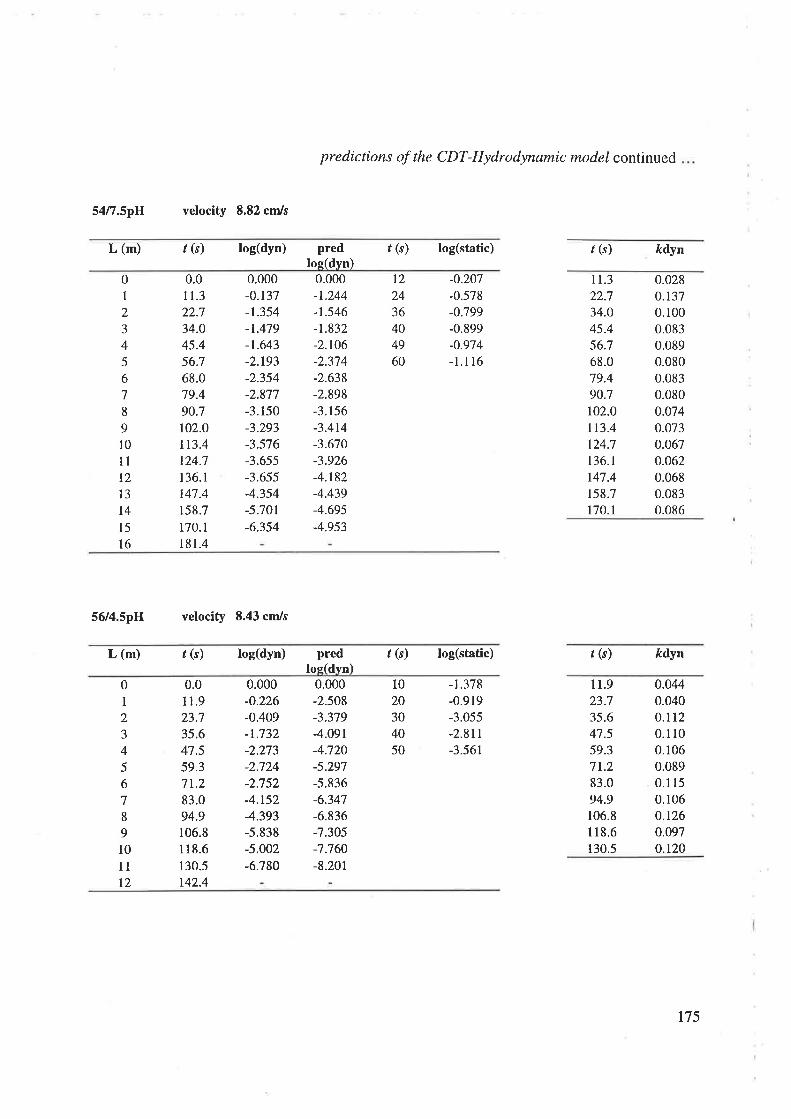
predictions of the CDT-Hydrodynamic model continued
5417,5pII velocity 8.82 cm/s
L (m) t (s) log(dyn) t (s) log(static) t (s) ftdynpredloe(dyn)
01
2
J
45
6
7
8
9l0llt213
r415
16
0.0
I 1.3
22.7
34.0
45.456.7
68.079,4
90.7
102.0
1t3.4124.7
t36.1147.4
r58.7t70.1181.4
0.000-o.137-r.354-1.479-1.643-2.193-2.354-2.877
-3.150-3.293-3.576
-3.655
-3.655-4.354-5.701
-6.354
0.000-t.244-1.546
-1.832-2,106-2.374
-2.638-2.898-3.156-3.414-3.670-3.926-4.182-4.439-4.695-4.953
-0.207
-0.578-0.799
-0.899-0.914
-1. I 16
l 1.3
22.734.O
45.4
56.7
68.0
79.4
90.7102.0
113.4
124.7
1 36.1
147.4158.7
170. I
0.028
o.t370.1000.0830.0890.080
0.083
0.0800.0740.073
0.0670.0620.0680.083
0.086
t224
36404960
5614.5pIJ velocity 8.43 cm/s
L (m) t (s) log(dyn) predlos(dvn)
ú (s) log(static) , (s) ftdyn
0I2J
45
6
78
9
l0l1t2
0.0
tt.923.7
35.647.559.37t.283.094.9106.8118.6
130.5
r42.4
0.000-0.226
-0.409
-1.732
-2.273
-2.724-2.752-4.r52-4.393-5.838
-5.002-6.780
0.000-2.508
-3.379-4.09t-4.720-5.297
-5.836
-6.347
-6.836-7.305-7.760-8.201
-1.378-0.919
-3.055
-2.811-3.561
I1.923.735.6
47.559.3
7r.283.0
94.9106.8
118.6
130.5
0.0440.0400.1t20.1 10
0.106
0.089
0.115
0.1060.1260.097o.t20
10
2030
4050
t75

56/6.0pH velocity 9,23 cmls
predictions of the CDT-Hydrodynamic model continued
t (s) log(static) ú (s) kdynL (m) ú (s) loe(dyn) Predlos(dvn)
0I2J
45
6
7
8
9
10
11
t213
t415
16
0.0010.8
21.732.5
43.3
54.265.075.886.7
97.5
108.3
1t9.2130.0
140.9t51.7162.5
t73.4
0.000-0.635-o.677
-0.913
-1.142-1.000-1.048-1.200-t.075-1.012-t.067-2.048-2.563-4.175-5.103
-6.048
0.000
-0.635-0.677
-0.913
-t.142-1.000-1.048
-1.200-1.075-t.otz-t.067-2.048-2.563-4.r75-5.103
-6.048
-0.682-1.079
-2.708-1.457
-2.088
10.8
21.7
32.5
43.3
54.265.0
15.886.7
97.5
108.3
1r9.2130.0140.9
t5t.7162.5
0.1 35
0.o'12
0.065
0.061
0.0420.0370.036
0.o290.o24o.0230.0400.045
0.068
0.o770.086
l020
30
4050
5617.5pH velocity 9.68 cm/s
L (m) ú (s) log(dYn) t (s) log(static) f (s) kdynpredloe(dvn)
01
2
3
456
7
8
9
l011
t2l3t4l5
0.010.3
20.731.041.351.762.O
72.382.693.0103.3
113.6124.O
134.3
144.6155.0
0.000-0.208-0.646-0.897-0.880-0996-1.458-t.872-2.579-3.041-3.690-4.090-4.914-6.090-6.789
0.000
-2.324
-3.064-3.656-4.r72-4.639-5.O72
-5.479-5.865-6.234
-6.589-6932-7.265-7.588
-7903
-0.918-2.249-2.484-2.6154-3.6864
10.3
20.7
31.041.3
51.7
62.072.3
82.693.0103.3
t13.6t24.0134.3
r44.6
0.046
0.0720.067
0.0490.0440.054
0.0600.0720.0750.0820.083
0.0910.104
0.108
10
20304050
176
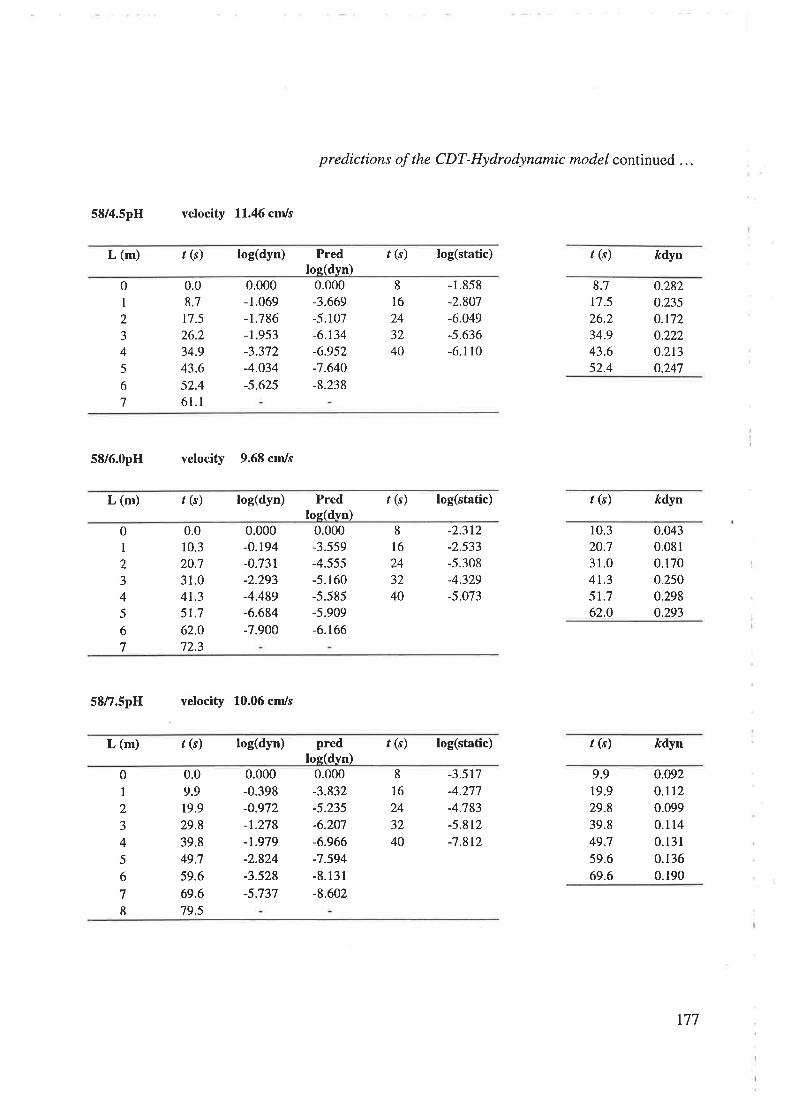
58/4.5pH velocity 11.46 cm/s
predictions of the CDT-Hydrodynamic model continued ...
, (s) log(static)L (m) t (s) log(dyn) , (s) /rdynPredIoe(dvn)
0I2J
4
5
6
7
0.08,7
t7.526.2
34.9
43.6
52.4
6l.l
0.000-1.069-L786-r.953-3.372-4.034-5.625
0.000-3.669-5. r07-6.134-6.952-7.640-8.238
-1.858-2.807
-6.O49
-5.636-6.1 l0
8.7
t7.526.2
34.943.6
52.4
0.282o.235o.172
0.2220.213o.247
8
l624
3240
58/6.0pH velocity 9.68 cm/s
L (m) f (s) log(dyn) t (s) log(static) t (s) kdynPredloe(dvn)
I16
24
3240
0
I2J
45
6
7
0.010.3
20.7
31.0
4r.351.7
62.072.3
0.000-0.r94-0.731
-2.293-4.489-6.684-7.900
0.000-3.559-4.555
-5.160-5.585
-5.909-6.166
-2.312-2.533-5.308
-4.329-5.073
10.3
20.7
31.041.3
51.762.O
0.0430.081
0.1700.250
0.298o.293
58f/.5pH velocity 10.06 cm/s
L (m) t (s) log(dyn) ú (s) log(static) t (s) kdynpredloe(dvn)
0
I2
3
45
6
7
8
0.0
9.9
19.9
29.8
39.8
49.7
59.6
69.6
79.5
0.000-0.398-o.972
-1.278-1.979-2.824-3.528-5.737
0.000-3.832-5.235
-6.207
-6.966-7.594-8.13 I-8.602
-3.5t7-4.277
-4.783-5.812
-7.812
9.9
19.9
29.8
39.8
49.7
59.669.6
0.092o.lt20.099
0.114
0.131
0.136
0.190
8
t624
32
40
r77

APPENDIX H
SIZING THE STEAM INJECTOR FOR THE PILOT CONTINUOUS
STERILISER
178
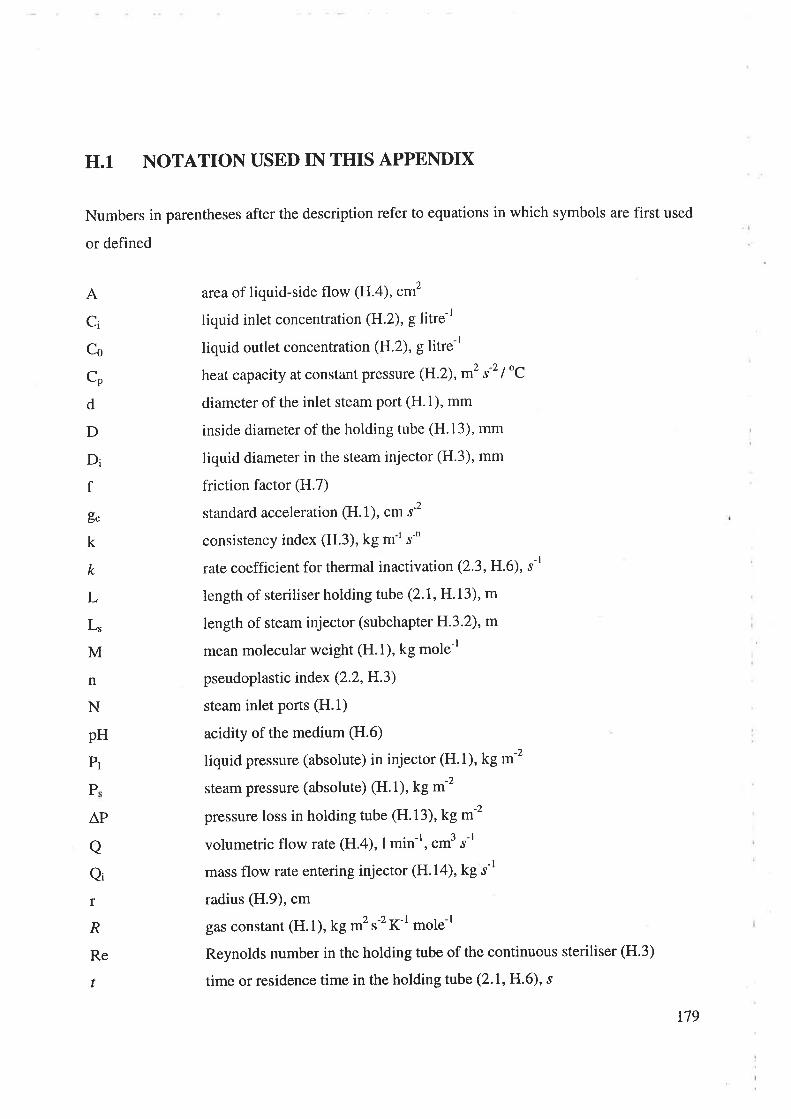
f
A
Ci
Co
cp
d
D
D¡
Ec
k
k
L
L,
M
n
N
pH
P¡
H.l NOTATION USED IN THIS APPENDIX
Numbers in parentheses after the description refer to equations in which symbols are first used
or defined
area of liquid-side flow (H.4), cm2
liquid inlet concentration (H.2), g litre-r
liquid outlet concentration (H.2), g litre-r
heat capacity at constant pressure (H.2), m2 s'2 loC
diameter of the inlet steam port (H.1), mm
inside diameter of the holding tube (H'13), mm
liquid diameter in the steam injector (H.3), mm
friction factor (H.7)
standard acceleration (H.1), cm ,-'
consistency index (H.3), kg m-' s-n
rate coefficient for thermal inactivation (2.3,H.6), s-l
length of steriliser holding tube (2.1, H.13), m
length of steam injector (subchapter H.3.2), m
mean molecular weight (H.1), kg mole-l
pseudoplastic index (2.2, H.3)
steam inlet ports (H.1)
acidity of the medium (H.6)
liquid pressure (absolute) in injector (H.1), kg --tsteam pressure (absolute) (H.1), kg *-t
pressure loss in holding tube (H.13), kg *-t
volumetric flow rate (H.4),1min-[, cm'r-t
mass flow rate entering injector (H.14), kg s-l
radius (H.9), cm
gas constant (H.1), kg *t r-'ICl mole-l
Reynolds number in the holding tube of the continuous steriliser (H.3)
time or residence time in the holding tube (2.1, H.6), s
P
AP
aQi
r
R
Re
t
179

T
Ti
To
Ts
<u>
VT
Greek Letters
Notation continued...
temperature, Kelvin and "C 1H.1)
inlet liquid temperature, Kelvin and "C 1H.2)
liquid temperature at injector discharge (H.2), Kelvin and oC
steam saturation temperature at P, (H.2), Kelvin and oC
bulk velocity of the liquid in holding tube (2.1, H.3), cm ,-r
mass flow rate of steam (H.1), kg tt
enthalpy of reaction (latent heat) (H.2), kg m2 s-2
3.14159 (H.1)
density (H.3), kg -'shear stress (H.5), kg rrl s-2
wall shear stress inside injector (H.7), kg mr .r2
tTE
p
x
tw
180

H.2 ANALYTICAL DEVELOPMENT
The steam-side and liquid-side flows are treated separately in this thesis. The design
constraints for the steam injector are:
o steam velocity in the inlet ports must be less than the sonic velocity;
o diameter of the port must not be so small as to foul easily.
For the liquid stream the flow diameter is estimated from a simultaneous solution of two
equations, respectively:
. Reynolds number in a tube
o total liquid (liquid and condensed steam) flow rate.
H.2.1 Steam-Side
Extended Bernoulli Equation
The injection of steam through a number of inlet ports, N, into the liquid causes turbulent
flow. The extended Bernoulli equation can be used as it provides a relationship between
pressure and friction. For the direct steam injector, this equation can be written in terms of
steam inlet ports as following (Davey 1980):
N = (4 W I n d\ lQ R T I g"M) ln (Pr / PJ I (Pt2 -P,')lt'' (H.1)
Steam Flow and Liquid Dilution
A term for dilution of the liquid flow by condensing steam can be obtained from a heat and
mass balance around the injector. Following the work of Davey (1980) a final equation is
obtained of the form:
Ci =Co [Cp (r0 -Ti)lQ.+Cn (78 + 0.22P")+CrTi-2C, ?o)+ 1] (H.2)
181
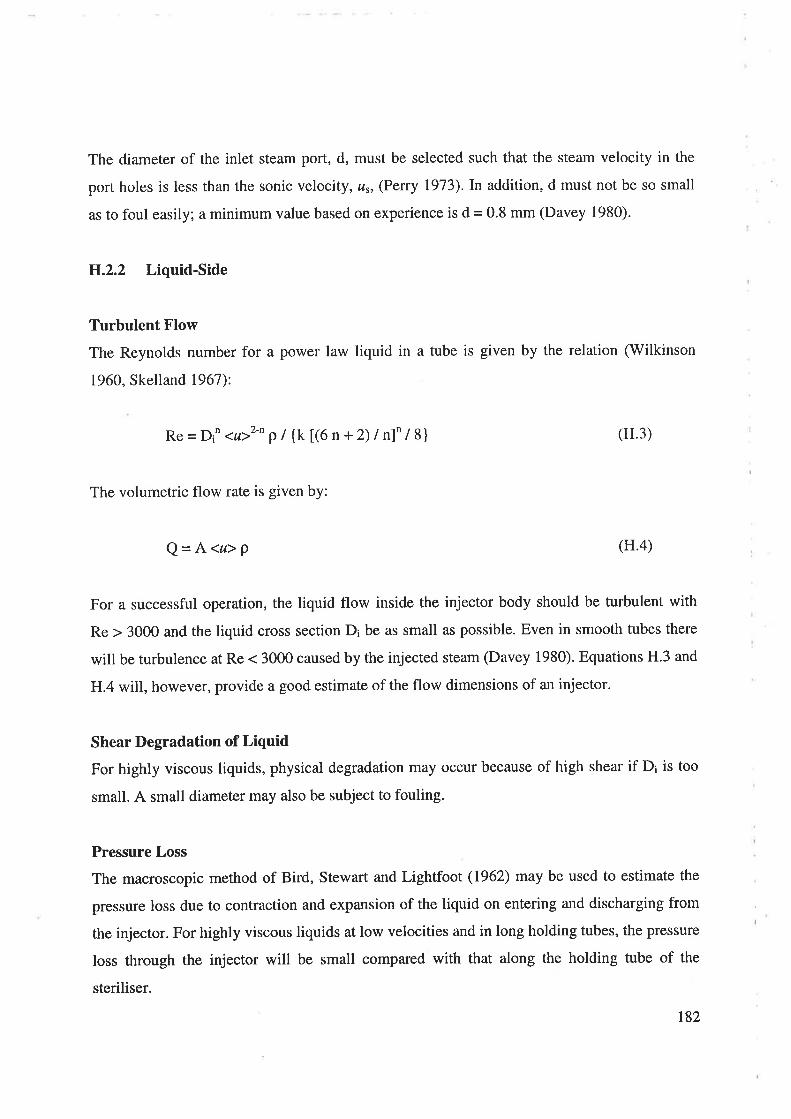
The diameter of the inlet steam port, d, must be selected such that the steam velocity in the
port holes is less than the sonic velocity, u", (Perry 1973).In addition, d must not be so small
as to foul easily; a minimum value based on experience is d = 0.8 mm (Davey 1980).
H.2.2 Liquid-Side
Turbulent Flow
The Reynolds number for a power law liquid in a tube is given by the relation (Wilkinson
1960, Skelland 1967):
Re = Din <r>''n p / {k [(6 n + 2) I n]" I 8l (H.3)
The volumetric flow rate is given by:
Q=A<u>p (H.4)
For a successful operation, the liquid flow inside the injector body should be turbulent with
Re > 3000 and the liquid cross section Di be as small as possible. Even in smooth tubes there
will be turbulence at Re < 3000 caused by the injected steam (Davey 1980). Equations H.3 and
H.4 will, however, provide a good estimate of the flow dimensions of an injector.
Shear Degradation of Liquid
For highly viscous liquids, physical degradation may occur because of high shear if D¡ is too
small. A small diameter may also be subject to fouling.
Pressure Loss
The macroscopic method of Bird, Stewart and Lightfoot (1962) may be used to estimate the
pressure loss due to contraction and expansion of the liquid on entering and discharging from
the injector. For highly viscous liquids at low velocities and in long holding tubes, the pressure
loss through the injector will be small compared with that along the holding tube of the
steriliser.
182
H.2.3 Design Equations
Equations H.3 and H.4 are the design equations, subject to the constraint of equation H.l and
H.2.
H.3 SOLUTION OF EQUATIONS AT THE CONDITIONS OF
EXPERIMENTAL STERILISER
H.3.1 Liquid'Side
Dimensions of Experimental Steriliser
The inside diameter of the holding tube is D = 0.95 cm. Bulk liquid velocities of
<r> =5 cm s-l to 15 cm s-l match those used in commercial sterilisers (Pfiefer and Vojnovich
lg5¡). Corresponding liquid volumetric flow rates are in the range Q = 0.214 I min-rto
0.6421min-t (3.57 cm3 ,-' to 10.7 crnt r-t;.
The Liquid
The power law equation for the test liquid for n = 0'37 is:
t=k(- duldr)o'37 (H.s)
where k is given by equation (5.15). The liquid density is assumed to be p = 1 g cm-3.
The Micro-organism
The test bacterium used for the calculations of the steriliser dimensions is E. coli-The thermal
inactivation kinetics in the test liquid to obtain a reduction of - logro [<N>/<No>] < 5 are given
by CDT model (equation 5.13, Table 5.2). The micro-organism has a heat sensitivity in the
range of 57oC to 64oC. Substitution of coefficients of equation (5.13) gives:
183

k = 2.315.6x10'2-(6.5-l.4xlo3lr+5.7xro4lf¡1lnt¡+1r.4+991r-0.lpH+8.6.110-3pH2¡llnr¡2]/r (H.6)
tr'low Diameter of Steam Injector
A temperature of 60oC is assumed for the liquid inside the injector. The liquid diameter in the
injector, D¡, câD be determined from equations H.3 and H.4 by assuming a medium or upper
value of Q - 0.6421 min-r (10.7 cm3 s-r).
H.3.1.1 First approximation
Simultaneous solution of equations H.3 and H.4 for 60oC with Re = 3000, n = 0.37 and
Q=0.6421min-r gives (Davey 1980):
D¡ = 0.124 cm
<u> = 880.238 "- r-t
The resulting wall shear stress inside the injector can be estimated from the friction factor
(V/ilkinson 1960, Skelland 1967):
f =2 x* I <u>2 = f (Re) (H.7)
Atn= 0.37 andRe=3000, f =4x 10r(Wilkinson 1960,p.67,Fig38a).
Tw = 1.55 x 10³ dyne cm-2 (H.8)
The corresponding wall shear rate is obtained from equation H.5:
(- du ldr)* - 3.708 x lOa s-l (H.e)
This shear rate is about 68 times the average from which the constants in the rheological
equation were determined (Davey 1980). At these shear rate conditions the liquid might be
susceptible to physical degradation, and the desirable friction reducing property of the high
molecular weight test liquid will be lost (Pallerson, Zakin and Rodriguez 1969, Davey 1980).
184

H.3.1.2 Second approximation
The values of the wall shear stress (- du I dr)* were obtained from the relation (Wilkinson
r960):
(- du ldr)* = [(3 n + l) I 4 n] (8 <ø> / Di) (H.10)
Davey (1930) showed that a value of Di = 0.15 cm is seen to be the best compromise as shear
rates in the injector and the holding tube will match those from which the rheological
constants u'ere determined. The value of the liquid-side flow diameter is therefore fixed at
Di = 0.15 cm.
Test Liquid Make-up and Dilution
The concentration of the test liquid which gives a 2 kg m-3 solution Carbopol when diluted
with condensed steam, is obtained from equation F.2, with the following substitutions:
cp= 4.219 kJ kg-r / oc
L=2258 kJ kg-'
Ti=2OoC
that is,
Ci=0.214.219 (To-20) l(2671+0.9282 P' - 8.438 To) + 1l (H.r 1)
Solution of equation H.11 requires that To and P. be specified. The holding tube temperature at
the injector discharge To can be readily specified, but P, must be specified from a
consideration of the steam-side flow.
185

H.3.2 Steam-Side
Diameter of Steam Inlet Holes
The value of the diameter of the steam inlet ports is selected at d = 0.12 cm. After substitution,
the number of steam inlet ports is given by (Davey 1980):
N = 1.88-x10t [(o.t rp"+342) ln(P/P,)/(Pr2lP"'))''' Q?o-2o)l(2258+0.9282P"+4.2r9(78-r0) G.12)
where R = 8.539 x 10a g cm mol-l K-I, M = 18 and g" = 980 cm s-'
Liquid Pressure Inside Injector
The liquid pressure inside the injector, P, will be about equal to the static pressure loss along
the holding tube, plus 100 kPa, ie atmospheric pressure. The pressure loss for laminar flow of
a power law liquid in a tube is given by equation (V/ilkinson 1960):
ÀP = k [(3 n + 1) /4 n]" (8 <ø> I D)" 4L I D (H.13)
The length of the steriliser holding tube L was obtained from the CDT hydrostatic model
(Chapter 6, Appendix F). Calculations for the pressure loss were made using equation H.13.
For the range of velocities and temperatures used in the experimental trials, it was found that
for values of -logro [<N>/<Ng>] < 5, the length of the holding tube could go up to 44 m (54oC,
pH 6.0). However at the mid-range temperature of 56oC, the length is < 20 m.
Steam Pressure
Experience with direct steam injectors suggests that the operating steam pressure should be
about 20 kPa to 50 kPa above the liquid pressure inside the injector (Davey 1980):
P. = 130 + 50 = 180 kPa.a
186

Number of Steam Inlets
Equation H.12 gives N = I for the following substitutions
Q = 0.428 I min-r (a midrange value)
To = 60oC
Pr = 130 kPa.a
P. = 180 kPa.a
Based on equation !J..I2, C¡ is determined to complete the design and specification of the
dependent variables, P., for a range of values of the independent variables, Q and To.
Residence Time in the Steam Injector
At the lower flow rate of Q = 0.2361 min-l (3.925 cm3 s-t¡, the residence time in the steam
injector of the liquid containing the bacteria is a maximum at:
f = 0.0183 s
L. = 3.7 cm
<u> =2O1.78 cm "-t
187
H.4 MASS AND ENERGY BALANCE FOR STEAM INJECTOR
Figure 6.2 represents the injector with inlet and outlet streams'
Energy balance
If Ii is used as the datum temperature, the inlet liquid stream has zero energy.
W + W (f, - fo) Co = (W + Qi) Cp (To - Ti) (H.14)
Hence
V/ = Qi Cp (10 - T) | (1.+ Co T' + Cp Ti - 2 CpTs) (H.rs)
Mass balance
An expression for the liquid make up concentration, C¡, câtt be obtained in terms of the outlet
liquid concentration, C0, to allow for dilution with condensed steam:
CiQi=Co$/+Q¡) (H.16)
Hence
Ci=Co(W+QJ/Q¡ (H.17)
188

Table H.l Calculation for the Carbopol dilution
P, Concentration (Vo)
(kpa.a) 54oc 56"C 58oC 60oC 62oC 64oC 66oC 6goc 700c 720c
120130
r40150160170180190200
5.55.55.55.45.45.45.45.45.3
5.85.85.85.85.75.75.75.15.1
6.26.1
6.r6.1(,.1
6.16.06.06.0
6.56.56.46.46.46.46.46.36.3
6.86.86.86.86.16.76.76.16.6
1.27.17.1
1.11.1
7.07.07.07.O
7.51.57.47.47.47.41.31.37.3
7.87.81.87.81.77.77.71.67.6
8.28.28.1
8.1
8.1
8.08.08.08.0
8.5
8.58.58.48.48.48.3
8.3
8.3
Ave.Conc.
5.4 5.7 6.1 6.4 6.7 7 .r 7 .4 7 .7 8.1 8.4
The average value for the Carbopol dilution over Z range 54oC to 72oC is 6.9Vo + 1.5, that was
averaged for a practical propose to7Vo.
189
APPENDIX I
THERMOCOUPLES
190

I.1 MBASUREMENT ERROR
Type T copper-constantan thermocouples were used to measure and monitor the temperature
of the liquid in pilot continuous steriliser.
Measurement errors are most difficult to be predicted. An error translates in that there may be
a difference between the temperature of the product and the temperature of the probe making
the measurement. For this kind cf experimental work, an accurate temperature reading is
requested.
I.2 CALIBRATION OF THERMOCOUPLES
The thermocouples were calibrated by immersing them in a controlled temperature water bath
of known temperature. The temperature of water bath was measured with a fully immersed
reference mercury thermometer.
The value of temperature for each thermocouple was displayed on a panel mount digital
controller with a ten-way switch box.
19t
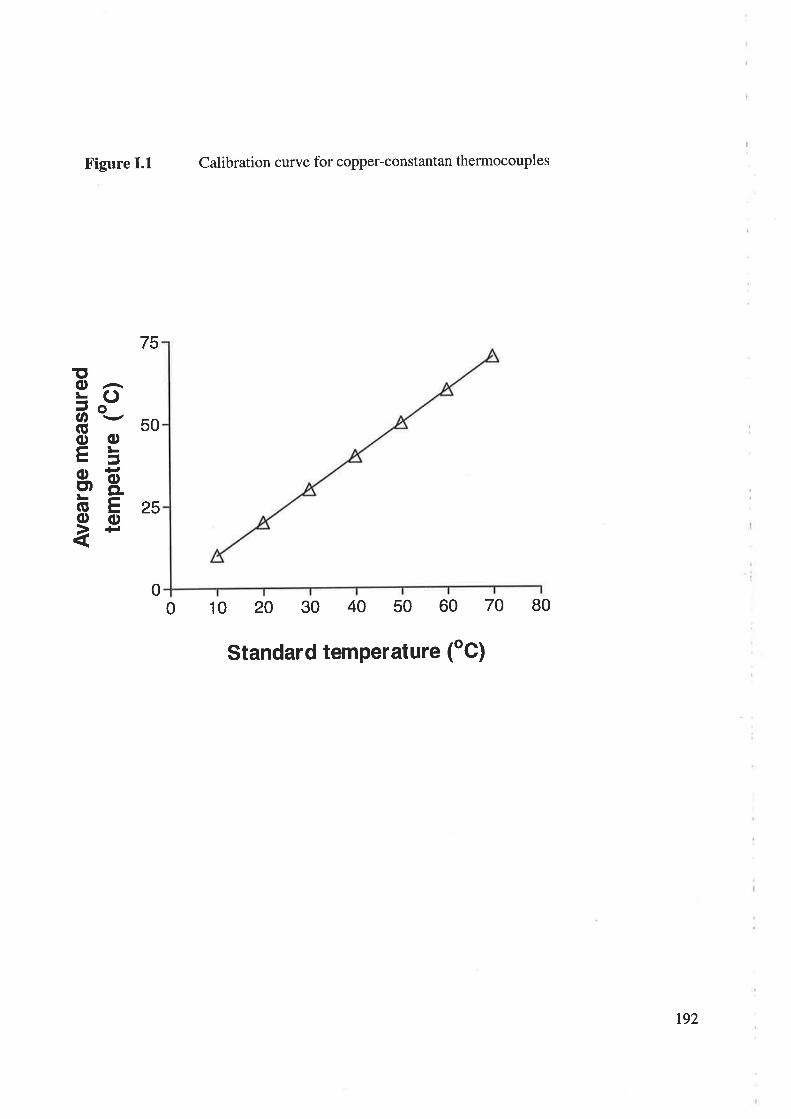
T'o=oJar
I -\-' soooEL-¿Ë'E(úts 25ooã+'
Figure I.1 Calibration curve for copper-constantan thermocouples
75
001020304050607080
Standard temperature (oC)
192

Table I.1. Calibration data for copper-constantan thermocouples
Temperature
cc)
Standard
th/couplel
th/couple2
thlcouple3
th/couple4
th/couple5
thlcouple6
th/coupleT
thlcouple8
th/couple9
th/couple10
th/couplel l
thlcouplel2
th/couple13
th/couple14
th/couplel5
10.0
t0.2
10.r
10.1
r0.0
10.3
10.1
10.0
10.0
10.1
10.0
9.9
10.2
10.0
10.1
10.1
20.0
20.0
20.1
20.0
20.4
20.t
20.3
20.0
20.0
20.1
20.t
20.0
20.0
20.0
20.0
20.t
30.0
30.0
30.0
30.0
30.0
30.0
30.1
30.1
30.0
30.0
30.0
29.9
30.1
30.r
30.0
30.0
40.0
40.r
40.0
40.0
40.0
40.0
40.0
40.t
40.0
40.0
40.1
40.0
40.2
40.0
40.0
40.0
50.0
50. I
50.0
50.1
50.2
50.2
50.1
50.0
50.0
50.0
50.0
50.1
50.0
50.0
50.1
50.1
60.0
60.0
60.0
60.0
60.0
60.0
60.0
60.0
60.0
60.0
60.0
60.0
60.1
60.1
60.1
60.0
70.0
70.0
70.0
70.2
70.0
10.1
70.r
70.0
70.0
70.r
70.0
70.0
70.0
70.0
70.0
70.1
193

APPENDIX J
EQUATIONS FOR CONCENTRATION OF THE TEST LIQUID INCONTINUOUS STERILISER
194
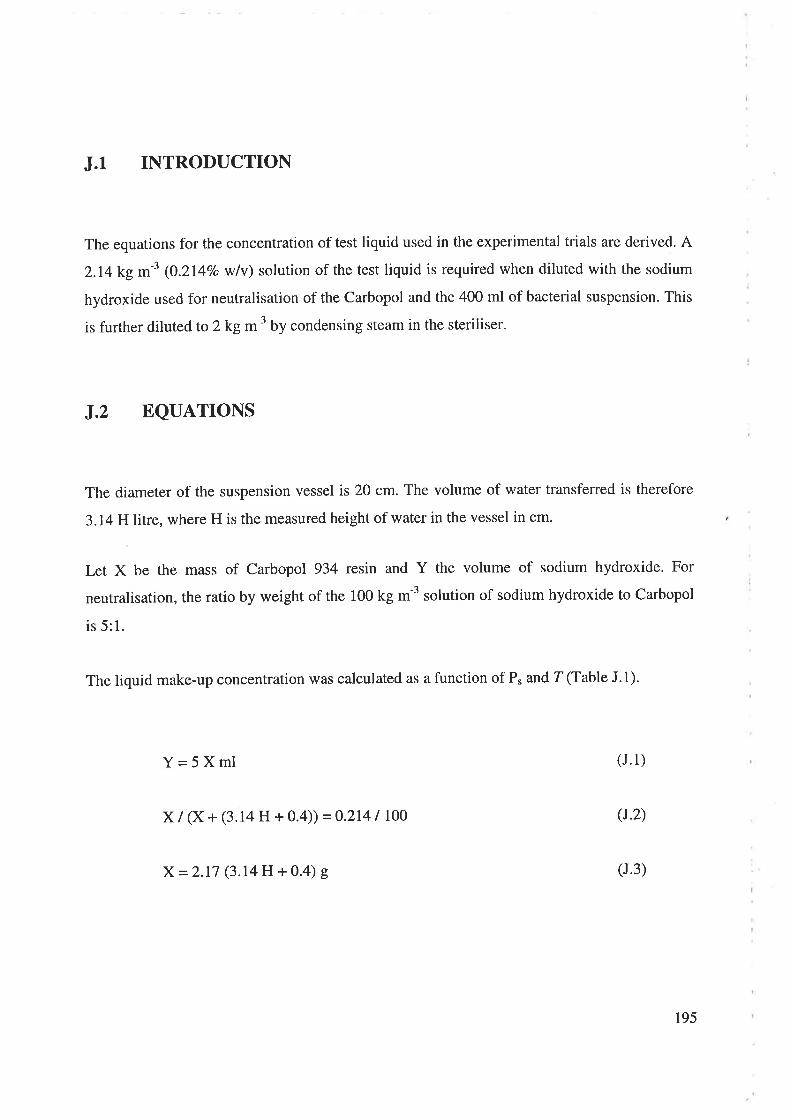
J.1 INTRODUCTION
The equations for the concentration of test liquid used in the experimental trials are derived. A
2.I4 kg m-3 ç0.21+7o wlv) solution of the test liquid is required when diluted with the sodium
hydroxide used for neutralisation of the Carbopol and the 400 ml of bacterial suspension. This
is further diluted to 2kgm-3 by condensing steam in the steriliser.
J.2 EQUATIONS
The diameter of the suspension vessel is 20 cm. The volume of water transferred is therefore
3.l4Hlitre, where H is the measured height of water in the vessel in cm.
IÆt X be the mass of Carbopol 934 resin and Y the volume of sodium hydroxide. For
neutralisation, the ratio by weight of the 100 kg m-3 solution of sodium hydroxide to Carbopol
is 5: 1.
The liquid make-up concentration was calculated as a function of P, and T (Table J.1).
Y=5Xml (J. 1)
X / (X + (3.14 H + 0.4)) =0.2141 100 (1.2)
X=2.17 (3.14H + 0.4) g (J.3)
t95

Table J.1 Test liquid make-up concentration (Ci (g l-t)) as a function of P, and T
P. Concentration (7o)
(kPa.a) 54"C 560C 580C 600c 620C 640C 66'c 6goc 700c 12"C
r20
130
140
150
160
170
180
190
200
2.tl2.1,1
2.tl2.rl
2.rl
2.tl2.rl
2.ll2.ll
2.12
2.12
2.12
2.12
2.lr
2.Il2.tl2.rl
2tl
2.12
2.12
2.12
2.r2
2.12
2.r2
2.r2
2.12
2.12
2.r3
2.13
2.r3
2.13
2.r3
2.13
2.13
2.13
2.13
2.14
2.t4
2.14
2.t4
2.13
2.13
2.r3
2.13
2.13
2.t4
2.r4
2.t4
2.14
2.14
2.14
2.r4
2.r4
2.r4
2.r5
2.15
2.15
2.t5
2.15
2.t5
2.r5
2.r5
2.r5
2.16
2.t6
2.16
2.16
2.15
2.r5
2.t5
2.r5
2.15
2.16
2.16
2.t6
2.16
2.16
2.16
2.16
2.16
2.16
2.r7
2.t7
2.t7
2.17
2.t7
2.r7
2.t7
2.t7
2.17
Ave.
Conc.
2.ll 2.lr 2.12 2.13 2.r3 2.r4 2.15 2.15 2.16 2.17
2.14
196

APPENDIX K
A PROCEDURE TO ESTIMATE THE EFFECTS OF DISPERSION
r97

K.1 INTRODUCTION
This appendix presents a procedure to estimate the effects of dispersion on continuous
sterilisation. This subject is new and not enough data resources were found in the literature.
K.2 DERIVED CALCULATIONS
The effect of axial dispersion in the steriliser holding tube was considered on intuitive
grounds. The hypotheses were based on the correlation of the Peclet number (Pe) in terms of
Reynolds (Re) and Damkohler (Da) numbers for fluid flow in a tubular steriliser.
It was appreciated that a very rough extrapolation of the available data in the literature
(I-ne 1992,pg.244, Fig. 8.5), for Pe = 10, corresponded to survivors of 10-7. These values
were compared with experimental data obtained in a pilot continuous steriliser (see Table
K.1).
198
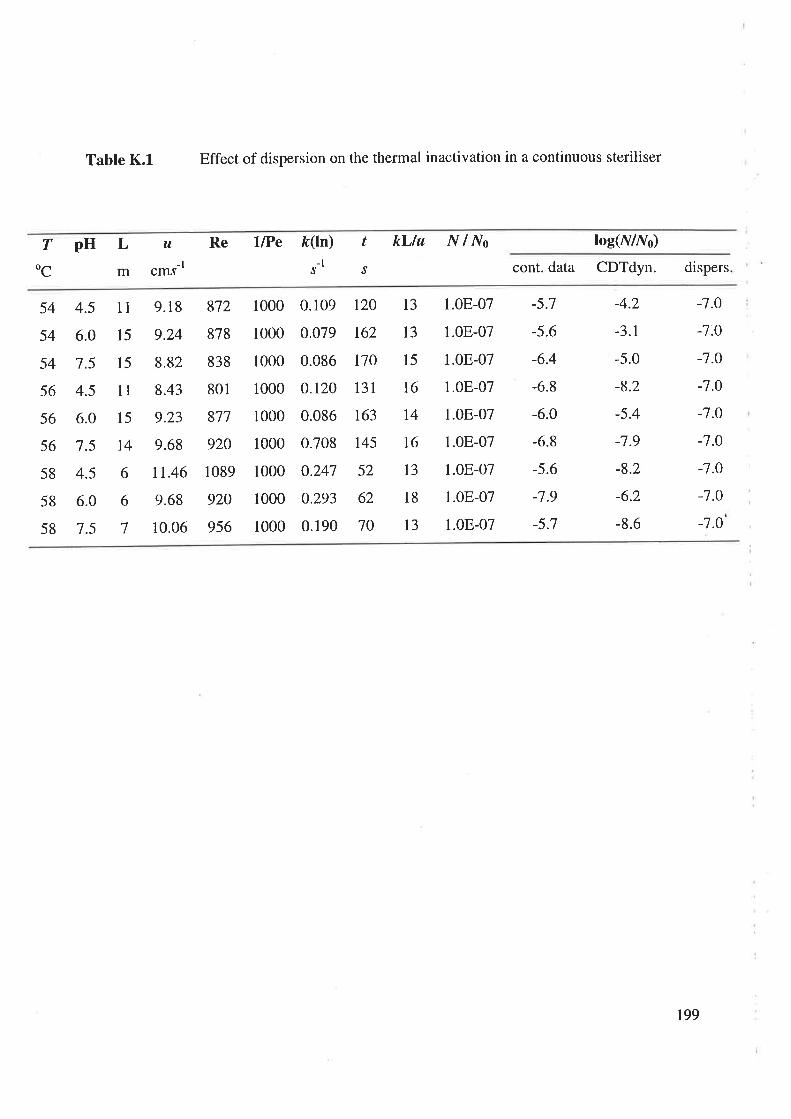
Table K.l Effect of dispersion on the thermal inactivation in a continuous steriliser
TpH Lu-lm cm.r
Re l[Pe ft(ln) t kLlu N / No
J-l J cont. data CDTdyn. dispers
log(N/No)
OC
54
54
54
56
56
56
58
58
58
4.5
6.0
7.5
4.5
6.0
7.5
4.5
6.0
7.5
t1
l5
l5
lll5
t4
6
6
7
872
878
838
801
871
920
1089
920
956
t20
162
170
131
r63
t45
52
62
10
13
t3
15
t6
t4
t6
13
18
13
-5.7
-5.6
-6.4
-6.8
-6.0
-6.8
-5.6
-7.9
-5.7
-4.2
-3.1
-5.0
-8.2
-5.4
-7.9
-8.2
-6.2
-8.6
-7.0
-7.0
-1.0
-7.0
-7.0
-1.0
-7.0
-7.0
-1.0
9.18
9.24
8.82
8.43
9.23
9.68
11.46
9.68
10.06
1000
1000
1000
1000
1000
1000
1000
1000
1000
0.109
0.079
0.086
0.r20
0.086
0.708
0.247
0.293
0.190
1.0E-07
1.0E-07
1.0E-07
1.0E-07
l.0E-07
1.0E-07
1.08-07
1.0E-07
1.0E-07
199
APPENDIX L
SAFETY OPERATIONAL PROCEDURES (SOP's) FOR PILOT
CONTINUOUS STERILISER
200
Project Designer:
Project Supervisors:
UNIVERSITY OF'ADELAIDE
DEPARTMENT OF CHEMI CAL ENGINEERING
CHEMICAL ENGINEERING LABORATORIES
SAFBTY OPERATING PROCEDURE
FOR PILOT CONTINUOUS STERILISER
Laboratory Manager:
Juliana Chiruta
Dr. K. R. Davey
Dr. C. J. Thomas
Chris Mansel
Date: 15 May 1998
This section has been developed according to Australian Standards For Sterilisers
(AS 1410) to assist in achieving uniform levels of safety and efficiency for materials,
design, construction, testing and installation of an experimental installation for
sterilisation of liquids.
20r
Part One - Start-Up Procedure
WARNING - SERIOUS BURN HAZARD
. Always wear safety glasses when open up the steam valve
. Wear protective gloves when handling anything near to autoclave
. 'Wear safety boots to avoid slipping
. Wear an overall coat for laboratory
EXPERIMENTAL PROCEDURE
. Inspect rig: see that the rig is clean, free of obvious mechanical defects or signs of
disrepair, and properlY set uP
. Open the feed ball valve from the boiler and allow temperature to rise to the matrix
temperature. The liquid should rich this matrix temperature in less than 25 min
. Ensure there is sufficient pressure (min 400 kPa) by opening the rear door and
inspecting the gauge
. Switch on magnetic pump
' Open needle-valve
. Slowly open pressure regulator to the assumed value of 240 kPa
. Check temperature to be in the required range using the TC read-on monitor
r IJse the needle valve for another adjustment of temperature if required
. To stop the rig, close up the regulator, the stop valve, and the magnetic pump
The person who operates the steriliser has to ware protective clothes, that will protect
him/her to any skin exposure while operate. Protective clothes consist of: protective
gloves designed for high temperatures, glasses, safety shoes, and an overall coat for
laboratory.
Part Two - Shutdown Procedure
I Turn off the pressure regulator to the steam inlet
r Turn off the needle-valve
. Switch off magnetic pump
. Switch off boiler
202

Part Three - Maintenance Procedure
. Clean the tank, magnetic pump and pipes in situ using the steam only (see start-up
procedure)
. Clean all the moisture from the apparatus and surrounding floor
Part - Safetv and to Note
WARNING - SERIOUS BURN HAZARD
' Always wear safety glasses when open up the steam valve
. Wear protective gloves when handling anything near to autoclave
r 'Wear safety boots to avoid slipping
. 'Wear an overall coat for laboratory
. Take great care when operating the rig
WARNING - ALWAYS CHECK FOR
. The main switchboard for thermocouples together with the temperature monitor
have to be placed into a box specially designed for this purpose, to avoid exposure to
a24OY
r { pressure-relieve device has to be placed in the case of too much pressure in the
system, just after the pressure regulator
. All tubing system have to be insulated with polystyrene insulation for protection
against high temperatures
NOTE
. Steriliser operates in a low range of temperatures and is not subject to high pressures
or pressurised vessels
r For an initial adjustment of the pressure a nomogram has been drawn that allows an
easy calculation of the initial pressures as temperature and flow rate are changed
203
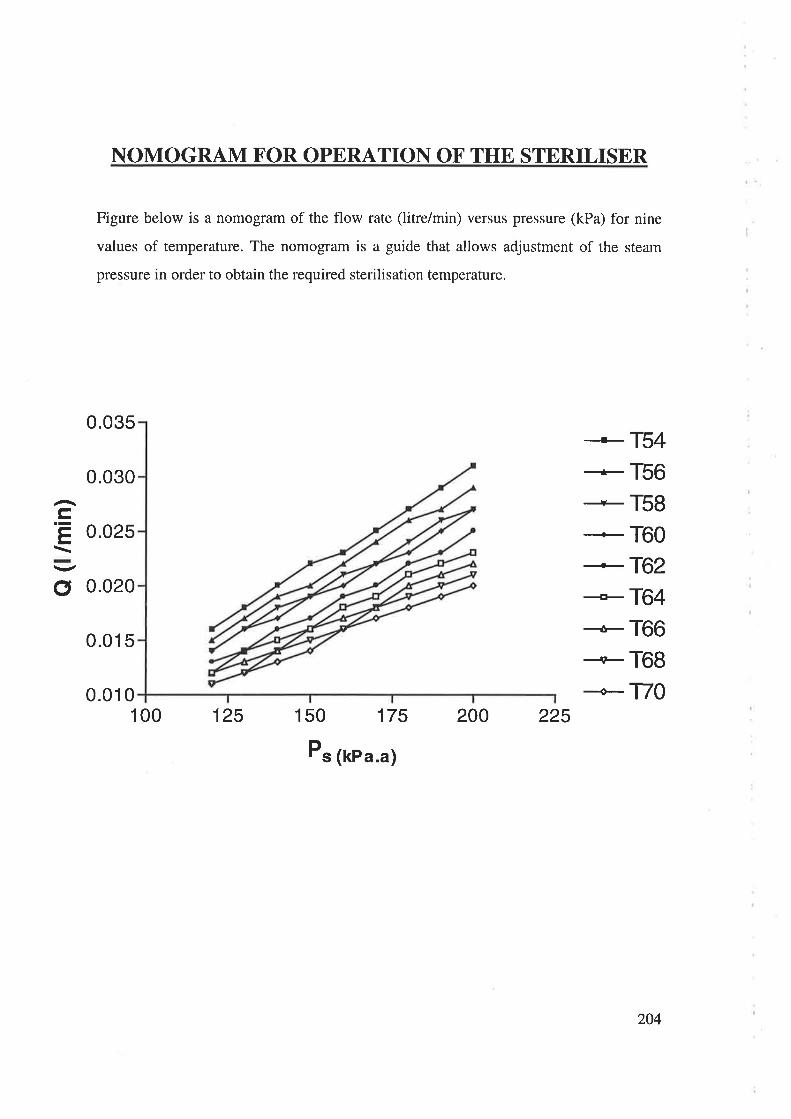
NOMOGRAM FOR OPERATION OF THE STERILISER
Figure below is a nomogram of the flow rate (litre/min) versus pressure (kPa) for nine
values of temperature. The nomogram is a guide that allows adjustment of the steam
pressure in order to obtain the required sterilisation temperature.
0.035
0.030
tr.E0.025
ø 0.020
0.015
0.010
-'- T54* T56
-r- T5g* T60+ T62*= T64
-F T66
T68
T701 00 125 1 50 175 200 225
Ps (kPa.a)
204

NOTATION
205
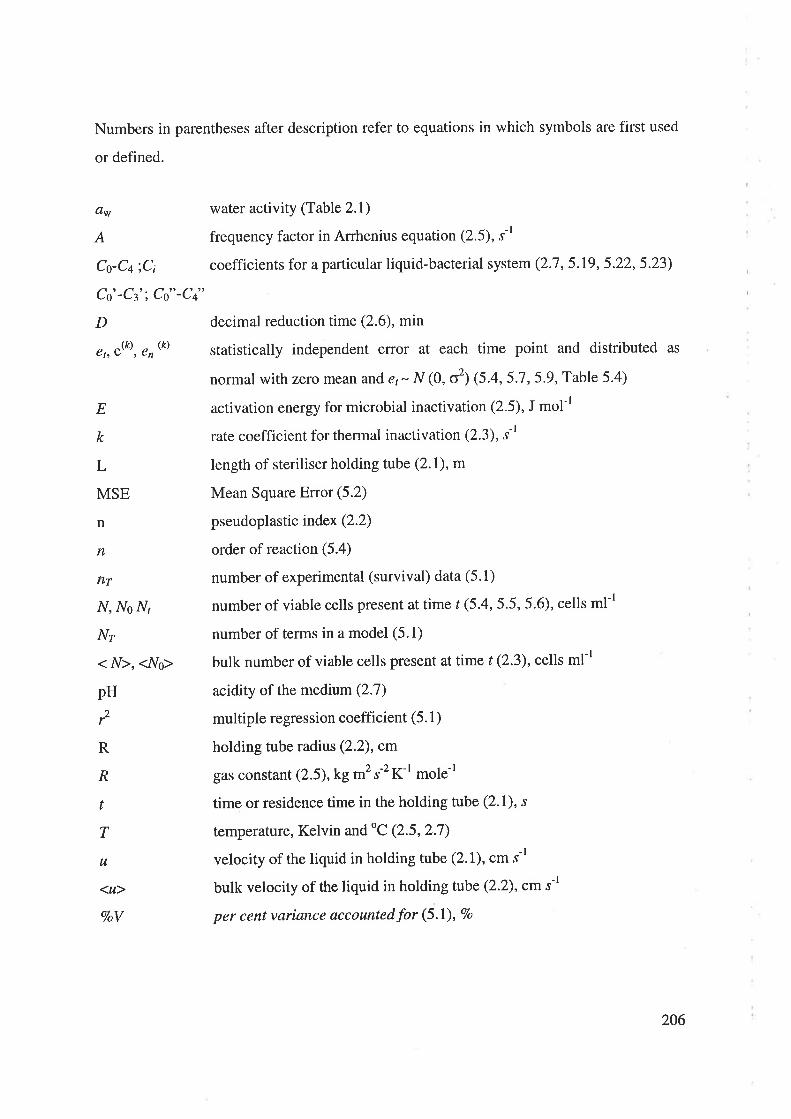
Numbers in parentheses after description refer to equations in which symbols are first used
or defined.
clw
A
Co-C¿, iC¡
Co'-Cl'; Co"-C4"
D(k\ (k)
€¡, A' ', €¡ '
warer activity (Table 2.1)
frequency factor in Arrhenius equation (2.5), s-l
coefficients for a particular liquid-bacterial system (2.7,5.19,5.22,5.23)
decimal reduction time (2.6), min
statistically independent error at each time point and distributed as
normal with zero mean and et- N (0, o') (5.4,5.7,5.9, Table 5.4)
activation energy for microbial inactivation (2.5), J mol-l
rate coefficient for thermal inactivation (2.3), s-l
length of steriliser holding tube (2.1), m
Mean Square Error (5.2)
p seudopl as tic index (2.2)
order of reaction (5.4)
number of experimental (survival) data (5.1)
number of viable cells present at time t (5.4,5.5, 5.6), cells ml-l
number of terms in a model (5.1)
bulk number of viable cells present at time t (z.3),cells ml-l
acidity of the medium (2.7)
multiple regression coefficient (5. 1)
holding tube radius (2.2), cm
gas constan t (2.5),kg m2 s-2 K-l mole-l
time or residence time in the holding tube (2.1), s
temperature, Kelvin and oC (2.5,2.7)
velocity of the liquid in holding tube (2.1), cm ,-t
bulk velocity of the liquid in holding tube (2.2),cm r-l
per cent variance accountedfor (5.1), Vo
E
k
L
MSE
n
n
fl7
N, NoN,
Nr
< N>, <No>
pH2r
R
,¿R
t
T
u
<u>
VoV
206
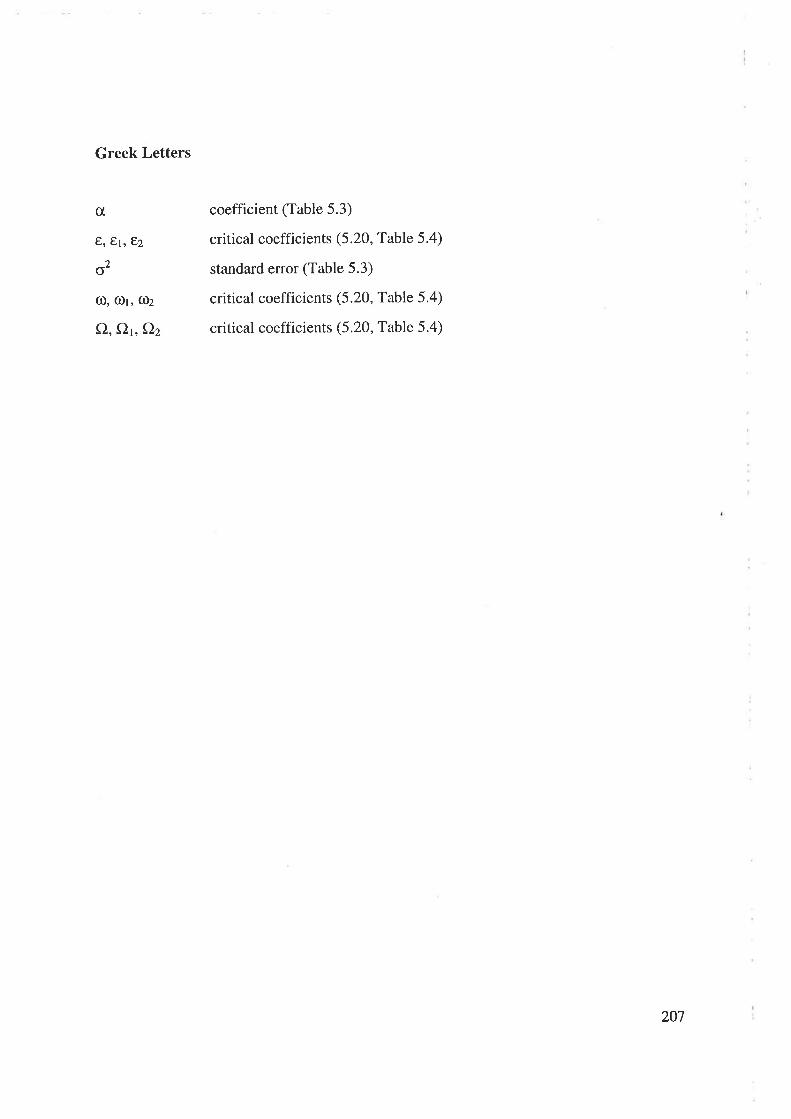
Greek Letters
c{,
E,81, E2
o2
(Ð, ú)1, ú)
O, o¡, Ç)2
coefficient (Table 5.3)
critical coefficients (5.2O, Table 5.4)
standard error (Table 5.3)
critical coefficients (5.20, Table 5.4)
critical coefficients (5.20, Table 5.4)
207

REFERENCES
208

REFERENCES
Aiba, S., Humphrey, A. E. and Millis, N. F. (1973) Biochemical Engineering,2nd edn.,
University of Tokyo Press, TokYo
Aiba, S. and Toda, K. (1967) Thermal death rate of bacterial spores, Process Biochemistry,
2(2):35-40
Aris, R. (1969) Elementary Chemical Reactor Analysis, Prentice-Hall Inc., UK, pp. 92
Ashley, M. H. J. (1982) Continuous sterilisation of media, The Chemical Engineer,54: 58
Bailey, J. E. and Ollis, D. F. (1986), Biochemical Engineering Fundamentals,2nd edn.,
McGlaw-Hill, New York
Banwart, G. J. (1979) Basic Food Microbiology, The AVI Publishing Company Inc',
Westport, Connecticut, PP. 662
Ben-Embarek, P. K. and Huss, H. H. (1993) Heat resistance of Listeria monocytogenes in
vacuum packaged pasteurized fish fillets, International Journal of Food Microbiology
20(2):85-95
Bird, R. 8., Stewart, tW. E. and Lightfoot, E. N. (1962) Transport Phenomena, John Wiley
and Sons, New York, ChaPters 2, 13
Carpenter, S. L. and Harrison, M. A. (1989) Survival of Listeria monocytogenes tn
processed poultry, Journal of Food Science,54 556-557
Cerf, O., Davey, K. R. and Sadoudi, A. K. (1996) Thermal inactivation - a new predictive
model for the combined effect of three environmental factors: temperature, pH and water
activity, F o o d Re s e arch Int e rnati onal, 29 : 2I9 -226
209

Charm, S. E. (1966) On the margin of safety in canned foods, Food Technology, 20:
665-661
Coker, G. L., Davey, K. R. and Kristall, Z. (1993) Modelling the combined effect of pH
and temperature on the denaturation of vitamins in a tubular steriliser, Asia Pacific
Conference of Chemical Engineers-CHEMECA '93, Melbourne, Australia, September
26 - 29,3:107-ll2
Cole, M. 8., Davies, K. W., Munro, G., Holyoak, C. D. and Kilsby, D. C. (1993)
A vitalistic model to describe the thermal inactivation of Listeria monocytogenes, Journal
of Industrial M icrobiolo gy, 12: 232-239
Dabbah, R., Moats, \V. A. and Mattick, F. J. (1969) Factors affecting resistance to heat and
recovery of heat-injured bacteria, Journal of Dairy Science, 52: 608-614
Daughtry, B. J., Davey, K. R. and King, K. D. (1991) Temperature dependence of growth
kinetics of food bacteria, Food Microbiology,14:2I-30
Daughtry, B. J., Davey, K. R., Thomas, C. J. and Verbyla, A. P. (1997) Process
sterilisations based on a new EDP model for the rate coefficient of thermal inactivation for
Listeria monocytogenes, Proc. 3'd International Conference on Modelling and Simulation,
MS '97, International Association for the Advancement of Modelling and Simulation
Techniques in Enterprises, Melbourne, Victoria, October 29 -3t,pp.352-356
Davey, K. R. (1980) Continuous sterilization of liquid, PhD Thesrs (University of
Melbourne)
Davey, K. R. (1952) Biochemical engineering terminology, The Chemical Engineer, 382
301
210

Davey, K. R. (1993a) Linear-Arrhenius models for bacterial growth and death and vitamin
denaturatio n, J o urnal of I ndust rial M ic rob io lo gy, 12: 17 2- 17 9
Davey, K. R. (1993b) Extension of the generalised sterilisation chart for combined
temperature and pH, Leb ensmittel-Wis s enschaft und Technolo gie, 26: 47 6-47 9
Davey, K. R. (1994) Modelling combined temperature and pH on the rate coefficient for
bacterial growth: A Review, International Journal of Food Microbiology,23;295-303
Davey, K. R. and Cerf, O. (1996) Predicting concomitant denaturation of vitamin as
influenced by combined process temperature and pH in batch and continuous flow
sterilisation of liquid, Transactions of the Institution of Chemical Engineers, Part C,
Bioproducts and Food P rocessing, 7 4: 2OO-206
Davey, K. R., Hall, R. F. and Thomas, C. J. (1995) Experimental and model studies of the
combined effect of temperature and pH on the thermal sterilisation of vegetative bacteria in
liquid, Transactions of the Institution of Chemical Engineers, Part C, Bioproducts and
F ood P roces sing, 7 3: 2I9 -226
Davey, K. R., Lin, S. H. and Wood, D. G. (1978) The effect of pH on continuous high-
temperature short-time sterilization of liquid, American Institute of Chemical Engineers
J ournal, 24 (3): 537 -540
Davey, K. R., Lin, S. H. and Wood, D. G. (1979) Laminar flow of Herschel-Bulkley fluids
- Implications for processing of liquid foods, First National Conference on Rheology,
Melbourne, May 30 - June 1, British Society of Rheology (Australia), pp. 51-55
Davey, K. R. and Wood, D. G. (1984) Laboratory evaluation of Lin's model of continuous
sterilization of micro-organisms, Chemical Engineering Research and Design, 62: ll7 -122
2tt

Deindoerfer, F. H. and Humphrey, A. E. (1959) Analytical methods for calculating heat
sterilization times, Ap p lie d M ic ro b iolo gy, 7 ; 25 6-264
Esty, J. R. and Meyer, K. F. (1922) The heat resistance of the spores of Bacillus botulinus
and allied anaerobes, Journal of Infectious Diseases,3l: 650-663
Farber, J. M. (1989) Thermal resistance of Listeria monocytogenes in foods, International
Journal of Food Microbiolo gy, 8: 285-29 I
Farber, J. M., Hughes, 4., Holley, R. and Brown, B. (1989) Thermal resistance of Listeria
monocytogenes in sausage meat, Acta Microbiologica Hungarica,36(2-3): 273-275
Grau, F. H. (1996) Smallgoods and listeria, Food Australia,4S(2):81-83.
Guariguata, C., Barreiro, J. A. and Guarigtata, G. (1979) Analysis of continuous
sterilization processes for Bingham plastic fluids in laminar f7ow, Journal of Food Science,
44:905-910
Han, Y. W., Zhang, H. I. and Krochta, J. M. (1976) Death rate of bacterial spores:
mathematical models, Canadian J ournal of Microbiolo gy, 22: 29 5
Harrison, M. A. and Carpenter, S. L. (1989a) Survival of large populations of Listeria
monocytogenes orr chicken breasts processed using moist heat, Journal of Food Protection,
52:376-378
Harrison, M. A. and Carpenter, S. L. (1989b) Survival of large populations of Listeria
monocytogenes on microwave cooked poultry, Food Microbiology,6: 153-157
Hawker, L. E. and Linton, A. H. (1979) Micro-organisms: Function, Form and
Environment,2ndedn., Edward Arnold (Publishers) Ltd, [,ondon, UK
212
Holdsworth, S. D. (1971) Applicability of rheological models to the interpretation of flow
and processing behaviour of fluid food products, Journal ofTexture Studies,2:393-418
Holdsworth, S. D. (1992) Aseptic Processing and Packaging of Food Products, Elsevier
Applied Food Science Series, Galliard Ltd, Great Yarmouth, England
Holdsworth, S. D. (L993) Rheological models used for the prediction of the flow properties
of food products: A Review, Transactions of the Institution of Chemical Engineers, Part C,
Bioproducts and Food Processing,TL: 139-179
Hugo, W. B. (1991) A brief history of heat and chemical preservation and disinfection: A
Review, Jountal of Applied Bacteriology, 7l: 9-18
Jones, M. C. and Larner, G. S. (1963) The use of steam injection as a means of rapid
heating for sterilisation of liquid foods, Chemical Engineering, Jan / Feb, CE 4-9
Jong, P. de (1997) Impact and control of fouling in milk processing, Trends in Food
Science and TechnologY, 8: 40 1 -405
Jordon, R. C. and Jacobs, S. E. (1944) Journal of Hygyene, Cambridge,43: 275 (as quoted
by Hawker and Linton 1979)
Jordon, R. C. and Jacobs, S. E. (1945) Journal of Hygyene, Cambridge,44:210 (as quoted
by Hawker and Linton 1979)
Jordon, R. C., Jacobs, S. E. and Davies, H. E. F. (1947) Journal of Hygyene, Cambridge,
45 333 (as quoted by Hawker and Linton 1979)
Kalchayanand, N., Sikes, 4., Dunne, C. P. and Ray, B. (1998) Interaction of hydrostatic
pressure, time and temperature of pressurization and pediocin AcH on inactivation of food
borne bacteria, Joumal of Food Protection,6l(4): 425-43I
213
Karaioannoglou, P. G. and Xenos, G. C. (1980) Survival of Listeria monocytogenes in
meatballs, Hellenic Veterinary Medicine,23: ll l-118
Le,e,J.M. (1992) Biochemical Engineering,Prcntice-Hall NJ, pp. 221
Lemaire, V., Cerf, O. and Audurier, A. (1989) Heat resistance of Listeria monocytogenes,
A c t a M i c r o b i o I o g i c a H un g ar ic a, 36 (2-3) : 28 I -28 4
Levenspiel, O. (1972) Chemical Reaction Engineering, 2nd edn., John Wiley and Sons,
New York
Lin, S. H. (1975) A theoretical analysis of thermal sterilization in a continuous sterilizer,
Journal of Fermentation Technology,53: 92-98
Lin, S. H. (I976) Continuous high temperature/short time sterilization of liquid with steam-
injection heating, Chemical Engineering S cience, 3l: 7 7 -82
Mackey, B. M. and Bratchell, N. (1989) Destruction of Listeria monocytogenes, Letters in
Applied Microbiolo gy, 9: 89 -94
Mackey, B. M., Pritchet, C., Norris, A. and Mead, G. C. (1990) Heat resistance of Listeria:
strain differences and effects of meat type and curing salts, Letters in Applied
M ic rob iolo gy, l0 : 25 | -255
Manson, J. E. and Cullen, J.F. (I974) Thermal process simulation for aseptic processing of
food containing discrete particulate matter, Journal of Food Science,39: 1084-1089
McKellar, R. C., Modler, H. \V., Couture, H., Hughes, 4., Mayers, P., Gleeson, T. and
Ross, W. H. (1994) Predictive modelling of alkaline phosphatase inactivation in a high-
temperature short-time pasteurizer, Journal of Food Protection, 57(5): 424-430
2r4

McMahon, C. M. M., Byrne, C. M., Sheridan, J. J., McDowell, D. 4., Blair, I. S. and
Hegarty, T. (2000) The effect of culture growth phase on induction of the heat shock
response in Yersinia enterocolitica and Listeria monocytogenes, Journal of Applied
M icrobiolo gy, 89: 198-206
McMeekin, T. 4., Olley, J. N., Ross, T. and Ratkowsky, D. A. (1993) Predictive
Microbiology-Theory and Application, Research Studies Press Ltd., Taunton, England
Meynell, G. G. and Meynell, E. (1970) Theory and Practice in Experimental Bacteriology,
University Press, Cambridge
Moats, V/. (1971) Kinetics of thermal death of bacteria, Journal of Bacteriology,l0S(l)
t65-17 I
Muriana, P. M. (1997) Effect of pH and hydrogen peroxide on heat inactivation of
Salmonella and Listeria in egg white, Food Microbiology,14: 1 1-19
Naik, S. C., l-ne, J. C. and Richardson, J. F. (1977) The rheology and aging characteristics
of sodium carboxymethylcellulose solutions, Canadian Journal of Chemical Engineering,
55:90-92
Palleroni, N. J. (1984) Genusl. Pseudomonas, in Bergey's Manual of Systematic
Bacteriology, Krieg, N. R. and Holt, J. G., (eds.) Vol I, Williams & Wilkins, [,ondon, pp.
14t
Pallerson, G. K., Zakin, J. L. and Rodriguez, J. M. (1969) Drag reduction - polymer
solution, soap solution and solid particles in suspension in pipe flow, Industrial
Engíneering Chemistry, 61( 1): 22-30
Perry, R. H. (1973) Chemical Engineers' Handbook, McGraw-Hill Kogakusha Ltd.,
Tokyo, Chapters 3-206, 5-4
2r5

Pfiefer, V. F. and Vojnovich, C. (1952) Continuous sterilization of media in biochemical
processes, Industrial Engineering Chemistry, 44(B): 1940-1946
Reichart, O' (1994) Modelling the destruction of Escherichia coli on the base (slc) of
reaction kinetics, International Journql of Food Microbiology,23: 449-465
Ruyter, P. W. de, and Brunet, R. (1973) Estimation of process conditions for continuous
sterilization of foods containing particulates , Food rechnology,2T: 44-5r
Seeliger, H. P. R. and Jones, D. (l93ú) Genus Listeria, in Bergey's Manual of Systematic
Bacteriology, sneath, P. H. 4., Mair, N. s., Sharpe, M. E. and Holt, J. G. (eds.) vol II,V/illiams & V/ilkins, London, pp.1242
Simpson, S. G. and Williams, M. C. (1974) An analysis of high temperature/ short-time
sterilization during laminar flow, Journal of Food science,3g: lo47-1053
Skelland, A. H. P. (1967) Non-Newtonian FIow and Heat Transfer, John Wiley & Sons,
NY, Chapters 1, 3,4
Snedecor, G. V/. and Cochran, 'W. G. (1969) Statistical Methods,6th edn., University
Press, Iowa
Stern, J. A. and Proctor, B. E. (1954) A micro-method and apparatus for the multiple
determination of rates of destruction of bacterial spores subjected to heat, Food
Technology, 8: 1139-1142
Tsuji, 4., Kaneko, Y., Takahashi, K., ogawa, M. and Goto, s. (1982) The effects of
temperature and pH on the growth of eight enteric and nine glucose non-fermenting species
of gram-ne gative rods, M ic r ob io I - I mmuno Io gy, 26(l) : I 5 -24
216

varnham' A' H' and Evans, M. G. (1991) Food Borne Pathogens - An lllustrated rext,Wolfe Publishing Ltd., London
weisberg, s. (19s5) Applied Linear Regression 2nd edn., wiley, New yorkwhitmarsh' J. M. (1954) continuous sterilization of fermentation medi a, Journal ofApplied Bacteriolo gy, 17 : 27 -30
V/ilkinson, w' L. (1960) Non-Newtonian Fluids - Fluid Mechanics, Mixing and HeatTransfer, Pergamon Press, London, Chapters l, 3
Xezones, H' and Hutchings, I. J. (1965) Thermal resistance of clostridium Botulinum (sic)(62A) spores as affected by fundamental food constituents, Food Technology, 19: 1003-1005
2t7