in brief - australian institute of health and welfare
TRANSCRIPT

Australia’s welfare 2019in brief
+61 2 6244 1000
GPO Box 570Canberra ACT 2601Australia
1 Thynne StreetBruce ACT 2617Australia
@aihw
www.aihw.gov.au
Stronger evidence, better decisions, improved health and welfare
Australia’s welfare 2019: in brief tells the story of welfare in Australia with key findings on housing, education and skills, employment and work, income and finance: government payments, social support, justice and safety, and Indigenous Australians.
Australia’s welfare 2019 is the 14th biennial welfare report of the Australian Institute of Health and Welfare. This edition introduces a new format and expanded product suite:• Australia’s welfare 2019: data insights• Australia’s welfare snapshots• Australia’s welfare 2019: in brief• Australia’s welfare indicators
Australia’s welfare 2019in brief

ii
The Australian Institute of Health and Welfare is a major national agency whose purpose is to create authoritative and accessible information and statistics that inform decisions
and improve the health and wellbeing of all Australians.
© Australian Institute of Health and Welfare 2019This product, excluding the AIHW logo, Commonwealth Coat of Arms and any material owned by a third party or protected by a trademark, has been released under a Creative Commons BY 3.0 (CC BY 3.0) licence. Excluded material owned by third parties may include, for example, design and layout, images obtained under licence from third parties and signatures. We have made all reasonable efforts to identify and label material owned by third parties.You may distribute, remix and build upon this work. However, you must attribute the AIHW as the copyright holder of the work in compliance with our attribution policy available at www.aihw.gov.au/copyright/. The full terms and conditions of this licence are available at http://creativecommons.org/licenses/by/3.0/au/.This publication is part of the Australian Institute of Health and Welfare’s Australia’s welfare series. A complete list of the Institute’s publications is available from the Institute’s website www.aihw.gov.au.
ISSN 2651-9801 (Online)
ISBN 978-1-76054-585-7 (Online)ISBN 978-1-76054-586-4 (Print)
DOI 10.25816/5d5e1912778e0
Suggested citationAustralian Institute of Health and Welfare 2019. Australia’s welfare 2019 in brief. Cat. no. AUS 227. Canberra: AIHW.
Australian Institute of Health and WelfareBoard Chair Chief Executive Officer Mrs Louise Markus Mr Barry Sandison
Any enquiries relating to copyright or comments on this publication should be directed to:
Australian Institute of Health and Welfare GPO Box 570 Canberra ACT 2601
Tel: (02) 6244 1000 Email: [email protected]
Published by the Australian Institute of Health and Welfare.
Please note that there is the potential for minor revisions of data in this report.Please check the online version at www.aihw.gov.au.

iii
Contents
1 Welfare in Australia . . . . . . . . . . . . . . . . . . . . . . . . . . . . . . . . . . . . . . . . 1
2 Housing . . . . . . . . . . . . . . . . . . . . . . . . . . . . . . . . . . . . . . . . . . . . . . . . . . 10
3 Education and skills . . . . . . . . . . . . . . . . . . . . . . . . . . . . . . . . . . . . . . . 20
4 Employment and work . . . . . . . . . . . . . . . . . . . . . . . . . . . . . . . . . . . . . 30
5 Income and finance: government payments . . . . . . . . . . . . . . . . . . 38
6 Social support . . . . . . . . . . . . . . . . . . . . . . . . . . . . . . . . . . . . . . . . . . . . 44
7 Justice and safety . . . . . . . . . . . . . . . . . . . . . . . . . . . . . . . . . . . . . . . . . 50
8 Indigenous Australians . . . . . . . . . . . . . . . . . . . . . . . . . . . . . . . . . . . . . 58

iv
About Australia’s welfare 2019This edition of the AIHW’s biennial flagship report on welfare introduces a new format and an expanded product suite:
Australia’s welfare 2019: data insights is a collection of articles on selected welfare topics, including an overview of the welfare data landscape, and contributions by academic experts. It is available as a print report and online as a PDF.
Australia’s welfare snapshots are 41 web pages that present key facts on housing, education and skills, employment and work, income and finance: government payments, social support, justice and safety, and Indigenous Australians. They are available online in HTML (updated when new data are available) and as a compiled PDF.
Australia’s welfare 2019: in brief presents key findings and concepts from the snapshots to tell the story of welfare in Australia. It is available as a print report and online as a PDF.
Australia’s welfare indicators is an interactive data visualisation tool that measures welfare system performance, individual and household determinants and the nation’s wellbeing. It is available online in HTML.
All products can be viewed or downloaded at www.aihw.gov.au/australias-welfare.
Australia’s welfare 2019: data insights
Australia’s welfare 2019: in brief
Australia’s welfare indicators
Australia’s welfare snapshots

v

1 Welfare in Australia

Australia’s welfare 2019: in brief 1
A person’s welfare,
or wellbeing, is affected by
many factors, including their
housing, education and family functioning.
Some people see welfare as primarily income support,
but support and services in many areas of life are critical.
Wellbeing can be difficult to measure and report on. Frequently
measured outcomes include a person’s income, work–life balance
and feelings of safety. Measuring the performance of welfare services also
enables us to track the need for welfare support and provides
insights into the nation’s wellbeing more
broadly.
Australia’s welfare 2019: in brief2
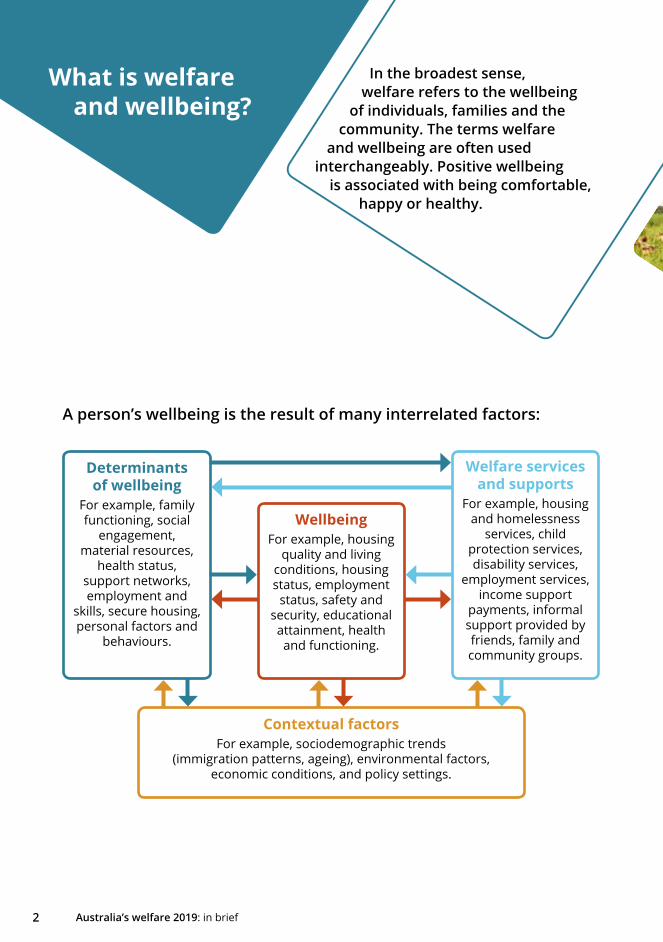
A person’s wellbeing is the result of many interrelated factors:
Welfare services and supports
For example, housing and homelessness
services, child protection services, disability services,
employment services, income support
payments, informal support provided by friends, family and community groups.
WellbeingFor example, housing
quality and living conditions, housing status, employment
status, safety and security, educational attainment, health and functioning.
Determinants of wellbeing
For example, family functioning, social
engagement, material resources,
health status, support networks, employment and
skills, secure housing, personal factors and
behaviours.
Contextual factorsFor example, sociodemographic trends
(immigration patterns, ageing), environmental factors, economic conditions, and policy settings.
What is welfare and wellbeing?
In the broadest sense, welfare refers to the wellbeing
of individuals, families and the community. The terms welfare
and wellbeing are often used interchangeably. Positive wellbeing
is associated with being comfortable, happy or healthy.

Australia’s welfare 2019: in brief 3
A person’s wellbeing can be bolstered by the help they receive in a time of need. This can come from family, friends and the community, or from government and/or non-government organisations. Services and support can include:
• government payments, such as income support, family assistance payments and supplementary payments—for example, Age Pension and Family Tax Benefit
• tax concessions
• welfare services, such as employment services, child protection services, homelessness services, and social housing
Find out more: Understanding welfare and wellbeing www.aihw.gov.au/australias-welfare/snapshots

Australia’s welfare 2019: in brief4
Overall, Australia is faring well on many indicators:
Fewer people are working very long hours
2009 201816% 14%
of employed people worked 50 hours or more a week
Civic engagement has increased
2010 201990% 97%
of eligible people were enrolled
to vote
More homes have internet access
2007–08 2016–1767% 86%
What do Australia’s welfare indicators show?
One in 4 unemployed people are long-term unemployed
2009 201815% 25%
of unemployed people aged 15 and over had been looking for
work for more than a year
One in 9 families with children are jobless
2012 201712% 12%
of families with children under 15 had no one in the family
who was employed
Find out more: Australia’s welfare indicators www.aihw.gov.au/reports-data/indicators/australias-welfare-indicators
Australia’s welfare indicators
summarise the performance of welfare
services, track individual and household determinants of the
need for welfare support, and provide insights into the
nation’s wellbeing more broadly.
The measures in some other areas are not as encouraging:

Australia’s welfare 2019: in brief 5
How do we compare internationally?
Comparing welfare data between Australia and the other member
countries of the Organisation for Economic Co-operation and
Development (OECD) helps to inform policy, planning and decision-making.
Australia has a relatively high life satisfaction, ranking 10th out of 35 OECD countries.
Health-adjusted life expectancy
Life satisfaction
Perception of safety in the community
Air quality
Greenhouse gas emissions per capita
Social connectedness
Internet access
Long-term unemployment ratio
Youth unemployment rate
Young people not in education, employment or training
Household net disposable income
Income inequality
Employment to population ratio
Employees working 50 hours or more
Tertiary education
Population dependency ratio
Overseas-born population
Gross domestic product (GDP) per capita
Find out more: International comparisons of welfare data www.aihw.gov.au/australias-welfare/snapshots
Australia’s ranking in 2018 (or based on the latest year of data):
Worst third Middle third Best third
Lowest third Middle third Highest third

Australia’s welfare 2019: in brief6
Social determinants are among the many factors that can influence our
health. For example, people with lower levels of education have higher rates of
death due to cardiovascular disease.
In 2011–12, if all Australians aged 25–74 had the same cardiovascular disease death rate as
people with a bachelor’s degree or higher:
• the death rate for the disease would have fallen by 55%
• there would have been 7,800 fewer deaths from the disease
In 2016–17, 4,600 women and 1,700 men were hospitalised due to family and domestic violence.
In 2017–18, 121,000 people who sought specialist homelessness services were experiencing family and domestic violence.
Health and welfare linksOur personal circumstances are key drivers of our
health and wellbeing. How we grow, live, work and age all play a role.
Many issues involve both health and welfare services; for example, family, domestic and sexual violence can have a serious impact on a person’s health, but also on other aspects of their life, such as their job or housing status.
Find out more: Health and welfare links www.aihw.gov.au/australias-welfare/snapshots
Australia’s welfare 2019: in brief 7
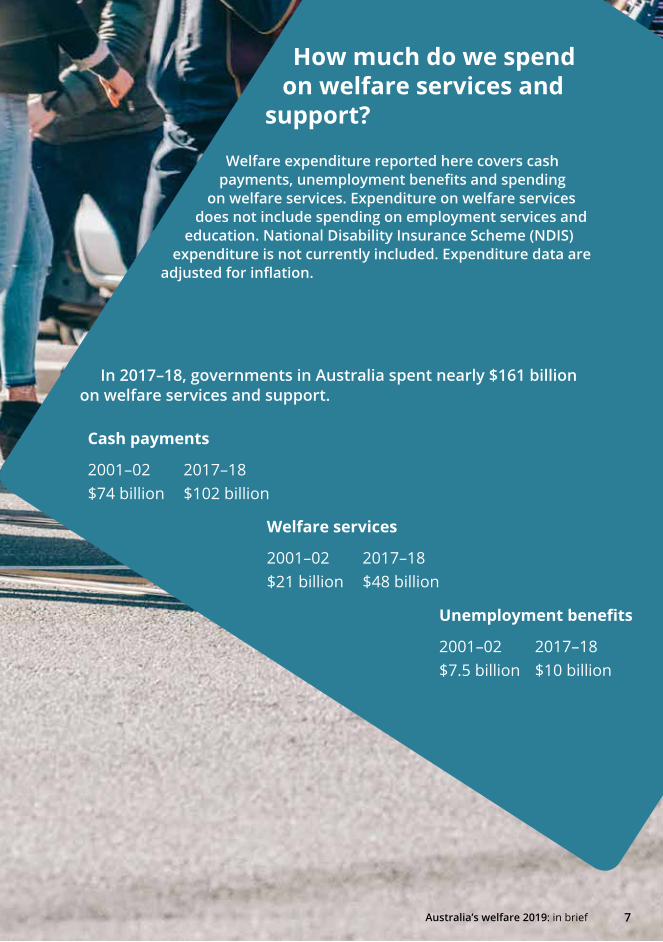
How much do we spend on welfare services and
support?
Welfare expenditure reported here covers cash payments, unemployment benefits and spending
on welfare services. Expenditure on welfare services does not include spending on employment services and
education. National Disability Insurance Scheme (NDIS) expenditure is not currently included. Expenditure data are
adjusted for inflation.
In 2017–18, governments in Australia spent nearly $161 billion on welfare services and support.
Cash payments
2001–02 2017–18$74 billion $102 billion
Unemployment benefits
2001–02 2017–18 $7.5 billion $10 billion
Welfare services
2001–02 2017–18$21 billion $48 billion
Australia’s welfare 2019: in brief 7

Australia’s welfare 2019: in brief8
Between 2001–02 and 2017–18, welfare spending in real terms (adjusted for inflation) grew slightly faster than the population, with per person spending rising an average of 1.3% a year (from $5,287 in 2001–02 to $6,482 in 2017–18).
There are challenges in comparing welfare spending across countries. For example, the social support structures in many countries are complex, and not necessarily comparable.
Welfare spending as a proportion of GDP, selected OECD countries, 2016Finland (highest) 23.0%
OECD median 13.3%
United Kingdom 12.2%
Australia 10.9%New Zealand 10.6%
United States 10.0%
Canada 9.8%
Mexico (lowest) 3.8%
Find out more: Welfare expenditure www.aihw.gov.au/australias-welfare/snapshots
8 Australia’s welfare 2019: in brief

Australia’s welfare 2019: in brief 9
More people are working in welfare
The welfare workforce comprises people who provide community services to the Australian population. These services are provided by public and private organisations and vary widely, from care for the elderly in residential aged care facilities, to counselling and social assistance for students in educational settings.
The welfare workforce has increased by 72% between 2008 and 2018 and now employs more than 550,000 people, or 4.4% of the working population. Over the same period, the total workforce grew by 18%.
The welfare workforce comprises:
• 179,000 workers in residential care services
• 185,000 workers in preschool education and child care
• 186,000 workers in other social assistance services
Profile of welfare workers:
87% are female, compared with 47% of all employed people
64% work part time, compared with 32% for all Australian workers
$840 is their average weekly earnings, compared with $1,106 for workers in similar occupations in other industries
Find out more: Welfare workforce www.aihw.gov.au/australias-welfare/snapshots
Australia’s welfare 2019: in brief10
2
Housing
Australia’s welfare 2019: in brief 11
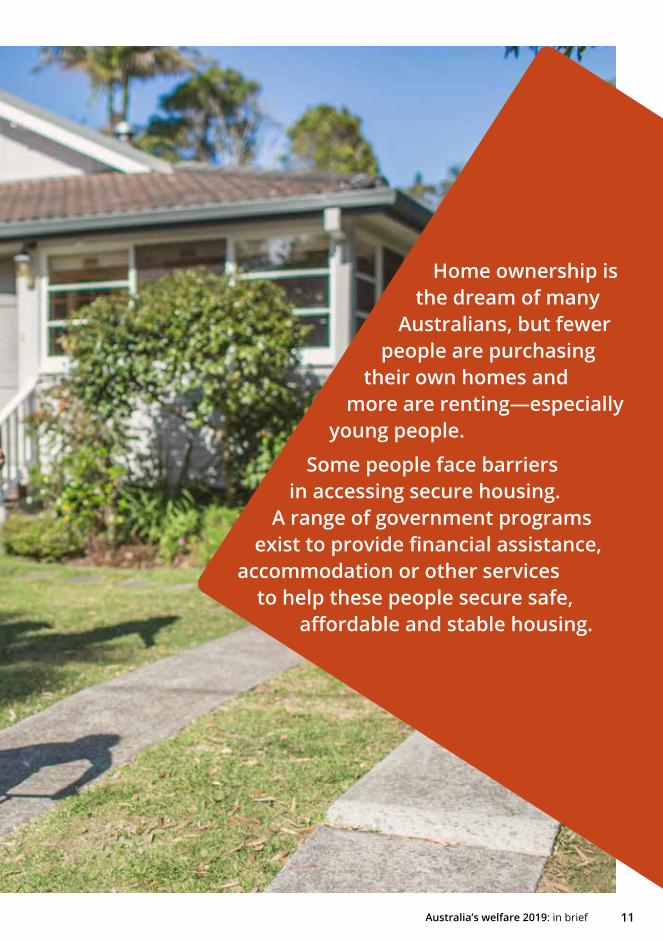
Home ownership is the dream of many
Australians, but fewer people are purchasing
their own homes and more are renting—especially
young people.
Some people face barriers in accessing secure housing.
A range of government programs exist to provide financial assistance,
accommodation or other services to help these people secure safe,
affordable and stable housing.

Australia’s welfare 2019: in brief12
How many Australians own the home they live in?
Many Australians aspire to own their own home, with home ownership providing security and a range of social and economic benefits to home owners.The proportion
of Australians who own their own home, with
or without a mortgage, has been around 67–70% since the mid-1960s,
with two-thirds of people owning a home in 2016.
However, fewer younger
people (aged under 35) own their own home.
More people are renting (private rental market)—especially younger age groups.
2006
47% 50% 54%
Under 35 years2011 2016 2006
21% 24% 27%
35–54 years2011 2016 2006
55 years and over2011 2016
8.9% 9.8% 11%
Find out more: Home ownership and housing tenure www.aihw.gov.au/australias-welfare/snapshots
Age 25–29
50% in 1971 37% in 2016 Age 30–34
64% in 1971 50% in 2016

Australia’s welfare 2019: in brief 13
Many Australians aspire to own their own home, with home ownership providing security and a range of social and economic benefits to home owners.
The proportion of households spending less than a quarter of their income on housing is shrinking. The proportion spending more than half is growing.
Percentage of income spent on housing costs 1994–95 2005–06 2017–18
More than 50% 4.6 5.1 5.530–50% 9.2 11 1225–50% 5.8 7.0 7.6Less than 25% 80 77 75
People are spending a higher proportion of their incomes on housing than in the past.
How much do Australians spend on housing?
Australia’s welfare 2019: in brief 13

Australia’s welfare 2019: in brief14
What are low-income households?
Put simply, these are households with the lowest 40% of household disposable income.
More than 1 million low-income
households were in housing stress in 2017–18. Housing
stress is particularly common among renters.
FORRENT
What is housing
stress?
When households with lower incomes spend more
than one-third of their income on rent or mortgage
repayments, they are considered to be
in ‘housing stress’.
14 Australia’s welfare 2019: in brief

Australia’s welfare 2019: in brief 15
Private renter 32% Owner with a mortgage 29%Owner without a mortgage 6.0%
What proportion of their income do low-income households spend on housing?
Housing stress is most common among low-income renters in capital cities and has increased over time.
Low-income households considered to be in rental stress
2007–08 2017–18
Capital cities 39% 48%
Outside capital cities 30% 36%
Housing costs as a percentage of gross household income, low-income households, 2017–18
Find out more: Housing affordability www.aihw.gov.au/australias-welfare/snapshots

Australia’s welfare 2019: in brief16
Social housing tenants are more likely to be female, and it is common for tenants to have a disability or be single adults.
6 in 10 (56%) tenants are female
4 in 10 (38%) households include someone with a disability
6 in 10 (55%) households consist of single adults
Who lives in social housing?
At 30 June 2018, there were almost
804,000 people living in social
housing.

Australia’s welfare 2019: in brief 17
Find out more: Housing assistance www.aihw.gov.au/australias-welfare/snapshots
Housing assistance programs help Australians on low incomes secure affordable housing. Depending on their situation, assistance might involve the government providing financial assistance to help with the cost of privately renting, or providing accommodation via social housing programs—including public housing, state owned and managed Indigenous housing, and community housing.
Most new social housing spots are filled by households considered in greatest need—many of which were experiencing homelessness.
Percentage of new spots filled with households in greatest need:
• Public Housing—76%, up from 74% in 2013–14
• Community Housing—82%, up from 75% in 2013–14
• State owned and managed Indigenous housing—63%, up from 59% in 2013–14

Australia’s welfare 2019: in brief18
On Census night in 2016, more than 116,000 people were experiencing homelessness in Australia.
The most common form of homelessness is living in severely overcrowded housing.
Of those who were homeless on Census night:
• 44% were living in severely overcrowded dwellings
• 18% were living in supported accommodation for the homeless
• 15% were staying temporarily with other households
• 15% were living in boarding houses
• 7% were sleeping rough
• 1% were living in other temporary lodgings
Who experiences homelessness and what help do they receive?
Australia’s welfare 2019: in brief 19
Find out more: Homelessness and homelessness services www.aihw.gov.au/australias-welfare/snapshots
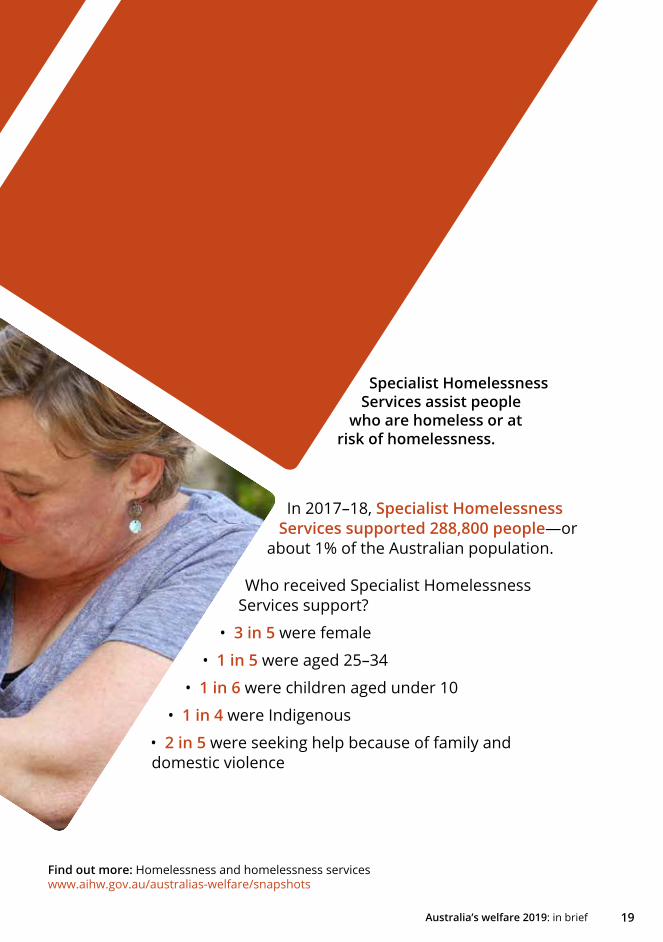
Who experiences homelessness and what help do they receive?
In 2017–18, Specialist Homelessness Services supported 288,800 people—or
about 1% of the Australian population.
Who received Specialist Homelessness Services support?
• 3 in 5 were female
• 1 in 5 were aged 25–34
• 1 in 6 were children aged under 10
• 1 in 4 were Indigenous
• 2 in 5 were seeking help because of family and domestic violence
Specialist Homelessness Services assist people
who are homeless or at risk of homelessness.

Australia’s welfare 2019: in brief20
3
Education and skills

Australia’s welfare 2019: in brief 21
Generally, the higher a
person’s level of education, the more
opportunities they have in their working
life. Completing Year 12 or higher education can
also improve a person’s social opportunities and overall
health and wellbeing.
The groundwork for educational attainment starts in a child’s early
years. Participation in early childhood education can help to develop a child’s
cognitive, emotional, behavioural and social skills, and prepare
them for formal schooling.

Australia’s welfare 2019: in brief22
More children are in preschool and child care
Child care and early childhood education is provided by a range of formal and informal services, including kindergartens, preschools, child care centres, before and after school care programs, family day carers, babysitters, and family friends or relatives.
In 2017, nearly half (49%, or 2 million) of
all children aged 0–12 attended formal or
informal child care and early childhood education.
Find out more: Early childhood education and care www.aihw.gov.au/australias-welfare/snapsots
In 2018, more than 342,000 Australian 4 and 5 year olds were enrolled in a preschool program, either at a preschool or through a child care centre.
17% in 1999
28% in 2017
The proportion of children aged
0–11 attending formal child care
has risen.
4 year olds
86%
5 year olds
21%

Australia’s welfare 2019: in brief 23
In 2017, nearly half (49%, or 2 million) of
all children aged 0–12 attended formal or
informal child care and early childhood education.
Are our children ready for school?
Physical health and wellbeing
Social competence
Emotional maturity Language and
cognitive skillsCommunication
skills and general knowledge
Children’s developmental
readiness for school is assessed across
5 domains
Find out more: Transition to primary schoolwww.aihw.gov.au/australias-welfare/snapshots
In 2018, 4 in 5 (78%) children were on track developmentally when they started
primary school, according to assessments made by teachers.
Developmental vulnerability differs by sex, socioeconomic area, and remoteness area. For example:
Boys are nearly twice as likely to be developmentally vulnerable on 1 or more domains as girls.
Boys
28%
Girls
15%

Australia’s welfare 2019: in brief24
How are our students performing?In Australia, children must attend school until they complete Year 10. They must then participate in full-time education, employment, training or a mix, until they are 17.
Average NAPLAN score, change between 2008 and 2018
NAPLAN domain Year 3 Year 5 Year 7 Year 9
Reading
Writing*
Spelling
Grammar & punctuation
Numeracy
Since national literacy and numeracy tests (National
Assessment Program—Literacy and Numeracy, or NAPLAN) began
in 2008, the average scores have generally improved across different
domains, except in writing.
Statistically significant increase Statistically significant decrease
Increase (not statistically significant) Decrease (not statistically significant)
* Writing comparison is for 2011 and 2018
Australia’s welfare 2019: in brief24

Australia’s welfare 2019: in brief 25
Average PISA score, Australia compared with OECD average, 2015
PISA subject areas Australia OECD average
Reading 503 493
Maths 494 490
Science 510 493
The latest survey took place in 2018 and results will be published in December 2019.
Find out more: School student engagement and performance www.aihw.gov.au/australias-welfare/snapshots
The Programme for International Student
Assessment (PISA) is a 3-yearly survey of 15-year-old students
around the world that focuses on science, reading and maths. Australian students continue to
perform above the OECD average, but the gap
has narrowed.
Australia’s welfare 2019: in brief 25

Australia’s welfare 2019: in brief26
How many students are staying in school?
Participating in secondary education enables young
people to develop skills and knowledge that can lead to
improved health and wellbeing, and social and economic
opportunities.
Find out more: Secondary education: school retention and completion www.aihw.gov.au/australias-welfare/snapshots
In 2018, more than three-quarters (78%) of
people aged 15–64 had a Year 12 or equivalent
qualification.
The proportion of students staying in school until Year 12 has risen.
2008 2018
69%81%
Male2008 2018
Female
80%89%
Australia’s welfare 2019: in brief 27
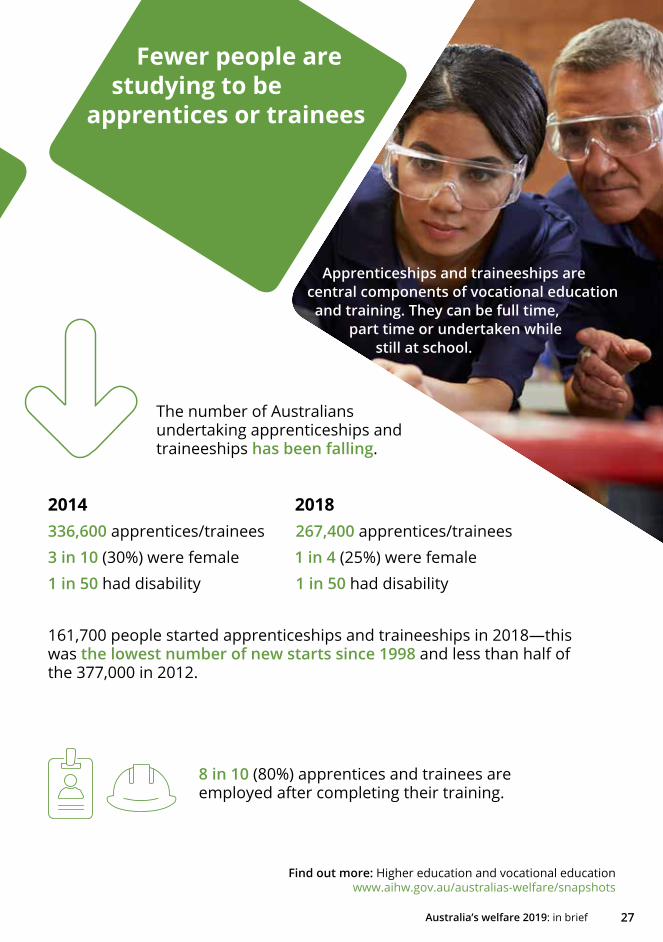
161,700 people started apprenticeships and traineeships in 2018—this was the lowest number of new starts since 1998 and less than half of the 377,000 in 2012.
8 in 10 (80%) apprentices and trainees are employed after completing their training.
Participating in secondary education enables young
people to develop skills and knowledge that can lead to
improved health and wellbeing, and social and economic
opportunities.
Fewer people are studying to be apprentices or trainees
Apprenticeships and traineeships are central components of vocational education and training. They can be full time, part time or undertaken while still at school.
Find out more: Higher education and vocational education www.aihw.gov.au/australias-welfare/snapshots
The number of Australians undertaking apprenticeships and traineeships has been falling.
2014 2018336,600 apprentices/trainees 267,400 apprentices/trainees3 in 10 (30%) were female 1 in 4 (25%) were female1 in 50 had disability 1 in 50 had disability

Australia’s welfare 2019: in brief28
Find out more: Higher education and vocational education www.aihw.gov.au/australias-welfare/snapshots
Roughly the same proportion of males and females have a non-school qualification.
The proportion of people aged 15–64
enrolled in non-school qualifications has
risen.
Non-school qualifications include Certificate I–IV, Diploma, Bachelor, Master and Doctoral level qualifications.
More Australians have non-school qualifications
2008 2018
12%14%
In 2018, 3 in 5 (60%, or 11 million) Australians aged 15–74 had a non-school qualification. Bachelor degree
or higher
45%
Certificate III/IV
30%
Males (61%) Females (60%)

Australia’s welfare 2019: in brief 29
Males (61%) Females (60%)
Australia’s welfare 2019: in brief 29
Australia’s welfare 2019: in brief30
4 Employment and work

Australia’s welfare 2019: in brief 31
Most Australians
get all or at least some of
their income from employment and,
increasingly, that employment is part time.
Working part time enables some people to balance
work with other activities, including caring responsibilities.
However, some people are ‘underemployed’—they are working
fewer hours than they prefer.
Activities undertaken by volunteers are also very valuable. Volunteering
benefits the economy and the health and wellbeing of
volunteers.
Employment and work

Australia’s welfare 2019: in brief32
Most of us have a job
Find out more: Employment trends www.aihw.gov.au/australias-welfare/snapshots
Having a job enables people to support themselves, their families and their
communities. Employment is also tied to physical and mental health
outcomes and is important to a person’s overall
wellbeing.
The level of overall employment in Australia has risen since the
1970s—mostly driven by the increase in females joining the
workforce.
In December 2018, the employment rate for females aged 15–64 was 70%—the
highest point recorded in Australia. In contrast, the rate for males was 79%,
which was slightly lower than the 82% in 1978.
Females
1978 1988 1998 2008 201846% 55% 60% 67% 70%
1978 1988 1998 2008 201882% 79% 76% 79% 79%
Males In December 2018, the unemployment
rate was 5.1%.

Australia’s welfare 2019: in brief 33Australia’s welfare 2019: in brief 33
More of us are working part timeFor many people, working part time enables them to balance work with other activities, including caring for children, parents or those with disability. It can also help older Australians to stay in work while transitioning to retirement, and enables students to have a part-time job while studying.
Three in 10 Australians work part time.
Find out more: The experience of employment www.aihw.gov.au/australias-welfare/snapshots
2008 2018 28% 31%
The proportion of people working part time has risen over the past decade.

Australia’s welfare 2019: in brief34
And more of us are underemployed
Find out more: Employment trends www.aihw.gov.au/australias-welfare/snapshots
Not everyone who is employed is working the hours they are willing and available to work. These people are considered to be ‘underemployed’.
In December 2018, 1 in 11 (9.0%) employed people aged 15–64 were underemployed—7.0% and 11.2% of the male and female labour force, respectively.
Since the late 1970s, the underemployment rate has trended upwards for both males and females.
7.0% 11.2%

Australia’s welfare 2019: in brief 35
Find out more: Employment services www.aihw.gov.au/australias-welfare/snapshots
Employment services
Employment services help people to find a job and/or acquire the skills needed to find and maintain work. They primarily provide support to people who receive income support payments, such as Newstart Allowance. The main employment services program for Australian job-seekers receiving income support is jobactive. Other services include the Disability Employment Service and Transition to Work.
More than 364,000 job placements were recorded in jobactive from April 2017 to March 2018.
Of people who left the jobactive program in the 12 months to March 2018:
• 64% were employed 3 months later
• 21% were unemployed
• 16% had left the labour force
There were more than 49,300 job placements under the Disability Employment Service in 2017–18.
Nearly 1 in 3 (32%) people were in employment 3 months after taking part in the program.
About 2 in 5 (42%) young people who have started the Transition to Work program since it began in 2016 have had a job placement.

Australia’s welfare 2019: in brief36
How many Australians volunteer?
Volunteering benefits both the
community and the people volunteering. Volunteers can
bring new insights to organisations, helping to improve efficiency and
effectiveness. For volunteers, benefits include greater social engagement,
feeling happier and personal satisfaction.
Three in 10 Australians are
volunteers.
Find out more: Volunteers www.aihw.gov.au/australias-welfare/snapshots

Australia’s welfare 2019: in brief 37
In 2014, 31% of Australians aged 15 and over—5.8 million people—did some voluntary work. Of these, 54% were female and 46% were male.
How much time did they contribute? About 743 million hours.
Who is most likely to volunteer?
• 15–17 year olds (42%) followed by people aged 35–44 (39%) and
65–74 (35%)
• Couples with children (38%) compared with couples without children (29%) and
individuals without children (25%)
• People in Outer regional and remote areas (39%) followed by Inner regional (33%) and Major cities (30%)
• People in households with highest income (39%) compared with lowest income (23%)
• People who work part time (38%) compared with those who work full time (30%), are not in the labour
force (30%) or who are retired (27%)

Australia’s welfare 2019: in brief38
Income and finance: government payments
5

Australia’s welfare 2019: in brief 39
Earning an income helps a person support
themselves, their family and the community more
broadly. However, some people may not be able to
earn enough money to meet the everyday costs of living and
require government assistance. Government payments, such as
income support and family assistance, help those who may not be able
to fully support themselves or would benefit from financial
assistance at different stages of their life.

Australia’s welfare 2019: in brief40
Fewer people are receiving unemployment and parenting payments
Income support payments assist people with the everyday costs of
living. Unemployment payments provide assistance to those who cannot find work.
Parenting payments are paid in recognition of the impact caring for a young child can
have on a parent’s capacity to work.
Parenting payment recipients
24% for less than 2 years
76% for 2 or more years
Find out more: Unemployment and parenting income support payments www.aihw.gov.au/australias-welfare/snapshots
The proportion of people aged 18–64 receiving unemployment payments has remained relatively stable over the past 2 decades, while the proportion receiving parenting payments has fallen.
At 29 June 2018, about 7% or 1.1 million people aged 18–64 were receiving unemployment or parenting payments, down from 13% or 1.3 million people in 2001.
2 in 3 recipients of unemployment or parenting payments at 29 June 2018 had been receiving income support for 2 or more years.
Unemployment payment recipients
40% for less than 2 years
60% for 2 or more years
Proportion of people aged 18–64 receiving
unemployment payments
2001 20185.3% 5.2%
Proportion of people aged 18–64 receiving
parenting payments
2001 20185.1% 2.1%

Australia’s welfare 2019: in brief 41
Find out more: Disability Support Pension and Carer Payment www.aihw.gov.au/australias-welfare/snapshots
More women are receiving Disability Support Pension or Carer Payment
Disability Suppport Pension assists people who have a reduced capacity to work because of impairment. Carer Payment assists people who cannot fully support themselves through work because of their caring role.
At 29 June 2018, about 6%—or 908,200— Australians aged 18–64 were receiving Disability Support Pension or Carer Payment.
In 2001, 1.5 times as many men received Disability Support Pension or Carer Payment as women. In 2018, more women were receiving one of these payments than men (478,600 and 429,600, respectively).
Note: Data may differ from official statistics on income support payments and recipients, due to differences in methodology and/or data source.
0
100,000
200,000
300,000
400,000
500,000
600,000
2001 2002 2004 2006 2008 2010 2012 2014 2016 2018
Year
Number of people receiving Disability Support Pension or Carer Payment

Australia’s welfare 2019: in brief42
At 29 June 2018, 37% of older income support recipients received part-rate payment. The rate of payment is influenced by income earned from work, investments, superannuation and/or substantial assets.
Find out more: Welfare payments for older people www.aihw.gov.au/australias-welfare/snapshots
Between 2001 and 2018, the proportion of older people receiving income support
has remained relatively stable. However, an ageing and growing population means
the number of older people receiving income support rose from 1.6 million to 2.6 million—a
60% increase.
The proportion of older people receiving Age Pension has remained relatively stable for most of the past 2 decades, but has fallen in recent years. The proportion of older people receiving Disability Support Pension or Carer Payment has risen—this is partially due to the incremental increase in the qualifying age for Age Pension.
Proportion of older people receiving Age Pension
2001–2015 2018 67–70% 63%
Proportion of older people receiving Disability Support Pension or Carer Payment
2001 20180.2% 3.0%
More than 2.6 million older Australians receive income support payments After retiring, many older
Australians (aged 65 and over) receive government
assistance—including Age Pension, Disability Support
Pension or Carer Payment—as their main source of income.

Australia’s welfare 2019: in brief 43
Family Tax Benefit payments support 2.8 million children
Family Tax Benefit (FTB) is a payment designed to help families with the costs of raising children. If a family is found to be eligible, they may receive FTB Part A (a per child payment) or Part B (a per family payment for single parents or families with 1 main income). At 29 June 2018,
1.4 million Australians were receiving FTB
payments, supporting 2.8 million children.
Australia’s welfare 2019: in brief 43
Find out more: Family assistance payments www.aihw.gov.au/australias-welfare/snapshots
Most FTB recipients received both FTB Part A and Part B.
77% received Part A and Part B
22% received Part A only
1% received Part B only
The proportion of FTB recipients receiving income support payments
has increased over time.
June2012
38%44%
June2018
FTB Part A recipients
2011 20181.6 million 1.4 million
FTB Part B recipients
2011 20181.4 million 1.1 million
The number of people receiving FTB payments has fallen.
Australia’s welfare 2019: in brief44
6 Social support

Australia’s welfare 2019: in brief 45
Social support in
its broadest sense means
people and services that you
can turn to, or rely on, in times of need.
Social support can be in the form of formal services
or informal care.
Formal services include programs and payments available to the
whole population or targeted to specific groups, such as those with
disability or in aged care.
Informal carers can be family, friends or neighbours who
provide assistance with activities such as child
care, housework, or transport.
Social support

Australia’s welfare 2019: in brief46
More than 3,000 aged care providers in Australia deliver care through nearly 9,000 outlets. The cost to governments in 2017–18 was $18.4 billion.
Of Australians aged 65 and over in 2017–18:
• 7% accessed residential aged care
• 22% accessed some form of support or care at home
• 71% lived at home without accessing government-subsidised aged care services
More than 1.2 million people (or 3 in 10 older Australians) used aged care services in 2017–18.
Of these:
• 77% (around 927,000) received support in their home or other setting in the community
• 1.6% (nearly 19,000) were under the age of 65, including around 9,600 Indigenous Australians
3 in 10 older Australians use aged care services
Aged care aims to promote
the wellbeing and independence of older
people by enabling them to stay in their own homes
or by supporting them in residential care.
Find out more: Aged care www.aihw.gov.au/australias-welfare/snapshots

Australia’s welfare 2019: in brief 47
Find out more: Supporting people with disability www.aihw.gov.au/australias-welfare/snapshots
Of 280,000 people using services under the NDA in 2017–18:
• almost 3 in 5 (58%) were male
• the average age was 37
• 1 in 17 (5.9%) were Indigenous
Specialist disability support services and payments help people
with disability participate fully in all aspects of everyday life. Disability services
are provided under the National Disability Insurance Scheme (NDIS) or the National
Disability Agreement (NDA). The NDIS, which is currently being rolled out across Australia,
is expected to largely replace the provision of services under the NDA.
In 2015, about 1 in 5 (18%)—or 4.3 million Australians—had disability.
Of these, nearly 1 in 3 (32%), had severe or profound disability. This means that they sometimes or always needed help with day-to-day activities related to self-care, mobility or communication.
Of the 172,000 people using services under the NDIS (having an approved individual support plan and an associated funding package) at June 2018:
• more than 3 in 5 (62%) were male
• almost half (47%) were aged 18 and under
• 1 in 20 (5.4%) were Indigenous
More males use disability services

Australia’s welfare 2019: in brief48
Find out more: Informal carers www.aihw.gov.au/australias-welfare/snapshots
2.7 million Australians are informal carers
Informal care is unpaid and usually takes place in
the context of an existing relationship such as a
family member, a friend or a neighbour. The type
and level of care varies considerably, and can include
helping someone with showering, eating or shopping, transport, or
providing in-home supervision.
More than 1 in 10 Australians—or 2.7 million people—were informal carers in 2015.
Of these:
• almost 1 in 3 (32%, or 860,000) were primary
carers—meaning they provided the most care to the person needing
support
• more than 1 in 3 (37%, or 991,000) were aged 35–54
• 274,000 carers aged 16 and over received the means-tested Carer Payment
Australia’s welfare 2019: in brief48

Australia’s welfare 2019: in brief 49
Find out more: Social isolation and loneliness www.aihw.gov.au/australias-welfare/snapshots
Australia’s welfare 2019: in brief 49
Of these:
• almost 1 in 3 (32%, or 860,000) were primary
carers—meaning they provided the most care to the person needing
support
• more than 1 in 3 (37%, or 991,000) were aged 35–54
• 274,000 carers aged 16 and over received the means-tested Carer Payment
Loneliness is also more common among:
• young adults
• males
• people with children
1 in 4 Australians are lonely
Loneliness has been linked to premature death, poor physical and mental health
and general dissatisfaction with life.
1 in 4 Australians are currently experiencing an episode of loneliness.
Loneliness is more common among people who live alone—1 in 4 Australian households are made up of a person living on their own.
1 in 2 Australians feel lonely at least 1 day a week.
1 in 10 Australians say they lack social support.

Australia’s welfare 2019: in brief50
7 Justice and safety

Australia’s welfare 2019: in brief 51
Ensuring the safety of the community can take
many forms and involve many systems. The prison and
youth justice systems deal with people who have committed—or
are alleged to have committed—a crime. Other systems work to protect
children from harm, and ensure they grow up in a safe environment.
Justice and safety

Australia’s welfare 2019: in brief52
Addressing the health and welfare concerns of prisoners
may help them reintegrate into the community.
Who is in prison in Australia?
Find out more: Adult prisoners www.aihw.gov.au/australias-welfare/snapsots
Find out more: Youth justice
www.aihw.gov.au/ australias-welfare/
snapshots
Prisoners often face a range of social and health challenges
before they arrive in prison.
Prisoners are more likely to be young, male, and Indigenous when compared with the general community.
4 in 5 are male2 in 5 are Indigenous2 in 3 are aged under 40
Most people entering prison have been in prison before and many are unemployed.
3 in 4 have been in prison before
1 in 2 are unemployed

Australia’s welfare 2019: in brief 53
Young people from Very remote areas were 9 times as likely as those from Major cities to be under supervision.
Find out more: Youth justice
www.aihw.gov.au/ australias-welfare/
snapshots
4 in 5 are male2 in 5 are Indigenous2 in 3 are aged under 40
How many young people are under youth justice supervision?
The youth justice system manages children and young people (aged 10
years and over) who have committed or allegedly committed a crime. They may
be supervised in the community or in detention facilities.
On an average day in 2017–18, there were about 5,500 people aged 10 and over under youth justice supervision.

Australia’s welfare 2019: in brief54
1 in every 35 children receives child protection services
In 2017–18, about 159,000 children aged 0–17—or
1 in 35—received child protection services.
Find out more: Child protection www.aihw.gov.au/australias-welfare/snapsots
A range of factors may be
behind the rise in children receiving protection services.
Increased public awareness and reporting, legislative changes and
inquiries into the child protection processes all play a part, as well
as potential rises in the rate of child abuse
and neglect.
• At 30 June 2018, around 45,800 children were in out-of-home care, such as foster care.
Of these children, 82% had been continuously in out-of-home care for 1 year or more.
• Over the past 5 years, the number of children receiving child protection services rose by 11%—from
143,000 children (27.2 per 1,000) in 2013–14 to 158,600 children (28.7 per 1,000) in 2017–18.

Australia’s welfare 2019: in brief 55
Known child adoptions are where an Australian child is adopted by Australian adoptive parent(s) who were known to the child prior to adoption. This includes adoptions by step-parents, other relatives and foster parents.
Local adoptions are adoptions of Australian children by Australian parent(s), but where the child and adoptive parents did not already know each other.
Intercountry adoptions are when Australian parent(s) adopt children from overseas.
Most adoptions are by people the child already knows
In 2017–18, 330 children were adopted, up from 315 the year before.
• The increase is mostly due to a rise in the number of known child adoptions.
• Of the 233 known child adoptions finalised in 2017–18, 63% were by carers, such as a foster parent.
55Australia’s welfare 2019: in brief
Find out more: Adoptions www.aihw.gov.au/australias-welfare/snapshots

Australia’s welfare 2019: in brief56
How common is family, domestic and sexual violence?
Family violence is violence between family members. Violence occuring in
intimate partner relationships (either current or previous) is usually referred to
as domestic violence. Sexual violence refers to sexual behaviour carried out against a
person’s will. It can be perpetrated by a current or former partner, other people known to the
victim, or strangers.
Family, domestic and sexual violence affects people of all ages and backgrounds, but it mostly affects women and children.
have experienced physical or sexual violence by a current or previous
partner since the age of 151 in 6 women
17% or 1.6 million1 in 16 men
6.1% or 548,000
have experienced emotional abuse by a current or previous
partner since the age of 15 1 in 4 women
23% or 2.2 million
1 in 6 men16% or 1.4 million
1 in 5 women18% or 1.7 million
have experienced sexual violence
since the age of 15 1 in 20 men4.7% or 429,000
Australia’s welfare 2019: in brief 57
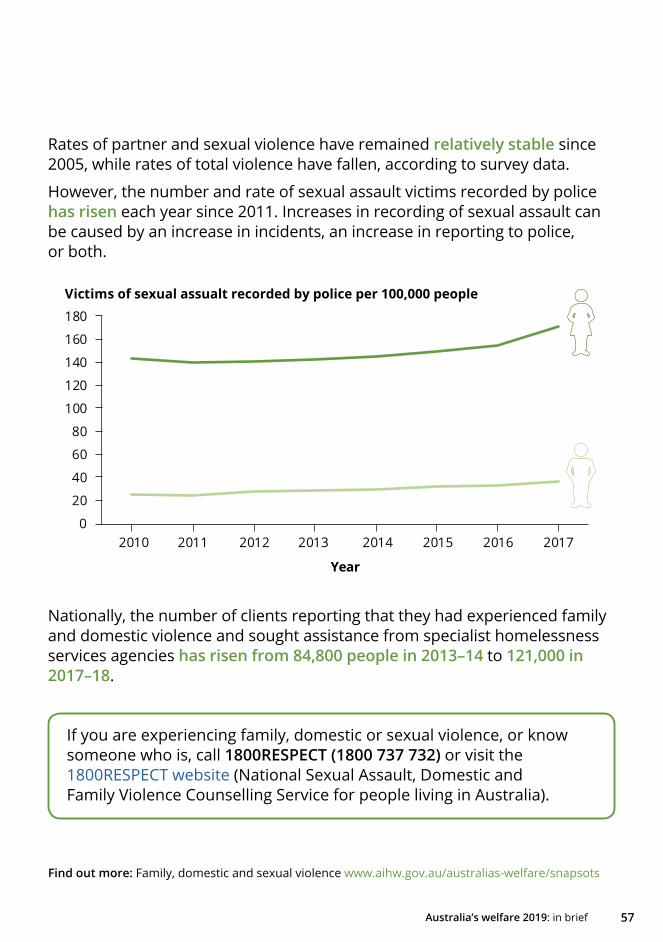
Rates of partner and sexual violence have remained relatively stable since 2005, while rates of total violence have fallen, according to survey data.
However, the number and rate of sexual assault victims recorded by police has risen each year since 2011. Increases in recording of sexual assault can be caused by an increase in incidents, an increase in reporting to police, or both.
If you are experiencing family, domestic or sexual violence, or know someone who is, call 1800RESPECT (1800 737 732) or visit the 1800RESPECT website (National Sexual Assault, Domestic and Family Violence Counselling Service for people living in Australia).
Find out more: Family, domestic and sexual violence www.aihw.gov.au/australias-welfare/snapsots
0
20
40
60
80
100
120
140
160
180
2010 2011 2012 2013 2014 2015 2016 2017
Victims of sexual assualt recorded by police per 100,000 people
Year
Nationally, the number of clients reporting that they had experienced family and domestic violence and sought assistance from specialist homelessness services agencies has risen from 84,800 people in 2013–14 to 121,000 in 2017–18.

Australia’s welfare 2019: in brief58
8 Indigenous Australians

Australia’s welfare 2019: in brief 59
For Aboriginal and Torres
Strait Islander Australians, wellbeing
encompasses not only the wellbeing
of the individual, but also the wellbeing of the
community. In recent years, improvements in a range of
areas for Indigenous Australians are evident. These include home
ownership, household overcrowding, and Year 12 completion rates.
However, despite this, as a group, Indigenous Australians still
experience widespread social and economic
disadvantage.
Indigenous Australians

Australia’s welfare 2019: in brief60
Profile of Indigenous Australians The Australian Government defines
Indigenous Australians as people who: are of Aboriginal or Torres Strait Islander descent;
identify as being of Aboriginal or Torres Strait Islander origin; and are accepted as such in the
communities in which they live, or have lived.
In most data collections, a person is considered Indigenous if they identified themselves, or were identified by another household member, as being of Aboriginal or Torres Strait Islander origin. For a few programs, information on acceptance of a person as being Indigenous by an Indigenous community may also be required.
In 2016, there were nearly 800,000 Aboriginal and Torres Strait Islander people in Australia—or 3.3% of the total population.
91% identify as being of Aboriginal origin
5% identify as being of Torres Strait Islander origin
4% identify as being of both Aboriginal and Torres Strait Islander origin
Of all Indigenous Australians:
• 1 in 3 (34%) are under 15
• 4 in 5 (81%) live in non-remote areas— Major cities (37%), Inner regional (24%) or Outer regional (20%) areas
Of Indigenous Australian aged 15 and over in 2014–15:
• 3 in 4 (74%) recognise an area as homelands or traditional country
• nearly 1 in 5 (18%) speak an Australian Indigenous language
Find out more: Profile of Indigenous Australians www.aihw.gov.au/australias-welfare/snapsots

Australia’s welfare 2019: in brief 61
The Stolen Generations fare worse than other Indigenous Australians Who are the Stolen Generations?
Between about 1910 and 1970, many Indigenous children were forcibly
removed from their families as part of a systematic policy of various
governments in Australia to assimilate Indigenous Australians into mainstream
society. These children are now referred to as the Stolen Generations.
In 2014–15, there were an estimated 20,900 surviving members of the Indigenous population born before 1972 who reported having been removed from their families.
66% were aged 50 and over
56% were women
79% lived in non-remote areas
The Stolen Generations are a particularly disadvantaged group of Indigenous Australians. Compared with Indigenous Australians who were not removed, those born before 1972 who were removed were:
• 3.3 times as likely to have been incarcerated in the previous 5 years
• 1.8 times as likely to have government payments as their main source of income
• 1.7 times as likely to have experienced actual or threatened physical violence in the previous 12 months
• 1.6 times as likely to have experienced homelessness in the previous 10 years
Find out more: Understanding Indigenous welfare and wellbeing www.aihw.gov.au/australias-welfare/snapshots

Australia’s welfare 2019: in brief62
Indigenous households
2001 201616% 10%
More Indigenous Australians are home owners
A safe, secure home with working facilities is crucial to a person’s
overall health and wellbeing.
Of the estimated 263,000 Indigenous households in 2016,
nearly 2 in 5 were home owners, 1 in 3 were renting privately and
1 in 5 lived in social housing.
Indigenous home ownership has risen over the past decade while home ownership among Other Australian households has fallen.
Find out more: Indigenous housing www.aihw.gov.au/australias-welfare/snapsots
Indigenous households
2006 201634% 38%
In 2016, 1 in 10 (or about 26,400) Indigenous households and 1 in 5 (or about 114,400) Indigenous Australians lived in overcrowded conditions. Both of these proportions have fallen.
Indigenous Australians
2001 201630% 20%

Australia’s welfare 2019: in brief 63
Are we closing the gap in education?
Education is a key focus of the Council of Australian Governments
Closing the Gap targets, highlighting its importance in helping to overcome
Indigenous disadvantage.
There are 4 education-related Closing the Gap targets and 2 of these are on track to be met:
on track to ensure 95% of Indigenous 4-year-olds are enrolled in early childhood education by 2025
on track to halve the gap for Year 12 attainment rates by 2020
In 2016, 65% of Indigenous 20–24 year olds had a Year 12 or equivalent qualification, in line with the target to halve the gap between Indigenous and non-Indigenous young people by 2020.
Find out more: Indigenous education and skills www.aihw.gov.au/australias-welfare/snapshots
In 2017, around 15,700 (95%) Indigenous 4 year olds were enrolled in early childhood education, in line with the target of 95% enrolment by 2025.

Australia’s welfare 2019: in brief64
The most common occupations for Indigenous Australians were:• community and personal service workers (18%)• general labourers (16%)• technicians and trades workers (14%)• professionals (14%)
Chances of employment fall outside major cities
Having a job is central to improving opportunities for all Australians. Work contributes to higher
personal and family incomes, and has a positive effect on a person’s health, general wellbeing
and social outcomes.
Find out more: Indigenous employment www.aihw.gov.au/australias-welfare/snapsots
The Closing the Gap target of halving the gap in employment between Indigenous and non-Indigenous Australians within a decade is not on track to be met.
The employment gap between Indigenous and non-Indigenous Australians narrows as education levels increase—there was no gap between Indigenous and non-Indigenous Australians with a Bachelor degree or higher.
In 2016, 47% of Indigenous Australians aged 15–64 were employed—45% of Indigenous females and 49% of Indigenous males. This compares with the non-Indigenous employment rate of around 72%.
Indigenous Australians aged 15–64 were more likely to be employed:
• the closer they lived to Major cities (54% compared with 31% in Very remote areas)
• the higher their level of education (83% for Bachelor degree or higher compared with 22% for Year 9 or lower)

Australia’s welfare 2019: in brief 65
At 30 June 2018, around 45% (234,600) of Indigenous Australians aged 15 and over were receiving some form of income support payment. Among them:
1 in 3 (76,200) received Newstart Allowance
1 in 5 (48,500) received Disability Support Pension
1 in 6 (36,800) received Parenting Payment Partnered
1 in 12 (19,900) received Age Pension
Fewer Indigenous Australians rely on government payments
Find out more: Indigenous income and finance www.aihw.gov.au/australias-welfare/snapshots
Having an adequate level of income, and access to
assistance when in need, are essential components in
the measurement of individual and household wellbeing. For many
disadvantaged Australians, including some Indigenous Australians, having
access to income assistance is a key factor in ensuring their economic and
social wellbeing.
In 2014–15, 52% of Indigenous Australians aged 15 and over relied on government payments as their main income source—down from 65% in 2002.
non-Indigenous Australians
2011 2016$585 $670
5% increase (adjusted for inflation)
Indigenous Australians
2011 2016$362 $441
11% increase (adjusted for inflation)
Median weekly personal income:

Australia’s welfare 2019: in brief66 Australia’s welfare 2019: in brief66
More than 20,000 older Indigenous Australians receive aged care support in their home
The Indigenous population has a much younger age
structure than the non-Indigenous population. However, as with
the general population, the Indigenous population
is also ageing.
In 2016, there were about 124,000 Indigenous Australians aged 50 and over.
Among older Indigenous Australians:• 20,200 received home support
during 2017–18• 2,900 were receiving home care
at 30 June 2018• 1,700 were living in residential
aged care at 30 June 2018
Among people aged 65–74, compared with non-Indigenous Australians, Indigenous Australians were:
• 3.1 times as likely to use home support
• 7.1 times as likely to use home care
• 2.1 times as likely to use residential aged care
Find out more: Aged care for Indigenous Australians www.aihw.gov.au/australias-welfare/snapshots

Australia’s welfare 2019: in brief 67
Compared with non-Indigenous Australians, Indigenous Australians were:
• 1.8 times as likely to have disability
• 2.0 times as likely to use NDA disability support services
The Indigenous population has a much younger age
structure than the non-Indigenous population. However, as with
the general population, the Indigenous population
is also ageing.
1 in 4 Indigenous Australians have disability
Disability can affect a person’s participation in work, education
and social activities. For Indigenous Australians, having disability can
place them at further economic and social disadvantage.
In 2015, 1 in 4 (24%, or 125,000 people) Indigenous Australians in private
households were living with disability, and 7.3% had severe or profound disability.
Find out more: Disability support for Indigenous Australians www.aihw.gov.au/australias-welfare/snapshots
Disability rates were higher in older ages. Of Indigenous Australians aged 55 and over:
• over half (58%) were living with some form of disability
• nearly 1 in 5 (18%) had severe or profound disability
In 2017–18, nearly 16,000 Indigenous Australians were receiving disability support services under the National Disability Agreement (NDA). Disability service users are transitioning to the National Disability Insurance Scheme (NDIS). At 30 June 2018, nearly 9,300 Indigenous Australians were active participants in the NDIS.

Australia’s welfare 2019: in brief68
Indigenous community safety
Many factors can influence community safety and wellbeing for Indigenous Australians.
Positive influences include being connected to Country, land, family and spirit; having strong and
positive social networks; and having strong leadership in both the family and the community.
In 2014–15, 87% of Indigenous Australians aged 15 and over reported they felt safe or very safe while at home after dark.
68% reported that they felt safe or very safe walking alone in their local area after dark.

Australia’s welfare 2019: in brief 69
Find out more: Indigenous community safety www.aihw.gov.au/australias-welfare/snapshots
Experiences of violence
• 22% of Indigneous Australians aged 15 and over reported in 2014–15 they were a victim of physical or threatened violence in the last 12 months.
• Rates were similar for Indigenous females (22%) and males (23%).
• Actual physical violence was experienced by 13% of Indigenous Australians aged 15 and over.
Child protection
• 48,300 Indigenous children aged 0–17 were receiving child protection services in 2017–18 (164 per 1,000).
• 17,800 (59 per 1,000) Indigenous children were in out-of-home care at 30 June 2018. Of these children, 65% were placed with relatives or kin, or other Indigenous caregivers.
Contact with police and the criminal justice system
• 472 Indigenous youth aged 10–17 were supervised in youth detention on an average day in 2017–18, a rate 23 times as high as non-Indigenous youth (37 compared with 1.6 per 10,000).
• 11,800 Indigenous adults were imprisoned as at 30 June 2018 (2,481 per 100,000), of which 90% were men.

Australia’s welfare 2019in brief
+61 2 6244 1000
GPO Box 570Canberra ACT 2601Australia
1 Thynne StreetBruce ACT 2617Australia
@aihw
www.aihw.gov.au
Stronger evidence, better decisions, improved health and welfare
Australia’s welfare 2019: in brief tells the story of welfare in Australia with key findings on housing, education and skills, employment and work, income and finance: government payments, social support, justice and safety, and Indigenous Australians.
Australia’s welfare 2019 is the 14th biennial welfare report of the Australian Institute of Health and Welfare. This edition introduces a new format and expanded product suite:• Australia’s welfare 2019: data insights• Australia’s welfare snapshots• Australia’s welfare 2019: in brief• Australia’s welfare indicators