in 2009 the board approved the lcfs regulation to reduce ... · pdf filein 2009 the board...
TRANSCRIPT
1
2
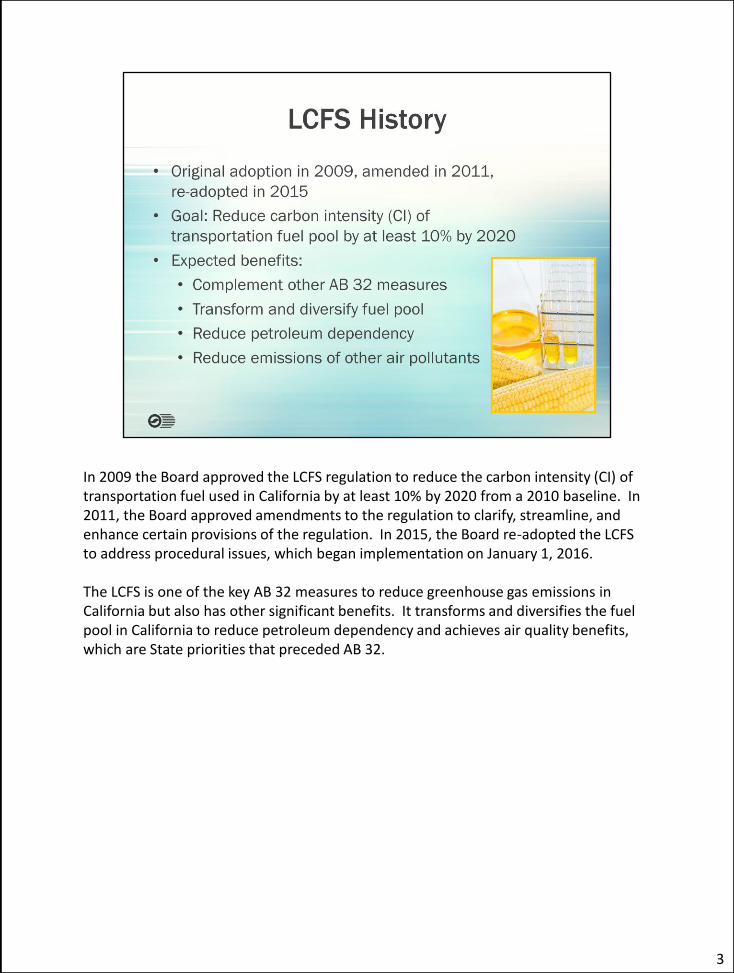
In 2009 the Board approved the LCFS regulation to reduce the carbon intensity (CI) of transportation fuel used in California by at least 10% by 2020 from a 2010 baseline. In 2011, the Board approved amendments to the regulation to clarify, streamline, and enhance certain provisions of the regulation. In 2015, the Board re-adopted the LCFS to address procedural issues, which began implementation on January 1, 2016. The LCFS is one of the key AB 32 measures to reduce greenhouse gas emissions in California but also has other significant benefits. It transforms and diversifies the fuel pool in California to reduce petroleum dependency and achieves air quality benefits, which are State priorities that preceded AB 32.
3
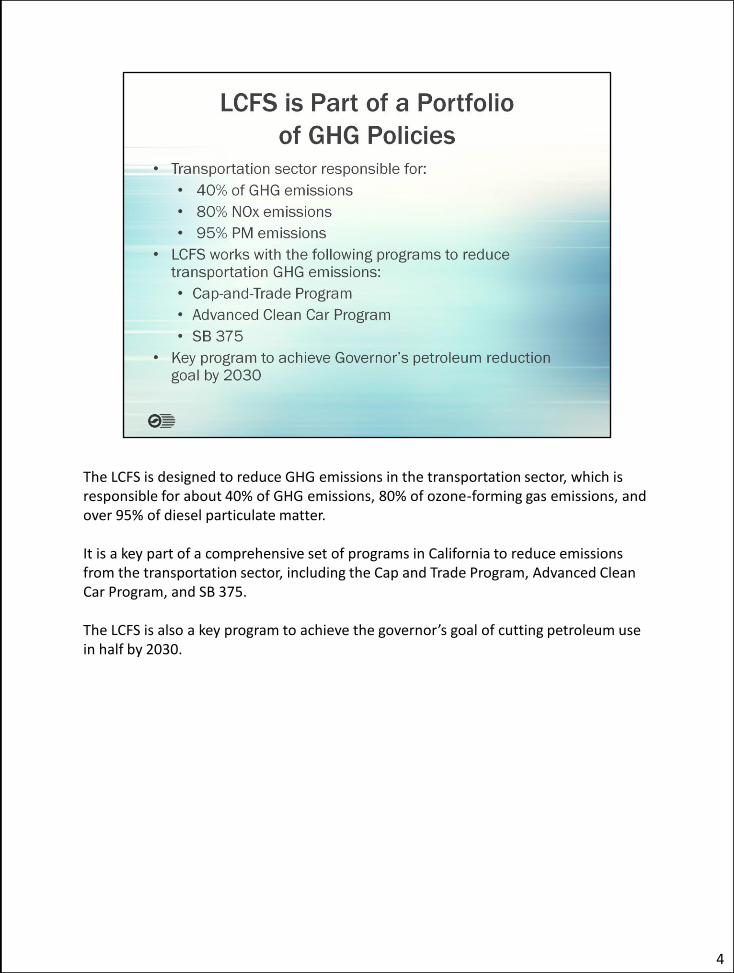
The LCFS is designed to reduce GHG emissions in the transportation sector, which is responsible for about 40% of GHG emissions, 80% of ozone-forming gas emissions, and over 95% of diesel particulate matter. It is a key part of a comprehensive set of programs in California to reduce emissions from the transportation sector, including the Cap and Trade Program, Advanced Clean Car Program, and SB 375. The LCFS is also a key program to achieve the governor’s goal of cutting petroleum use in half by 2030.
4
5
The LCFS sets annual carbon intensity standards, which reduce over time, for gasoline, diesel, and the fuels that replace them. Carbon intensity is expressed in grams of carbon dioxide equivalent per megajoule of energy provided by that fuel. CI takes into account the GHG emissions associated with all of the steps of producing, transporting, and consuming a fuel—also known as a complete lifecycle of that fuel. The LCFS is fuel-neutral, and lets the market determine which mix of fuels will be used to reach the program targets.
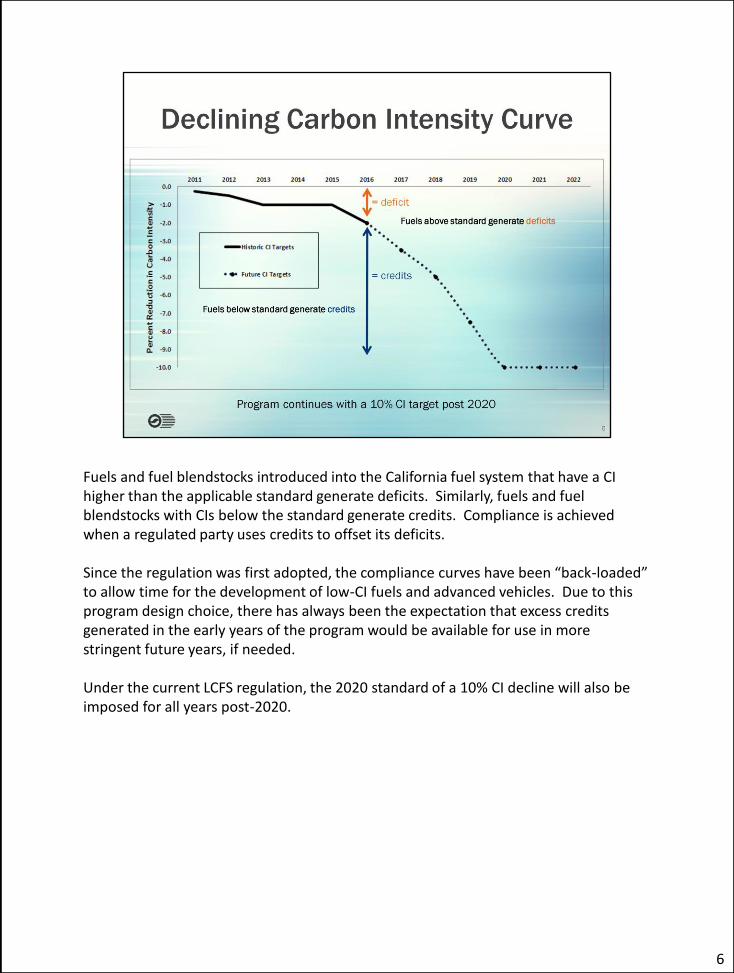
Fuels and fuel blendstocks introduced into the California fuel system that have a CI higher than the applicable standard generate deficits. Similarly, fuels and fuel blendstocks with CIs below the standard generate credits. Compliance is achieved when a regulated party uses credits to offset its deficits. Since the regulation was first adopted, the compliance curves have been “back-loaded” to allow time for the development of low-CI fuels and advanced vehicles. Due to this program design choice, there has always been the expectation that excess credits generated in the early years of the program would be available for use in more stringent future years, if needed. Under the current LCFS regulation, the 2020 standard of a 10% CI decline will also be imposed for all years post-2020.
6
7
Since the regulation went into effect, low carbon fuel use has increased. Staff have continually monitored the program and found that regulated parties, in the aggregate, have over-complied with the LCFS standards in every quarter since implementation. The LCFS Data Dashboard web page was created to display the current status of the LCFS. Some of the information found in the Data Dashboard are the following: • Volume of fuels and credits generated under the LCFS • Compliance curve and the percent reduction in carbon intensity to date • Credit volumes transacted and the average credit prices per month under the LCFS. To see the Data Dashboard, please see http://www.arb.ca.gov/fuels/lcfs/dashboard/dashboard.htm.
8
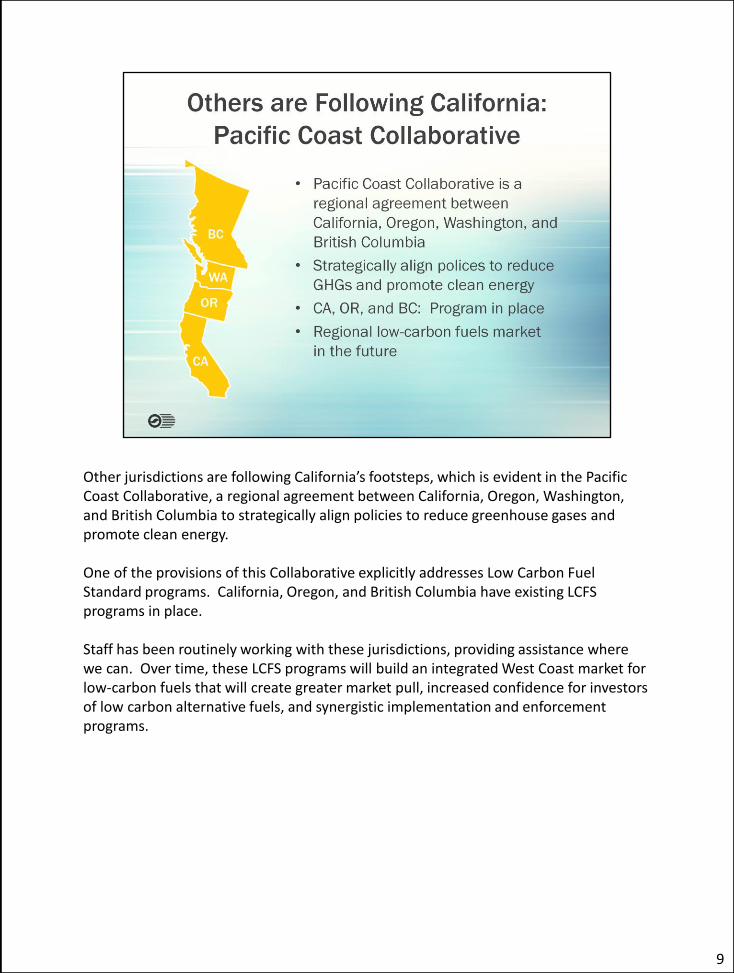
Other jurisdictions are following California’s footsteps, which is evident in the Pacific Coast Collaborative, a regional agreement between California, Oregon, Washington, and British Columbia to strategically align policies to reduce greenhouse gases and promote clean energy. One of the provisions of this Collaborative explicitly addresses Low Carbon Fuel Standard programs. California, Oregon, and British Columbia have existing LCFS programs in place. Staff has been routinely working with these jurisdictions, providing assistance where we can. Over time, these LCFS programs will build an integrated West Coast market for low-carbon fuels that will create greater market pull, increased confidence for investors of low carbon alternative fuels, and synergistic implementation and enforcement programs.
9
10
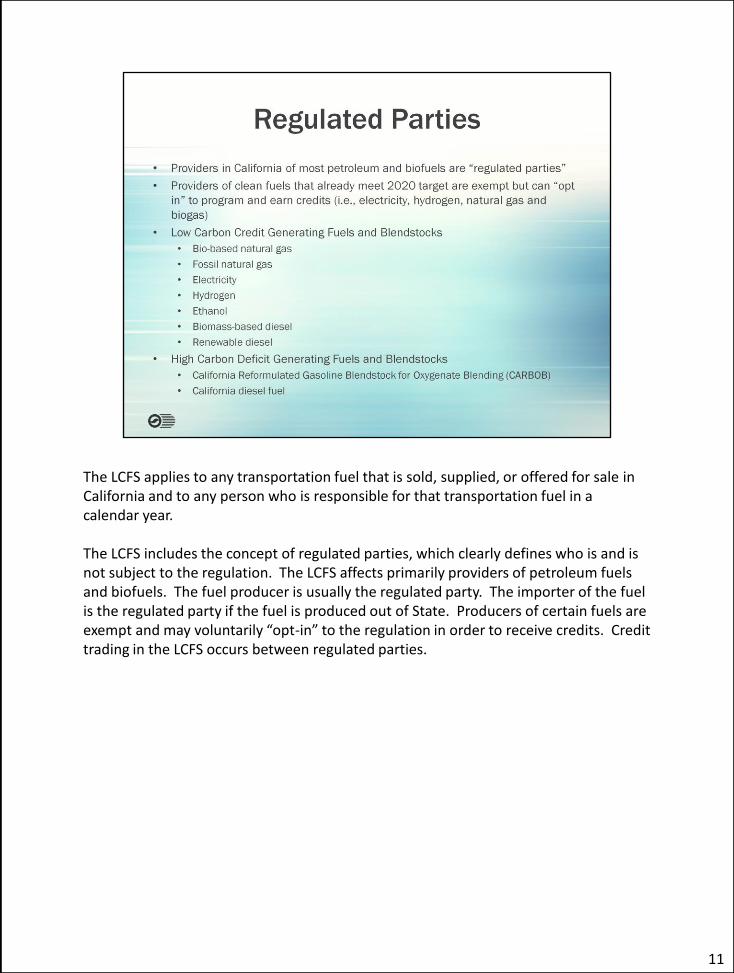
The LCFS applies to any transportation fuel that is sold, supplied, or offered for sale in California and to any person who is responsible for that transportation fuel in a calendar year. The LCFS includes the concept of regulated parties, which clearly defines who is and is not subject to the regulation. The LCFS affects primarily providers of petroleum fuels and biofuels. The fuel producer is usually the regulated party. The importer of the fuel is the regulated party if the fuel is produced out of State. Producers of certain fuels are exempt and may voluntarily “opt-in” to the regulation in order to receive credits. Credit trading in the LCFS occurs between regulated parties.
11
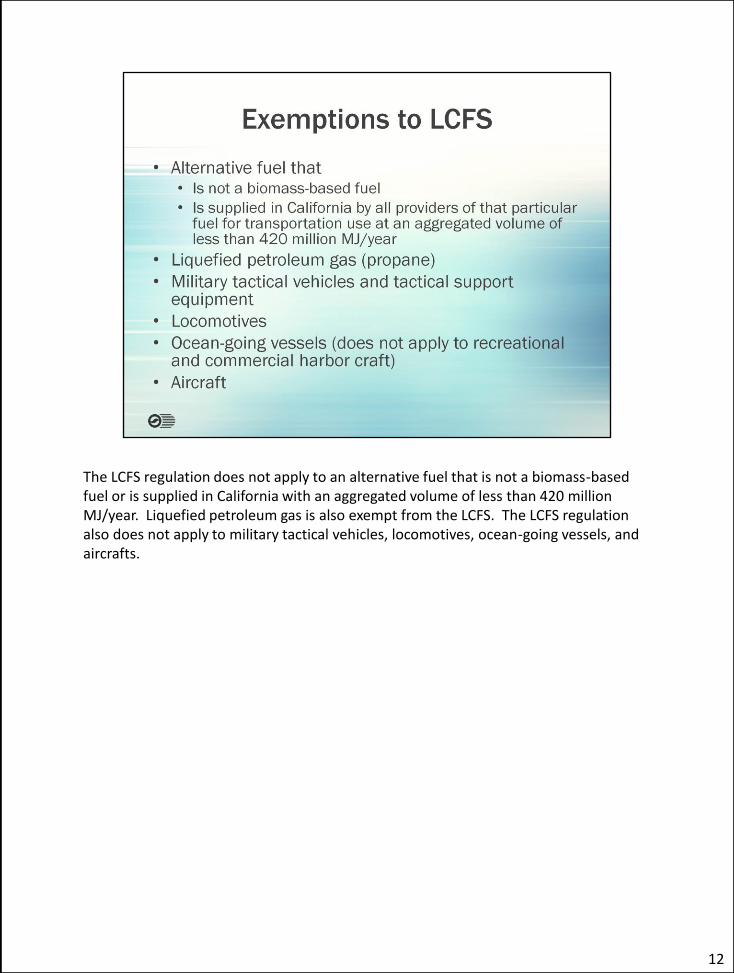
The LCFS regulation does not apply to an alternative fuel that is not a biomass-based fuel or is supplied in California with an aggregated volume of less than 420 million MJ/year. Liquefied petroleum gas is also exempt from the LCFS. The LCFS regulation also does not apply to military tactical vehicles, locomotives, ocean-going vessels, and aircrafts.
12
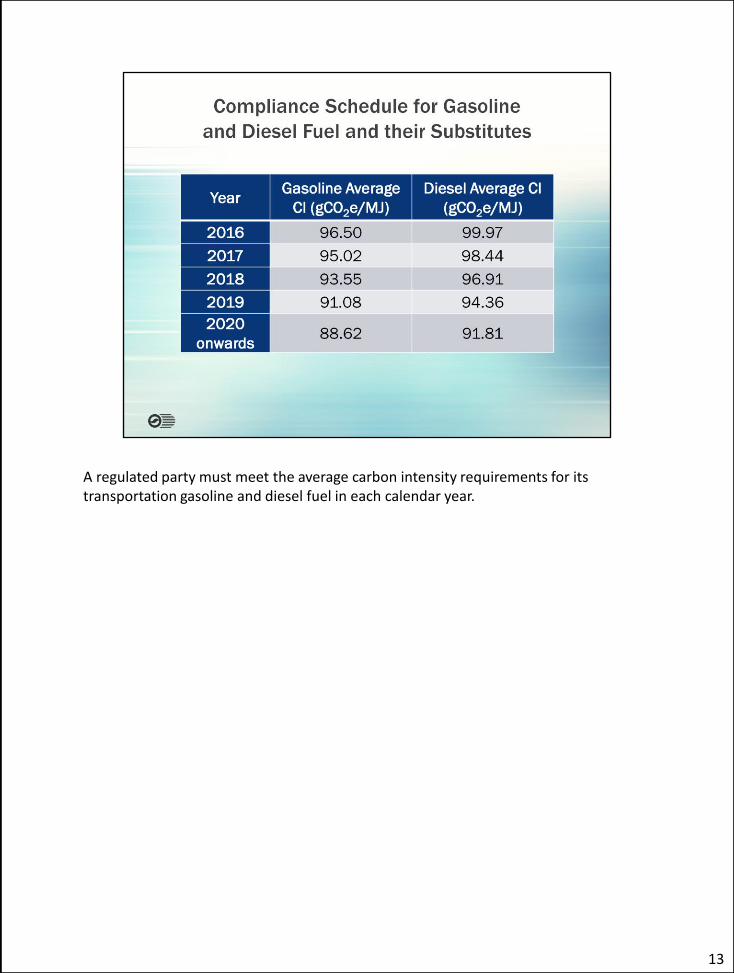
A regulated party must meet the average carbon intensity requirements for its transportation gasoline and diesel fuel in each calendar year.
13
14
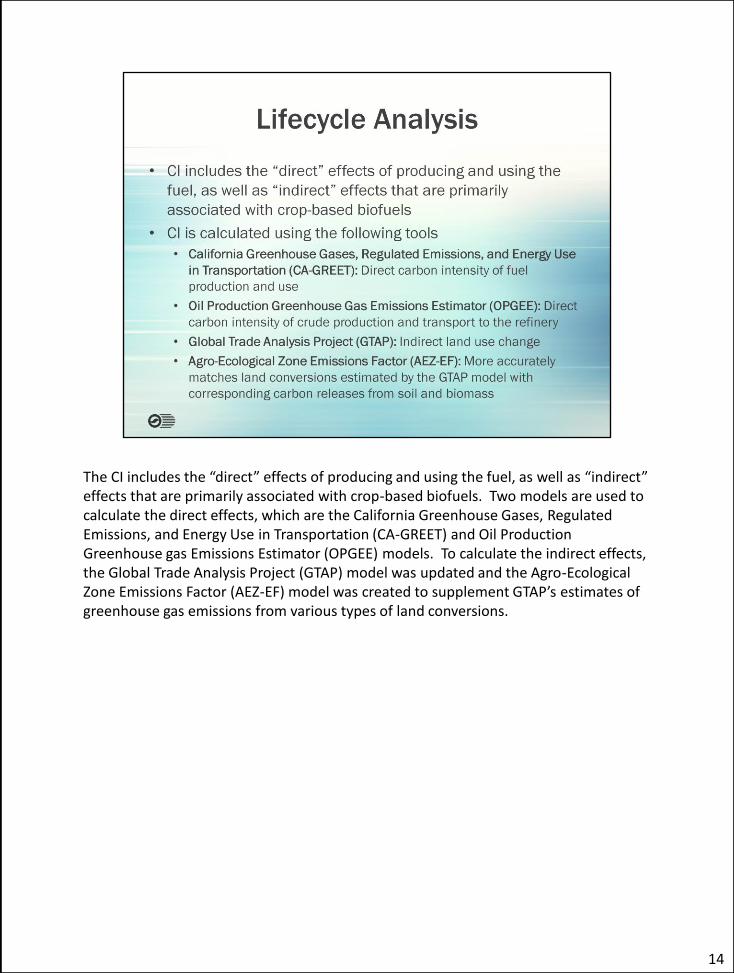
The CI includes the “direct” effects of producing and using the fuel, as well as “indirect” effects that are primarily associated with crop-based biofuels. Two models are used to calculate the direct effects, which are the California Greenhouse Gases, Regulated Emissions, and Energy Use in Transportation (CA-GREET) and Oil Production Greenhouse gas Emissions Estimator (OPGEE) models. To calculate the indirect effects, the Global Trade Analysis Project (GTAP) model was updated and the Agro-Ecological Zone Emissions Factor (AEZ-EF) model was created to supplement GTAP’s estimates of greenhouse gas emissions from various types of land conversions.
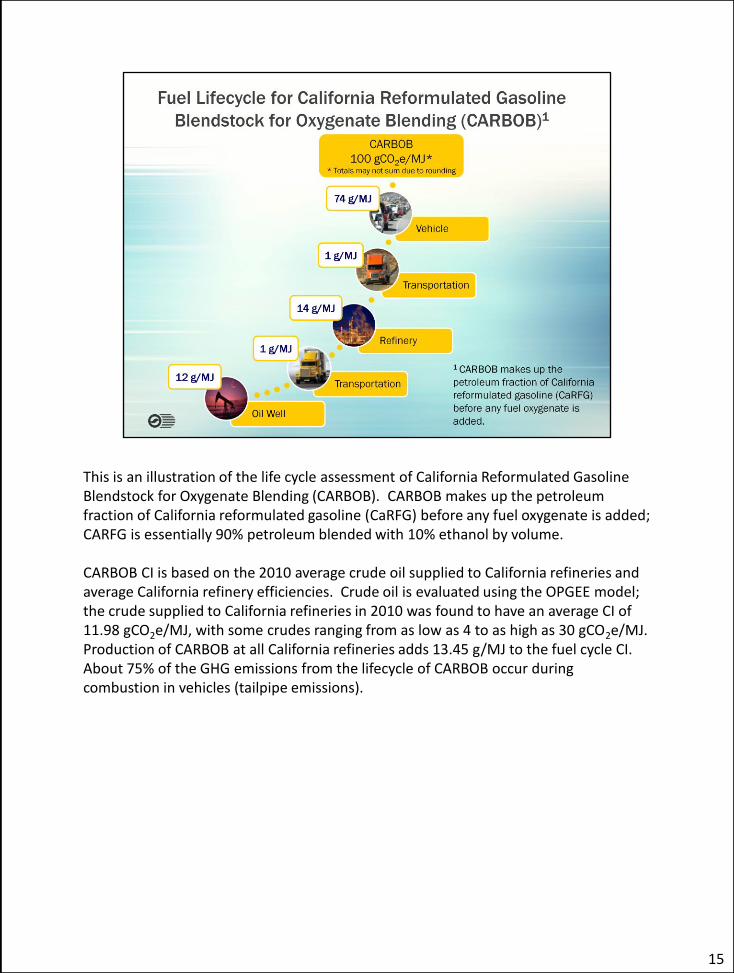
This is an illustration of the life cycle assessment of California Reformulated Gasoline Blendstock for Oxygenate Blending (CARBOB). CARBOB makes up the petroleum fraction of California reformulated gasoline (CaRFG) before any fuel oxygenate is added; CARFG is essentially 90% petroleum blended with 10% ethanol by volume. CARBOB CI is based on the 2010 average crude oil supplied to California refineries and average California refinery efficiencies. Crude oil is evaluated using the OPGEE model; the crude supplied to California refineries in 2010 was found to have an average CI of 11.98 gCO2e/MJ, with some crudes ranging from as low as 4 to as high as 30 gCO2e/MJ. Production of CARBOB at all California refineries adds 13.45 g/MJ to the fuel cycle CI. About 75% of the GHG emissions from the lifecycle of CARBOB occur during combustion in vehicles (tailpipe emissions).
15
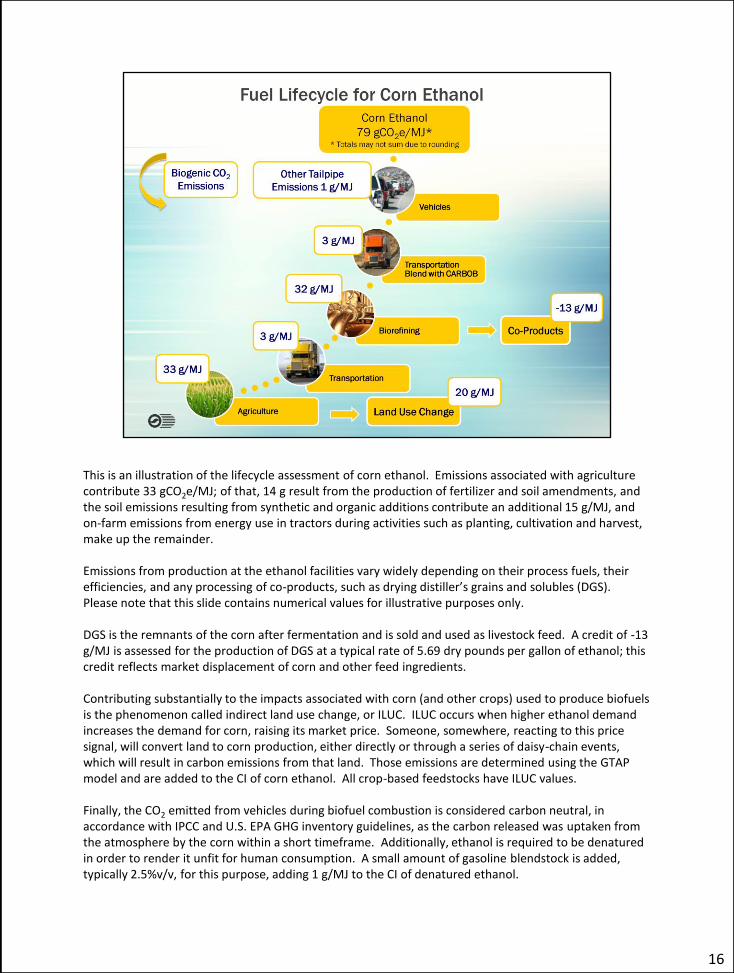
This is an illustration of the lifecycle assessment of corn ethanol. Emissions associated with agriculture contribute 33 gCO2e/MJ; of that, 14 g result from the production of fertilizer and soil amendments, and the soil emissions resulting from synthetic and organic additions contribute an additional 15 g/MJ, and on-farm emissions from energy use in tractors during activities such as planting, cultivation and harvest, make up the remainder. Emissions from production at the ethanol facilities vary widely depending on their process fuels, their efficiencies, and any processing of co-products, such as drying distiller’s grains and solubles (DGS). Please note that this slide contains numerical values for illustrative purposes only. DGS is the remnants of the corn after fermentation and is sold and used as livestock feed. A credit of -13 g/MJ is assessed for the production of DGS at a typical rate of 5.69 dry pounds per gallon of ethanol; this credit reflects market displacement of corn and other feed ingredients. Contributing substantially to the impacts associated with corn (and other crops) used to produce biofuels is the phenomenon called indirect land use change, or ILUC. ILUC occurs when higher ethanol demand increases the demand for corn, raising its market price. Someone, somewhere, reacting to this price signal, will convert land to corn production, either directly or through a series of daisy-chain events, which will result in carbon emissions from that land. Those emissions are determined using the GTAP model and are added to the CI of corn ethanol. All crop-based feedstocks have ILUC values. Finally, the CO2 emitted from vehicles during biofuel combustion is considered carbon neutral, in accordance with IPCC and U.S. EPA GHG inventory guidelines, as the carbon released was uptaken from the atmosphere by the corn within a short timeframe. Additionally, ethanol is required to be denatured in order to render it unfit for human consumption. A small amount of gasoline blendstock is added, typically 2.5%v/v, for this purpose, adding 1 g/MJ to the CI of denatured ethanol.
16
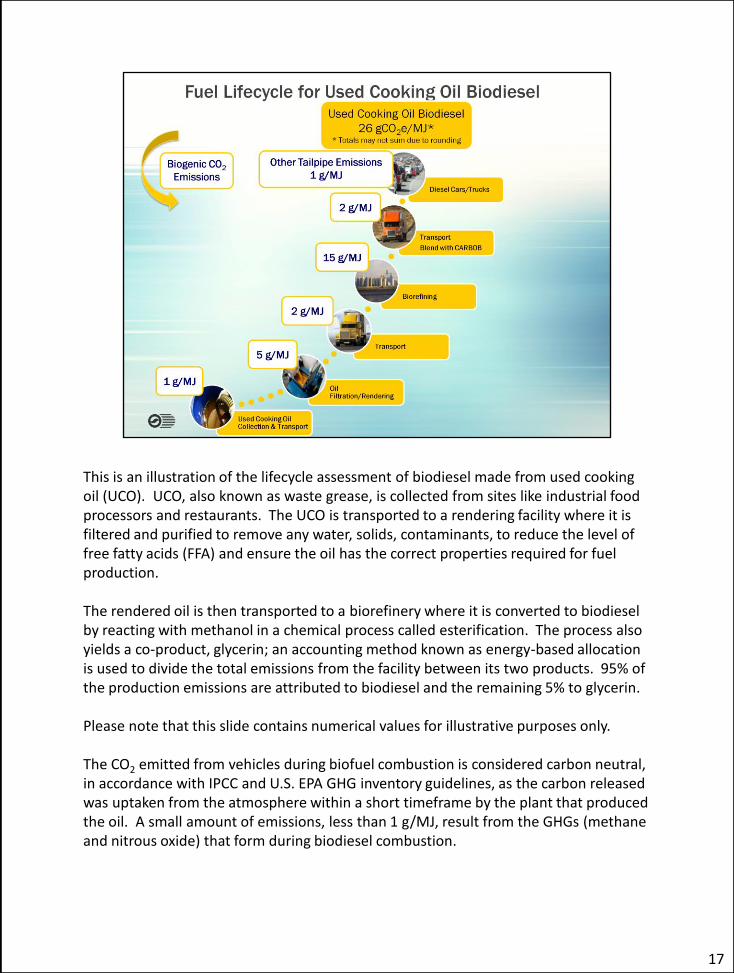
This is an illustration of the lifecycle assessment of biodiesel made from used cooking oil (UCO). UCO, also known as waste grease, is collected from sites like industrial food processors and restaurants. The UCO is transported to a rendering facility where it is filtered and purified to remove any water, solids, contaminants, to reduce the level of free fatty acids (FFA) and ensure the oil has the correct properties required for fuel production. The rendered oil is then transported to a biorefinery where it is converted to biodiesel by reacting with methanol in a chemical process called esterification. The process also yields a co-product, glycerin; an accounting method known as energy-based allocation is used to divide the total emissions from the facility between its two products. 95% of the production emissions are attributed to biodiesel and the remaining 5% to glycerin. Please note that this slide contains numerical values for illustrative purposes only. The CO2 emitted from vehicles during biofuel combustion is considered carbon neutral, in accordance with IPCC and U.S. EPA GHG inventory guidelines, as the carbon released was uptaken from the atmosphere within a short timeframe by the plant that produced the oil. A small amount of emissions, less than 1 g/MJ, result from the GHGs (methane and nitrous oxide) that form during biodiesel combustion.
17
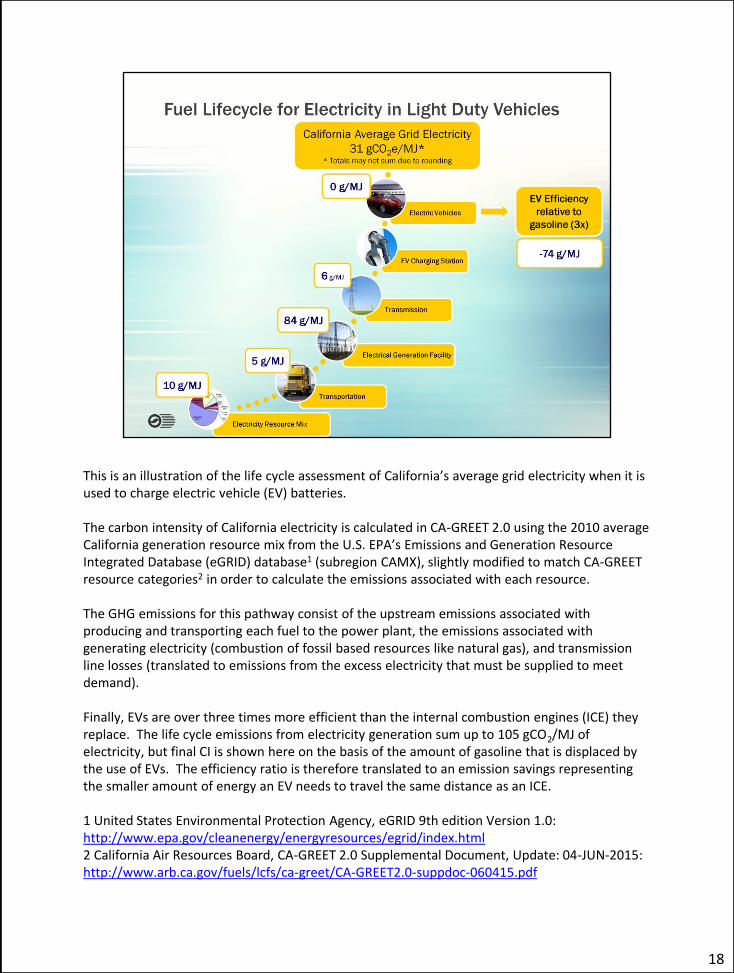
This is an illustration of the life cycle assessment of California’s average grid electricity when it is used to charge electric vehicle (EV) batteries. The carbon intensity of California electricity is calculated in CA-GREET 2.0 using the 2010 average California generation resource mix from the U.S. EPA’s Emissions and Generation Resource Integrated Database (eGRID) database1 (subregion CAMX), slightly modified to match CA-GREET resource categories2 in order to calculate the emissions associated with each resource. The GHG emissions for this pathway consist of the upstream emissions associated with producing and transporting each fuel to the power plant, the emissions associated with generating electricity (combustion of fossil based resources like natural gas), and transmission line losses (translated to emissions from the excess electricity that must be supplied to meet demand). Finally, EVs are over three times more efficient than the internal combustion engines (ICE) they replace. The life cycle emissions from electricity generation sum up to 105 gCO2/MJ of electricity, but final CI is shown here on the basis of the amount of gasoline that is displaced by the use of EVs. The efficiency ratio is therefore translated to an emission savings representing the smaller amount of energy an EV needs to travel the same distance as an ICE. 1 United States Environmental Protection Agency, eGRID 9th edition Version 1.0: http://www.epa.gov/cleanenergy/energyresources/egrid/index.html 2 California Air Resources Board, CA-GREET 2.0 Supplemental Document, Update: 04-JUN-2015: http://www.arb.ca.gov/fuels/lcfs/ca-greet/CA-GREET2.0-suppdoc-060415.pdf
18
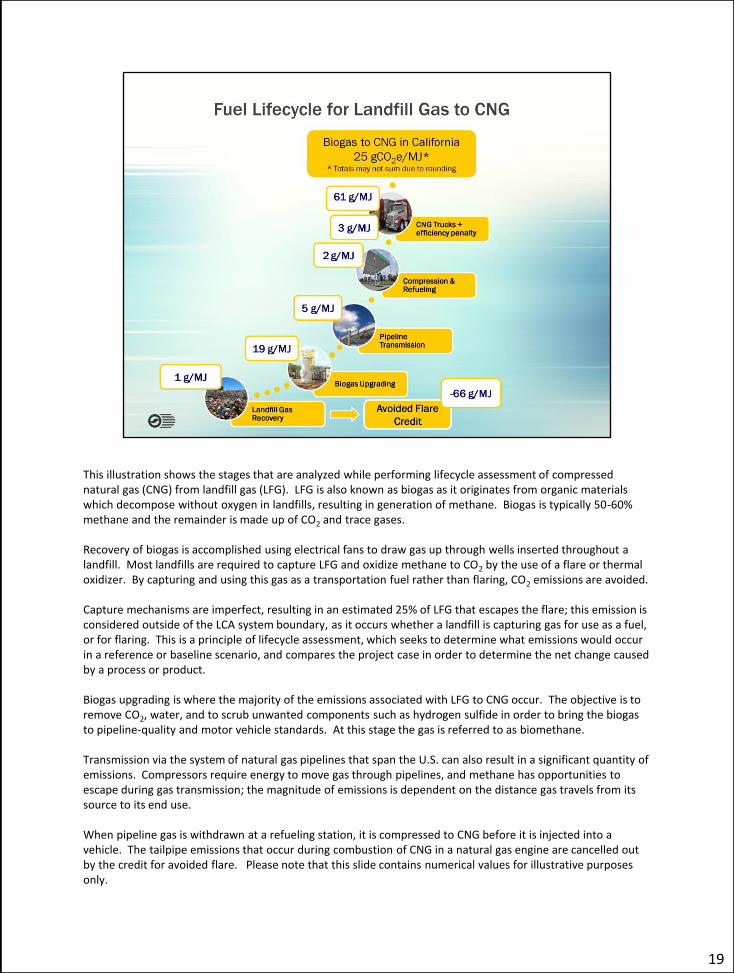
This illustration shows the stages that are analyzed while performing lifecycle assessment of compressed natural gas (CNG) from landfill gas (LFG). LFG is also known as biogas as it originates from organic materials which decompose without oxygen in landfills, resulting in generation of methane. Biogas is typically 50-60% methane and the remainder is made up of CO2 and trace gases. Recovery of biogas is accomplished using electrical fans to draw gas up through wells inserted throughout a landfill. Most landfills are required to capture LFG and oxidize methane to CO2 by the use of a flare or thermal oxidizer. By capturing and using this gas as a transportation fuel rather than flaring, CO2 emissions are avoided. Capture mechanisms are imperfect, resulting in an estimated 25% of LFG that escapes the flare; this emission is considered outside of the LCA system boundary, as it occurs whether a landfill is capturing gas for use as a fuel, or for flaring. This is a principle of lifecycle assessment, which seeks to determine what emissions would occur in a reference or baseline scenario, and compares the project case in order to determine the net change caused by a process or product. Biogas upgrading is where the majority of the emissions associated with LFG to CNG occur. The objective is to remove CO2, water, and to scrub unwanted components such as hydrogen sulfide in order to bring the biogas to pipeline-quality and motor vehicle standards. At this stage the gas is referred to as biomethane. Transmission via the system of natural gas pipelines that span the U.S. can also result in a significant quantity of emissions. Compressors require energy to move gas through pipelines, and methane has opportunities to escape during gas transmission; the magnitude of emissions is dependent on the distance gas travels from its source to its end use. When pipeline gas is withdrawn at a refueling station, it is compressed to CNG before it is injected into a vehicle. The tailpipe emissions that occur during combustion of CNG in a natural gas engine are cancelled out by the credit for avoided flare. Please note that this slide contains numerical values for illustrative purposes only.
19
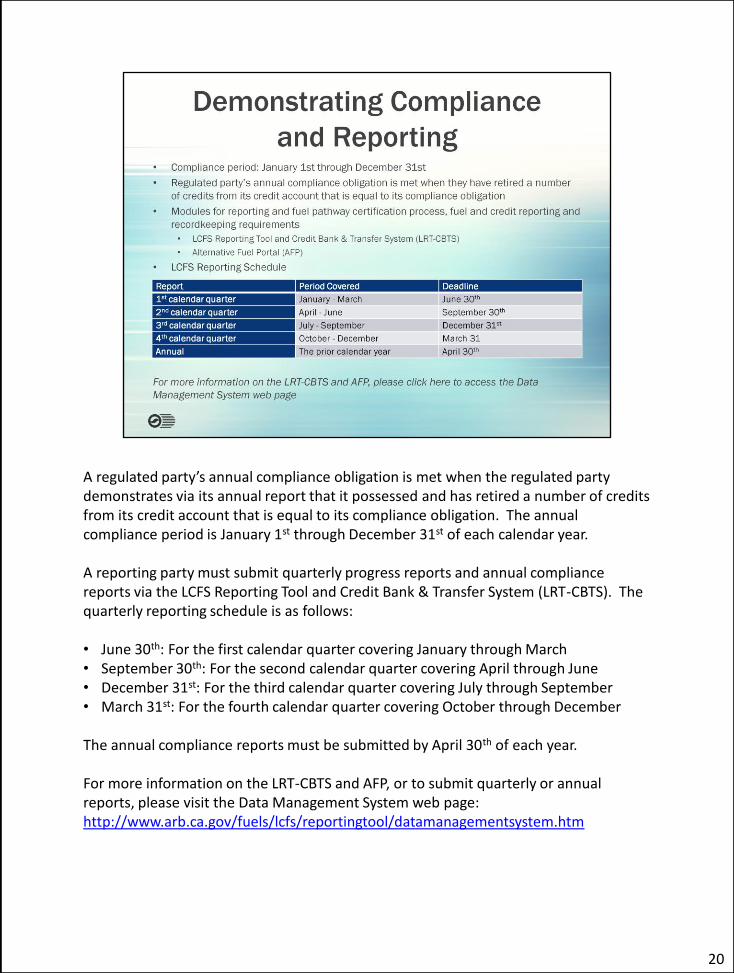
A regulated party’s annual compliance obligation is met when the regulated party demonstrates via its annual report that it possessed and has retired a number of credits from its credit account that is equal to its compliance obligation. The annual compliance period is January 1st through December 31st of each calendar year. A reporting party must submit quarterly progress reports and annual compliance reports via the LCFS Reporting Tool and Credit Bank & Transfer System (LRT-CBTS). The quarterly reporting schedule is as follows: • June 30th: For the first calendar quarter covering January through March • September 30th: For the second calendar quarter covering April through June • December 31st: For the third calendar quarter covering July through September • March 31st: For the fourth calendar quarter covering October through December The annual compliance reports must be submitted by April 30th of each year. For more information on the LRT-CBTS and AFP, or to submit quarterly or annual reports, please visit the Data Management System web page: http://www.arb.ca.gov/fuels/lcfs/reportingtool/datamanagementsystem.htm
20
If a regulated party does not retire sufficient credits to meet its compliance obligation, that party must purchase its pro-rata share of credits in the Credit Clearance Market if one occurs. A price cap provides consumer protection and protects the price of credits.
21
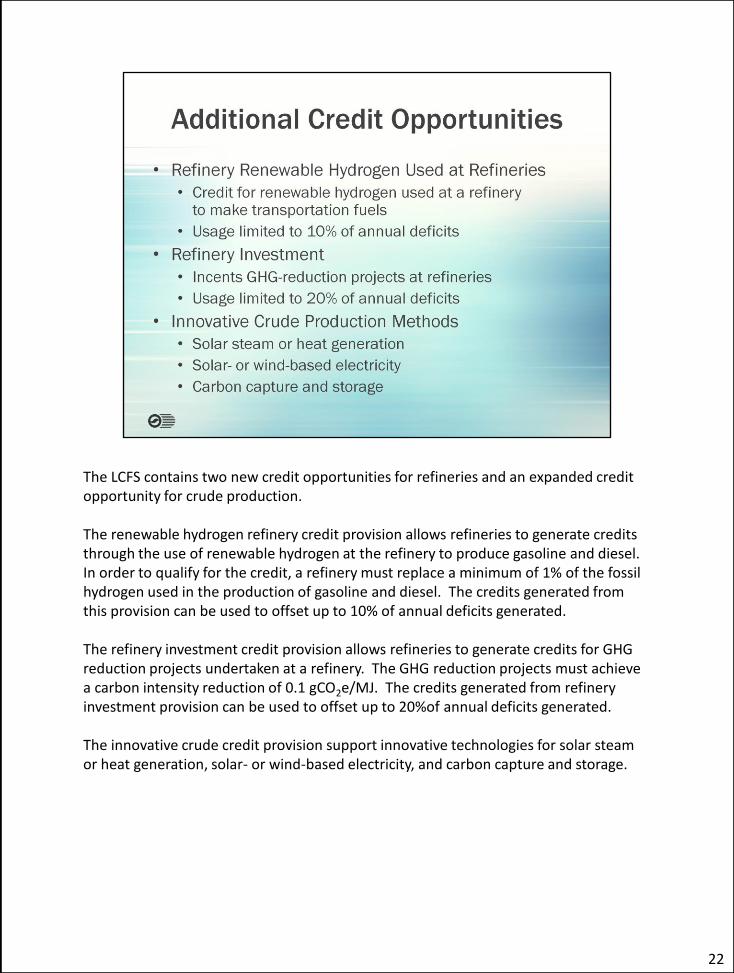
The LCFS contains two new credit opportunities for refineries and an expanded credit opportunity for crude production. The renewable hydrogen refinery credit provision allows refineries to generate credits through the use of renewable hydrogen at the refinery to produce gasoline and diesel. In order to qualify for the credit, a refinery must replace a minimum of 1% of the fossil hydrogen used in the production of gasoline and diesel. The credits generated from this provision can be used to offset up to 10% of annual deficits generated. The refinery investment credit provision allows refineries to generate credits for GHG reduction projects undertaken at a refinery. The GHG reduction projects must achieve a carbon intensity reduction of 0.1 gCO2e/MJ. The credits generated from refinery investment provision can be used to offset up to 20%of annual deficits generated. The innovative crude credit provision support innovative technologies for solar steam or heat generation, solar- or wind-based electricity, and carbon capture and storage.
22
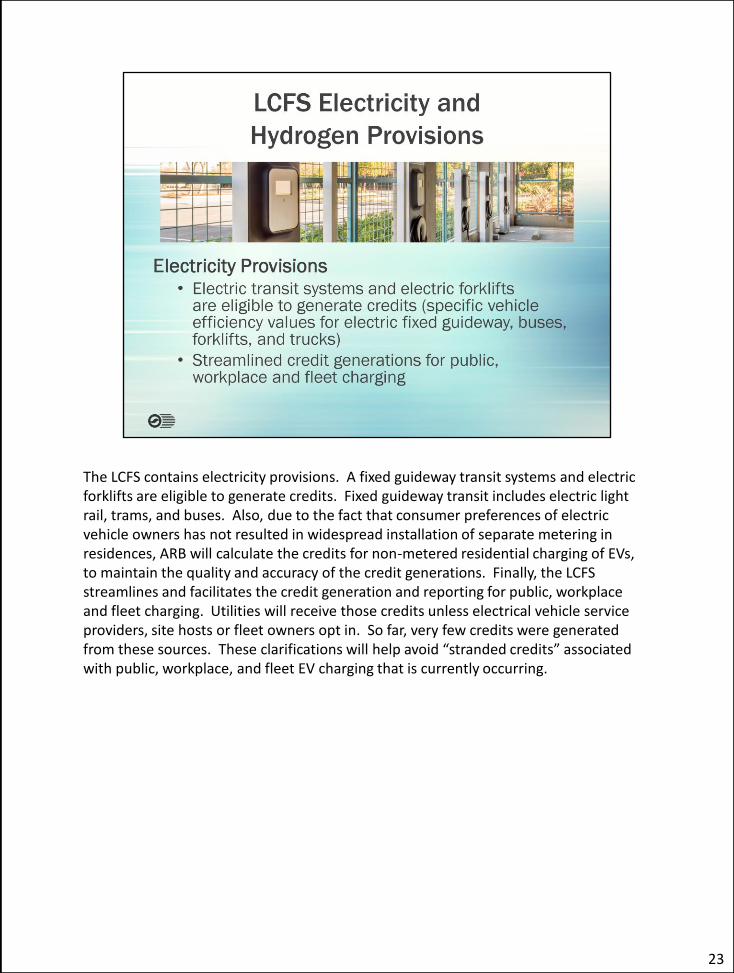
The LCFS contains electricity provisions. A fixed guideway transit systems and electric forklifts are eligible to generate credits. Fixed guideway transit includes electric light rail, trams, and buses. Also, due to the fact that consumer preferences of electric vehicle owners has not resulted in widespread installation of separate metering in residences, ARB will calculate the credits for non-metered residential charging of EVs, to maintain the quality and accuracy of the credit generations. Finally, the LCFS streamlines and facilitates the credit generation and reporting for public, workplace and fleet charging. Utilities will receive those credits unless electrical vehicle service providers, site hosts or fleet owners opt in. So far, very few credits were generated from these sources. These clarifications will help avoid “stranded credits” associated with public, workplace, and fleet EV charging that is currently occurring.
23
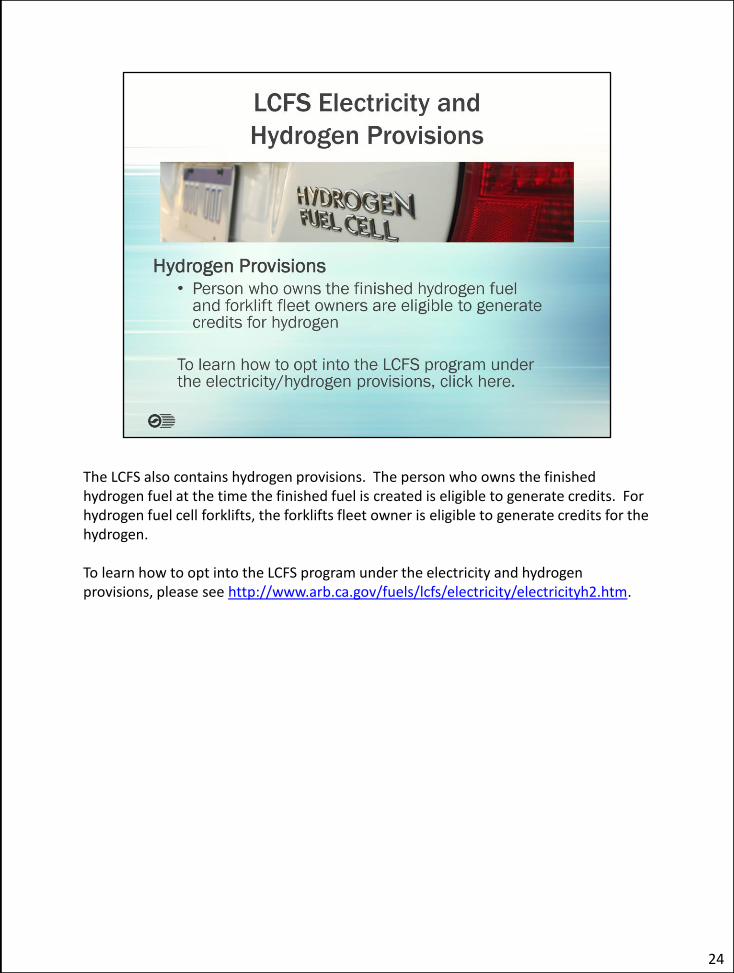
The LCFS also contains hydrogen provisions. The person who owns the finished hydrogen fuel at the time the finished fuel is created is eligible to generate credits. For hydrogen fuel cell forklifts, the forklifts fleet owner is eligible to generate credits for the hydrogen. To learn how to opt into the LCFS program under the electricity and hydrogen provisions, please see http://www.arb.ca.gov/fuels/lcfs/electricity/electricityh2.htm.
24