improving the process for sizing reciprocating compressors · 2017-09-07 · improving the process...
TRANSCRIPT
Improving The Process For Sizing Reciprocating Compressors
By Dwayne A. Hickman
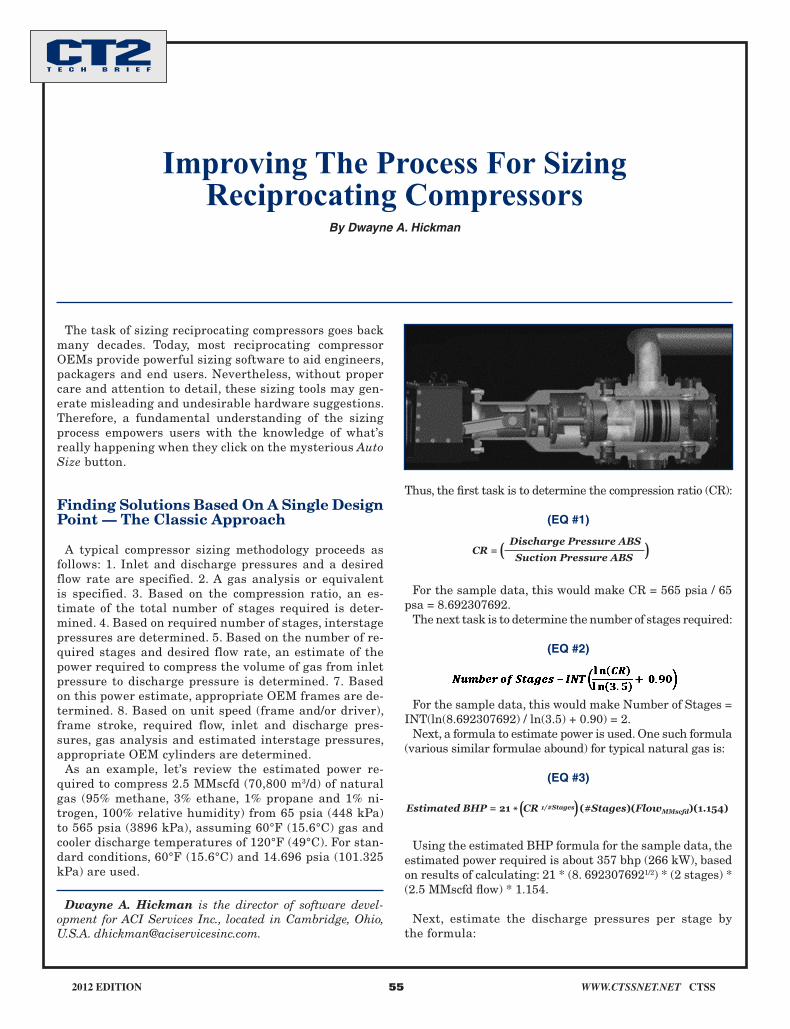
The task of sizing reciprocating compressors goes back many decades. Today, most reciprocating compressor OEMs provide powerful sizing software to aid engineers, packagers and end users. Nevertheless, without proper care and attention to detail, these sizing tools may gen-erate misleading and undesirable hardware suggestions. Therefore, a fundamental understanding of the sizing process empowers users with the knowledge of what’s really happening when they click on the mysterious Auto Size button.
Finding Solutions Based On A Single Design Point — The Classic Approach
A typical compressor sizing methodology proceeds as follows: 1. Inlet and discharge pressures and a desired flow rate are specified. 2. A gas analysis or equivalent is specified. 3. Based on the compression ratio, an es-timate of the total number of stages required is deter-mined. 4. Based on required number of stages, interstage pressures are determined. 5. Based on the number of re-quired stages and desired flow rate, an estimate of the power required to compress the volume of gas from inlet pressure to discharge pressure is determined. 7. Based on this power estimate, appropriate OEM frames are de-termined. 8. Based on unit speed (frame and/or driver), frame stroke, required flow, inlet and discharge pres-sures, gas analysis and estimated interstage pressures, appropriate OEM cylinders are determined.
As an example, let’s review the estimated power re-quired to compress 2.5 MMscfd (70,800 m3/d) of natural gas (95% methane, 3% ethane, 1% propane and 1% ni-trogen, 100% relative humidity) from 65 psia (448 kPa) to 565 psia (3896 kPa), assuming 60°F (15.6°C) gas and cooler discharge temperatures of 120°F (49°C). For stan-dard conditions, 60°F (15.6°C) and 14.696 psia (101.325 kPa) are used.
Thus, the first task is to determine the compression ratio (CR):
(EQ #1)
For the sample data, this would make CR = 565 psia / 65 psa = 8.692307692.
The next task is to determine the number of stages required:
(EQ #2)
For the sample data, this would make Number of Stages = INT(ln(8.692307692) / ln(3.5) + 0.90) = 2.
Next, a formula to estimate power is used. One such formula (various similar formulae abound) for typical natural gas is:
(EQ #3)
Using the estimated BHP formula for the sample data, the estimated power required is about 357 bhp (266 kW), based on results of calculating: 21 * (8. 6923076921/2) * (2 stages) * (2.5 MMscfd flow) * 1.154.
Next, estimate the discharge pressures per stage by the formula:
Dwayne A. Hickman is the director of software devel-opment for ACI Services Inc., located in Cambridge, Ohio, U.S.A. [email protected].
CR =Discharge Pressure ABS
Suction Pressure ABS( )
Estimated BHP = 21 * CR 1/#Stages (#Stages)(FlowMMscfd)(1.154)( )
2012 edition 55 www.ctssnet.net ctss

Dwayne A. Hickman is the director of software devel-opment for ACI Services Inc., located in Cambridge, Ohio, U.S.A. He has been involved with the reciprocating compres-sor industry since 1992 and has written many articles. He can be contacted at: [email protected].
2012 edition 56 www.ctssnet.net ctss
(EQ #4)
Thus, discharge out of stage 1 = 65 * 8.692307692 1/2 = 191.637679 psia (interstage pressure), and discharge out of stage 2 = 65 * 8.692307692 2/2 = 565 psia (as expected).
Estimating the number of stages, required power and in-terstage pressures is very important. Each OEM has a finite number of frames and a predesigned family of standard cylin-ders that fit those frames. Thus, there are a limited number of combinations of frame/cylinders. At least one of the possible combinations is the best solution that that particular OEM can provide.
Unfortunately, it is not practical to check all possible com-binations. Based on OEM frames and cylinders, there can easily be over 1 trillion unique-position combinations. Even reviewing a million cases per second would require over 11 days, which is too long to wait.
Fortunately, it is not necessary to check all possible com-binations. Using the calculated estimates for number of stages and required power, the number of cases to review can easily be reduced down to about 30 to 10,000 combina-tions, depending on whether cylinders considered are iden-tical per each stage, pre-determined layouts are used (e.g. on a four-throw, two-stage model, two throws are always first stage and two throws are always second stage), if tan-dem cylinders are considered, etc. With such a significant decrease in the number of cases to check, a solution can be determined within seconds.
This remarkable reduction in hardware combinations to check begins by simply reviewing which frames are rated to handle the required power. Frames rated with sufficient load capabilities are checked to determine whether they have enough throws to (ideally) keep each stage equipped with double-acting cylinders (i.e., avoid using tandem cyl-inders). For those that do, the next step is to determine the size of the cylinders per stage. Note: The driver (engine or motor) can have an impact on sizing, since it really deter-
mines available load and speed. However, for now, concen-tration is placed on just the compressor portion of the unit.
Determining the bore sizes of the cylinders is the most in-volved process. In general, at this point, the initial and final pressures are known, the gas analysis is known, any side-streams are known, the speed (from the frame rating or the specified driver rating) is known, and finally the stroke and rod diameter are known (from the frame selected).
An additional restriction often employed is that of prede-termined hardware layouts. That is, if the OEM offers a two-throw, a four-throw and a six-throw frame, then the most common arrangements for a two-stage model would be: one first-stage cylinder and one second-stage cylinder on the two-throw frame, two first-stage cylinders and two second-stage cylinders on the four-throw frame; three first-stage cylinders and one second-stage cylinder on the four-throw frame; three first-stage cylinders and three second-stage cylinders on the six-throw frame; and four first-stage cylin-ders and two second-stage cylinders on the six-throw frame. Obviously, the incorporation of tandem cylinders would in-crease the number of potential useful cylinder layouts.
Cylinders are most often sized toward achieving balanced compression ratios across all stages. However, an alternate approach used mostly by at least one OEM is to allow the user to additionally size the units based on maintaining bal-anced discharge temperatures across all stages. Since all OEMs at least provide for the balanced-ratio approach, this article will concentrate on that sizing methodology.
Finally, another major restriction during the sizing process is that all cylinders per each stage are identical. That is, if X cylinders are required for the nth stage of compression, then all X cylinders on that stage are iden-tical. In other words, you would not normally design the system to have both a 10 in. (254 mm) and a 7 in. (178 mm) first-stage cylinder, but rather two 8.5 in. (216 mm) first-stage cylinders.
Thus, there are only a few major critical items of infor-mation that are not yet known, such as the fixed volumet-ric clearances per end of the cylinders, and the cylinder efficiencies (i.e., how high are losses due to cylinder pas-sageways and valving). Cylinder efficiencies tend to more significantly impact power requirements than flow rates. Clearances affect both power and flow — from very slight effects at low compression ratios to very significant effects at higher compression ratios. Cylinder fixed clearances are related to cylinder type, design and valving installed. Typi-cal fixed clearances for normal cylinders range from about 8 to 30%, with an average (based on over 800 OEM cylinders) being about 20%: typical fixed clearances for pipeline cylin-ders range from 40 to 200%, with an average (based on over 300 OEM cylinders) being about 60%. Finally, clearances on tandem cylinders (especially on the high-pressure end) vary significantly based on tandem design.
With select restrictions in force, the steps for cylinder siz-ing often proceed by determining the known information required by a general flow equation (e.g., Equation #6) and solving for bore diameters: 1. Number of cylinders (Cylinder images courtesy of Knox Western.)
Est. Discharge Pressure StageN = SuctionPressureABS * CR
StageN#Stages

2012 edition 57 www.ctssnet.net ctss
Dwayne A. Hickman is the director of software devel-opment for ACI Services Inc., located in Cambridge, Ohio, U.S.A. He has been involved with the reciprocating compres-sor industry since 1992 and has written many articles. He can be contacted at: [email protected].
Therefore, all quantities are known, except for the cylin-der’s bore diameter (BoreDiam). Thus, the equation for flow, Eq #6, is then solved for BoreDiam. The two (2) in front of the BoreDiam2 factor is there to reflect the total piston displace-ment for the entire cylinder, and not just for the head end (i.e., Head End + Crank End = p/4*Stroke*{ [BoreDiam2] + [BoreDiam2 – RodDiam2]} = p/4*Stroke*{2*BoreDiam2 – RodDiam2}). For tandems, only one end is used per stage, so the “2” factor would not be present in the equation.
Once BoreDiam is calculated, a check of which cylinders (if any) in the OEM database that are close (i.e., ±0.5 in., 12.7 mm) to this dimension and whose MAWP is close (and usu-ally higher) than PD are considered worthy of further review.
Steps 1 through 10 are repeated for each stage. The result of which is the determination of one specific frame with various combinations of cylinders that might sufficiently meet the end user’s sizing request.
Steps 1 through 11 are repeated for each frame worth con-sidering. The result of which is the determination of vari-ous frames with various combinations of cylinders that might sufficiently meet the end user’s sizing request.
All combinations found in Step 12 (using a thorough ther-modynamic performance method) are reviewed for safety and predicted closeness to desired flow rate. Unsafe (high rod loads, pin nonreversals, high interstage pressures and/or temperatures, grossly overloaded, etc.) should be dropped from consideration. Furthermore, if the hardware combina-tion is technically safe, but reasonably close to problem ar-eas, that combination should also be dropped — unless it is the only one left: Do you really want your key design point positioned close to unsafe operating conditions?
Finally, the list of possible solutions should be presented to the end user, perhaps ranked by load per flow (i.e., bhp, MM), cost per unit, delivery time per unit, etc. This list of possible solutions should remain available to the user so that they can review each hardware combination in more detail.
An ideal solution is one that delivers the required flow rates for the least amount of power, yet is quite safe to run at the indicated (design) operating point. Additional items, such as actual unit costs, delivery schedules, OEM reputa-tion, etc., need to be considered as well. However, as these are more subjective, this paper concentrates on just the ob-jective elements of power, flow and safety.
Oversizing a compressor on load (bhp, kW) leads to buying a driver with more power than required, and a frame and/or cylinders larger than needed. These items increase the cost of the project, and for engines may increase emission issues and affect related emission permits. On the positive side, when the unit is installed and if it fails to meet flow performance objec-tives (often due to flow restrictions resulting from installed pulsation attenuation devices), there’s some additional power available to overcome any unforeseen system pressure drops.
Oversizing a compressor on flow is more acceptable as the use of unloading devices (speed, variable volume pockets, fixed-volume pockets, end deactivators, etc.) often allow the unit to be unloaded to meet the desired flow rate.
Undersizing a compressor on load (bhp) leads to buying
to consider per stage is known via the predetermined hard-ware layout. 2. Stroke and rod diameters are known from the frame being considered. 3. Maximum speed (rpm) is known from the frame considered and/or the driver speci-fied. 4. Assuming balanced compression ratios per stage, the interstage pressures are easy to estimate via Equation #4. This gives suction pressure (PS), and discharge pressure (PD), and compression ratio (CR) per stage. 5. Knowing PS and PD, gas analysis, and initial suction temperatures (of-ten TS=60°F [15.6°C] is used for first stage, and TS=120°F [48.9°C] for subsequent stages), allows for determination of suction volumetric efficiency (VES) and suction gas com-pressibility (ZS). Note that discharge temperature TD (= TS * CR1-1/K) is required for the discharge gas compressibility (ZD) factor, which is required in the calculation of VES.
(EQ #5)
The term “a” usually varies from 0.96 to 1.00, and the “slippage” term is often very unique to the OEM, although it tends to be in the neighborhood of 1 to 4% of CR, with high-er slippage rates often associated with gases like hydrogen.
The “K” term (specific heat ratio) is based on the gas analysis, and for typical natural gas is in the range of 1.24 to 1.34. For the gas analysis specified in the example, the “K” term is about 1.2692. While this Gas-K value is often calculated as the ratio of tabulated values of CP and CV (specific heat capacities relative to constant pressure and to constant volume, respectfully), it really is determined by solving the equation Entropy (PS,TS) = Entropy(PD,TD) for TD, then finding K such that TD = TS * CR1-1/K.
The “Clr” factor is the fixed volumetric clearance of the cylinder end, as a fraction of swept volume. Technically, this item is not known until a cylinder is selected. Since it is undesirable to attempt to solve a single equation with two unknowns (clearance and bore diameter), this factor is usually assigned a value based on the OEM’s average clearance per end for a select group of cylinders. This might be 15% (Clr = 0.15) for normal cylinders and 65% (Clr = 0.65) for pipeline cylinders. Note: The assumed clearance values to use during the sizing process signifi-cantly affect later results. Cylinders that greatly differ in clearances between head end and crank end, or cylinders that greatly differ from the average OEM base clearances, are more likely to lead to poor sizing results.
In Equation #6, TBASE, PBASE are known (standard condi-tions) and ZBASE is subsequently determined from them.
In Equation #6, the constant factors correct for units, dry-ing gas, OEM adjustments, etc.
Flow is specified as part of the user’s design point. Moreover, an equation to calculate reciprocating compressor flow is:
(EQ #6)
( )(#Cyls * rpm * stroke)(2 * BoreDiam2 — RodDiam2)(VES)
Flow =
( )ZBaseTBasePs
ZSTSPBase
6.531895107
( )VES = � — Slippage — Clr CRZS
ZD
1K * — 1

Dwayne A. Hickman is the director of software devel-opment for ACI Services Inc., located in Cambridge, Ohio, U.S.A. He has been involved with the reciprocating compres-sor industry since 1992 and has written many articles. He can be contacted at: [email protected].
2012 edition 58 www.ctssnet.net ctss
a driver with less power generation than required, and a frame and/or cylinders smaller than needed. Undersizing tends to initially decrease the cost of the project. However, in the long term, the costs for installing larger drivers later (and consequences of acquiring new emission permits), fail-ing to deliver contractual flow rates, recylindering the unit, adding additional site compression, etc., often make the ini-tial savings pale in comparison.
Undersizing a compressor on flow is usually not accept-able, as it significantly impacts the customer’s ability to ever meet their flow objectives. Often, the same concerns as undersizing a unit on load are relevant.
Thus, during the initial sizing process, sizing software might tend to slightly oversize the unit in regards to achiev-ing desired flow rates. Then, it should favor the frame/cylin-der combinations that require the least amount of power to compress the slightly adjusted gas volumes.
Finding Solutions Based On Multiple Design Points — An Advanced Sizing Approach
In real-world applications, rarely is only a single design point specified when purchasing a large reciprocating com-pressor. In general, while an OEM may only guarantee a single point, the end user desires a unit that can achieve multiple goals across a wide operating map. Otherwise, why even consider a reciprocating compressor?
A typical resolution to handling multiple design points is to size the unit to the user’s specified guarantee point, or to the design point that specifies the highest flow rate. The idea being that with sufficient turndown, via adjusting speed and/or adding unloading devices (clearance pockets and/or end deactivators), the unit can then hopefully meet the flow rates at the other design points, while still staying under the maximum allowed load, and not operating in potentially unsafe conditions. This approach does not always work.
This multipoint sizing issue can quickly become difficult to address if multiple services (e.g., natural gas on two cyl-inders, and propane on four cylinders of the same frame) are specified on the unit, if the unit can operate in different modes (e.g., single- and two-stage modes for injection and withdrawal), or if the unit operates by having its inlet gas come directly from another compressor or has its discharge gas go directly into another compressor. These occasional, but more complex situations genuinely call for an experi-enced and detail-oriented performance engineer to meticu-lously do the sizing.
For the more normal cases, where the unit serves only one mode and one service, but must be flexible enough to handle a wide range of operating points, then there should be a sizing procedure to identify what hardware combinations best meet the end user’s specifications. However, of the six largest North American reciprocating compressor OEMs, as well as other major global compressor OEMs, only one had software available for sizing a unit based on multiple de-sign points — as of August 2009.
To understand the issues with a multipoint sizing prob-
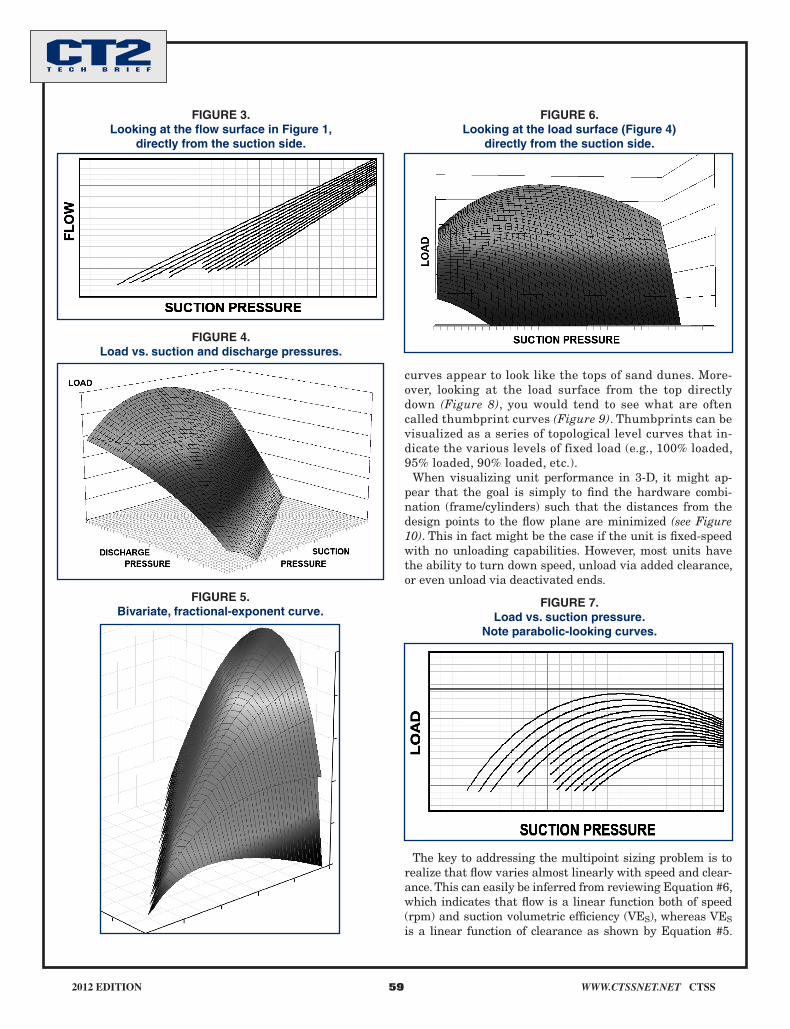
lem, it is important to visualize what goal is to be achieved. First, the list of design points is likely to consist of just dif-ferent flow requirements at different suction and discharge pressure combinations. For a reciprocating compressor, when flow is plotted against suction and discharge pres-sures (Figure 1) the resulting surface is very close to a plan-er surface (Figure 2), but not quite. When load is plotted against suction and discharge pressures (Figure 4) the re-sulting surface is similar to a bivariate, fractional-exponent curve (Figure 5), but again not quite.
Looking at the flow surface (Figure 1) directly from the suction side, or from the discharge side, you would tend to see straight lines (Figure 3). This explains why when an OEM plots flow curves, those curves appear very linear.
Looking at the load surface (Figure 4) directly from the suction side (Figure 6), or from the discharge side, you would tend to see parabolic-looking curves (Figure 7). This explains why when an OEM plots load curves, those
FIGURE 1. Flow vs. suction discharge pressures.
FIGURE 2.Plot of plane in 3-D.
Dwayne A. Hickman is the director of software devel-opment for ACI Services Inc., located in Cambridge, Ohio, U.S.A. He has been involved with the reciprocating compres-sor industry since 1992 and has written many articles. He can be contacted at: [email protected].
2012 edition 59 www.ctssnet.net ctss
curves appear to look like the tops of sand dunes. More-over, looking at the load surface from the top directly down (Figure 8), you would tend to see what are often called thumbprint curves (Figure 9). Thumbprints can be visualized as a series of topological level curves that in-dicate the various levels of fixed load (e.g., 100% loaded, 95% loaded, 90% loaded, etc.).
When visualizing unit performance in 3-D, it might ap-pear that the goal is simply to find the hardware combi-nation (frame/cylinders) such that the distances from the design points to the flow plane are minimized (see Figure 10). This in fact might be the case if the unit is fixed-speed with no unloading capabilities. However, most units have the ability to turn down speed, unload via added clearance, or even unload via deactivated ends.
The key to addressing the multipoint sizing problem is to realize that flow varies almost linearly with speed and clear-ance. This can easily be inferred from reviewing Equation #6, which indicates that flow is a linear function both of speed (rpm) and suction volumetric efficiency (VES), whereas VES is a linear function of clearance as shown by Equation #5.
FIGURE 3. Looking at the flow surface in Figure 1,
directly from the suction side.
FIGURE 6. Looking at the load surface (Figure 4)
directly from the suction side.
FIGURE 7. Load vs. suction pressure.
Note parabolic-looking curves.
FIGURE 4. Load vs. suction and discharge pressures.
FIGURE 5. Bivariate, fractional-exponent curve.

Dwayne A. Hickman is the director of software devel-opment for ACI Services Inc., located in Cambridge, Ohio, U.S.A. He has been involved with the reciprocating compres-sor industry since 1992 and has written many articles. He can be contacted at: [email protected].
2012 edition 60 www.ctssnet.net ctss
1. Determine the number of stages of compression re-quired. This will be the maximum of the individual results from Equation #2 for each design point.
2. Estimate the amount of power required. This will be the maximum of the individual results from Equation #3 for each design point.
3. Repeat steps #1 through #13 of the Single Design Point Method for each design point. This endeavor will generate a combined list of hardware combinations (frames and cylinders) that deserve further review to see if any of them can effectively meet the end user’s objectives.
Thus, slowing the driver’s speed down, and/or adding clear-ance (e.g., opening variable volume pockets [VVPs] on the head end) will lower the resulting flow rates. Thus, the actual flows the unit could possibly achieve are bounded above by a maximum flow surface (operating unit at maximum speed with minimum clearance) and below by a minimum flow sur-face (operating unit at minimum speed with maximum clear-ance) — see Figure 11 for visual.
Therefore, a procedure (described here for easier under-standing and not necessarily for optimizing the computing process or handling exceptions) for sizing the unit toward multiple design points is:
FIGURE 8. Looking at the load surface (Figure 4)
from the top directly down.
FIGURE 9. Thumbprint curves.
FIGURE 10. Distance from design point to
flow plane representation.
FIGURE 11. Flow vs. discharge and suction pressure.

Dwayne A. Hickman is the director of software devel-opment for ACI Services Inc., located in Cambridge, Ohio, U.S.A. He has been involved with the reciprocating compres-sor industry since 1992 and has written many articles. He can be contacted at: [email protected].
2012 edition 61 www.ctssnet.net ctss
more complexity. However, the benefits to the sizing en-gineer and the end user are substantial. For example: streamline the process of identifying what frames and cyl-inder bore sizes are appropriate to the overall compres-sion needs; quickly check hardware with regard to power, flow and safety requirements; save hours of engineering/packager/end-user effort by identifying a short list of ideal solutions that are most likely to meet the compression ob-jectives; quickly propose alternative solutions that may be less expensive, have shorter delivery times, etc.; and pre-vent user oversights regarding unit safety — help to pre-vent sizing of hardware in areas of unsafe or nearly unsafe operating conditions.
Summary
While most current reciprocating compressor selec-tion packages simply return a single hardware solution, customer expectations are changing and end users and packagers now expect more powerful options from their OEM’s provided sizing/performance software. This is very important as new and inexperienced users can easi-ly be misled into false impressions about the capabilities and adequacy of auto-sized hardware. They need to know if there are other potentially better (and safer) combina-tions of the OEM’s hardware. And, they need to be able to find those ideal combinations without searching through millions of combinations.
Thus, whether sizing software is configured to handle just a single design point or multiple design points, the best avail-able software should properly identify the appropriate OEM hardware combinations (frames and cylinders) to best meet the desired flow rates, while also properly considering unit op-erational safety. A desirable goal is that sizing software should return multiple useful combinations of hardware, and not ar-bitrarily stop after returning only one particular combination.
References
“Practical Applications of Compressor Sizing,” GMC Pa-per/ASME, 2000, Hasu Gajjar.
“The Ins and Outs of Sizing Reciprocating Compressors,” GFC Papers, 2004, David Pearsall, Dresser-Rand Co. n
4. Now, for each frame/cylinder combination found in Step #3 above, model the unit performance using a thorough thermodynamic performance method.
a. For each of the design points, check for pre-dicted closeness to desired flow rates. Adjust speed and/or cylinder’s allowable clearances to achieve the desired flow rate, if possible. Hardware arrangements that cannot reason-ably meet all design point flow rates should be ranked low.
b. For each of the design points, check for operat-ing safety at conditions (determined speed and clearance settings) required to achieve desired flow. Unsafe (high rod loads, pin nonreversals, high interstage pressures and/or tempera-tures, overload, etc.) should be dropped from consideration. Furthermore, if the hardware combination is technically safe, but reason-ably close to problem areas, that combination should also be dropped (unless it is the only one left).
c. Note: Changes to both speed (rpm) and clear-ance will affect flow rates. Thus, potentially, dif-ferent combinations of adjustments to speed and clearance can result in the same flow rate. How-ever, this does not mean that the unit integrity is the same at both adjustment points. Consider: i. Changes to speed can quickly affect rod loads and pin nonreversals. ii. Changes to clearance can adversely affect volumetric efficiencies, in-crease discharge temperatures and increase in-terstage pressures (which can consequentially affect rod loads and pin nonreversals).
5. Finally, the list of possible solutions should be pre-sented to the end user, perhaps ranked by how effec-tive each hardware combination was at achieving the desired flow rates of all of the design points. This list of possible solutions should remain available to the user so that they can review each hardware combina-tion in more detail. See Figure 12.
Evolving the sizing process from a simple one-point method to a multipoint method did not involve that much
FIGURE 12. List of possible solutions for a compressor sizing request.