improving the impact resistance of masonry …greg99/epsrcgm/genaccess/report_exec.pdf · improving...
TRANSCRIPT
1
IMPROVING THE IMPACT RESISTANCE OF MASONRY PARAPETSSUMMARY REPORT
October 2001
Investigators:Professor Brian Hobbs, University of TeessideDr Tom Molyneaux, University of LiverpoolDr Matthew Gilbert, University of Sheffield
ABSTRACTThis report describes the initial overall objectives of the EPSRC funded project 'Improving theimpact resistance of masonry walls' and then summarises work that has been carried out duringthe first two years to attempt to meet these objectives.
1. INTRODUCTION
The current work is a three-year collaborative project between the Universities of Liverpool,Sheffield and Teesside and is designed to continue and develop work that has resulted from apreviously successful EPSRC grant, ‘Impact resistance of masonry walls’. The overall aims ofthe project are to develop an understanding of the influence of reinforcement on the response ofmasonry walls to "car like" impact loading and to apply this to the development of cost effectiveand durable construction and strengthening procedures for masonry parapets on bridges andretaining walls. A subsidiary (and inter-linked) aim is to investigate the mechanical propertiesand rate sensitivity of both the unit-mortar bond and the reinforcing materials that may be used toimprove the strength to the walls. The project will finish in approximately one year.
The main focus of the original work was on the fundamental behaviour of unreinforced masonrybrick and block walls subject to dynamic impact loading. Results from the original workhighlighted a lack of information on the dynamic properties of masonry joints and showed thatthere was a real need to investigate the implementation of novel reinforcement techniques.
Several project objectives were identified at the start of the project and in order to achieve theseeach university has been allocated specific objectives. The research areas have been organisedto reflect the facilities and expertise that the three universities gained as a result of the originalproject. An interaction diagram detailing the organisational structure and principal tasks is shownin Figure 1.

2
Finite element modelling of small specimens
Small-scale masonry and
reinforcement tests
Liverpool
Finite element modelling of test walls
Hopkinson bar masonry tensile/shear bond tests
Sheffield
Mechanism analysis
Full-size wall tests (repaired/new build)
Teesside
Figure 1: schematic of principal tasks
1.1. Global objectives• Explore current methods of reinforcement of masonry walls.• Gain a fundamental understanding of the mode of response of reinforced and
unreinforced masonry walls subjected to vehicle impacts. This will be achieved by:� Undertaking full size and small-scale laboratory test work.� Developing appropriate numerical models.
• Produce recommendations for selection of reinforcement systems.
1.2. Teesside objectives• Testing of full size reinforced and unreinforced masonry walls subjected to localized
dynamic loads with similar characteristics to those resulting from accidental car impacts.• Continue development of the mechanism method of analysis described in the earlier
EPSRC work.
1.3. Sheffield objectives• Investigate the dynamic shear and tensile bond characteristics of masonry - using a Split
Hopkinson Pressure Bar technique and/or other appropriate experimental techniques.• Model masonry walls using a finite element methodology to investigate the effects of
different reinforcement configurations and to identify the most significant parameters.
1.4. Liverpool objectives• Development of small scale reinforced and unreinforced test methods in order to provide
dynamic and static data required for the finite element modelling.• Test and analysis of small structural models.
2. TEESSIDE PROGRESS
2.1. Impact testingThere have been 9 impact tests on 6 walls at the University of Teesside. The test rig wasdesigned specifically for the EPSRC impact test programmes and comprises a vertical dropweight and rotating quadrant arrangement, as showing in Figure 2. The impact velocity and

3
energy can be controlled by adjusting the mass and the drop height. The load applied to the wallis measured by a load cell positioned between the toe of the rotating quadrant and a 400 mmsquare steel plate placed against a fibreboard sheet on the face of the test wall. The rise timeand duration of the impact load are controlled by a crushable timber block fixed on the heel of therotating quadrant. A suitable design of this timber block has been achieved so as to reproducethe impact characteristics of a typical car impact.
Figure 2: impact test rig
2.2. Test Details2.2.1. Wall detailsThe wall panels were constructed on steel plates bolted to the strong floor and tested at least 28days after construction. All walls were constructed using Marshall’s Nori Class B Engineeringbricks using a Designation (iii) mortar with a water/cement ratio of 1.39. Brick bond was EnglishGarden wall using 13 courses and a brick on edge capping. The walls were 330 mm breadth and1090 mm height. Table 1 summarises wall lengths, end conditions and reinforcement details.
Table 1: wall details
WallRef:
Units Mortar Construction Length
Breadth(mm)
Height(m)
EndConditio
Reinf
B8 ClassB Solid
Design(iii)W/C 1.39
English GardenWall13 Courses & Brick on edge
19.54 330 1.09 2 x Free None
RB8 ClassB Solid
Design(iii)W/C 1.39
English GardenWall13 Courses &Brick on edge
19.54 330 1.09 2 x Free 6mm Stainless,each face, topof courses 1, 3,5, 7, 9, 11, &13
B8(End)
ClassB Solid
Design(iii)W/C 1.39
English GardenWall13 Courses &Brick on edge
4.48 330 1.09 1 x Abut.1 x Free
None
RB9 ClassB Solid
Design(iii)W/C 1.39
English GardenWall13 Courses &Brick on edge
9.6 330 1.09 2 xSimpleSupports
6mm Stainless,each face, top ofcourses 1, 3, 5,7, 9, 11, & 13

4
WallRef:
Units Mortar Construction Length
Breadth(mm)
Height(m)
EndConditio
Reinf
RB10 ClassB Solid
Design(iii)W/C 1.39
English GardenWall13 Courses &Brick on edge
9.12 330 1.09 2 x Free 6mm Stainless,each face, top ofcourses 1, 3, 5,7, 9, 11, & 13
RB10(Test2)
ClassB Solid
Design(iii)W/C 1.39
English GardenWall13 Courses &Brick on edge
9.12 330 1.09 2 x Free 6mm Stainless,each face, topof courses 1, 3,5, 7, 9, 11, & 13
RB9(Test2)
ClassB Solid
Design(iii)W/C 1.39
English GardenWall13 Courses &Brick on edge
9.6 330 1.09 2 xSimpleSupports
6mm Stainless,each face, topof courses 1, 3,5, 7, 9, 11, & 13
RB11 ClassB
Design(iii)w/c 1.39
English GardenWall13 courses &Brick on edge
9.6 330 1.09 2 xSimpleSupports
2 x 6 mmstainless eachface, top ofcourses 1, 2, 3,4, 5, 6, 7, 8, 9,10, 11, 12 & 13
RB12 ClassB
Design(iii)w/c 1.39
English GardenWall13 courses &Brick on edge
19.54 330 1.09 2 x Free Proprietarysystem – seebelow.
2.2.2. InstrumentationThe walls were instrumented with displacement transducers and potentiometers to record out ofplane movements, at mid-height and close to the top of the wall, and in-plane longitudinalmovements at the ends of the wall. In some walls conducting paint crack detectors wereemployed to determine the time at which fractures occurred.
2.2.3. Bed Joint ReinforcementBed-joint reinforcement was used in walls RB8, 9, 10 & 11. The stainless steel reinforcement barused was an austenitic stainless steel grade 460 type 2 (ribbed) reinforcement bar complying toBS 6744. Bars were 6 mm diameter and 6.0 m long.
2.2.4. Proprietary Anchor SystemThe anchor system used was a specially designed system consisting of a reinforcing membersurrounded by a fabric sock which was inflated using a cementitious grout. The mesh of the sockcontained the aggregate of the mixed grout whilst still allowing the cement enriched water to passthrough the sock thus bonding to the substrate. Both horizontal and raking anchors were used.The main horizontal anchor consisted of 6 No x 8 mm diameter high yield multibar in a 85 mmdiameter hole, the centre of which was 370 mm below the top of the wall. 20 raking anchors wereused - installed in pairs at 30° to the vertical. Each anchor consisted of 3 No 8 mm diameter highyield mulitbar in a 50 mm diameter holes either side of the vertical centre line of the wall.
2.3. Test ProgramIn order to obtain the maximum amount of useful post-test information the mass, drop height andcrush block shape were selected for each test so as to generate a representative force/time
5
history and an initial failure mechanism, without causing excessive damage to the wall. Nine full-scale impact tests have been carried out. Details of each test are shown in Table 2
Walls RB8 to RB12 were all reinforced walls whilst wall B8 was unreinforced to provide a controltest for the programme. After the central impact on wall B8 it was possible to salvage a length ofsubstantially undamaged masonry and the opportunity was taken to carry out an additional testclose to the end of the wall, B8 (End). Wall RB9 was simply supported at both ends andsubjected to a central impact. This wall was subjected to a second central impact, RB9 Test 2.Wall RB10 was essentially identical to RB9 but was tested without any end supports. Again thiswall was subjected to a second impact, RB10 Test 2. Wall RB11 was constructed and tested withthe same end conditions as RB9 but was reinforced with 3.7 times the amount of bed jointreinforcement. Wall RB12 was constructed and tested in the same manner as walls B8 and RB8.Wall RB12 was reinforced with a proprietary anchor system consisting of horizontal and rakingreinforcement grouted into drilled in holes.
Additional supplementary tests were carried out on samples of masonry to establish the density ofthe brickwork, shear bond, pullout characteristics of the reinforcement and the static bendingperformance of small panels of brickwork. The coefficient of friction between the masonry andthe steel base plates was also established.
Table 2 : test details
Wall Ref:DropHeight(m)
Mass (kg) Age attest(days)
MortarStrength(N/mm2)28 days
LocationofImpact
PeakForce(kN)
MaxDispl.(mm)
B8 1.27 1500 30 3.90 Centre 256 158RB8 1.27 1500 32 4.39 Centre 228 176B8(End) 0.82 690 151 3.90 End 85 312
RB9 1.27 1220 28 7.49 Centre 251 50RB10 1.00 1220 30 7.32 Centre 228 184RB10(Test 2)
1.00 1220 52 7.32 Centre 224 126
RB9(Test 2)
1.00 1220 104 7.49 Centre 196 151
RB11 1.27 1220 28 8.65 Centre 236 55RB12 1.27 1500 65 5.33 Centre 300 100
2.4. Test resultsExtensive data in the form of force/time and displacement/time histories has been obtainedtogether with video records and times of crack formation.
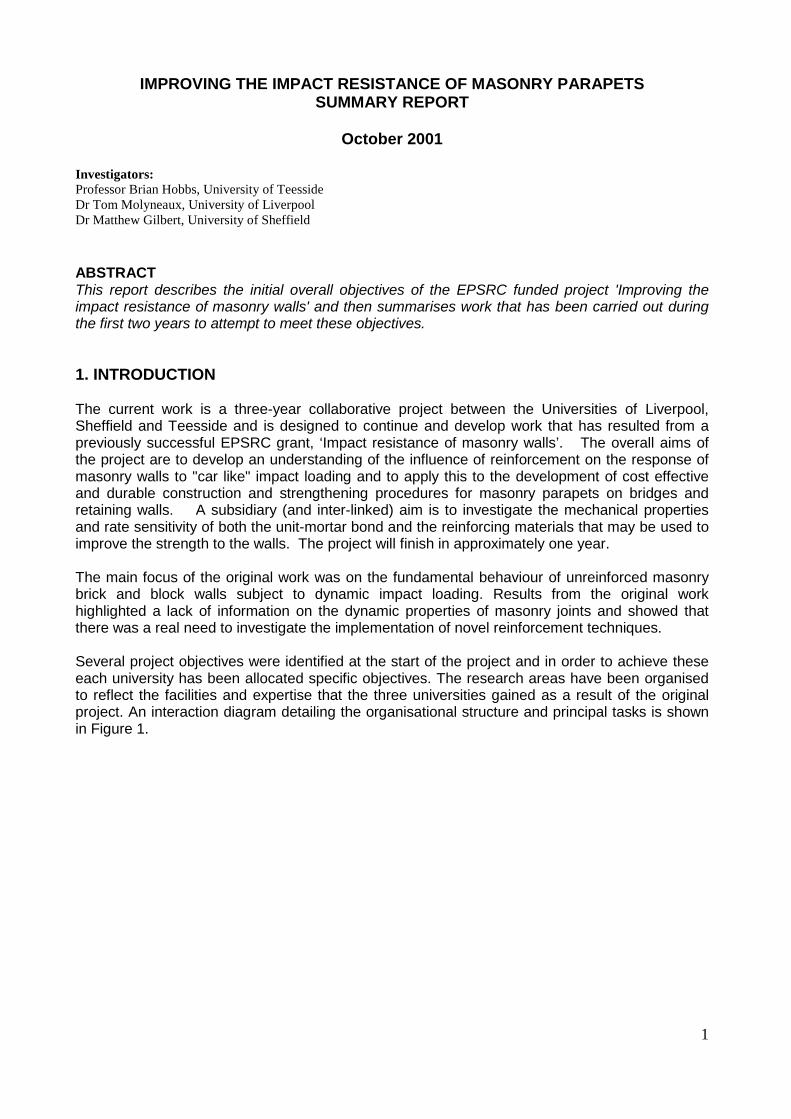
2.4.1. Modes of FailureA brief description of the failures is given in Table 3. The failure mechanism for the control wallB8 was the same as those observed previously for tests on unreinforced walls. The mechanismwas generated by the formation of three fracture lines, at which the rotations were concentrated,together with horizontal shear cracks, generally at the base of the wall. The fracture lines dividedthe wall into plane panels, which rotated and translated as the mechanism developed. The crackpattern for the 20m wall containing bed joint reinforced, RB8, was very different to theunreinforced wall B8. In wall RB8 long horizontal fractures occurred along a number of bed joints.This was accompanied by significant relative horizontal displacements between several courseseffectively dividing the wall into three horizontal brick beams. Photograph 1 shows the bed joint

6
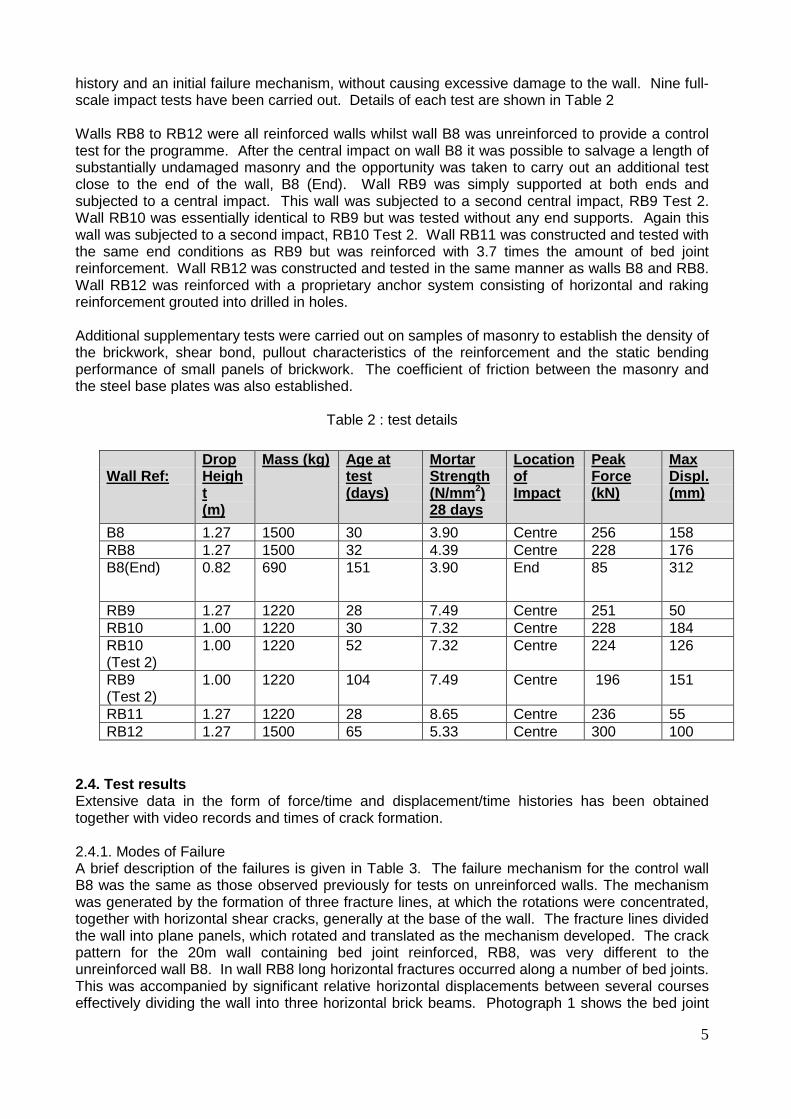
failures and displacements at the centre of wall on the non-impact face. During the demolition ofwall RB8, large vertical cracks were found between adjacent bricks within a course (seePhotograph 2). The bed joint failures and separation of bricks within a course has not beenexperienced in any of the previous tests on unreinforced walls and was not found in the other20m reinforced wall, RB12.
Table 3: failure mechanisms
WallRef.
Description of Crack pattern Max. Length ofcrack dispersion
(m)
Max. HorizontalDisplacement atbase of wall (mm)
B8 Central vertical fracture,Diagonal fractures either side ofimpact emanating from base ofwall. Multiple bed joint fractures.
4.5 55
B8(End)
Diagonal fracture emanating frombase of wall 1m from centre ofimpact. Diagonals dissipate in 2directions.
3.6 113
RB8 Long fractures along bed joints,diagonal fractures at ends of bedjoint fractures.
7.1 29
RB9 Intermittent bed joint fractures,diagonal fractures emanating frombase of wall.
3.8 45
RB10 Discontinuous bed joint fractures,diagonal fractures starting at bedjoint failures.
2.6 43
RB11 Multiple long bed joint fractures &perpend fractures toward end ofbed joint dispersion, irregularpattern
4.1 26
RB12 Central vertical fracture seen onnon-impact face only. Diagonalfractures either side of impactemanating from base of wall onimpact side only.
5.5 54
7
Photograph 1: bed joint failures, wall RB8
Photograph 2: vertical separation in wall RB8

8
3. SHEFFIELD PROGRESS
3.1. Design of a Split Hopkinson Pressure BarAt present there is very little experimental data relating to masonry joints that have beensubjected to dynamic impact loading. In order to assist with the development of a numericalmodel that is able to simulate the response of a masonry bridge parapet subject to a car-likeimpact it is necessary to incorporate a rate dependent joint constitutive model. Therefore, one ofthe main objectives of the Sheffield programme of work is to test masonry joints under dynamicimpact loading.
A Split Hopkinson Pressure Bar (SHPB) test rig potentially allows characterisation of theproperties of brick-mortar specimens subject to both dynamic tensile loading and combinedcompressive and shear loading. The SHPB has been used for many years and is well suited todetermining material properties at different rates of strain. Significantly, the test will allow not onlythe tensile and shear strengths of a sample to be obtained; it will also enable the post-peaksoftening branch (e.g. Figure 3) to be characterised. The amount of energy dissipated (due to thejoint cracking) corresponds to the area under the stress-crack displacement curve. This is termedfracture energy Gf. and is an important parameter required for the numerical modelling work.
0.05 0.1 0.15 0.2 0
0.2
0.4
0
Stress (N/mm2)
Crack Displacement (mm)
Gf
Post peak softening branch
Figure 3: typical behaviour of a masonry joint under tensile loading and definition of fractureenergy
3.1.1. Current statusThe test rig is almost fully complete and is now able to produce dynamic compressive and tensileloading pulses. A series of proving tests are being carried out to ensure that rig is mechanicallysound and is able to produce consistent high quality stress pulses. Once the rig is fullyoperational, materials characterisation tests will be carried out on brick-mortar specimens. Initially,the test programme will comprise dynamic tension tests only. Once these tests have been carriedout and the results are shown to be satisfactory, there is scope to subject specimens to combinedstress states. It should be possible to complete at least 100 tests over the duration of the project.
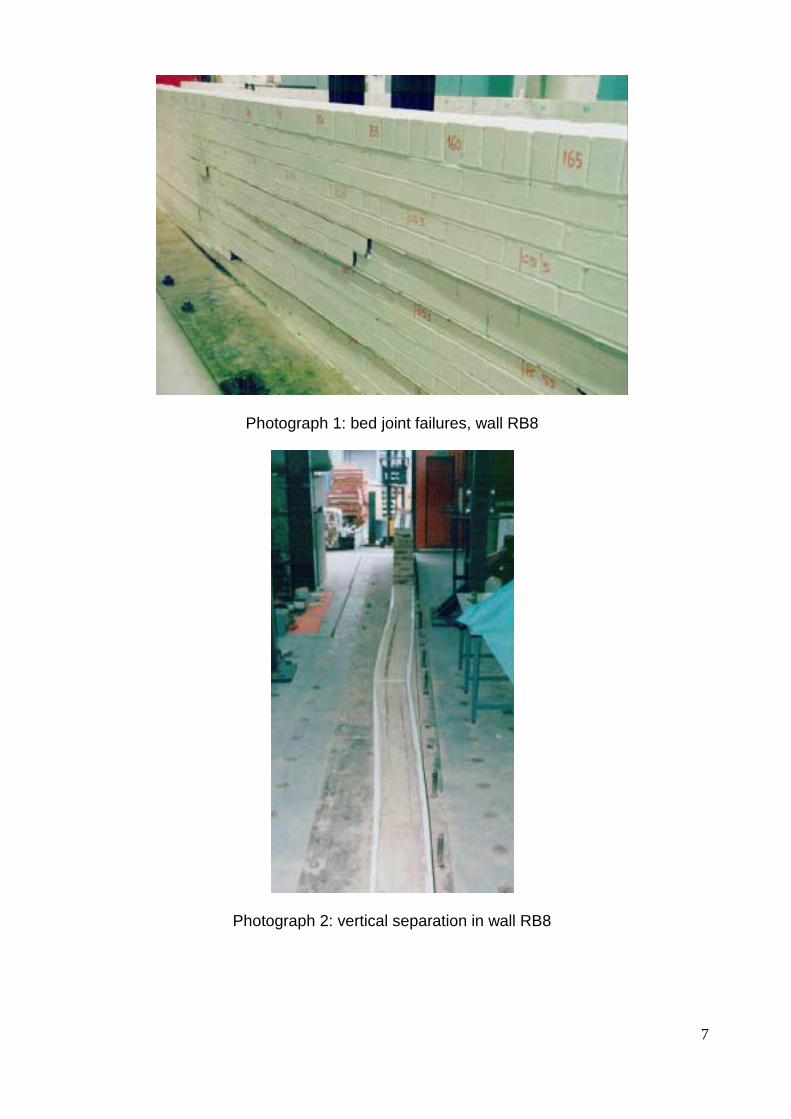
3.1.2. Description of test rigThe test rig comprises two 100mm diameter aluminium bars with the specimen sandwichedbetween the two ends (Figure 4). Tension, compression, shear or a combination is applied to theinput bar with the clamp in place. Releasing the clamp results in a stress wave travelling downthe bar and through the specimen into the output bar. Strain gauges on each bar record the
9
strain history as the wave travels and these results are analysed using wave propagation theoryto establish the stress-strain history in the specimen.
This stored energy approach is particularly advantageous because it enables tension,compression and torque to be applied to the bar simultaneously i.e. a combined stress state canbe achieved. However, not only does the stored energy technique allow a combined stress statebut it also enables the stress to be applied either dynamically or statically. For example, a staticpre-compression may be applied prior to a dynamic shear stress. This is particularlyadvantageous when testing frictional materials such as masonry because it is often useful to beable to simulate loading that results from the self-weight of a structure and the application of adynamic load.
Specimen Input bar Output bar
Strain gauge Strain gauge
Clamp
Hydraulic actuator
Compression/ Tension
Torque
Strain
Time
Strain
Time
Figure 4: split Hopkinson Pressure Bar schematic
3.2. Numerical modellingThe second objective of the Sheffield programme of work is to accurately model the TeessideUniversity laboratory walls numerically. This should permit a greater understanding of thefundamental performance of reinforced masonry walls to be obtained. Once satisfactoryrepresentations of the walls have been obtained, it is relatively straightforward to extend themodelling strategy to include wall-vehicle interactions and variations of reinforcement. Full-scalemodelling has focussed on the 9.12m reinforced, 9.6m reinforced (with end supports) and the19.54m reinforced and unreinforced walls.
The finite element modelling has been carried out using LS-DYNA, a three-dimensional non-linearexplicit finite element program. A discrete modelling approach is being employed, wherebyindividual masonry units are modelled separately and fracture is permitted to occur either alongthe mortar joints or through the centres of the masonry unit. The rationale behind the use of adiscrete modelling strategy for masonry is that, as the performance is to a large extent governedby the mechanical behaviour of the joints between the constituent units, potential failure surfacesare realistically considered to be predefined. The ribbed stainless steel reinforcement has beenrepresented by an elasto-plastic material model .
The Fortran source code of LS-DYNA has been modified to incorporate a purpose writteninterface algorithm and a number of key parameters are currently being investigated. At present,it is thought that the unit-mortar, reinforcement-mortar and unit-base shear and tensile interfaceproperties are likely to have a significant influence on the behaviour of the wall. Significantprogress has been made in modelling the walls that have been tested at Teesside, though thereis still scope for improvement.
3.2.1. Unreinforced wall (B8 - 19.54m)A model of a 19.54m unreinforced wall has been impacted at mid length with an impulse ofapproximately 7.5 kNs - equivalent to that measured from the test. Figure 5 shows out of plane

10
displacement fringes. The diagonal fringes indicate that the wall tilts and translatessimultaneously. The fringe discontinuities at courses 3, 4 and 8 indicate the presence ofhorizontal shear planes.
Rear Elevation
Plan
-20
2
24
46
68
90
112
134
156
178
200
Displacement (mm)
Figure 5: 19.54m unreinforced wall (B8): fringes of out-of-plane displacement (time = 0.12s)
Figure 6 shows a section through the wall at the point of impact and once again, it is clear thathorizontal shear planes form within the wall. Some horizontal cracking was in evidence in the testwall following impact however the splits along longitudinal (or ‘collar’) joints seen in the analysiswere not observed experimentally.

11
-20
2
24
46
68
90
112
134
156
178
200
Displacement (mm)
Figure 6: 19.54m unreinforced wall (B8): section through wall at mid length showing fringes ofout-of-plane displacement (time = 0.12s)
3.2.2. Reinforced wall (RB8 - 19.54)For all reinforced walls described in this report reinforcement has been placed on top of courses1,3,5,7,9,11 and 13. Unlike in the case of the model of unreinforced wall B8, the reinforced wallmodel does not start to fail at around 0.12s but instead continues to remain relatively undamagedeven at 0.28s. Once again (Figures 7,8), it is apparent that the wall tilts as it translates and thathorizontal shear planes form within the bed joints. These shear planes form on top of courses 1, 3and 7 and correspond to those courses containing reinforcement. Similar shear planes were alsoobserved to form along courses containing reinforcement in the impact test (see Photograph 1).
The peak wall displacement, measured 0.5m left of the point of impact at the top of the wall, isbetween 156mm and 178mm and compares well with the actual full-scale wall displacement of176mm.

12
Rear Elevation
Plan
-20
2
24
46
68
90
112
134
156
178
200
Displacement (mm)
Figure7: 19.54m reinforced wall (RB8): fringes of out-of-plane displacement (time = 0.28s)
Figure 8 shows a section through the wall at the point of impact. Once again, it is clear thathorizontal shear planes form within the wall but it is also apparent that the wall splits along verticaljoints between courses 1 and 7. Significantly, a similar observation was made for the full-scalewall (see Photograph 1).
-20
2
24
46
68
90
112
134
156
178
200
Displacement (mm)
Figure 8: 19.54m reinforced wall (RB8): section through wall at mid length showing fringes of out-of-plane displacement (time = 0.28s)

13
3.2.3. Reinforced wall (RB10 - 9.12m)The model and experimental wall displacements, measured 0.36m left of the point of impact atthe top of the wall, are shown in Figure 9. Immediately after impact the wall starts to displace withtime and up until 0.038s the model response closely follows the full-scale wall response. After0.038s the full-scale wall starts to displace at a much slower rate before eventually reaching amaximum displacement of 184mm at approximately 0.43s. In contrast, the maximum modeldisplacement of 164mm occurs at 0.33s.
0
50
100
150
200
250
0 0.05 0.1 0.15 0.2 0.25 0.3 0.35 0.4 0.45 0.5
Time (s)
Dis
plac
emen
t (m
m)
ModelFull-scale
Figure9: 9.12m reinforced wall (RB10): displacement-time graph
It is clear (Figure 9) that the wall model starts to rock back towards its original position earlier thanthe full-scale wall. Figure 10 shows the out-of-plane displacement at 0.28s. The diagonaldisplacement fringes indicate that the wall tilting is taking place. The overall displaced shape issimilar to that observed in the full-scale wall test.
Rear Elevation
Plan
-20
2
24
46
68
90
112
134
156
178
200
Displacement (mm)
Figure 10: 9.12m reinforced wall (RB10): fringes of out-of-plane displacement (time = 0.28s)
Figure 11 shows a section through the wall at the point of impact. Once again, it is clear that thewall tilts as it translates and that there is no bed joint splitting or the formation of horizontal shear

14
planes within the cross section. In the full-scale wall test hairline horizontal cracks were observed(on top of courses 2, 4 and 5), but no significant horizontal bed-joint sliding was in evidence.
-20
2
24
46
68
90
112
134
156
178
200
Displacement (mm)
Figure 11: 9.12m reinforced wall (RB10): section through wall at mid length showing fringes ofout-of-plane displacement (time = 0.28s)
3.2.4. Reinforced wall with end supports (RB9 - 9.6m)The vertical supports used in the full-scale test were constructed from steel box sections thatwere bolted to a strong floor. In the model these supports were represented by a rigid verticalsurface along which the wall could slide with friction.
The model and experimental wall displacements, measured 0.5m left of the point of impact at thetop of the wall, are shown in Figure 12. Immediately after impact the wall starts to displace withtime and up until 0.046s the model response closely follows the full-scale wall response. After0.046s the full-scale wall starts to displace at a much slower rate before eventually reaching amaximum displacement of 72mm at approximately 0.21s. In contrast, the maximum modeldisplacement of 74mm occurs at 0.11s.
0
10
20
30
40
50
60
70
80
0 0.05 0.1 0.15 0.2 0.25 0.3
Time (s)
Dis
plac
emen
t (m
m)
ModelFull-scale
Figure 12: 9.6m reinforced wall with vertical supports (RB9): displacement-time graph

15
The displacement-time history for RB9 can be compared to RB10. RB10 reached a maximumdisplacement of 184mm at 0.43s before starting to rock back towards its original position.Therefore, it is apparent that the inclusion of end supports reduces the period of oscillation. As aresult, the maximum wall displacement occurs much earlier after impact.
Comparing the response of walls RB9 and RB10 indicates that the inclusion of vertical supportscan have a significant influence on wall response. Therefore, the difference between the modelresponse and full-scale wall response may be partly explained by the method used to replicatethe supports. In the full-scale wall the supports may not have been completely rigid, as assumedin the model.
Figure 13 shows the out-of-plane model displacement at 0.28s. The near vertical displacementfringes indicate that wall tilt is minimal. The overall displaced shape is similar to that observed inthe full-scale wall test.
Rear Elevation
Plan
-20
2
24
46
68
90
112
134
156
178
200
Displacement (mm)
Figure 13: 9.60m reinforced wall with end supports (RB9): fringes of out-of-plane displacement(time = 0.28s)
Figure 14 shows a section through the wall at the point of impact. Once again, it is clear that thewall has just started to rock back beyond its vertical position and there are no horizontal shearplanes or vertical cracks forming within the cross section. In contrast, the full-scale wall showedthat small horizontal shear planes formed on top of courses 3, 4 and 5.

16
-20
2
24
46
68
90
112
134
156
178
200
Displacement (mm)
Figure 14: 9.60m reinforced wall with end supports (RB9): Section through wall at mid lengthshowing fringes of out-of-plane displacement (time = 0.28s).
3.2.5. ConclusionsA number of the walls tested at Teesside have been simulated numerically using a modifiedversion of LS-DYNA. So far ‘most likely’ material property data has been used when actualexperimental data has not been available.
The maximum model displacements for RB8, RB9 and RB10 have been shown to be in goodagreement with the full-scale walls. However, the accuracy of the displacement-time history couldbe improved. For example, model RB9 reached a maximum displacement at approximately 0.28swhilst the full-scale wall displacement was reached at approximately 0.2s.
Walls RB9 and RB10 showed that the period of oscillation in the model was much shorter thanthe full-scale wall. The reinforcement properties might be partly responsible for this discrepancy.This is because they are likely to influence the elastic response of the wall after impact.
Model B8 (19.54m unreinforced) provided incorrect results because of a frictional sliding problemidentified in the interface. The same problem did not affect the other models to the same extentbecause the bed joint did not displace significantly relative to an adjacent course. However, forfuture work this problem will hopefully be corrected for all models by modifying revised interfaceformulation.
Models B8 and RB8 (19.54m unreinforced and reinforced walls) showed that splitting occurredbetween longitudinal joints in the cross section of the wall. However, no splitting was observed tooccur in the shorter 9m walls (RB9 and RB10). These responses were similar to those observedin the full-scale wall tests.
4. LIVERPOOL PROGRESS
The last year has seen considerable progress on small scale testing and analysis aimed atsupporting the modelling work at Sheffield.
• All tests required to define the basic material properties of the bricks and mortar havebeen completed.
• A series of tests investigating the material parameters that influence the behaviour ofmasonry under both quasi-static and impact loading have been completed.
17
• A detailed analysis using LS-DYNA has been carried out of some of the small-scalelaboratory tests.
4.1. Material testsBritish Standard tests were used to determine basic material characteristics and additional testswere developed where no such standards exist. The following properties were measured:
• Brick density - measured following the procedure set out in BS 1881:1983• Brick Young's modulus (dynamic) - Measured in accordance with BS1881:1990• Brick Young's modulus (quasi - static)• Mortar density - measured following the procedure set out in BS 1881:1983• Mortar Young's modulus (dynamic) - Measured in accordance with BS 1881:1990• Mortar Young’s modulus (quasi - static) in accordance with BS 1881:1983.• Mortar compressive strength• Mortar hardening modulus - Obtained from static Young's Modulus tests.• Mortar Flexural strength - measured in accordance with BS 1881:1983• The combined stiffness of the brick mortar combination was measured using brick
couplets loaded in compression.
All tests completed throughout the work were conducted using a standard brick unit and astandard mortar specification. The bricks used were Nori Class B Engineering Bricks. The mortarmix used was a 1:1:6 mix initially prepared by volume in accordance with BS 5628 (1978) Table1. However, due to a potential variation from mix to mix when measuring by volume, the firstbatch was weighed giving ratios for cement:lime:sand. These mix proportions by weight werethen kept constant for all mortar mixes used in connection with the work.
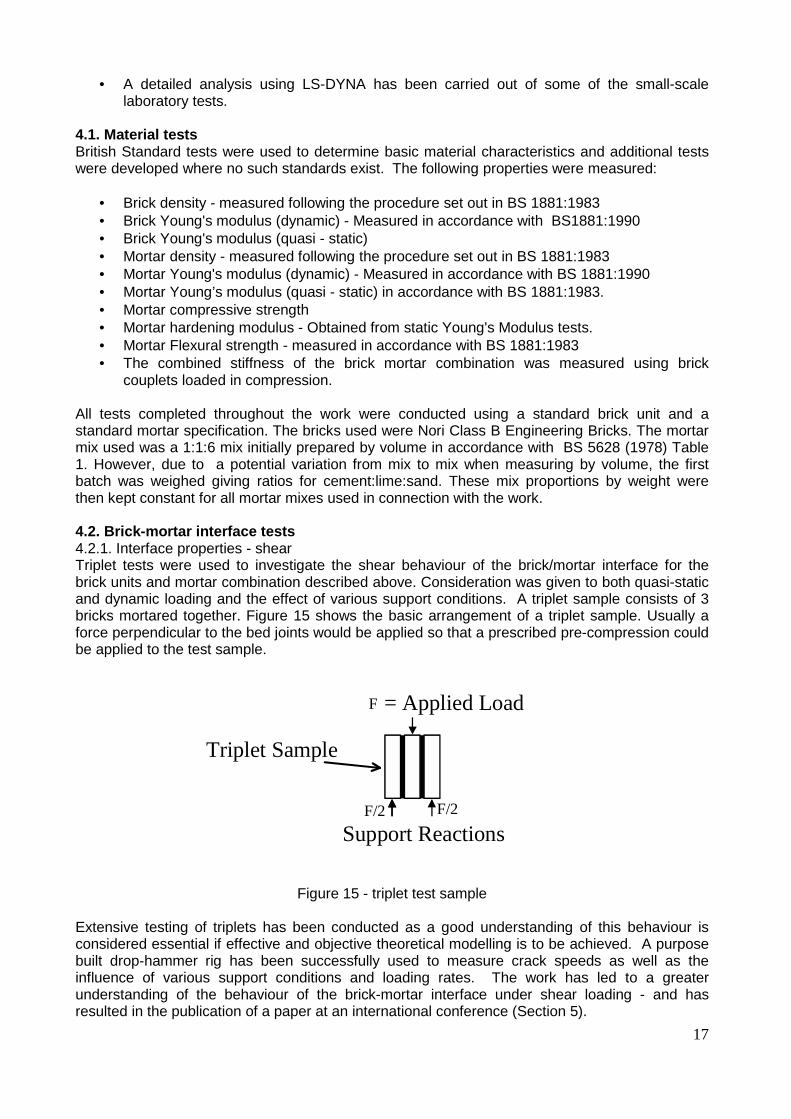
4.2. Brick-mortar interface tests4.2.1. Interface properties - shearTriplet tests were used to investigate the shear behaviour of the brick/mortar interface for thebrick units and mortar combination described above. Consideration was given to both quasi-staticand dynamic loading and the effect of various support conditions. A triplet sample consists of 3bricks mortared together. Figure 15 shows the basic arrangement of a triplet sample. Usually aforce perpendicular to the bed joints would be applied so that a prescribed pre-compression couldbe applied to the test sample.
Figure 15 - triplet test sample
Extensive testing of triplets has been conducted as a good understanding of this behaviour isconsidered essential if effective and objective theoretical modelling is to be achieved. A purposebuilt drop-hammer rig has been successfully used to measure crack speeds as well as theinfluence of various support conditions and loading rates. The work has led to a greaterunderstanding of the behaviour of the brick-mortar interface under shear loading - and hasresulted in the publication of a paper at an international conference (Section 5).
F/2 F/2
F
Triplet Sample
Support Reactions
= Applied Load

18
4.2.2. Couplet tests - tensionThese tests were used to investigate the tensile behaviour of the brick/mortar interface. Theprimary objectives were to obtain data on tensile strength and secondly to obtain the mode Ifracture energy characteristics of this particular brick/mortar combination. A couplet testcomprises two bricks mortared together with plates attached (using epoxy adhesive) as shown inFigure 16.
Figure 16: brick couplet test
Previous work has indicated problems in obtaining an even stress distribution and so half brickswere used to create the couplet test samples and 100mm steel cubes were attached in the placeof plates. This was expected to give a much more uniform stress distribution.
4.2.3. Couplet pullout testsThis test has been designed to gain insight into the characteristics of the bond that existsbetween reinforcement and masonry. The test specimen comprises a single reinforcing bar set inthe mortar joint between two bricks and the test involves pulling the bar axially until either the barfails in tension or slides out of the joint. The bars for the initial set of couplet tests were not straingauged. However, samples have now been prepared with strain gauges attached to the bars.Tests have been conducted both quasi-statically and dynamically with and without lateral preloadacross the two bricks.
The results show that with if the couplet is restrained passively during the test then lateral(splitting) forces are developed.
4.3. Beam testsTwo quasi-static masonry beam tests have been conducted and an impact test is to be performedshortly. The beam consists of a wall 1790 x 300 x 328 wide constructed in English garden wallbond with four reinforcement bars (6mm ribbed stainless steel) - two of these on the tensile faceand two on the compressive face. The tensile bars were strain gauged at intervals along their
F =F orce A pplied F rom D ennison
F
100X100X100mm Steel BlocksMasonry Couplet - 2No
100x100x65mm Bricks with 10mm Mortar Joint

19
length. The walls were simple supported and loaded quasi statically with a central point load inincrements of approximately 0.5kN.
During the tests it was expected that the reinforced bed joints would crack and separate as wasobserved with the Teesside tests. This did not happen significantly during the testing of Beam 1.However, Beam 2 showed that separation started to occur in the tensile face before failure, andon failure complete separation of some of the surfaces occurred (see Figure 17). This failure wasnoted on both the tensile and compressive faces of the beam. The couplet pullout tests indicatethat a force perpendicular to the bed joint is created during the debonding and finally pullout of thebar. Although it was shown that this was not significant enough to overcome the tensile strengthof the mortar/brick interface, it could possibly reduce the shear strength at the bed jointsincorporating reinforcement.
Another possible action that would create a force perpendicular to the bed joints is the buckling ofthe compression reinforcement. Although some cracking along these bed joints was noted beforefailure it increased significantly as the beam failed and rotated. During the large rotationsimmediately after failure the compression bars would attempt to buckle. This could assist in this“splitting action”.
The above possibilities may be combined to produce the failure observed for the walls tested todate. However, more investigation is needed in this area.
Figure 17: beam test 2 - separation of surfaces
4.4. LS -DYNA Analysis of Laboratory Tests4.4.1. IntroductionThe work presented here was carried out to assist the development of the finite elementmodelling strategy. A number of finite element models were created to investigate the laboratorytests. This allowed the parameters that contribute to the overall behaviour of masonry to be
20
considered in greater detail than would otherwise be possible. The ability of the existing LS-DYNAinterface formulation to replicate real masonry-mortar interface behaviour was also evaluated.
3 models were developed and analysed - triplet, couplet and beam models. The variablesinvestigated by the use of these models were:
• Shear Strength between the brick and mortar interface;• Tensile Strength between the brick and mortar interface;• Masonry/reinforcement interaction.
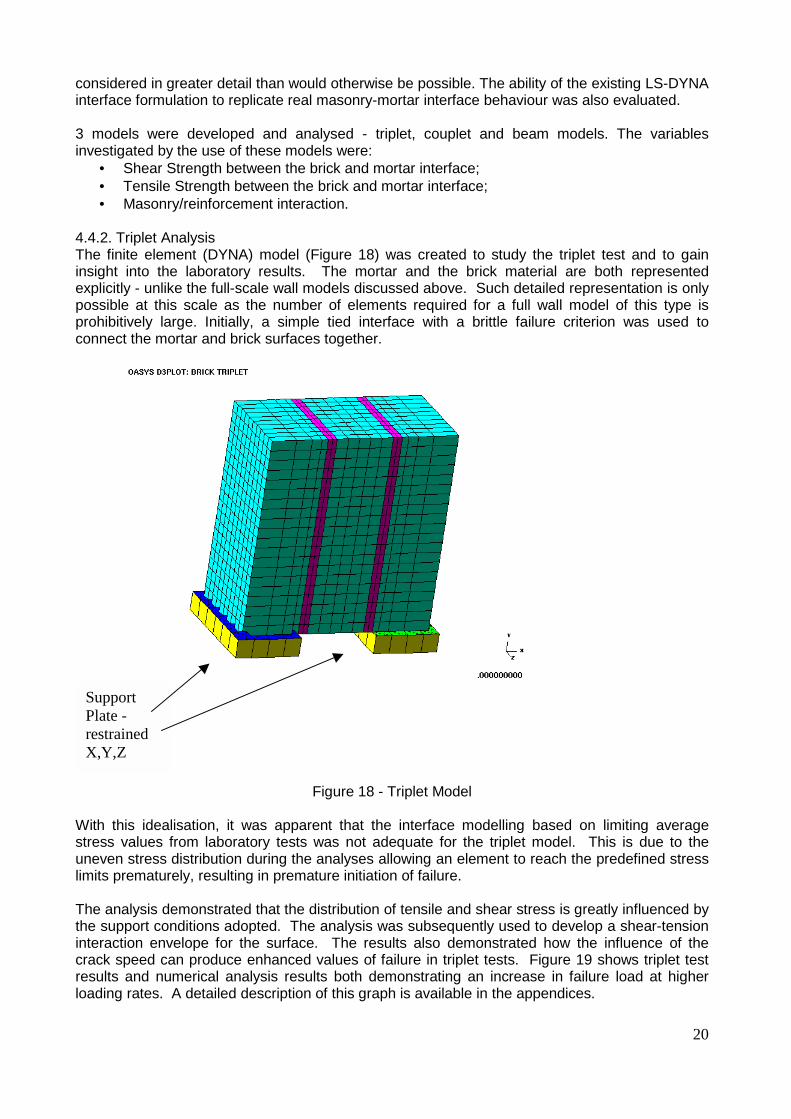
4.4.2. Triplet AnalysisThe finite element (DYNA) model (Figure 18) was created to study the triplet test and to gaininsight into the laboratory results. The mortar and the brick material are both representedexplicitly - unlike the full-scale wall models discussed above. Such detailed representation is onlypossible at this scale as the number of elements required for a full wall model of this type isprohibitively large. Initially, a simple tied interface with a brittle failure criterion was used toconnect the mortar and brick surfaces together.
Figure 18 - Triplet Model
With this idealisation, it was apparent that the interface modelling based on limiting averagestress values from laboratory tests was not adequate for the triplet model. This is due to theuneven stress distribution during the analyses allowing an element to reach the predefined stresslimits prematurely, resulting in premature initiation of failure.
The analysis demonstrated that the distribution of tensile and shear stress is greatly influenced bythe support conditions adopted. The analysis was subsequently used to develop a shear-tensioninteraction envelope for the surface. The results also demonstrated how the influence of thecrack speed can produce enhanced values of failure in triplet tests. Figure 19 shows triplet testresults and numerical analysis results both demonstrating an increase in failure load at higherloading rates. A detailed description of this graph is available in the appendices.
SupportPlate -restrainedX,Y,Z

21
0
0.5
1
1.5
2
2.5
3
3.5
4
0.01 0.1 1 10 100 1000 10000 100000
Stress Rate (N/mm2s)
Av
Shea
r Stre
ss (N
/mm
2 )Existing Quasi-Static DataMET - Test Seriescrack time 0.12ms - average stressCET - Test SeriesExisting Dynamic Datacrack time 0.12ms - low stresscrack time 0.12ms - high stressDYNA ResultsDYNA(applied load)
CET Exponential Curve
1E+5kN/
1E+4kN/s1E+3kN/s
ExponentialCurve F=1.0E(6983t)
Figure 19: triplet test results
4.4.3. Couplet AnalysisThis model (Figure 20) was created to investigate the actual tensile stress distributions that wouldoccur in the physical tests described above. The model was created using the same philosophyas for the triplet model described previously.
Figure 20: couplet model

22
An analysis was conducted using material parameters developed from the triplet model and byapplying the load at a rate of 1E+03kN/s. The calculated failure load was 3.72kN, whichcompares very well with an average failure load of 3.74kN obtained from tests. It can also beseen from Figure 21 that the tensile stress distribution is not uniform - with peak stresses initiatingfailure at the corners and around the perimeter with stresses reducing towards the centre.
Figure 21: couplet analysis - tensile stress distribution4.4.4. Beam modelFigure 22 shows the mesh used for this analysis. Each brick consisted of 3 elements. Interfaceswere employed at all locations where a mortar bed or perpend joint would occur. The supportsand loading platen were identical to those used for the current test work. However they wereassigned rigid material properties as it was thought unlikely that the elasticity of these elementswould have a significant influence on the results.
Figure 21: Beam model

23
The analysis of the unreinforced beam model is currently being processed and the model is beingmodified to incorporate reinforcement. In addition an unreinforced beam is due for testing in thelaboratory.
5. FUTURE WORK
5.1. Wall Tests5.1.1. Reinforcement SystemsTable 4 summarises a number of reinforcement schemes currently under consideration for futuretest work. A pair of 20m unreinforced walls are currently being built and it is planned to drill thesewalls with raking holes on the vertical centre line of the wall and place stainless bars in one walland GRP rods in the other. A drilling and resin grouting system currently used in industry forretro-fitting reinforcement will be used.
5.1.2. Future TestsIt is recommended that a further six 20m long walls be tested using some of the schemes given inTable 4.
Table 4: proposed reinforcement systems
Retro-fit reinforcementScheme
Location ofreinforcement
Preparation ReinforcementType
Horizontal beam reinforcement(pocket reinforcement)
1 1. At top of wall.
2. On impact sideof wall 500mmup from bottom ofwall.
3. At both abovelocations 1 and 2.
Cut out horizontalpocket to takereinforced concretebeam
1. Stainless steel
2. GRP bar
3. Carbon Fibre
4. Kevlar
Vertical reinforcement (pocketreinforcement)
At intervals onimpact face of wall
Cut out verticalpocket to takereinforced concretebeam
As above
Additional R.C. or brickwork wallbonded to existing wall
Full length ofimpact face
Tie new wall toexisting
As above
Vertical or raking reinforcement indrilled holes
At verticalcentreline of wall
Drill holes As above
Horizontal reinforcement in drilledholes
On verticalcentreline of wall500mm abovebase
Drill holes As above
Sheet reinforcement On impact face tofull height of wall
Prepare brick wallsurface, bond ormechanically anchorsheet
Stainless steel, GRP,Kevlar Sheet
External reinforcement On impact side ofwall 500mm abovebase
Mechanically anchorreinforcement to wallusing drilled holesand anchors
Stainless steel orGRP box section

24
5.2. Material TestingAn extensive programme of small sample testing using the new Hopkinson bar test facility isplanned for the next year at Sheffield.
At Liverpool, the triplet and couplet test programme will be completed in the next 6 months. Inaddition the beam testing will be completed. The beam tests will provide a greater understandingof the debonding behaviour of the bedding plane reinforcement under both dynamic and quasi-static loading. It is hoped that the results will enable verification of the new brick–brick and brick-reinforcement interface algorithms.
5.3. Numerical Work5.3.1 Small-scale testsThe finite element analysis of the Liverpool tests will continue in order to provide insight into thejoint behaviour and to assist in the development of the interface formulation.
5.3.2 Wall testsThe interface algorithm and the meshing strategy adopted are both currently under development.The work so far has shown that despite obtaining good results in many aspects of the modellingthere are certain areas where improvement should be possible by modification of the interfacealgorithm and meshing strategy. It is anticipated, for example, that the apparent problem withfrictional sliding observed in the analysis of wall B8 will be eliminated by a modification to theinterface algorithm.
5.3.3 Mechanism analysisDuring the previous project a simplified mechanism based method of dynamic analysis was foundto provide reasonable predictions of the behaviour of unreinforced mortared walls. This modelwill be extended to include reinforced walls.
6. PUBLICATIONS
The following papers have been published during the last 6 months:
• "Masonry Shear Strength Under Impact Loading". Presented at 9th Canadian MasonrySymposium in June 2001.
• "Improving The Impact Resistance Of Masonry Parapets". Presented at Third EuropeanLS-DYNA Conference in Paris, June 2001.
• "Improving The Impact Resistance Of Masonry Parapet Walls". Presented at ThirdInternational Conference On Arch Bridges in Paris, September 2001
The following will be published at the 6th International Masonry Conference in 2002
• "Numerical modelling of reinforced masonry walls subject to out-of-plane car-like impacts"• "Impact Testing of Masonry Parapet walls"• "The Behaviour of Masonry under Impact Loading"
6. CONCLUSIONS
An ambitious research programme which includes impact tests on full-scale reinforced walls,materials characterisation at high loading rates and the development of detailed finite-elementmodelling strategies is underway.

25
Results from early full-scale wall tests indicate that the addition of very small amounts of bed jointreinforcement may not be beneficial. Providing higher levels of reinforcement may howeverimprove performance whilst provision of vertical reinforcement has been found to prevent the bedjoint sliding failure mode encountered in one of the early reinforced wall tests.