improving the affordability of inactivated poliovirus ... · improving the affordability of...
TRANSCRIPT
Improving the affordability of inactivated poliovirus vaccines (IPV) for use in low- and middle-income countries
An economic analysis of strategies to reduce the cost of routine IPV immunization April 20, 2010 Mail: PATH PO Box 900922 Seattle, WA 98109 Street: PATH 2201 Westlake Ave Suite 200 Seattle, WA 98121 www.path.org

Economic analysis of routine IPV immunization 20 April 2010 __________________________________________________________________________
Page ii
Authorship This report was commissioned by PATH’s Disposable-Syringe Jet Injector Project and the Vaccine Delivery Technologies portfolio. The report was authored by Julian Hickling, MBA, PhD, and Rebecca Jones, PhD, from Working in Tandem Ltd., and Neeti Nundy, CFA, MBA, from PATH. The authors hope this report will contribute to ongoing discussions of the role of IPV for LMIC use, and welcome comments from interested parties. Contact Information: Darin Zehrung Team Leader Vaccine Delivery Technologies [email protected] Mail: PATH PO Box 900922 Seattle, WA 98109 Street: PATH 2201 Westlake Ave Suite 200 Seattle, WA 98121 TEL: 206.285.3500 FAX: 206.285.6619 Date: April 20, 2010 Copyright © 2010, Program for Appropriate Technology in Health (PATH). All rights reserved. The material in this document may be freely used for educational or noncommercial purposes, provided that the material is accompanied by an acknowledgment line.

Economic analysis of routine IPV immunization 20 April 2010 _______________________________________________________________________________________
Page iii
Acknowledgements The authors would like to thank the members of the PATH Vaccine Delivery Technologies Team (Emily Griswold, Courtney Jarrahian, Gene Saxon, Dr. Shirley Villadiego, and Darin Zehrung) for their comments and guidance during the writing of this report and for reviewing the completed document. The authors also thank other PATH staff members (Hugh Chang, Dr. Dexiang Chen, Erica Jacoby, Debra Kristensen, Dr. Mercy Mvundura, and Noah Perin) for reviewing the document. We would also like to thank John Lloyd and Dr. Pritu Dhalaria for providing valuable input to the cost analysis model. Finally we would like to thank Dr. Hiromasa Okayasu (WHO) and Dr. Roland Sutter (WHO) for allowing us to use and refer to unpublished data and for their expert comments and reviewing of the report. Work on this article by PATH staff members and consultants was supported by funding from the Bill & Melinda Gates Foundation.

Economic analysis of routine IPV immunization 20 April 2010 _______________________________________________________________________________________
Page iv
Contents Authorship ................................................................................................................................ ii
Acknowledgements ................................................................................................................ iii
Contents ................................................................................................................................... iv
Abbreviations and acronyms .................................................................................................. v
Executive summary ................................................................................................................. vi
1. Aim of the report .............................................................................................................. 1
2. Introduction ...................................................................................................................... 2 2.1. GPEI goals and timeline .............................................................................................2 2.2. Current status of the eradication initiative ..................................................................2 2.3. Poliovirus vaccines .....................................................................................................2 2.4. Role of IPV in polio eradication and control ..............................................................3 2.5. Issues surrounding the future use of IPV in eradication and control ..........................4
3. IPV: Future demand, supply, and cost .......................................................................... 6 3.1. Potential post-eradication IPV strategies ....................................................................6 3.2. Future demand scenarios for IPV ...............................................................................6 3.3. Future supply of IPV ...................................................................................................7 3.4. Cost of production of IPV ...........................................................................................8
4. Approaches to increasing the affordability of IPV ..................................................... 10 4.1. Approach A: Reduce the volume of each dose: intradermal delivery ......................10 4.2. Approach B: Reduce the antigen content of each dose by use of adjuvants .............11 4.3. Approach C: Reduce the number of IPV doses ........................................................12 4.4. Approach D: Reduce vaccination costs by using IPV in combination vaccines ......13 4.5. Approach E: sIPV to reduce the cost of vaccine manufacture ..................................13 4.6. Summary of approaches to reduce cost and improve supply of IPV ........................15
5. Analysis of the incremental costs associated with various approaches for routine IPV immunization .................................................................................................................. 18
5.1. Introduction ...............................................................................................................18 5.2. Methods.....................................................................................................................18 5.3. Results .......................................................................................................................20 5.4. Discussion .................................................................................................................30
6. Reducing the cost of IPV for use in LMICs: Conclusions .......................................... 33
Appendix 1: Incremental cost model.................................................................................... 35 Assumptions .........................................................................................................................35 Base case model inputs ........................................................................................................35 Sensitivity analysis...............................................................................................................37
References ............................................................................................................................... 38

Economic analysis of routine IPV immunization 20 April 2010 _______________________________________________________________________________________
Page v
Abbreviations and acronyms AFP ........................................................................................... acute flaccid paralysis Al-based ................................................................... aluminium salt–based (adjuvant) aP ..................................................................................................... acellular pertussis bOPV ......................................................................... bivalent oral poliovirus vaccine cVDPV ............................................................ circulating vaccine-derived poliovirus DTP ................................................................................. diphtheria-tetanus-pertussis DSJI .............................................................................. disposable syringe jet injector EPI .................................................................... Expanded Program on Immunization GAVI ............................................... Global Alliance for Vaccines and Immunization GPEI ..................................................................... Global Polio Eradication Initiative GSK ................................................................................................. GlaxoSmithKline HepB ........................................................................................................... hepatitis B Hib .............................................................................. Haemophilus influenzae type b ID ......................................................................................................... intradermal(ly) IDD .............................................................................................. intradermal delivery IM ..................................................................................................... intramuscular(ly) IPV ................................................................................ inactivated poliovirus vaccine LMICs ................................................................... low- and middle-income countries lyo ............................................................................................................... lyophilized MN ............................................................................................................ microneedle mOPV .................................................................. monovalent oral poliovirus vaccine N&S ................................................................................................ needle and syringe NRA ................................................................................ national regulatory authority OPV ......................................................................................... oral poliovirus vaccine SAGE .................................................... Strategic Advisory Group of Experts (WHO) SC ........................................................................................................... subcutaneous sIPV .................................................................... Sabin inactivated poliovirus vaccine SSI ........................................................................ Statens Serum Institute (Denmark) tOPV .......................................................................... trivalent oral poliovirus vaccine UNICEF .................................................................... United Nations Children’s Fund VAPP ......................................................... vaccine-associated paralytic poliomyelitis VDPV ................................................................................ vaccine-derived poliovirus WHO ................................................................................ World Health Organization wP .................................................................................... whole-cell pertussis vaccine WPV ............................................................................................ wild-type poliovirus wtIPV ................................ wild-type (non-attenuated) inactivated poliovirus vaccine

Economic analysis of routine IPV immunization 20 April 2010 _______________________________________________________________________________________
Page vi
Executive summary If the current efforts to eradicate polioviruses are successful and the world is to remain free of polioviruses, then use of oral poliovirus vaccine (OPV) will need to be stopped following eradication of wild-type polioviruses. Continuing use of OPVs will lead to the reintroduction of vaccine-derived polioviruses into the population. Therefore, inactivated poliovirus vaccine (IPV) will be the only option for those countries wanting to continue to vaccinate against polio. The future global demand for IPV following eradication of polioviruses is uncertain; modeling suggests that it could increase from the current level of 80 million doses to 450 million doses per year. Existing and planned-for IPV manufacturing capacity should be sufficient to meet some of this demand but will not meet the most aggressive scenarios. Modeling also suggests a possible transient peak in demand for IPV in low- and middle-income countries (LMICs) for approximately five years following cessation of OPV. Consequently, approaches to “stretch” supplies of IPV are likely to be required. IPV is currently considered to be too expensive for use for routine immunization in LMICs, so strategies to make IPV more affordable are being evaluated, including:
• Intradermal delivery (IDD) of reduced volumes of vaccine per dose. • Use of adjuvants to allow a reduced IPV antigen content per dose. • Reducing the number of doses per IPV immunization schedule. • Use of IPV in combination vaccine formulations. • IPVs based on Sabin (attenuated) strains to reduce biosafety concerns and to
facilitate production in countries where vaccine manufacture is less expensive.
In this report, results are presented from an economic model that calculates the costs involved in delivering IPV vaccine in Indian immunization clinics according to the first three strategies listed above. The model analyzed the costs associated with four delivery devices: disposable needle and syringe, disposable-syringe jet injectors (DSJI), an ID adapter (which controls the depth and angle of the ID injection), or a syringe-mounted hollow microneedle (MN). Clinical trials have shown that IDD of reduced doses (delivering 20% of the volume of a standard dose) can be sufficiently immunogenic. The results of the economic analysis suggest that IDD of IPV using needle and syringe, DSJI, or ID adapter could result in cost savings of up to 71%–73% per immunized infant compared with delivery of the standard dose via the usual intramuscular (IM) route using needle and syringe. Combining IPV with adjuvant so that only 10% of the original antigen content was needed, whilst still using the IM route, had the potential to save 82%–83% of the immunization costs, depending upon the delivery device used. Alternatively, reducing the number of doses in the schedule to two doses per infant reduced costs by 31%–33% (if the IM route was used with either DSJI or needle and syringe, respectively), or by 79%–82% if the two dose schedule was administered intradermally using needle and syringe, DSJI, or an ID adapter. Because of the potential savings that could be achieved by IDD of IPV, this approach should be pursued further, along with the other cost-saving strategies. Should IDD delivery of IPV

Economic analysis of routine IPV immunization 20 April 2010 _______________________________________________________________________________________
Page vii
be implemented, issues surrounding the use of existing single-dose vials of IPV as multidose presentations for IDD will need to be addressed. Development of IDD devices should also continue, and these devices should be evaluated in the clinical trials that will be needed in order to optimize and demonstrate the efficacy of reduced-dose, ID immunization schedules of IPV.

Economic analysis of routine IPV immunization 20 April 2010 __________________________________________________________________________
Page 1
1. Aim of the report If the world is to remain free of circulating polioviruses following eradication, then use of oral poliovirus vaccines (OPV) will need to be stopped in order to prevent the reintroduction of circulating vaccine-derived polioviruses (cVDPV). Inactivated poliovirus vaccines (IPV) will then be the only option for those countries wanting to continue to vaccinate against polio. This report aims to:
• Provide a brief overview of the key issues associated with the use of IPV before and after eradication of polioviruses.
• Summarize the various strategies under consideration to make IPV more affordable for routine immunization, and review the issues associated with these approaches.
• Provide a more detailed analysis of the incremental costs associated with three of the strategies for reducing the cost of IPV:
• Intradermal (ID) delivery of reduced doses of IPV using different vaccine-delivery devices, compared with existing use of needle and syringes.
• Intramuscular (IM) delivery of IPV combined with an adjuvant. • Reducing the number of doses of IPV per immunization schedule.
Analysis of the potential cost savings that might result from the use of IPV in combination vaccines or use of IPVs based on Sabin strains of poliovirus were beyond the scope of the cost-analysis model used and therefore beyond the scope of this report.

Economic analysis of routine IPV immunization 20 April 2010 _______________________________________________________________________________________
Page 2
2. Introduction 2.1. GPEI goals and timeline In 1988, the World Health Assembly announced a goal to eradicate polio, thereby creating the Global Polio Eradication Initiative (GPEI). The GPEI has several distinct objectives both leading up to, and after, eradication of polioviruses (Figure 1):
• Interrupt transmission of wild polioviruses (WPVs); the current goal is to achieve this by 2013.1
• Achieve containment and certification of WPVs. • Eliminate vaccine-derived polioviruses (VDPVs), and vaccine-associated
paralytic poliomyelitis (VAPP). • Stop the use of OPV.
Figure 1: Post-eradication activities and timeline.
Source: Aylward B. Presentation at the 8th WHO/UNICEF Consultation with OPV/IPV Manufacturers and National Regulatory Authorities, 30 October 2009. 2.2. Current status of the eradication initiative By the end of 2009, only four countries had never interrupted the endemic transmission of wild poliovirus: Nigeria, India, Pakistan, and Afghanistan. WPVs (types 1 and 3) remain endemic in focal areas within those four countries. In 2009, 1,548 cases of polio were reported: 1,210 cases in the four endemic countries and 338 cases in nonendemic countries, where the virus has been reintroduced from one of the four endemic countries.2 2.3. Poliovirus vaccines 2.3.1. Oral poliovirus vaccines
Oral poliovirus vaccines (OPVs) contain live-attenuated strains of poliovirus, which together are referred to as the Sabin strains. Trivalent OPV (tOPV) consists of type 1, 2, and 3 strains

Economic analysis of routine IPV immunization 20 April 2010 _______________________________________________________________________________________
Page 3
of poliovirus; more recently, monovalent OPV (mOPV) and bivalent OPV (bOPV) have been produced. OPVs have been the vaccines of choice in the eradication effort because they are inexpensive, induce intestinal mucosal immunity, and are delivered orally and thus do not require highly trained personnel for administration. OPVs have some drawbacks, including the very rare association with VAPP (approximately one in 2.5 million immunizations). OPV replicates and can mutate within a vaccinee; the shed virus can persist and circulate in susceptible populations and is then called circulating vaccine-derived poliovirus (cVDPV).3 To totally eradicate circulation of polioviruses following interruption of WPV transmission, the use of OPVs will therefore need to stop. 2.3.2. Inactivated poliovirus vaccines
Inactivated poliovirus vaccines (IPVs) that are currently licensed and in use are based on non-attenuated (Salk) vaccine virus strains; they are therefore also referred to as wild-type IPV (wtIPV). This term distinguishes them from IPVs based on the Sabin strains (sIPV), which are also being developed (see section 4.5). IPV is delivered by intramuscular (IM) or deep subcutaneous (SC) injection and therefore requires a needle and syringe and trained personnel for administration. IPV induces protective, neutralizing antibodies that circulate in serum, but induces lower levels of secretory antibody in the intestinal tract compared with OPV.3 IPV is expensive relative to OPV; the UNICEF tender price is $3 per dose compared with 15–20 cents for tOPV.4 IPV is currently available either as a non-adjuvanted stand-alone formulation, or in various combinations, including DT-IPV (with diphtheria and tetanus toxoids) and hexavalent DTP-HepB-Hib-IPV vaccines (additionally with pertussis, hepatitis B, and Haemophilus influenzae b). 2.4. Role of IPV in polio eradication and control Two distinct roles or applications have been identified for IPV in GPEI’s eradication and post-eradication activities: acceleration of eradication efforts and post-eradiation control.5 2.4.1. Acceleration of eradication efforts
IPV could play a role in boosting immunity in infants in areas of high WPV circulation such as in Uttar Pradesh and Bihar in India, where a single dose, or even multiple doses of OPV do not appear to induce a high rate of seroconversion, particularly against WPV type 1, for reasons that are not well understood.6, 7 A recent clinical trial conducted in Moradabad, India, demonstrated that a single dose of IPV was able to increase seropositivity rates against WPV types 2 and 3 from ~75% and ~55%, respectively, to >99% in infants 6–9 months old who had previously been immunized with tOPV.4 2.4.2. Post-eradication control
The current GPEI strategy is to stop using OPV as soon as the following prerequisites have been met:8
• Interruption and containment of WPVs. • Establishment of global surveillance and notification networks. • Establishment of mOPV stockpiles and response mechanisms. • Availability of affordable IPV and implementation of IPV requirements in
biohazard settings.

Economic analysis of routine IPV immunization 20 April 2010 _______________________________________________________________________________________
Page 4
• Containment of Sabin (attenuated vaccine strain) polioviruses. Following cessation of OPV use, the risk of polio outbreaks due to cVDPVs will remain. At that time however, IPV will be the only option for countries wishing to maintain polio immunity through vaccination.9 2.5. Issues surrounding the future use of IPV in eradication and control In order for IPV to be used extensively as part of eradication efforts, or as a replacement for OPV in routine immunization, strategies to increase the supply of IPV and to make IPV affordable for low- and middle-income countries (LMICs) will be required.1, 5 Several strategies to achieve affordable IPV are being investigated, including:
• Intradermal delivery of a reduced volume of IPV per dose. • Use of adjuvants to allow a reduced IPV antigen content per dose. • Modified immunization regimens to reduce the number of doses of IPV
administered. • Use of IPV in combination vaccines. • Development of IPVs based on attenuated Sabin strains to reduce biosafety
concerns and to facilitate vaccine production in countries where manufacturing costs are lower.
These approaches are discussed in more detail in sections 3, 4, and 5 of this report. Further complexity derives from IPV being used as a stand-alone formulation or combined with other vaccines. Some of the factors affecting the future demand, supply, and cost of IPV are summarized in Figure 2.

Economic analysis of routine IPV immunization 20 April 2010 _____________________________________________________________________________________________________________________
Page 5
Figure 2. Factors influencing future demand for, supply, and cost of IPV.

Economic analysis of routine IPV immunization 20 April 2010 ________________________________________________________________________________________
Page 6
3. IPV: Future demand, supply, and cost 3.1. Potential post-eradication IPV strategies Following cessation of OPV use, IPV will be the only option for countries wanting to immunize against polio. The World Health Organization’s (WHO) Strategic Advisory Group of Experts (SAGE) on immunization is currently evaluating potential strategies for IPV use that might be adopted by countries following WPV eradication and OPV cessation. Possible strategies include reducing the number of doses of IPV administered per infant. Options for policies for post-eradication IPV use for LMICs are expected to be published in April 2011.8 3.2. Future demand scenarios for IPV 3.2.1. Preliminary IPV-demand modeling by GPEI*
The GPEI has started to model potential IPV-demand scenarios, starting with a “high demand” situation, in which all countries adopt IPV universally and administer 2–3 doses per immunization course. The key findings from the analysis performed to date are:
• Future demand for IPV is very sensitive to the success of the eradication initiative. Annual global demand is estimated to be up to 425 million doses if eradication is successful or as “little” as 150 million doses if it is not.
• The expectation is that LMICs and GAVI-eligible countries will start to use IPV upon, but not before, cessation of OPV use. IPV use by these countries might only last as long as there is a risk from cVDPVs. The consequence of this is that there will be a transient period of IPV demand from these countries in the model:
• As few as zero doses of IPV will be required by these countries in the years prior to OPV cessation.
• For these countries, more than 100 million doses per year will be needed for approximately five years after eradication, resulting in a global demand for IPV (including in combinations for high-income countries) of up to 425 million doses annually.
• As few as zero doses will be required after this finite period of use, which could be as short as five years in duration.
• This short, transient, rapid demand for significant amounts of IPV antigen and vaccine is likely to be commercially unattractive to manufacturers because it does not provide an incentive to scale up production facilities to meet longer-term demand. For this reason,
* All the information in this section is taken from Dr. Hiromasa Okayasu’s presentation at the 8th WHO/UNICEF Consultation with OPV/IPV Manufacturers and National Regulatory Authorities, 30 October 2009, unless indicated otherwise.

Economic analysis of routine IPV immunization 20 April 2010 ________________________________________________________________________________________
Page 7
measures to “stretch” supplies (such as dose sparing or use of adjuvants) in order to meet the rapid increase in demand at the time of OPV cessation are thought to be necessary.
3.2.2. IPV demand modeling by Oliver Wyman Inc.*
Assessment of future supply and demand for IPV has recently been undertaken by Oliver Wyman Inc. Demand scenarios were created by interviews with experts, combined with WHO demographic predictions. Supply of IPV was predicted by discussions with existing manufacturers to determine existing manufacturing IPV capacity and plans for future IPV capacity. Among the key findings from this analysis are:
• Post-eradication IPV demand is still uncertain, with clear policy guidance on a number of issues from agencies such as WHO being highlighted as a key requirement to resolve some uncertainty.
• Annual post-eradication demand for IPV could rise from the existing level of 80 million doses to 190–450 million doses post-eradication. These demand figures are similar to those from the GPEI modeling described above and indicate the high level of uncertainty in the projections.
3.3. Future supply of IPV 3.3.1. Manufacturing capacity for stand-alone IPV*
Two manufacturers, GSK and Sanofi Pasteur, produce the majority of IPV used globally. Smaller amounts of IPV are produced by the Netherlands Vaccine Institute, Statens Serum Institute (SSI, Denmark), and SBL Vaccines (Sweden, now part of Crucell). In addition, Biological E. Limited (India), Panacea Biotec (India), and Novartis (India) purchase bulk IPV for local “fill and finishing.” It is estimated that existing IPV production capacity is 120 million doses annually. Several manufacturers are planning to invest in expansions to their IPV manufacturing capacity, which could increase overall global capacity to 260 million doses, but this would be dependent on 2–3 years’ notice being given by vaccine purchasers to allow a timely ramp-up of production. Additional, as yet not-planned-for expansion of manufacturing facilities would also be possible from at least one existing manufacturer; this could bring global IPV capacity up to 460 million doses per year. Up to five years’ lead time would be required for this greater expansion, and the majority of the capacity would also reside with a single IPV manufacturer.
* Information in this section is taken from Oliver Wyman Inc., Global Post-eradication IPV Supply and Demand Assessment: Integrated Findings. March 2009.

Economic analysis of routine IPV immunization 20 April 2010 ________________________________________________________________________________________
Page 8
Thus, current IPV manufacturers have the flexibility to expand manufacturing capacity to meet even the most aggressive demand scenarios and will clearly play a significant role in post-eradication IPV supply; however, lead times of 3–5 years will be needed, once the decision to expand has been taken, before full manufacturing capacity can be achieved. 3.3.2. Manufacturing capacity for IPV in combination vaccines
Two IPV-containing combination vaccines are currently marketed to high-income countries: INFANRIX® hexa (DTaP-HepB-Hib[lyo], GSK) and Pentaxim™/Pentacel™ (DTaP-IPV-Hib[lyo], Sanofi Pasteur). Marketing of these vaccines is expected to remain focused on high- and middle-income countries.10 Four manufacturers are believed to be interested in developing hexavalent (DTP-HepB-Hib-IPV) formulations for use in LMICs. Both acellular pertussis (aP) and whole-cell pertussis (wP) are being considered. By 2014, it is estimated that the total planned global manufacturing capacity for hexavalent vaccines could be as high as 280 million doses annually. Achieving this level of hexavalent production would depend on those manufacturers that do not have internal IPV manufacturing capacity being able to secure cost-effective access to IPV, either as wtIPV or sIPV.10
3.4. Cost of production of IPV 3.4.1. Stand-alone IPVs
Currently, most IPV is sold to high-income countries and mostly in combination vaccines. UNICEF currently procures small amounts of IPV for use in Palestine. The UNICEF tender price for stand-alone IPV in 2006 was $311 and this price is still used by WHO.12 The higher manufacturing cost of IPV is largely driven by the need for a large viral harvest compared with that required for OPV, and this is followed by additional purification processes.13 The production cost is scale sensitive to some degree: if IPV manufacturing capacity increases as described above, then costs could decrease by 30%–50%.11 However, IPV manufacturing costs are still estimated to remain 5–15 times the current price of OPV. Furthermore, future supplies are likely to be dominated by one or two manufacturers, with consequent effects on price-setting.11
3.4.2. IPV in combination formulations
Several measures are being explored with the aim of reducing the manufacturing cost of hexavalent vaccines by 25%–60%, to $1–$4 per dose:10
• An increase in the scale of production by individual manufacturers of the more expensive components of hexavalent vaccines is expected to reduce costs for IPV, Hib, and aP (such that aP might approach the cost of wP).
• New processes for conjugation of Hib and production of aP are expected to increase yields of these components.
• Addition of vaccine adjuvants might allow a reduction in antigen content for Hib and IPV within the hexavalent vaccine.

Economic analysis of routine IPV immunization 20 April 2010 ________________________________________________________________________________________
Page 9
• Changing from Salk to Sabin IPV might allow safer production in countries with lower production costs.
Summary
• The timing of future demand for IPV is extremely dependent on the timing of WPV eradication and OPV cessation.
• LMICs and GAVI-eligible countries are predicted to use IPV for a relatively short period only, possibly for only five years following OPV cessation; this would result in a significant but transient peak in demand.
• Manufacturers currently producing IPV have existing or planned manufacturing capacity to meet the majority of the projected demand. Given sufficient notice (several years), these manufacturers could expand their manufacturing capacity to meet even the most aggressive demand scenarios.
• The cost of production of IPV antigen is sensitive to scale, so can be expected to decrease as IPV production increases. The cost of IPV is expected to remain more than five times higher than OPV. The cost of production of combination vaccines containing IPV is also expected to decrease.

Economic analysis of routine IPV immunization 20 April 2010 ________________________________________________________________________________________
Page 10
4. Approaches to increasing the affordability of IPV A number of interrelated technical factors influence the cost and supply of IPV, as shown in Figure 2. These factors could be manipulated or optimized to make IPV more affordable. 4.1. Approach A: Reduce the volume of each dose: intradermal delivery 4.1.1. Rationale and supporting data
An aim of this strategy is to reduce the amount of vaccine antigen required to induce a protective immune response by intradermal (ID) delivery of fractional or reduced doses, i.e., administering a smaller volume of the existing formulation. If this could be achieved for IPV, it would have the potential to “stretch” the manufacturing capacity of existing IPV facilities and also to reduce the manufacturing cost per dose. Some logistics costs might also be reduced as it is possible that a lower-volume dose would require less space in the cold chain during distribution and storage. Intradermal delivery (IDD) of fractional doses has been investigated for a number of vaccines, most notably rabies, influenza, and hepatitis B.* Three studies of IDD of fractional doses of IPV have been published:
• IDD of reduced doses (20% of the standard volume and therefore 20% of the standard antigen content) induced “striking” antibody responses in adults and children who had previously been immunized.14 No IM comparator arm was included in this trial.
• A schedule of two ID doses (20% of the standard dose) in nonimmune subjects resulted in a seroconversion index of 82% which was described as being “comparable to an index of 91% seen in a previous study following two IM doses.”15
• Nirmal et al.16 reported that two or three 0.1 ml doses ID were equivalent in terms of seroconversion to two 0.5 ml doses of IPV delivered IM in a previous study. The overall seroconversion rates to all three poliovirus types were 85.5% and 89.0% following two or three ID doses, respectively. Seroconversion was seen in all infants (following either two or three ID doses) who did not have maternal antibodies present in prevaccination sera.16
More recently, two GPEI-sponsored trials used the Biojector 2000®
disposable syringe jet injector (DSJI) device to deliver a 20% dose ID compared with full-dose IM.5 Two different immunization schedules were tested, one in each of the two countries (Oman and Cuba) selected to run the study, and vaccines from two different suppliers were used.
* Reviewed in Intradermal Delivery of Vaccines. A review of the literature and the potential for development for use in low- and middle-income countries. PATH, August 2009. http://www.path.org/files/TS_opt_idd_review.pdf.

Economic analysis of routine IPV immunization 20 April 2010 ________________________________________________________________________________________
Page 11
Significantly inferior seroconversion rates to each of the poliovirus types were seen when ID immunizations were given at 6, 10, and 14 weeks of age: 53%, 85%, and 69% seroconversion to WPV types 1, 2, and 3, respectively. When the vaccine was given at 2, 4, and 6 months, however, the 20% dose ID resulted in >95% seroconversion to all three poliovirus types, which was not significantly different to the level of seroconversion induced by IM administration of the full dose. It should be noted, however, that the median antibody titers were significantly lower following IDD, and at this stage, there is no information on the longevity of the immune response induced by IDD. The differences in seroconversion rates between the two studies are believed to be due to the impact of maternal antibodies on the 6-, 10-, and 14-week immunization schedule.5
4.1.2. Current status and future prospects
A further GPEI-sponsored clinical trial is currently in progress in Cuba to evaluate a two-dose (4 and 8 months) fractional dose (ID) schedule. Results are expected in June 2010. Further dose sparing could in theory be achieved by combining IPV with adjuvants that are compatible with IDD (section 4.2). Although it might be possible to develop adjuvants suitable for IDD, none are approved for clinical use at present. Successful development and testing of such adjuvants is likely to require several years’ development, so adjuvanted IPV specifically for ID use might not be available for implementation in the period immediately following cessation of OPV use. Using a reduced volume per dose of IPV could result in a standard single dose (0.5 ml) vial being used as a five-dose vial (0.1 ml per dose). The implications of whether the presentation of vaccine in the vial would need to be changed and/or whether preservative would have to be added (to maintain sterility of open vials) need to be considered. Furthermore, using what was a single-dose vial without preservative as a five-dose vial could also lead to an increase in vaccine wastage as unused vaccine in open vials would have to be discarded at the end of an immunization session.17 4.2. Approach B: Reduce the antigen content of each dose by use of
adjuvants 4.2.1. Rationale and supporting data
Existing presentations of stand-alone IPV do not contain adjuvant. Combination vaccines containing IPV are formulated with aluminium salt–based (Al-based) adjuvants (including alum), and it has been suggested that the adjuvant enhances the immune response to the IPV component, which in turn might allow the IPV antigen content to be reduced. Because they are already used in combination vaccines containing IPV, Al-based adjuvants have the lowest development hurdles as adjuvants for IPV:
• Al-based adjuvants are inexpensive to manufacture and there are no significant intellectual property issues surrounding their use (although different manufacturers use different adjuvants for different combination vaccines).

Economic analysis of routine IPV immunization 20 April 2010 ________________________________________________________________________________________
Page 12
• It has been estimated that incorporation of Al-based adjuvants might enable a three- to four-fold lower IPV content to be used.5
• DTaP-IPV formulations containing 12.5%–25% of the standard IPV dose and formulated with Al-based adjuvant had similar in vivo potency to the current stand-alone IPV.18
Oil-in-water emulsion adjuvants, such as MF59 (Novartis) or AS03 (GSK), have the potential to permit even greater levels of dose-sparing:
• Data from a Polio Research Committee–funded preclinical study suggest that use of MF59-like (i.e., oil-in-water) adjuvants might allow use of 10% of the standard amount of IPV antigen.5
• There are no significant intellectual property issues surrounding the use of this class of adjuvant, although manufacturers have their own proprietary formulations.19
MF59-like adjuvants should be simple and inexpensive ($0.01–$0.02 per dose) to produce.19 In addition, there is an extensive clinical database for MF59, including subjects from all age groups (reviewed by Schultze et al. 2008).20 The number of infants and toddlers who have received vaccines containing MF59 was, until recently, relatively small, probably less than 1,000 in total. However, MF59 is present in H1N1- and H5N1-pandemic influenza vaccines produced by Novartis (Focetria®), and with the testing and use of these vaccines, the safety database in children and infants will increase.21 4.2.2. Current status and future prospects
Further development work on IPV formulated with an MF59–like adjuvant leading to GMP production and clinical trials is being funded by the Wellcome Trust.5 In order to expedite development and implementation, it has been suggested that adjuvant and vaccine should be mixed at point of use, to avoid the need for lengthy stability testing of the new vaccine-adjuvant combination. If this format is adopted, the same issues regarding use of IPV in multidose vials (section 4.1.2) will need to be considered. It has been suggested by one major vaccine manufacturer that development of novel formulations of stand-alone IPVs, such as adjuvanted formulations, will require 7–8 years before they are commercially available, which might not be soon enough to have an impact on the transient IPV demand from 2017 to 2021.18
4.3. Approach C: Reduce the number of IPV doses 4.3.1. Rationale and supporting data
Use of two-dose IPV regimens (e.g., at 14 weeks and 9 months) rather than the current three-dose regimens would extend IPV supplies. A two-dose regimen (8 and 16 weeks) has been shown to induce only moderately lower overall rates of seroconversion than a three-dose regimen (6, 10, and 14 weeks). Both regimens gave seroconversion rates >90% for types 1 and 3 WPVs and >80% for type 2 WPV.22

Economic analysis of routine IPV immunization 20 April 2010 ________________________________________________________________________________________
Page 13
4.3.2. Current status and future prospects
A clinical study is in progress in Cuba to evaluate two fractional (20% of standard) doses of IPV, given at 4 and 8 months of age. Results are expected in June 2010.5 The SAGE IPV working group is modeling the impact of three-, two-, and one-dose or “no IPV” immunization regimens on immunity to polioviruses at the individual and population levels.8 4.4. Approach D: Reduce vaccination costs by using IPV in combination
vaccines 4.4.1. Rationale and supporting data
It is possible that, for some countries, purchasing IPV as part of a hexavalent vaccine rather than stand-alone IPV plus a pentavalent vaccine would reduce the overall cost of administering IPVs. Hexavalent combinations should result in savings due to administration of fewer injections, reduction in cost of syringes and their disposal, reduction in cold chain costs, and reductions in vaccine waste.11 The antigen content of IPV might also be reduced (and costs saved) due to the presence of the adjuvant in the combination vaccine. The degree to which this approach is cost saving overall will be extremely sensitive to the relative prices of a hexavalent combination compared with stand-alone IPV plus a pentavalent combination.11 4.4.2. Current status and future prospects The manufacturing capacity and cost issues for IPV-containing combinations are discussed in sections 3.3.2 and 3.4.2. Whether or not real cost savings can be obtained at the system level by the use of combination vaccines will depend on several factors, such as the immunization regimens currently used and to be used in the future. Detailed cost modeling will be required to determine the potential benefits and savings from using IPV combination vaccines. 4.5. Approach E: sIPV to reduce the cost of vaccine manufacture 4.5.1. Rationale and supporting data
IPV containing the attenuated Sabin vaccine strains of poliovirus (sIPV) would reduce the potential severity of the consequences of intentional or unintentional release of virus from an IPV manufacturing facility. Thus sIPV is seen as more appropriate for manufacture in countries such as China, India, and Indonesia, where OPV is already manufactured. Manufacturing costs are likely to be lower in these countries compared with Europe and the United States, thus potentially resulting in a less expensive vaccine. Although it is based on different strains than those in the current IPV, sIPV should be suitable for use in the other cost-reducing strategies being considered: IDD of reduced volumes, dose reduction with adjuvants, and incorporation into combination vaccines.

Economic analysis of routine IPV immunization 20 April 2010 ________________________________________________________________________________________
Page 14
4.5.2. Current status and future prospects
The larger existing IPV manufacturers have indicated that they are not interested in using their capacity to produce products such as sIPV.11, 18 Nevertheless, sIPVs, either for use as stand-alone vaccines or in combination vaccines, are in development by several other manufacturers:
• Seed strains of sIPV have been produced by the Netherlands Vaccine Institute. Stability testing was due to commence at the end of 200923 and toxicity testing of vaccine strains is under way.4
• The Japan Poliomyelitis Research Institute has developed sIPV strains and technology and transferred these to Takeda Ltd (Japan). Takeda is developing DTaP-sIPV and other sIPV-containing combinations; pilot-scale production of sIPV is ongoing.24
• The Institute of Medical Biology, Chinese Academy of Medical Sciences, has produced pilot lots of sIPV. A phase I safety study has been completed and a phase II trial was planned for the second half of 2009;25 the current status of this is unknown.
• sIPV is also being developed for licensure by Panacea Biotec Ltd of India.
There are risks and hurdles that need to be overcome in the development of sIPVs:
• Data from the rat potency assay for IPV suggest that the type 2 poliovirus strain and to a lesser degree the type 3 poliovirus strain in sIPV are less immunogenic than in wtIPV; in contrast, the type 1 sIPV strain appears to be more immunogenic than in wtIPV.23, 26, 27, 28 Thus, either increased antigen content or an adjuvant might be needed in order to compensate for this lower immunogenicity of the type 2 and possibly type 3 strains, eroding some of the possible cost savings.
• Whether, or by how much, sIPV production costs will be less than those for wtIPV remains to be determined. The manufacturing process will be largely the same as for wtIPV13 and as such will be sensitive to scale. But if the antigen content needs to be increased due to poor immunogenicity, then any potential cost savings might be lost.
• One manufacturer has suggested that sIPV will require 7–8 years before it is available to use,18 raising the possibility that large-scale production of sIPV might not be in place in time to meet post-OPV cessation demand, especially if new manufacturing facilities need to be built. However, this might be too conservative an estimate for the time needed to develop and implement sIPV, and given the current state of progress it is possible that the development timeline could be closer to five to six years.29

Economic analysis of routine IPV immunization 20 April 2010 ________________________________________________________________________________________
Page 15
4.6. Summary of approaches to reduce cost and improve supply of IPV 4.6.1. Timelines for approaches to reducing cost of IPV
Estimates of the relative timelines associated with each of the cost-reducing or supply-improving approaches described above are shown in Figure 3. Figure 3. Timelines for approaches to reduce cost of IPV.
The timelines shown in Figure 3 are estimates based on publicly available information, but should be treated with caution. The estimates for adjuvanted IPV development and sIPV development are based on figures presented by vaccine manufacturers.18, 23 It is possible that these are overestimates, but because of the amount of development work required, these activities are “riskier,” with a higher chance of delay or failure. Administering a reduced number of doses per schedule (Approach C) and ID delivery of reduced-volume doses (Approach A) might “only” require clinical trials to confirm noninferiority compared with current IPV immunization, plus time required to develop and approve novel IDD devices if these are to be used. Thus, these are technically less challenging and it should be possible to implement these strategies sooner than approaches B and E. However, the time required for IDD of reduced doses could be increased if reformulation and/or a new presentation of IPV are required. Use of IPV in combination vaccines (approach D) is already possible, and as such does not require additional development or testing. However, it has been suggested that scale-up of manufacturing of various components of hexavalent vaccines containing IPV is required in order to reduce the cost (see section 3.3.2), and the timeline presented is intended to reflect the time needed for this process.

Economic analysis of routine IPV immunization 20 April 2010 ________________________________________________________________________________________
Page 16
4.6.2. Comparison of the strategies for reducing cost of IPV
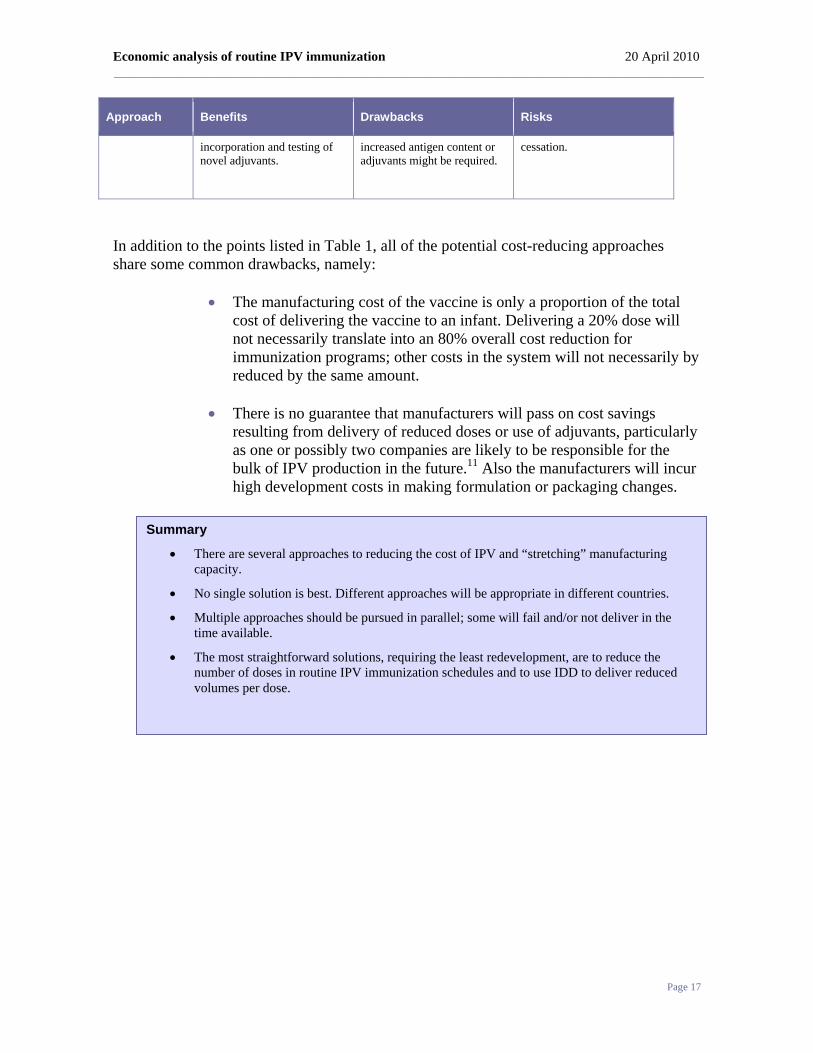
The relative merits of each of the approaches being considered to reduce cost of IPV and stretch manufacturing capacity are summarized in Table 1 below. Table 1. Comparison of approaches to reduce the cost of IPV.
Approach Benefits Drawbacks Risks
A: IDD of fractional or reduced-volume doses of IPV
Minimal redevelopment and reformulation needed, therefore faster and lower risk of failure—“low hanging fruit” Positive data from Oman IDD study. Potential to reduce volume required in the cold chain for IPV storage and distribution.
Cost of IDD devices might outweigh cost savings of antigen. Need to demonstrate that dose sparing is possible with IPV from different manufacturers and with vaccine at the end of its shelf life. Negative data from Cuba IDD study (and Moradabad). Additional training of healthcare workers will be needed.
A 20% dose might be too low for satisfactory, long-term immunogenicity; four-dose regimens might be needed. Manufacturers might be unwilling to change formulation (e.g., adding preservative) to comply with multidose vial guidelines. Manufacturers might increase vaccine price to compensate for the smaller volumes given per dose.
B: Use of adjuvants to reduce IPV antigen content
Encouraging preclinical data. Relatively straightforward development path for Al-based adjuvants. Point-of-use mixing (for oil-in-water adjuvants) would avoid changes to existing IPV manufacture and filling, and avoid need for new stability data.
Long development timeline for oil-in-water adjuvants. Likely to be suitable for IM/SC only due to reactogenicity. IDD of adjuvanted IPV is unlikely in the medium to long term. Point-of-use mixing will be unconventional; one vial of vaccine into multidose vial of MF59-like adjuvant.19
Promising preclinical data might not be matched in clinical trials; the same degree of antigen sparing might not be achieved. Safety is paramount in the target (infant) population; zero tolerance for excess reactogenicity.
C: Reduce the number of IPV doses.
No reformulation required. Would “stretch” manufacturing capacity and reduce overall costs.
Reduction in overall levels of population immunity.
Re-emergence of cVDPVs is possible if strategy is implemented too soon.
D: Use of IPV in combination vaccines
Presence of adjuvant could result in a reduction of IPV antigen content. Potential for systems savings (needle and syringe, wastage, distribution, etc.). Reduces the number of injections in infant immunization schedules.
Lack of flexibility in immunization schedule due to combination with other EPI vaccines. If novel adjuvants are needed, reformulation will be complex.
Supply:demand balance is not yet understood. Extent of system cost savings needs to be modeled. Non-IPV manufacturers intending to make combinations need access to bulk IPV.
E: Use of sIPV.
Could potentially reduce the cost of manufacture of IPV by reducing biocontainment requirements. Development of sIPV allows
Long development timelines; might be too late for transient demand surge. Reduced antigenicity of two sIPV poliovirus types;
Required improvements to antigenicity or yield might outweigh cost savings. sIPV might not be available at large scale in time for OPV
Economic analysis of routine IPV immunization 20 April 2010 ________________________________________________________________________________________
Page 17
Approach Benefits Drawbacks Risks
incorporation and testing of novel adjuvants.
increased antigen content or adjuvants might be required.
cessation.
In addition to the points listed in Table 1, all of the potential cost-reducing approaches share some common drawbacks, namely:
• The manufacturing cost of the vaccine is only a proportion of the total cost of delivering the vaccine to an infant. Delivering a 20% dose will not necessarily translate into an 80% overall cost reduction for immunization programs; other costs in the system will not necessarily by reduced by the same amount.
• There is no guarantee that manufacturers will pass on cost savings resulting from delivery of reduced doses or use of adjuvants, particularly as one or possibly two companies are likely to be responsible for the bulk of IPV production in the future.11 Also the manufacturers will incur high development costs in making formulation or packaging changes.
Summary
• There are several approaches to reducing the cost of IPV and “stretching” manufacturing capacity.
• No single solution is best. Different approaches will be appropriate in different countries.
• Multiple approaches should be pursued in parallel; some will fail and/or not deliver in the time available.
• The most straightforward solutions, requiring the least redevelopment, are to reduce the number of doses in routine IPV immunization schedules and to use IDD to deliver reduced volumes per dose.

Economic analysis of routine IPV immunization 20 April 2010 ________________________________________________________________________________________
Page 18
5. Analysis of the incremental costs associated with various approaches for routine IPV immunization
5.1. Introduction In an effort to provide a more detailed analysis of the incremental costs associated with strategies for reducing the cost of IPV, a model developed by the Disposable Syringe Jet Injector Project at PATH was adapted and applied to three of the strategies—ID delivery of reduced doses, inclusion of adjuvant, and an immunization regimen consisting of fewer doses. The original model developed by PATH analyzes economic costs from the health system perspective by focusing on those costs that are affected by the depth of delivery (i.e., ID vs. IM/SC), which affects the size of the dose used, and the delivery device. In its original form it evaluates the costs per patient added and saved for a number of vaccine delivery scenarios:
• Needle and syringe (N&S), IM/SC, standard dose (base case). • Disposable syringe jet injector (DSJI), IM/SC, standard dose. • DSJI, ID, reduced dose (typically 20% of standard). Other devices for
delivery of reduced doses can also be included.
The model assumes a “steady-state” situation. It does not include the costs incurred in reaching that state. Therefore the costs involved in developing each of the approaches, such as the cost of developing and conducting clinical trials with adjuvanted formulations and developing and testing novel ID delivery devices, are not included. Similarly, any costs associated with training healthcare workers for each of the approaches are not included. We modified the model to explore the costs associated with routine IPV immunization using various vaccine formulations, routes of delivery, and delivery devices. In particular, we have used the model to explore three approaches (A, B, and C [sections 4.1, 4.2, and 4.3]) for reducing the cost of IPV, i.e.:
• Using ID delivery to administer a reduced volume of IPV per dose (Approach A).
• Combining IPV with adjuvants to enable delivery of a reduced antigen content per dose (Approach B).
• Delivering fewer doses of IPV per infant (Approach C).
5.2. Methods Details of the cost-analysis model, including the key assumptions and the input values used, are provided in Appendix 1. The main features of the model are described briefly in the sections below. 5.2.1. Approach A: Intradermal delivery of IPV
Three devices for IDD are evaluated in the model and compared with N&S IM. Each of the devices is filled in the field, and none of them are commercially available. The prices used for each of the delivery devices in the model assumed high-volume production. These figures were therefore estimates in the case of DSJI, the ID needle adapter, and the

Economic analysis of routine IPV immunization 20 April 2010 ________________________________________________________________________________________
Page 19
microneedle array. Disposable syringe jet injector30
DSJIs can deliver vaccines intramuscularly, subcutaneously, or intradermally. The features and costs used in the model are an aggregate from three devices currently in development. These systems consist of:
• A reusable handpiece (sometimes with a separate reset station). • A vial adapter. • A disposable syringe. • A reconstitution syringe (this was not required in this scenario as IPV is
supplied as a liquid vaccine).
ID adapter30
This is a plastic sheath that fits around a standard tuberculin syringe to control the depth and angle of needle penetration for ID delivery. The system consists of:
• A tuberculin syringe. • The ID adapter sheath. • A reconstitution syringe (not required in this scenario).
Syringe-mounted microneedle array30
A field-filled hollow microneedle (MN) prototype device is used as an example. This consists of:
• An array of MNs mounted on a standard luer syringe. • An extra needle (used for filling the syringe and removed before
injection). • A reconstitution syringe (not required in this scenario).
5.2.2. Approach B: Combining IPV with adjuvant
The costs associated with using a 10% dose of IPV combined with an oil-in-water, MF59-like adjuvant (as described in section 3.2) were also analyzed. In this scenario, only IM delivery using N&S or DSJI was modeled. It was assumed that adjuvanted IPV would be too reactogenic if delivered intradermally. 5.2.3. Approach C: Administering fewer doses of IPV
The savings achieved by reducing the number of doses per schedule from three to two doses were analyzed. In addition, the consequences of increasing the schedule to four doses (to allow for possible suboptimal immunogenicity of the ID route) were also examined. In both situations, the costs associated with IM and ID delivery of IPV were considered. 5.2.4. Costs included in the model
• Device-specific costs, including the cost of reusable and disposable components and the costs involved in the disposal of sharps and biohazardous waste.

Economic analysis of routine IPV immunization 20 April 2010 ________________________________________________________________________________________
Page 20
• Costs associated with reconstitution, as it was assumed that adjuvant and vaccine would be supplied in separate vials that required mixing at point of use.
• Cost of vaccine, including vaccine waste. • Vaccine transport costs. • Healthcare costs arising from needle reuse and needle-stick injury.
5.2.5. Costs not modeled
• Development costs (preclinical studies, clinical trials, device development, etc.).
• Training healthcare workers on novel devices (DSJI, ID adapter, and syringe-mounted MNs).
• Healthcare worker productivity (e.g. additional time required for reconstituting adjuvanted vaccine).
• Healthcare center direct costs. • Healthcare center overhead costs. • Travel to/from immunization center. The timing of IPV immunizations
was assumed to be the same as for other routine immunizations (e.g., DTP), so additional trips for IPV immunization would not be needed.
5.2.6. Setting
India was selected as the initial case-study setting for routine IPV immunization as it still has foci of endemic poliovirus transmission. It should be noted, however, that if or when India introduces routine IPV immunization it is possible that this will be with IPV in a combination vaccine. 5.3. Results 5.3.1. Approach A: Costs of IDD of reduced volumes per dose of IPV
For approach A, the costs associated with the following scenarios for routine IPV delivery were modeled.
• N&S, IM/SC (i.e., standard route), 0.5 ml per injection (i.e., standard dose); this was defined as the base case.
• DSJI, IM/SC, standard dose. • DSJI, ID, 20% dose. • ID needle adapter, ID, 20% dose. • Syringe-mounted MN array, ID, 20% dose.
It was assumed that the immunization regimens would be three doses for both IM and ID delivery. The results are shown in Figure 4.

Economic analysis of routine IPV immunization 20 April 2010 ________________________________________________________________________________________
Page 21
Figure 4. Incremental costs associated with routine IPV immunization per infant in India.
Costs of IPV immunization per infant: IM vs ID delivery
$-
$2.00
$4.00
$6.00
$8.00
$10.00
$12.00
N&S (IM) DSJI (IM) N&S (ID) DSJI (ID) ID Adapter (ID) MN (ID)
Immunization device (route)
Imm
uniz
atio
n co
sts
($)
Vaccine Costs Device Costs Unsafe Injection Costs
Several key points can be observed from the results shown in Figure 4.
• Three of the ID regimens (N&S, DSJI, and the ID adapter) reduce the cost for a three-dose schedule of IPV by 71%–73%, depending on the delivery device, from the base-case cost of $10.24, to $2.72 (N&S ID), $2.97 (DSJI, ID) and $2.91 (ID adapter). Thus, although reducing the amount of vaccine delivered by 80% does not translate into an 80% cost reduction, IDD does result in significant savings. It should be noted, however, that the model does not account for costs associated with training healthcare workers.
• Each of the new delivery devices is more expensive than N&S; therefore, the least expensive option is IDD using N&S. In this model, however, the additional device costs of the DSJI compared with N&S are offset by saving the cost “premium” per injection to cover the estimated direct healthcare costs of infections caused by unsafe injection practices, needle reuse, and accidental needle-stick injuries. These costs have been estimated to be $535 million per year globally, equivalent to an additional $0.125 per injection.31 However, this figure is only an estimate based on many assumptions. It is possible that it could be an overestimate, or significant underestimate of the hidden costs associated with sharps use (see section 5.4).
• The syringe-mounted microneedle array is the least cost-efficient device. Not only is it the most expensive in terms of disposable components, it is also the least efficient in terms of extracting vaccine from the vial, resulting in wastage of up to 40% of the contents. This is probably at least in part due to the fact that this is a novel type of device that is relatively early in development compared to DSJIs. It is possible (but not

Economic analysis of routine IPV immunization 20 April 2010 ________________________________________________________________________________________
Page 22
guaranteed) that wastage due to dead space in the device might be improved as development progresses.
5.3.2. IDD of IPV: Sensitivity to changes in vaccine price
It has been estimated that if IPV manufacturers increase production of IPV, then economies of scale could result in a reduction in the production price for the vaccine of 30%–50%.11 These savings might be passed onto the purchase price of the vaccine. Therefore the impact of reducing the price per 0.5 ml vial of IPV was modeled (Figure 5). Figure 5. Costs of IPV immunization: sensitivity to vaccine price.
Costs of IPV immunization per infant: sensitivity to vaccine price
$-
$2.00
$4.00
$6.00
$8.00
$10.00
$12.00
$3.00 $2.70 $2.40 $2.10 $1.80 $1.50
Cost of IPV per 0.5ml vial ($)
Imm
uniz
atio
n co
sts
($) N&S (IM)
DSJI (IM)
N&S (ID)
DSJI (ID)
ID Adapter (ID)
MN (ID)
If the proposed economies of scale in IPV manufacture lead to a 30% reduction in vaccine price, IDD of reduced (20%) doses by either DSJI, the ID adapter, or N&S would still result in significant cost savings. A full immunization course delivered ID with these devices would cost approximately $2.08–$2.27 per infant compared with $7.38 for IM delivery of the standard dose. Even if the price of vaccine were to be reduced by 50% to $1.50, then IDD with N&S or DSJI would still be ~70% less expensive than IM delivery. It is possible that the vaccine producers might increase the price per vial of IPV to compensate for the fact that with IDD each vial would contain five doses, rather than one. If the vaccine price were doubled to $6.00, then the cost per immunized infant would be $4.84, $5.36, and $5.03 for IDD with N&S, DSJI, or ID adapter, respectively—i.e., approximately 50% of the cost using IM delivery at a vaccine price of $3.00. 5.3.3. IDD of IPV: Sensitivity to the cost of the delivery devices
None of the IDD devices use in this cost model is currently commercially available or produced at very large scale. The ID adapter is still at the prototype stage. Syringe-mounted MN arrays have had some limited use in clinical trials.32 DSJIs from different manufacturers have been evaluated in clinical trials with a number of vaccines and have
Economic analysis of routine IPV immunization 20 April 2010 ________________________________________________________________________________________
Page 23
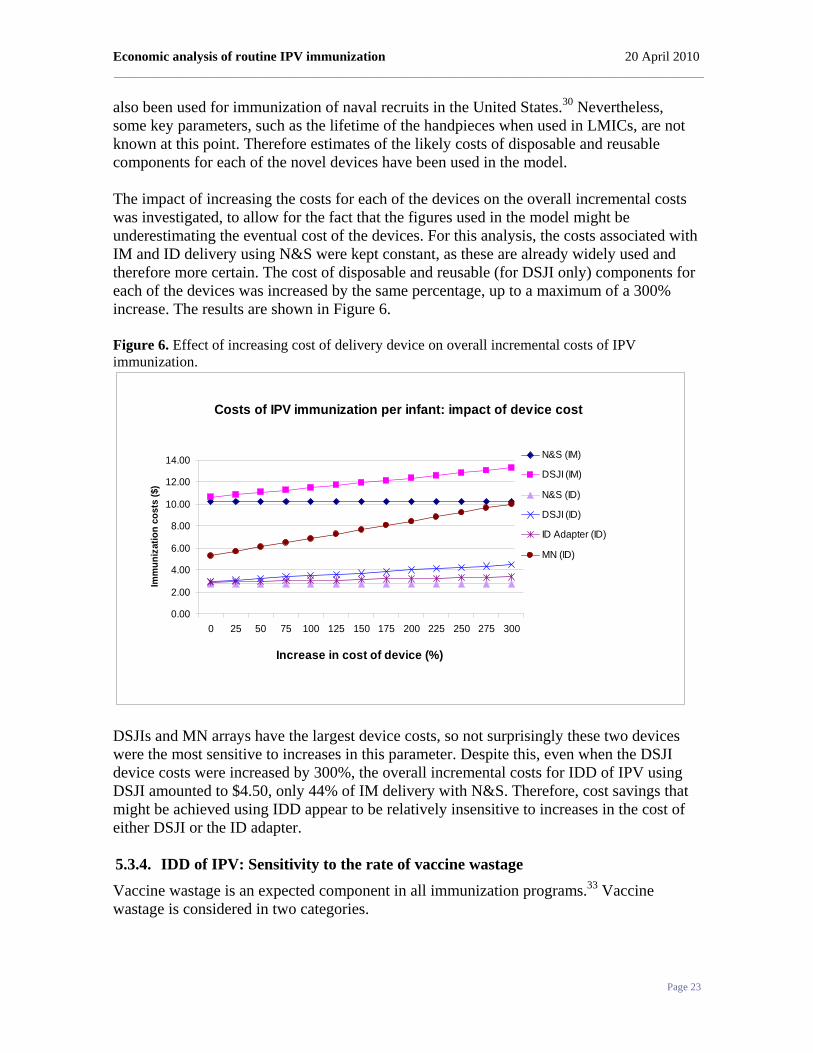
also been used for immunization of naval recruits in the United States.30 Nevertheless, some key parameters, such as the lifetime of the handpieces when used in LMICs, are not known at this point. Therefore estimates of the likely costs of disposable and reusable components for each of the novel devices have been used in the model. The impact of increasing the costs for each of the devices on the overall incremental costs was investigated, to allow for the fact that the figures used in the model might be underestimating the eventual cost of the devices. For this analysis, the costs associated with IM and ID delivery using N&S were kept constant, as these are already widely used and therefore more certain. The cost of disposable and reusable (for DSJI only) components for each of the devices was increased by the same percentage, up to a maximum of a 300% increase. The results are shown in Figure 6. Figure 6. Effect of increasing cost of delivery device on overall incremental costs of IPV immunization.
Costs of IPV immunization per infant: impact of device cost
0.00
2.00
4.00
6.00
8.00
10.00
12.00
14.00
0 25 50 75 100 125 150 175 200 225 250 275 300
Increase in cost of device (%)
Imm
uniz
atio
n co
sts
($)
N&S (IM)
DSJI (IM)
N&S (ID)
DSJI (ID)
ID Adapter (ID)
MN (ID)
DSJIs and MN arrays have the largest device costs, so not surprisingly these two devices were the most sensitive to increases in this parameter. Despite this, even when the DSJI device costs were increased by 300%, the overall incremental costs for IDD of IPV using DSJI amounted to $4.50, only 44% of IM delivery with N&S. Therefore, cost savings that might be achieved using IDD appear to be relatively insensitive to increases in the cost of either DSJI or the ID adapter. 5.3.4. IDD of IPV: Sensitivity to the rate of vaccine wastage
Vaccine wastage is an expected component in all immunization programs.33 Vaccine wastage is considered in two categories.

Economic analysis of routine IPV immunization 20 April 2010 ________________________________________________________________________________________
Page 24
Unopened vial wastage
This is due to vaccine expiry, damage by heat or freezing, vial breakage, or theft of vaccine.34 Unopened vial wastage is generally less than opened vial wastage.33 Opened vial wastage
This is caused by a number of factors, the most important two causes being: • Not being able to draw the expected number of doses from the vial. This
is dependent on the amount of dead space in the design of the device and also methods of expelling vaccine out of the device to remove air bubbles. Estimates of waste attributable to device design were included in the model.
• Unused remnants of vaccine in the vial, usually unused vaccine at the end of an immunization session.
For the purposes of this analysis, unopened vial wastage was assumed to remain constant for each of the delivery devices and routes. Opened vial waste was assumed to be negligible for IM delivery (with either N&S or DSJI), as one vial is equivalent to one immunizing dose. However, one of the most significant implications of delivering 20% doses of IPV by the ID route is that the existing single-dose vial presentation will be used as a five-dose multidose vial. Therefore, any opened, partly used vials would have to be discarded at the end of an immunization session. Therefore the effect of increasing the amount of opened-vial vaccine wastage for each of the devices was modeled. The wastage rate was kept constant for IM delivery (N&S and DSJI), as one vial is used for one immunization, so there will not be unused remnants at the end of an immunization session. The starting point for each of the IDD devices was to assume no unused vaccine at the end of an immunization session, so that the only vaccine wastage was caused by not being able to withdraw the full number of usable doses from the vial due to the design of the device. The impact of increasing the amount of opened-vial vaccine wastage due to other causes was then modeled. The results are shown in Figure 7.

Economic analysis of routine IPV immunization 20 April 2010 ________________________________________________________________________________________
Page 25
Figure 7. Effect of opened-vial waste overall incremental costs of IPV immunization.
Costs of IPV immunization per infant: impact of opened-vial waste
0.00
2.00
4.00
6.00
8.00
10.00
12.00
14.00
0 10 20 30 40 50 60 70 80
Overall opened vial waste (%)
Imm
uniz
atio
n co
sts
($)
N&S (IM)
DSJI (IM)
N&S (ID)
DSJI (ID)
ID Adapter (ID)
MN (ID)
The impact of additional opened-vial wastage resulting from using single-dose vials as multidose vials appears to be significant. When the total opened-vial wastage is 50%, then the cost savings from the fractional dose IDD regimens are only approximately 50% of the standard IM schedule. This level of opened-vial wastage might not be unusual or unexpected. Accurate data on amount of vaccine wastage is not easy to find. However, a recent study in Bangladesh reported total wastage of DTP of 45.1% and 34.3% opened-vial wastage.33 Therefore, in order to maximize the benefits from IDD of fractional doses, attention will need to be given to the size of routine immunization sessions to reduce the chance of having unused vaccine at the end of a session. Alternatively, producing IPV in a new presentation, such as two ID doses per vial, might reduce opened-vial wastage, but could also increase the amount of space required in the cold chain for distribution and storage of IPV, compared with a single vial containing five ID doses. 5.3.5. Approach B: Costs associated with use of adjuvanted IPV
The use of oil-in-water adjuvants with IPV to reduce the antigen content required per dose of vaccine is being explored (section 4.2, Approach B). Therefore the incremental costs of this strategy were modeled. ID administration of adjuvanted IPV is not likely to be feasible using the currently available oil-in-water or Al-based adjuvants, due to unacceptable local reactogenicity at the ID injection site. Therefore IM delivery only, using N&S or DSJI, was considered. The antigen dose was assumed to be 10% of the current IM dose based on existing preclinical data.5 The cost of adjuvant was assumed to be $0.067 per dose as a “worst case”; estimates of 1–3 cents per dose have been proposed.19 It was also assumed that the adjuvant and vaccine would be supplied in two separate vials, to be mixed at the point of use,19 therefore, the

Economic analysis of routine IPV immunization 20 April 2010 ________________________________________________________________________________________
Page 26
costs of reconstitution syringes were included in the model. The incremental costs resulting from IM delivery of adjuvanted IPV using N&S or DSJI are shown in Figure 8; the costs of IDD of non-adjuvanted, reduced (20%) doses are also shown for comparison. Figure 8. Incremental costs associated with IPV immunization using adjuvanted IPV delivered IM.
Costs of IPV immunization per infant: use of adjuvanted IPV
$-
$2.00
$4.00
$6.00
$8.00
$10.00
$12.00
N&S(IM)
DSJI(IM)
N&S(IM+adj.)
DSJI(IM+adj.)
N&S(ID)
DSJI(ID)
ID adapter(ID)
MN(ID)
Immunization device (route)
Imm
uniz
atio
n co
sts
($)
Vaccine Costs Device Costs Unsafe Injection Costs
Use of adjuvanted IPV leads to significant cost savings compared with IM delivery of the standard doses; cost savings of 82–83% were achieved with N&S and DSJI, respectively. This is approach is potentially less expensive than IDD of reduced doses. The costs of delivering fractional (10%), adjuvanted IPV doses are lower (by approximately $1 per immunized infant) than for the 20% doses delivered ID using the same device (N&S or DSJI), despite the additional cost of the adjuvant and the need for reconstitution equipment for mixing adjuvant and vaccine. However, if the presentation of IPV remains as it is (i.e., 0.5 ml per vial), then the current single-dose vial will become a ten-dose multidose vial when used with adjuvant. This could potentially increase the amount of opened-vial waste even more than the “five-dose” IDD presentation, as there is an even greater likelihood of unfinished vials at the end of a session, which would then reduce the degree of cost saving achieved by this strategy.

Economic analysis of routine IPV immunization 20 April 2010 ________________________________________________________________________________________
Page 27
5.3.6. Approach C: Costs associated with delivering a reduced number of doses of IPV
It has been proposed that two-dose ID or IM regimens might induce sufficient immunity at the individual or population level, and clinical trials to evaluate two-dose regimens are under way.5 Delivering fewer doses per immunized child would clearly reduce the costs of immunization. The data obtained from trials of IDD of reduced volumes of IPV suggest that the efficacy of these regimens might be dependent on the timing of the immunization regimen. Even when good seroconversion rates were induced, the antibody titers generated following IDD delivery of reduced doses were significantly lower than those following IM vaccination8 (see section 4.1.1). It has been suggested, therefore, that a four-dose (rather than three-dose) IDD regimen might be required to ensure adequate seroprotection.5 Therefore, the incremental costs arising from two-, three-, and four-dose ID regimens with two- and three-dose IM regimens were modeled. Four-dose IM schedules were not considered, as these are not likely to be used. The results are shown in Figure 9 (below). If a two-dose IM regimen was used, as opposed to a three dose IM regimen, the cost saving would be 31% and 33%, if the vaccine was delivered with DSJI or needle and syringe, respectively. Not surprisingly, two-dose ID regimens give the greatest savings compared with the base case of three IM doses by N&S. Immunization costs per infant for two ID doses with N&S, DSJI, and ID adapter are 17.7%, 17.6%, and 21.7% respectively, of the cost of the three-dose IM regimen (i.e., savings of 82.3%, 82.4%, and 79.3% compared with the base case). Delivering two IM doses per child is still more than twice the cost of delivering three doses intradermally with either: N&S, DSJI, or the ID adapter ($6.83 vs. $2.72–$2.91). In the event that four ID administrations of reduced-volume doses are required to induce satisfactory immune responses, these four-dose ID regimens could still result in significant cost savings compared with three doses IM with N&S. Costs of the four-dose ID regimens using N&S, DSJI, and the ID adapter are still only 35.4%, 35.3%%, and 41.3%, respectively, of the cost of the standard three-dose IM regimen.

Economic analysis of routine IPV immunization 20 April 2010 ________________________________________________________________________________________
Page 28
Figure 9. Effect of using two-, three-, and four-dose ID immunization regimens on overall incremental costs of IPV immunization.
Costs of delivering IPV per infant: effect of number of doses
$- $2.00 $4.00 $6.00 $8.00 $10.00 $12.00
N$S (IM, 2 dose)
N$S (IM, 3 dose)
DSJI (IM, 2 dose)
DSJI (IM, 3 dose)
N&S (ID, 2 dose)
N&S (ID, 3 dose)
N&S (ID, 4 dose)
DSJI (ID, 2 dose)
DSJI (ID, 3 dose)
DSJI (ID, 4 dose)
ID Adapter (ID, 2 dose)
ID Adapter (ID, 3 dose)
ID Adapter (ID, 4 dose)
MN (ID, 2 dose)
MN (ID, 3 dose)
MN (ID, 4 dose)
Immunization costs ($)
Vaccine CostsUnsafe Injection CostsDevice Costs

Economic analysis of routine IPV immunization 20 April 2010 ________________________________________________________________________________________
Page 29
5.3.7. Comparison of the costs associated with approaches A, B, and C
A summary of the potential cost savings that might be achieved with each of the three strategies or approaches modeled is presented in Table 2 below. Table 2. Summary of “best-case” cost savings achievable with approaches A, B, and C.
Approach
Cost of IPV immuni-
zation per infant ($)
Cost savings per infant1
Comments
$ %
IM, three doses, non-adjuvanted IPV
N&S (IM)
10.24 NA2 NA
DSJI (IM) 10.62 -0.38 -3.7 A: IDD of fractional or reduced-volume doses of IPV
N&S (ID) 2.72 7.52 73.4 Extent of savings might be eroded by increased vaccine wastage. Savings insensitive to cost of device.
DSJI (ID) 2.97 7.27 71.0
ID adapter (ID)
2.91 7.33 71.6
MN (ID) 5.30 4.94 48.2 B: Adjuvants to reduce antigen content3
N&S (IM)
1.81 8.43 82.3 Preclinical and clinical development work still required. DSJI (IM) 1.72 8.52 83.2
C: Reduce the number of IPV doses per infant (from three to two)
N&S (IM)
6.83 3.41 33.3 No reformulation or novel development required. Need to understand impact on levels of immunity.
DSJI (IM) 7.08 3.16 30.9
N&S (ID) 1.81 8.43 82.3
DSJI (ID) 1.80 8.44 82.4
ID adapter (ID)
2.12 8.12 79.3
MN (ID) 3.53 6.71 65.5 Notes: 1 – Cost savings compared with IM, three doses, non-adjuvanted IPV. 2 – NA – not applicable. 3 – Approach B is assumed to be suitable for IM delivery only (three doses per infant). The figures presented in Table 2 represent the “best case” for each of the scenarios, before sensitivity analysis to test for the impact of increasing vaccine and devices prices, or the possible impact of increasing vaccine waste. It is apparent that, using this method of analysis, the greatest potential savings in immunization costs might be achieved either by reducing the number of doses administered, particularly if the doses are delivered

Economic analysis of routine IPV immunization 20 April 2010 ________________________________________________________________________________________
Page 30
intradermally (approximately 80% reduction in costs), or by the use of adjuvants to reduce antigen content. However, as stated earlier, this model does not account for the costs and investment required to develop each of these approaches. 5.4. Discussion The sections above describe a preliminary analysis of the incremental costs of routine IPV immunization using IM injection and three of the strategies currently being considered for reducing the costs of IPV immunization: IDD of 20% of vaccine using different delivery devices, IM delivery of adjuvanted IPV with a 10% antigen content, or reducing the number of doses per immunization schedule. The cost of the vaccine was found to be the major component in all scenarios, therefore it was not surprising that delivery of a 20% dose intradermally or a 10% dose combined with adjuvant resulted in significant cost savings compared with the base case (standard IM injection of the full dose). Even if the cost of IPV is reduced by 50% from its current level by improving the manufacturing process, the overall costs of immunization using N&S, DSJI, or the ID adapter for IDD were approximately 30% of those for IM delivery with N&S. Thus, either of the two dose-sparing mechanisms (delivering a reduced volume or reducing the antigen content by incorporating an adjuvant) could play a significant role in making IPV more affordable. Reducing the number of doses per infant from three to two doses reduced the overall cost of immunization by approximately 30% if the route of immunization remained the same. Greater savings (approximately 80%) could be achieved by using two ID doses. It should also be noted that if four ID doses (each of 20% of the standard dose) are required to generate high levels of seroprotection, using N&S, DSJI, or the ID needle-adapter for IDD would still result in approximately 60% reduction in costs compared with IM delivery with N&S. IDD using N&S, DSJI, or the ID needle-adaptor led to significant savings even when the additional costs associated with the novel delivery devices were taken into consideration. If the device costs were increased by up to 300% (to allow for inaccuracies in the cost estimates), IDD using any of these three devices was still associated with approximately 70% lower costs than IM delivery with N&S. Of these, IDD using N&S is likely to be the least expensive option, as the model does not account for the costs involved in training healthcare workers on the novel delivery devices. Therefore the immunization costs shown for the novel IDD devices could be underestimates. DSJIs have an additional safety benefit in that they are needle-free. In this model, the additional device costs for DSJI were almost entirely offset by the removal of the “premium” applied to N&S, MNs, and the ID adapter, of $0.125 per injection of hidden costs due to medical care of infections caused by unsafe injections.31 It should be noted that this figure is based on a single publication, and estimates of the hidden costs of injections due to infections caused by needle-stick injury and improper N&S use are difficult to calculate. Other investigators have suggested that when these factors are taken into consideration, the overall costs of N&S for vaccine delivery ($25.29 per injection) are two orders of magnitude greater than those for DSJI delivery ($0.36 per injection).35 Using

Economic analysis of routine IPV immunization 20 April 2010 ________________________________________________________________________________________
Page 31
these estimates would clearly have a significant impact on the outcome of the incremental cost model. Therefore, more reliable estimates of the overall societal costs arising from N&S use are needed. Of the IDD devices modeled, the syringe-mounted MN array resulted in the highest costs. This was partly due to relatively high costs for the device itself combined with the fact that it has the highest level of vaccine wastage due to dead space in the luer syringe used with the device. It is possible that the cost of these devices and the dead space will be reduced over time. It is also likely that MN arrays will still be considered as sharps and will require the appropriate, costlier disposal. IM delivery of adjuvanted IPV was associated with even lower costs than the IDD regimens. Adjuvanted IPV is likely to be in a ten-dose rather than five-dose presentation, making this strategy more susceptible to vaccine wastage resulting from unused doses remaining at the end of an immunization session. In addition, before adjuvanted formulations of IPV are available, considerable preclinical and clinical development is required, more than is needed for IDD of IPV either with or without novel delivery devices. 5.4.1. Limitations of the model and further research
The cost-modeling exercise has identified the need to understand more fully the issues resulting from the presentation of IPV if it is to be used for routine immunization. Using the existing single-dose presentation of IPV as a five-dose multidose vial for IDD could result in an increased amount of vaccine wastage due to unused, opened vials at the end of an immunization session. The sensitivity analysis suggested that this could be the most significant factor affecting the cost savings that might be achieved. Therefore accurate data on vaccine wastage rates and typical routine immunization session sizes will be required for each country to be modeled. Other inputs to the model are likely to be refined over time as information becomes available, such as improved estimates for the device costs and the amount of waste associated with each device. The costs associated with disposal of sharps and biohazardous waste will need to be revised for each country modeled. As discussed above, further estimates on the healthcare costs arising from sharps injuries and reuse of needles could have a significant impact on the model. Given that a relatively low premium has been used in this analysis, it is likely that any revision of this estimate will skew the results more in favour of needle-free delivery, i.e., DSJIs for IM or ID delivery. 5.4.2. Additional factors to be considered
It is not clear from a regulatory perspective whether the existing single-dose presentations of IPV could be used as multidose vials. Current presentations of IPV do not contain preservatives and their use as multidose vials without reformulation and/or repackaging would have to be “off label.” This would require the relevant national regulatory authority to collaborate with the vaccine producer to draw up a licensing amendment. If this is not possible, then reformulation and/or repackaging the vaccine into smaller vials will be needed if IDD is to be used.
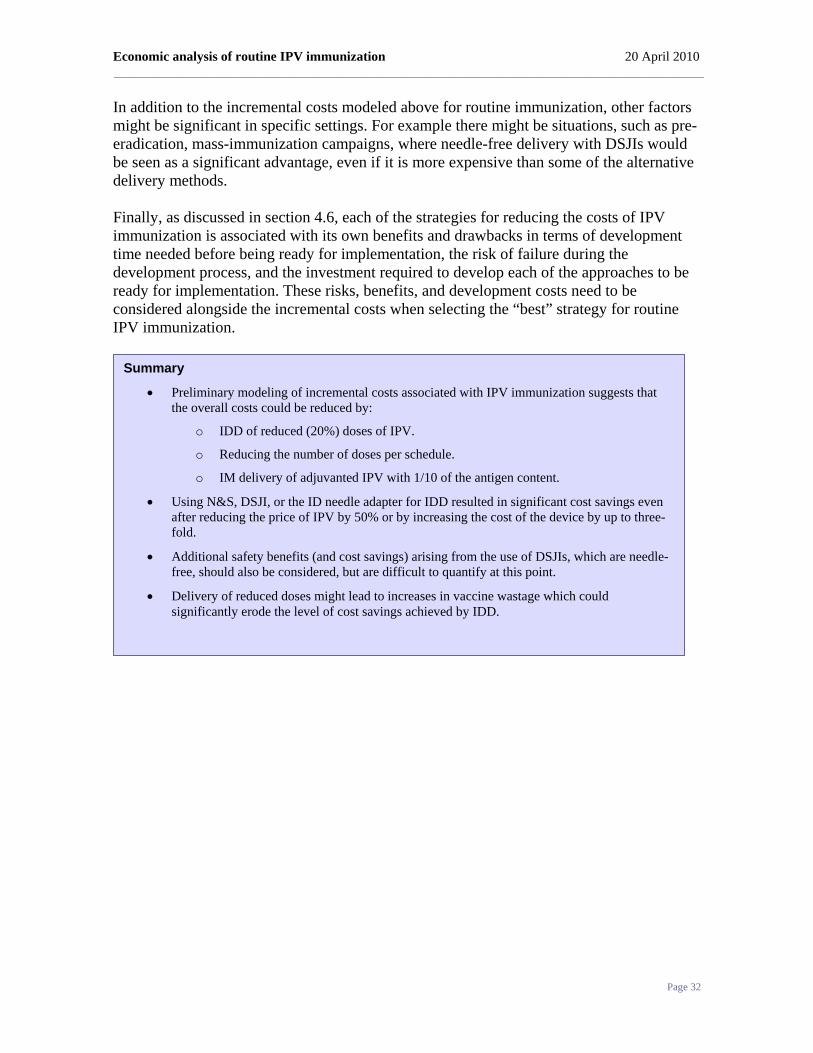
Economic analysis of routine IPV immunization 20 April 2010 ________________________________________________________________________________________
Page 32
In addition to the incremental costs modeled above for routine immunization, other factors might be significant in specific settings. For example there might be situations, such as pre-eradication, mass-immunization campaigns, where needle-free delivery with DSJIs would be seen as a significant advantage, even if it is more expensive than some of the alternative delivery methods. Finally, as discussed in section 4.6, each of the strategies for reducing the costs of IPV immunization is associated with its own benefits and drawbacks in terms of development time needed before being ready for implementation, the risk of failure during the development process, and the investment required to develop each of the approaches to be ready for implementation. These risks, benefits, and development costs need to be considered alongside the incremental costs when selecting the “best” strategy for routine IPV immunization.
Summary
• Preliminary modeling of incremental costs associated with IPV immunization suggests that the overall costs could be reduced by:
o IDD of reduced (20%) doses of IPV.
o Reducing the number of doses per schedule.
o IM delivery of adjuvanted IPV with 1/10 of the antigen content.
• Using N&S, DSJI, or the ID needle adapter for IDD resulted in significant cost savings even after reducing the price of IPV by 50% or by increasing the cost of the device by up to three-fold.
• Additional safety benefits (and cost savings) arising from the use of DSJIs, which are needle-free, should also be considered, but are difficult to quantify at this point.
• Delivery of reduced doses might lead to increases in vaccine wastage which could significantly erode the level of cost savings achieved by IDD.

Economic analysis of routine IPV immunization 20 April 2010 ________________________________________________________________________________________
Page 33
6. Reducing the cost of IPV for use in LMICs: Conclusions Several approaches for reducing the cost of IPV and thereby increasing its use for routine immunization following cessation of OPV use are being evaluated. The main strategies are:
• Use of IDD to deliver reduced volumes of vaccine per dose. • Use of adjuvants to enable delivery of reduced amounts of antigen per
use. • Reducing the number of immunizations per schedule. • Use of IPV in combination vaccine formulations. • Use of sIPVs, which could be less expensive to manufacture than the
currently used IPV. At this point, each of the approaches requires further development work before it can be implemented. Development of sIPVs and adjuvanted IPV formulations both require several years of preclinical and clinical development before they will be ready for implementation. Therefore there is a risk that they will not be ready in the timeframe required, or that issues will arise, such as insufficient immunogenicity or unacceptable reactogenicity that preclude their use. Because of these uncertainties, each of the strategies listed above should continue to be developed in parallel. Reducing the number of doses of IPV in routine immunization schedules and/or delivering a smaller volume of vaccine per dose should be more straightforward to develop and could be implemented more quickly. The fact that there is uncertainty in timing of OPV cessation means manufacturers are hesitant to commit to long-term activities or activities that require a lot of investment (manufacturing scale-up, development of new formulations). Therefore these “simple” approaches to making IPV more affordable for LMICs could be the most appropriate. The clinical data obtained to date suggest that ID regimens employing 20% doses can be sufficiently immunogenic if used in an appropriate schedule. Further clinical research is still required to optimize these regimens in terms of number and timing of immunizations. Additional work is also required to develop further the novel IDD devices, such as DSJIs, in order to optimize ease of use and reproducibility of IDD. Analysis of the incremental costs associated with IDD using several delivery devices suggests that this approach could result in significant cost savings of approximately 70% compared with IM delivery of the full dose using N&S. This level of cost saving could be achieved using N&S, DSJIs, or an ID needle-adapter for IDD delivery. The potential cost savings from use of adjuvanted IPV are greater, but as indicated above, this approach arguably requires a longer period of development before it can be implemented. Some uncertainties still remain with both the IDD of reduced doses and IM delivery of adjuvanted IPV approaches, however. It is not clear whether it will be possible to use existing single-dose vial presentations as multidose vials, and if this is possible, whether the increase in vaccine wastage that is likely to occur will reduce the cost savings to such an

Economic analysis of routine IPV immunization 20 April 2010 ________________________________________________________________________________________
Page 34
extent that pursuing delivery of fractional doses of IPV by IDD or use of adjuvants will not be worthwhile. The potential savings that could be achieved by IDD of IPV and the relatively straightforward development path mean that this approach should certainly be pursued further. Additional cost modeling is required to demonstrate the case for this strategy and also to help to select the most appropriate IDD device to be developed and used. Development of IDD devices should also continue, and these devices should be evaluated in the clinical trials that will be needed in order to optimize and demonstrate the efficacy of reduced-dose IDD immunization schedules.

Economic analysis of routine IPV immunization 20 April 2010 ________________________________________________________________________________________
Page 35
Appendix 1: Incremental cost model Assumptions
Setting
India was selected as the initial case-study setting for routine IPV immunization as figures for the data inputs for the model were readily available.
Base case scenario
Current standard immunization with stand-alone IPV was taken as the base case. • Vaccine supplied in a single-dose (0.5ml) vial. • 0.5ml injected IM (or deep SC) per dose. • Three doses per infant.
Travel costs
It was assumed that routine immunization with IPV would be timed to fit with other routine immunizations such as DTP, at 6, 10 and 14 weeks. Therefore there would be no travel costs for additional visits to healthcare centers.
Base case model inputs
General model inputs Intra-muscular
Intra-dermal
Source and comments
Volume of vaccine per vial (ml) 0.5 0.5 Based on current presentation of Imovax IPV (Sanofi Pasteur)
Volume delivered per injection (ml) 0.5 0.1 Based on Imovax IPV
Number of injections per schedule per infant 3 3
Vaccine wastage - OVERALL 25% 25% Overall wastage rate for routine DTP in India. P. Dhalaria, PATH.
Proportion of total vaccine wastage due to expiration, oversupply, etc., i.e., UNOPENED
24% 24% Guichard et al. 2010. 24% of total DTP waste is unopened waste in Bangladesh.
Cost of vaccine vial, Indian rupees (INR) 135 135 Exchange rate: 45 INR = 1 USD
Cost of vaccine vial (USD) $3.00 $3.00 UNICEF tender price 2006 (Oliver Wyman, March 2009)
Vaccine transport cost per vial (USD) $0.04 $0.04 Based on cost of transport for rabies vaccine in India
Cost of sharps disposal per gram (USD) $0.0039 $0.0039 Disposal costs are based on weight. Base line - BD Soloshot 0.5 ml syringe - 2.56 grams, costs 0.45 USD to dispose; i.e., INR 0.175/g to dispose of a syringe as sharps waste.
Cost of biomedical waste disposal per gram (USD)
$0.0033 $0.0033 Assume INR 0.15/g to dispose of biohazardous waste.
Unsafe injection cost per injection $0.125 $0.125 Miller et al. 1999

Economic analysis of routine IPV immunization 20 April 2010 ________________________________________________________________________________________
Page 36
Device-specific inputs Intra-muscular
Intra-dermal
Source and comments
Needle and syringe (N&S)
Price of autodisable N&S $0.05 $0.05 PATH India. An autodisable syringe costs 2.6 INR or US$0.53.
Wastage rate of autodisable N&S 5% 5% Assumption
Amount of vaccine wastage - OPENED (due to dead space, residual volume, etc.)
0% 10% IPV supplied in single-dose vial, so assume “opened” waste is negligible for IM, but higher for ID. 10% is an assumption.
Disposable syringe jet injector (DSJI)
Price of the DSJI + reset station (USD) $60.00 $60.00 PATH. Assumes $55 price + $5 shipping per device.
Number of injections given with DSJI during lifetime
5,000 5,000 PATH. Lifetime of device estimated at 20,000 injections. 5,000 allows for loss, breakage, etc.
Price of the DSJI syringe (USD) $0.12 $0.12 PATH
Wastage of DSJI syringe 5% 5% PATH
Price of the DSJI vial adapter (USD) $0.15 $0.15 PATH
Wastage of DSJI vial adapter 5% 5% PATH
Amount of vaccine wastage - OPENED (due to dead space, residual vol., etc.)
0% 20% PATH
Intradermal (ID) needle adapter
Price of the ID adapter (USD) $0.05 PATH - Based on cost quotes from potential manufacturing partners
Wastage of ID adapter 5% PATH - Assume wastage is the same as N&S
Amount of vaccine wastage - OPENED (due to dead space, residual vol., etc.)
10% PATH
Syringe-mounted microneedle array
Price of the microneedle (USD) $0.50 PATH- Based on conversations with microneedle developers
Wastage of microneedle 5% PATH - Assume wastage is the same as N&S
Price of the removable sharp (USD) $0.02 Assumption
Wastage of removable sharp 5% PATH - Assume wastage is the same as N&S
Amount of vaccine wastage - OPENED (due to dead space, residual vol., etc.)
40% PATH

Economic analysis of routine IPV immunization 20 April 2010 ________________________________________________________________________________________
Page 37
Adjuvant-specific inputs IM IM+ adjuvant
Source and comments
Volume of vaccine per vial (ml) 0.5 0.5 Based on current presentation of Imovax IPV (Sanofi Pasteur)
Volume delivered per injection (ml) 0.5 0.05 Assume 10% antigen dose in the presence of adjuvant (based on preclinical data)
Cost of vaccine vial, Indian rupees (INR) 135 138 Exchange rate: 45 INR = 1 USD
Cost of vaccine vial (USD) $3.00 $3.07 Assume cost of adjuvant is up to $0.07 per dose
Vaccine transport cost per vial (USD) $0.04 $0.08 Need to transport adjuvant vial and vaccine vial
Sensitivity analysis
Number of doses per schedule
Input values for the number of doses administered per infant were: • ID regimens (all devices): 2, 3, and 4 doses per schedule. • IM regimens (both devices): 2 and 3 doses per schedule.
Four IM doses were not modeled as this is not a regimen being considered.
Cost of delivery device
The starting point used the inputs in the tables above. The costs of disposable and reusable components of the devices were then increased in 25% increments up to a 300% increase in cost. Waste disposal costs were not altered.
Amount of opened-vial vaccine wastage
Unopened-vial waste was not altered as this was assumed to be constant for all devices and both IM and ID delivery. The number of doses that could be obtained per vial with each device was determined by bench-testing at PATH, or by communication from the manufacturers. This was used as the starting point of opened-vial wastage for each device. The amount of vaccine wasted was then increased in 10% increments.

Economic analysis of routine IPV immunization 20 April 2010 ________________________________________________________________________________________
Page 38
References 1 World Health Organization. Global Polio Eradication Initiative Programme of Work 2009 and
Financial Resource Requirements 2009–2013. Available at: http://www.polioeradication.org/content/general/Final_English.GPEIProgrammeofWork2009.pdf
2 Global Polio Eradication Initiative website: http://www.polioeradication.org/casecount.asp. Accessed 14 January 2010.
3 Global Polio Eradication Initiative website: http://www.polioeradication.org/vaccines.asp. Accessed 14 January 2010.
4 Sutter R. Written communication, 16 February 2010.
5 Sutter R. Presentation at 8th WHO/UNICEF Consultation with OPV/IPV Manufacturers and National Regulatory Authorities, October 2009.
6 World Health Organization. Conclusions and recommendations of the Advisory Committee on Poliomyelitis Eradication. Weekly Epidemiological Record. 2008;83:35–36.
7 Paul Y. Polio eradication in India: Have we reached the dead end? Vaccine. 2010;28(7):1661–1662.
8 Aylward B. Presentation at the 8th WHO/UNICEF Consultation with OPV/IPV Manufacturers and National Regulatory Authorities, October 2009.
9 World Health Organization. Inactivated Poliovirus Vaccine Following Oral Poliovirus Vaccine Cessation Supplement to the WHO Position Paper. Weekly Epidemiological Record. 2006;15:137–144.
10 Smith G, Oliver Wyman Inc. Presentation at 8th WHO/UNICEF Consultation with OPV/IPV Manufacturers and National Regulatory Authorities, October 2009.
11 Oliver Wyman Inc. Global Post-eradication IPV Supply and Demand Assessment: Integrated Findings. March 2009.
12 Sutter R. Written communication, 15 January 2010. 13 Duchêne M. Production, testing and perspectives of IPV and IPV combination vaccines: GSK
biologicals' view. Biologicals: Journal of the International Association of Biological Standardization. 2006;34(2):163–166.
14 Samuel BU et al. Immune response to intradermally injected inactivated poliovirus vaccine. Lancet. 1991;338(8763):343–344.
15 Samuel BU et al. Immune response of infants to inactivated poliovirus vaccine injected intradermally. Vaccine. 1992;10(2):135.
16 Nirmal S. et al. Immune response of infants to fractional doses of intradermally administered inactivated poliovirus vaccine. Vaccine. 1998;16(9-10):928–931.

Economic analysis of routine IPV immunization 20 April 2010 ________________________________________________________________________________________
Page 39
17 World Health Organization. WHO policy statement. The use of opened multi-dose vials of
vaccine in subsequent immunization sessions. 2000. Available at http://www.who.int/vaccines-documents/DocsPDF99/www9924.pdf.
18 Pierard I. Presentation at NIAID conference, Polio Immunization: Moving Forward, September
2007.
19 Friede M. Presentation at 7th WHO/UNICEF Consultation with OPV/IPV Manufacturers and National Regulatory Authorities, October 2008.
20 Schultze V et al. Safety of MF59 adjuvant. Vaccine. 2008;26(26):3209–3222.
21 Vesikari T et al. MF59-adjuvanted influenza vaccine (FLUAD) in children: safety and immunogenicity following a second year seasonal vaccination. Vaccine. 2009;27(45):6291–6295.
22 Cuba IPV Study Collaborative Group. Randomized, placebo-controlled trial of inactivated poliovirus vaccine in Cuba. The New England Journal of Medicine. 2007;356(15):1536–1544.
23 Bakker W. Netherlands Vaccine Institute. Presentation at 8th WHO/UNICEF Consultation with OPV/IPV Manufacturers and National Regulatory Authorities, October 2009.
24 Takeda Ltd. Presentation at 8th WHO/UNICEF Consultation with OPV/IPV Manufacturers and National Regulatory Authorities, October 2009.
25 Institute of Medical Biology. Presentation at 8th WHO/UNICEF Consultation with OPV/IPV Manufacturers and National Regulatory Authorities, October 2009.
26 Kersten G, Hazendonk T, Beuvery C. Antigenic and immunogenic properties of inactivated polio vaccine made from Sabin strains. Vaccine. 1999;17(15-16):2059–2066.
27 Simizu B. et al. Development of inactivated poliovirus vaccine derived from Sabin strains. Biologicals: Journal of the International Association of Biological Standardization. 2006;34(2):151–154.
28 Tano Y et al. Antigenic characterization of a formalin-inactivated poliovirus vaccine derived from live-attenuated Sabin strains. Vaccine. 2007;25(41):7041–7046.
29 Okayasu H. Written communication, 15 February 2010.
30 PATH. Intradermal Delivery of Vaccines: A Review of the Literature and the Potential for Development for Use in Low- and Middle-Income Countries. 2009. Available at: http://www.path.org/files/TS_opt_idd_review.pdf.
31 Miller MA, Pisani E. The cost of unsafe injections. Bulletin of the World Health Organization. 1999;77(10):808–811.
32 Van Damme P et al. Safety and efficacy of a novel microneedle device for dose sparing intradermal influenza vaccination in healthy adults. Vaccine. 2009;27(3):454–459.
33 Guichard S et al. Vaccine wastage in Bangladesh. Vaccine. 2010;28(3):858–863.

Economic analysis of routine IPV immunization 20 April 2010 ________________________________________________________________________________________
Page 40
34 World Health Organization. Monitoring vaccine wastage at the country level. 2003. Available at:
http://whqlibdoc.who.int/hq/2003/WHO_V&B_03.18.pdf.
35 Ekwueme DU, Weniger BG, Chen RT. Model-based estimates of risks of disease transmission and economic costs of seven injection devices in sub-Saharan Africa. Bulletin of the World Health Organization. 2002;80(11):859–870.