improving sample preparation in hplc · classic sample prep techniques while sample preparation is...
TRANSCRIPT

JU
LY
20
17
Presented in partnershipSponsored by
ImprovIng Sample preparatIon
In HplC

Sample prep overvIew
®
485F US Highway One South, Suite 210,Iselin, NJ 08830(732) 596-0276
PUBLISHING & SALES
Michael J. TessaloneVice President/Group [email protected]
Edward FantuzziPublisher
Stephanie ShafferSales Manager
Brianne MolnarSales Manager
Oliver WatersSales Manager
Liz McCleanSales Executive
Michael KushnerSenior Director, Digital Media
SPECIAL PROJECTS
Kaylynn Chiarello-EbnerManaging Editor, Special Projects
Sabina AdvaniDigital Production Manager
Vania OliveiraProject Manager
Kristen MooreWebcast Operations Manager
EDITORIAL
Laura BushEditorial [email protected]
Megan L’HeureuxManaging Editor, LCGC North America
Stephen A. BrownGroup Technical Editor, LCGC North America
Cindy DelonasAssociate Editor, LCGC North America
Alasdair MathesonEditor-in-Chief, LCGC Europe
Kate MosfordManaging Editor, LCGC Europe
Lewis BotcherbyAssistant Editor, LCGC Europe
© 2017 UBM. All rights reserved. No part of this publication may be reproduced or transmitted in any form or by any means, electronic or mechanical including by photocopy, recording, or information storage and retrieval without permission in writing from the publisher. Authorization to photocopy items for internal/educational or personal use, or the internal/educational or personal use of specific clients is granted by UBM for libraries and other users registered with the Copyright Clearance Center, 222 Rosewood Dr. Danvers, MA 01923, 978-750-8400 fax 978-646-8700 or visit http://www.copyright.com online. For uses beyond those listed above, please direct your written request to Permission Dept. fax 440-756-5255 or email: [email protected].
UBM Americas provides certain customer contact data (such as customer’s name, addresses, phone numbers, and e-mail addresses) to third parties who wish to promote relevant products, services, and other opportunities that may be of interest to you. If you do not want UBM Americas to make your contact information available to third parties for marketing purposes, simply call toll-free 866-529-2922 between the hours of 7:30 a.m. and 5 p.m. CST and a customer service representative will assist you in removing your name from UBM Americas lists. Outside the U.S., please phone 218-740-6477.
LCGC does not verify any claims or other information appearing in any of the advertisements contained in the publication, and cannot take responsibility for any losses or other damages incurred by readers in reliance of such content.
LCGC North America (ISSN 1527-5949 print) (ISSN 1939-1889 digital) is published monthly by UBM Life Sciences, 131 West First Street, Duluth, MN 55802-2065. LCGC Europe (ISSN 1471-6577) and LCGC Asia Pacific (ISSN 1754-2715) are published monthly by UBM EMEA, Hinderton Point, Lloyd Drive, Cheshire Oaks, Cheshire CH65 9HQ, UK. Issues are distributed free of charge to users and specifiers of chromatographic equipment.
To subscribe, call toll-free 888-527-7008. Outside the U.S. call 218-740-6477.
UBM Americas (www.ubmlifesciences.com) is a leading worldwide media company providing integrated marketing solutions for the Fashion, Life Sciences and Powersports industries. UBM Americas serves business professionals and consumers in these industries with its portfolio of 91 events, 67 publications and directories, 150 electronic publications and Web sites, as well as educational and direct marketing products and services. Market leading brands and a commitment to delivering innovative, quality products and services enables UBM Americas to “Connect Our Customers with Theirs.” UBM Americas has approximately 1000 employees and currently operates from multiple offices in North America and Europe.
IntroDUCtIonW
hile sample preparation is a routine task for chromatography labs, it cannot be taken for granted. Sample prep may well be one of the most important ways of ensuring the selectivity, sensitivity, and reproducibility of an analytical method.
In Improving Sample Preparation in HPLC (sponsored by GE Healthcare, and presented in partnership with LCGC), experts explain how labs can ensure their sample prep techniques are supporting the success of even the most advanced chromatographic methods.
First, Nicolas Snow, PhD, a professor of chemistry and biochemistry at Seton Hall University, provides an overview of how some basic factors—like lab glassware choice and solvent mixing—can all have a major effect on the reproducibility of a separation method. Snow also reviews the fundamentals of some of the most common sample preparation techniques, such as liquid–liquid extraction, solid-phase extraction, solid-phase microextraction, and QuEChERS, and the importance of keeping equilibrium and kinetics in mind.
Next, “Sample Prep Perspectives” columnist Douglas E. Raynie interprets the results of a recent LCGC North America readership survey about the use of sample preparation techniques. He examines both short-term trends (especially in the use of automation and newer instrumental extraction techniques) and long-term trends spanning over a decade.
In a separate piece, Raynie and Ronald E. Majors explore high-throughput sample preparation as a possible technique for accelerating sample preparation time. They suggest that the best approach may be a combination of methods for achieving high-throughput sample preparation.
Last, Dwight Stoll, editor of LCGC’s LC Troubleshooting column, discusses some best practices in instrument set-up related to filters and filtering, two important parts of any liquid chromatography system.
As this LCGC eBook demonstrates, a well-thought out sample preparation technique is a lab’s first step in an ensuring an accurate and reliable chromatography method—and proper planning for this stage is critical.
5
30
37
13
Table of contentsTOC IMPROVING SAMPLE
PREPARATION IN HPLC
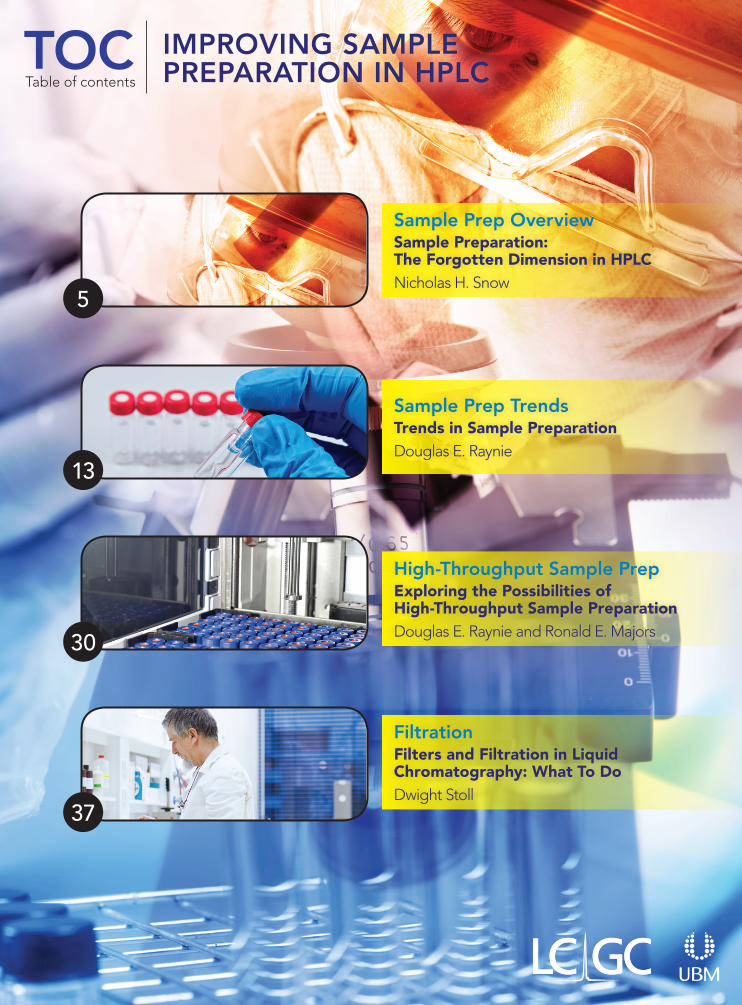
Sample Prep OverviewSample preparation: the Forgotten Dimension in HplCNicholas H. Snow
High-Throughput Sample Prepexploring the possibilities of High-throughput Sample preparationDouglas E. Raynie and Ronald E. Majors
FiltrationFilters and Filtration in liquid Chromatography: what to DoDwight Stoll
Sample Prep Trendstrends in Sample preparationDouglas E. Raynie
shu
tter
sto
ck
.co
m/L
oo
ker
_stu
dio
5 | July 2017 | LCGC
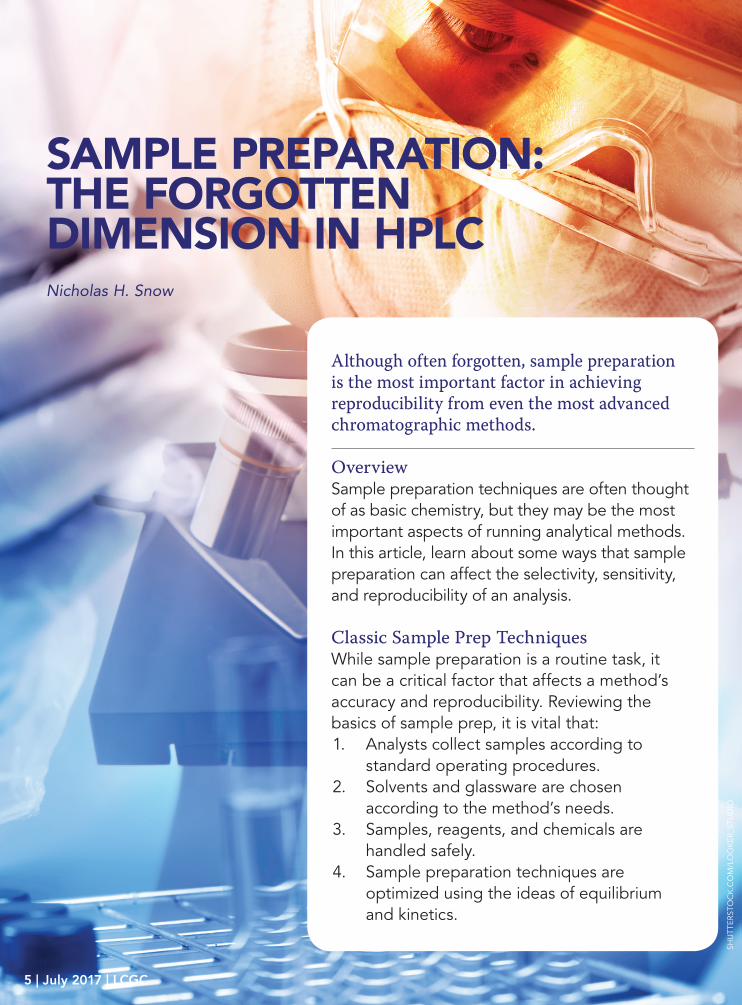
Although often forgotten, sample preparation is the most important factor in achieving reproducibility from even the most advanced chromatographic methods.
OverviewSample preparation techniques are often thought of as basic chemistry, but they may be the most important aspects of running analytical methods. In this article, learn about some ways that sample preparation can affect the selectivity, sensitivity, and reproducibility of an analysis.
Classic Sample Prep TechniquesWhile sample preparation is a routine task, it can be a critical factor that affects a method’s accuracy and reproducibility. Reviewing the basics of sample prep, it is vital that:1. Analysts collect samples according to standard operating procedures.
2. Solvents and glassware are chosen according to the method’s needs.
3. Samples, reagents, and chemicals are handled safely.
4. Sample preparation techniques are optimized using the ideas of equilibrium and kinetics.
Sample preparatIon: tHe Forgotten DImenSIon In HplCNicholas H. Snow

6 | July 2017 | LCGC
FIltratIonHIgH-tHroUgHpUt Sample prep
Sample prep trenDS
Sample prep overvIew
5. Samples are kept as clean as possible.Sample preparation requires precise
handling and manipulation of samples from the time they enter the lab until the vial is placed on the tray. One should always think about which steps of the sample handling process could enable hidden errors to creep into the method.
Several techniques are used in sample preparation, ranging from well-established procedures like weighing, dilution, and filtration, to relatively new technologies like QuEChERS. The results from two recent surveys about the popularity of sample preparation techniques are shown in Figure 1. Older methods are by far the most common.
The process of turning a raw sample into
a form that is ready to be injected into an instrument can require numerous steps, each with its own potential for introducing variance to the method. Gravitmetric steps often have the fewest errors associated with them, assuming the balances are properly maintained and calibrated, and proper operating procedures are used. Dilutions, on the other hand, are often a neglected source of variance.
Glassware choice. It is common to do simple dilutions in volumetric glassware. It is imperative to use good techniques and avoid bad practices that can negatively affect quantitative analysis. For instance, one may be introducing precision and accuracy errors into the method by using smaller glassware, which is chosen for smaller
Figure 1: Popularity of sample preparation techniques.Source: D.E. Raynie, LCGC North America, 34(3), 174–188 (2016).
Red = 2015 Blue = 2013

7 | July 2017 | LCGC
FIltratIonHIgH-tHroUgHpUt Sample prep
Sample prep trenDS
samples. Larger flasks for larger samples offer better precision, at least on a percentage basis. In addition, when using nonaqueous solvents, analysts may also see some small errors in working with volumetric glassware because they were calibrated for water.
Class A glassware has a known tolerance that should be considered, and is higher for smaller volumes. For example, a 250-mL volumetric flask has a tolerance of 0.048%, while a 10-mL flask is 0.20%. Performing serial dilutions is a good way to save on the use of solvent, but introduces extra steps into the process. Each step comes with additional uncertainty, which can accumulate.
The same rule applies to pipettes, with the smallest variance resulting from the larger volumes. The type of pipette also matters. Volumetric transfer pipettes have the tightest tolerances. Graduated seriological pipettes can be an order of magnitude worse, and syringes and automatic pipettors are the worst. It is also good to keep in mind that plastic pipette tips have an added complication: There is a high surface area-to-volume ratio and a plastic surface has the possibility of adsorbing hydrophobic analytes.
Glassware condition. The condition and arrangement of glassware are also important. When flasks are shipped from the factory, they are paired with well-fitting stoppers. These items invariably become separated during cleaning and normal use. While it is not critical to keep a flask paired with its original stopper, there is enough
variance that blindly picking a stopper from the drawer could result in a poor fit. If a leak occurs during the inversion and mixing step, some solvent will be lost and the concentration will be thrown off.
One way to check to see if a leak is present is to insert the lid and see if any ground glass is visible. If there is, switch to another lid until no ground glass can be seen.
Last, glassware has a finite lifespan. The volume of a heavily used flask will drift over time. If the etched labeling on the side of the glassware is no longer legible, it might be time to consider replacing it.
In a nutshell, one must remember (especially when faced with reproducibility challenges) that volumetric flasks and pipettes can be the source of small experimental errors. Such errors have the potential to add up to a potential larger error in the method that may or may not be tolerable.
Solvent mixing. Mixing aqueous and nonaqueous solvents results in a change of volume. Whenever possible, the mixing of two solvents inside a volumetric flask should be avoided or minimized. Although it adds a step, it is better to prepare the solvent mixture beforehand and then use it in the volumetric glassware.
Safety. Safety is also an important consideration in any laboratory procedure. Proper solvent handling, such as aliquoting and secondary containment, are essential. Having standard operating procedures (SOPs) in place for solvent handling has many benefits. Not only
Sample prep overvIew
8 | July 2017 | LCGC
FIltratIonHIgH-tHroUgHpUt Sample prep
Sample prep trenDS
do SOPs improve safety, but they also increase the reproducibility of the analysis. This can include simple things such as aliquoting the needed solvent from the bottle rather than pipetting directly, which can lead to contamination.
Solvent choices are not absolute. There are times when a slightly suboptimal solvent is acceptable if it greatly reduces the risk associated with a procedure.
Safety considerations become particularly important when working with pure standards of highly toxic compounds.
Phase Equilibrium and KineticsMany sample preparation techniques are separations in their own right, including liquid–liquid extractions (LLE), solid-phase extraction (SPE), solid-phase microextraction (SPME), head space analysis, and QuEChERS. They depend on the partitioning of the compounds between
the solution and a separate phase. In some cases, the goal is to capture the analyte, and in others, it is to remove interferences. For any partitioning separation, two important parameters that must be kept in mind are equilibrium and kinetics.
LLE. LLE is simple, easily understood, and relatively inexpensive, although it is not always easily adapted to automation. The figure of merit for an LLE is the distribution constant (K), which is defined as the ratio of the concentration of the analyte in the two phases at equilibrium. When extracting from an aqueous phase to an organic phase, a high value of K means that the analyte will preferentially partition into the organic phase while a low value means that the concentration in the aqueous phase will be higher. If the value of the distribution constant is not known, it may be useful to do a quick experiment to get a rough approximation.
Theory – Multiple Extractions
18
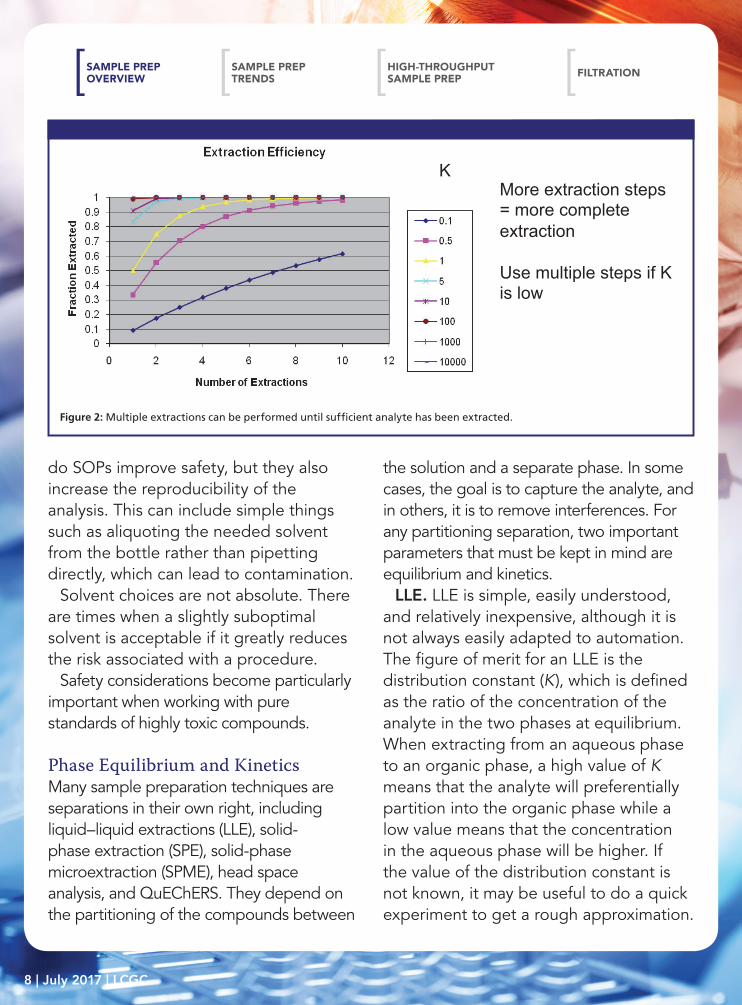
K More extraction steps = more complete extraction Use multiple steps if K is low
Figure 2: Multiple extractions can be performed until sufficient analyte has been extracted.
Sample prep overvIew

9 | July 2017 | LCGC
FIltratIonHIgH-tHroUgHpUt Sample prep
Sample prep trenDS
For most applications, the analyst is attempting to extract the analytes from the aqueous sample into an organic phase. For this, the value of K will ideally be high, but it will never be infinite. There will always be some fraction of analyte remaining, but near-quantitative extractions are possible. A low value of K is not necessarily a point of failure, however, as multiple extractions can be performed until sufficient analyte has been extracted, as seen in Figure 2. The fraction removed is shown as a function of the number of repeated extractions for several values of K. Sufficiently complete collection of the analyte is possible even with relatively weak extraction conditions. The trade-off is analyst time, solvent use, and the concentration of the resulting extract.
The kinetics of the partitioning must be kept in mind. The mixture should be shaken long enough for the partitioning to occur, and given enough time to settle so that the phases can reach equilibrium. Failure to do so can introduce substantial errors. Mechanical shakers can be valuable as a way of ensuring the mixtures are subjected to the same conditions each time.
It is important to remember that the distribution constant represents the concentration, not fraction removed. When the ratio of the volumes of the two phases is high (e.g., small volume of organic phase exposed to a high volume of aqueous phase), then a high value of K is needed or only a small fraction of the compound will be removed. Fortunately,
the extraction does not have to be complete if it is reproducible.
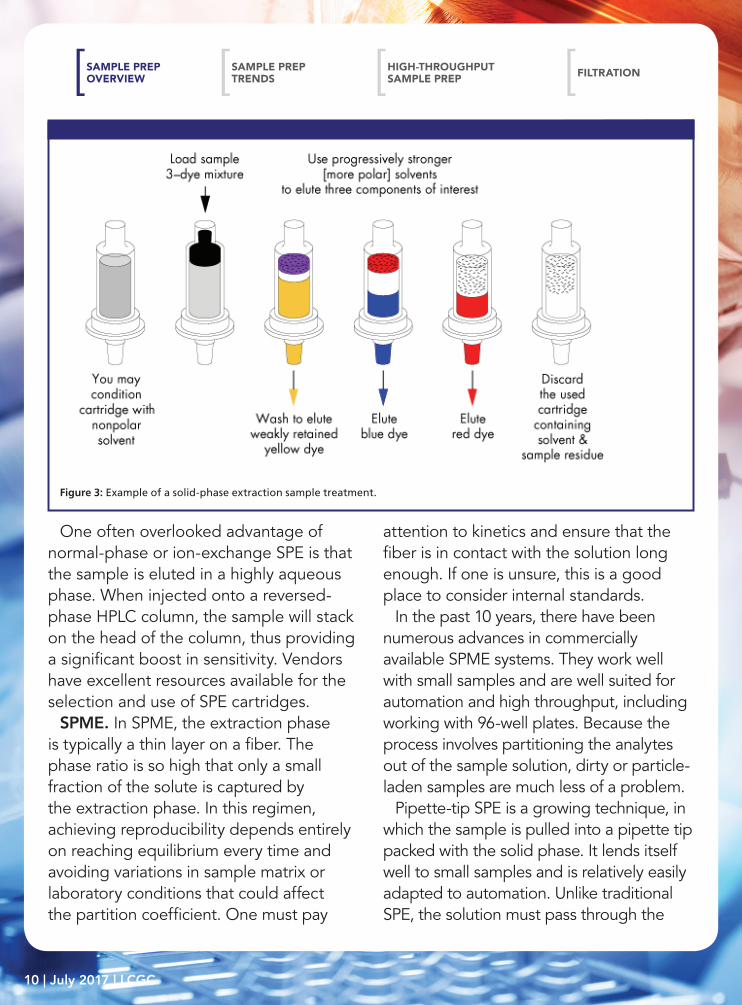
SPE. SPE is one example where nearly all of the analyte can be captured in the bed. Figure 3 shows an example of an SPE sample treatment. The sample is forced through the bed with either positive pressure from above or vacuum below. During the loading step, the solvent must be weak relative to the stationary phase within the column. The more strongly the analytes are bound, the tighter their band will be at the top of the column. During elution, a stronger solvent is flushed through, thus removing the solute from the column. Just as in HPLC, step gradients can be used to elute more than one band into separate fractions.
Kinetics are an important factor in SPE. The packed beds use larger particles than HPLC, meaning the rate of mass transfer is much slower. Driving the solution through the bed too quickly will result in some analyte passing completely through before it can be captured by the stationary phase. Sometimes, the difference between high and low reproducibility comes down to the strength of the vacuum system used to pull samples through the SPE cartridges.
When preparing samples for HPLC, the obvious choice might be to pick an SPE cartridge with a similar chemistry to the LC column. While this kind of cleanup has value, using a chemistry that is orthogonal to your subsequent separation is more likely to selectively remove compounds other than the intended analyte.
Sample prep overvIew
10 | July 2017 | LCGC
FIltratIonHIgH-tHroUgHpUt Sample prep
Sample prep trenDS
One often overlooked advantage of normal-phase or ion-exchange SPE is that the sample is eluted in a highly aqueous phase. When injected onto a reversed-phase HPLC column, the sample will stack on the head of the column, thus providing a significant boost in sensitivity. Vendors have excellent resources available for the selection and use of SPE cartridges.
SPME. In SPME, the extraction phase is typically a thin layer on a fiber. The phase ratio is so high that only a small fraction of the solute is captured by the extraction phase. In this regimen, achieving reproducibility depends entirely on reaching equilibrium every time and avoiding variations in sample matrix or laboratory conditions that could affect the partition coefficient. One must pay
attention to kinetics and ensure that the fiber is in contact with the solution long enough. If one is unsure, this is a good place to consider internal standards.
In the past 10 years, there have been numerous advances in commercially available SPME systems. They work well with small samples and are well suited for automation and high throughput, including working with 96-well plates. Because the process involves partitioning the analytes out of the sample solution, dirty or particle-laden samples are much less of a problem.
Pipette-tip SPE is a growing technique, in which the sample is pulled into a pipette tip packed with the solid phase. It lends itself well to small samples and is relatively easily adapted to automation. Unlike traditional SPE, the solution must pass through the
Normal Phase SPE
27
www.waters.com
Figure 3: Example of a solid-phase extraction sample treatment.
Sample prep overvIew

11 | July 2017 | LCGC
FIltratIonHIgH-tHroUgHpUt Sample prep
Sample prep trenDS
bed in two directions, first being drawn in and then flushed out. This places somewhat tighter restrictions on the need to have a high partition coefficient. An analyte that is only weakly bound will tend to be flushed out again. However, this feature is arguably an advantage when there are large amounts of a weakly bound interferant. In addition, clogging issues are somewhat alleviated as the head of the column is effectively backwashed each time.
QuEChERS. In recent years, a new technique has become quite popular, and is known as QuEChERS, an acronym for quick, easy, cheap, effective, rugged, and safe. In a typical application, the sample is homogenized and extracted using an organic solvent such as acetonitrile or ethyl acetate. The organic phase is then isolated and can be dried with magnesium sulfate. As a final step, derivatized particles are mixed with the sample to selectively capture unwanted sample components and then separated via centrifuge. Several surface chemistries of the particles are available, including primary secondary amines for sugars, organic acids, and lipids; graphitized carbon black for aromatic and conjugated compounds such as carotenoids and chlorophyll; and C18 for highly nonpolar compounds.
Unlike many of the other methods, the SPE is being used as a one-way means of removing what is not wanted from the sample. The QuEChERS method has quickly been adapted to such wide-ranging applications as pharmaceutical
drugs in blood, preservatives in pet food, and acrylamide in fried food.
ConclusionSample preparation is very often the biggest source of variance for a method, making it the most important factor to control and design well. It is often neglected because it constitutes the cheaper, more mundane part of any method. One cannot always rely on the column to make up for an insufficiently selective sample preparation. Likewise, even a mass spectrometer with the highest resolving power is still susceptible to ion suppression from an insufficiently purified sample matrix. Separations of any kind work best with clean samples, and instruments require less maintenance. Well-established and standardized techniques can minimize variance, whether day-to-day, person-to-person, or lab-to-lab.
Many sample prep techniques are separations in their own right, whether LLE, SPE, SPME, QuEChERS, or another solid-phase method. Treating them as a potentially orthogonal dimension to a primary separation is a useful way to simplify an otherwise complex sample. As with all separations, being mindful of both the equilibrium and the kinetics of that separation is important to both the sensitivity and reproducibility of a method.
Nicholas H. Snow, PhDis a professor of chemistry and biochemistry at Seton Hall University.
Sample prep overvIew

Choose Whatman™ products to increase lab consistency and standardize your membrane for a broad range of solvents.
Leave the filtration to us: We have your back!
Filtration should just work
gelifesciences.comGE, the GE Monogram, and Whatman are trademarks of General Electric Company. © 2017 General Electric Company. GE Healthcare Bio-Sciences Corp., 100 Results Way, Marlborough, MA 01752 USAFor local office contact information, visit gelifesciences.com/contact
29273661 AA 06/2017
get
ty Im
ag
es/x
xx
xx
xx
x
SPONSORED
HPLC Sample Preparation: A Study Using Whatman Brand Filtration Devices
Click here to read
the study
13 | July 2017 | LCGC
This article compares the results obtained from a recent survey on sample preparation techniques with the results of previous surveys from 1991 to March 2013. The survey investigated trends in areas such as technologies currently being used, sample loads, sample sizes, automation, the use of solid-phase extraction (SPE) devices (cartridges, disks, plates, tips), SPE chemistries, selection criteria, and problems encountered. Respondents were also asked about sample preparation technologies on the horizon.
While the field of sample preparation has languished behind advances in modern chromatography, significant advances have been made in the past generation. These advances and the trends emanating from them have been the subject of periodic surveys reported in the LCGC “Sample Prep Perspectives” column (1–5). While a great many laboratories are hanging on to older, traditional methods of sample preparation, others are adopting newer techniques developed over the past generation. Here, not only do we assess the current state of the field, but the timing of the current survey allows us to look at longer trends over the past quarter century.
trenDS In Sample preparatIonDouglas E. Raynie
14 | July 2017 | LCGC
FIltratIonHIgH-tHroUgHpUt Sample prep
Sample prep overvIew
Sample prep trenDS
As in previous iterations of the survey, LCGC North America sent an Internet-based survey to a statistically representative group of readers during the last quarter of 2015, nearly two years after the most recent survey (5). The survey used a similar set of questions as those administered previously. Although the response rate was down from the 2013 survey (5), it is still sufficient to yield useful conclusions. This installment summarizes the survey results and observes trends in sample preparation for chromatography.
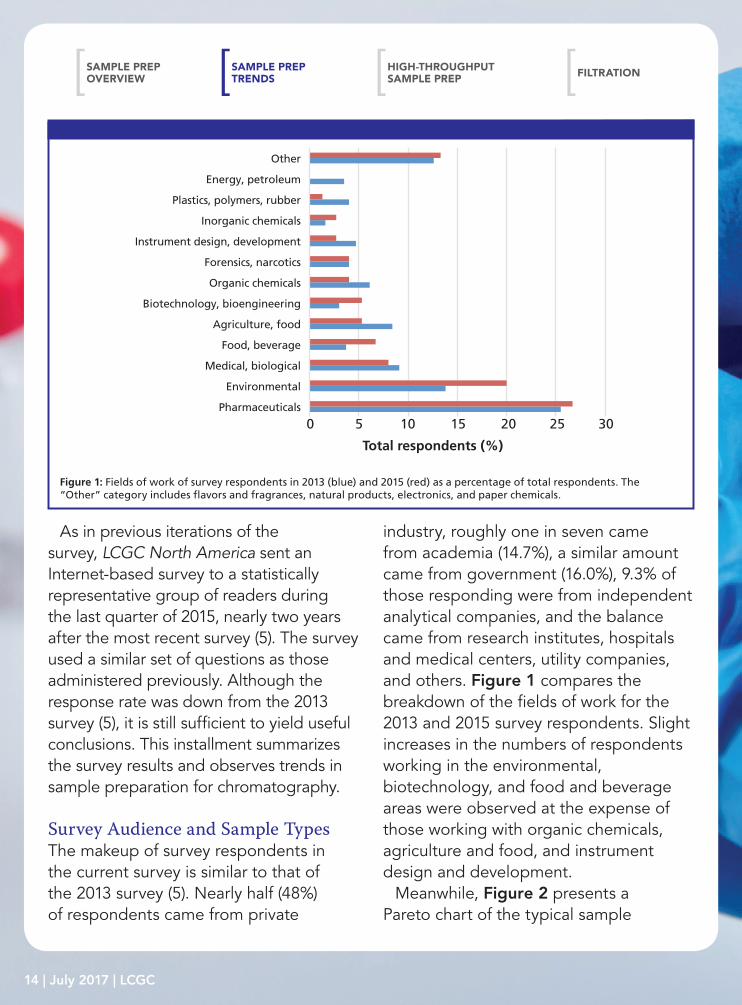
Survey Audience and Sample TypesThe makeup of survey respondents in the current survey is similar to that of the 2013 survey (5). Nearly half (48%) of respondents came from private
industry, roughly one in seven came from academia (14.7%), a similar amount came from government (16.0%), 9.3% of those responding were from independent analytical companies, and the balance came from research institutes, hospitals and medical centers, utility companies, and others. Figure 1 compares the breakdown of the fields of work for the 2013 and 2015 survey respondents. Slight increases in the numbers of respondents working in the environmental, biotechnology, and food and beverage areas were observed at the expense of those working with organic chemicals, agriculture and food, and instrument design and development.
Meanwhile, Figure 2 presents a Pareto chart of the typical sample
Pharmaceuticals
Environmental
Medical, biological
Food, beverage
Agriculture, food
Biotechnology, bioengineering
Organic chemicals
Forensics, narcotics
Instrument design, development
Inorganic chemicals
Plastics, polymers, rubber
Energy, petroleum
Other
0 5 10 15 20 25 30
Total respondents (%)
Figure 1: Fields of work of survey respondents in 2013 (blue) and 2015 (red) as a percentage of total respondents. The “Other” category includes flavors and fragrances, natural products, electronics, and paper chemicals.
15 | July 2017 | LCGC
FIltratIonHIgH-tHroUgHpUt Sample prep
Sample prep overvIew
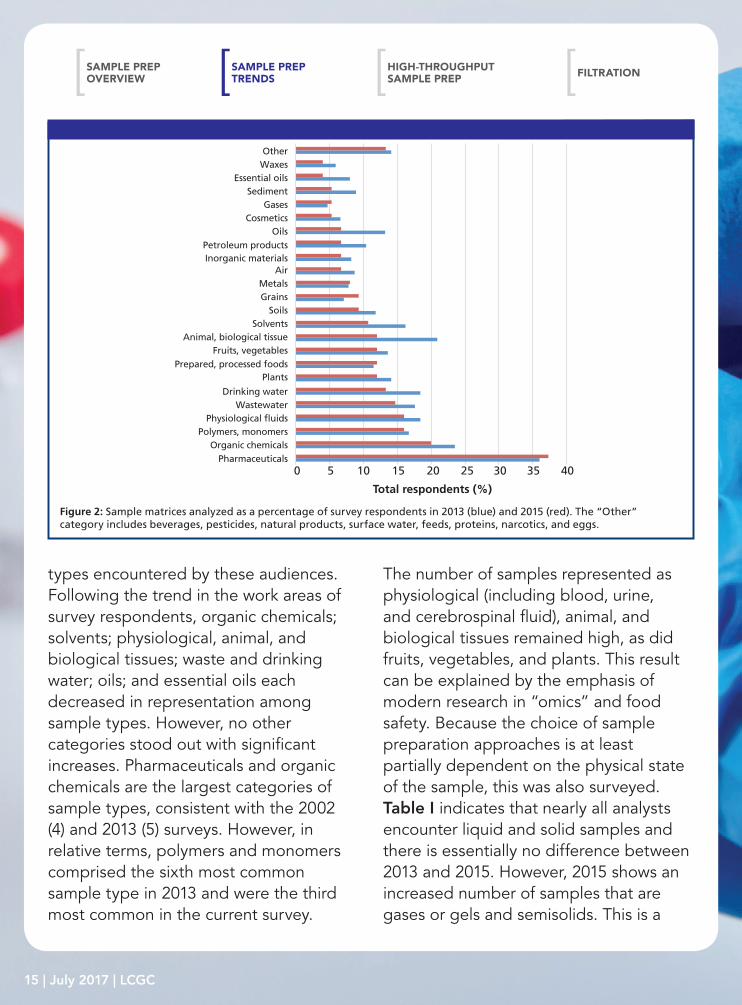
types encountered by these audiences. Following the trend in the work areas of survey respondents, organic chemicals; solvents; physiological, animal, and biological tissues; waste and drinking water; oils; and essential oils each decreased in representation among sample types. However, no other categories stood out with significant increases. Pharmaceuticals and organic chemicals are the largest categories of sample types, consistent with the 2002 (4) and 2013 (5) surveys. However, in relative terms, polymers and monomers comprised the sixth most common sample type in 2013 and were the third most common in the current survey.
The number of samples represented as physiological (including blood, urine, and cerebrospinal fluid), animal, and biological tissues remained high, as did fruits, vegetables, and plants. This result can be explained by the emphasis of modern research in “omics” and food safety. Because the choice of sample preparation approaches is at least partially dependent on the physical state of the sample, this was also surveyed. Table I indicates that nearly all analysts encounter liquid and solid samples and there is essentially no difference between 2013 and 2015. However, 2015 shows an increased number of samples that are gases or gels and semisolids. This is a
0 5 10 15 20 25 30 35 40
Total respondents (%)
Inorganic materialsPetroleum products
OilsCosmetics
GasesSediment
Essential oilsWaxesOther
PlantsPrepared, processed foods
Fruits, vegetablesAnimal, biological tissue
SolventsSoils
Grains
PharmaceuticalsOrganic chemicals
Polymers, monomersPhysiological �uids
WastewaterDrinking water
MetalsAir
Figure 2: Sample matrices analyzed as a percentage of survey respondents in 2013 (blue) and 2015 (red). The “Other” category includes beverages, pesticides, natural products, surface water, feeds, proteins, narcotics, and eggs.
Sample prep trenDS
16 | July 2017 | LCGC
FIltratIonHIgH-tHroUgHpUt Sample prep
Sample prep overvIew
dramatic increase compared to the results presented in 1996 (3). While the question was asked slightly differently 20 years ago, if we normalize the results to the most prevalent physical state each year, only about 17.5% of analysts encountered gas samples in 1996, while about 70% did in 2015. The increase is only slightly less dramatic for gels and semisolid samples,
about 42.5% in 1996 compared with nearly 70% in 2015.
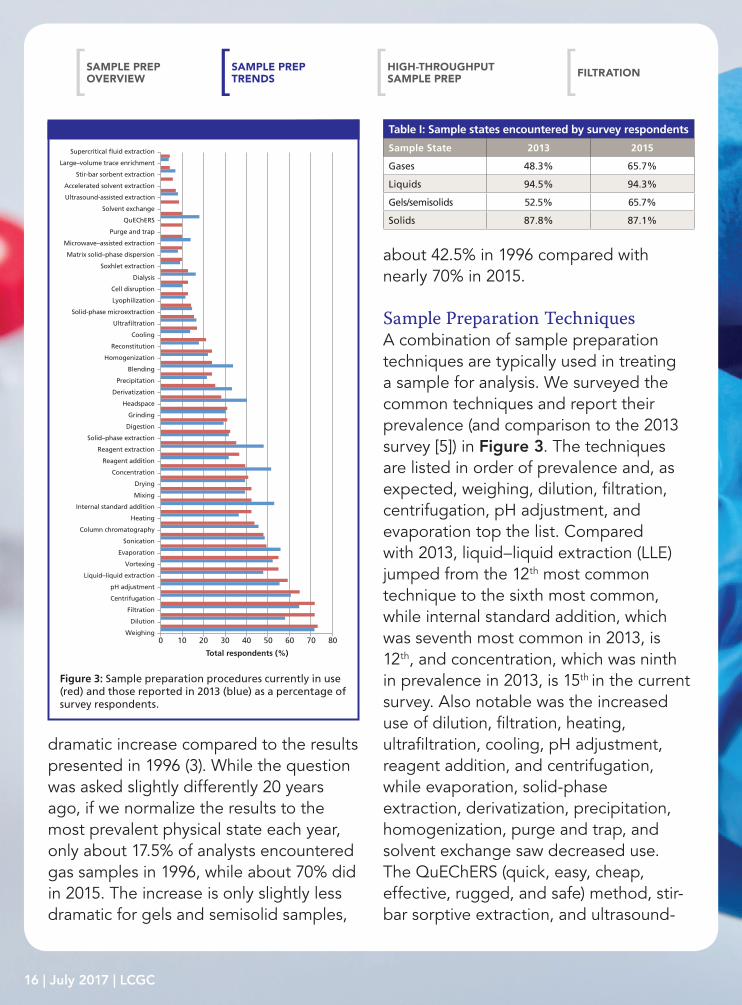
Sample Preparation TechniquesA combination of sample preparation techniques are typically used in treating a sample for analysis. We surveyed the common techniques and report their prevalence (and comparison to the 2013 survey [5]) in Figure 3. The techniques are listed in order of prevalence and, as expected, weighing, dilution, filtration, centrifugation, pH adjustment, and evaporation top the list. Compared with 2013, liquid–liquid extraction (LLE) jumped from the 12th most common technique to the sixth most common, while internal standard addition, which was seventh most common in 2013, is 12th, and concentration, which was ninth in prevalence in 2013, is 15th in the current survey. Also notable was the increased use of dilution, filtration, heating, ultrafiltration, cooling, pH adjustment, reagent addition, and centrifugation, while evaporation, solid-phase extraction, derivatization, precipitation, homogenization, purge and trap, and solvent exchange saw decreased use. The QuEChERS (quick, easy, cheap, effective, rugged, and safe) method, stir-bar sorptive extraction, and ultrasound-
100 20 30 40 50 60 70 80
Total respondents (%)
Microwave–assisted extraction
Purge and trap
QuEChERS
Solvent exchange
Accelerated solvent extraction
Ultrasound-assisted extraction
Stir-bar sorbent extraction
Large–volume trace enrichment
Supercritical �uid extraction
Cooling
Ultra�ltration
Solid-phase microextraction
Lyophilization
Cell disruption
Dialysis
Soxhlet extraction
Headspace
Derivatization
Precipitation
Blending
Homogenization
Reconstitution
Concentration
Reagent addition
Reagent extraction
Solid–phase extraction
Digestion
Grinding
Sonication
Column chromatography
Heating
Internal standard addition
Mixing
Drying
Filtration
Dilution
Weighing
Centrifugation
pH adjustment
Liquid–liquid extraction
Vortexing
Evaporation
Matrix solid–phase dispersion
Figure 3: Sample preparation procedures currently in use (red) and those reported in 2013 (blue) as a percentage of survey respondents.
Table I: Sample states encountered by survey respondents
Sample State 2013 2015
Gases 48.3% 65.7%
Liquids 94.5% 94.3%
Gels/semisolids 52.5% 65.7%
Solids 87.8% 87.1%
Sample prep trenDS
17 | July 2017 | LCGC
FIltratIonHIgH-tHroUgHpUt Sample prep
Sample prep overvIew
assisted extraction joined the survey choices and these techniques are seeing use by 5–10% of survey respondents. It is interesting to note that each of the techniques for which movement in usage was observed involve the use of liquid samples or liquid extracts of solid samples. Meanwhile, the newcomers to the survey (especially QuEChERS and ultrasound-assisted extraction) can be directly applied to solid samples.
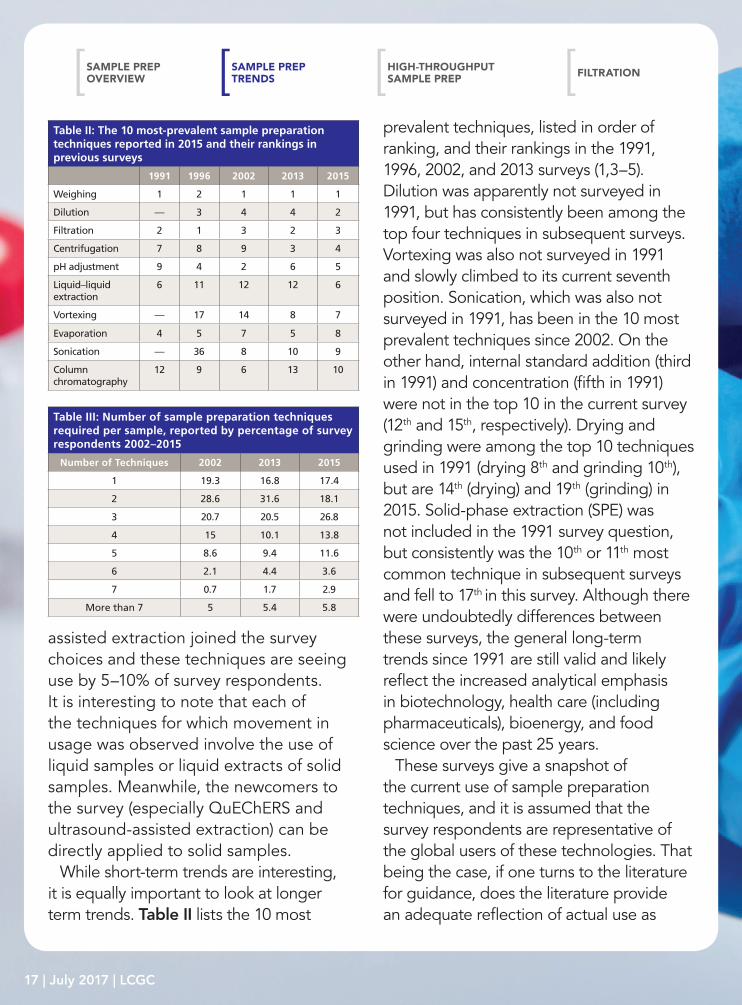
While short-term trends are interesting, it is equally important to look at longer term trends. Table II lists the 10 most
prevalent techniques, listed in order of ranking, and their rankings in the 1991, 1996, 2002, and 2013 surveys (1,3–5). Dilution was apparently not surveyed in 1991, but has consistently been among the top four techniques in subsequent surveys. Vortexing was also not surveyed in 1991 and slowly climbed to its current seventh position. Sonication, which was also not surveyed in 1991, has been in the 10 most prevalent techniques since 2002. On the other hand, internal standard addition (third in 1991) and concentration (fifth in 1991) were not in the top 10 in the current survey (12th and 15th, respectively). Drying and grinding were among the top 10 techniques used in 1991 (drying 8th and grinding 10th), but are 14th (drying) and 19th (grinding) in 2015. Solid-phase extraction (SPE) was not included in the 1991 survey question, but consistently was the 10th or 11th most common technique in subsequent surveys and fell to 17th in this survey. Although there were undoubtedly differences between these surveys, the general long-term trends since 1991 are still valid and likely reflect the increased analytical emphasis in biotechnology, health care (including pharmaceuticals), bioenergy, and food science over the past 25 years.
These surveys give a snapshot of the current use of sample preparation techniques, and it is assumed that the survey respondents are representative of the global users of these technologies. That being the case, if one turns to the literature for guidance, does the literature provide an adequate reflection of actual use as
Table II: The 10 most-prevalent sample preparation techniques reported in 2015 and their rankings in previous surveys
1991 1996 2002 2013 2015
Weighing 1 2 1 1 1
Dilution — 3 4 4 2
Filtration 2 1 3 2 3
Centrifugation 7 8 9 3 4
pH adjustment 9 4 2 6 5
Liquid–liquid extraction
6 11 12 12 6
Vortexing — 17 14 8 7
Evaporation 4 5 7 5 8
Sonication — 36 8 10 9
Column chromatography
12 9 6 13 10
Table III: Number of sample preparation techniques required per sample, reported by percentage of survey respondents 2002–2015
Number of Techniques 2002 2013 2015
1 19.3 16.8 17.4
2 28.6 31.6 18.1
3 20.7 20.5 26.8
4 15 10.1 13.8
5 8.6 9.4 11.6
6 2.1 4.4 3.6
7 0.7 1.7 2.9
More than 7 5 5.4 5.8
Sample prep trenDS
18 | July 2017 | LCGC
FIltratIonHIgH-tHroUgHpUt Sample prep
Sample prep overvIew
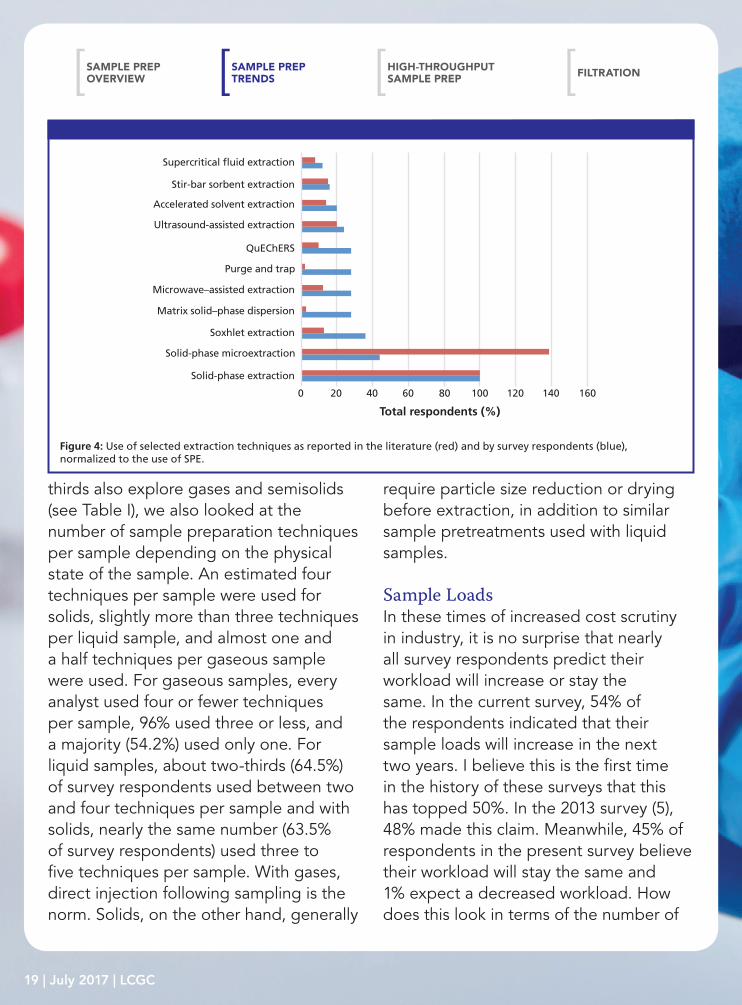
indicated by the LCGC survey? To address this concern, I performed a quick keyword search on selected extraction techniques using Sci-Finder. The results presented in Figure 4 are normalized to the use of SPE. While a strong correlation (correlation coefficient = 0.6798) is found between the literature and survey results, these trends are not immediately apparent upon first looking at the data. With the exception of solid-phase microextraction (SPME), for each technique the relative literature reports lag the use by survey respondents, sometimes quite dramatically. This lag may be due to the reality that, by definition, articles in peer-reviewed journals are research-based, rather than reflecting more routine use of these methods. Additionally, the trends observed in Figure 4 may be indicative of the service, or enabling, role played by extraction in support of analytical research.
Looking at future use, Majors reported (5) that SPME, microwave-assisted extraction, accelerated solvent extraction (also called pressurized fluid [liquid] extraction), SPE, headspace sampling, and supercritical fluid extraction (SFE) were expected to see increased use, according to the 2013 survey respondents. Looking at the current survey results, only microwave-assisted extraction and headspace sampling actually saw increased use, and SPE remained steady; the other techniques saw slightly less use. In the 2015 survey, respondents expressed plans to use derivatization, QuEChERS,
and SPME. Other techniques also receiving mild attention were accelerated solvent extraction, evaporation, homogenization, internal standard addition, large-volume trace enrichment, matrix solid-phase dispersion, microwave-assisted extraction, solvent exchange, SFE, and ultrasound-assisted extraction. These plans seem to both address changes in the analytical challenges because of emerging sample types and indicate a maturation of once-emerging technologies.
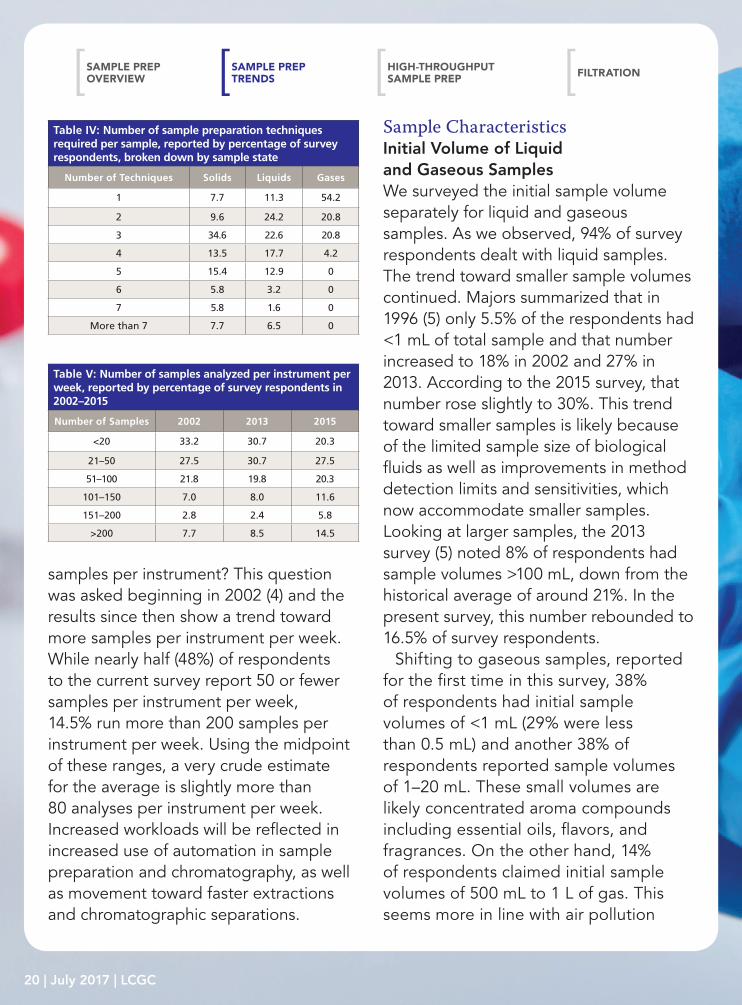
In nearly every analysis (or 82.6% of analyses according to the 2015 survey), more than one pretreatment step is needed. This ignores, for example, direct injection of gaseous samples or direct injection methods used with mass spectrometry (MS). Table III reports the number of sample preparation techniques required per sample in the three most recent surveys. In 2002 and 2013, 52% of respondents were reported to use three or more techniques per sample (4,5). That number has jumped to 65% in the current survey. My estimation is that approximately 3.5 techniques are used per sample, up from about three per sample previously. This is logical as most samples will be measured by mass or volume, extracted, and then have their solvent volume adjusted. Additional manipulations like cleanup, pH adjustment, addition of internal standards, and so forth, add to the sample treatment. Recalling that the great majority of survey respondents handle both solid and liquid samples and two-
Sample prep trenDS
19 | July 2017 | LCGC
FIltratIonHIgH-tHroUgHpUt Sample prep
Sample prep overvIew
thirds also explore gases and semisolids (see Table I), we also looked at the number of sample preparation techniques per sample depending on the physical state of the sample. An estimated four techniques per sample were used for solids, slightly more than three techniques per liquid sample, and almost one and a half techniques per gaseous sample were used. For gaseous samples, every analyst used four or fewer techniques per sample, 96% used three or less, and a majority (54.2%) used only one. For liquid samples, about two-thirds (64.5%) of survey respondents used between two and four techniques per sample and with solids, nearly the same number (63.5% of survey respondents) used three to five techniques per sample. With gases, direct injection following sampling is the norm. Solids, on the other hand, generally
require particle size reduction or drying before extraction, in addition to similar sample pretreatments used with liquid samples.
Sample LoadsIn these times of increased cost scrutiny in industry, it is no surprise that nearly all survey respondents predict their workload will increase or stay the same. In the current survey, 54% of the respondents indicated that their sample loads will increase in the next two years. I believe this is the first time in the history of these surveys that this has topped 50%. In the 2013 survey (5), 48% made this claim. Meanwhile, 45% of respondents in the present survey believe their workload will stay the same and 1% expect a decreased workload. How does this look in terms of the number of
200 40 60 80 100 120 140 160
Total respondents (%)
Solid-phase microextraction
Soxhlet extraction
Matrix solid–phase dispersion
Microwave–assisted extraction
QuEChERS
Purge and trap
Accelerated solvent extraction
Ultrasound-assisted extraction
Stir-bar sorbent extraction
Supercritical �uid extraction
Solid-phase extraction
Figure 4: Use of selected extraction techniques as reported in the literature (red) and by survey respondents (blue), normalized to the use of SPE.
Sample prep trenDS
20 | July 2017 | LCGC
FIltratIonHIgH-tHroUgHpUt Sample prep
Sample prep overvIew
samples per instrument? This question was asked beginning in 2002 (4) and the results since then show a trend toward more samples per instrument per week. While nearly half (48%) of respondents to the current survey report 50 or fewer samples per instrument per week, 14.5% run more than 200 samples per instrument per week. Using the midpoint of these ranges, a very crude estimate for the average is slightly more than 80 analyses per instrument per week. Increased workloads will be reflected in increased use of automation in sample preparation and chromatography, as well as movement toward faster extractions and chromatographic separations.
Sample CharacteristicsInitial Volume of Liquid and Gaseous SamplesWe surveyed the initial sample volume separately for liquid and gaseous samples. As we observed, 94% of survey respondents dealt with liquid samples. The trend toward smaller sample volumes continued. Majors summarized that in 1996 (5) only 5.5% of the respondents had <1 mL of total sample and that number increased to 18% in 2002 and 27% in 2013. According to the 2015 survey, that number rose slightly to 30%. This trend toward smaller samples is likely because of the limited sample size of biological fluids as well as improvements in method detection limits and sensitivities, which now accommodate smaller samples. Looking at larger samples, the 2013 survey (5) noted 8% of respondents had sample volumes >100 mL, down from the historical average of around 21%. In the present survey, this number rebounded to 16.5% of survey respondents.
Shifting to gaseous samples, reported for the first time in this survey, 38% of respondents had initial sample volumes of <1 mL (29% were less than 0.5 mL) and another 38% of respondents reported sample volumes of 1–20 mL. These small volumes are likely concentrated aroma compounds including essential oils, flavors, and fragrances. On the other hand, 14% of respondents claimed initial sample volumes of 500 mL to 1 L of gas. This seems more in line with air pollution
Table IV: Number of sample preparation techniques required per sample, reported by percentage of survey respondents, broken down by sample state
Number of Techniques Solids Liquids Gases
1 7.7 11.3 54.2
2 9.6 24.2 20.8
3 34.6 22.6 20.8
4 13.5 17.7 4.2
5 15.4 12.9 0
6 5.8 3.2 0
7 5.8 1.6 0
More than 7 7.7 6.5 0
Table V: Number of samples analyzed per instrument per week, reported by percentage of survey respondents in 2002–2015
Number of Samples 2002 2013 2015
<20 33.2 30.7 20.3
21–50 27.5 30.7 27.5
51–100 21.8 19.8 20.3
101–150 7.0 8.0 11.6
151–200 2.8 2.4 5.8
>200 7.7 8.5 14.5
Sample prep trenDS

21 | July 2017 | LCGC
FIltratIonHIgH-tHroUgHpUt Sample prep
Sample prep overvIew
studies and similar investigations with environmental samples.
Weight of Solid SamplesPreviously, there was no clear trend in the mass of solid samples, with an even distribution of sample sizes reported (5). However, the questions on sample size in this survey were separated by physical state so it is easier to observe trends. As shown in Table VI, 59% of survey respondents stated that they use solid samples of 1 g or less. Turning to larger samples, 17% report sample sizes of 10 g or larger. The mode for sample size appears to be about 0.5 g.
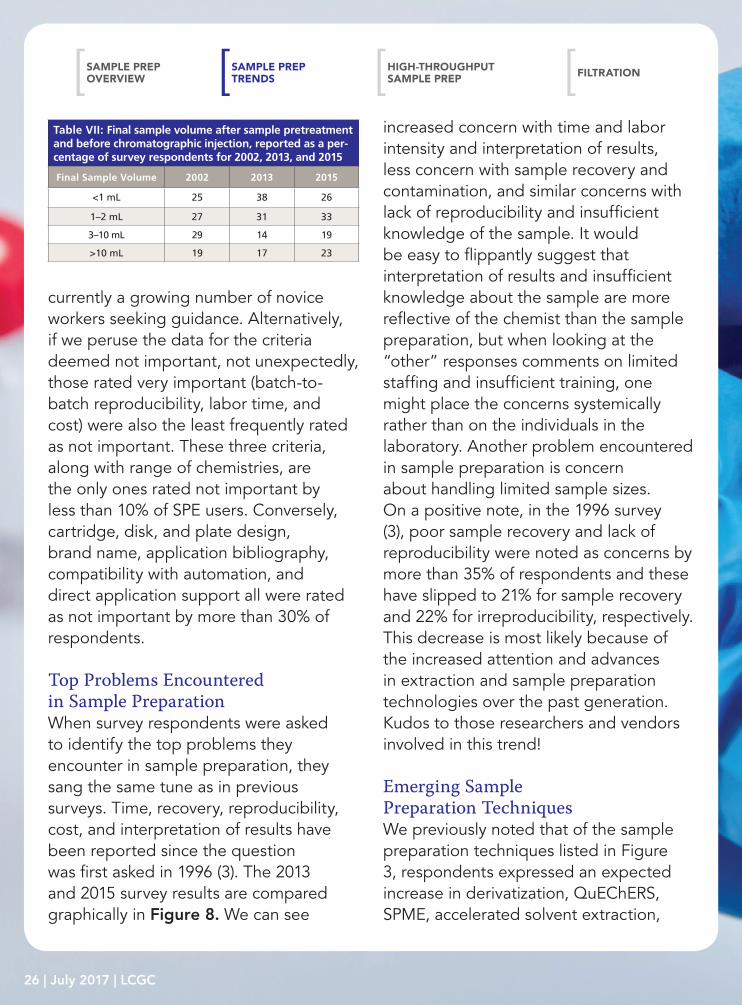
Final Volume of Sample Before InjectionIn most chromatographic methods, the pretreated sample must be in solution before injection onto the column. Often sample aliquots are retained for possible reanalysis. If any trend is gleaned from our survey, it is the shift away from small sample volumes. Table VII compares survey results from 2002 (4) and 2013 (5) with 2015. For sample volumes <1 mL, the 2015 data revert back to that observed in 2002, leading to a continued rise in the number of samples in the 1–2 mL range. Sample volumes greater than 10 mL also saw a sharp increase to 23% of samples. That 59% can be directly accommodated by standard 2-mL autosampler vials is not unexpected, though this is slightly down from 2013 and more aligned with the 2002 results. Regardless, even if one were
to carefully and quantitatively concentrate the sample volume down to 100 µL (quite the challenge, I suspect, for many of us) and we use standard chromatographic injection systems, much less than 10% of our sample actually would make it onto the chromatographic column!
ConcentrationAs in the past two surveys (4,5), there was no change in the initial analyte concentration in the sample belonging to survey respondents. In each survey, 53% of the samples had analyte concentrations of >1 ppm and 47% encountered analyte concentrations of <1 ppm. While there were no apparent trends, Majors (5) discussed the need for extraction and concentration methods like SPE and others that provide the requisite trace enrichment and the use of sensitive detection systems. He also mentioned that analyte derivatization may provide improved detection. Given the potential for derivatization to improve the determination of trace analytes, it is interesting to note that those that use derivatization decreased from 49% in 2013 to 28% in 2015, see Figure 3.
AutomationWith just two years between surveys, dramatic changes in survey results should not be expected. However, if we take another look at the discussion on sample load (see Table V), what follows is perhaps the most dramatic result in
Sample prep trenDS
22 | July 2017 | LCGC
FIltratIonHIgH-tHroUgHpUt Sample prep
Sample prep overvIew
the present survey. The number of survey respondents using automated sample preparation jumped significantly, from 29% in 2013 to 39% in 2015. This change likely follows from what was reported above. Those with more than 200 samples per instrument per week rose from 8.5% to 14.5% and those expecting further increases in their sample load increased from 48% to 54% over the same survey periods. Perhaps to gain further understanding of this trend, we should examine the rationale for those who have not adopted automated sample preparation. Those that state their sample
throughput does not justify automation decreased from 55% in 2013 to 51%. Note that 51% is only slightly more than the 48% who have 50 or fewer samples per instrument per week. At the same time, those that do not consider automated sample preparation necessary (31% versus 27% in 2013) is roughly the same as the number that have fewer than 20 samples per instrument per week plus less than half of those with 21–50. In addition to the sharp increase in those using automated sample preparation, the number planning to use these approaches within next year is also up, from 4% to 7%,
100 20 30 40 6050 70 80
Total respondents (%)
CyanoAminoFlorisil
C4
DiolPSA
C2Cyclohexyl
C1Other
Weak cation exchange
C8Strong cation exchangeStrong anion exchangeWeak anion exchange
PhenylApplication speci�c or proprietary
Af�nity
SilicaC18
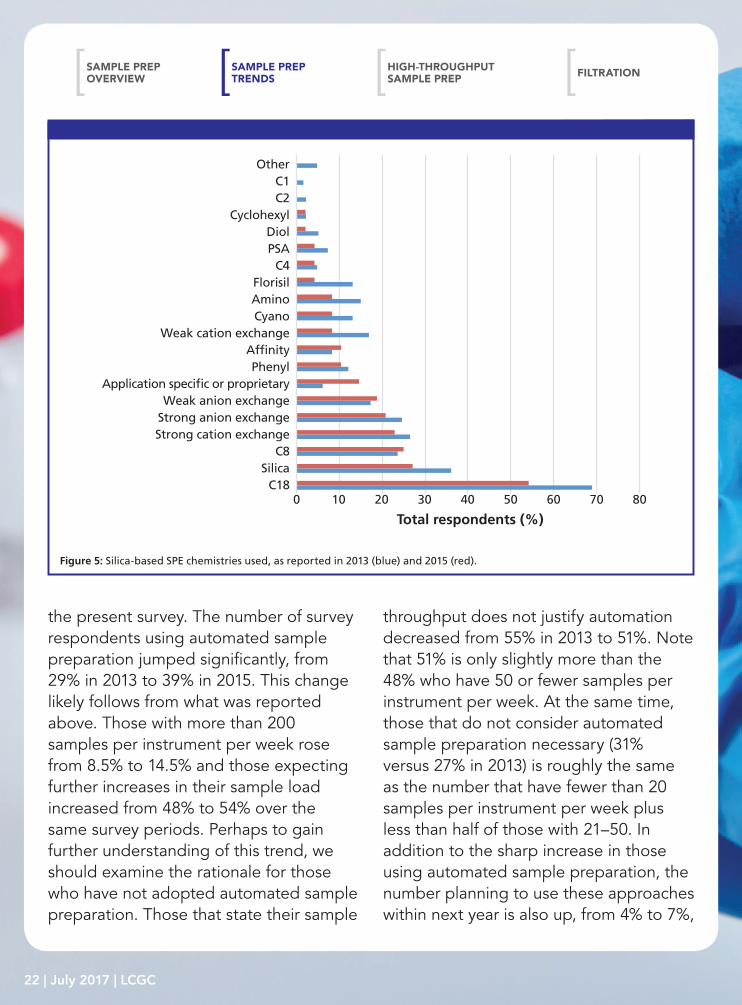
Figure 5: Silica-based SPE chemistries used, as reported in 2013 (blue) and 2015 (red).
Sample prep trenDS
23 | July 2017 | LCGC
FIltratIonHIgH-tHroUgHpUt Sample prep
Sample prep overvIew
and those reviewing its use is the same as in 2013, 11%. Cost as a reason against the use of automated sample preparation also grew, from 24% to 31%.
Regarding the types of automation used, autosamplers still predominate and their use is unchanged from the 2013 survey (83% of those using automation). Full laboratory robotics was up, from 7% to 14%, and use of automated liquid handlers was down, from 17% to 9%, but there was no change in other types of automated equipment.
Solid-Phase ExtractionEach of the previous surveys outlined strong use of SPE among survey respondents. SPE is perhaps the oldest of the “modern” sample preparation
techniques, having been developed in the 1970s, while wide-spread developments of new technologies for the extraction of solid samples such as SFE, accelerated solvent extraction, and microwave-assisted extraction began around 1990. SPE is used for both the extractive isolation of analytes from liquid samples and for the cleanup of post-extraction solutions. A number of techniques based on solute adsorption onto stationary phases, including SPME, stir-bar sorbent extraction, and dispersive SPE (like matrix solid-phase dispersion and QuEChERS), came about at least partially as a result of the advantages of SPE as well as the needs for improvement.
One of the advantages of SPE is the variety of formats available including
50 10 15 20 25 35 4030 45 50
Total respondents (%)
Neutral polymer
Strong cation exchange
Strong anion exchange
Application speci�c or proprietary
Weak anion exchange
Weak cation exchange
Other
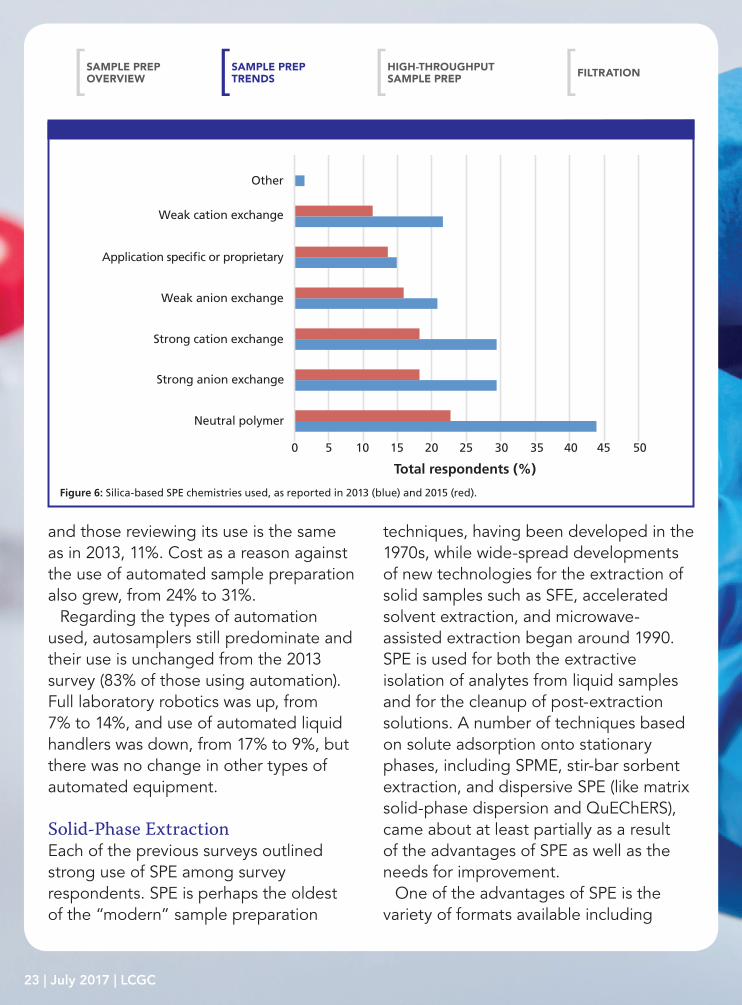
Figure 6: Silica-based SPE chemistries used, as reported in 2013 (blue) and 2015 (red).
Sample prep trenDS

24 | July 2017 | LCGC
FIltratIonHIgH-tHroUgHpUt Sample prep
Sample prep overvIew
cartridges, disks, plates, and pipette tips. The original SPE format was based on syringe cartridges and this remains the most popular choice. Of survey respondents who use SPE, 81% use cartridges, down from 88% two years ago. The overwhelming number of users employ cartridges with 500 mg or less of sorbent, but in 2015 this was down (65%) from just over the historical trend of about 75% of users in 2013 and 2002. Most of this discrepancy can be attributed to those using the smallest amounts of SPE material (<50 mg). This decrease may be explained by the use of other SPE formats, as each of those reported saw remarkable increase in utilization. The disk format has seen growth from use by 24% in the SPE community in 2002 to 37% in 2013 and up to 60% in 2015. The most popular disk size is 47 mm, so the increased use is somewhat puzzling since we reported earlier that drinking and waste water analyses declined. The increased analysis of biological fluids and tissues would explain the increased use of the 96-well plate and pipette tip formats. The high-throughput well format, used for the rapid isolation of solutes in drug discovery and related scenarios, was introduced in 1996 (3) and in less than 20 years has seen its growth expand to 14% of SPE users in 2002, 39% in 2013, and 60% in 2015. There was no consensus regarding the sorbent mass in the well-plate format. Meanwhile in 2013, the pipette tip approach was used by 52% of SPE practitioners, and that has grown to
72% currently. It is interesting to note that if we add the percent of SPE users that employ each format (81% cartridges, 60% disks, 60% plates, and 72% pipette tips), that means each averages 2.7 of the four standard SPE formats in their laboratory.
Turning to the types of phases in SPE, 77% of users claim to employ silica-based phases, 44% use polymeric phases, and 31% use inorganic and other phases. Since the advent of this survey, octadecyl (C18), silica, octyl (C8), and ion-exchange resins have dominated the phase chemistry of silica-based material and that is true again in this survey, see Figure 5. Our desire for analytical selectivity in the sample preparation process is reflected by the growth in the use of affinity and application-specific or proprietary phases. In fact, the use of application-specific phases rose from 6% to 15%. Other than those phases just mentioned, each of the other phases were reported by no more than 10% of SPE users. Regarding polymeric phases, their use was down (44% compared with 62% in 2013). However, as observed in Figure 6, the
Table VI: Solid sample size reported as a percentage of survey respondents
Sample Size Percentage of Respondents
<0.05 g 13.6
0.05–0.1 g 18.6
0.1–0.5 g 18.6
0.5–1.0 g 8.5
1.0–5.0 g 17.0
5.0–10.0 g 6.8
10–50 g 10.2
>50 g 6.8
Sample prep trenDS
25 | July 2017 | LCGC
FIltratIonHIgH-tHroUgHpUt Sample prep
Sample prep overvIew
overall trend in the specific phases used is similar. Finally, of those that use inorganic phases, the use of Florisil and alumina dropped strongly, from 58% in 2013 to 47% currently for Florisil and 54% to 27% for alumina. This is offset somewhat by a sharp increase in the application of graphitized carbon black, increasing from 40% to 60% over the past two years. Graphitized carbon, with a positively charged surface has both reversed-phase and anion-exchange properties and it can retain analytes covering a broad range of polarities.
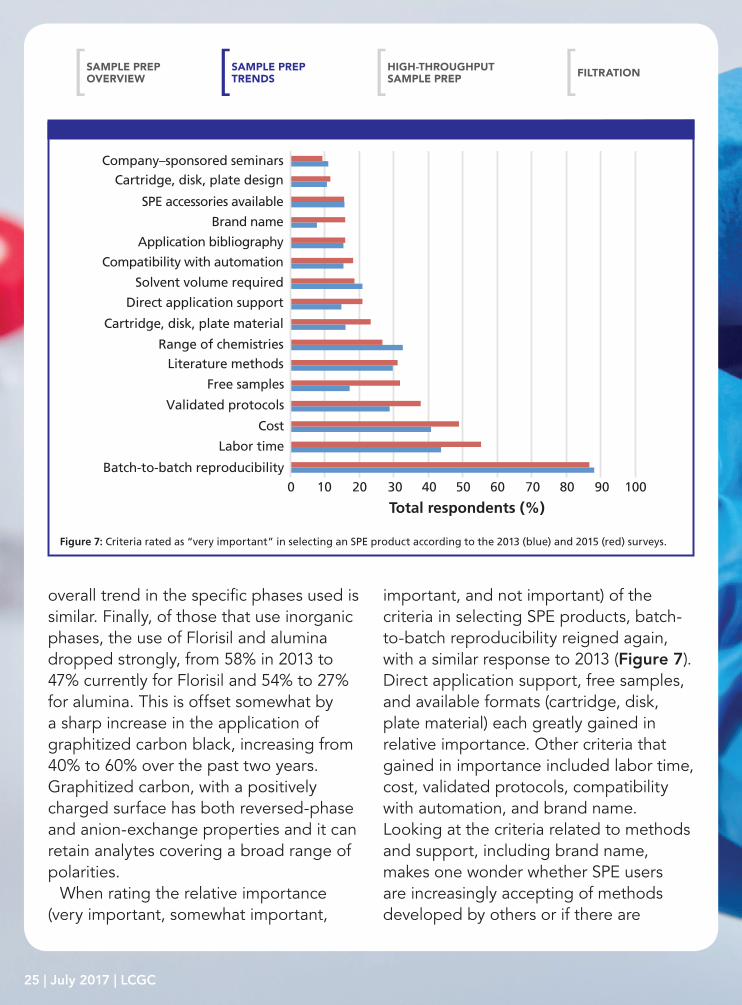
When rating the relative importance (very important, somewhat important,
important, and not important) of the criteria in selecting SPE products, batch-to-batch reproducibility reigned again, with a similar response to 2013 (Figure 7). Direct application support, free samples, and available formats (cartridge, disk, plate material) each greatly gained in relative importance. Other criteria that gained in importance included labor time, cost, validated protocols, compatibility with automation, and brand name. Looking at the criteria related to methods and support, including brand name, makes one wonder whether SPE users are increasingly accepting of methods developed by others or if there are
0 10 20 30 5040 70 8060 90 100
Total respondents (%)
Cost
Labor time
Batch-to-batch reproducibility
Cartridge, disk, plate material
Range of chemistriesLiterature methods
Free samples
Validated protocols
SPE accessories available
Brand name
Application bibliography
Compatibility with automation
Direct application support
Solvent volume required
Cartridge, disk, plate designCompany–sponsored seminars
Figure 7: Criteria rated as “very important” in selecting an SPE product according to the 2013 (blue) and 2015 (red) surveys.
Sample prep trenDS
26 | July 2017 | LCGC
FIltratIonHIgH-tHroUgHpUt Sample prep
Sample prep overvIew
currently a growing number of novice workers seeking guidance. Alternatively, if we peruse the data for the criteria deemed not important, not unexpectedly, those rated very important (batch-to-batch reproducibility, labor time, and cost) were also the least frequently rated as not important. These three criteria, along with range of chemistries, are the only ones rated not important by less than 10% of SPE users. Conversely, cartridge, disk, and plate design, brand name, application bibliography, compatibility with automation, and direct application support all were rated as not important by more than 30% of respondents.
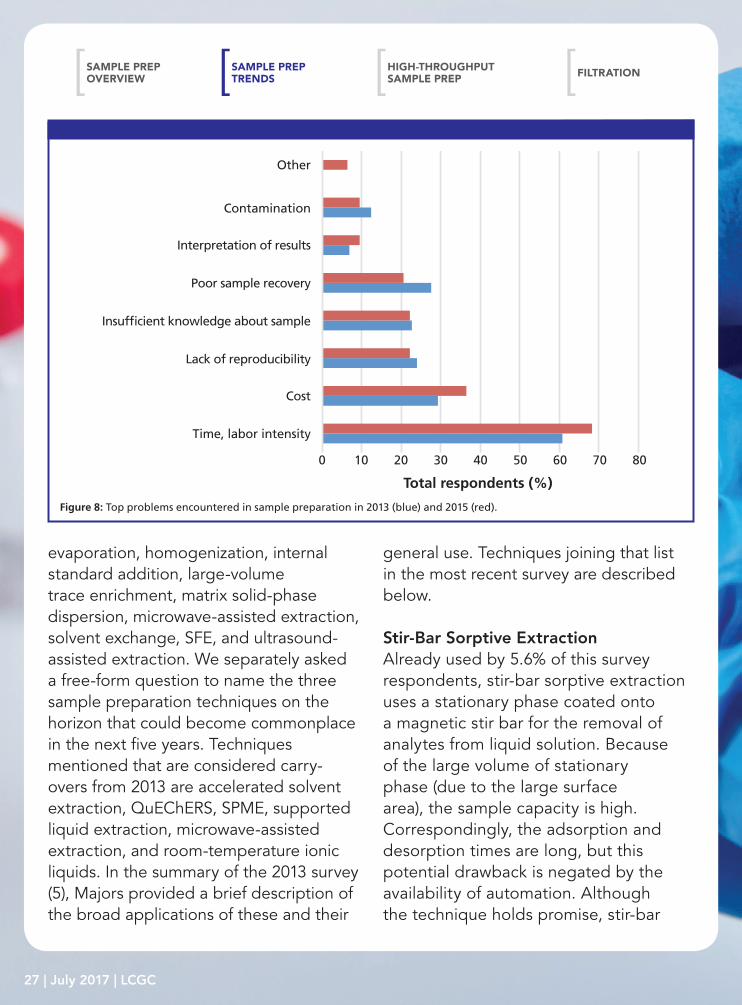
Top Problems Encountered in Sample PreparationWhen survey respondents were asked to identify the top problems they encounter in sample preparation, they sang the same tune as in previous surveys. Time, recovery, reproducibility, cost, and interpretation of results have been reported since the question was first asked in 1996 (3). The 2013 and 2015 survey results are compared graphically in Figure 8. We can see
increased concern with time and labor intensity and interpretation of results, less concern with sample recovery and contamination, and similar concerns with lack of reproducibility and insufficient knowledge of the sample. It would be easy to flippantly suggest that interpretation of results and insufficient knowledge about the sample are more reflective of the chemist than the sample preparation, but when looking at the “other” responses comments on limited staffing and insufficient training, one might place the concerns systemically rather than on the individuals in the laboratory. Another problem encountered in sample preparation is concern about handling limited sample sizes. On a positive note, in the 1996 survey (3), poor sample recovery and lack of reproducibility were noted as concerns by more than 35% of respondents and these have slipped to 21% for sample recovery and 22% for irreproducibility, respectively. This decrease is most likely because of the increased attention and advances in extraction and sample preparation technologies over the past generation. Kudos to those researchers and vendors involved in this trend!
Emerging Sample Preparation TechniquesWe previously noted that of the sample preparation techniques listed in Figure 3, respondents expressed an expected increase in derivatization, QuEChERS, SPME, accelerated solvent extraction,
Table VII: Final sample volume after sample pretreatment and before chromatographic injection, reported as a per-centage of survey respondents for 2002, 2013, and 2015
Final Sample Volume 2002 2013 2015
<1 mL 25 38 26
1–2 mL 27 31 33
3–10 mL 29 14 19
>10 mL 19 17 23
Sample prep trenDS
27 | July 2017 | LCGC
FIltratIonHIgH-tHroUgHpUt Sample prep
Sample prep overvIew
evaporation, homogenization, internal standard addition, large-volume trace enrichment, matrix solid-phase dispersion, microwave-assisted extraction, solvent exchange, SFE, and ultrasound-assisted extraction. We separately asked a free-form question to name the three sample preparation techniques on the horizon that could become commonplace in the next five years. Techniques mentioned that are considered carry-overs from 2013 are accelerated solvent extraction, QuEChERS, SPME, supported liquid extraction, microwave-assisted extraction, and room-temperature ionic liquids. In the summary of the 2013 survey (5), Majors provided a brief description of the broad applications of these and their
general use. Techniques joining that list in the most recent survey are described below.
Stir-Bar Sorptive ExtractionAlready used by 5.6% of this survey respondents, stir-bar sorptive extraction uses a stationary phase coated onto a magnetic stir bar for the removal of analytes from liquid solution. Because of the large volume of stationary phase (due to the large surface area), the sample capacity is high. Correspondingly, the adsorption and desorption times are long, but this potential drawback is negated by the availability of automation. Although the technique holds promise, stir-bar
0 10 20 30 5040 70 8060
Total respondents (%)
Interpretation of results
Poor sample recovery
Insuf�cient knowledge about sample
Lack of reproducibility
Time, labor intensity
Cost
Contamination
Other
Figure 8: Top problems encountered in sample preparation in 2013 (blue) and 2015 (red).
Sample prep trenDS

28 | July 2017 | LCGC
FIltratIonHIgH-tHroUgHpUt Sample prep
Sample prep overvIew
sorptive extraction is limited in the number of stationary phases available and vendors promoting the technique.
Restricted-Access MediaLCGC first reported the use of these materials as liquid chromatography (LC) stationary phases in 1997 (6). Just as the use of other application-specific SPE phases are seeing increased use, it follows that the tremendous selectivity advantages of restricted-access media is of strong interest for high-volume analyses.
Direct Analysis in Real-Time MSWhen introduced about a decade ago, this approach to sample introduction for MS seemed like the panacea—no sample preparation at all. Gas, liquid, and solid samples can be ionized under ambient conditions for MS analysis. After 10 years, the growing pains are being worked out and the promise of the technique may soon be fully realized.
Matrix Solid-Phase DispersionEspecially useful for tissue samples, this dispersive SPE approach is seeing a resurgence because of the similarity with the initial portion of the QuEChERS method. While initially developed for the isolation of pesticides in fruits and vegetables, QuEChERS has been refined as a screening tool for a wide variety of applications. As the myriad applications are sorted out, the matrix solid-phase dispersion technique should settle into its comfort zone.
ConclusionsAlthough sample preparation is still considered a time- and labor-intensive step in an analytical scheme, its importance is undeniable. We have looked at short-term trends in sample preparation over the past two years, especially in the use of automation and newer instrumental extraction techniques. Similarly, some long-term trends during the past 10–25 years of this survey have been noted.
AcknowledgmentI would like to thank those readers who took the time to respond to the rather lengthy survey. The information provided helps to keep all readers up on the latest technology in sample preparation.
References(1) R.E. Majors, LCGC 9(1), 16–20 (1991).(2) R.E. Majors, LCGC 10(12), 912–918 (1992).(3) R.E. Majors, LCGC 14(9), 754–766 (1996).(4) R.E. Majors, LCGC North Am. 20(12), 1098–1113 (2002).(5) R.E. Majors, LCGC North Am. 31(3), 190–202 (2013).(6) K.-S. Boos and A. Rudolphi, LCGC 15(7), 606–611 (1997).
This article originally appeared in LCGC North America, 34 (3), 174–188 (2016).
Sample prep trenDS
Douglas Raynie“Sample Prep Perspectives” editor Douglas E. Raynie is an Associate Research Professor at South Dakota State University. His research interests include green chemistry, alternative solvents, sample preparation, high resolution chromatography, and bioprocessing in supercritical fluids. He earned his PhD in 1990 at Brigham Young University under the direction of Mil-ton L. Lee. He is also a member of LCGC’s editorial advisory board.

gelifesciences.com/hplcGE, GE monogram, and Whatman are trademarks of General Electric Company.© 2017 General Electric Company.GE Healthcare Bio-Sciences AB, Björkgatan 30, 751 84 Uppsala, SwedenFor local office contact information, visit gelifesciences.com/contact.
29273662 AA 06/2017
Stop searching for filtersTrust Whatman™ GE
get
ty Im
ag
es/x
xx
xx
xx
x
SPONSORED
Optimizing QC Lab Workflow
Click here to watch the video
30 | July 2017 | LCGC
Sample preparation has often been viewed as the bottleneck in analytical procedures. Surveys have shown that time is typically the most frequent problem area for sample preparation procedures and that analysts can easily spend a majority of the total analysis time on sample preparation. While newly developed extraction techniques address time, modern chromatography advances are also moving toward faster separations. Based on these considerations, what is high-throughput sample preparation? Do modern extraction methods adequately address the issue of time? How can we address the analytical need for speed?
The self-proclaimed world’s greatest rock and roll band famously sang, “You can’t always get what you want.” It’s easy to apply the Rolling Stones’ admonition to analytical sample preparation because surveys (1–3) have consistently shown that time, along with cost and solvent use, is
explorIng tHe poSSIbIlItIeS oF HIgH-tHroUgHpUt Sample preparatIonDouglas E. Raynie and Ronald E. Majors

31 | July 2017 | LCGC
FIltratIonSample prep trenDS
Sample prep overvIew
HIgH-tHroUgHpUt Sample prep
among the most significant desires of analysts. Traditional sample preparation methods are often the rate-limiting step in the overall sample analysis process. We can envision three approaches for addressing the desire for high-throughput sample preparation: parallel sample processing, automation, and improvements in the process kinetics.
Evolution of High-Throughput Analysis from MicroplatesOver the past several years, we’ve heard increasing calls for high-throughput sample preparation. But what is high-throughput sample preparation? In many cases, high-throughput stems from the high-throughput screening approach to combinatorial chemistry. This approach is the most established, based on the 96-well plate format. These microplates have been established for two to three decades. Key considerations for the acceptance of this approach are standardization of microplate dimensions and attributes by the Society for Biomolecular Screening and development of ancillary devices like repeating pipettes, vacuum manifolds, and more. Countless vendors are involved. Sample preparation and analysis using microplates includes liquid–liquid extraction (LLE), protein precipitation, solid-phase extraction (SPE), fluorescence, matrix-assisted laser desorption–ionization mass spectrometry (MALDI-MS), and separations.
Wells (4) presented a list of some of the uses of filtration microplates in pharmaceutical development, including:• clarification of acid, base, or organic
digests of plant materials in medicinal chemistry,
• SPE of natural products,• solution-phase synthesis in
combinational chemistry using resin scavenger media,
• dye terminator removal,• plasmid DNA binding,• lysate clarification,• membrane-based proteolytic digestion
before MALDI-MS,• filtration of precipitated proteins,• filtration of plasma or serum samples
in combination with direct injection techniques,
• filtration of reconstituted extracts, and• solid-supported LLE, SPE, or exclusion
chromatography.As we can see, the development of 96-
well plates and the major applications of this approach are in bioanalysis of liquid samples. This is because the transfer of liquid samples from analytical operation to another is somewhat straightforward. Recently, Scoffin (5) reviewed liquid transfer in high-throughput systems. These liquid-handling systems operate either by air displacement or positive displacement and can reliably work with microliter volumes of volatile or viscous liquids. Other combinations of liquid handling and sorbent-based extraction, including solid-phase microextraction (SPME), automated disposable pipette
32 | July 2017 | LCGC
FIltratIonSample prep trenDS
Sample prep overvIew
extraction, and microextraction by packed sorbent have also been used in high-throughput approaches (6,7). By combining these solvent-free, sorbent-based extractions with syringe-needle or pipette configurations, direct extraction and liquid transfer is accommodated.
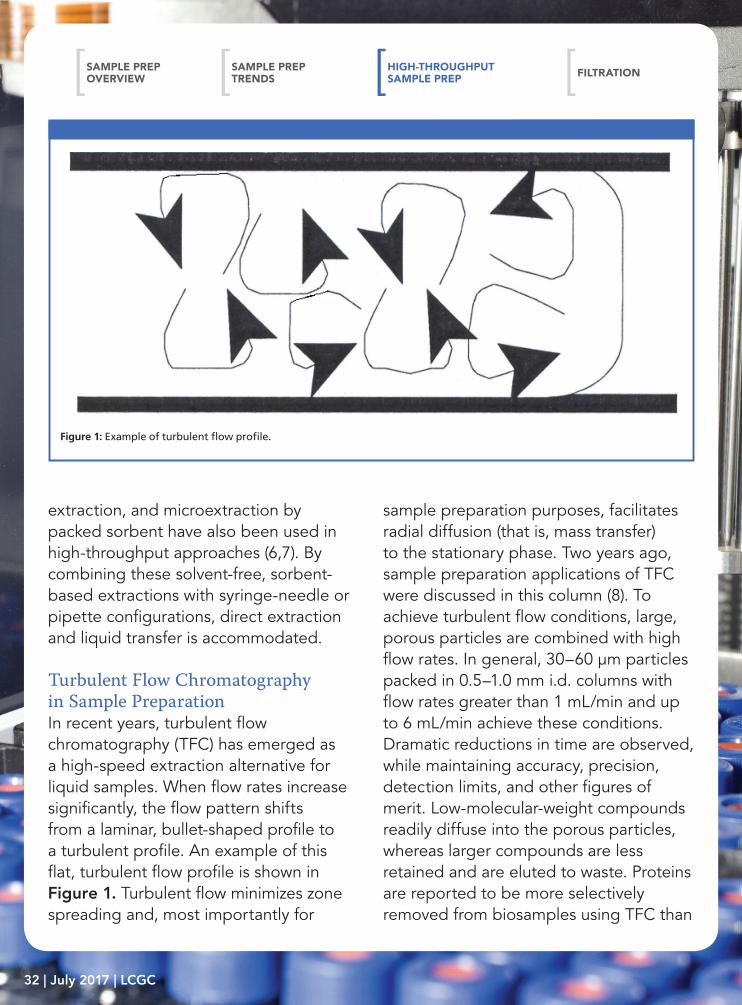
Turbulent Flow Chromatography in Sample PreparationIn recent years, turbulent flow chromatography (TFC) has emerged as a high-speed extraction alternative for liquid samples. When flow rates increase significantly, the flow pattern shifts from a laminar, bullet-shaped profile to a turbulent profile. An example of this flat, turbulent flow profile is shown in Figure 1. Turbulent flow minimizes zone spreading and, most importantly for
sample preparation purposes, facilitates radial diffusion (that is, mass transfer) to the stationary phase. Two years ago, sample preparation applications of TFC were discussed in this column (8). To achieve turbulent flow conditions, large, porous particles are combined with high flow rates. In general, 30–60 μm particles packed in 0.5–1.0 mm i.d. columns with flow rates greater than 1 mL/min and up to 6 mL/min achieve these conditions. Dramatic reductions in time are observed, while maintaining accuracy, precision, detection limits, and other figures of merit. Low-molecular-weight compounds readily diffuse into the porous particles, whereas larger compounds are less retained and are eluted to waste. Proteins are reported to be more selectively removed from biosamples using TFC than
Figure 1: Example of turbulent flow profile.
HIgH-tHroUgHpUt Sample prep
33 | July 2017 | LCGC
FIltratIonSample prep trenDS
Sample prep overvIew
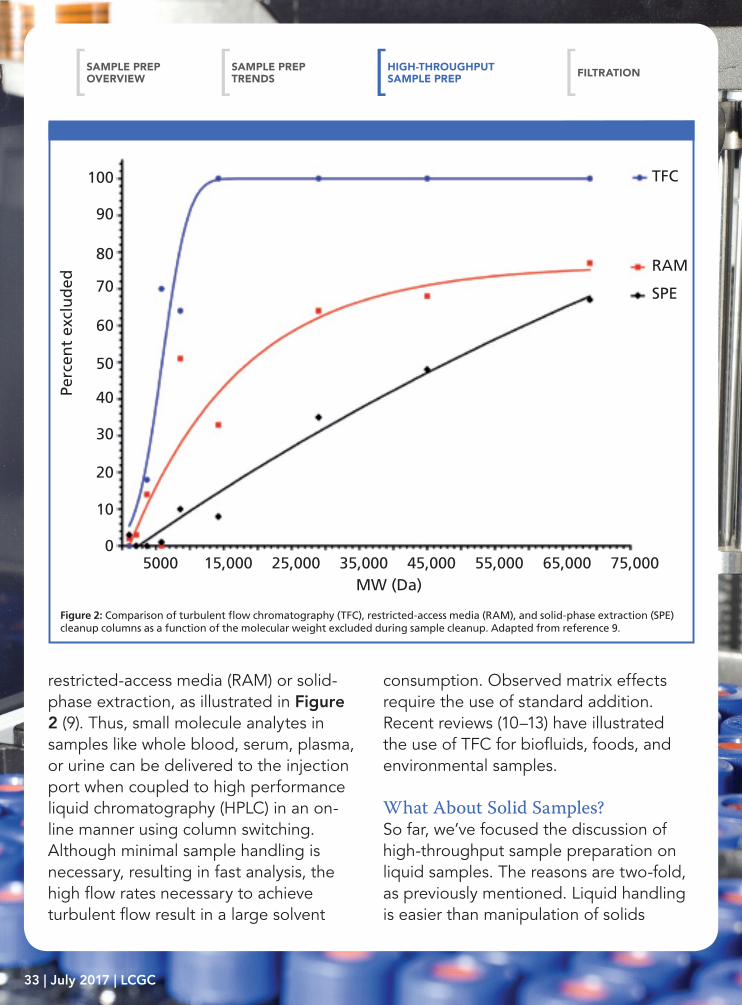
restricted-access media (RAM) or solid-phase extraction, as illustrated in Figure 2 (9). Thus, small molecule analytes in samples like whole blood, serum, plasma, or urine can be delivered to the injection port when coupled to high performance liquid chromatography (HPLC) in an on-line manner using column switching. Although minimal sample handling is necessary, resulting in fast analysis, the high flow rates necessary to achieve turbulent flow result in a large solvent
consumption. Observed matrix effects require the use of standard addition. Recent reviews (10–13) have illustrated the use of TFC for biofluids, foods, and environmental samples.
What About Solid Samples?So far, we’ve focused the discussion of high-throughput sample preparation on liquid samples. The reasons are two-fold, as previously mentioned. Liquid handling is easier than manipulation of solids
100
90
80
70
60
50
Perc
ent
excl
ud
ed
40
30
20
10
05000 15,000 25,000
MW (Da)
TFC
RAM
SPE
35,000 45,000 55,000 65,000 75,000
Figure 2: Comparison of turbulent flow chromatography (TFC), restricted-access media (RAM), and solid-phase extraction (SPE) cleanup columns as a function of the molecular weight excluded during sample cleanup. Adapted from reference 9.
HIgH-tHroUgHpUt Sample prep
34 | July 2017 | LCGC
FIltratIonSample prep trenDS
Sample prep overvIew
and the microplate technology drove the development of high-throughput methods. How can we make the analysis of solid samples high-throughput? Do the more recently developed extraction techniques take us in that direction?
During the time when 30–60 min chromatography runs were standard, Soxhlet extractions took 6–48 h. This bottleneck was even further exacerbated when spectroscopy or other rapid analytical procedures were used. During the past 20 years or so, several automated techniques (including supercritical fluid extraction [SFE], microwave-assisted extraction [MAE], and pressured liquid extraction [PLE]) have been developed, which provide the hope for high-throughput sample analysis. In addition to automation of the extraction procedure, these methods are characterized by very rapid extraction times compared with the traditional methods. However, simultaneously to the development of these techniques, advances in sensors, mass spectrometry, and chromatography have rendered even these modern technologies to remain the rate-limiting part of an analytical procedure. Sample preparation that
takes 20 min, while several-fold faster than Soxhlet or shake-flask methods, is still slow compared with 5-min analyses. In the days of 6–48-h Soxhlet extraction and 30–60-min chromatographic analysis, the ratio of sample preparation time to chromatography run time was 6–96:1. However, it is common to perform, for example, 12 Soxhlet extractions simultaneously, so the ratio becomes 0.5–8:1. SFE, PLE, and MAE extractions commonly take 20 min, but have we really gained anything? It is now routine to perform chromatography with 10–30-min run times or faster. So the ratio remains 0.5–6:1.
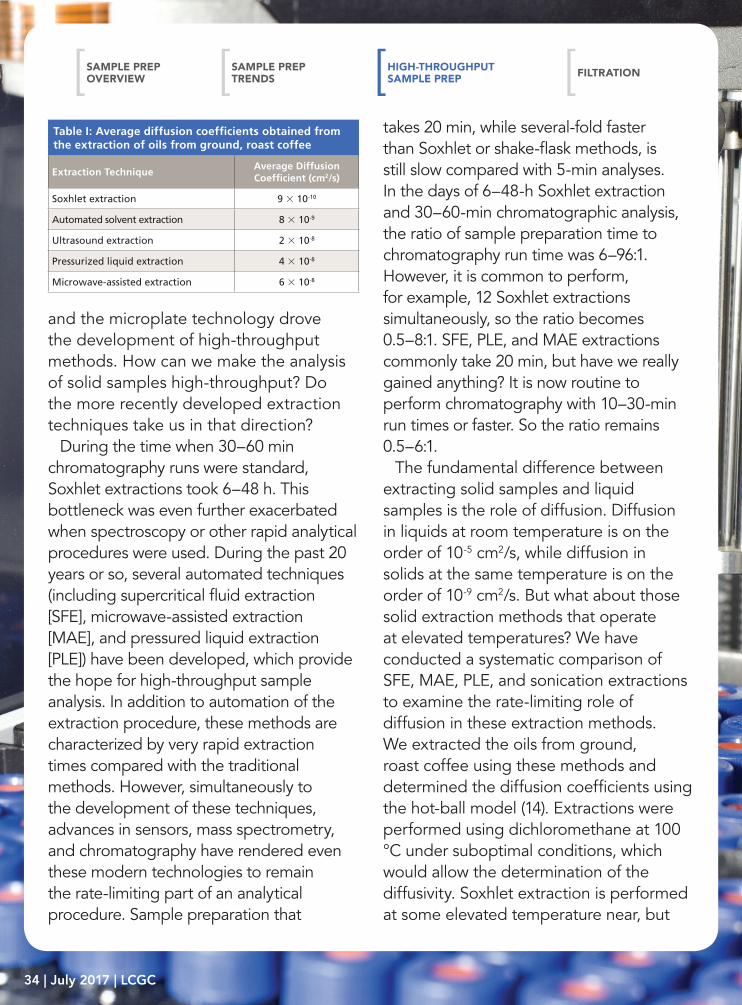
The fundamental difference between extracting solid samples and liquid samples is the role of diffusion. Diffusion in liquids at room temperature is on the order of 10-5 cm2/s, while diffusion in solids at the same temperature is on the order of 10-9 cm2/s. But what about those solid extraction methods that operate at elevated temperatures? We have conducted a systematic comparison of SFE, MAE, PLE, and sonication extractions to examine the rate-limiting role of diffusion in these extraction methods. We extracted the oils from ground, roast coffee using these methods and determined the diffusion coefficients using the hot-ball model (14). Extractions were performed using dichloromethane at 100 °C under suboptimal conditions, which would allow the determination of the diffusivity. Soxhlet extraction is performed at some elevated temperature near, but
Table I: Average diffusion coefficients obtained from the extraction of oils from ground, roast coffee
Extraction TechniqueAverage Diffusion Coefficient (cm2/s)
Soxhlet extraction 9 × 10⁻¹⁰
Automated solvent extraction 8 × 10⁻⁹
Ultrasound extraction 2 × 10⁻⁸
Pressurized liquid extraction 4 × 10⁻⁸
Microwave-assisted extraction 6 × 10⁻⁸
HIgH-tHroUgHpUt Sample prep

35 | July 2017 | LCGC
FIltratIonSample prep trenDS
Sample prep overvIew
below, the boiling point of 39.8 °C, while the modified Soxhlet approach includes leaching in boiling solvent as the main portion of the extraction. Ultrasonic extractions are performed in open-vessels, so the bulk solvent cannot exceed the boiling point, but on a molecular level temperatures during cavitation can reach 5000 K. PLE and MAE in this work were performed at 100 °C. Figure 3 displays the kinetic curves from these extractions (15). When the hot-ball model is applied to these data, the diffusion coefficients shown in Table I
are obtained. The results show that analyte diffusion values, under similar extraction conditions applied across each method, were within the same order of magnitude. It seems unlikely that temperatures greater than those used in these techniques will be routinely applied for analytical extractions. Thus, when developing high-throughput extraction systems, the kinetics of extraction will not differentiate these alternative extraction procedures. PLE, MAE, and SFE seem to be the preferred approaches for developing high-throughput processing, but advantages
100
80
60
40
20
00 10 20 30 40 50 60
SoxhletAutomated solvent extractionPLE
MAE
Ultrasound
Figure 3: Relative percent of oil extracted from 725-μm coffee particles as a function of time (min) using various extraction processes. Adapted from reference 15.
HIgH-tHroUgHpUt Sample prep

36 | July 2017 | LCGC
FIltratIonSample prep trenDS
Sample prep overvIew
with each technique will arise because of instrumental configurations.
Is High-Throughput Sample Preparation Necessary?As discussed, the major approaches to achieve high-throughput sample preparation stem from parallel sample processing, automation, and the kinetics of the sample processing procedure. The success observed in the high-throughput sample preparation of liquids comes, in part, from automation and parallel processing. The microplates process 96 or more samples simultaneously. The instrumental approaches to extracting solids are also configured for automation and parallel processing. The kinetics of extraction is fundamentally limited by practical considerations. So perhaps the best approaches for high-throughput analysis will result from the integration of methods. Just as turbulent flow chromatography is coupled to liquid chromatography (LC), thermal desorption is coupled with gas chromatography (GC), and 96-well microplates are coupled to MALDI-MS, similar methodologies combining rapid sample and processing parallel approaches will begin to address this need. However, the analyst must also keep in mind what is truly desired. High-throughput sample preparation is not the ultimate goal, but rather high-throughput analysis. Chemometrics and other statistical approaches can glean the desired information from minimal analysis, and dilute-and-shoot or direct analysis
mass spectrometry eliminate the need for sample preparation entirely, which is perhaps the fastest method of all.
References(1) R.E. Majors, LCGC North Am. 9(1), 16–20 (1991).(2) R.E. Majors, LCGC North Am. 20(12), 1098–1113 (2002). (3) R.E. Majors, LCGC North Am. 31(3), 190–202 (2013).(4) D.A. Wells, High Throughput Sample Preparation Methods
and Automation Strategies (Elsevier, Amsterdam, The Neth-erlands, 2003), pp. 199–254.
(5) K. Scoffin, Am. Lab. 46, 17–19 (2014).(6) J. Pereira, C.L. Silva, R. Perestrelo, J. Goncalves, V. Alves,
and J.S. Camara, Anal. Bioanal. Chem. 406, 2101–2122 (2014).(7) F. Mousavi and J. Pawliszyn, Anal. Chim. Acta. 803, 66–74
(2013).(8) J.L. Herman, T. Edge, and R.E. Majors, LCGC North Am.
30(3), 200–214 (2012).(9) O. Nunez, H. Gallart-Ayala, C.P.B. Martins, and P. Lucci, J.
Chromatogr. A. 1228, 298–232 (2012).(10) J. Pan, C. Zhang, Z. Zhang, and G. Li, Anal. Chim. Acta 815,
1–15 (2014).(11) O. Nunez, H. Gallart-Ayala, C.P.B. Martins, P. Lucci, and R.
Busquets, J. Chromatogr. B. 927, 3–21 (2013).(12) M.D. Marazuela and S. Bogialli, Anal. Chim. Acta. 645, 5–17
(2009).(13) L. Couchman, Biomed. Chromatogr. 26, 892–905 (2012).(14) K.D. Bartle, A.A. Clifford, S.B. Hawthorne, J.J. Langenfeld,
D.J. Miller, and R. Robinson, J. Supercrit. Fluid. 3, 143–149 (1990).
(15) J.L. Driver and D.E. Raynie, in preparation (2014).
This article originally appeared in LCGC North America, 32 (6), 396–403 (2014).
Douglas Raynieis an Associate Research Professor at South Dakota State University. His research interests include green chemistry, alternative solvents, sample preparation, high resolution chromatography, and bioprocessing in supercritical fluids. He earned his PhD in 1990 at Brigham Young University under the direction of Mil-ton L. Lee. He is also a member of LCGC’s editorial advisory board.
Ronald E. Majors“Sample Prep Perspectives” Editor Ronald E. Majors is an analytical consultant and is a member of LCGC’s editorial advisory board. Direct correspondence about this column to [email protected].
HIgH-tHroUgHpUt Sample prep

get
ty Im
ag
es/x
xx
xx
xx
x
Standardize to Reduce Variation
SPONSORED
Click here to read
the article
SPONSORED
Whatman Filter Selector
Click here to view
the filter selector
37 | July 2017 | LCGC
Delivering samples to the analytical column in “clean” mobile phase is important for robust methods and high quality results.
Sometimes, the instrumentation we use in liquid chromatography (LC) works remarkably well in spite of our occasional justified neglect of best practices designed to protect the instrument’s more-delicate components. One of the ways I balanced the checkbook during my graduate school days was doing instrument repair on nights and weekends. I vividly recall receiving an LC pump from a laboratory in Kansas that looked like it had sat out in the middle of a farm field through a Minnesota winter—the electronic boards were full of dust and the front area of the pump where the pump head sits was literally packed with dirt. To my amazement, it still pumped liquid, albeit not with the accuracy we would like.
In this article, I decided to focus on filters and filtering as they relate to proper, reliable operation of high performance liquid chromatography (HPLC) instruments. John
FIlterS anD FIltratIon In lIqUID CHromatograpHy—wHat to DoDwight Stoll
FIlterS anD FIltratIon In lIqUID CHromatograpHy—wHat to Do

38 | July 2017 | LCGC
HIgH-tHroUgHpUt Sample prep
Sample prep trenDS
Sample prep overvIew FIltratIon
Dolan has written extensively and often on these topics in the past (1–4), and yet many of the problems I discuss with LC practitioners in the field—and with students in my own laboratory—are in some way related to filters and filtering. Technologies, practices, and the demands of our laboratory settings change, too, and so I’d like to discuss what has stayed the same and what has changed, while providing some guidance for our everyday work.
In preparation for writing this piece, I informally surveyed several people, because I was interested to know what folks are actually doing in their laboratories. I consider all of these people experts in LC, with an average of about 15 years of experience, and they represent a broad cross-section of our community, ranging from pharmaceutical and chemical companies to instrument manufacturers. What was strikingly evident from this survey was that people handle the topic of filters and filtering in diverse ways, even though instrument manuals and books on LC may suggest only one way. Our reality today is that the practice of LC is strongly influenced by a number of drivers that the manuals don’t consider, including minimizing the number of laboratory operations to minimize variation in analytical results, and optimizing the costs of analytical results from a holistic point of view (in other words, analyzing the benefit of component X to the method relative to the cost of the component).
The topic of filters and filtering is very important in LC because a number of components in a LC system are susceptible to premature failure if particulates are present in the mobile-phase flow path. For example, dust or other particulates in the mobile phase pulled from a solvent bottle can cause pump check valves to partially fail (they become leaky) or entirely (the pump produces no flow at all). Perhaps the most obvious failure mode involves particulates from injected samples or instrument components accumulating at the column inlet, resulting in a plugged column. In the following sections, I will discuss some of the most important points in an instrument setup and method related to filters and filtration. In each case, I will describe best practices from the point of view of the instrument and will also discuss cases in which this advice may not be strictly followed for good reason. We will see that many of these considerations boil down to thinking about risk and benefit in terms of the potential benefit derived from deviating from best practices and the risks associated with doing so.
Filtering to Protect the PumpFrom the point of view of an LC pump, ideal solvents are absolutely free of particulate matter. Particulates can interfere with the sealing interface between the check valve ball and seat, causing it to leak or to fail entirely, resulting in inconsistent or no flow

39 | July 2017 | LCGC
HIgH-tHroUgHpUt Sample prep
Sample prep trenDS
Sample prep overvIew
from the pump. Particulates can also accelerate wear on pump pistons and seals, which can result in leaks and flow-rate inaccuracy. These problems usually manifest themselves as noisy or irregular baselines, unexpected fluctuations in the operating pressure reported by the pump, and variations in retention time. Most sources of advice on this topic recommend that solvents should be filtered to 0.45 µm before use. Modern LC pumps come equipped with filters that are fitted to the inlet end of solvent lines that pull solvents from their reservoirs, but these filters have much larger porosity and are not designed to retain particles at the 0.5-µm level. Off-line filtration, however, adds cost (both consumables and operator time) and is a potential source of both chemical and particulate (yes, it happens) contamination of the solvent. Reputable manufacturers of solvents sold specifically for use in LC filter their solvents at the point of packaging (typically to 0.2 µm, and some to 0.1 µm), so one way to avoid in-house filtering altogether is to purchase and use premixed solvents. There was a time when choices for these solvents were limited to water and neat organic solvents, but these days most commonly used mobile phases can be purchased from major manufacturers as premixed solutions. For example, 0.1% formic acid in water, 0.1% formic acid in acetonitrile, and 0.1% ammonium acetate in water are all readily available. There is also an incredible array of premade buffers
available for HPLC, including phosphate buffers, buffers with ion-pairing reagents added, and so on. The convenience associated with using these premixed solvents comes at a significant increase in purchase price over pure solvents, however, so users must decide if the increased cost is worth the benefits they offer. Some laboratories find that the increased cost of premixed solvents is offset by savings in labor and reduced downtime that would otherwise result from errors in mobile-phase preparation.
Mobile-Phase AdditivesThe majority of LC methods in use today involve some type of mobile-phase additive, including buffering agents and ion-pairing reagents. If we choose not to use the type of premade solvents described above, then we have to make a choice: Do we filter the solvent after adding the additives, or not? At this point there is an opportunity to divide the question over two scenarios—those that involve liquid additives (for example, formic acid, ammonium hydroxide, and phosphoric acid), and those that involve solid additives (for example, potassium phosphate, sodium perchlorate, and sodium chloride). Among the experts I surveyed, very few reported that their laboratories filter solvents involving only liquid additives. I would report the same for my laboratory. The responses from the experts about solvents involving solid additives are mixed. A majority, but not all, of their laboratories routinely filter
FIltratIon
40 | July 2017 | LCGC
HIgH-tHroUgHpUt Sample prep
Sample prep trenDS
Sample prep overvIew
solvents containing solid additives. In my laboratory we often base our decision on the amount of solid additive used. If the amount of additive is small and it is highly soluble in the solvent—say 10 mM ammonium acetate in water—we don’t filter, but we always filter solutions containing high concentrations of additives. The compelling reasons to filter in these cases include increased risk of particulate contaminants present in the solid additive, particulates present due to incomplete dissolution of the additive, and, in the case of buffer–organic solvent mixtures, precipitation of the additive upon addition of the organic solvent.
Why or Why Not?In the face of these compelling reasons to filter, especially when solid additives are used, one might reasonably ask—why not? Here is a short list of reasons, the significance of which often depends on context.
• Cost of filtering versus costs resulting from pump problems: If the risk of a solvent-related problem associated with the pump can be minimized through use of liquid additives and high-quality reagents, the cost associated with in-house filtering may outweigh costs associated with pump down-time. On the other hand, if your laboratory is a 24/7 operation and pump robustness is critical, then you may choose to prioritize in-house solvent filtering to maximize instrument up-time.
• Risk of introducing chemical and biological contaminants during filtering: These days, very high-quality membrane filters are available for filtering LC solvents that are unlikely to contaminate the solvent themselves. But, the filter is only one component of the filtration process. The rest of the filtration apparatus must be cleaned properly to avoid carryover of particulate and chemical contaminants to the filtered solvent. This approach is most certainly possible, but it is dependent on well trained operators, standard operating procedures, and a laboratory culture of respect for cleanliness. This issue of chemical and biological contaminants is especially important for methods focused on trace-level determinations, because the contaminants will be observed as noise or interferents when using very sensitive detectors (5,6).
• Fewer steps equal less opportunity for mistakes: One of the themes that emerged from my survey of experts is that there is a continuous drive for simplification of analytical procedures. If a step can be eliminated without compromising the quality of the analytical result, it is because fewer steps tend to translate into lower variability of results.
Microbial ContaminationFinally, the topic of microbial growth in solvent reservoirs is important. If microbes begin growing in the solvent
FIltratIon
41 | July 2017 | LCGC
HIgH-tHroUgHpUt Sample prep
Sample prep trenDS
Sample prep overvIew
container feeding the pump, there is potential for the instrument to be contaminated both physically and chemically. Here, too, some themes emerged from the experts I surveyed. The following best practices will help minimize problems with microbial growth, which is limited to aqueous solutions:• Resist the temptation to top off solvent
containers by adding new buffer to old buffer. Topping off provides a path for cross-contamination of buffer batches—even if the new buffer is perfectly sterile, it will be contaminated immediately if added to a solvent reservoir containing old buffer. Avoiding this practice adds some waste when the last drops of old buffer are thrown away, but this minor waste is a small price to pay for avoiding cross-contamination.
• For buffered aqueous solutions, particularly those near neutral pH, prepare concentrated stock buffer solutions (such as a solution containing a 10× concentration of buffering agent), refrigerate them upon storage, and dilute small quantities for use when needed. Prepare only enough of the working buffer to last one or two days to limit the time available for microbes to grow at room temperature.
• Add some antimicrobial agent to the buffer. Historically, sodium azide was used for this purpose at low concentration (~0.05%), but this practice is becoming less common and many laboratories are choosing to simply add a small amount (many labs use 10%, but
the “right amount” is case specific) of organic solvent such as acetonitrile to the buffer for this purpose.
Filtering to Protect the ColumnThe size of the interstitial spaces between particles of packed columns typically used in LC is a small fraction of the diameter of the particles themselves. Thinking of it this way, it becomes evident that the packed bed itself can act as an effective filter; clearly we want to employ the column for separation, not as a filter. The frits on the ends of the columns serve two purposes then: They retain the particles inside the column, and they prevent particulates carried by the mobile phase from entering and partially blocking flow through the particle bed. Accumulation of particulates on the frit at the inlet side of the column can also lead to plugging of the frit, rendering the column unusable because of the increased pressure drop over the frit. In the preceding section I discussed the mobile phase as it is drawn into the pump as a source of particulates. But even if the mobile phase entering the pump is perfectly particulate-free, there are several potential sources of particulates entering the flow stream between the pump and the column. Most prominent among these are shedding of pump-seal material (chunks of polymer); shedding of valve rotor seals (again, chunks of polymer), including the sample injection valve and column switching valves; and the sample itself. The topic of particulates in the sample is one
FIltratIon
42 | July 2017 | LCGC
HIgH-tHroUgHpUt Sample prep
Sample prep trenDS
Sample prep overvIew
that clearly crosses over into the area of sample preparation, and one could easily write an entire column on this topic alone. Here, we will focus on the first two potential sources, the instrument-related sources of particulates.
In-Line Filters Versus Guard ColumnsIn the context of a LC instrument, an in-line filter is usually one that is placed in the mobile-phase flow path at some point between the pump outlet and the column inlet. These filters have evolved over the years to the point that the most high-performing ones can be used at very high pressures, have small throughpore sizes (down to 0.2 µm), and have internal volumes in the microliter range so as to limit contributions to peak broadening. The sole purpose of these filters is to collect particulates in the mobile phase as a means of preventing damage to downstream components from these particulates. In my laboratory we do not regularly use in-line filters immediately after the pump, but we are very disciplined about using them between valves with polymeric rotor seals (for example, autosampler and column-switching valves) and the analytical column. We find that these seals shed a lot of particles as they wear, and that capturing them with an in-line filter generally increases the lifetimes of our analytical columns and small diameter capillary connection tubing. I would say that only about 50% of the LC instruments I see in a year in different
laboratories have an in-line filter installed ahead of the analytical column, which is very surprising to me. Replacement filters cost anywhere from a few dollars to $25 depending on their features, but it is easy to justify replacing a few of these if we can significantly increase the lifetimes of our analytical columns and improve instrument robustness in general. It is important to note that some applications involving very small peak volumes (for example, small particle sizes and short columns) will be more susceptible to peak broadening inside the in-line filter. In these cases one has to think carefully about which is more important—minimizing dispersion, or protecting the column from particulates.
Guard columns are essentially very short versions of the analytical column (often with the same packing material and diameter, but lengths on the order of 5 or 10 mm) that are screwed into the column inlet. One can argue that guard columns can also serve as particulate filters to protect the analytical column, but this approach is a much more expensive way of doing so (on the order of 10–20% of the column purchase price per guard column). Instead, guard columns are more appropriately used for chemical protection of the analytical column. For example, sample constituents that are very highly retained by the analytical column, or perhaps will not even be eluted under the conditions of the experiment, can be trapped by the guard column. The contaminated guard
FIltratIon
43 | July 2017 | LCGC
HIgH-tHroUgHpUt Sample prep
Sample prep trenDS
Sample prep overvIew
column can then be replaced with a new one after the analysis of some number of samples at a fraction of the price of a new analytical column. The experts I surveyed reported more frequent use of in-line filters than guard columns, citing the cost of guard columns as being generally too high to justify their use in a uniform way.
Closing ThoughtsIn this article, I made generalizations where possible about when and why to filter. Of course there are special situations where these generalizations are not applicable. For example, certain types of detectors, such as light-scattering detectors used for polymer analysis, are very sensitive to particulates in the mobile phase and may require more-thorough and more-consistent filtering of mobile-phase solvents. LC users should think carefully about special requirements associated with their particular analyses and adjust their approaches to the use of filters and filtering accordingly.
References(1) J.W. Dolan, LCGC North Am. 28, 28–30 (2010).(2) J.W. Dolan, LCGC North Am. 26, 352–355 (2008).(3) J.W. Dolan, LCGC North Am. 3, 956–960 (1985).(4) J.W. Dolan and V.N. Berry, LCGC N. Am. 1, 542–544 (1983).(5) B.O. Keller, J. Sui, A.B. Young, and R.M.
Whittal, Anal. Chim. Acta. 627, 71–81 (2008). doi:10.1016/j.aca.2008.04.043.
(6) S. Williams, J. Chromatogr. A. 1052, 1–11 (2004) 1–11. doi:10.1016/j.chroma.2004.07.110.
This article originally appeared in LCGC North America, 35 (2), 98–103 (2017).
Dwight Stollis Associate Professor and Co-Chair of Chemistry at Gustavus Adolphus College in St. Peter, Minnesota. He has authored or coauthored 48 peer-reviewed publications in separation science and more than 90 conference presentations. His primary research focus is on the development of two-dimensional liq-uid chromatography (2D-LC) for both targeted and untargeted analyses. He has made contributions on the topics of stationary-phase characterization, new 2D-LC methodologies and instrumentation, and fundamental aspects including reequilibration in gradient elution reversed-phase LC and analyte focusing. He is the 2009 recipient of the John B. Phillips Award for contributions to multidimen-sional gas chromatography, the 2011 recipient of LCGC’s Emerging Leader in Chromatography Award, and the 2015 recipient of the American Chemi-cal Society Division of Analytical Chemistry Award for Young Investigators in Separation Science. He is also a member of LCGC’s editorial advisory board. Direct correspondence about this column via e-mail to [email protected].
FIltratIon