improving runoff water quality from small pork production...
TRANSCRIPT
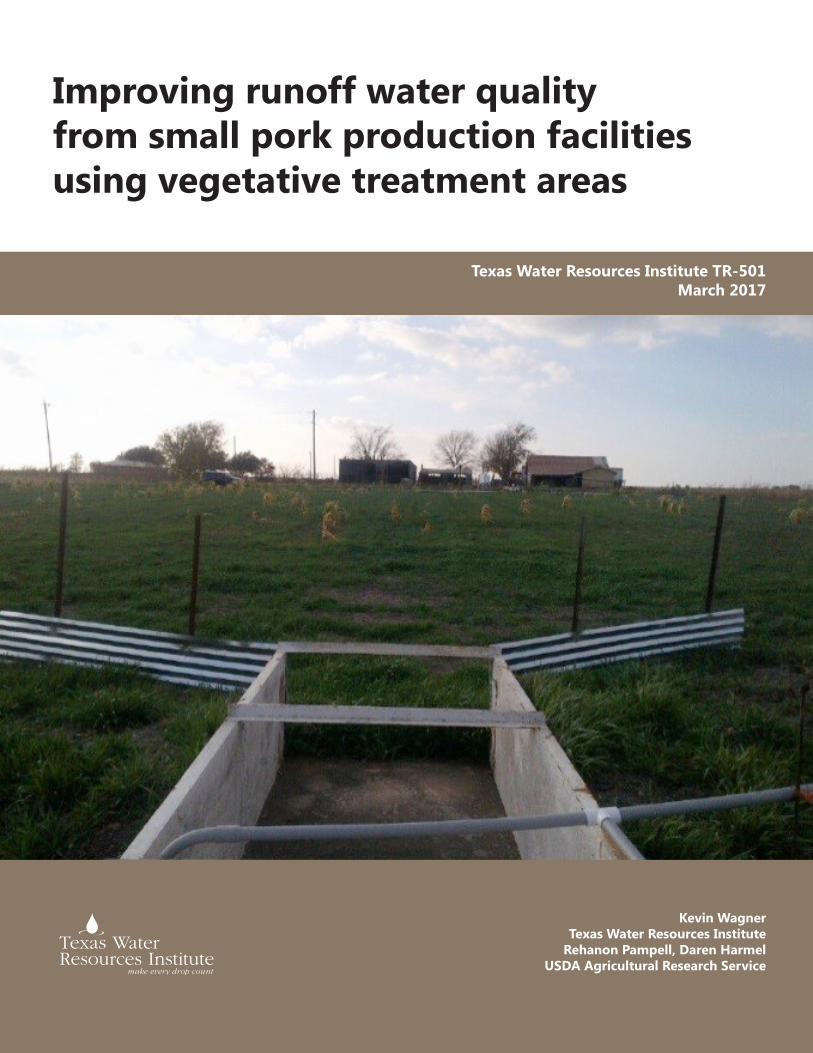
Improving runoff water qualityfrom small pork production facilitiesusing vegetative treatment areas
Kevin Wagner Texas Water Resources Institute
Rehanon Pampell, Daren Harmel USDA Agricultural Research Service
Texas Water Resources Institute TR-501March 2017

Improving runoff water quality from small pork production facilities
using vegetative treatment areas
STATE NONPOINT SOURCE GRANT PROGRAM
TSSWCB PROJECT 16-50
Prepared for:
TEXAS STATE SOIL AND WATER CONSERVATION BOARD
Prepared by:
DR. KEVIN WAGNER
TEXAS WATER RESOURCES INSTITUTE
-------------------------------------------------------------
REHANON PAMPELL & DR. DAREN HARMEL
U.S. DEPARTMENT OF AGRICULTURE – AGRICULTURAL RESEARCH SERVICE
-------------------------------------------------------------
DR. TERRY GENTRY
TEXAS A&M AGRILIFE RESEARCH
MARCH 2017
TEXAS WATER RESOURCES INSTITUTE TECHNICAL REPORT 501 College Station, Texas
2
Executive Summary Federal law requires all animal feeding operations manage manures and wastewater by-products in a manner that is protective of U.S. waters. As a result, the Texas State Soil and Water Conservation Board (TSSWCB) encourages animal feeding operations to voluntarily participate in the agency’s Water Quality Management Plan (WQMP) Program; however, limited participation of the pork industry has historically occurred largely due to logistical and operational issues on smaller operations. Smaller pork facilities generally operate on smaller tracts of land that do not support traditional animal waste management systems such as waste storage ponds, treatment lagoons, and significant expanses of land application acreage.
The U.S. Department of Agriculture–Agricultural Research Service (ARS) and Texas Water Resources Institute (TWRI) initiated this project with funding from the TSSWCB to evaluate an alternative manure treatment system, a vegetated treatment area (VTA), to treat runoff and wash water from small pork production facilities. This evaluation was designed to provide the scientific basis for considering this system for inclusion as an approved practice in the WQMP Program.
The demonstration and evaluation of the VTA system was initiated at three small pork production facilities in Bell, Brazos, and Robertson Counties. Water quality monitoring stations were established at: 1) adjacent control sites, 2) below pens and barns to quantify water quality leaving the facility prior to treatment in the VTA, and 3) at the VTA outlet to quantify effectiveness of the VTA in treating runoff. Runoff volume and event mean concentrations for E. coli, nitrogen (N), and phosphorus (P) were determined for each rainfall runoff event. Soil sampling was also conducted to assess nutrient accumulation and movement within the VTAs.
This 4-year evaluation found that VTAs reduced runoff volume by up to 29%, total N concentrations 47-76%, total P concentrations 65-88%, and E. coli concentrations 34-93%. Additionally, nutrient loads were reduced by 32-92%, and E. coli loads were reduced by 29-94%. Despite these reductions, with the exception of Robertson County, runoff from the VTAs had higher concentrations than control sites. This is attributed to alternative management of solids (i.e. solids removal) and enclosed barn pens used at the Robertson County site.
Based on evaluation results, VTAs were found to be a practical, environmentally-friendly waste management alternative for reducing nutrient and bacteria concentrations and loading from small pork production operations if proper consideration is given to design and management factors (e.g., solids management, perennial grass cover and subsequent haying and removal, and nutrient loads/VTA area).
3
Table of Contents Executive Summary ....................................................................................................................................... 2
Table of Contents .......................................................................................................................................... 3
List of Figures ................................................................................................................................................ 3
List of Tables ................................................................................................................................................. 3
List of Acronyms and Abbreviations ............................................................................................................. 4
Project Background and Goals ...................................................................................................................... 5
Methods ........................................................................................................................................................ 6
Results ........................................................................................................................................................... 8
Conclusions ................................................................................................................................................. 16
Appendix A – 2017 Fact Sheet .................................................................................................................... 17
Appendix B – Presentation.......................................................................................................................... 20
Appendix C – Poster .................................................................................................................................... 31
List of Figures Figure 1. Locations of VTA Sites .................................................................................................................... 6
Figure 2. VTA “out” at the Bell County (a), Brazos County (b), and Roberson County (c) sites. Lateral distribution lines were installed below all VTA “in” sites (Brazos County site shown here) (d) ................... 7
Figure 3. Inorganic N accumulation and movement in soil at the Bell County VTA site ............................ 10
Figure 4. Inorganic P accumulation and movement in soil at the Bell County VTA site ............................. 11
Figure 5. Inorganic N accumulation and movement in soil at the Brazos County VTA site ........................ 12
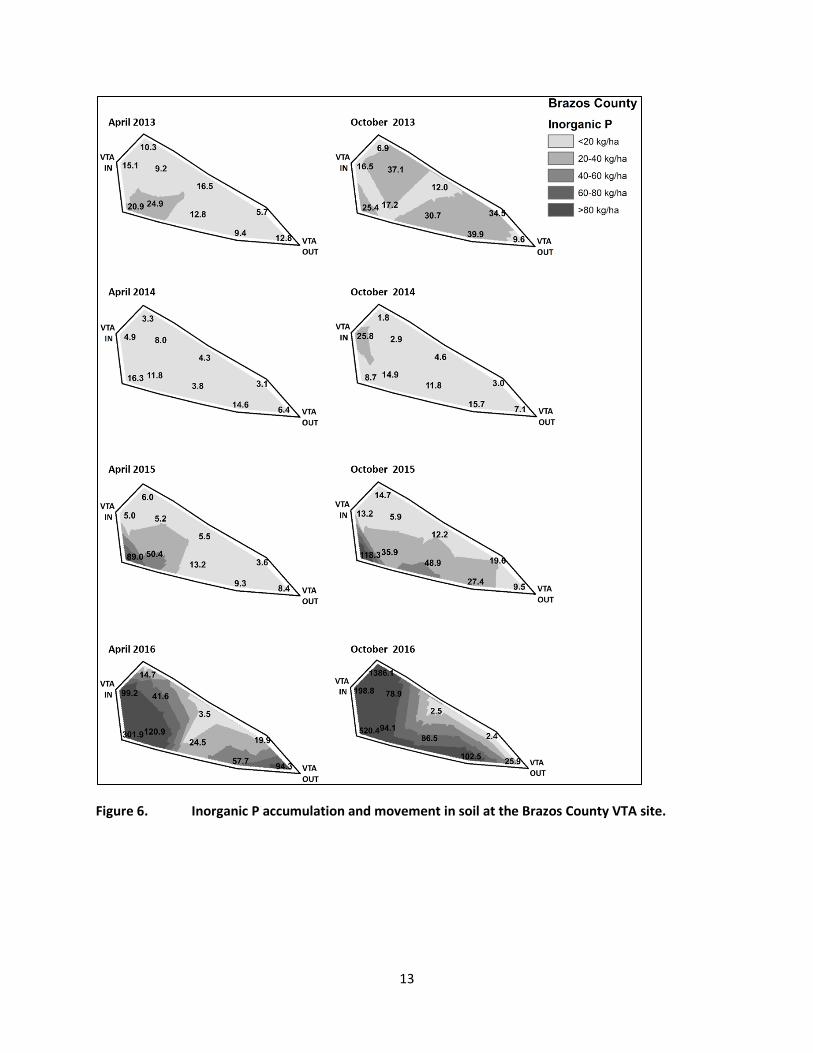
Figure 6. Inorganic P accumulation and movement in soil at the Brazos County VTA site ........................ 13
Figure 7. Inorganic N accumulation and movement in soil at the Robertson County VTA site.................. 14
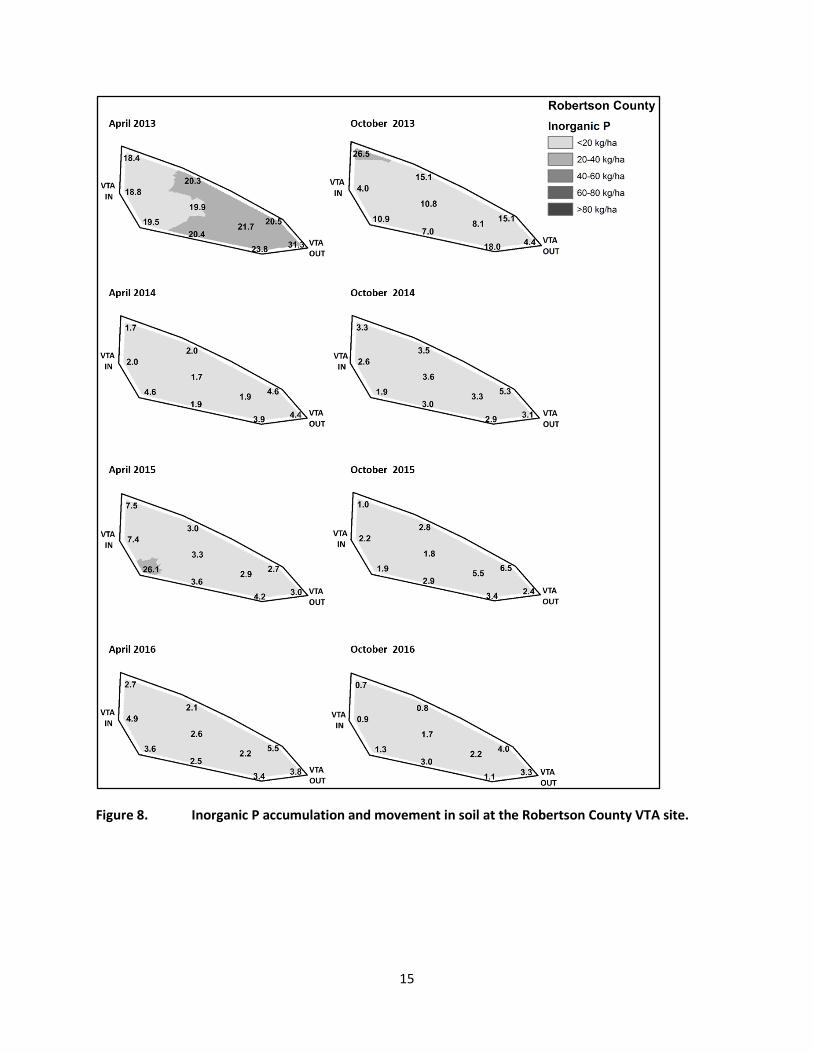
Figure 8. Inorganic P accumulation and movement in soil at the Robertson County VTA site .................. 15
List of Tables Table 1. VTA sample sites and monitoring frequencies ................................................................................ 7
Table 2. Summary of total N concentrations in runoff (mg/L) ..................................................................... 8
Table 3. Summary of total P concentrations in runoff (mg/L) ...................................................................... 8
Table 4. Summary of E. coli concentrations in runoff (CFU/100 mL) ............................................................ 8
Table 5. Summary of total N runoff loads (kg/ha) ........................................................................................ 9
Table 6. Summary of total P runoff loads (kg/ha) ......................................................................................... 9
Table 7. Summary of E. coli runoff loads (CFU/ha) ....................................................................................... 9

4
List of Acronyms and Abbreviations AFOs Animal feeding operations ARS United States Department of Agriculture – Agricultural Research Service CNMPs comprehensive nutrient management plans CAFOs Concentrated animal feeding operations CFU Colony forming units CNMP Comprehensive nutrient management plans EPA United States Environmental Protection Agency EQIP Environmental Quality Incentives Program FOTG Field Office Technical Guide GBRA Guadalupe-Blanco River Authority N Nitrogen NH4-N Ammonium-Nitrogen NMPs Nutrient management plans NO2-N Nitrite-Nitrogen NO3-N Nitrate-Nitrogen NPDES National Pollutant Discharge Elimination System NPS Nonpoint source pollution NRCS United States Department of Agriculture - Natural Resource Conservation Service P Phosphorus PO4-P Ortho-Phosphate TCEQ Texas Commission on Environmental Quality TSSWCB Texas State Soil and Water Conservation Board VTA Vegetated Treatment Area WQMP Water Quality Management Plan

5
Project Background and Goals On December 15, 2002, the Administrator of the United States Environmental Protection Agency (EPA) signed the final rule regulating concentrated animal feeding operations (CAFOs). This rule reinforced the need for all animal feeding operations (AFOs), regardless of the definition as a CAFO and required to operate under the coverage of a National Pollutant Discharge Elimination System (NPDES) permit, to manage manures and wastewater by-products in a manner that is protective of U.S. waters. The requirement for nutrient management plans (NMPs) and the recommendation that all AFOs obtain comprehensive nutrient management plans (CNMPs) was a key strategy for achieving maximum protection. As EPA has delegated the NPDES program to the State of Texas, the Texas Commission on Environmental Quality (TCEQ) has adopted the Texas Pollutant Discharge Elimination System under administrative rule, and certain management practices and technical requirements specific to unpermitted AFOs in Texas Administrative Code §321.47.
In Texas, the Texas State Soil and Water Conservation Board (TSSWCB), the agency responsible for management, prevention, and abatement of nonpoint source (NPS) pollution from agricultural and silvicultural activities, administers a certified Water Quality Management Plan (WQMP) Program. The term NPS, as it relates to AFOs, is loosely used to differentiate between AFOs, which do not require written authorization from TCEQ, from point source CAFOs, which do require written authorization under a permit. Because of this, the TSSWCB’s WQMP Program is applicable for any AFO not defined as a CAFO. An estimated 3000 such AFOs currently operate under the authority of a WQMP certified in accordance with Texas Agriculture Code §201.026. The technical elements of a WQMP are based on the United States Department of Agriculture - Natural Resource Conservation Service’s (NRCS) Field Office Technical Guide (FOTG), which is the best available technology and the basis for many management practices and agricultural engineering standards incorporated into the permitting program. A certified WQMP developed for an AFO that meets the technical requirements of the FOTG is a CNMP. A WQMP is effectively a conservation plan that includes a functionally equivalent level of environmental protection from a voluntary perspective. Thus, the TSSWCB encourages as many AFOs as possible to voluntarily participate in the WQMP Program, even if they are not explicitly required to obtain permit coverage.
Historically, the dairy and poultry industries have had high levels of WQMP interest and make up the bulk of the AFOs currently participating. In contrast, limited participation of the pork industry has occurred largely due to logistical and operational issues on smaller operations. Smaller pork facilities generally operate on smaller tracts of land that do not support traditional animal waste management systems such as waste storage ponds, treatment lagoons, and sufficient land application acreage.
This project evaluated an alternative manure treatment system – a vegetated treatment area (VTA) designed by NRCS to treat runoff and wash water prior to leaving the VTA. This system is compatible with small pork producer operations and designed to function well with minimal management. The project was designed to demonstrate the system’s effectiveness to the regulatory community and unpermitted pork producers, thus encouraging increased WQMP program participation. Finally, the project was designed to provide a scientific evaluation of VTAs for possible inclusion as an approved practice in the TSSWCB WQMP Program and NRCS Environmental Quality Incentives Program (EQIP).
6
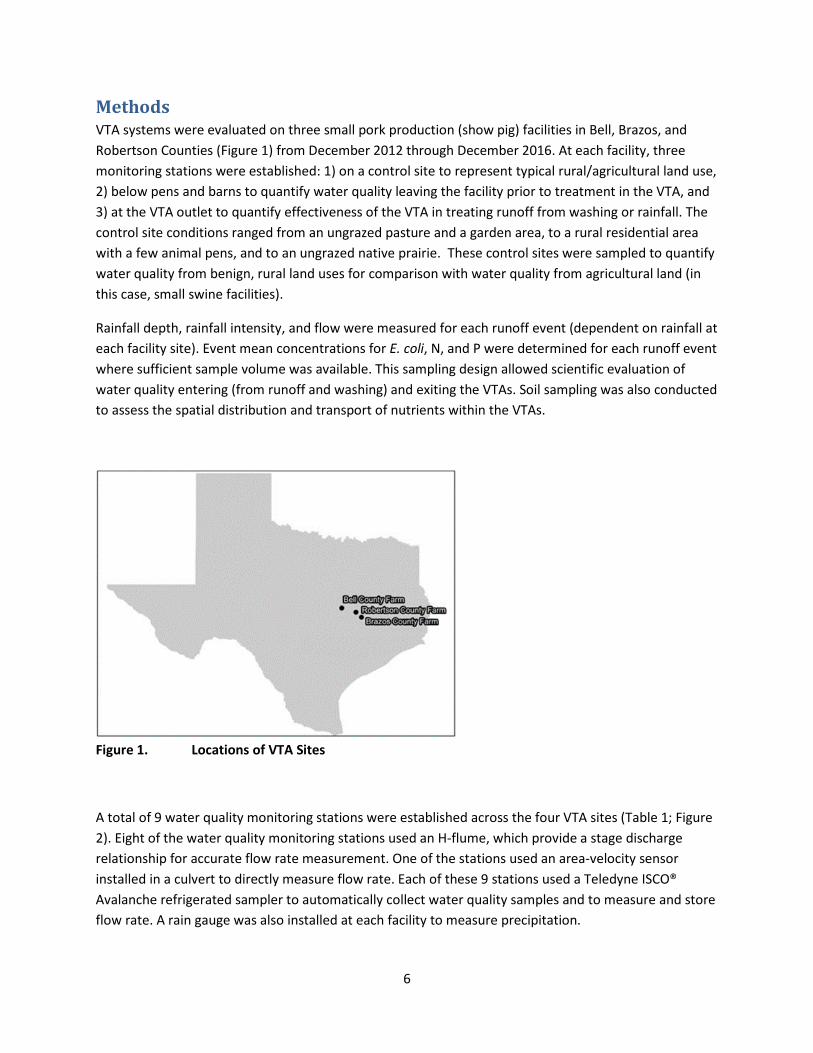
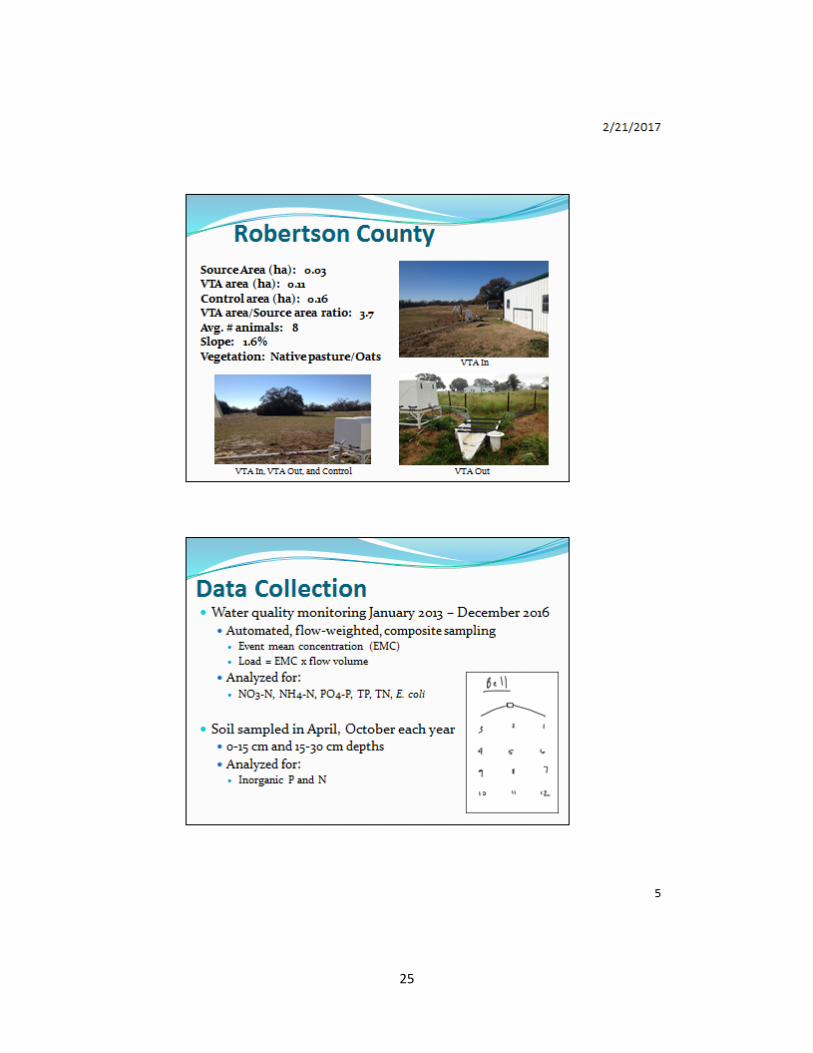
Methods VTA systems were evaluated on three small pork production (show pig) facilities in Bell, Brazos, and Robertson Counties (Figure 1) from December 2012 through December 2016. At each facility, three monitoring stations were established: 1) on a control site to represent typical rural/agricultural land use, 2) below pens and barns to quantify water quality leaving the facility prior to treatment in the VTA, and 3) at the VTA outlet to quantify effectiveness of the VTA in treating runoff from washing or rainfall. The control site conditions ranged from an ungrazed pasture and a garden area, to a rural residential area with a few animal pens, and to an ungrazed native prairie. These control sites were sampled to quantify water quality from benign, rural land uses for comparison with water quality from agricultural land (in this case, small swine facilities).
Rainfall depth, rainfall intensity, and flow were measured for each runoff event (dependent on rainfall at each facility site). Event mean concentrations for E. coli, N, and P were determined for each runoff event where sufficient sample volume was available. This sampling design allowed scientific evaluation of water quality entering (from runoff and washing) and exiting the VTAs. Soil sampling was also conducted to assess the spatial distribution and transport of nutrients within the VTAs.
Figure 1. Locations of VTA Sites
A total of 9 water quality monitoring stations were established across the four VTA sites (Table 1; Figure 2). Eight of the water quality monitoring stations used an H-flume, which provide a stage discharge relationship for accurate flow rate measurement. One of the stations used an area-velocity sensor installed in a culvert to directly measure flow rate. Each of these 9 stations used a Teledyne ISCO® Avalanche refrigerated sampler to automatically collect water quality samples and to measure and store flow rate. A rain gauge was also installed at each facility to measure precipitation.
7
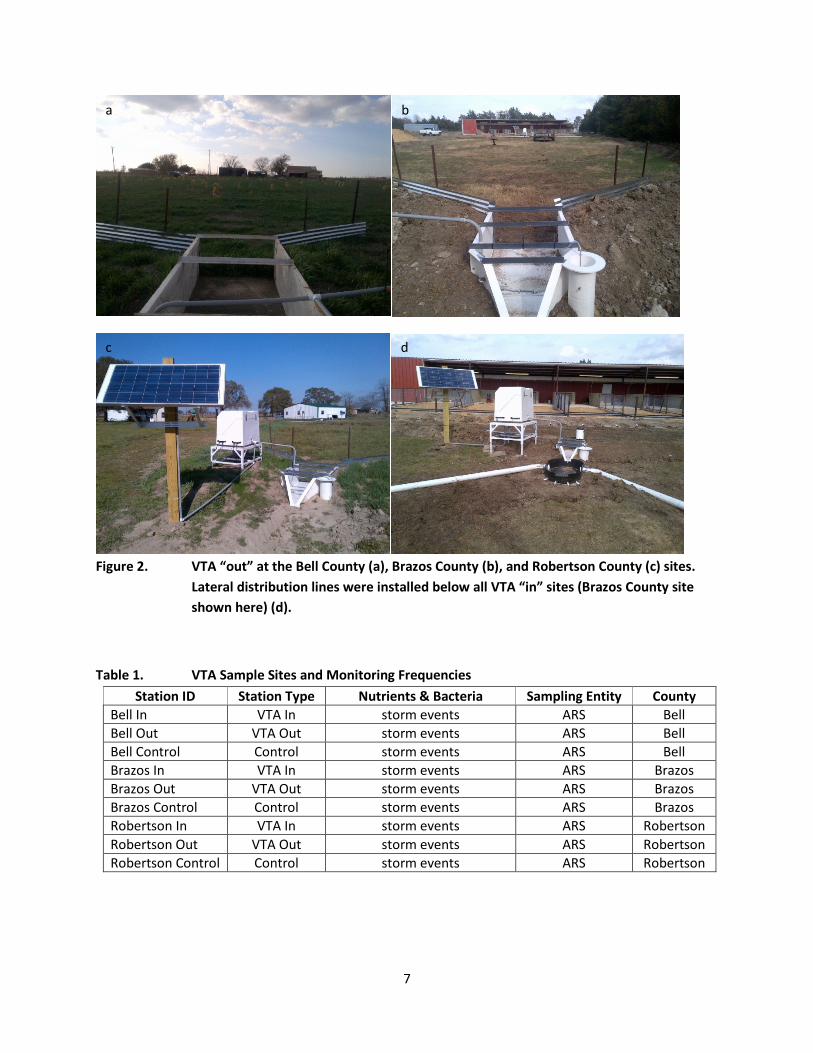
Figure 2. VTA “out” at the Bell County (a), Brazos County (b), and Robertson County (c) sites.
Lateral distribution lines were installed below all VTA “in” sites (Brazos County site shown here) (d).
Table 1. VTA Sample Sites and Monitoring Frequencies Station ID Station Type Nutrients & Bacteria Sampling Entity County
Bell In VTA In storm events ARS Bell Bell Out VTA Out storm events ARS Bell Bell Control Control storm events ARS Bell Brazos In VTA In storm events ARS Brazos Brazos Out VTA Out storm events ARS Brazos Brazos Control Control storm events ARS Brazos Robertson In VTA In storm events ARS Robertson Robertson Out VTA Out storm events ARS Robertson Robertson Control Control storm events ARS Robertson
a b
c d
8
For runoff events, water samples were stored at 4oC in the refrigerated samplers immediately following collection. Samples were retrieved from the field and analyzed within 24 hours of the first sample and were transported to the lab on ice. Approximately 100 mL was poured into a Nasco Whirl-Pak (NASCO, Inc., Fort Atkinson, Wisc.) sterilized bag and transported on ice to the Texas A&M University Soil and Aquatic Microbiology Laboratory for bacteria analysis. In addition, three separate 20 mL high density polyethylene bottles were filled and analyzed by ARS for dissolved nitrate + nitrite (NO3+NO2-N), ammonium (NH4-N), orthophosphate (PO4-P), total N, and total P.
To assess nutrient accumulation and movement in the VTAs, soil samples were collected throughout each VTA using a sampling grid. Soil samples were collected twice annually from each grid location and analyzed by Ward Laboratories, Inc. for inorganic P and N.
Results
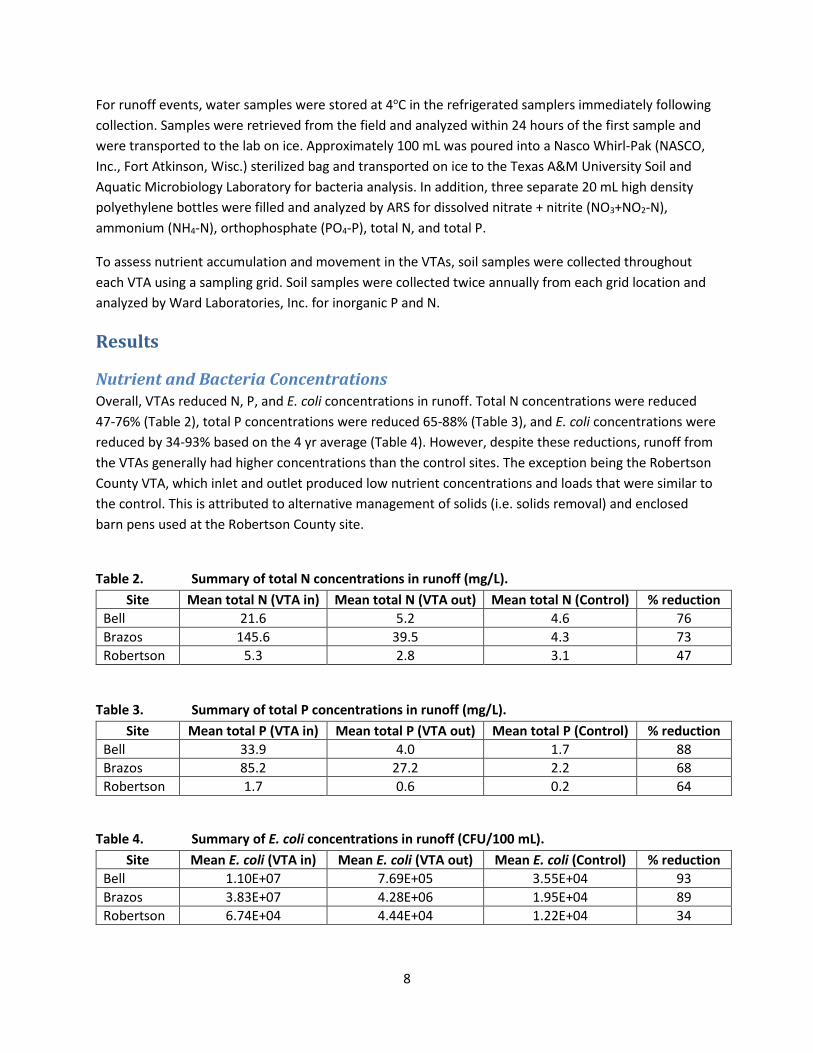
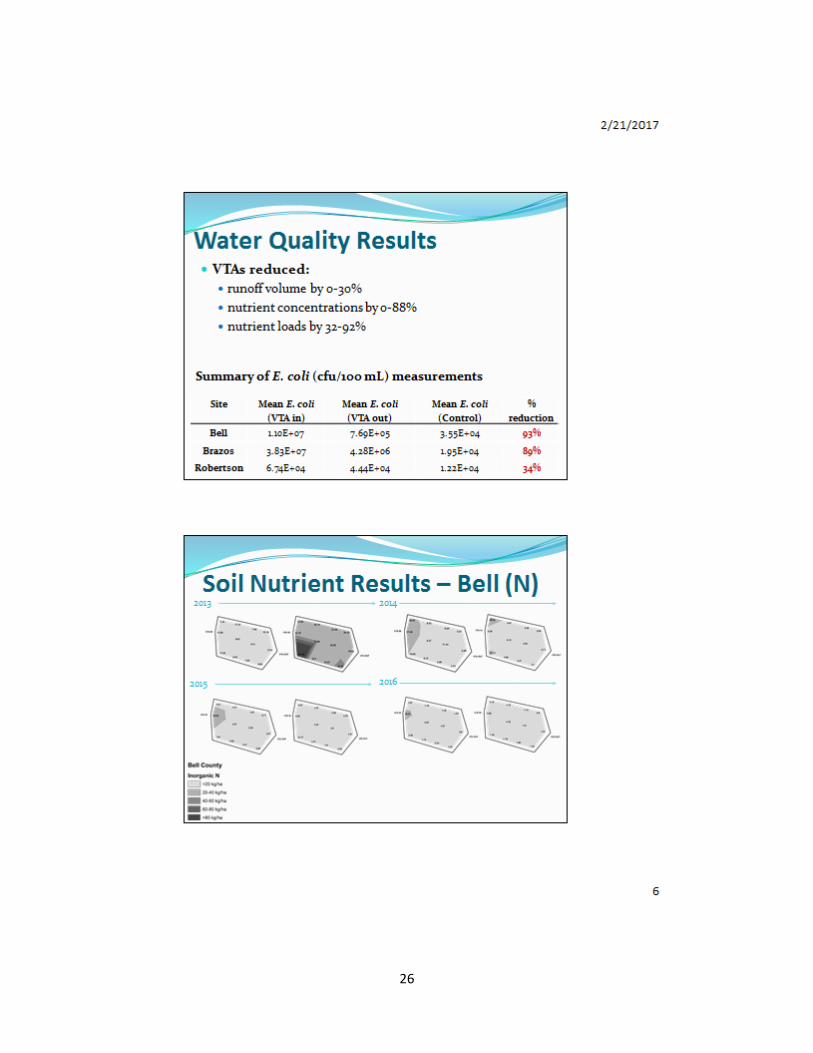
Nutrient and Bacteria Concentrations Overall, VTAs reduced N, P, and E. coli concentrations in runoff. Total N concentrations were reduced 47-76% (Table 2), total P concentrations were reduced 65-88% (Table 3), and E. coli concentrations were reduced by 34-93% based on the 4 yr average (Table 4). However, despite these reductions, runoff from the VTAs generally had higher concentrations than the control sites. The exception being the Robertson County VTA, which inlet and outlet produced low nutrient concentrations and loads that were similar to the control. This is attributed to alternative management of solids (i.e. solids removal) and enclosed barn pens used at the Robertson County site.
Table 2. Summary of total N concentrations in runoff (mg/L).
Site Mean total N (VTA in) Mean total N (VTA out) Mean total N (Control) % reduction Bell 21.6 5.2 4.6 76 Brazos 145.6 39.5 4.3 73 Robertson 5.3 2.8 3.1 47
Table 3. Summary of total P concentrations in runoff (mg/L). Site Mean total P (VTA in) Mean total P (VTA out) Mean total P (Control) % reduction
Bell 33.9 4.0 1.7 88 Brazos 85.2 27.2 2.2 68 Robertson 1.7 0.6 0.2 64
Table 4. Summary of E. coli concentrations in runoff (CFU/100 mL). Site Mean E. coli (VTA in) Mean E. coli (VTA out) Mean E. coli (Control) % reduction
Bell 1.10E+07 7.69E+05 3.55E+04 93 Brazos 3.83E+07 4.28E+06 1.95E+04 89 Robertson 6.74E+04 4.44E+04 1.22E+04 34
9
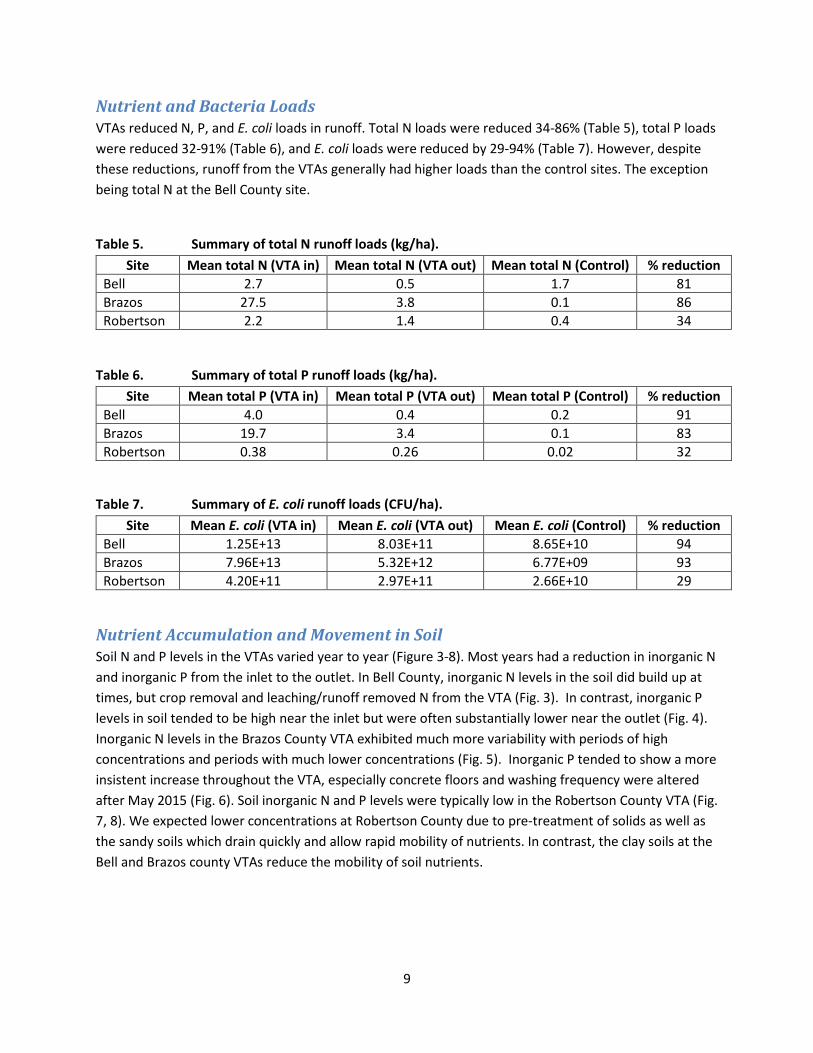
Nutrient and Bacteria Loads VTAs reduced N, P, and E. coli loads in runoff. Total N loads were reduced 34-86% (Table 5), total P loads were reduced 32-91% (Table 6), and E. coli loads were reduced by 29-94% (Table 7). However, despite these reductions, runoff from the VTAs generally had higher loads than the control sites. The exception being total N at the Bell County site.
Table 5. Summary of total N runoff loads (kg/ha).
Site Mean total N (VTA in) Mean total N (VTA out) Mean total N (Control) % reduction Bell 2.7 0.5 1.7 81 Brazos 27.5 3.8 0.1 86 Robertson 2.2 1.4 0.4 34
Table 6. Summary of total P runoff loads (kg/ha). Site Mean total P (VTA in) Mean total P (VTA out) Mean total P (Control) % reduction
Bell 4.0 0.4 0.2 91 Brazos 19.7 3.4 0.1 83 Robertson 0.38 0.26 0.02 32
Table 7. Summary of E. coli runoff loads (CFU/ha). Site Mean E. coli (VTA in) Mean E. coli (VTA out) Mean E. coli (Control) % reduction
Bell 1.25E+13 8.03E+11 8.65E+10 94 Brazos 7.96E+13 5.32E+12 6.77E+09 93 Robertson 4.20E+11 2.97E+11 2.66E+10 29
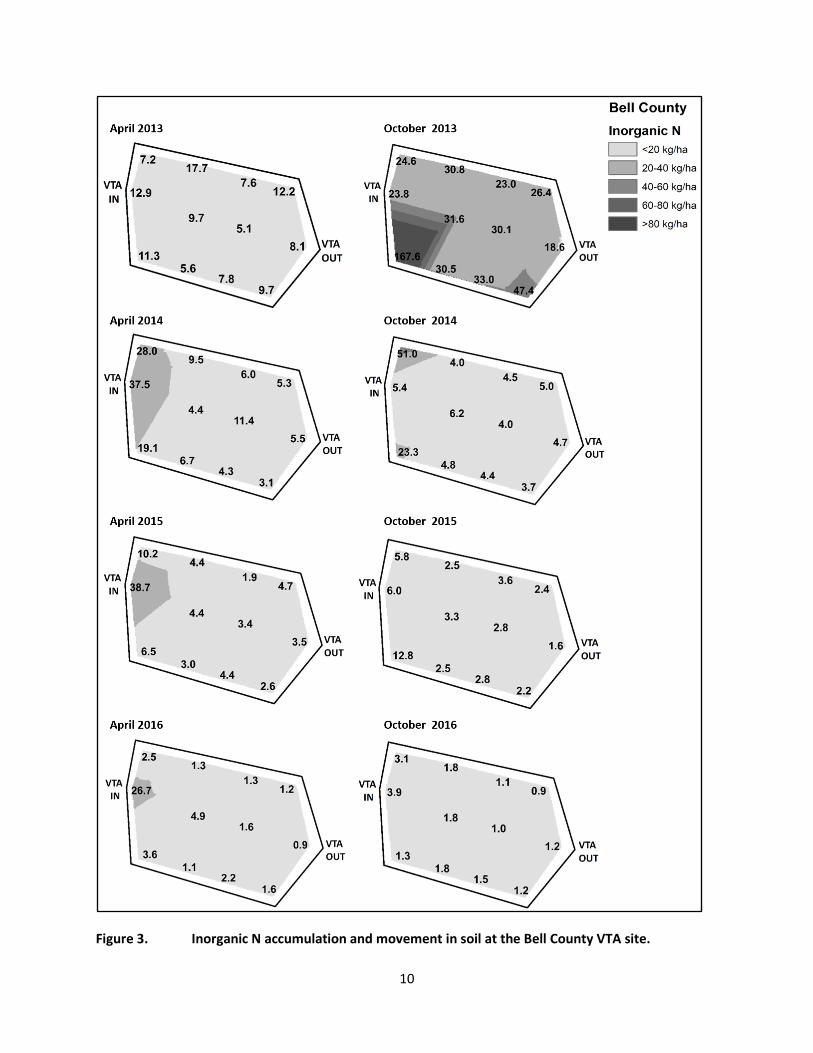
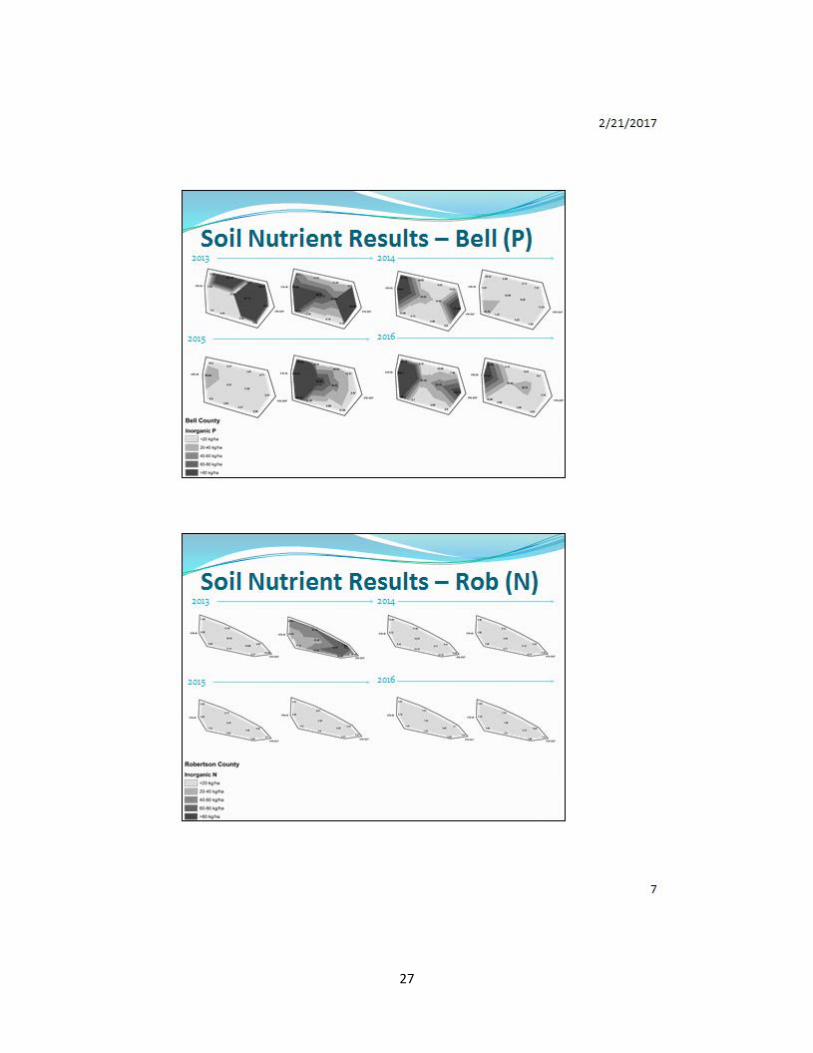
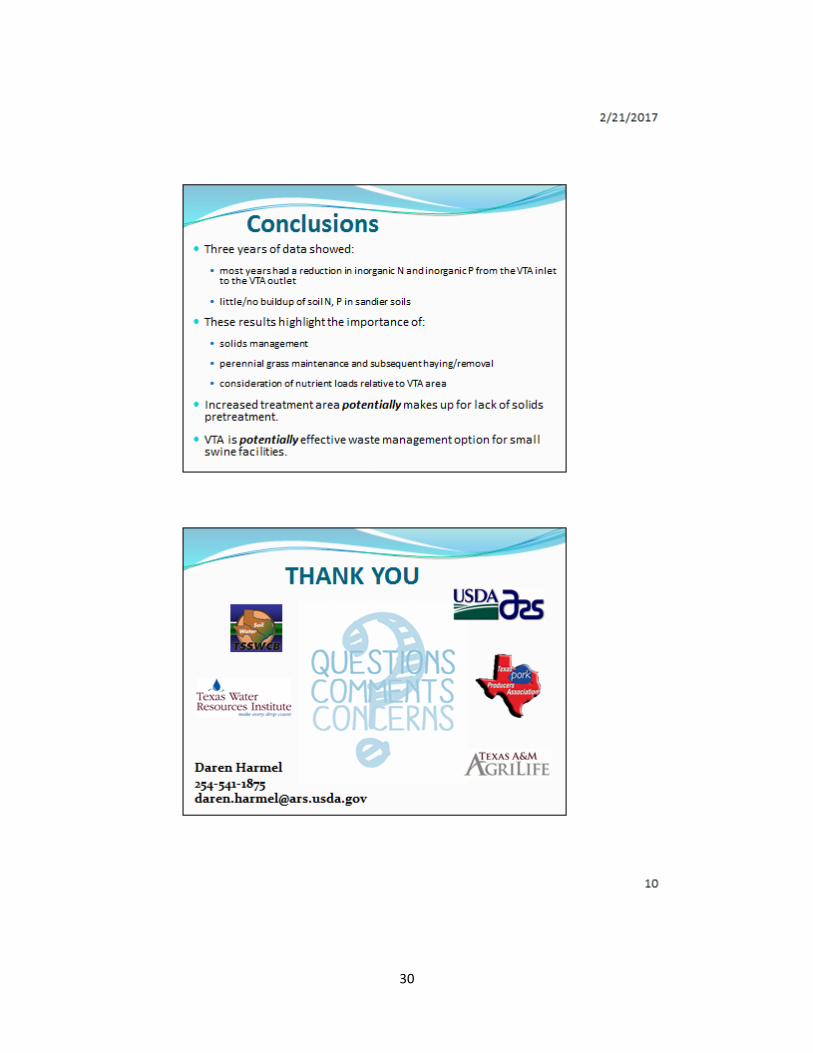
Nutrient Accumulation and Movement in Soil Soil N and P levels in the VTAs varied year to year (Figure 3-8). Most years had a reduction in inorganic N and inorganic P from the inlet to the outlet. In Bell County, inorganic N levels in the soil did build up at times, but crop removal and leaching/runoff removed N from the VTA (Fig. 3). In contrast, inorganic P levels in soil tended to be high near the inlet but were often substantially lower near the outlet (Fig. 4). Inorganic N levels in the Brazos County VTA exhibited much more variability with periods of high concentrations and periods with much lower concentrations (Fig. 5). Inorganic P tended to show a more insistent increase throughout the VTA, especially concrete floors and washing frequency were altered after May 2015 (Fig. 6). Soil inorganic N and P levels were typically low in the Robertson County VTA (Fig. 7, 8). We expected lower concentrations at Robertson County due to pre-treatment of solids as well as the sandy soils which drain quickly and allow rapid mobility of nutrients. In contrast, the clay soils at the Bell and Brazos county VTAs reduce the mobility of soil nutrients.
10
Figure 3. Inorganic N accumulation and movement in soil at the Bell County VTA site.

11
Figure 4. Inorganic P accumulation and movement in soil at the Bell County VTA site.

12
Figure 5. Inorganic N accumulation and movement in soil at the Brazos County VTA site.
13
Figure 6. Inorganic P accumulation and movement in soil at the Brazos County VTA site.

14
Figure 7. Inorganic N accumulation and movement in soil at the Robertson County VTA site.
15
Figure 8. Inorganic P accumulation and movement in soil at the Robertson County VTA site.

16
Result dissemination To disseminate results of the VTA evaluation, a journal article describing the effects of VTAs on nutrient and bacteria runoff will be submitted in 2017. The fact sheet developed in 2016 summarizing VTAs and their effectiveness was updated to reflect all four years of data (Appendix A). This will be disseminated to pork producers and others (i.e. NRCS, Extension, and TSSWCB). Finally, a presentation (Appendix B) and poster (Appendix C) were also developed for delivery to the Texas Pork Producers Association and others (e.g., NRCS and TSSWCB). These final products will be provided to the NRCS State Office for final determination of needed changes to standards and specifications.
Conclusions VTAs installed below small pork production facilities in Texas were able to effectively reduce nutrient and bacteria runoff; however, runoff concentrations and loads from the VTAs typically exceeded those of nearby control sites representing typical rural land use (not in agricultural production). Based on evaluation results, VTAs were found to be practical, environmentally-friendly waste management alternatives for reducing nutrient and bacteria loading from small pork production operations if proper consideration is given to design and management factors (e.g., solids management, perennial grass cover and subsequent haying and removal, and nutrient loads/VTA area).

17
Appendix A – 2017 Fact Sheet

18

19

20
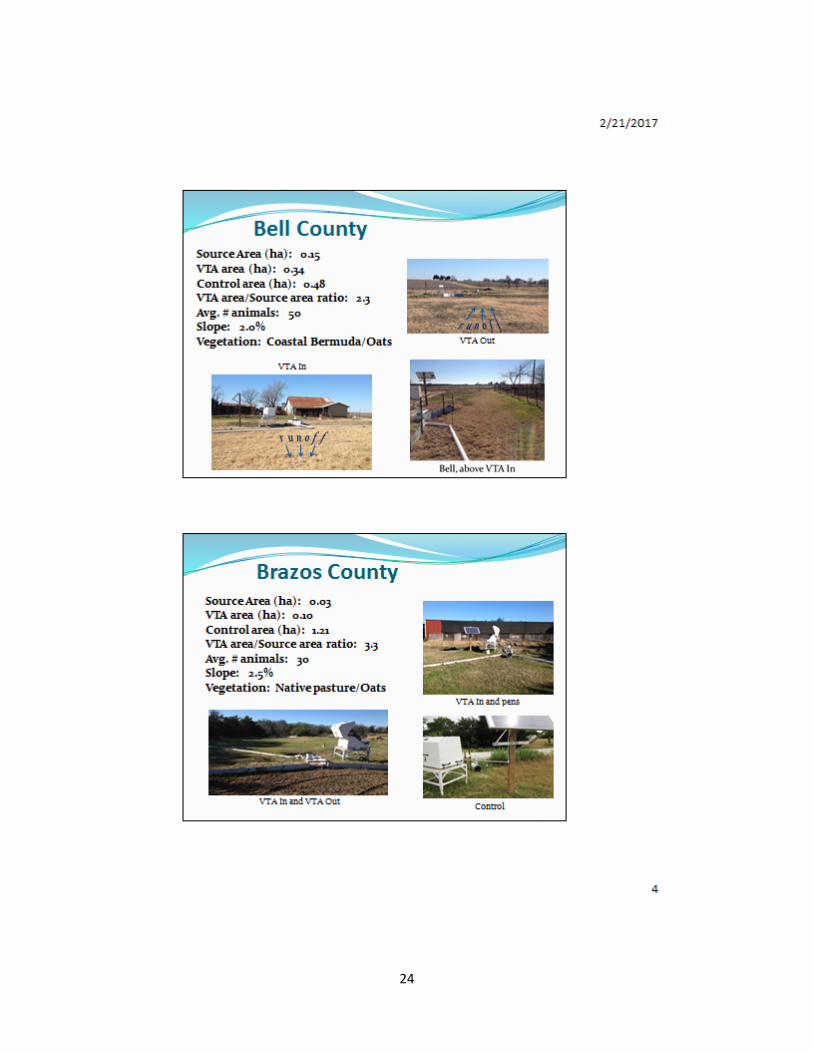
Appendix B – Presentation
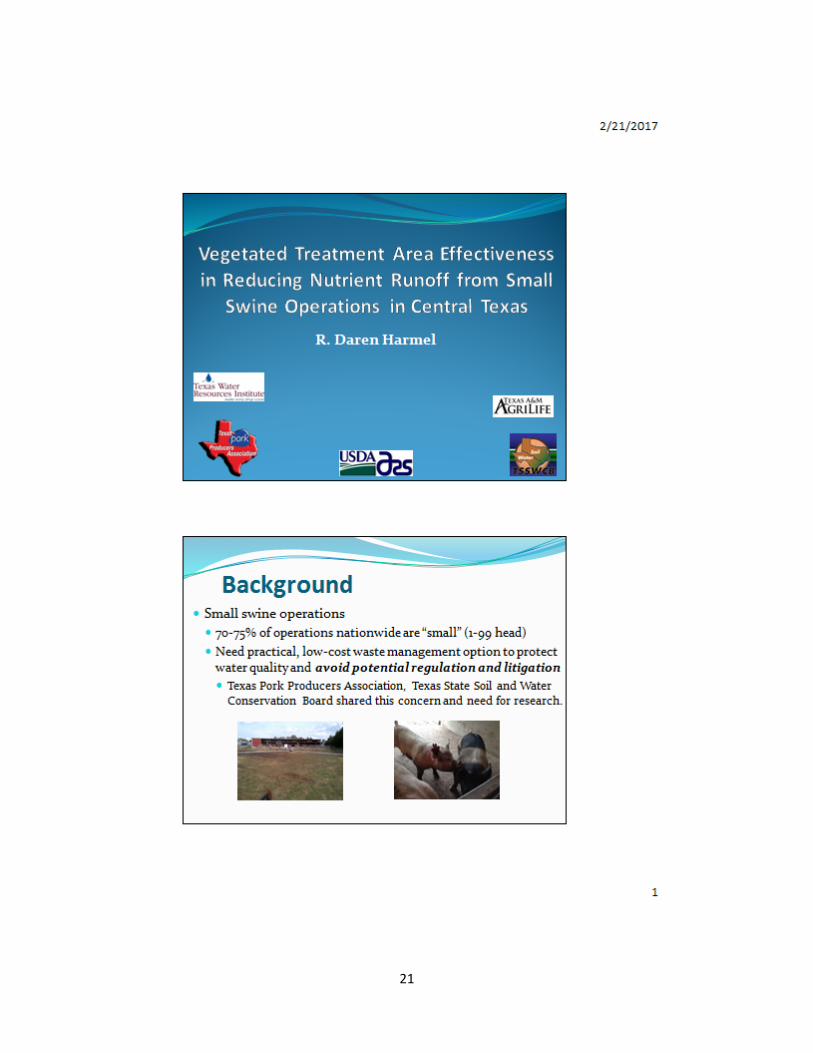
21

22

23
24
25
26
27

28

29
30

31
Appendix C – Poster

32