improving radiation and stress...
TRANSCRIPT
University of Nebraska - LincolnDigitalCommons@University of Nebraska - LincolnMechanical (and Materials) Engineering --Dissertations, Theses, and Student Research
Mechanical & Materials Engineering, Departmentof
Spring 4-22-2016
IMPROVING RADIATION AND STRESSCORROSION CRACKING RESISTANCE OFAUSTENITIC STAINLESS STEELS BY LASERSHOCK PEENINGQiaofeng LuUniversity of Nebraska-Lincoln, [email protected]
Follow this and additional works at: http://digitalcommons.unl.edu/mechengdiss
Part of the Mechanical Engineering Commons
This Article is brought to you for free and open access by the Mechanical & Materials Engineering, Department of at DigitalCommons@University ofNebraska - Lincoln. It has been accepted for inclusion in Mechanical (and Materials) Engineering -- Dissertations, Theses, and Student Research by anauthorized administrator of DigitalCommons@University of Nebraska - Lincoln.
Lu, Qiaofeng, "IMPROVING RADIATION AND STRESS CORROSION CRACKING RESISTANCE OF AUSTENITICSTAINLESS STEELS BY LASER SHOCK PEENING" (2016). Mechanical (and Materials) Engineering -- Dissertations, Theses, andStudent Research. Paper 97.http://digitalcommons.unl.edu/mechengdiss/97

IMPROVING RADIATION AND STRESS CORROSION CRACKING
RESISTANCE OF AUSTENITIC STAINLESS STEELS BY LASER SHOCK
PEENING
by
Qiaofeng Lu
A THESIS
Presented to the Faculty of
The Graduate College at the University of Nebraska
In Partial Fulfillment of Requirements
For the Degree of Master of Science
Major: Mechanical Engineering and Applied Mechanics
Under the Supervision of Professor Bai Cui
Lincoln, Nebraska
May, 2016
IMPROVING RADIATION AND STRESS CORROSION CRACKING
RESISTANCE OF AUSTENITIC STAINLESS STEELS BY LASER SHOCK
PEENING
Qiaofeng Lu, M.S
University of Nebraska 2016
Advisor: Bai Cui
Structural alloys for Generation-IV nuclear reactors need to endure a high neutron
dose, high temperature, and corrosive coolant. Austenitic stainless steels, particularly the
oxide-dispersion-strengthened (ODS) austenitic steels, are promising candidate materials,
but they suffer several limits such as irradiation damage and stress corrosion cracking
(SCC). This research applies a laser shock peening (LSP) process to improve the
radiation and SCC resistance of austenitic stainless steels in simulated nuclear reactor
environments. A high density dislocation networks, stacking faults and twin boundaries
were generated in the surface region of 304 steels by the shock wave-material
interactions in the LSP process. In-situ TEM irradiation experiments suggest that laser-
peened 304 steels suffer less radiation damage than the untreated samples because the
generated dislocation networks and twin boundaries serve as sinks for the annihilation of
irradiation defects. Stress corrosion cracking tests show that transgranular cracks
propagate in the untreated 304 steels, while no apparent cracks were observed in laser
peened 304 steel samples on the same conditions.

ACKNOWLEDGEMENTS
I would like to express my special gratitude to my committee chair, Professor Bai Cui
and my committee members, Professor Jeffery Shield and Professor Michael Nastasi. I
appreciate all the comments, discussions and suggestions you have given on my research
and thesis.
It is my pleasure to acknowledge the staff at the Argonne National Lab, Dr. Meimei
Li, Dr. Mark Kirk, Pete Baldo and Ed Ryan for offering me the technical supports in the
Intermediate Voltage Electron Microscopy (IVEM)-Tandem Facility.
I would also like to thank the staff at the Nebraska Center for Materials and
Nanoscience (NCMN) at University of Nebraska Lincoln for all the trainings and efforts
to keep the facility maintained in good conditions for my research.
I am also indebted to my colleague Fei Wang in my research group for the generous
help and countless advice throughout my research and study. It is always a great time
working and having discussions with you! Thank you and thank all the people who help
me during my graduate study and research.
In the end, I owe my sincere gratitude to my family, who served as a solid foundation
in my life and provided countless supports for my graduate study. I could not go this far
without you!

TABLE OF CONTENTS
CHAPTER 1: INTRODUCTION AND BACKGROUND……………............……....….1
1.1 Motivation……………………………………………………………..............…...1
1.2 Austenitic Stainless Steel and Oxide-Dispersion-Strengthened Steels.....................2
1.3 Laser Shock Peening…..........................………………………………..….............4
1.3.1 Principle of Laser Shock Peening.................................................…...............4
1.3.2 Laser Shock Processing effect on Inducing Compressive Residual Stress.......7
1.3.3 Laser Shock Processing effect on Mechanical Properties……….….............11
1.4 Radiation Damage………….…………………………………………….............16
1.4.1 Influencing Factors in Radiation Damage.........….………………….............18
1.4.2 Enhancement of Radiation Resistance………....….………………….............18
1.5 Stress Corrosion Cracking in Austenitic Stainless Steels......................................22
1.5.1 Influence Factors in Stress Corrosion Cracking..............................................22
1.5.2 Proposed Mechanism for Stress Corrosion Cracking.......................................29
CHAPTER 2: EXPERIMENTAL METHODS…………….....…………………............33
2.1 Sample Preparation and Laser Shock Peening Treatment...................................33
2.2 Microstructure Characterization of the LSP samples..........................................35
2.3 In-situ irradiation TEM experiment for LSP and untreated samples..................37
2.4 Stress Corrosion Cracking Tests for LSP and untreated samples........................41

CHAPTER 3: RESULTS AND DISCUSSION…………….......…………………..........45
3.1 Observation of cross-sectional grain structure by SEM.......................................45
3.2 Observation of the surface microstructure after LSP by TEM.............................46
3.3 Loop density analysis at stacking fault region......................................................49
3.4 Loop density analysis at twin boundary region....................................................56
3.5 Microstructural evolution of LSP at elevated temperature...................................59
3.6 Comparison of sink strength for twins and dislocations.......................................61
3.7 Analysis of the LSP effect on Stress Corrosion Cracking....................................63
3.8 Future Work .........................................................................................................68
CHAPTER 4: CONCLUSION..........................................................................................70
REFERENCES..................................................................................................................72

LIST OF FIGURES
Figure 1.1 Morphology of the nano oxide particles in austenitic steel matrix....................3
Figure 1.2 Principle of Laser Shock Peening ...................……………………………….8
Figure 1.3 Principle of residual stress measurement via 𝑠𝑖𝑛𝜑2method............................8
Figure 1.4 Relationship of Bragg’s angle and φ angle......................................................9
Figure 1.5 Stress Profile for untreated and LSP AISI 304 steel..........................................9
Figure 1.6 Comparison of fatigue behavior for 2024-T3 aluminum alloy with laser shock
peening, shot peening and without any peening t rea tment . . . . . . . . . . . . . . .12
Figure 1.7 Dependence of average surface hardness on peak shock pressure by different
surface modification...........................................................................................................14
Figure 1.8 Effect of shock peening on Vickers Hardness for A356-T6 and 7075-T351
aluminum alloys.................................................................................................................14
Figure 1.9 Grain Refinement Mechanism of laser shock peened ANSI 304 steel............15
Figure 1.10 Effect of temperature on radiat ion -induced microstructural
evolution....................................................................................................................18
Figure 1.11 Sink strength effect on radiance-induced hardening for different material....21
Figure 1.12 Transgranular and intergranular stress corrosion cracking morphology........23
Figure 1.13 Conditions for the occurrence of stress corrosion cracking (SCC)................23
Figure 1.13 The anodic polarization curve to show zones susceptible to
SCC.................................................................................................................................26
Figure 1.14 Three crack modes in f rac ture mechanics . . . . . . . . . . . . . . . . . . . . .28
Figure 1.15 The Edge crack in a finite plate under uniaxial stress model for determining
the stress intensity factor........................................................................................28
Figure 1.16 Theoretical curve of crack growth rate as a function of stress intensity
factor.................................................................... .......................................29
Figure 1.17 Illustration of the film rupture model for SCC.........................................31
Figure 1.18 Effect of hydrogen contamination and concentration on crack growth rate in
low alloy steel....................................................................................................................31
Figure 2.1 Basic setup of laser shock peening...................................................................34
Figure 2.2 Principle of laser shock peening effect on resisting SCC.................... ............35
Figure 2.3 Calibration curve for twin-jet-polishing...........................................................37
Figure 2.4 IVEM (with an accelerator) for the in-situ irradiation TEM experiment at
Argonne National Lab....................................................................................................40
Figure 2.5 Principle of bright-field and dark-field TEM imaging.....................................40
Figure 2.5 Basic setup of proof ring system......................................................................43
Figure 2.6 Dimension of SCC specimen for proof ring system.........................................43
Figure 2.7 Calibration curve of applied load as a function of displacement.....................44
Figure 3.1 Cross-sectional morphology of 304 stainless steel before and after LSP.......46
Figure 3.2 Microstructure evolution of 304 stainless steel surface after LSP..................47
Figure 3.3 Microstructure of 304 stainless steel surface without LSP..............................49
Figure 3.4 The process of absorbing loops by dislocation lines and tangles.....................51
Figure 3.5 Comparison of radiation damage on 304 steel with and without LSP.............54
Figure 3.6 Loop density as a function of radiation dose at stacking fault region of LSP
304 steel at different temperature .....................................................................................55
Figure 3.7 Temperature effect on the microstructure of the LSP 304 steel.......................55
Figure 3.8 The process of absorbing loops by twin boundary...........................................57
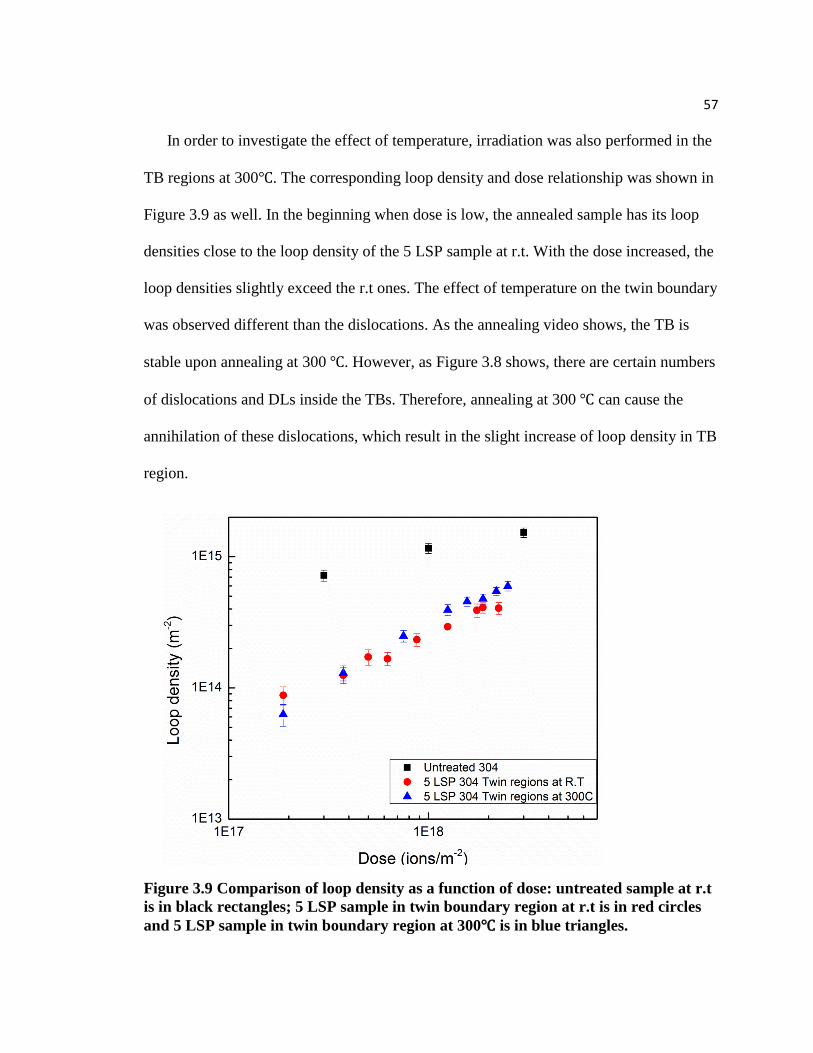
Figure 3.9 Loop density as a function of dose at twin boundary region of 304 steel at
different temperature..........................................................................................................58
Figure 3.10 Temperature effect on twin boundary of LSP 304 steel.................................61
Figure 3.11 Index of the twin boundary diffraction pattern.....................................63
Figure 3.12 Crack length of 304 stainless steel after subjected 30 hours and 35 hours SCC
tests............................................................................................. .................64
Figure 3.13 Crack length as a function of time for 304 stainless steels...........................65
Figure 3.14 Crack length as a function of time for 304 ODS steels.................................65
Figure 3.15 Crack growth rate as a function of stress intensity factor.........................66
Figure 3.16 Crack morphology in the cross-section of the untreated 304 stainless steel..67
Figure 3.17 Cross-sectional grain morphology of the laser peened 304 stainless steel
subjected to 96 hours SCC test.........................................................................................68

1
CHAPTER 1: INTRODUCTION AND BACKGROUND
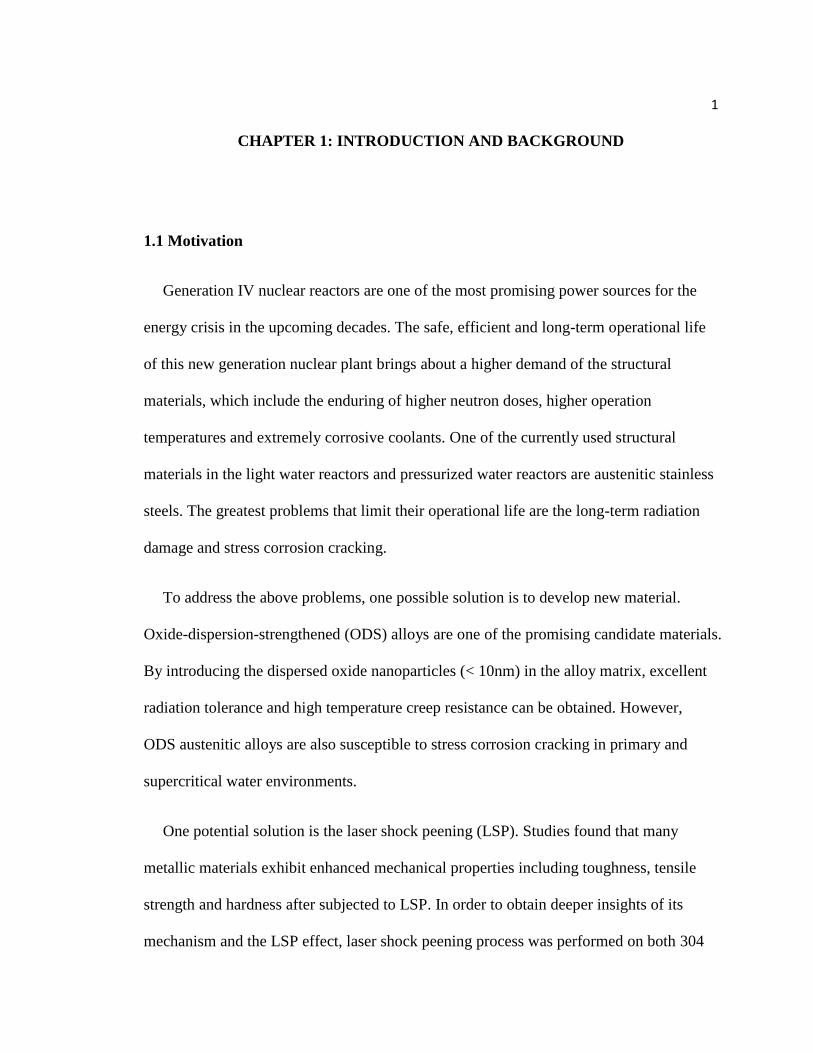
1.1 Motivation
Generation IV nuclear reactors are one of the most promising power sources for the
energy crisis in the upcoming decades. The safe, efficient and long-term operational life
of this new generation nuclear plant brings about a higher demand of the structural
materials, which include the enduring of higher neutron doses, higher operation
temperatures and extremely corrosive coolants. One of the currently used structural
materials in the light water reactors and pressurized water reactors are austenitic stainless
steels. The greatest problems that limit their operational life are the long-term radiation
damage and stress corrosion cracking.
To address the above problems, one possible solution is to develop new material.
Oxide-dispersion-strengthened (ODS) alloys are one of the promising candidate materials.
By introducing the dispersed oxide nanoparticles (< 10nm) in the alloy matrix, excellent
radiation tolerance and high temperature creep resistance can be obtained. However,
ODS austenitic alloys are also susceptible to stress corrosion cracking in primary and
supercritical water environments.
One potential solution is the laser shock peening (LSP). Studies found that many
metallic materials exhibit enhanced mechanical properties including toughness, tensile
strength and hardness after subjected to LSP. In order to obtain deeper insights of its
mechanism and the LSP effect, laser shock peening process was performed on both 304

2
and 304 ODS stainless steels followed by microstructural characterization, in-situ
irradiation transmission electron microscopy and stress corrosion cracking test.
1.2 Austenitic Stainless Steels and Oxide-Dispersion-Strengthened Steels
Austenitic stainless steels are the most common types of stainless steels. The austenite
phase is face-center cubic (FCC) structure which leads to the high toughness, ductility
and formability of the austenitic stainless steels. Typical compositions of austenitic
stainless steels include chromium and nickel. The addition of chromium can increase the
strength and most importantly, increase the resistance against corrosion of the steels and
the addition of nickel serves the function of stabilizing the austenite phase of the steel.
One weakness of austenitic stainless steels is their low strength compared to other types
of steels, but they can be easily strengthened by cold-working such as rolling, drawing,
bending or shearing. Another weakness is their susceptibility to stress corrosion cracking
(SCC). Since many of the structural steels are used in a stress and corrosive environment,
this SCC problem can greatly lower their operational life and increase the cost [1].
In contrast to the traditional stainless steels, oxide-dispersion-strengthened (ODS)
steels, especially the ODS austenitic stainless steels are among the most promising
structural materials. One application of ODS austenitic stainless steels is as structural
materials for the Generation IV nuclear power plants. ODS austenitic stainless steels are
known to exhibit excellent mechanical properties such as high strength, long fatigue life,
low creep at high temperature etc. and the extraordinary high resistance against radiation
3
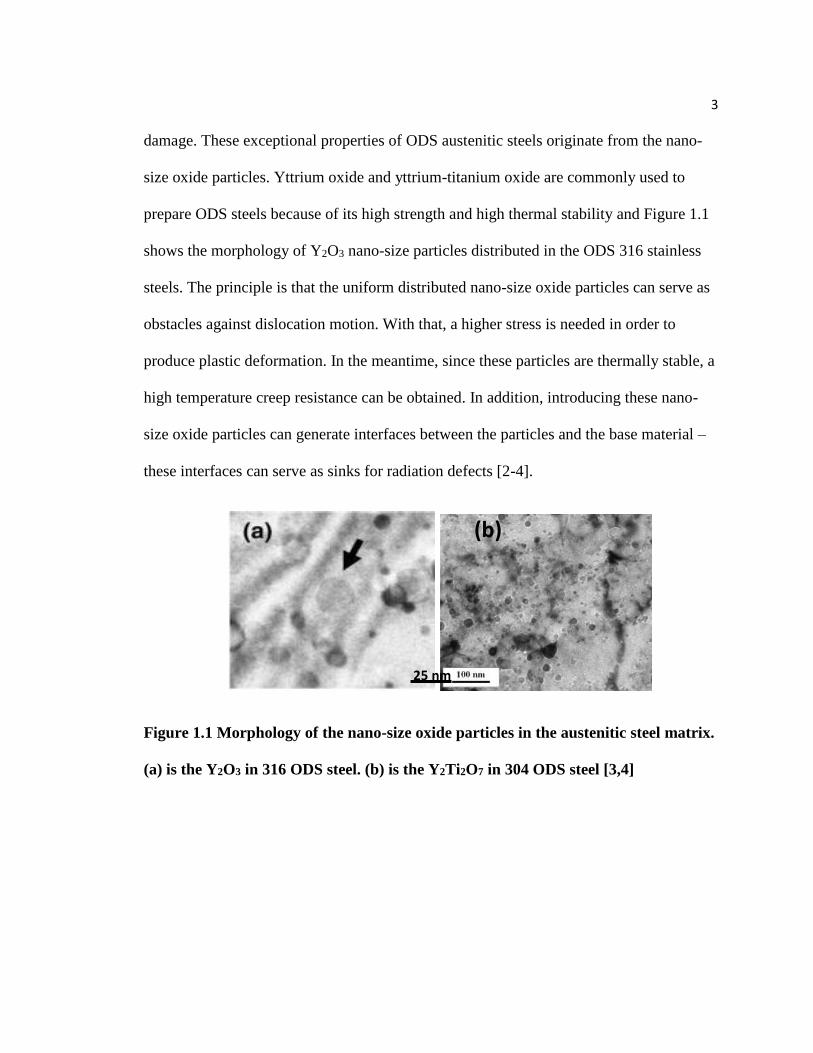
damage. These exceptional properties of ODS austenitic steels originate from the nano-
size oxide particles. Yttrium oxide and yttrium-titanium oxide are commonly used to
prepare ODS steels because of its high strength and high thermal stability and Figure 1.1
shows the morphology of Y2O3 nano-size particles distributed in the ODS 316 stainless
steels. The principle is that the uniform distributed nano-size oxide particles can serve as
obstacles against dislocation motion. With that, a higher stress is needed in order to
produce plastic deformation. In the meantime, since these particles are thermally stable, a
high temperature creep resistance can be obtained. In addition, introducing these nano-
size oxide particles can generate interfaces between the particles and the base material –
these interfaces can serve as sinks for radiation defects [2-4].
Figure 1.1 Morphology of the nano-size oxide particles in the austenitic steel matrix.
(a) is the Y2O3 in 316 ODS steel. (b) is the Y2Ti2O7 in 304 ODS steel [3,4]
25 nm
(b)

4
1.3 Laser Shock Peening
1.3.1 Principle of Laser Shock Processing
Laser shock peening, also known as laser shock processing was first discovered in
early 1960s and now is developed as a novel cold-working method for surface
modification [5-7]. Prior to the discovery and development of laser shock processing,
shot peening is the dominating surface modification method to induce compressive
residual stress and to improve mechanical properties by cold-working. The limitations of
shot peening process are obvious, including its instability of the peening energy, low
affected depth and rough surface finish. As a result, when laser shock processing was first
found with the advantages of stable energy and well surface finish, it kindled the interest
of many scientists. Subsequent researches successfully improved the energy intensity,
depth of affected zone as well as many other aspects of this technique and made it
possible to induce residual compressive stress and plastic deformation of the material
while maintaining a smooth surface finish [8-14].
The Q-switched laser pulse with the yttrium aluminum garnet (YAG) crystal lasing
rod is commonly used for research purpose because of its low cost, high efficiency and
reliability. Compared with other sources, the Q-switched source has the characteristics of
high energy intensity and short duration time, which are advantageous for producing
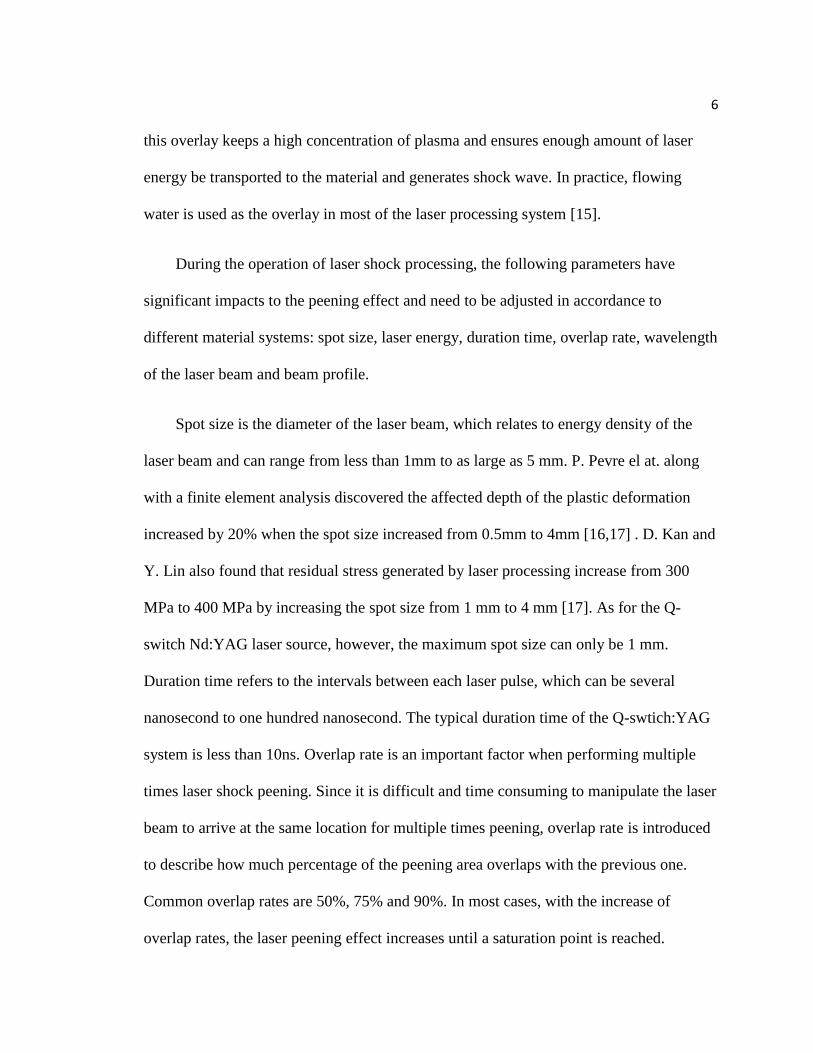
shock waves. The mechanism of shock wave generation and propagation have been
studied and can be simplified in Figure 1.1[3] below: it started as the laser pulse hits the
material, because of the high energy intensity of the laser source, material will vaporize

5
and form a plasma on its top. A plasma consists of high temperature gas with large
numbers of electron charges. Depending on the relative number of positive ions versus
negative charges, a plasma can be positively, negatively charged and neural. In the case
of laser shock peening, the plasma is composed by high temperature vaporized gas with
an equal number of positive ions and negative electrons. As a result, this generated
plasma can expand by continuously absorbing the laser energy and embracing the
vaporized material. A pressure as high as several hundred GPa can thus be exerted on the
surface of the material and produce a stress field. In this way, the absorbed laser energy
converts into mechanical energy and can finally transport to the material in the form of
shock waves. When the shock wave accumulates to a point that the stress field produced
by it exceeds the yield strength of the material, plastic deformation occurs. In the
meantime, as shock wave can propagate to the interior of the sample, plastic deformation
can take place several millimeter depth from the surface.
Note Figure.1 that there is a sacrificial coating and a transparent overlay on top of
the sample. Both of them are designed to enhance intensity of the shock wave and
facilitate its propagation. The function of the sacrificial layer is to protect the material
from melting and ablation which are disadvantageous to the formation of plasma as well
as the surface finish. Two common types of sacrificial coatings are metallic coating and
organic coating. The former one uses metal with high melting point and excellent heat
conductivity such as aluminum, zinc and copper. The latter one is proved to have higher
thermal absorption and be beneficial to the smooth surface finish. The transparent overlay
works as a confinement of the plasma region from the over-expanding. In other words,
6
this overlay keeps a high concentration of plasma and ensures enough amount of laser
energy be transported to the material and generates shock wave. In practice, flowing
water is used as the overlay in most of the laser processing system [15].
During the operation of laser shock processing, the following parameters have
significant impacts to the peening effect and need to be adjusted in accordance to
different material systems: spot size, laser energy, duration time, overlap rate, wavelength
of the laser beam and beam profile.
Spot size is the diameter of the laser beam, which relates to energy density of the
laser beam and can range from less than 1mm to as large as 5 mm. P. Pevre el at. along
with a finite element analysis discovered the affected depth of the plastic deformation
increased by 20% when the spot size increased from 0.5mm to 4mm [16,17] . D. Kan and
Y. Lin also found that residual stress generated by laser processing increase from 300
MPa to 400 MPa by increasing the spot size from 1 mm to 4 mm [17]. As for the Q-
switch Nd:YAG laser source, however, the maximum spot size can only be 1 mm.
Duration time refers to the intervals between each laser pulse, which can be several
nanosecond to one hundred nanosecond. The typical duration time of the Q-swtich:YAG
system is less than 10ns. Overlap rate is an important factor when performing multiple
times laser shock peening. Since it is difficult and time consuming to manipulate the laser
beam to arrive at the same location for multiple times peening, overlap rate is introduced
to describe how much percentage of the peening area overlaps with the previous one.
Common overlap rates are 50%, 75% and 90%. In most cases, with the increase of
overlap rates, the laser peening effect increases until a saturation point is reached.

7
1.3.2 Laser Shock Processing Effect on Inducing Compressive Residual Stress
One effect of the laser shock processing is the introduction of compressive residual
stress, which is perpendicular to the direction of the propagating shock wave. Many
studies have been carried out to determine the laser shock processing generated residual
stresses both on the surface and along the depth of the sample. The most commonly used
technique for residual stress measurement is called sin2ψ X-ray diffraction method.
Advantages of this method include: non-destructive, large depth penetration of X-ray
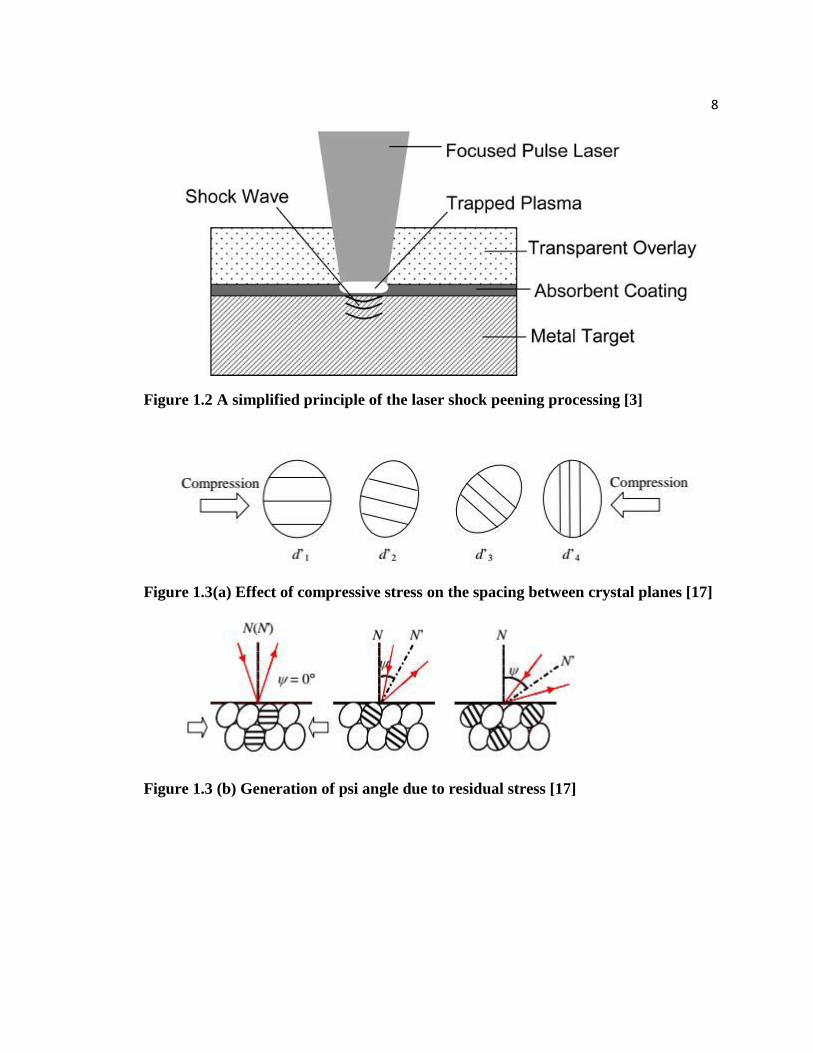
(about 10 micron) as well as controlled area or local region. The principle of this
measurement is the induced stress (compressive or tensile) will change the spacing of the
crystal plane or d-spacing of the material and this will generate an angle ψ between the
sample surface normal and lattice plane normal as shown in Figure 1.2 below. This angle
ψ along with the Bragg angle 2Ө are related to the stress value б by the following
equation:
σ = −𝐸
2(1+𝑣)∙ 𝑐𝑜𝑡𝜃0 ∙
𝜋
180∙
∆(2𝜗)
∆(𝑠𝑖𝑛2𝜑)= 𝐾 ∙
∆(2𝜃)
∆(𝑠𝑖𝑛2𝜑) Eqn. 1
where E is the Young’s modulus, ѵ is the Poisson’s ratio, Ө0 is the Bragg angle of the
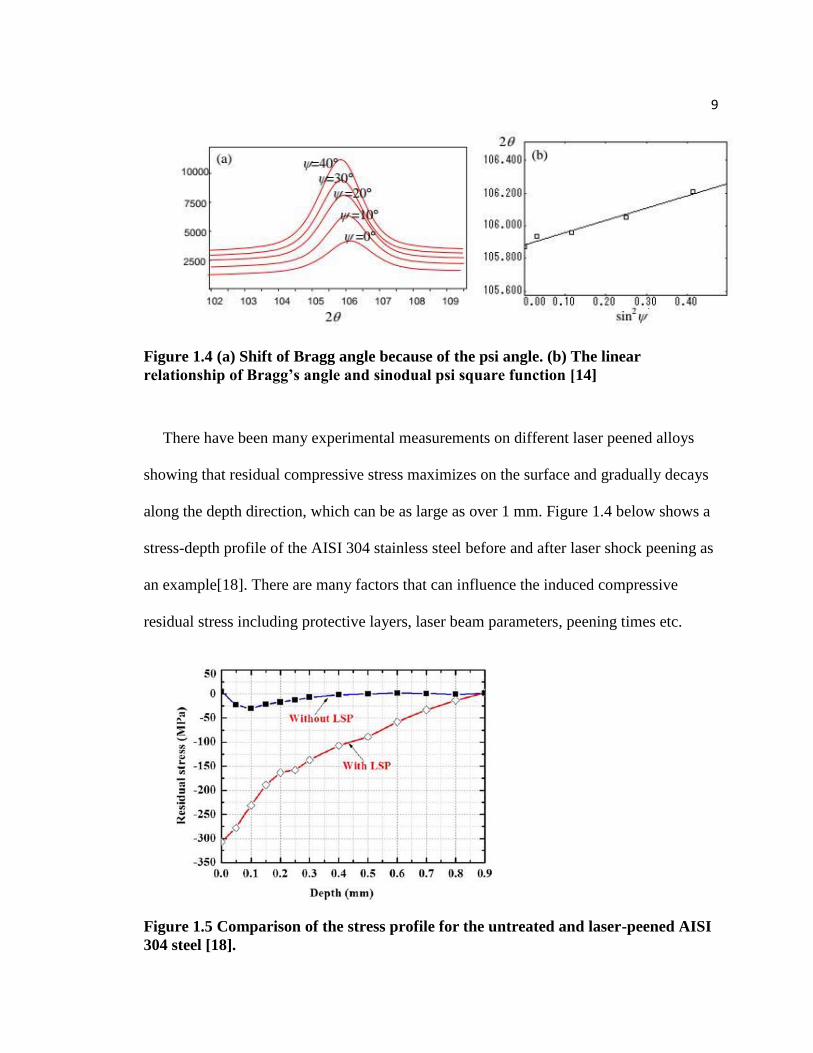
material free of stress. By irradiating the sample with varied ψ angle X-ray, different
Bragg angle 2Ө will be generated and the slope of linear curve plot with 2Ө versus sin2ψ
multiple by the stress constant can yield to the stress value of the sample. The peak shift
profile and the linear relationship of 2Ө versus sin2ψ is shown in Figure 1.3 below [17].
8
Figure 1.2 A simplified principle of the laser shock peening processing [3]
Figure 1.3(a) Effect of compressive stress on the spacing between crystal planes [17]
Figure 1.3 (b) Generation of psi angle due to residual stress [17]
9
Figure 1.4 (a) Shift of Bragg angle because of the psi angle. (b) The linear
relationship of Bragg’s angle and sinodual psi square function [14]
There have been many experimental measurements on different laser peened alloys
showing that residual compressive stress maximizes on the surface and gradually decays
along the depth direction, which can be as large as over 1 mm. Figure 1.4 below shows a
stress-depth profile of the AISI 304 stainless steel before and after laser shock peening as
an example[18]. There are many factors that can influence the induced compressive
residual stress including protective layers, laser beam parameters, peening times etc.
Figure 1.5 Comparison of the stress profile for the untreated and laser-peened AISI
304 steel [18].

10
The protective layers (coating), both the transparent overlay and the sacrificial layer
serve the function of preventing the ablation and melting of the material so that laser
energy can efficient generate shock wave and induce compressive residual stress. There
have been studies carried out to compare laser shock peening effect on samples with and
without protective layers. It was found that laser peened samples without any coating
exhibited a very small amount of compressive stress, some of which even exhibited
tensile residual stress [19,20] while samples with protective layers coated prior to the
peening process exhibit large compressive stress. Further experiments show non-coating
laser peened samples have very rough surface finish, which is a sign of ablation and will
result in a high susceptibility to corrosion cracking and low fatigue life. The influence of
laser beam parameters is mainly based on the fact that the laser generated shock wave is
directly related to the power density of the laser beam. Consequently, the peening times
matter significantly as in theory, the more peening processing have the sample went
through, the larger plastic deformation and more shock wave will accumulate in the
interior of the sample until saturation point is reached. Both experiment and simulation
by finite element analysis demonstrate that multiple laser shots can introduce larger
amount of compressive stress on surface as well as in depth[17,22]. For example, a three
pulse laser peening of the 7075 aluminum alloy can lead to a largest 340 MPa
compressive on the surface compared with a 240 MPa stress induced by two-time
peening and a 170 MPa stress induced by one-time peening.[23] In the meantime, a three-
time laser peening of 0.55% carbon steel shows a largest affected depth of 1.8 mm,

11
compared with a 1.4 mm affected depth for a two-time peening sample and a 0.9 mm
affected depth of a one-time peening sample.[24]
1.3.3 Laser Shock Peening Effect on Mechanical Properties
Another significant effect of laser shock processing is its improvement of mechanical
properties of material especially in fatigue life, toughness and hardness. Explanations for
these enhancements mainly focus on the induced compressive stress both on surface and
in depth and the microstructural evolution especially the generation of defects and grain
refinement phenomenon.
There have been studies in many types of metallic material including steels, titanium
alloys and aluminum alloys on the growth of their pre-existing crack under cyclic
working showing that after subjected to single or multiple laser shock peening, samples
exhibit a greater resistance against crack initiation and a slower crack growth rate [25-27].
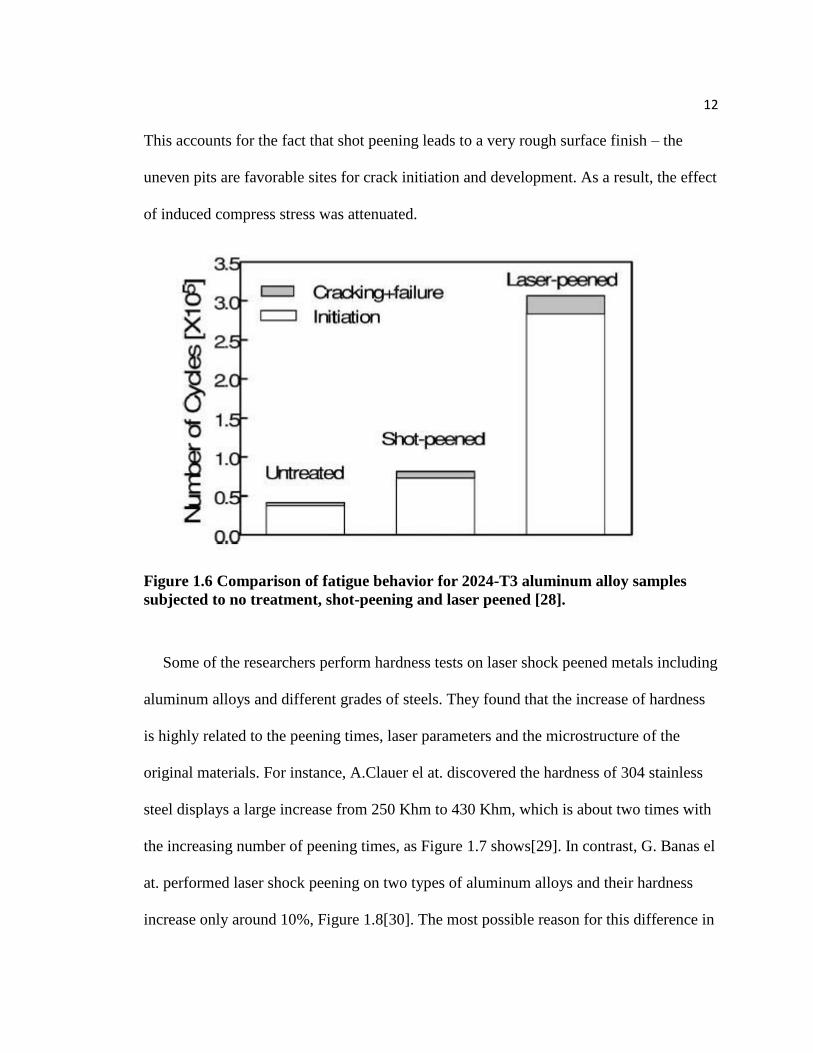
For example, Figure 1.6 below compares the fatigue behavior of the 7075-T7351
aluminum with laser shock peening, shock peening and without any surface treatment
[28]. It shows the sample can endure the largest numbers of work cycle after laser
peening while sample without any surface treatment has the shortest fatigue life. The
reason it that both crack initiation and crack growth requires tensile stress, by inducing
compress residual stress, they can serve as a barrier against this fatigue behavior and thus
increase the fatigue life and fatigue strength. Note Figure 1.5 also shows that shot
peening is able to produce similar effect but less profound as laser shot peening does.
12
This accounts for the fact that shot peening leads to a very rough surface finish – the
uneven pits are favorable sites for crack initiation and development. As a result, the effect
of induced compress stress was attenuated.
Figure 1.6 Comparison of fatigue behavior for 2024-T3 aluminum alloy samples
subjected to no treatment, shot-peening and laser peened [28].
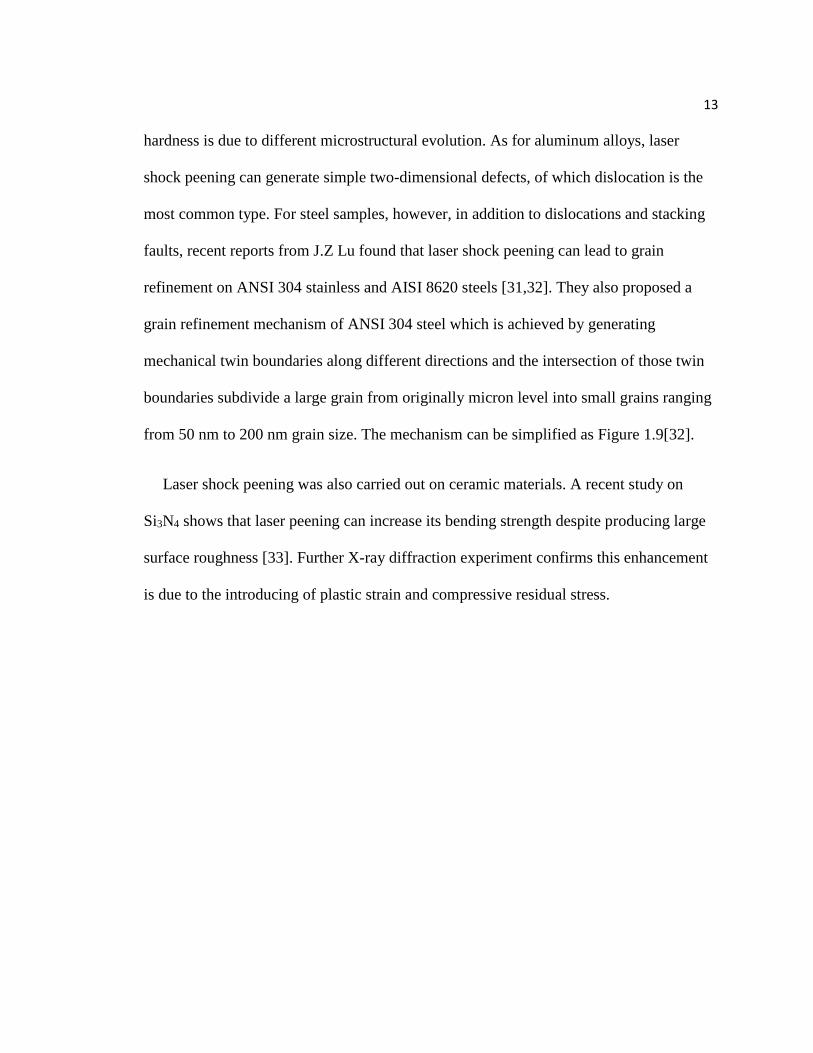
Some of the researchers perform hardness tests on laser shock peened metals including
aluminum alloys and different grades of steels. They found that the increase of hardness
is highly related to the peening times, laser parameters and the microstructure of the
original materials. For instance, A.Clauer el at. discovered the hardness of 304 stainless
steel displays a large increase from 250 Khm to 430 Khm, which is about two times with
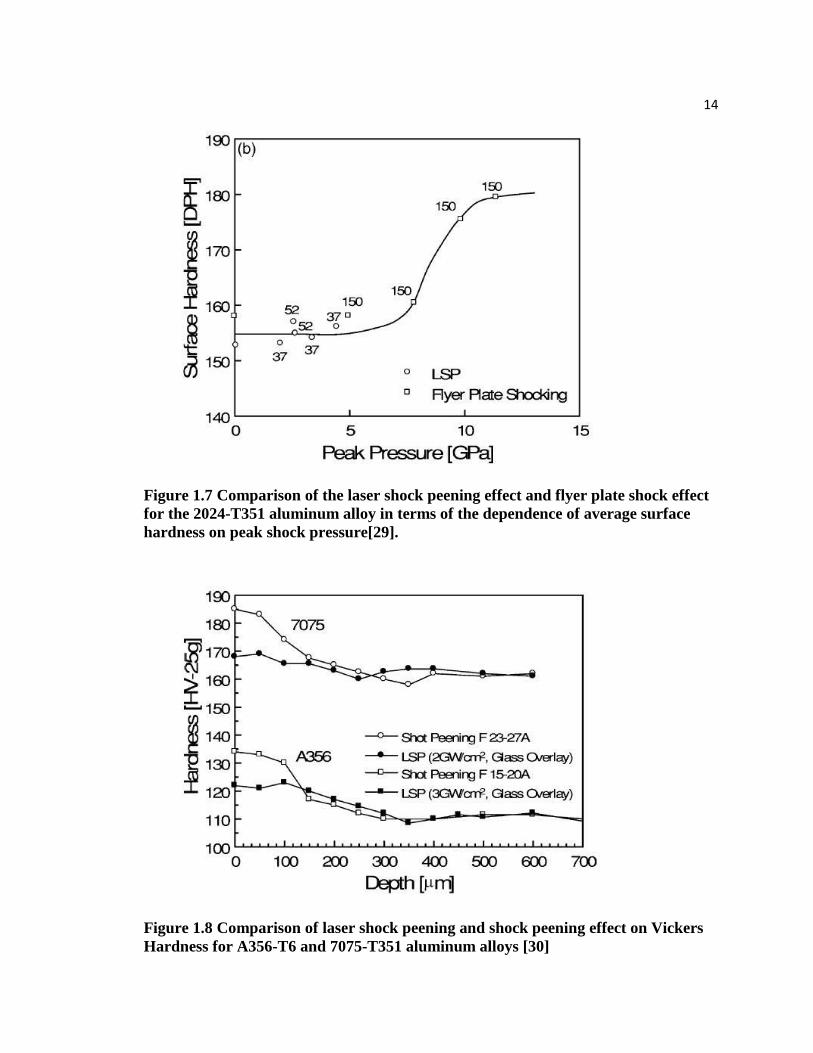
the increasing number of peening times, as Figure 1.7 shows[29]. In contrast, G. Banas el
at. performed laser shock peening on two types of aluminum alloys and their hardness
increase only around 10%, Figure 1.8[30]. The most possible reason for this difference in
13
hardness is due to different microstructural evolution. As for aluminum alloys, laser
shock peening can generate simple two-dimensional defects, of which dislocation is the
most common type. For steel samples, however, in addition to dislocations and stacking
faults, recent reports from J.Z Lu found that laser shock peening can lead to grain
refinement on ANSI 304 stainless and AISI 8620 steels [31,32]. They also proposed a
grain refinement mechanism of ANSI 304 steel which is achieved by generating
mechanical twin boundaries along different directions and the intersection of those twin
boundaries subdivide a large grain from originally micron level into small grains ranging
from 50 nm to 200 nm grain size. The mechanism can be simplified as Figure 1.9[32].
Laser shock peening was also carried out on ceramic materials. A recent study on
Si3N4 shows that laser peening can increase its bending strength despite producing large
surface roughness [33]. Further X-ray diffraction experiment confirms this enhancement
is due to the introducing of plastic strain and compressive residual stress.
14
Figure 1.7 Comparison of the laser shock peening effect and flyer plate shock effect
for the 2024-T351 aluminum alloy in terms of the dependence of average surface
hardness on peak shock pressure[29].
Figure 1.8 Comparison of laser shock peening and shock peening effect on Vickers
Hardness for A356-T6 and 7075-T351 aluminum alloys [30]

15
Figure 1.9 Schematic illustration on the microstructural evolution of the surface
layer of ANSI 304 stainless steel subjected to multiple laser shock peening [32].

16
1.4 Radiation Damage
1.4.1 Influencing factors in radiation damage
Currently, 304 stainless steels along with other types of austenitic stainless steels are
commonly used as cladding materials in nuclear power plant. However, the duration or
the life expectancy of these austenitic stainless steels is highly limited due to the damage
caused by neutron irradiation. There have been many studies on radiation damage on
austenitic stainless steel and three common types of radiation defects were found: point
defects (vacancy and interstitial), microscopic defects(faulted dislocation loops, cavities,
radiation-induced segregation) and macroscopic changes (void swelling and
embrittlement) depending on different irradiation conditions.
Generally speaking, radiance damage in austenitic steels relates to many factors
including temperature, radiation dose, types of irradiation ions and transmutant gas. To
quantify the radiation dose, dpa or displacement per atom was defined – dpa is the
number of times that an atom is displaced under a given radiation fluence. Therefore, a
material subjected to 0.1 dpa radiation damage means 10% of the atoms have been
displaced from their lattice sites.
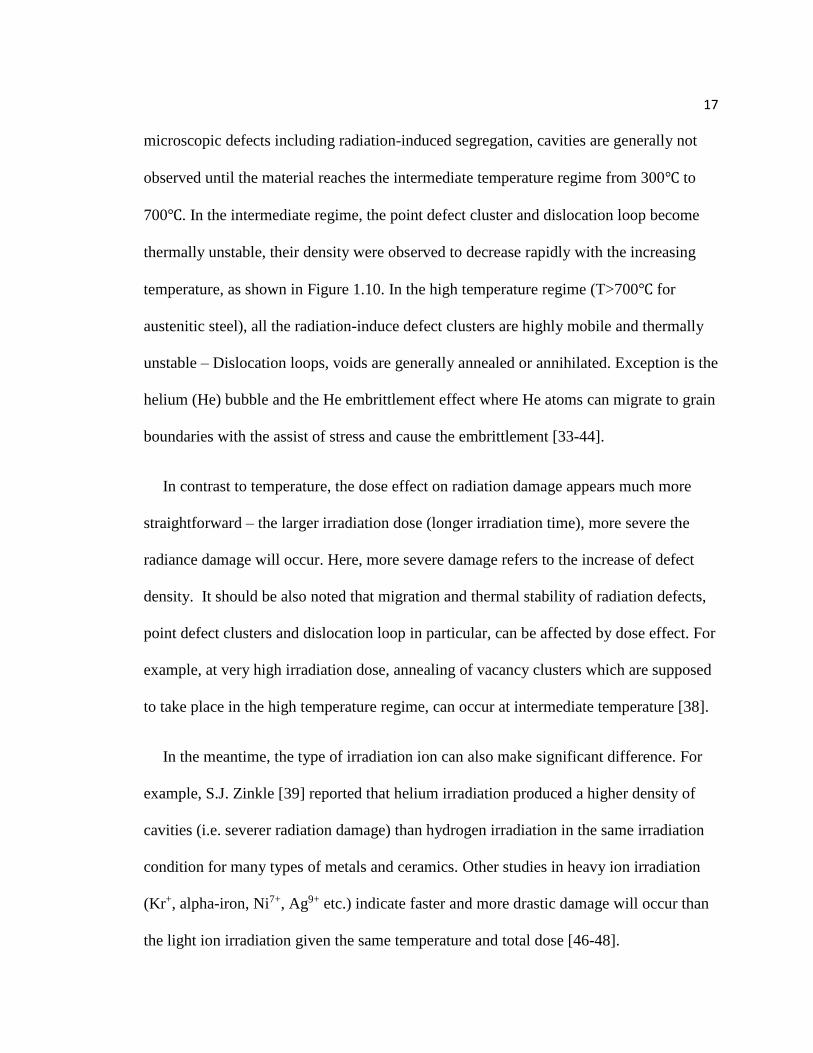
Temperature effect on radiance damage is phenomenal. As for austenitic stainless steel
three temperature regime can be categorized. The low temperature regime ranges from 50℃
to 300 ℃, common radiation defects in austenitic steel include point defect clusters and
dislocation loops. The mobility of these defects is limited and the density of dislocation
loops will increase with the increasing temperature as displayed in Figure 1.10. The
17
microscopic defects including radiation-induced segregation, cavities are generally not
observed until the material reaches the intermediate temperature regime from 300℃ to
700℃. In the intermediate regime, the point defect cluster and dislocation loop become
thermally unstable, their density were observed to decrease rapidly with the increasing
temperature, as shown in Figure 1.10. In the high temperature regime (T>700℃ for
austenitic steel), all the radiation-induce defect clusters are highly mobile and thermally
unstable – Dislocation loops, voids are generally annealed or annihilated. Exception is the
helium (He) bubble and the He embrittlement effect where He atoms can migrate to grain
boundaries with the assist of stress and cause the embrittlement [33-44].
In contrast to temperature, the dose effect on radiation damage appears much more
straightforward – the larger irradiation dose (longer irradiation time), more severe the
radiance damage will occur. Here, more severe damage refers to the increase of defect
density. It should be also noted that migration and thermal stability of radiation defects,
point defect clusters and dislocation loop in particular, can be affected by dose effect. For
example, at very high irradiation dose, annealing of vacancy clusters which are supposed
to take place in the high temperature regime, can occur at intermediate temperature [38].
In the meantime, the type of irradiation ion can also make significant difference. For
example, S.J. Zinkle [39] reported that helium irradiation produced a higher density of
cavities (i.e. severer radiation damage) than hydrogen irradiation in the same irradiation
condition for many types of metals and ceramics. Other studies in heavy ion irradiation
(Kr+, alpha-iron, Ni7+, Ag9+ etc.) indicate faster and more drastic damage will occur than
the light ion irradiation given the same temperature and total dose [46-48].

18
Figure 1.10 Temperature effect on faulted dislocation loop density of different types
of austenitic stainless steel under neutron irradiation [38].
1.4.2 Enhancement of Radiation Resistance
There have been many approaches proposed and tested to enhance the radiation
resistance in the past five decades. Generally speaking, they can be divided into two

19
categories: developing inherently high radiation tolerant materials and introducing stable
high-strength sinks [38,48].
Among the great varieties of newly developed materials, oxide-dispersion-
strengthened (ODS) alloys are one of the most promising structural materials for the new
generation nuclear power plant. They are known as material with excellent mechanical
properties (high strength, creep resistance at high temperature) and radiation resistance,
which all originate from introducing the nano-sized oxide particles. For example, nano-
sized yttrium oxide can act strong obstacles to slow down or hinder the dislocation
motion, thus increasing the stress threshold for plastic deformation. In the meantime,
these oxide particles are highly stable at high temperature (T can be as high as1627K),
they can prevent the diffusion of atoms along grain boundaries, thus resisting the creep
behavior. Finally, oxide particles can also act as sinks to absorb defects generated by
irradiation, which gives ODS alloys a high radiation tolerance. Many studies on ODS
alloys have confirms the existence of large numbers of oxide particles with a size
approximately or less than 10 nm, which are evenly distributed in the alloy matrix by
transmission electron microscopy (TEM) as well as atomic probe tomography (APT) [49-
53].
Another approach to increase radiation resistance is by introducing high-strength-sinks.
This approach was first proposed by modeling based on kinetic rate theory. These models
predicted that by introducing high-strength sinks, for example high density dislocation or
highly dispersed nano size precipitates, both point defects and large scale defects such as
void swelling and radiation induced segregation would greatly alleviate[55-59]. While
20
the boundary between a high and a low strength sink is not clear and depends on different
materials, the sink strength can be quantified based on the sink types. For instance, sink
strength of cavities Sc can be determined using the following equation:
𝑆𝑐 = 4𝜋𝑟𝑐𝑁𝑐(1 + 𝑆1/2𝑟𝐶)𝑍𝑐 Eqn. 2
where S is the cumulative sink strength, Zc is a constant of unity, rc is the radius and Nc is
the density. Because grain boundaries and dislocations do not have radius, their sink
strength can be simplified as:
Sgb=60/d2 Eqn. 3
where d is the diameter for the grain and
Sd = Zd×ρd Eqn. 4
where ρd is the dislocation density[31]. In the case of ferritic steels, sink strength needs
to reach over 1016/m2 in order to effectively resist radiation damage. Studies have shown
that at low temperature regime (T<0.3Tm), radiation hardening of ferritic steels will not
alleviate when sink strength less than 1016/m2. This is the same for the He embrittlement
which occurs as at the high temperature regime. Yet, once sink strength increased to over
1016/m2, radiation hardening and He embrittlement were clearly suppressed as it is
observed the radiation produced point defects and radiation generated He atoms are
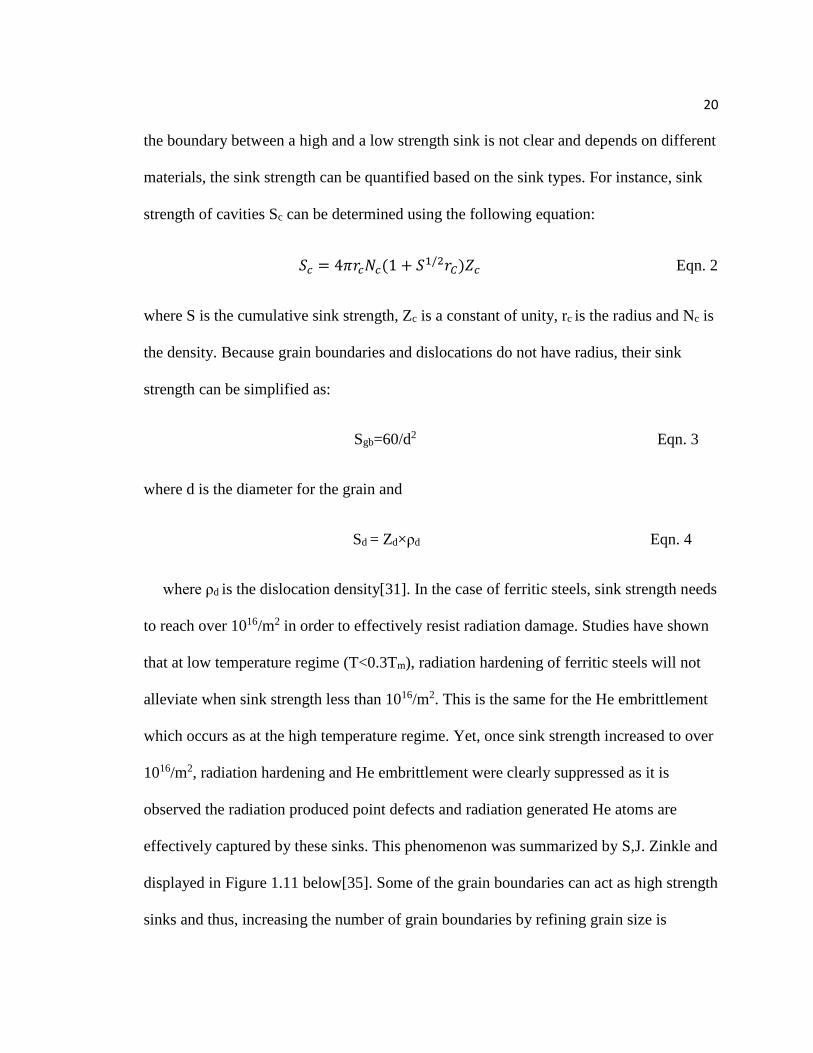
effectively captured by these sinks. This phenomenon was summarized by S,J. Zinkle and
displayed in Figure 1.11 below[35]. Some of the grain boundaries can act as high strength
sinks and thus, increasing the number of grain boundaries by refining grain size is

21
another way to introduce high strength sinks. C.Sun el at. applied equal channel angular
pressing technique and successfully prepared a ultrafine grain 304L stainless steel whose
an average grain size around 100 nm. They performed Fe ion irradiation on the ultrafine
grain 304L stainless steel at intermediate temperature and found the swelling resistance
has increased by almost one magnitude [54].
Figure 1.11 Effect of sink strength on alleviating radiation-induce hardening at
different radiation dose and temperature conditions [31].
22
1.5 Stress Corrosion Cracking in Austenitic Stainless Steels
1.5.1 Influence Factors in Stress Corrosion Cracking
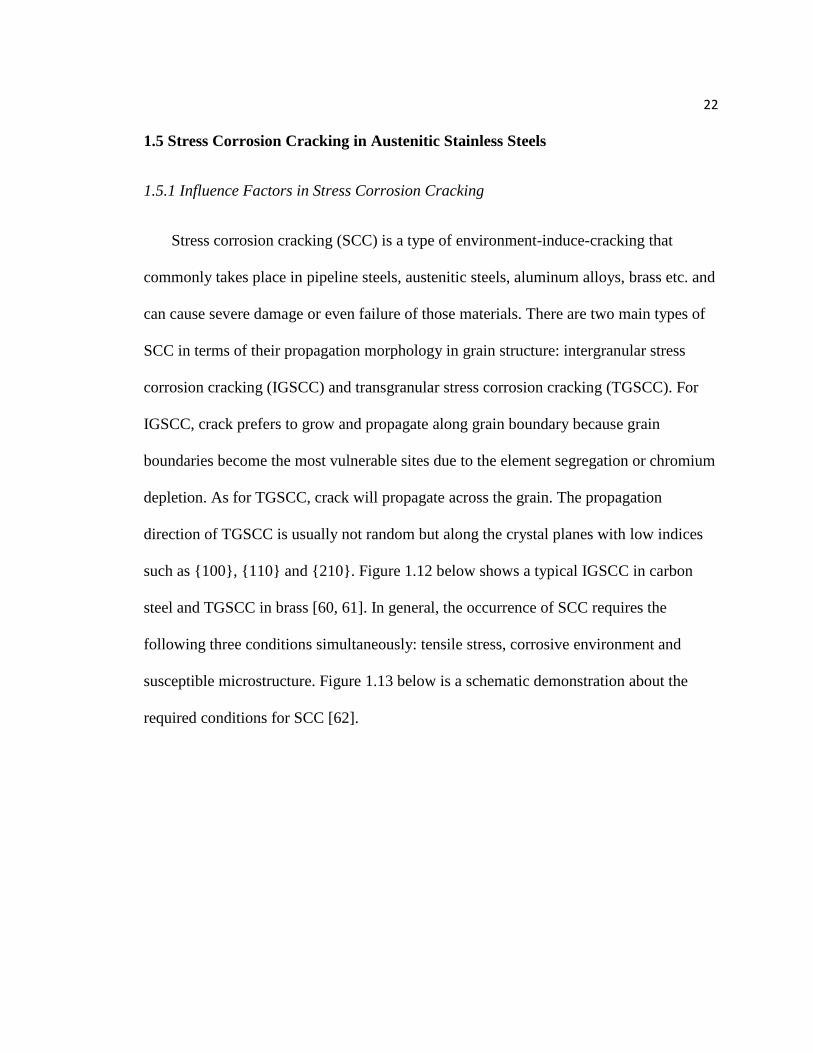
Stress corrosion cracking (SCC) is a type of environment-induce-cracking that
commonly takes place in pipeline steels, austenitic steels, aluminum alloys, brass etc. and
can cause severe damage or even failure of those materials. There are two main types of
SCC in terms of their propagation morphology in grain structure: intergranular stress
corrosion cracking (IGSCC) and transgranular stress corrosion cracking (TGSCC). For
IGSCC, crack prefers to grow and propagate along grain boundary because grain
boundaries become the most vulnerable sites due to the element segregation or chromium
depletion. As for TGSCC, crack will propagate across the grain. The propagation
direction of TGSCC is usually not random but along the crystal planes with low indices
such as {100}, {110} and {210}. Figure 1.12 below shows a typical IGSCC in carbon
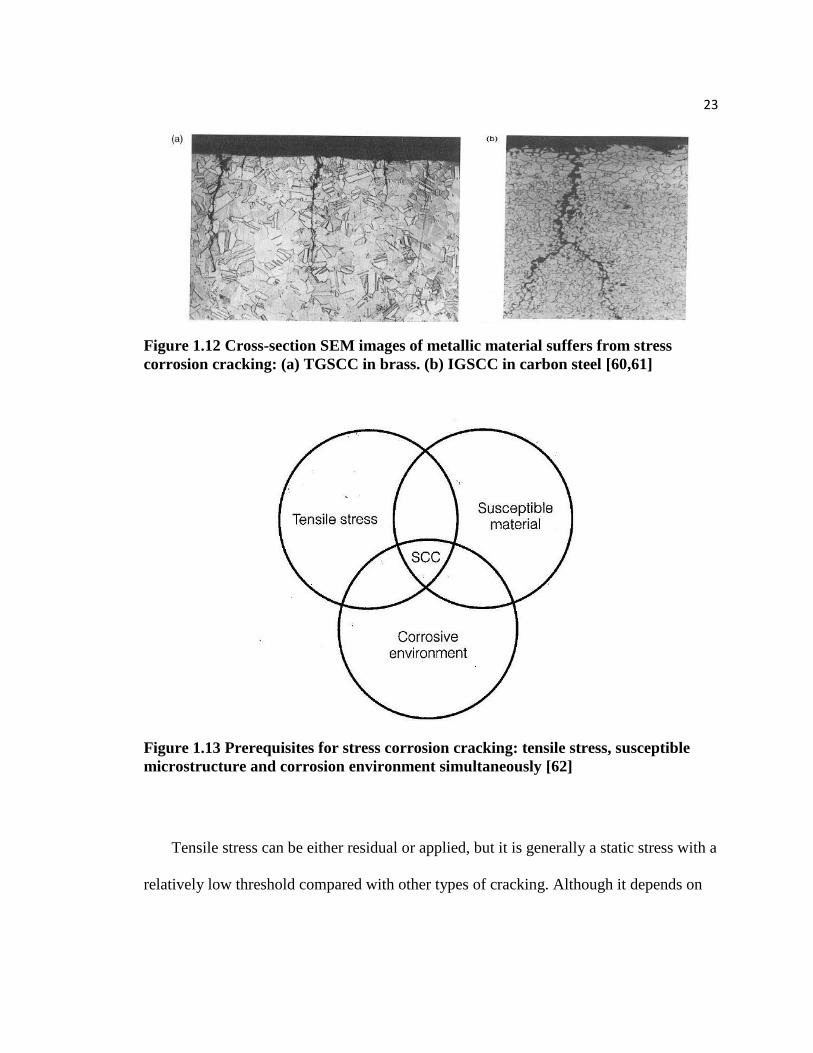
steel and TGSCC in brass [60, 61]. In general, the occurrence of SCC requires the
following three conditions simultaneously: tensile stress, corrosive environment and
susceptible microstructure. Figure 1.13 below is a schematic demonstration about the
required conditions for SCC [62].
23
Figure 1.12 Cross-section SEM images of metallic material suffers from stress
corrosion cracking: (a) TGSCC in brass. (b) IGSCC in carbon steel [60,61]
Figure 1.13 Prerequisites for stress corrosion cracking: tensile stress, susceptible
microstructure and corrosion environment simultaneously [62]
Tensile stress can be either residual or applied, but it is generally a static stress with a
relatively low threshold compared with other types of cracking. Although it depends on

24
different material system and environment, in many cases, a tensile stress in a range of
100 MPa to 200 MPa is sufficient to produce SCC.
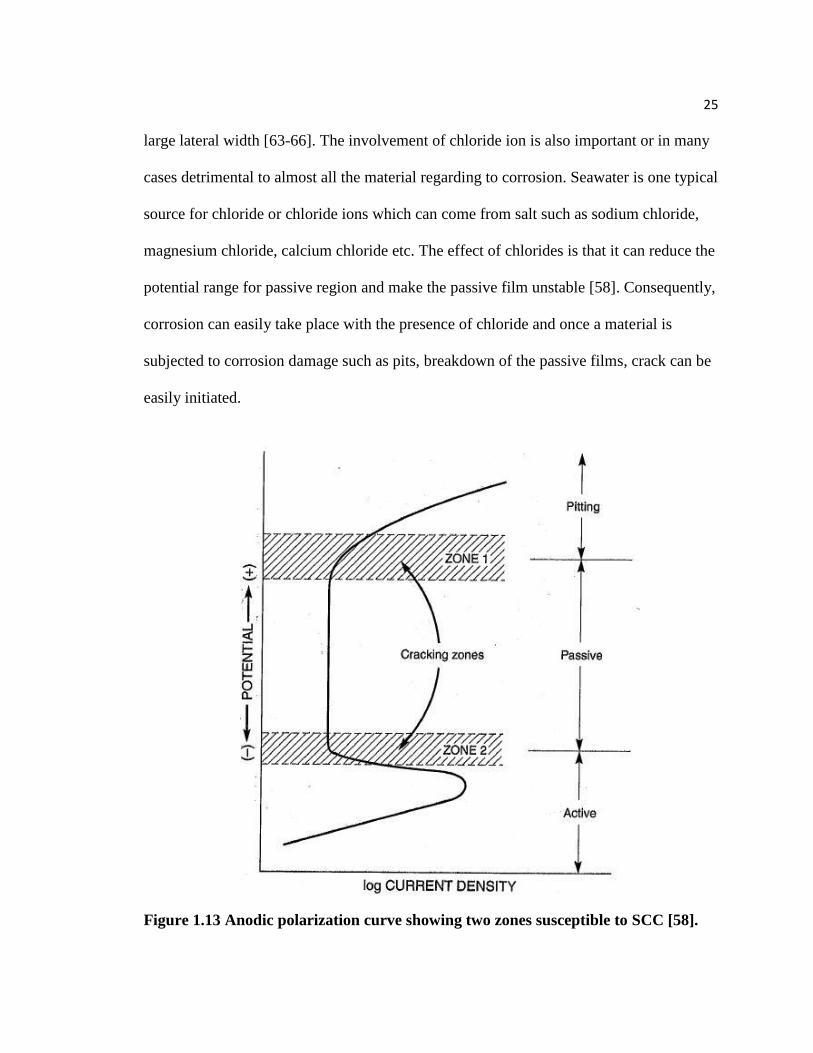
The corrosive environment also depends on material type, temperature and pH value.
For a specific material, the electrochemical potential is of great importance to the
occurrence of SCC. Figure 1.13 shows the anodic polarization curve with two zones
where passive films can be easily broken, making the material susceptible to SCC. In
zone 1, the potential is close to the pitting potential, making pitting corrosion easy to
occur and once pits are formed, passive films can be broken, which makes the material
vulnerable to SCC. The austenitic stainless steel in the hot MgCl2 solution is an example
for zone 1-SCC. In zone 2, although the potential is far lower than pitting potential, it just
passes through the transition from active region to passive region. As a result, the passive
film in zone 1 is unstable and is easy to be ruptured. In theory, the increase of acid
concentration (decrease of pH value) and temperature will narrow the passive region and
make corrosion easier to take place. In practice, however, the situation is much more
complicated as the pH value is not an independent factor, instead it correlates the
existence of other polluted ions and the corrosion mechanism of a specific material
system. For example, the effect of pH value is particularly significant in SCC of pipeline
steels. Here, high pH value environment usually refers to the bicarbonate (HCO3-) or
carbonate-bicarbonate solutions (CO32- +HCO3
-), whose pH value is around 9.0. The high
pH value environment along with tensile stress can cause IGSCC in pipeline steels. In the
meantime, low pH value environment usually refers to a dilute aqueous solution with a
pH value around 6.5. The crack morphology in this case is usually transgranular with a
25
large lateral width [63-66]. The involvement of chloride ion is also important or in many
cases detrimental to almost all the material regarding to corrosion. Seawater is one typical
source for chloride or chloride ions which can come from salt such as sodium chloride,
magnesium chloride, calcium chloride etc. The effect of chlorides is that it can reduce the
potential range for passive region and make the passive film unstable [58]. Consequently,
corrosion can easily take place with the presence of chloride and once a material is
subjected to corrosion damage such as pits, breakdown of the passive films, crack can be
easily initiated.
Figure 1.13 Anodic polarization curve showing two zones susceptible to SCC [58].
26
A susceptible microstructure means a crystal structure where SCC can easily initiate
and propagate. It depends on the composition, sensitization temperature, orientation of
the stress etc. For instance, austenite or FCC structure is one common of SCC susceptible
structure in stainless steel while ferrite or steel with BCC structure has a relatively high
SCC resistance compared with austenite. All those variations mentioned above relate to
the SCC mechanisms, which will be introduced below.
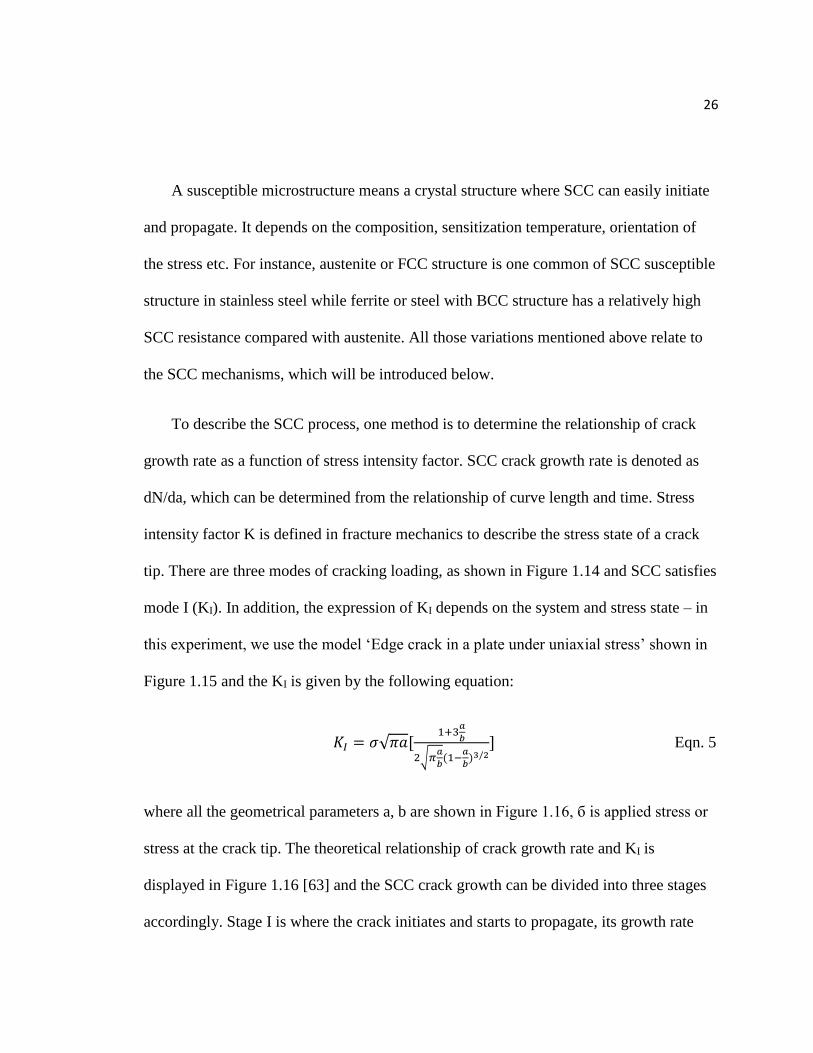
To describe the SCC process, one method is to determine the relationship of crack
growth rate as a function of stress intensity factor. SCC crack growth rate is denoted as
dN/da, which can be determined from the relationship of curve length and time. Stress
intensity factor K is defined in fracture mechanics to describe the stress state of a crack
tip. There are three modes of cracking loading, as shown in Figure 1.14 and SCC satisfies
mode I (KI). In addition, the expression of KI depends on the system and stress state – in
this experiment, we use the model ‘Edge crack in a plate under uniaxial stress’ shown in
Figure 1.15 and the KI is given by the following equation:
𝐾𝐼 = 𝜎√𝜋𝑎[1+3
𝑎
𝑏
2√𝜋𝑎
𝑏(1−
𝑎
𝑏)3/2
] Eqn. 5
where all the geometrical parameters a, b are shown in Figure 1.16, б is applied stress or
stress at the crack tip. The theoretical relationship of crack growth rate and KI is
displayed in Figure 1.16 [63] and the SCC crack growth can be divided into three stages
accordingly. Stage I is where the crack initiates and starts to propagate, its growth rate

27
increase exponentially. When SCC comes to stage II, a steady state is reached – crack
will grow in a constant rate with the increasing stress intensity factor and but when it
enters stage III, crack will grow in an exponential rate until the material fails [64].
Figure 1.14 Three cracking mode in fracture mechanics. In Mode I, crack is
generated by tensile load. In Mode II crack is generated by in-plane shear and for
Mode III also known as tearing mode, crack surface will move in an opposite
direction. Image is in courtesy of ‘D.P Rooke and D.J. Cartwright’, Compendium of
stress intensity factors [63].
Figure 1.15 ‘Edge crack in a plate under uniaxial stress model’ for determining KI,
where a is the crack length, b is the material length, h is the width [63].
28
Figure 1.16 Theoretical curve of crack growth rate as a function of stress intensity
factor KI [64].
1.4.2 Proposed Mechanism for Stress Corrosion Cracking
There have been many studies in modeling and experiments trying to explain the
mechanism of SCC. Thanks to their work, there are more than six SCC mechanism
proposed [62], three of which will be reviewed in this part, including the film rupture
model, hydrogen-induced SCC and film-induced cleavage.
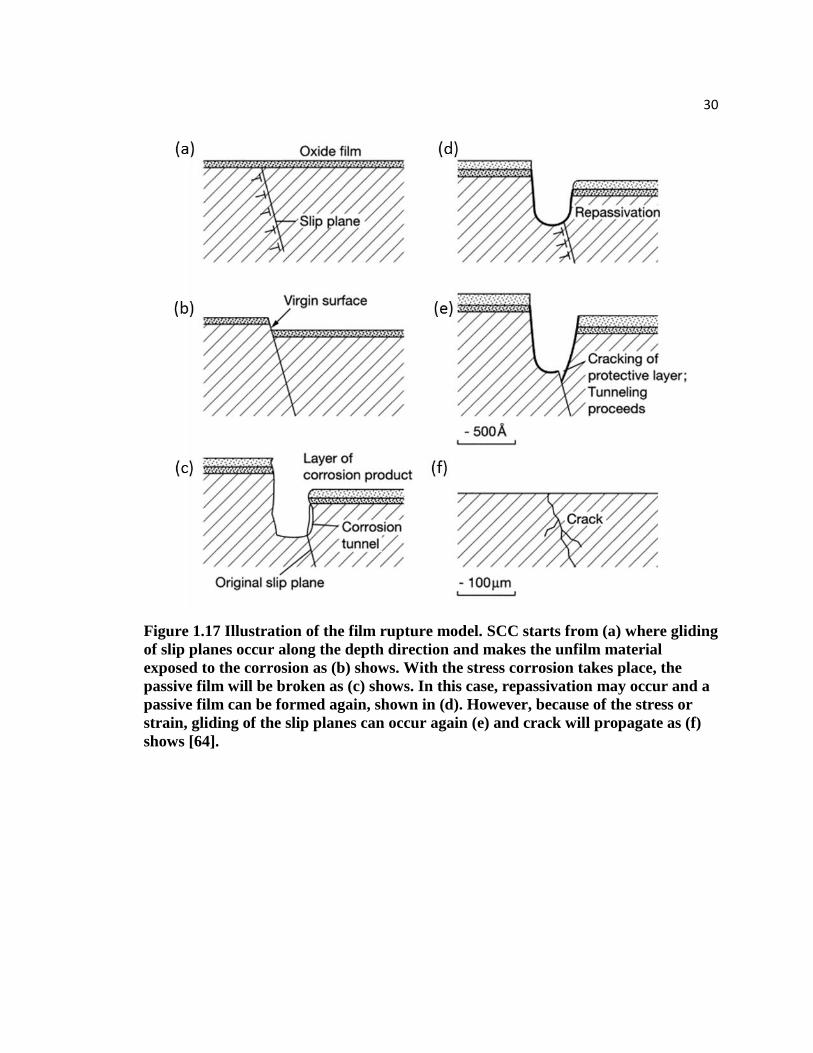
The film rupture model is a classic model. It states that crack is firstly initiated
because the accumulated strain produced by the tensile stress ruptured the protective
passive film on the surface. After that, crack will grow by anodic dissolution in which the
electrochemical reaction occurs and the material will dissolve in the anode. With cracks
propagate, the material will eventually fail in a relatively short amount of time. The
process of film rupture can be schematic shown in Figure 1.17. Further research on SCC
experiments confirm that crack initiation is by breaking down of the protective film,
however, debates are in the mechanisms on crack propagation[64]. For film rupture
model, electrochemical process is proposed to be the dominant way for crack propagation.
29
Another SCC mechanism that has been widely studied and discussed is the hydrogen-
induced SCC (HISCC). The principle of HISCC is that hydrogen atoms can diffuse to the
interior of the material and contaminate the material either by weakening the atomic
bonds or by the formation of hydrides. This contamination can facilitate the crack
initiation or crack growth, i.e. embrittle the material. The extent of embrittlement is
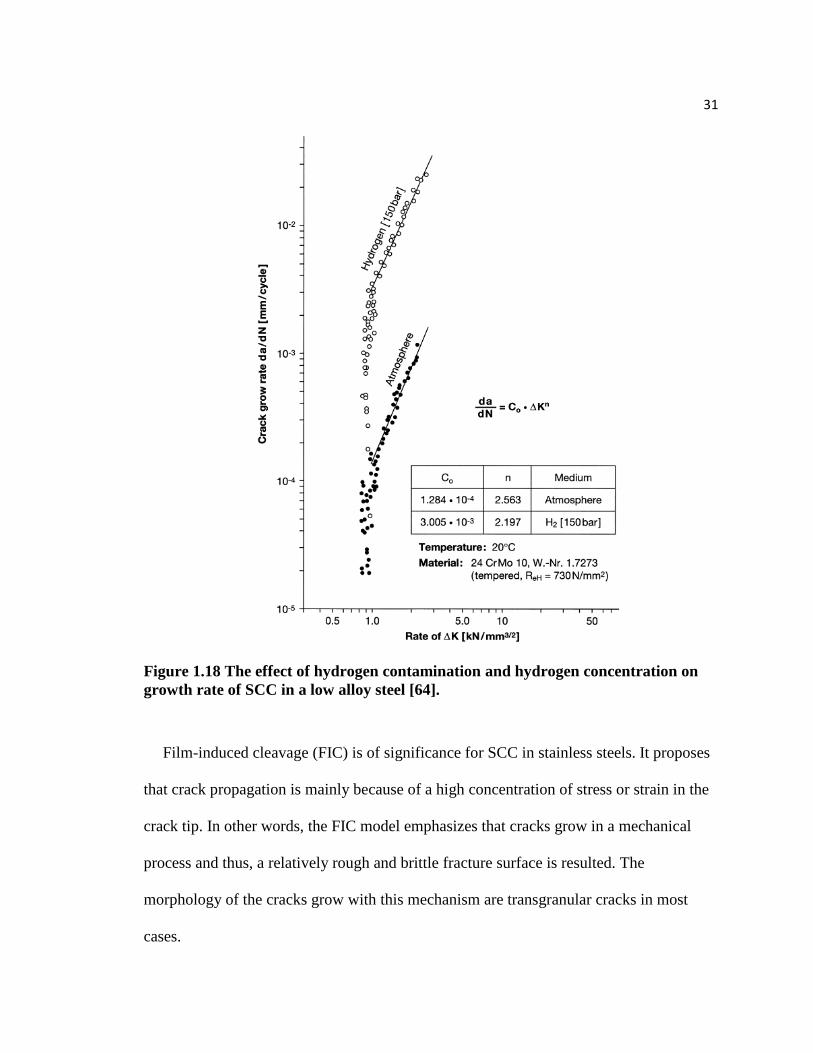
highly related to hydrogen concentration. There is a study on low-alloy steel showing that
the crack growth rate rises with the increase of hydrogen concentration and it is around
two magnitudes higher than the growth rate without hydrogen contamination, as Figure
1.18 shows. Because hydrogen has a preferential diffusion path to grain boundary and
interface, HISCC is generally intergranular [64]. In other words, the HISCC proposed
that crack propagation is governed by hydrogen embrittlement.
30
Figure 1.17 Illustration of the film rupture model. SCC starts from (a) where gliding
of slip planes occur along the depth direction and makes the unfilm material
exposed to the corrosion as (b) shows. With the stress corrosion takes place, the
passive film will be broken as (c) shows. In this case, repassivation may occur and a
passive film can be formed again, shown in (d). However, because of the stress or
strain, gliding of the slip planes can occur again (e) and crack will propagate as (f)
shows [64].
31
Figure 1.18 The effect of hydrogen contamination and hydrogen concentration on
growth rate of SCC in a low alloy steel [64].
Film-induced cleavage (FIC) is of significance for SCC in stainless steels. It proposes
that crack propagation is mainly because of a high concentration of stress or strain in the
crack tip. In other words, the FIC model emphasizes that cracks grow in a mechanical
process and thus, a relatively rough and brittle fracture surface is resulted. The
morphology of the cracks grow with this mechanism are transgranular cracks in most
cases.
32
CHAPTER 2: EXPERIMENTAL METHODS
2.1 Sample Preparation and Laser Shock Peening Treatment
The composition of as-received bulk steel samples (304 stainless steel and 304 ODS
steel) is listed in Table 1. The samples were first cut by a diamond saw into 10 mm ×8
mm × 2 mm rectangular solids. Then their surface was mechanically polishing with
silicon carbide grinding paper in a roughness range from #240 to #1200, followed by
polishing with alumina power in an order of 3 µm, 1 µm and 0.3 µm. After ultrasonic
cleaning with acetone and ethanol, laser shock peening was carried out. The utilized laser
source is known as Q-switched Nd:YAG. The pulse energy was 850 mJ and the duration
time was 7 ns. Prior to LSP, the samples were coated with a 177 micron thick black tapes
on the surface as sacrificial layers to avoid ablation and flowing water was used as
confining layer. All the steel samples would undergo the same LSP process five times,
with a 50% overlap of the area and for each time of LSP, the black tape was replaced.
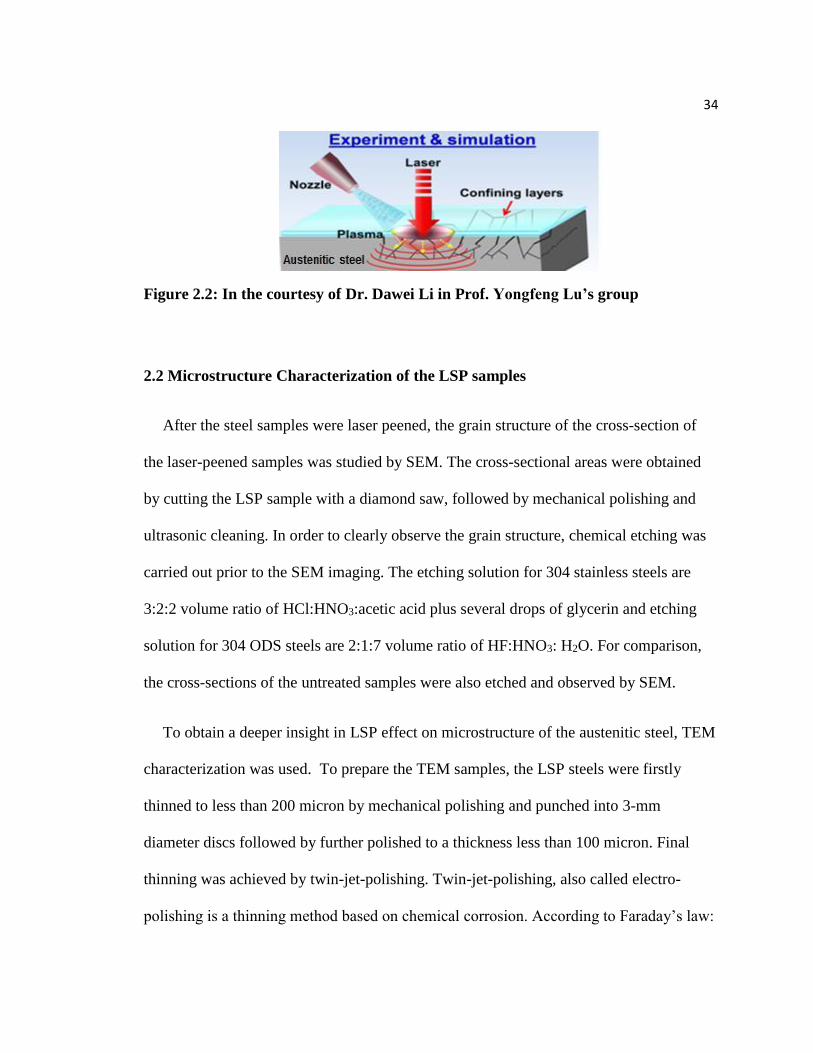
The detailed parameters of the LSP process are listed in Table 2 and the basic equipment
as well as the simplified LSP process can be displayed in Figure 2.1 and Figure 2.2
respectively.
Table.1: Composition of Austenitic Stainless Steels
304 stainless steel:
Composition Fe Cr Ni Mn Si P C
Percent (wt%) Bal. 18.3 8.5 1.38 0.06 0.03 0.04

33
304 ODS steel:
Composition Fe Cr Ni Mn Si Ti Y2O3
Percent (wt%) Bal. 18.2 8.2 1.20 0.06 0.7 0.35
Table 2: Laser Shock Peening Parameters
Type Value
Spot Size (mm) 1
Pulse energy (mJ) 850
Duration time (ns) 7
Overlap 50%
Repetition-rate (Hz) 10
Laser wavelength (nm) 1064
Beam profile Gaussian
Laser Pulse 5
Figure 2.1: In the courtesy of Dr. Dawei Li in Prof. Yongfeng Lu’s group.
34
Figure 2.2: In the courtesy of Dr. Dawei Li in Prof. Yongfeng Lu’s group
2.2 Microstructure Characterization of the LSP samples
After the steel samples were laser peened, the grain structure of the cross-section of
the laser-peened samples was studied by SEM. The cross-sectional areas were obtained
by cutting the LSP sample with a diamond saw, followed by mechanical polishing and
ultrasonic cleaning. In order to clearly observe the grain structure, chemical etching was
carried out prior to the SEM imaging. The etching solution for 304 stainless steels are
3:2:2 volume ratio of HCl:HNO3:acetic acid plus several drops of glycerin and etching
solution for 304 ODS steels are 2:1:7 volume ratio of HF:HNO3: H2O. For comparison,
the cross-sections of the untreated samples were also etched and observed by SEM.
To obtain a deeper insight in LSP effect on microstructure of the austenitic steel, TEM
characterization was used. To prepare the TEM samples, the LSP steels were firstly
thinned to less than 200 micron by mechanical polishing and punched into 3-mm
diameter discs followed by further polished to a thickness less than 100 micron. Final
thinning was achieved by twin-jet-polishing. Twin-jet-polishing, also called electro-
polishing is a thinning method based on chemical corrosion. According to Faraday’s law:
35
r =𝑖0𝑎
𝑛𝐹 Eqn. 7
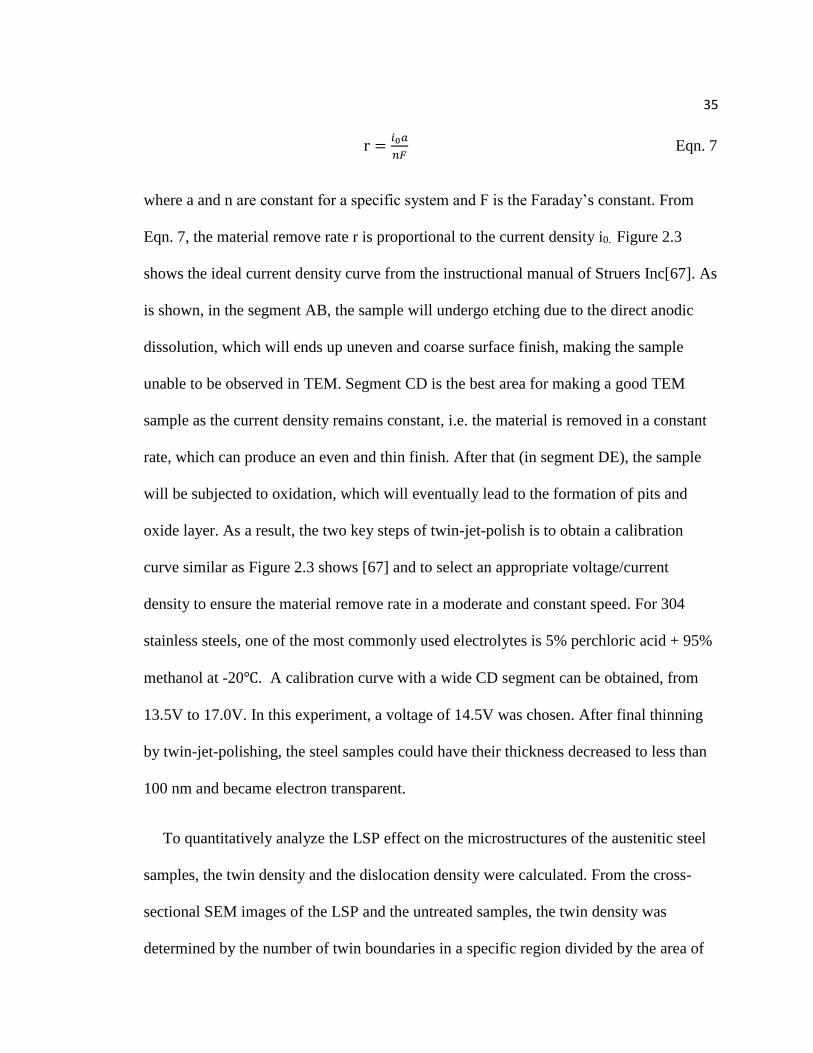
where a and n are constant for a specific system and F is the Faraday’s constant. From
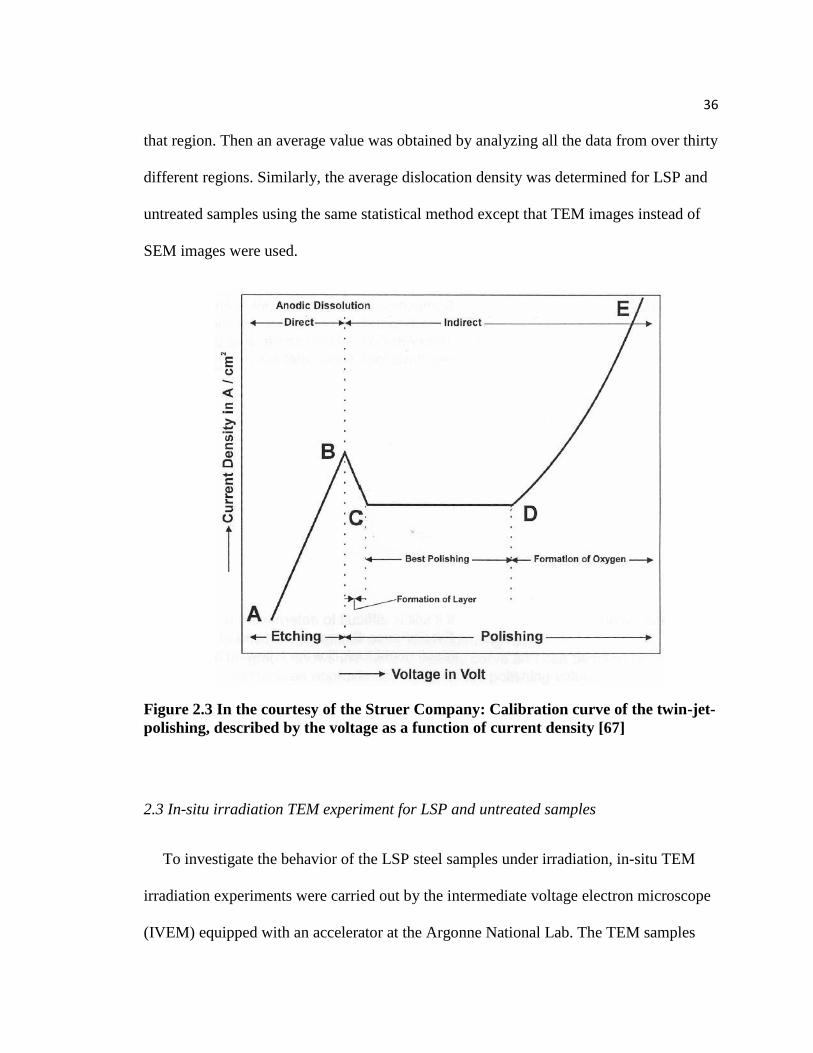
Eqn. 7, the material remove rate r is proportional to the current density i0. Figure 2.3
shows the ideal current density curve from the instructional manual of Struers Inc[67]. As
is shown, in the segment AB, the sample will undergo etching due to the direct anodic
dissolution, which will ends up uneven and coarse surface finish, making the sample
unable to be observed in TEM. Segment CD is the best area for making a good TEM
sample as the current density remains constant, i.e. the material is removed in a constant
rate, which can produce an even and thin finish. After that (in segment DE), the sample
will be subjected to oxidation, which will eventually lead to the formation of pits and
oxide layer. As a result, the two key steps of twin-jet-polish is to obtain a calibration
curve similar as Figure 2.3 shows [67] and to select an appropriate voltage/current
density to ensure the material remove rate in a moderate and constant speed. For 304
stainless steels, one of the most commonly used electrolytes is 5% perchloric acid + 95%
methanol at -20℃. A calibration curve with a wide CD segment can be obtained, from
13.5V to 17.0V. In this experiment, a voltage of 14.5V was chosen. After final thinning
by twin-jet-polishing, the steel samples could have their thickness decreased to less than
100 nm and became electron transparent.
To quantitatively analyze the LSP effect on the microstructures of the austenitic steel
samples, the twin density and the dislocation density were calculated. From the cross-
sectional SEM images of the LSP and the untreated samples, the twin density was
determined by the number of twin boundaries in a specific region divided by the area of
36
that region. Then an average value was obtained by analyzing all the data from over thirty
different regions. Similarly, the average dislocation density was determined for LSP and
untreated samples using the same statistical method except that TEM images instead of
SEM images were used.
Figure 2.3 In the courtesy of the Struer Company: Calibration curve of the twin-jet-
polishing, described by the voltage as a function of current density [67]
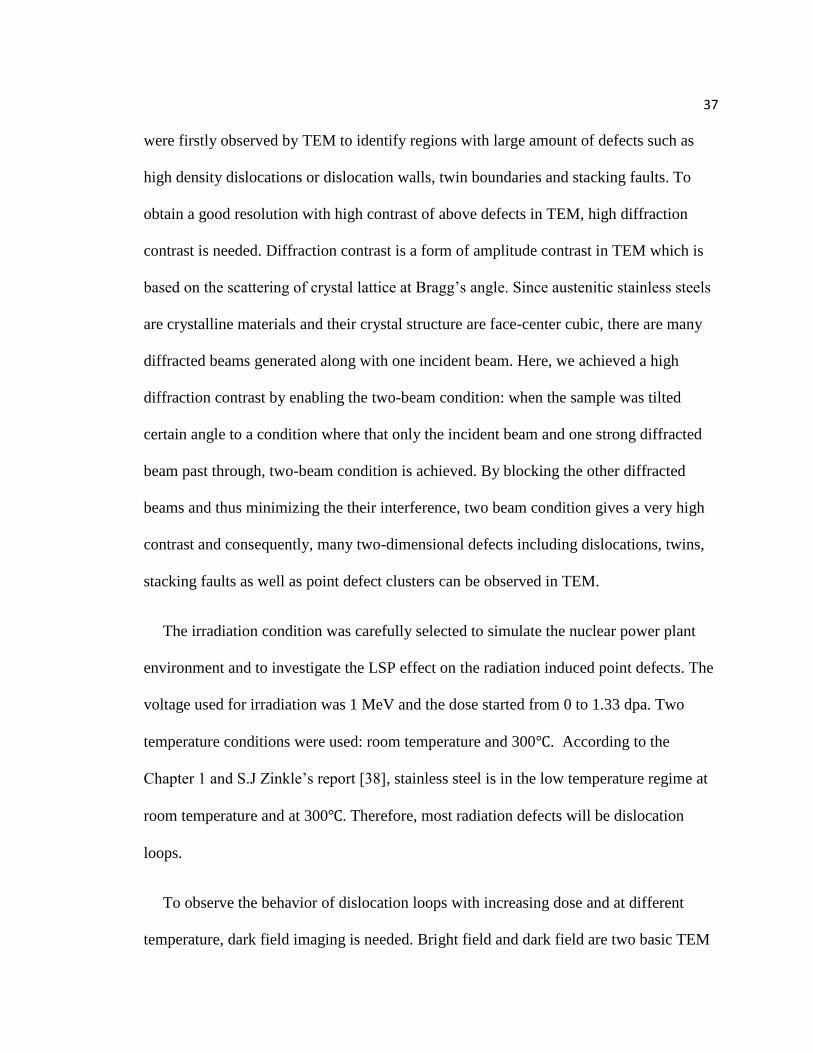
2.3 In-situ irradiation TEM experiment for LSP and untreated samples
To investigate the behavior of the LSP steel samples under irradiation, in-situ TEM
irradiation experiments were carried out by the intermediate voltage electron microscope
(IVEM) equipped with an accelerator at the Argonne National Lab. The TEM samples
37
were firstly observed by TEM to identify regions with large amount of defects such as
high density dislocations or dislocation walls, twin boundaries and stacking faults. To
obtain a good resolution with high contrast of above defects in TEM, high diffraction
contrast is needed. Diffraction contrast is a form of amplitude contrast in TEM which is
based on the scattering of crystal lattice at Bragg’s angle. Since austenitic stainless steels
are crystalline materials and their crystal structure are face-center cubic, there are many
diffracted beams generated along with one incident beam. Here, we achieved a high
diffraction contrast by enabling the two-beam condition: when the sample was tilted
certain angle to a condition where that only the incident beam and one strong diffracted
beam past through, two-beam condition is achieved. By blocking the other diffracted
beams and thus minimizing the their interference, two beam condition gives a very high
contrast and consequently, many two-dimensional defects including dislocations, twins,
stacking faults as well as point defect clusters can be observed in TEM.
The irradiation condition was carefully selected to simulate the nuclear power plant
environment and to investigate the LSP effect on the radiation induced point defects. The
voltage used for irradiation was 1 MeV and the dose started from 0 to 1.33 dpa. Two
temperature conditions were used: room temperature and 300℃. According to the
Chapter 1 and S.J Zinkle’s report [38], stainless steel is in the low temperature regime at
room temperature and at 300℃. Therefore, most radiation defects will be dislocation
loops.
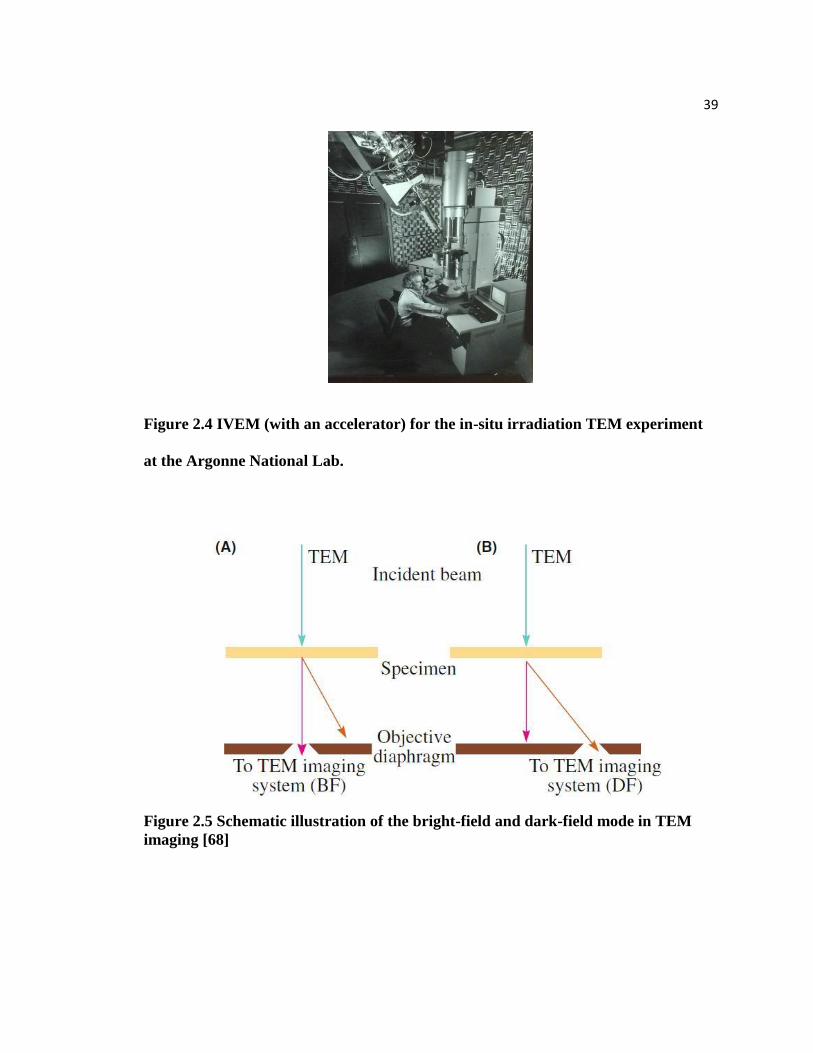
To observe the behavior of dislocation loops with increasing dose and at different
temperature, dark field imaging is needed. Bright field and dark field are two basic TEM

38
modes for amplitude-contrast imaging. The principle is shown in Figure 2.5[68]:
Basically, bright field is generated by moving the objective aperture to let incident beam
form the image while dark field is to let the diffracted beam form the image. As a result,
bright field imaging gives a very high magnitude illumination, but the low contrast limits
its ability to observe the small scale radiation defects. Dark field imaging on the other
hand, gives a very high contrast and enables the observation of dislocation loop or other
point defect clusters produced by irradiation.
To quantify the accumulation of radiation damage in the austenitic steel samples, loop
density as a function of dose was determined. The term ‘loop’ in this case refers to all
defects caused by radiation at low temperature regime, including vacancy clusters,
interstitial clusters and dislocation loop. There are two general expressions of loop
density: the number of loops per unit area or the number of loops per unit volume. In this
experiment, thickness of the TEM samples can be ignored and thus, loop density is
determined as the total number of loops divided by the total area of the region. In the
measurement of total number of loops, sometimes it is difficult to identify or confirm a
specific loop because of the low illumination in dark field imaging. In that case, all these
loops are counted as one half, as suggested by Z. Yao el at[69]. Meanwhile, to
minimizing the error, an average loop density was determined using a similar statistical
method as the determination of the dislocation density and twin density. The error bars in
all those calculation are the standard deviation.
39
Figure 2.4 IVEM (with an accelerator) for the in-situ irradiation TEM experiment
at the Argonne National Lab.
Figure 2.5 Schematic illustration of the bright-field and dark-field mode in TEM
imaging [68]

40
2.4 Stress Corrosion Cracking Tests for LSP and untreated samples
The untreated and LSP austenitic steels samples were subjected to a SCC environment
with applied tensile stress in order to study the LSP effect on the SCC of the austenitic
steels. The equipment for stress corrosion cracking test is called Proof Ring System from
Cortest. The setup is shown in Figure 2.5. Precision machining is needed for the
preparation of the SCC samples and they were carried out in the machine shop at the
Nebraska Center for Material and Nanoscience at University of Nebraska Lincoln. The
dimension of SCC sample is displayed below in Figure 2.6. The test area is the central
part of the sample with a length of 1.015± 0.15 inches and the LSP was performed on this
part. After subjected to LSP, the steel samples were put into the vessel and immersed into
the solution. Temperature control can be achieved by connecting the system to a
temperature monitor provided by Cortest. The key point of this test is to apply a constant
tensile stress. To achieve that, a constant load is required, which is generated by
producing displacement of the ring. By tightening the screw on top of the ring and
measuring ring deflection with a venial caliper, the applied load can be determined with
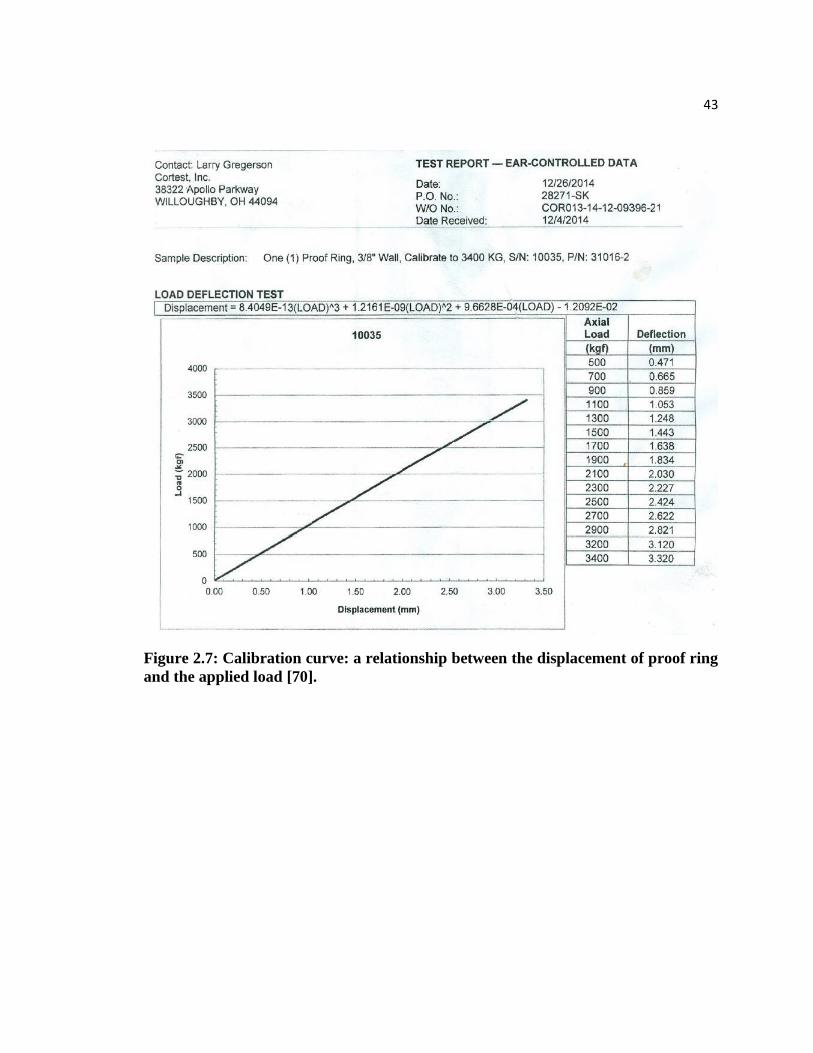
the aid of the calibration curve shown in Figure 2.7 below. The measurement process can
be simplified by the following equations[70]:
Displacement d = initial ring distance Di – final ring distance D Eqn. 8
d = 8.409𝐸−13 ∗ 𝑙𝑜𝑎𝑑3 + 1.2161𝐸−9 ∗ 𝑙𝑜𝑎𝑑2 + 9.6628𝐸−4 ∗ 𝑙𝑜𝑎𝑑 − 1.092𝐸02 Eqn. 9
Tensile Stress б = Applied load / Sample Area Eqn. 10

41
After SCC test, the samples were put in the FEI Helios 660 FIB/SEM facility, which can
accommodate the whole SCC sample and achieve surface and cross-section imaging. The
cross-section of the SCC sample was obtained by cutting out the test part and machined
along the depth direction, followed by chemical etching. To compare the LSP effect, this
SCC test was performed on untreated and LSP of 304 stainless steels. Their cross-
sectional grain structure after subjected to SCC was presented as SEM images.
To quantitatively describe the SCC behavior of our steel samples, the crack growth
rate as a function of stress intensity factor was obtained. Similar SCC samples were used.
However, for each of the SCC sample, a 1mm depth notch was machined at the center
prior to the test. The notched samples have an advantage of a shorter crack initiation time.
Because of the notch, the applied stress will concentrate on the notch site and cracks
would initiate and propagate along it. After a crack was initiated, the time was recorded
and the SCC sample was put into the Helios 660 to measure the crack length in SEM
mode. Then the sample was moved back into the proof ring system to have its crack
grown. The sample would be taken out again for every 2.5 hours to measure its crack
length until the sample failed. As a result, a curve of crack length as a function of test
time can be obtained. From this curve, the crack growth rate can be obtained as the slope
and with the ‘Edge Crack in a Finite Plane under Uniaxial Loads’ model, the stress
intensity factor can be determined. Finally, the crack growth rate as a function of stress
intensity factor was obtained.

42
Figure 2.5: A schematic overview of the proof ring system for SCC test [70]
Figure 2.6: Dimension of the SCC specimen for the proof ring test system [70]
43
Figure 2.7: Calibration curve: a relationship between the displacement of proof ring
and the applied load [70].
44
CHAPTER 3: RESULTS AND DISCUSSION
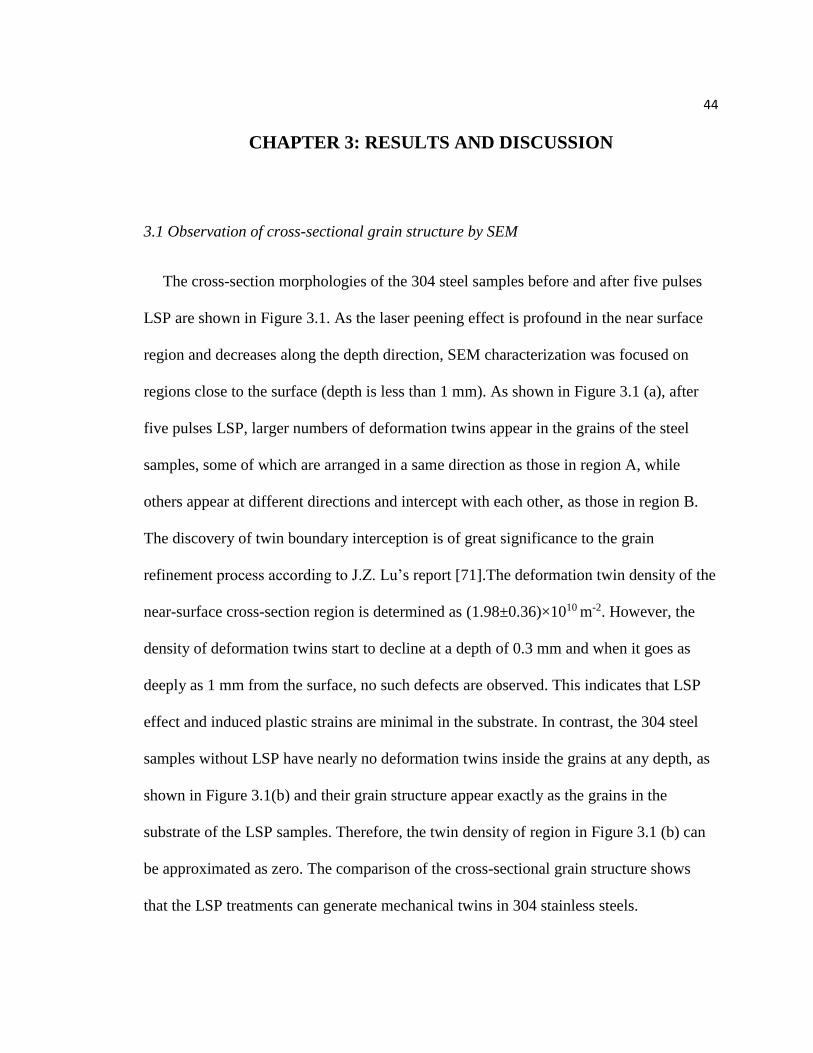
3.1 Observation of cross-sectional grain structure by SEM
The cross-section morphologies of the 304 steel samples before and after five pulses
LSP are shown in Figure 3.1. As the laser peening effect is profound in the near surface
region and decreases along the depth direction, SEM characterization was focused on
regions close to the surface (depth is less than 1 mm). As shown in Figure 3.1 (a), after
five pulses LSP, larger numbers of deformation twins appear in the grains of the steel
samples, some of which are arranged in a same direction as those in region A, while
others appear at different directions and intercept with each other, as those in region B.
The discovery of twin boundary interception is of great significance to the grain
refinement process according to J.Z. Lu’s report [71].The deformation twin density of the
near-surface cross-section region is determined as (1.98±0.36)×1010 m-2. However, the
density of deformation twins start to decline at a depth of 0.3 mm and when it goes as
deeply as 1 mm from the surface, no such defects are observed. This indicates that LSP
effect and induced plastic strains are minimal in the substrate. In contrast, the 304 steel
samples without LSP have nearly no deformation twins inside the grains at any depth, as
shown in Figure 3.1(b) and their grain structure appear exactly as the grains in the
substrate of the LSP samples. Therefore, the twin density of region in Figure 3.1 (b) can
be approximated as zero. The comparison of the cross-sectional grain structure shows
that the LSP treatments can generate mechanical twins in 304 stainless steels.
45
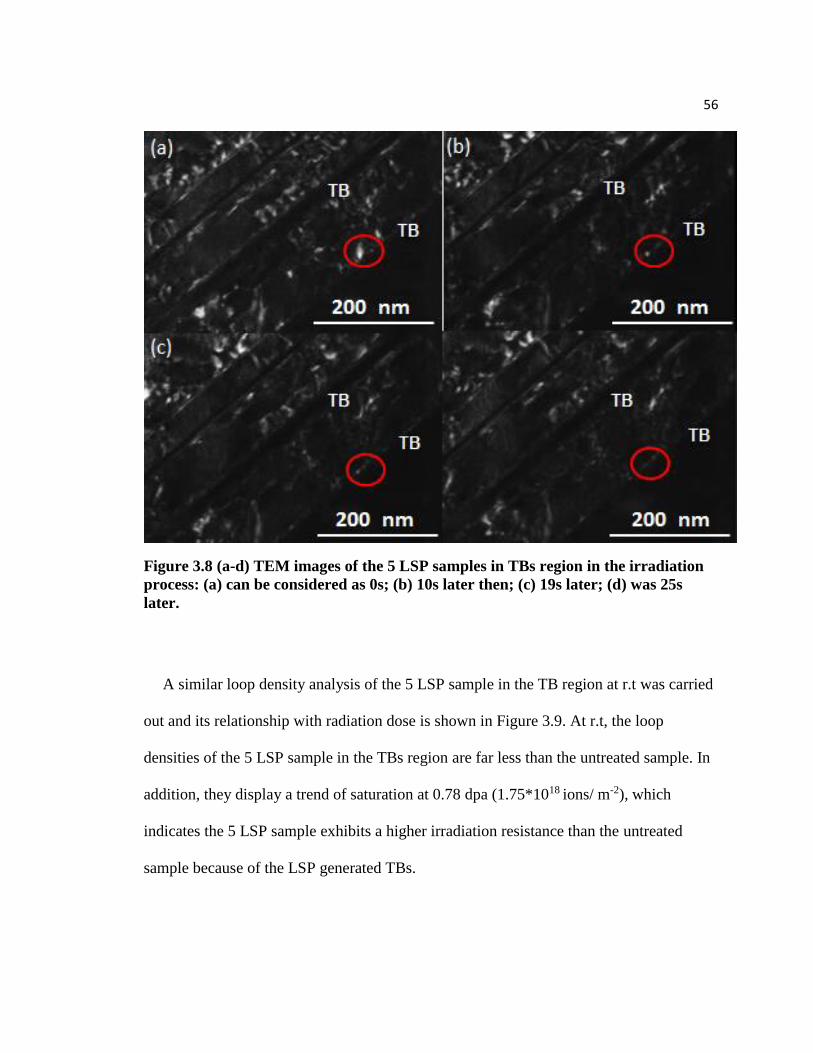
Figure 3.1 SEM images of the cross-sectional grain structure of 304 stainless steel
samples subjected to: (a) 5 LSP; (b) untreated.
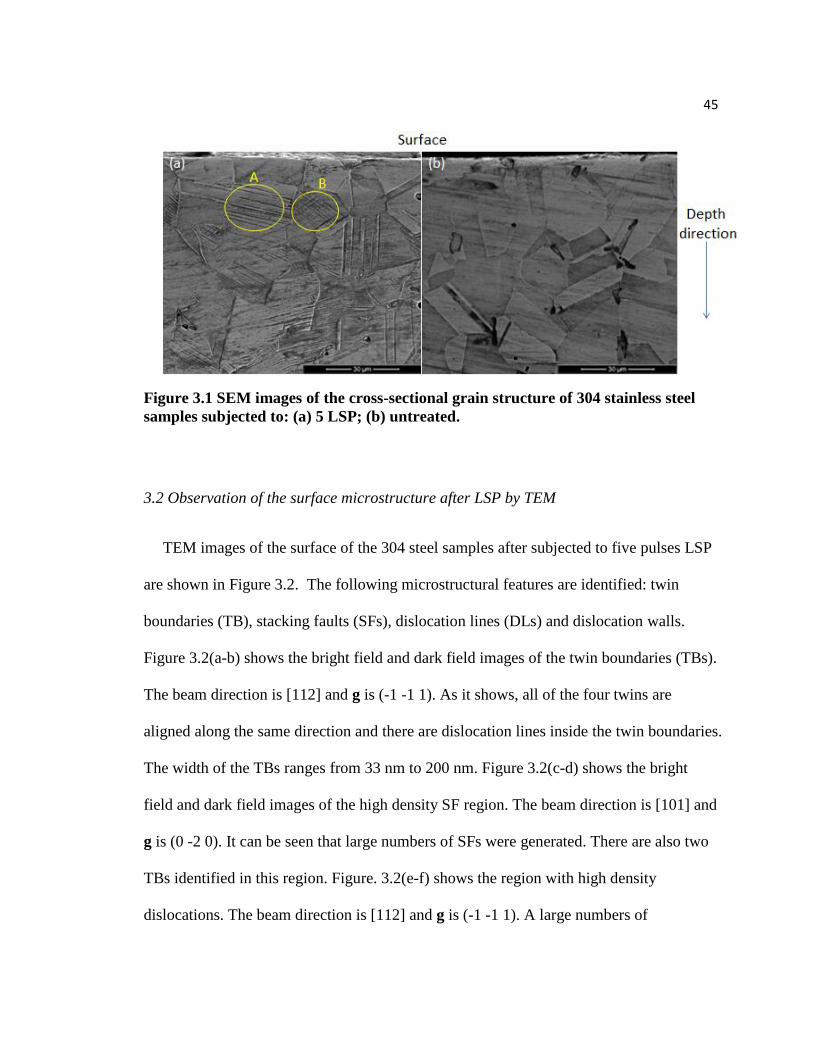
3.2 Observation of the surface microstructure after LSP by TEM
TEM images of the surface of the 304 steel samples after subjected to five pulses LSP
are shown in Figure 3.2. The following microstructural features are identified: twin
boundaries (TB), stacking faults (SFs), dislocation lines (DLs) and dislocation walls.
Figure 3.2(a-b) shows the bright field and dark field images of the twin boundaries (TBs).
The beam direction is [112] and g is (-1 -1 1). As it shows, all of the four twins are
aligned along the same direction and there are dislocation lines inside the twin boundaries.
The width of the TBs ranges from 33 nm to 200 nm. Figure 3.2(c-d) shows the bright
field and dark field images of the high density SF region. The beam direction is [101] and
g is (0 -2 0). It can be seen that large numbers of SFs were generated. There are also two
TBs identified in this region. Figure. 3.2(e-f) shows the region with high density
dislocations. The beam direction is [112] and g is (-1 -1 1). A large numbers of
46
dislocation lines and dislocation walls can be identified in that region. The average
dislocation density is determined as (9.63±1.24)×1013 m-2.
Figure 3.2 TEM images of 304 sample surface subjected to 5 LSP: (a) bright field
image of the twin boundaries; (b) dark field image of the twin boundaries; (c) bright
field image of the high density SFs region; (d) dark field image of the high density
SFs region; (e) bright field image of the high density DLs and dislocation walls
region; (f) dark field image of the high density DLs and dislocation walls region.
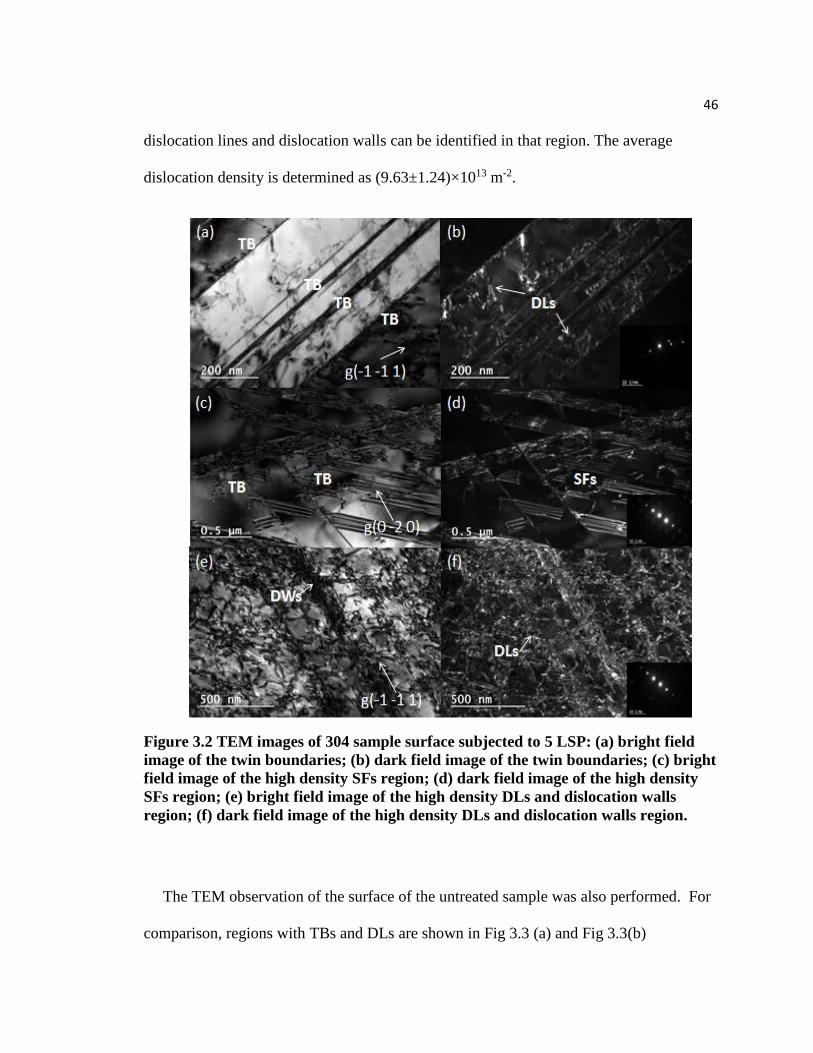
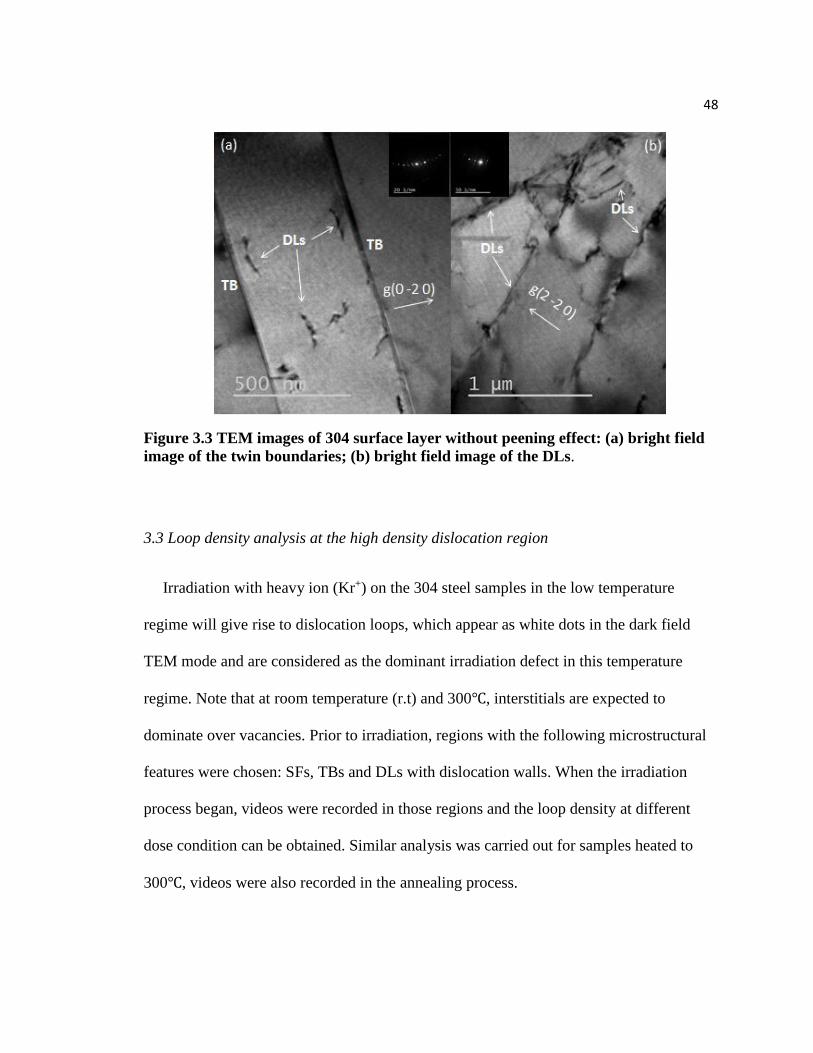
The TEM observation of the surface of the untreated sample was also performed. For
comparison, regions with TBs and DLs are shown in Fig 3.3 (a) and Fig 3.3(b)
47
respectively. In Fig 3.3(a), the beam direction is [101] and g is (0 -2 0). The twin width is
around 500 nm and the number of TBs as well as DLs are fewer than the peening sample.
This TB along with a few other TBs in the untreated samples are most likely generated
during preparation when the samples were subjected to the hot isostatic pressing.
Although all the steel samples were annealed immediately after received, some of the
TBs might remain. However, compared with the LSP samples, the number of TBs in the
untreated samples is much fewer. In Fig 3.3(b), the beam direction is [112] and g vector
is (2 -2 0). It can be seen the number of DLs is fewer than the peening surface and there
is no dislocation walls found. The average dislocation density is determined as
(6.53±0.85)×1012 m-2 which is approximately an order of magnitude less than the
dislocation density of the peening surface. As a result, it shows that by inducing severe
plastic deformation in the form of shock waves, multiple LSP processes can not only
increase the number of TBs, but can also increase the dislocation density of the 304
stainless steel.
48
Figure 3.3 TEM images of 304 surface layer without peening effect: (a) bright field
image of the twin boundaries; (b) bright field image of the DLs.
3.3 Loop density analysis at the high density dislocation region
Irradiation with heavy ion (Kr+) on the 304 steel samples in the low temperature
regime will give rise to dislocation loops, which appear as white dots in the dark field
TEM mode and are considered as the dominant irradiation defect in this temperature
regime. Note that at room temperature (r.t) and 300℃, interstitials are expected to
dominate over vacancies. Prior to irradiation, regions with the following microstructural
features were chosen: SFs, TBs and DLs with dislocation walls. When the irradiation
process began, videos were recorded in those regions and the loop density at different
dose condition can be obtained. Similar analysis was carried out for samples heated to
300℃, videos were also recorded in the annealing process.
49
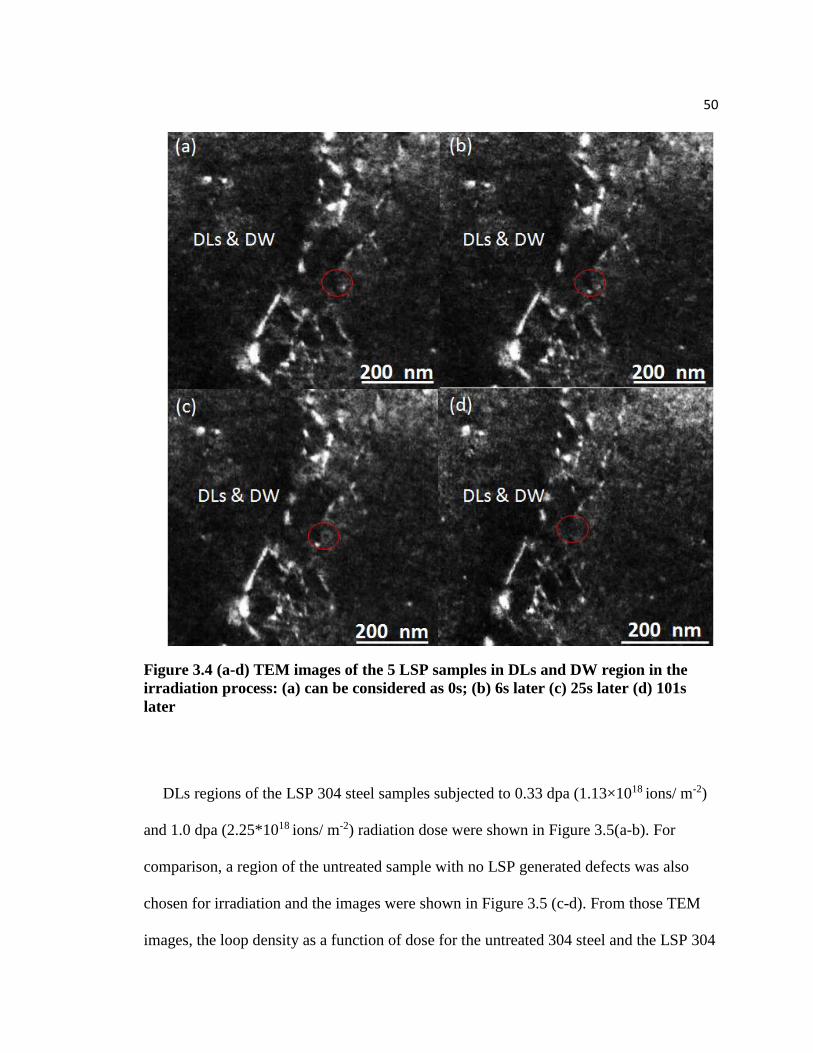
Fig 3.4 shows the process of loop absorption by DLs. In Figure 3.4(a), the image can
be considered at 0s when one dislocation loop moved to the DL. Then Figure 3.4(b) can
be considered 6s later when the first loop was gradually absorbed and a second loop
appeared. Figure 3.4(c) was 25s later when the first loop disappeared while the second
loop became weaker. Finally, Figure 3.4(d) was taken 101s later when the second loop
was completely adsorbed by the DL and disappeared, indicating DL’s ability to act as
sink as well. In fact, the high density dislocation has been confirmed as one of the
effective high strength sinks for radiation defects [72, 73]. The effectiveness can be
quantified as the sink strength of dislocation or Sd given by Eqn 4.
50
Figure 3.4 (a-d) TEM images of the 5 LSP samples in DLs and DW region in the
irradiation process: (a) can be considered as 0s; (b) 6s later (c) 25s later (d) 101s
later
DLs regions of the LSP 304 steel samples subjected to 0.33 dpa (1.13×10¹⁸ ions/ m-2)
and 1.0 dpa (2.25*1018 ions/ m-2) radiation dose were shown in Figure 3.5(a-b). For
comparison, a region of the untreated sample with no LSP generated defects was also
chosen for irradiation and the images were shown in Figure 3.5 (c-d). From those TEM
images, the loop density as a function of dose for the untreated 304 steel and the LSP 304

51
steels can be determined and displayed in Figure 3.6. It can be seen that with the increase
of dose, radiation damage becomes more severe and the loop density increases. However,
the 5 LSP steel shows a much less radiation damage than the untreated steel sample. The
loop density of 5 LSP steel is approximately one magnitude less than the untreated one.
The high density dislocations generated during LSP are believed to play an important
role in the difference in loop density. According to Eqn.4, the sink strength of dislocation
is proportional to its density for the same material. The 5 LSP sample is thus estimated to
have a 𝑆𝑑 around (9.63±1.24)×1013 m-2, approximately one order of magnitude larger
than that of the untreated sample whose 𝑆𝑑 is (6.53±0.85)×1012 m-2 (as Zd is unity).
Therefore, the high density dislocations produced by the laser shock processing raised the
radiation tolerance of the 304 stainless steel.
Figure 3.6 also displays a relationship of loop density vs. dose for the 5 LSP sample
irradiated at 300℃. As it shows, the loop density of the 5 LSP sample after annealing is
approximately 0.1 order of magnitude higher than those at room temperature (r.t) but it is
still greatly less than the loop densities of the untreated sample. The slight increase of
dislocation loop in the 5 LSP sample can be attributed to the temperature effect in two
aspects. Firstly, increasing temperature can promote the displacement of atoms thus
slightly increase the loop density, which is consistent as the pervious discovery by
S.J.Zinkle in Figure 1.10. Secondly, the LSP generated dislocations became mobile upon
annealing in a range (from 298K to 573K) below one third of the 304 sample’s melting
temperature (1723K). The video of the annealing process demonstrates this phenomenon.
The velocity of dislocation motion is given by the following equation:
52
𝑉𝑑𝑖𝑠 = 𝑓(𝜎)exp (−𝐸/𝑘𝑇) Eqn.11
where 𝑓(𝜎) is a function of stress, E is the activation energy and T is the absolute
temperature [73]. The increased 𝑉𝑑𝑖𝑠 enables the glide or climb of the DLs and when two
parallel DLs of opposite sign come across, annihilation will take place and this decreases
dislocation density. Figure 3.7 compares the microstructure of the 5 LSP sample in a
region with SFs and DLs before and after annealing at 300℃. There were five SF regions
at r.t. After annealing at 300℃, only two SFs regions remained. Since SFs are formed by
a high energy dislocation separated as two or more partial dislocations in low energy state,
the annihilation of SFs can cause a decline of dislocation density. Given that, the average
dislocation density in this region was (9.14±1.02)×1013 m-2 before annealing, but
decreased to (6.42±0.77)×1013 m-2 after annealing and that contributes to the slight
increase of radiation damage. But overall, the loop density is much less than the untreated
sample.
53
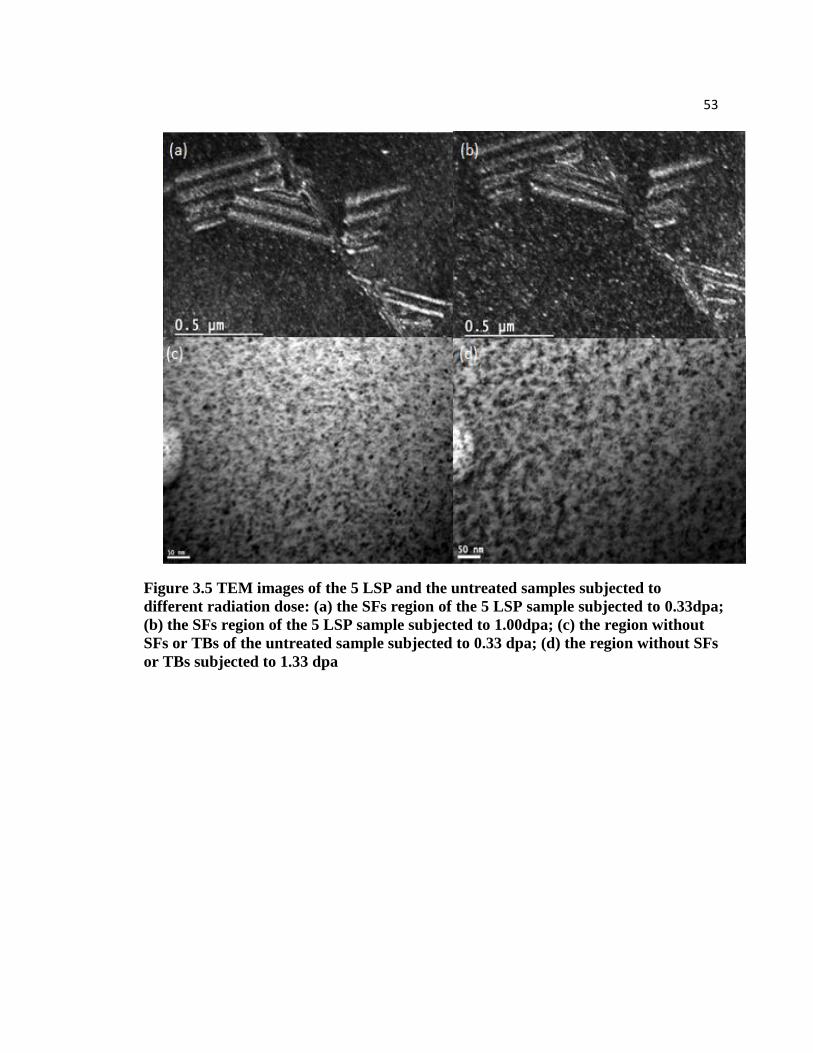
Figure 3.5 TEM images of the 5 LSP and the untreated samples subjected to
different radiation dose: (a) the SFs region of the 5 LSP sample subjected to 0.33dpa;
(b) the SFs region of the 5 LSP sample subjected to 1.00dpa; (c) the region without
SFs or TBs of the untreated sample subjected to 0.33 dpa; (d) the region without SFs
or TBs subjected to 1.33 dpa
54
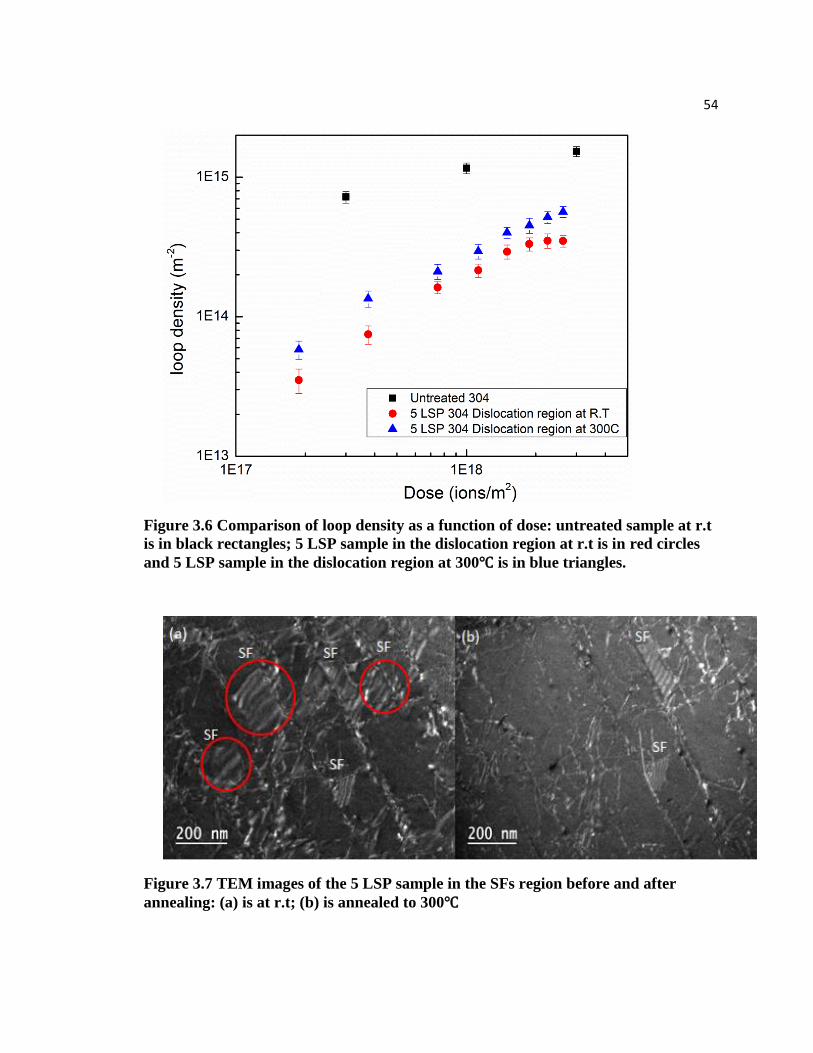
Figure 3.6 Comparison of loop density as a function of dose: untreated sample at r.t
is in black rectangles; 5 LSP sample in the dislocation region at r.t is in red circles
and 5 LSP sample in the dislocation region at 300℃ is in blue triangles.
Figure 3.7 TEM images of the 5 LSP sample in the SFs region before and after
annealing: (a) is at r.t; (b) is annealed to 300℃
55
3.4 Loop density analysis at twin boundary region
It has been reported that grain boundaries (GBs) can serve as sinks for radiation
defects and that the GB sink efficiency depends on the structure, misorientation, GB
plane orientation, etc. [74,75]. The sink capacity of TB, which is a special type of GB, is
thus worthy of investigation. The process of loop absorption was recorded in the in-situ
irradiation TEM experiment and the features of this process are displayed in Figure 3.8
(a-d). In Figure 3.8(a), a loop emerged and moved to the twin boundary. Then it became
smaller and weaker in illumination as Figure 3.8(b) and Figure 3.8 (c) show. Finally in
Figure 3.9(d) this dislocation loop was completely absorbed by TB and disappeared,
indicating that similar as the high density dislocations, TBs can act as sinks for radiation-
induced dislocation loops.
56
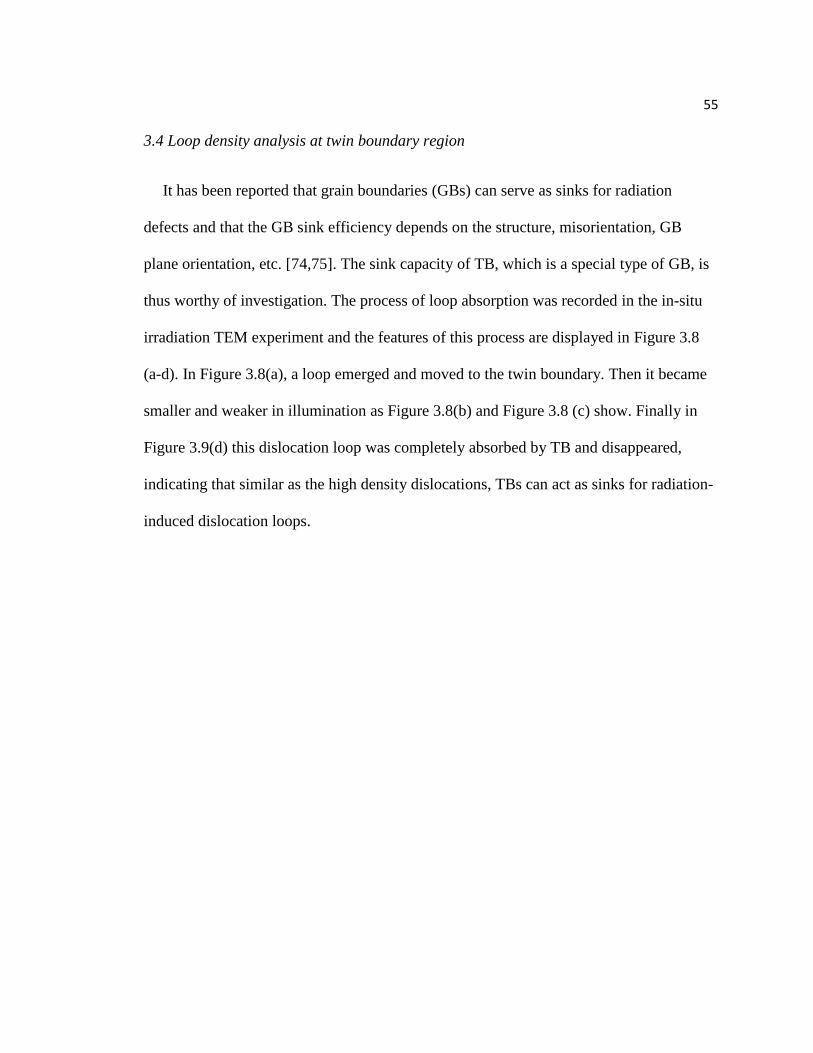
Figure 3.8 (a-d) TEM images of the 5 LSP samples in TBs region in the irradiation
process: (a) can be considered as 0s; (b) 10s later then; (c) 19s later; (d) was 25s
later.
A similar loop density analysis of the 5 LSP sample in the TB region at r.t was carried
out and its relationship with radiation dose is shown in Figure 3.9. At r.t, the loop
densities of the 5 LSP sample in the TBs region are far less than the untreated sample. In
addition, they display a trend of saturation at 0.78 dpa (1.75*1018 ions/ m-2), which
indicates the 5 LSP sample exhibits a higher irradiation resistance than the untreated
sample because of the LSP generated TBs.
57
In order to investigate the effect of temperature, irradiation was also performed in the
TB regions at 300℃. The corresponding loop density and dose relationship was shown in
Figure 3.9 as well. In the beginning when dose is low, the annealed sample has its loop
densities close to the loop density of the 5 LSP sample at r.t. With the dose increased, the
loop densities slightly exceed the r.t ones. The effect of temperature on the twin boundary
was observed different than the dislocations. As the annealing video shows, the TB is
stable upon annealing at 300 ℃. However, as Figure 3.8 shows, there are certain numbers
of dislocations and DLs inside the TBs. Therefore, annealing at 300 ℃ can cause the
annihilation of these dislocations, which result in the slight increase of loop density in TB
region.
Figure 3.9 Comparison of loop density as a function of dose: untreated sample at r.t
is in black rectangles; 5 LSP sample in twin boundary region at r.t is in red circles
and 5 LSP sample in twin boundary region at 300℃ is in blue triangles.

58
3.5 Microstructural evolution of LSP 304 stainless steel in elevated temperature
condition
As discussed above, laser shock processing can induce a high density of dislocations,
stacking faults and twin boundaries in the 304 stainless steel. However, with the sample
annealed to 300℃, microstructural evolution of the LSP sample will take place. As for
dislocations, because of the high mobility and recovery behavior at elevated temperatures,
annihilation and rearrangement of the LSP generated dislocations occurs and
consequently the density of dislocation decreased. The behavior of dislocations in low
temperature annealing can alter the LSP effect depending on the material and
strengthening mechanism. In the case of AISI 8620, which is a ferritic stainless steel
studied by J.Z.Lu et al. about the LSP strengthening and grain refinement mechanism
[76], the effect of dislocation annihilation is expected to result in the release of residual
stress and the increase of the grain size. The reason is that the grain refinement of the
AISI 8620 steels is achieved by formation of dislocation walls. When their laser-peened
samples are annealed at 300℃, some of the LSP generated dislocations as well as the
dislocation walls are expected to be annihilated. As a result, about 20% of the residual
stress will be released. This predication is based on the data from M.R.James [77].
In the case of LSP 304, the microstructural evolution upon annealing will be different
because the grain refinement mechanism is based on the formation and intersection of
mechanical twins (MTs) instead of dislocation walls, as reported by J.Z.Lu et al. [71].
Along with large numbers of dislocations and SFs, MTs are formed after LSP and they
are thermally stable in this temperature regime, as confirmed by Fig.10 and M.Shimada et
59
al.’s report [78]. The effect of annealing will thus be related to the interaction between
dislocations and newly-formed TBs. Many of the mechanisms for dislocations-coherent
twin boundary (CBT) interaction have been studied and the application of these
mechanisms is based on different materials and types of dislocations. For austenitic steels,
both screw and non-screw dislocations can be dissociated by TBs into partial dislocations
and when this happens, some of the partial dislocations can pass through or propagate
along the CBT while others are absorbed. [79-83]. In the meantime, P. H. Pumphreya et
al. used hot stage TEM to show that dislocations were annihilated by high angle grain
boundaries at elevated temperature for austenitic stainless steel and the annihilation was
achieved by dissociation of the dislocations into partials [84]. As a result, annealing our
LSP 304 sample to 300℃ would promote the interaction between the newly formed TBs
and the dislocations that lie in the TB region. The dissociation and absorption of
dislocations would eventually contribute to the release of strain energy and the decrease
of dislocation density.

60
Figure 3.10 TEM images of the 5 LSP sample in TBs region after 300℃ annealing,
the beam direction is [112] and g vector is (2 -2 0): (a) is the bright field image; (b) is
the dark field image
In both cases (ferritic and austenitic), since the maximum annealing temperature is
only 300℃, no grain growth will take place. Note that due to the limitation of laser
energy (maximum laser peening energy =850mJ), the grain refinement phenomenon is
not significant for the close-peening region. Therefore, the microstructural evolution of
the higher energy LSP sample or that at higher elevated temperature will be interesting
topics for future investigation.
3.6 Comparison of sink strength for twins and dislocations
While both high density dislocations and TBs can act as sinks for radiation defects,
their strength is varied. The concept of sink strength is defined to quantify and compare
the different capacity in defect absorption. As determined above in Chapter 3.3, the sink
strength of dislocation (9.14±1.02)×1013 m-2, which is approximately 1.0×10¹⁴ m-2.

61
Calculation of the TB sink strength is based on the sink strength of grain boundary for
point defect, which is shown as followed [85]:
𝑆𝐺𝐵 = 𝐴 × 𝑠𝑖𝑛𝜃
2 Eqn. 13
where 𝜃 is the misfit angle and A is 2Z/bd. b is the magnitude of the Burger’s vector for
edge dislocation, i.e. |𝑏| =𝑎0
2√ℎ2 + 𝑘2 + 𝑙2, and Z/d is defined as the number of point
defects extinguished per length of dislocation. From our in-situ irradiation at dislocation
region, it is estimated that for a total length of 10 micron dislocation line, there would be
around 25 point defects absorbed. The value of Z/d is thus estimated as 2.5×10⁶ m-1 . To
determine the misfit angle, the diffraction pattern of the TB was indexed and shown in
Figure 11. From Figure 11, the misfit angle Ө is determined as 70.5 degree. Assuming 𝑎0
equals to the lattice constant of FCC iron (3.65Å), 𝑆𝑇𝐵 =7.44×10¹⁵ m-2. Even though the
grain structure of our LSP 304 samples remains coarse, the sink strength of the TBs is
comparable to the grain boundary sink strength of the ultrafine grained 304L stainless
steel [54], which is around 6×10¹⁵ m-2. A possible explanation is that the generation of
high density dislocations and most importantly, the high sink strength of incoherent twin
boundaries gives rise to a high capacity to capture radiation-induced point defects.
Comparing the sink strength of the LSP generated dislocations and the sink strength of
the LSP generated dislocations twin boundaries gives the following relationship:
𝑆𝑇𝐵>𝑆𝑑𝑖𝑠 [86].
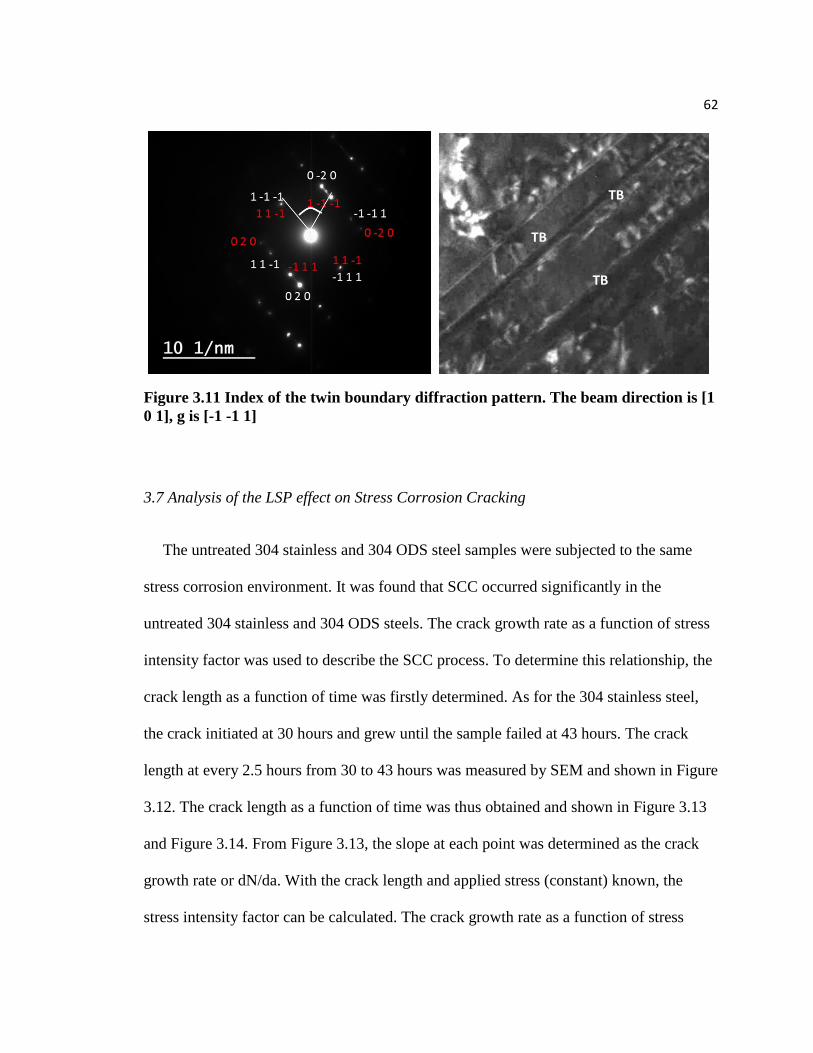
62
Figure 3.11 Index of the twin boundary diffraction pattern. The beam direction is [1
0 1], g is [-1 -1 1]
3.7 Analysis of the LSP effect on Stress Corrosion Cracking
The untreated 304 stainless and 304 ODS steel samples were subjected to the same
stress corrosion environment. It was found that SCC occurred significantly in the
untreated 304 stainless and 304 ODS steels. The crack growth rate as a function of stress
intensity factor was used to describe the SCC process. To determine this relationship, the
crack length as a function of time was firstly determined. As for the 304 stainless steel,
the crack initiated at 30 hours and grew until the sample failed at 43 hours. The crack
length at every 2.5 hours from 30 to 43 hours was measured by SEM and shown in Figure
3.12. The crack length as a function of time was thus obtained and shown in Figure 3.13
and Figure 3.14. From Figure 3.13, the slope at each point was determined as the crack
growth rate or dN/da. With the crack length and applied stress (constant) known, the
stress intensity factor can be calculated. The crack growth rate as a function of stress
TB
TB
TB
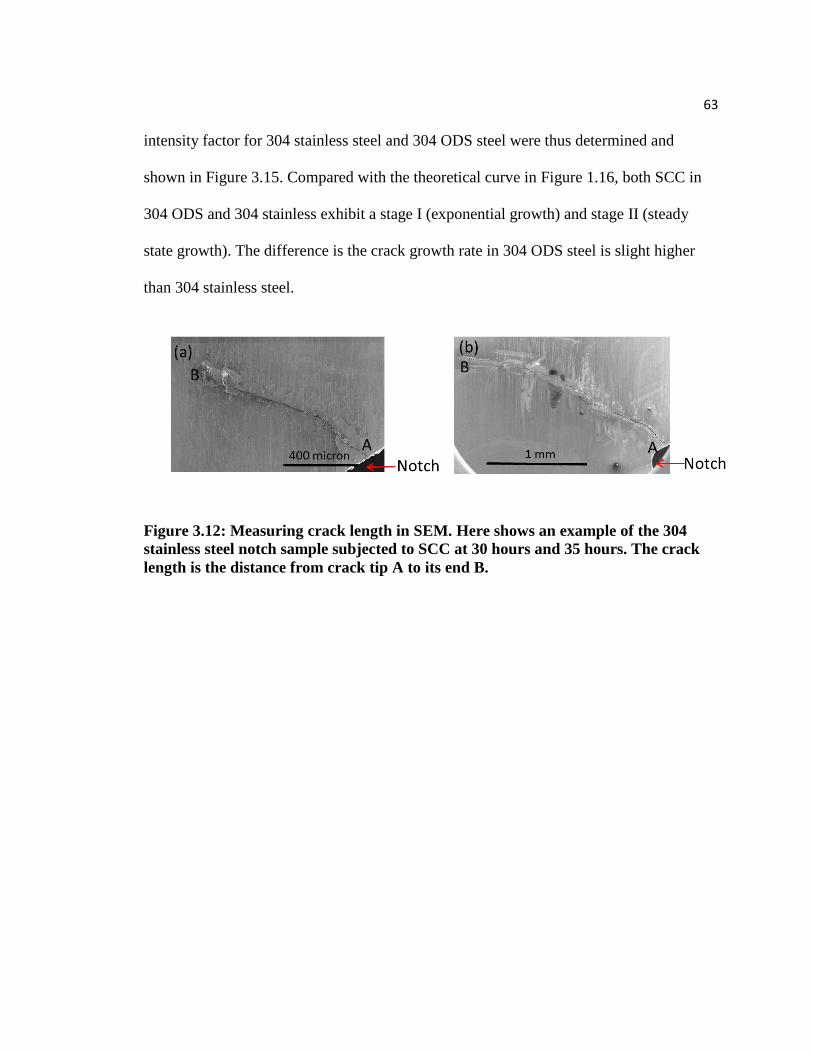
63
intensity factor for 304 stainless steel and 304 ODS steel were thus determined and
shown in Figure 3.15. Compared with the theoretical curve in Figure 1.16, both SCC in
304 ODS and 304 stainless exhibit a stage I (exponential growth) and stage II (steady
state growth). The difference is the crack growth rate in 304 ODS steel is slight higher
than 304 stainless steel.
Figure 3.12: Measuring crack length in SEM. Here shows an example of the 304
stainless steel notch sample subjected to SCC at 30 hours and 35 hours. The crack
length is the distance from crack tip A to its end B.
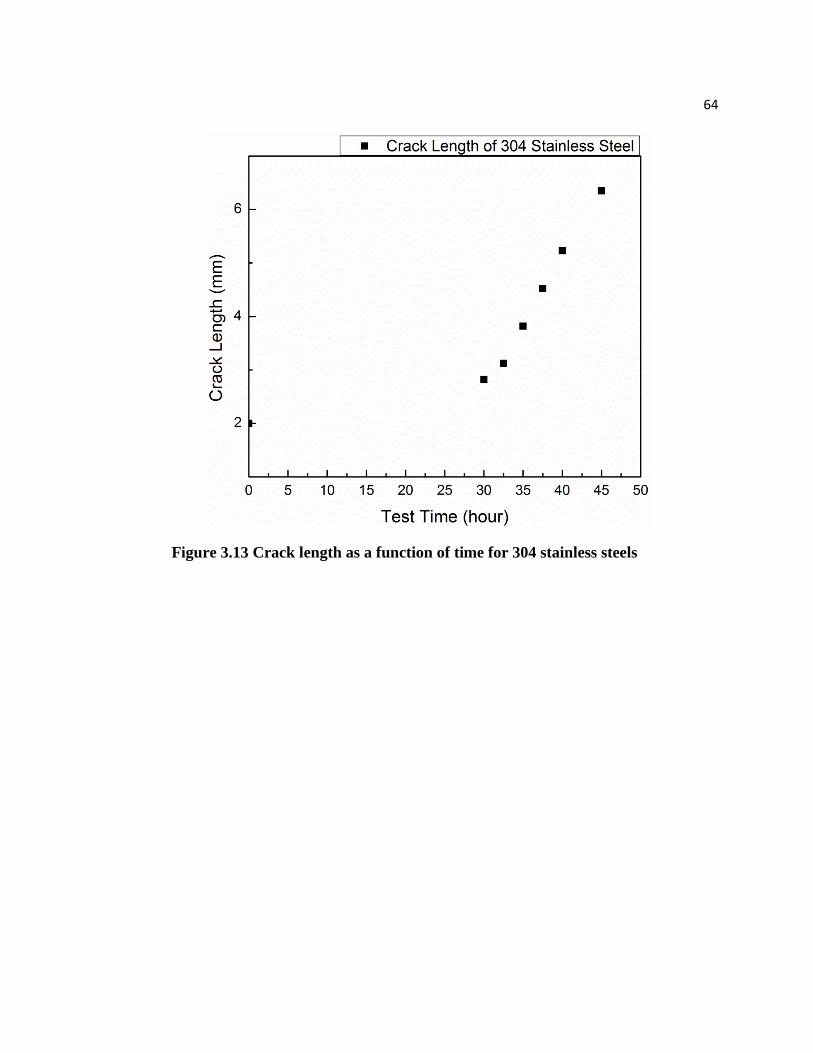
64
Figure 3.13 Crack length as a function of time for 304 stainless steels
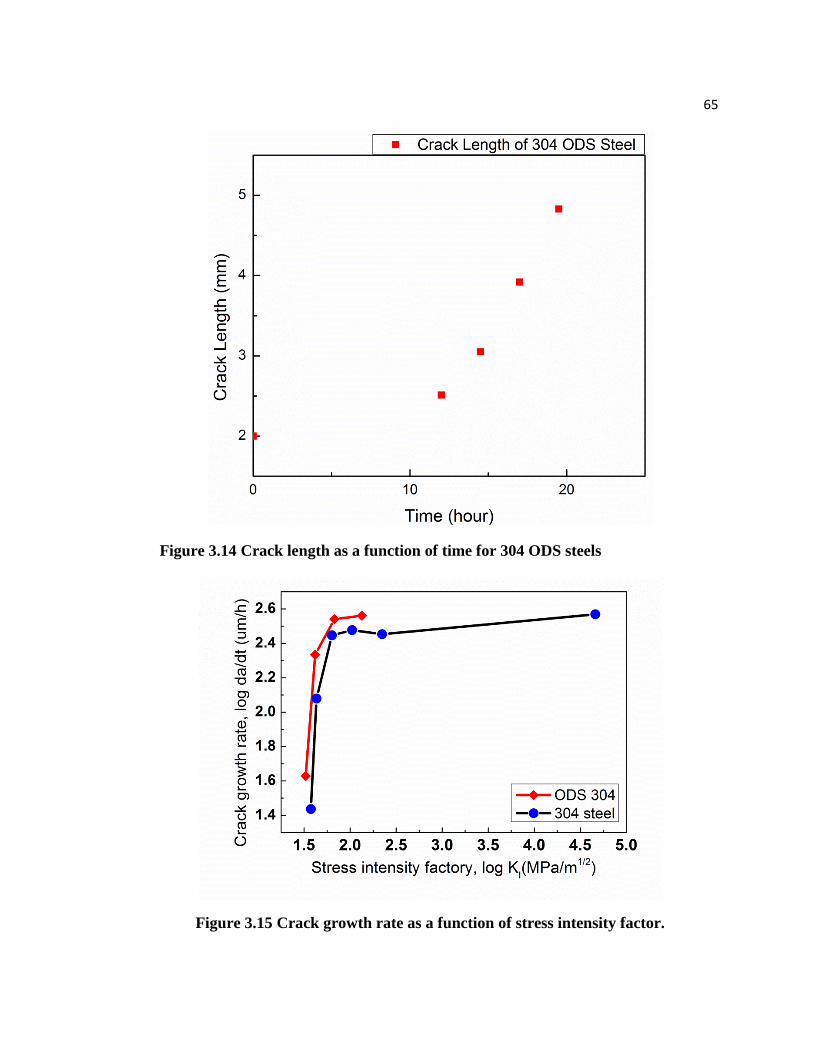
65
Figure 3.14 Crack length as a function of time for 304 ODS steels
Figure 3.15 Crack growth rate as a function of stress intensity factor.

66
Optical microscope was used to observe the crack morphology in the cross section of
the 304 stainless steels. As Figure 3.16 shows, the crack was firstly initiated along the
grain boundary but later propagate across the grain at different direction. Most of the
cracks are observed as TGSCC with a small number of IGSCC. This crack morphology is
related to the corrosion environment and the applied stress. In this test, the sample was
subjected to a saturated MgCl2 solution at boiling point (144℃), with around 200 MPa
tensile stress. The applied stress can cause film rupture and break down the protective
passive film. Then the solution provides a ‘low pH value’ (pH = 5) environment by the
following electrochemical reaction:
𝑀𝑔2+ + 2𝐻2𝑂 → 𝑀𝑔(𝑂𝐻)2 + 2𝐻+
Under this condition, crack will initiate at the rupture sites and propagate across the grain,
following the film-induced cleavage model as discussed in the SCC mechanism. As a
result, the crack morphology appears as TGSCC, as the model predicts.
However, when the LSP treatment was carried out prior to the SCC test, the LSP
samples were found to be much more resistant against SCC. As Figure 3.17 shows, no
cracks were observed at the cross-section of the laser peened 304 stainless steels after
subjected to the SCC environment for a longer time, 96 hours. Possible reason is that the
LSP process can induce compressive stress to the material, which can resist the applied
tensile stress and protect the passive film from rupture.
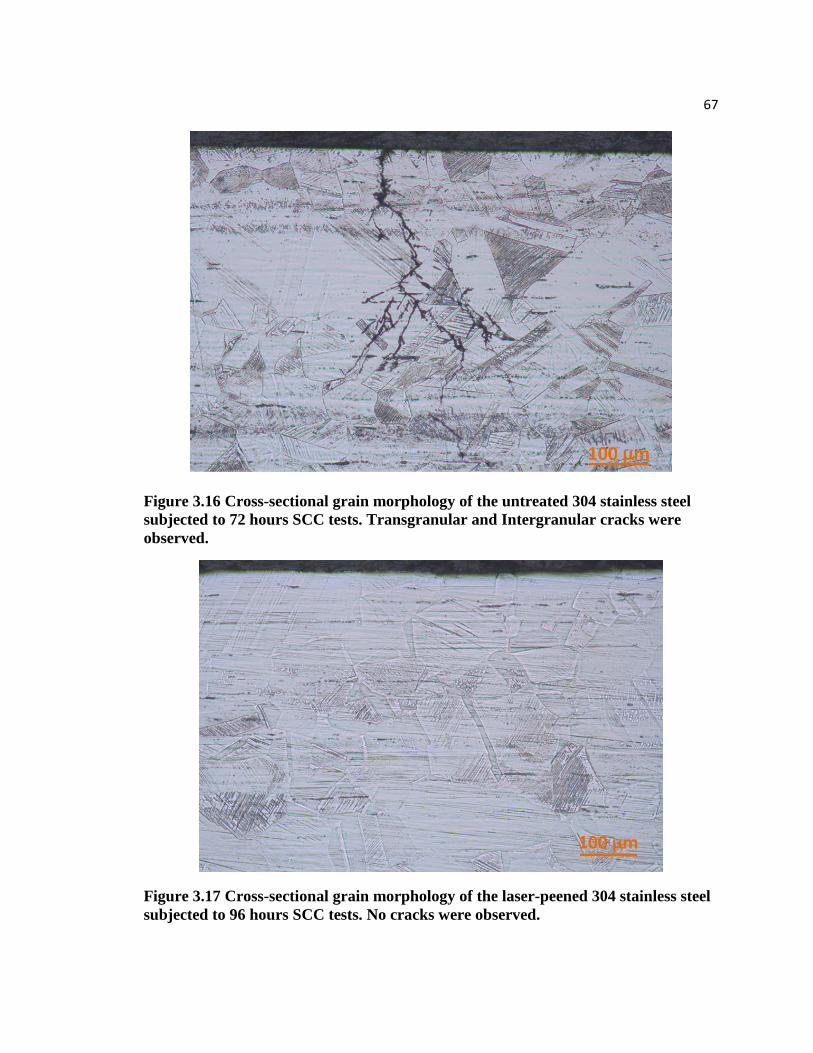
67
Figure 3.16 Cross-sectional grain morphology of the untreated 304 stainless steel
subjected to 72 hours SCC tests. Transgranular and Intergranular cracks were
observed.
Figure 3.17 Cross-sectional grain morphology of the laser-peened 304 stainless steel
subjected to 96 hours SCC tests. No cracks were observed.
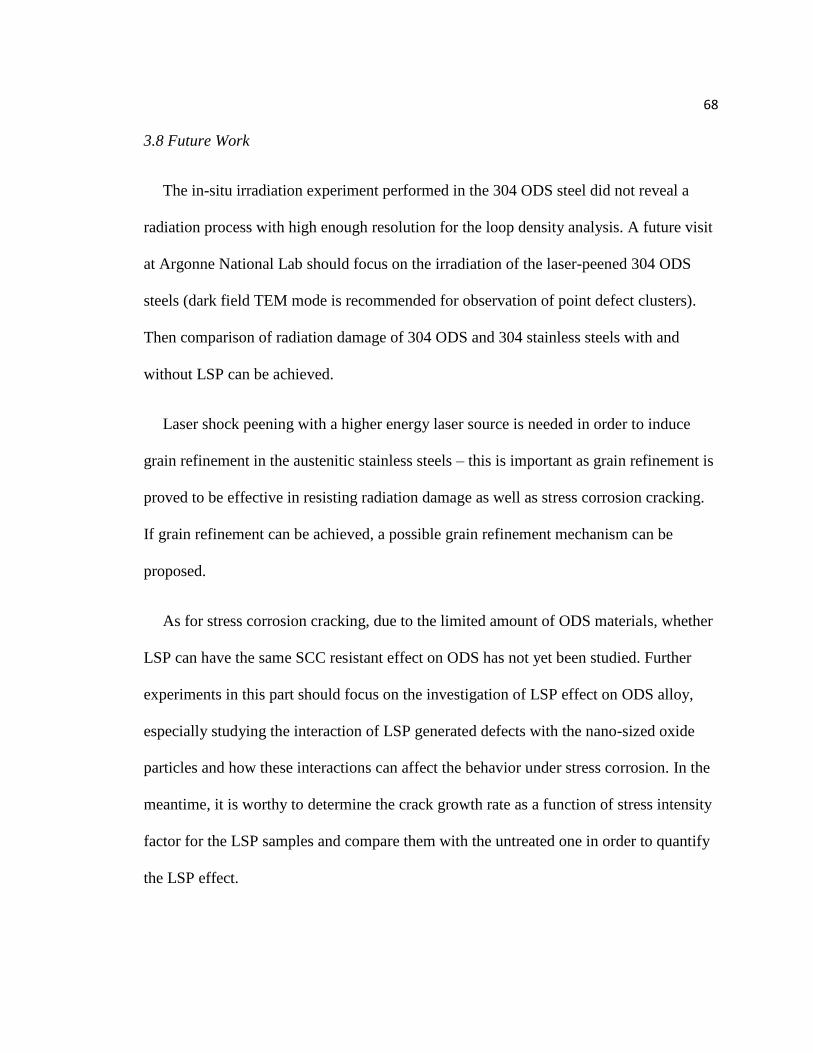
68
3.8 Future Work
The in-situ irradiation experiment performed in the 304 ODS steel did not reveal a
radiation process with high enough resolution for the loop density analysis. A future visit
at Argonne National Lab should focus on the irradiation of the laser-peened 304 ODS
steels (dark field TEM mode is recommended for observation of point defect clusters).
Then comparison of radiation damage of 304 ODS and 304 stainless steels with and
without LSP can be achieved.
Laser shock peening with a higher energy laser source is needed in order to induce
grain refinement in the austenitic stainless steels – this is important as grain refinement is
proved to be effective in resisting radiation damage as well as stress corrosion cracking.
If grain refinement can be achieved, a possible grain refinement mechanism can be
proposed.
As for stress corrosion cracking, due to the limited amount of ODS materials, whether
LSP can have the same SCC resistant effect on ODS has not yet been studied. Further
experiments in this part should focus on the investigation of LSP effect on ODS alloy,
especially studying the interaction of LSP generated defects with the nano-sized oxide
particles and how these interactions can affect the behavior under stress corrosion. In the
meantime, it is worthy to determine the crack growth rate as a function of stress intensity
factor for the LSP samples and compare them with the untreated one in order to quantify
the LSP effect.

69
CHAPTER 4: CONCLUSIONS
Microstructural evolution of the austenitic stainless steels after laser shock peening
treatment was investigated. With the change of microstructure, the laser peened samples
were further tested by in-situ irradiation TEM and stress corrosion cracking to study the
effect of these LSP induced defects and compressive stress on the materials behavior
under heavy ion radiation damage and stress corrosion. The key conclusions include:
1. LSP was found to generate shock waves and produce severe plastic deformation
into the austenitic steels. By means of TEM, large numbers of LSP generated twin
boundaries (TBs) and dislocation lines (DLs) and stacking faults (SFs) are identified.
2. Irradiation of 304 stainless steel at low temperature regime (< 300 ℃) can generate
high density of dislocation loops which appear as white dots in dark-field TEM mode.
However, when the samples were subjected to laser peening prior to irradiation, the
dislocation loop density was found to decrease as large as one magnitude, which means
less radiation damage. Further investigation of the irradiation process shows that high
density dislocation and twin boundary can serve as high strength sink for radiation
defects. Consequently, LSP process can improve the radiation resistance of austenitic
steel by generating high density dislocations and twin boundaries.
3. Stress corrosion cracking was found to occur significantly in 304 stainless and 304
ODS steels. The crack growth rate and stress intensity factor exhibits a similar
relationship as the theoretical model except the stage III is missing because of the limited
dimension of the material or short last time of stage III. However, when the 304 stainless

70
steel sample was subjected to LSP treatment prior to SCC test, no apparent cracks were
observed even in a longer SCC test time. This indicates laser peening can effectively
increase the resistance against stress corrosion in not only crack initiation but also crack
propagation.

71
References:
[1] ASM International. Stainless Steels for Design Engineers Chapter 6.
[2] A.Hirata, T.Fujita, Y.Wen, J.Schneibel, C.Liu, M.Chen. Atmoic structure of
nanoclusters in oxide-dispersion-strengthened steels. Nature Materials. 2011.
[3] H.Oka, M.Watanabe, H.Kinoshita, T. Shibayamaa, N. Hashimotoa, S. Ohnukia el at.
In situ observation of damage structure in ODS austenitic steel during electron irradiation.
Journal of Nuclear Materials. vol.417 2011 pp.279-282
[4] M.Wang, Z.Zhou, H.Sun. H.hu, S. Li Microstructural observation and tensile
properties of ODS-304 austenitic steel. Material Science and Engineering:A vol559 2013
pp.287-292
[5] Askar yan CA, Moroz EM. Pressure on evaporation of matter in a radiation beam.
Journal of Experimental and Theoretical Physics Letters 1963;16:1638–44.
[6] White RM. Elastic wave generation by electron bombardment or electromagnetic
wave absorption. Journal of Applied Physics 1963;34:2123–4.
[7] Gregg DW, Thomas SJ. Momentum transfer produced by focused laser giant pulses.
Journal of Applied Physics 1966;27:2787–9.
[8] Skeen CH, York CM. Laser-Induced “blow-off” phenomenon. Applied Physics
Letters 1968; 12:369–71.
[9] Anderholm NC. Laser-generated stress waves. Applied Physics Letters 1970;16:113–
5.
[10] Jones ED. Ultrafast laser-induced stress waves in solids. Applied Physics Letters
1971;18:33–5.
[11] Fairand BP, Clauer AH, Jung RG, Wilcox BA. Quantitative assessment of laser-
induced stress waves generated at confined surfaces. Applied Physics Letters
1974;25:431–3.
[12] Fairand BP, Clauer AH. Use of laser generated shocks to improvethe properties of
metals and alloys. Industrial Applications of High Power Laser Technology
1976;86:112–9.
[13] Fairand BP, Clauer AH, Wilcox BA. Pulsed laser induced deformation in an Fe-3
Wt Pct Si alloy. Metallurgical Transactions A 1977;8A:119–25.
[14] Fairand BP, Clauer AH, Wilcox BA. Laser shock hardening of weld zones in
aluminum alloys. Metallurgical Transactions A 1976;8A:1871–6.
72
[15] Fairand BP, Clauer AH. Laser generated stress waves: their characteristics and their
effects to materials. Presented at Proc.American Inst. of Physics Conf. on ‘Laser Solid
Interactions and Laser Processing’; 1978.
[16] Fairand BP, Clauer AH. Applications of laser-induced stress waves. Presented at
Lasers in Modern Industry Seminar; 1978.
[17] Clauer AH, Fairand BP. Interaction of laser-induced stress waves with metals.
Presented at Proc. ASM Conference Applications of Lasers in Materials Processing;
Washington DC; 1979.
[18] Henry George Liddell, Robert Scott, A Greek–English Lexicon, on Perseus
[19] P. Peyre, L. Berthe, X. Scherpereel, R. Fabbro, Laser-shock processing of
aluminium-coated 55C1 steel in water-confinement regime, characterization and
application to high-cycle fatigue behaviour, J. Mater. Sci.33 (1998) 1421–1429.
[20] Kan Ding, Lin Ye. Simulation of multiple laser shock peening of a 35CD4 steel
alloy. Simulation of multiple laser shock peening of a 35CD4 steel alloy Volume 178,
Issues 1–3, 2006, 162–169.
[21] Smartlab stress measurement guideline. Rigaku. Residual Stress Analysis Group
[22] Chu JP, Rigsbee JM, Banas G, Lawrence FV, Elsayed-Ali HE.Effects of laser-shock
processing on the microstructure and surface mechanical properties of Hadfield
manganese steel. Metallurgical and Materials Transactions A 1995;26A:1507–17.
[23] Peyre P, Berthe L, Scherpereel X, Fabbro R. Laser-shock processing of aluminum
coated 55C1 steel in water-confinement regime, characterization and application to high-
cycle fatigue behaviour. Journal of Materials Science 1998;33:1421–9.
[24] Peyre P, Fabbro R, Merrien P, Lieurade HP. Laser shock processing of aluminum
alloys. Application to high cycle fatigue behaviour. Materials Science and Engineering
1996;A210:102–13.
[25] Masse JE, Barreau G. Surface modification by laser induced shock waves. Surface
Engineering 1995;11:131–2.
[26] Charles S. Montross a, Tao Wei a, Lin Ye a,∗, Graham Clark b, Yiu-Wing Mai a
Laser shock processing and its effects on microstructure and properties of metal alloys: a
review
[27] Clauer AH, Koucky JR. Laser shock processing increases the fatigue life of metal
parts. Materials and Processing 1991;6:3–5.
[28] Peyre P, Berthe L, Scherpereel X, Fabbro R. Laser-shock processing of aluminum
coated 55C1 steel in water-confinement regime, characterization and application to high-
cycle fatigue behaviour. Journal of Materials Science 1998;33:1421–9.
73
[29] Clauer AH, Holbrook JH, Fairand BP. Effects of laser induced shock waves on
metals. In: Meyers MA, Murr LE, editors. Shock waves and high-strain-rate phenomena
in metals. New York: Plenum Publishing Corporation; 1981. p. 675–702.
[30] Peyre P, Fabbro R, Merrien P, Lieurade HP. Laser shock processing of aluminum
alloys. Application to high cycle fatigue behaviour. Materials Science and Engineering
1996;A210:102 13.
[31] J.Z. Lu, J.W. Zhong, K.Y. Luo, L. Zhang, F.Z. Dai el at. Microstructual
strengthening mechanism of multiple laser shock processing impacts on AISI8620 steel.
Material Science and Engineering :A 528 19-20 2011 6128-6133.
[32] J.Z. Lu , K.Y. Luo, , Y.K. Zhang G.F. Sun Y.Y. Gu el at. Grain refinement
mechanism of multiple laser shock processing impacts on ANSI 304 stainless steel. Acta
Materialia Vol.58 16 2010 5354-5362.
[33] Koichi Akita, Yuji Sano, Kazuma Takahashi, Hirotomo Tanaka, Shin Ichi Ohya.
Strengthening of Si3N4 Ceramics by Laser Peening. Materials Science Forum vol.524-
525 2006.
[34] M.Meyers, K. Chawala. Mechanical behavior of materials 2nd edition. Cambridge,
2009.
[35] S.J.Zinkle, L.L.Snead. Designing radiation resistance in materials for fusion energy.
Annual Review of Material Research. 2014. 44:241-267
[36] B.P.Uberuaga, L.J.Verno, E. Martinez, A.Voter. The relationship between grain
boundary structure, defect mobility and grain boundary sink efficiency. Scientific reports.
(2015) 13
[37] W.Z.Han, M.J.Demkowicz, E.G.Fu, Y.Q.Wang, A.Misra. Effect of grain boundary
character on sink efficiency. Acta Materialia. 60 (2012) 6341-6351
[38] S.J. Zinkle, P.J.Maziasz, R.E.Stoller. Dose dependence of the microstructural
evolution in neutron-irradiated austenitic stainless steel. Journal of nuclear material, 1993.
[39] S.J. Zinkle. Effect of H and He irradiation on cavity formation and blistering in
ceramics. Nuclear Instruments and Methods in Physics Research Section B: Beam
Interactions with Materials and Atoms.vol.286 2012 ppp.4-19
[40] R.G. Carter , N. Soned, K. Dohi, J.M. Hyde, C.A. English el at. Microstructural
characterization of irradiation-induced Cu-enriched clusters in reactor pressure vessel
steels. Journal of Nuclear Materials. vol.298 2001 pp 211-224
[41] J.P. Shepherd. Irradiation-induced precipitation in niobium-stabilized stainless steel.
Journal Name: Metal Sci. J. 3: 229-34(Nov 1969)
74
[42] R. K. Williams F. W. WiffenJ. BentleyJ. O. Stiegler. Irradiation induced
precipitation in tungsten based, W-Re alloys Metallurgical Transactions A. Volume 14,
Issue 3, pp 655-666
[43] R. Cauvin and G. Martin. Solid solutions under irradiation. II. Radiation-induced
precipitation in AlZn undersaturated solid solutions. Phys. Rev. B 23,1981
[44] G. Was, J. Wharry, B. Frisbie. Assessment of radiation-induced segregation
mechanisms in austenitic and ferritic–martensitic alloys. Journal of Nuclear Materials.
vol 411 2011 41-50.
[45] S.J. Zinkle, G.S. Was. Materials challenges in nuclear energy
[46] E. Snoeks, A. Polman and C. A. Volkert. Densification, anisotropic deformation, and
plastic flow of SiO2 during MeV heavy ion irradiation. Appl. Phys. Lett. 65, 2487 (1994)
[47] S. Som, S. Dutt, Vijay Kumar, Vinod Kumar, H.C. Swart el at. Swift heavy ion
irradiation induced modification in structural, optical and luminescence properties of
Y2O3:Tb3+ nanophosphor. Journal of Luminescence. vol.146 2014 162-173.
[48] Blas Pedro Uberuaga ⇑, Samrat Choudhury, Alfredo Caro. Ideal sinks are not always
ideal: Radiation damage accumulation in nanocomposites. Journal of Nuclear Materials.
vol 462 2015 402-408.
[49] Yamashita, S., Akasaka, N. & Ohnuki, S. Nano-oxide particle stability of9-12Cr
grain morphology modified ODS steels under neutron irradiation. J. Nucl. Mater. 3 29-33,
377-381 (2004)
[50] Okuda, T. & Fujiwara, M. Dispersion behavior of oxide particles in mechanically
alloyed ODS Steel. J. Mater. Sci. Lett. 14, 1600_1603 (1995).
[51] Klimiankou, M., Lindau, R. & Moslang, A. Energy-filtered TEM imaging and EELS
study of ODS particles and argon-filled cavities in ferritic-martensitic steels. Micron 36,
1_8 (2005).
[52] Kishimoto, H., Alinger, M. J., Odette, G. R. & Yamamoto, T. TEM examination of
microstructural evolution during processing of 14CrYWTi nanostructured ferritic alloys.
J. Nucl. Mater. 329_33, 369_371 (2004).
[53] Klimiankou, M., Lindau, R. & Moslang, A. HRTEM study of yttrium oxide particles
in ODS steels for fusion reactor application. J. Cryst. Growth 249, 381_387 (2003).
[54] C. Sun, S. Zheng, C. C. Wei, Y. Wu, L. Shao, el at. Superior radiation-resistant
nanoengineered austenitic 304L stainless steel for applications in extreme radiation
environments. Scientific Reports 5. Article number: 7801 (2015).
[55] Brailsford AD, Bullough R. 1972. The rate theory of swelling due to void growth
in irradiated metals. J. Nucl. Mater. 44:121–35
75
[56] Johnson RA, Lam NQ. 1976. Solute segregation in metals under irradiation. Phys.
Rev. B 13:4364–75
[57] Adda Y. 1972. Report on the CEA program of investigations of radiation-induced
cavities in metals: presentation of some results. In Radiation-Induced Voids in Metals,
ed. JW Corbett, LC Ianniello, pp. 31–81. Springfield, VA: Natl. Tech. Inf. Serv
[58] Brager HR. 1975. The effects of cold working and pre-irradiation heat treatment
on void formation in neutron-irradiated type 316 stainless steel. J. Nucl. Mater.
57:103–18
[59] Bloom EE, Stiegler JO. 1970. A comparison of irradiation-induced swelling and
void formation in two austenitic stainless steels. J. Nucl. Mater. 35:244–46
[60] A.Cohen Copper Development Association
[61] B.E. Wlide, Metals Handbook, Failure Analysis, ASM International
[62] D.A. Jones. Principles and Prevention of Corrosion. 2nd Edition
[63] ASM International, Metals Handbook (Desk Edition) Chapter 32 (Failure Analysis),
American Society for Metals, (1997) pp 32-24 to 32-26
[64] Jarmila Woodtli, Rolf Kieselbach Damage due to hydrogen embrittlement and stress
corrosion cracking. Engineering Failure Analysis 7 (2000) 427-450
[65]J.F. Newman. Corrosion Science: The stress corrosion of steel in sodium hydroxide
solution: a film-rupture model. Corrosion Science Vol 21, Issue 7, 1981, Pp 487-503
[66] X. Mao , D. Li. Slip-step dissolution and micromechanical analysis to model stress-
corrosion crack growth of type 321 stainless steel in boiling magnesium chloride.
Metallurgical and Materials Transactions A. 1995, Volume 26, Issue 3, pp 641-646
[67] Struer. Instruction Manual of Twin-jet-polishing machine
[68] D.B.William, C.B.Carter .Transmission Electron Microscopy, a textbook for
material science. Springer
[69] Z. Yao, M. Hernández-Mayoral, M.L. Jenkins & M.A. Kirk. Heavy-ion irradiations
of Fe and Fe–Cr model alloys Part 1: Damage evolution in thin-foils at lower doses.
Philosophical Magazine. Volume 88, Issue 21, 2008
[70] Cortest. Instruction Manual of Proof Ring System.
[71] J.Z. Lu, K.Y.Luo, Y.K.Zhang, G.F.Sun, Y.Y.Gu, J.Z. Zhou et al. Grain refinement
mechanism of multiple laser shock processing impacts on ANSI 304 Stainless steel. Acta
Materialia 58(2010), pp. 5354-5362
76
[72] C.Sun, S.Zheng, C.C. Wei, Y.Wu, L.Shao, Y.Yang et al. Superior radiation-resistant
nanoengineered austenitic 304L stainless steel for applications in extreme radiation
environments. Scientific Reports. (2015) Jan 15;5:7801
[73] G.S. Was, Fundamentals of Radiation Materials Science, Springer, Berlin, 2007.
[74] W.Z.Han, M.J.Demkowicz, E.G.Fu, Y.Q.Wang, A.Misra. Effect of grain boundary
character on sink efficiency. Acta Materialia. 60 (2012) 6341-6351.
[75] B.P.Uberuaga, L.J.Verno, E. Martinez, A.Voter. The relationship between grain
boundary structure, defect mobility and grain boundary sink efficiency. Scientific reports.
(2015) 13 March
[76] J.Z.Lu J.W.Zhong, K.Y.Luo, L.Zhang, F.Z.Dai, K.M.Chen et al. Micro-structural
strengthening mechanism of multiple laser shock processing impacts on AISI 8620 steel.
Materials Science and Engineering A. 528(2011) 6128-6133.
[77] M.R.James. Relaxation of residual stresses an overview. Proceedings of the28th
Sagamore Ar my Materials Research Conference. (1982) 297–314.
[78] M.Shimada, H.Kokawa, Z.J.Wang, Y.S.Sato, I.Karibe. Optimization of grain
boundary character distribution for intergranular corrosion resistant 304 stainless steel by
twin-induced grain boundary engineering. Acta Materialia 50(2002) 2331-2341
[79] Y.J.Li, X.H.Zeng, W.Blum. Transition from strengthening to softening by grain
boundaries in ultrafine-grained Cu. Acta Materialia. 52(2004) 5009-5018
[80]N.Li, J.Wang, A.Misra,X.Zhang, J.Y.Huang, J.P.Hirth. Twinning dislocation
multiplication at a coherent twin boundary. 59 (2011) 5989-5996
[81]R.C.Pond, D.A.Smith. On the absorption of dislocations by grain boundaries.
Philosophical Magazine. 36 (1977) 353-366
[82]Z.H.Jin, P.Gumbsch, E.Ma, K.Albe, K.Lu, H.Hahn, H.Gleiter. The interaction
mechanism of screw dislocations with coherent twin boundaries in different face-centered
cubic metals. Scripta Materilia 53(2006) 1163-1168.
[83] Z.H.Jin, P.Gumbsch, E.Ma, K.Albe, K.Lu, H.Hahn, H.Gleiter. Interactions between
non-screw lattice dislocations and coherent twin boundaries in face-centered cubic metals.
Acta Materialia 56(2008) 1126-1135.
[84] P. H. Pumphreya & H. Gleitera. The annealing of dislocations in high-angle grain
boundaries. Philosophical Magazine. 30 (1974) 593-602.
[85] S. Watanabe, N. Sakaguchi, N. Hashimoto, H. Takahashi. Sink effect of grain
boundary on radiation-induced segregationin austenitic stainless steel. Journal of Nuclear
Materials. (2000) 152-156

77
[86] S. Watanabe, N. Sakaguchi, N. Hashimoto, H. Takahashi. Quantitative studies of
irradiation-induced segregation and grain boundary migration in Fe-Cr-Ni alloy. Journal
of Nuclear Materials. 224 (1995) 158.