improving quality and safety through care delivery redesign-steve narang
TRANSCRIPT

Clinical Process Redesign (CPR) The Resuscitation of an Academic Medical
Center
Steve Narang, MD, MHCM Chief Executive Officer
Banner – University Medical Center Phoenix
ENDLESS POSSIBILITIES.
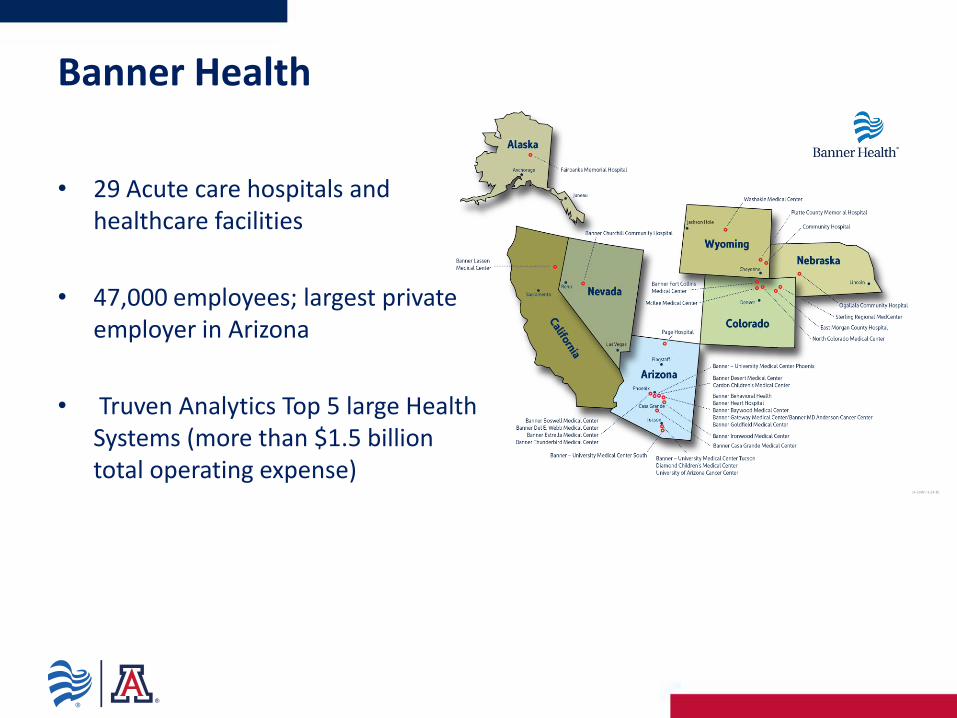
• 29 Acute care hospitals and healthcare facilities
• 47,000 employees; largest private employer in Arizona
• Truven Analytics Top 5 large Health Systems (more than $1.5 billion total operating expense)
Banner Health

• 733 bed Academic Medical Center
• Teaching Hospital for University of Arizona College of Medicine Phoenix
• ACS Level 1 Trauma Center
• Magnet™ Recognized
• 3,814 Employees
• 1,529 Medical Staff members
• 336 Allied Healthcare Providers
Banner – University Medical Center Phoenix

Vision & Strategy

Vision for Banner University Medical Center Phoenix
• Highly coordinated destination for patients and families to experience value-
based care, including the treatment of highly complex diagnoses-
INSTITUTES
• Attract world-class physicians and members of multi-disciplinary teams to
participate in an environment of teaching, scholarship, and clinical
improvement
• Invite faculty to work alongside to contribute and deliver excellent outcomes
• Improve value through reduction of clinical variation and cost
• Use the science of healthcare delivery to engage physicians, medical
students, and staff in the improvement journey

Financial Performance
• 2013-2014
• Despite double digit increases in Inpatient Admissions, OR
cases, Endoscopies, Cath Lab Procedures– Net Revenue
had decreased YOY by over 10% leading to an operation
margin of only 2 %
– Multiple Reasons
» Degradation of Payer Mix
» Revenue Cycle
– Senior Leadership Team decided to use this opportunity to
launch a campus wide Engagement Effort to align Physician
Expertise and Leadership towards ‘Clinical Process Redesign’
(CPR) with a focus on reducing waste in key clinical processes
and misuse and overuse of supplies and pharmaceuticals.
7
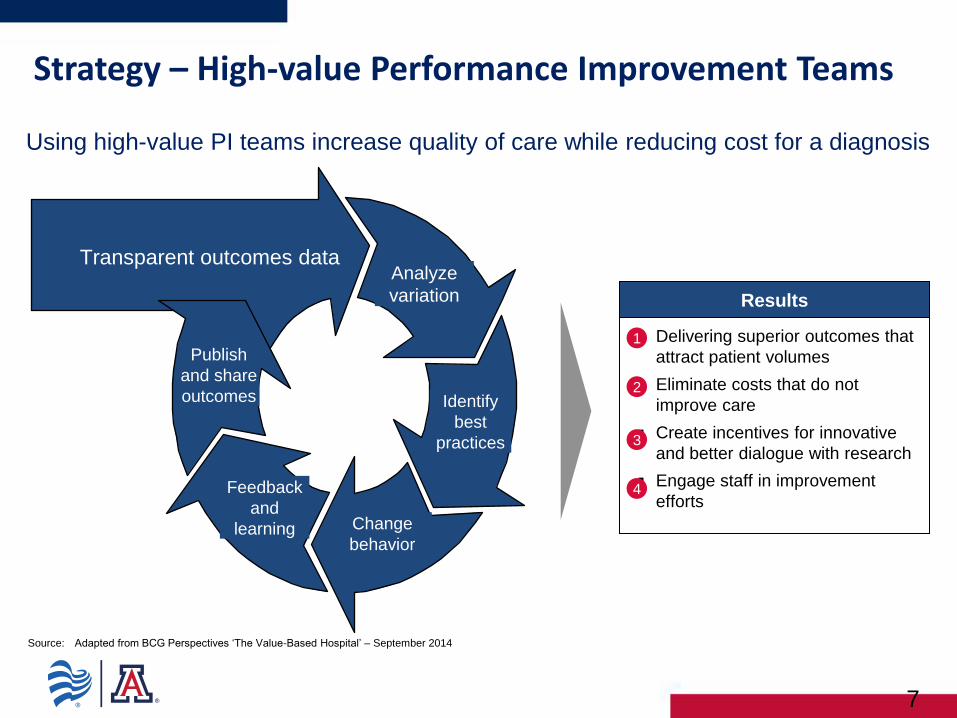
Transparent outcomes data Analyze
variation
Identify
best
practices
Change
behavior
Feedback
and
learning
Publish
and share
outcomes
Results
Delivering superior outcomes that
attract patient volumes
Eliminate costs that do not
improve care
Create incentives for innovative
and better dialogue with research
Engage staff in improvement
efforts
1
2
3
4
Strategy – High-value Performance Improvement Teams
Source: Adapted from BCG Perspectives ‘The Value-Based Hospital’ – September 2014
Using high-value PI teams increase quality of care while reducing cost for a diagnosis

The Improvement Journey
Build the foundation
facility level infrastructure to support improvement projects
Identification of at least one PI project for each department that utilizes the tools of performance improvement
Education of at least 50% of BUMCP employees on performance improvement
Utilize the tools of PI
“Improve the way we improve” – focused effort on utilizing the tools of performance improvement related to three key themes:
1. Efficient & Timely Care
2. Patient Safety
3. Patient Experience
Disciplined Execution
Continue improvement journey
Each department to identify one PI project related to Efficient & Timely care and Patient Safety.
Design interventions, implement, and remain ‘in control’
2016 2015 2014
Clinical Process Redesign (CPR) to Reduce the Milliman Index (observed/expected LOS for key /DRGs)
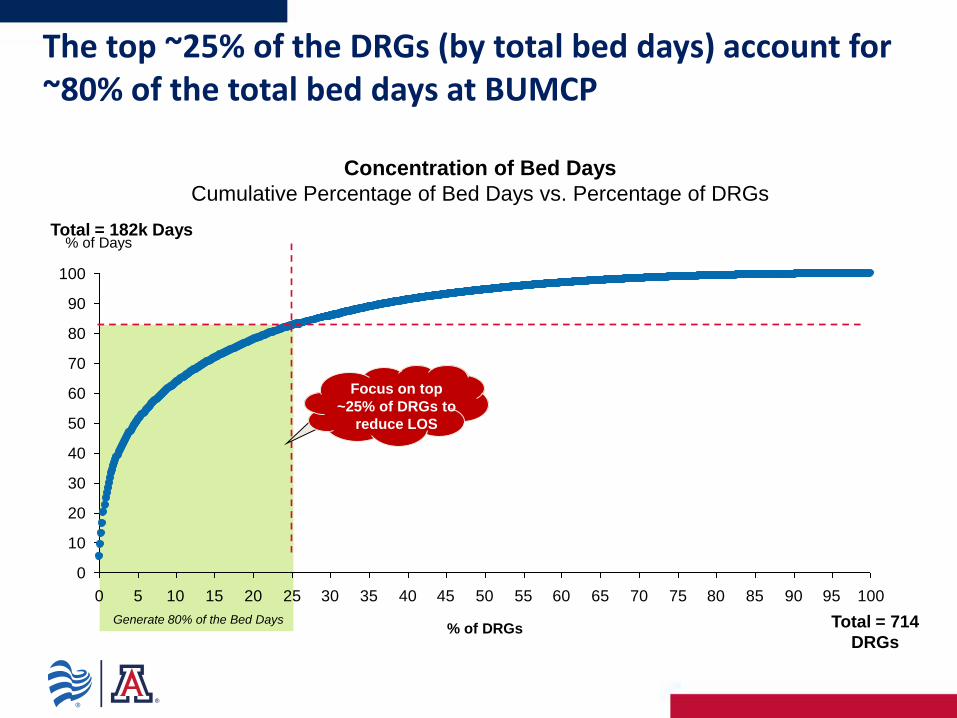
The top ~25% of the DRGs (by total bed days) account for ~80% of the total bed days at BUMCP
Generate 80% of the Bed Days
0
10
20
30
40
50
60
70
80
90
100
0 5 10 15 20 25 30 35 40 45 50 55 60 65 70 75 80 85 90 95 100
% of Days
% of DRGs
Concentration of Bed Days
Cumulative Percentage of Bed Days vs. Percentage of DRGs
Total = 182k Days
Total = 714
DRGs
Focus on top
~25% of DRGs to
reduce LOS

There is significant variation in Average Length of Stay; ~56% of DRGs have a standard deviation of more than 2 days
~56% of the DRGs have an ALOS standard deviation of >2 days
Variation in Average Length of Stay (ALOS) Distribution of DRGs by Standard Deviation in Days
Total = 424 DRGs1
13%
43%
11 - 15 Days 6 - 10 Days
0%
2 - 5 Days 1 - 2 Days
31%
<1 Day
13%
1. DRGs with less than 10 cases have been excluded
Source: Banner – University Medical Center Phoenix Finance – Timeframe 3/2014 – 3/2015

We utilized a decision tree analysis to estimate potential savings through reduced patient days
Total Patient Days
Reduction in Patient Days if All
DRGs < = 25th Percentile
Reduction in Patient Days if All
DRGs < = 50th Percentile
Bottom 75% of DRGs Top 25% of DRGs
Process Flow Issues (Admitting, Discharge
Planning, etc.)
Coding Issues Variation in Care
Practices
Step 1: Identify
improvement range
1
Step 2: Prioritize within
selected range
2
Step 3: Identify
operational drivers for
change
3
ALOS Decision Tree Analysis
Focused DRG driven approach to reduce length of stay,
focusing on three key elements (Process flow issues, coding
and documentation, and variation in care practices).

27 Clinical Process Redesign teams currently assessing and redesigning practices in key clinical areas
Advanced Lung Institute & Critical Care
Medicine
Sepsis
Pneumonia
COPD
Cardiovascular Institute
Heart Failure
Stents/AMI
TAVR Program
Digestive Institute
Whipple Care Pathway
Pancreatitis
Endocrine and Diabetes
Hypoglycemic Management
Hepatobiliary
Encephalopathy
Musculoskeletal
Geriatric Fracture Care Pathway
Hip Fracture Care Pathway
Neuroscience/Neurosurgery
Spinal Fusion Care Pathway
Observation Length of Stay
Chest Pain
Women’s Health Institute
Normal Delivery
Wound Care Institute & Infectious Disease
Cellulitis Care Pathway
Transplant
Kidney Transplant Rejection Care Pathway
Urology
Stone Management
Clinical Documentation Improvement (CDI)
Pharmacy & Supply Variation Reduction

The team has developed a standardized care pathway for Heart Failure patients
Define
Identify best practices supported by evidenced based research and literature
Draft standardized clinical pathway to share with other stakeholders
Design
Create strong implementation toolkit to share knowledge with stakeholders (Providers, nursing, ancillary, case management, etc.)
Operationalize design work of the team
Implement
Implement the care pathway; monitor performance; establish accountability for results
BUMCP Heart Failure Clinical Pathway

We have identified two significant drivers of length of stay management for Heart Failure patients
Discussion
Obtaining an accurate daily weight is negatively correlated to
length of stay. That is, patients who are weighed daily are more
likely to have a lower length of stay (Milliman < 1.000).
Accurate, daily standing weight measurements are important
for length of stay management
Daily Weight & Milliman’s Index BUMCP Heart Failure Patients DRG: 291- 293 (Jan – Sep 2015)
Avg. Daily Lasix Dosage (mg) & Milliman’s Index BUMCP Heart Failure Patients DRG: 291- 293 (Jan – Sep 2015)
Discussion
Average daily Lasix dosage is negatively correlated to length of
stay. That is, patients with higher daily dosages of Lasix are more
likely to have a lower length of stay (Milliman < 1.000).
Aggressive Lasix dosing is critical to managing patient
length of stay.
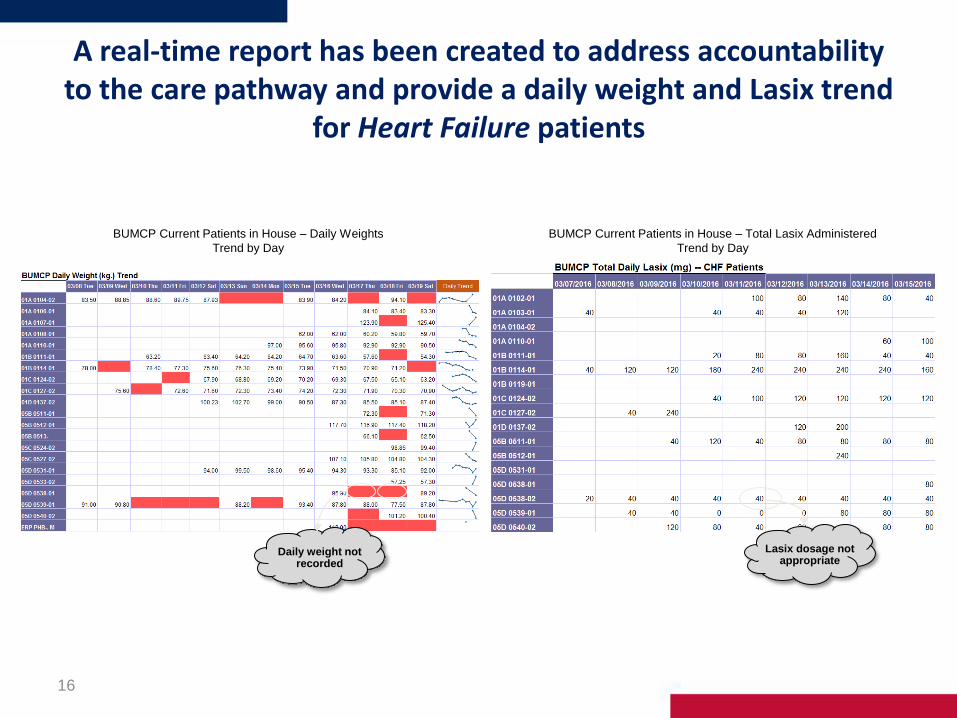
A real-time report has been created to address accountability to the care pathway and provide a daily weight and Lasix trend
for Heart Failure patients
16
BUMCP Current Patients in House – Daily Weights
Trend by Day
BUMCP Current Patients in House – Total Lasix Administered
Trend by Day
Lasix dosage not appropriate
Daily weight not recorded

Heart Failure: Significant improvements seen in weight compliance and accuracy; 94% of patients received daily
weights
17
0
10
20
30
40
50
60
70
80
90
100
Ja
n-1
6
Oct-
15
Se
p-1
5
Au
g-1
5
Ju
l-15
Ju
n-1
5
Ma
y-1
5
Apr-
15
Ma
r-15
Fe
b-1
5
Ja
n-1
5
Apr-
16
Fe
b-1
6
De
c-1
5
No
v-1
5
Ma
r-16
Avg. Daily Lasix
Lasix on Day 0
Daily Wt %
Wt Accuracy %
BUMCP Heart Failure (DRG 291-293) Key Clinical Indicators
By Month, 2015-2016
Discussion
Significant improvements in daily weight capture and weight accuracy driven by nursing
Daily weight compliance improvement to all time high of 94% of weights captured and recorded daily
Continue to engage providers around appropriate diuretic dosing with awareness surrounding improved weight compliance and management

Intervention
1.019
1.194
1.393
0.840
0.9501.029
1.110
1.234
0.819
1.0951.0761.139
0.926
1.350
1.0480.997
Apr-
16
Mar-
16
Feb-
16
Jan-
16
Dec-
15
Nov-
15
Oct-
15
Sep-
15
Aug-
15
Jul-
15
Jun-
15
May-
15
Apr-
15
Mar-
15
Feb-
15
Jan-
15
Milliman’s Index has improved for Heart Failure patients during 2016 with our refocus with a 73% reduction in average patient length of stay days
18
BUMCP Heart Failure (DRG 291-293) Milliman’s Index
By Month, 2015-2016
BUMCP Heart Failure (DRG 291-293) Average LOS (Days)
By Month, 2016
Discussion
Length of stay for heart failure has improved during 2016YTD with a 73% reduction in overall average length of stay
Significant predictors for LOS include daily weight accuracy/timeliness and appropriate diuretic dosing; performance for both measures declined in 2016 causing
longer patient length of stays for these months. Patient acuity also a causal factor as CMI was all time highest in Jan of 2016 for this population.
5.65
Feb-16
6.80
Jan-16 Apr-16
4.90
-73%
Mar-16
5.00

BUMCP Performs More Whipple Procedures than Any Medical Center in the Southwest – 84 in 2015
15.2
9
0
5
10
15
20
BUMCP Mass General*
2015 Average Length of Stay
Project
Aim
Create a Whipple Care Pathway that incorporates evidence based research in perioperative care and
leads to a reduction in the overall length of stay, while maintaining excellent outcomes and
readmission rates.
Key
Findings
1. Post-surgical use of opioids for pain control leading to decreased ambulation and GI function
2. Opportunity to accelerate post-surgical clamping and intake schedule
3. Preoperative education and nutrition
Key
Pathway
Changes
1. Preadmission education on procedure, nutrition, spirometer,
2. Epidural analgesic to manage pain post-surgically
3. Avoidance of opioids for pain management – combination of epidural and NSAIDs
4. Accelerated post-surgical nutrition and tube clamping
*Average 9 day LOS since 2010. Fernandez-del Castillo, Carlos, et.al. Evolution of the Whipple procedure at the Massachusetts General Hospital,
Surgery, 5/2012
Da
ys

Whipple : Post-Implementation Month 4 – Epidural Comparison
15.21
12.25
14.44
0
2
4
6
8
10
12
14
16
2015 Prior to Go-live (n=52)
Post-implementation with Epidural (n=21)
Post-implementation without Epidural (n=11)*
Average Length of Stay
200
1413
0
200
400
600
800
1000
1200
1400
1600
Post-implementation with Epidural (n=21) Post-implementation without Epidural (n=11)
Average Total Opioid Usage During Inpatient Stay (Converted to PO Morphine in mg)
Notes: Data pulled from Cerner via Business Analytics; Data run 2/3/16; Cases originally scheduled for Whipple but not
done were omitted.
* Adjusted for patients with Length of Stay over 22 days due to complications
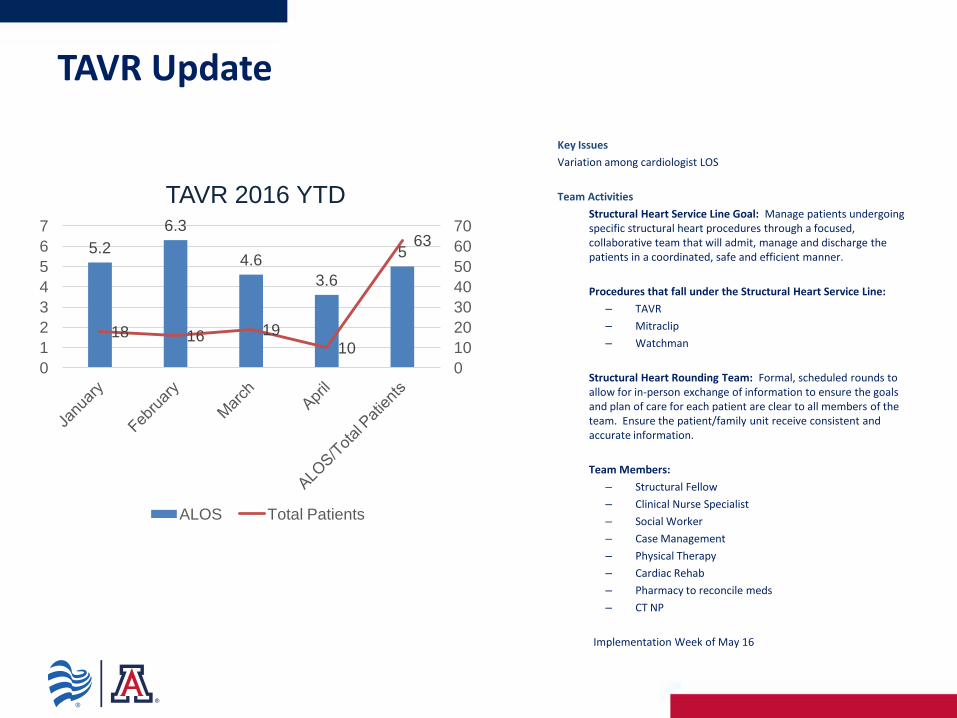
TAVR Update
Key Issues
Variation among cardiologist LOS
Team Activities
Structural Heart Service Line Goal: Manage patients undergoing specific structural heart procedures through a focused, collaborative team that will admit, manage and discharge the patients in a coordinated, safe and efficient manner.
Procedures that fall under the Structural Heart Service Line:
– TAVR
– Mitraclip
– Watchman
Structural Heart Rounding Team: Formal, scheduled rounds to allow for in-person exchange of information to ensure the goals and plan of care for each patient are clear to all members of the team. Ensure the patient/family unit receive consistent and accurate information.
Team Members:
– Structural Fellow
– Clinical Nurse Specialist
– Social Worker
– Case Management
– Physical Therapy
– Cardiac Rehab
– Pharmacy to reconcile meds
– CT NP
Implementation Week of May 16
5.2
6.3
4.6
3.6
5
18 16 19 10
63
0
10
20
30
40
50
60
70
0
1
2
3
4
5
6
7
TAVR 2016 YTD
ALOS Total Patients
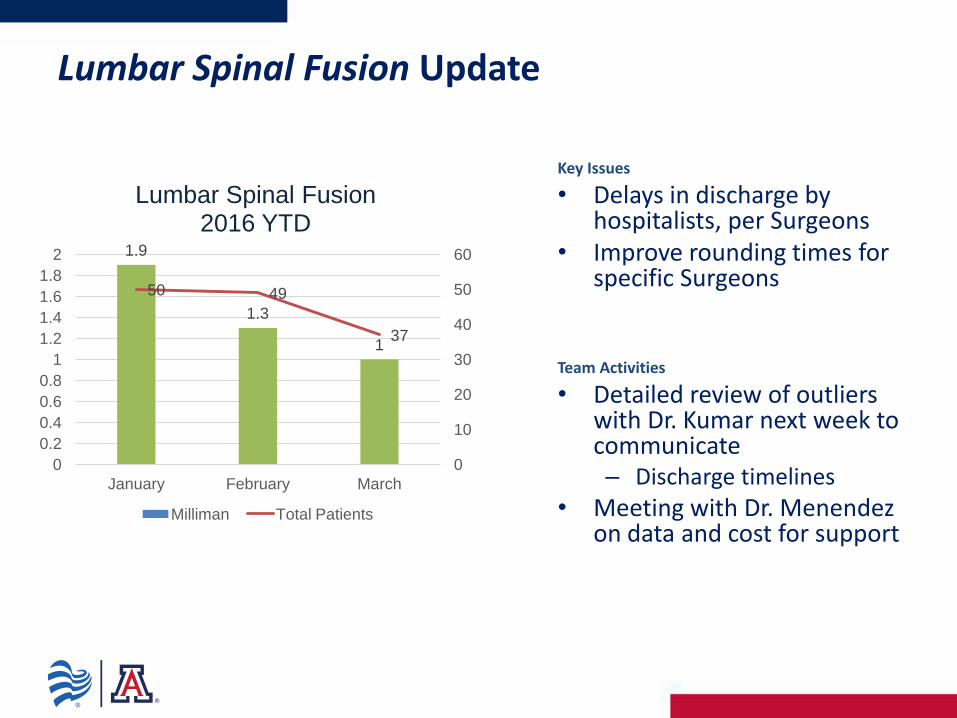
Lumbar Spinal Fusion Update
Key Issues
• Delays in discharge by hospitalists, per Surgeons
• Improve rounding times for specific Surgeons
Team Activities
• Detailed review of outliers with Dr. Kumar next week to communicate – Discharge timelines
• Meeting with Dr. Menendez on data and cost for support
1.9
1.3
1
50 49
37
0
10
20
30
40
50
60
0
0.2
0.4
0.6
0.8
1
1.2
1.4
1.6
1.8
2
January February March
Lumbar Spinal Fusion 2016 YTD
Milliman Total Patients

Kidney Transplant Rejection - Update
Key Issues
Team Activities 1. Provided data and analysis to Dr. Hodges for Infusion
Center Infrastructure enhancements to discharge and/or manage rejection outpatient
2. Developed integrated process flow to discharge patients for outpatient treatment
3. Reviewed pricing comparison for drug therapy for inpatient vs. outpatient cases
4. Case Management identify unintended consequences for discharging patients
5. Define Transplant Institute next Steps for NP management of patients discharged to outpatient
6. Dr. Zuhl engaged in reviewing patient cases and providing feedback on improved efficiencies with Hospitalists
2.1
1.6
2
1.162
2.283
9 7
13
4
28
0
5
10
15
20
25
30
0
0.5
1
1.5
2
2.5
January February March April 2015
Kidney Transplant Rejection 2016 YTD
Milliman Total Patients
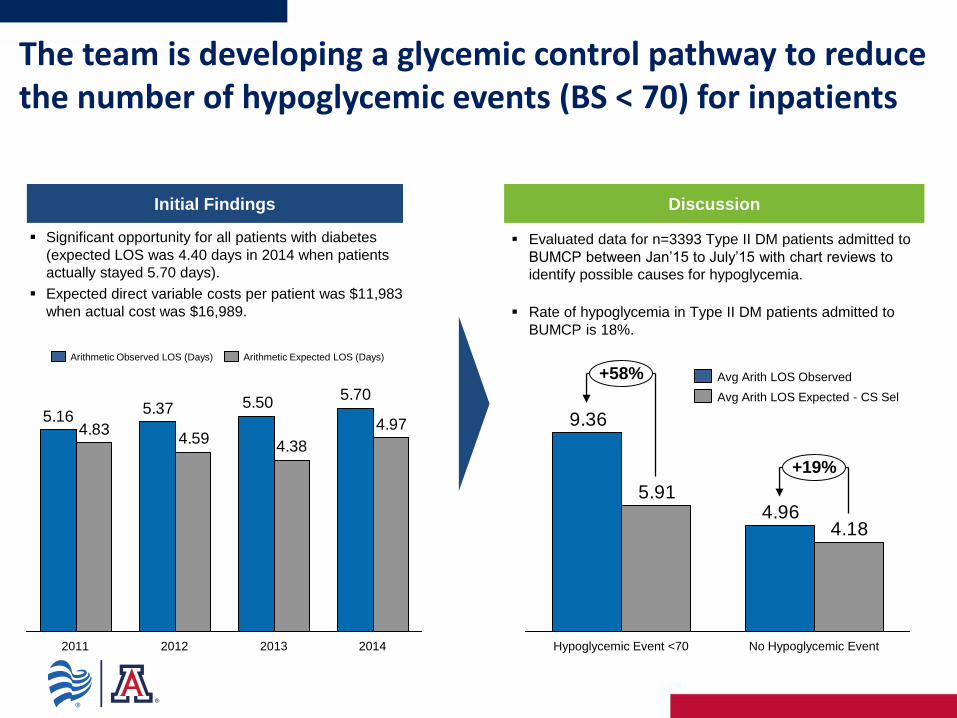
The team is developing a glycemic control pathway to reduce the number of hypoglycemic events (BS < 70) for inpatients
Initial Findings
Significant opportunity for all patients with diabetes
(expected LOS was 4.40 days in 2014 when patients
actually stayed 5.70 days).
Expected direct variable costs per patient was $11,983
when actual cost was $16,989.
Discussion
Evaluated data for n=3393 Type II DM patients admitted to
BUMCP between Jan’15 to July’15 with chart reviews to
identify possible causes for hypoglycemia.
Rate of hypoglycemia in Type II DM patients admitted to
BUMCP is 18%.
4.96
9.36
4.18
5.91
No Hypoglycemic Event
+19%
Hypoglycemic Event <70
+58%
Avg Arith LOS Expected - CS Sel
Avg Arith LOS Observed
5.705.505.37
5.164.97
4.384.59
4.83
2013 2011 2012 2014
Arithmetic Observed LOS (Days) Arithmetic Expected LOS (Days)

Observation Lap Appy and Chole clinical pathway and caresets have an anticipated implementation of June 2016
25
22.92
29.2028.10
20.42
40.25
Apr-16 Jan-16
-13%
Mar-16 Feb-16 May-16*
BUMCP Lap Appy/Chole Observation LOS (Hrs.)
By Month, 2016
Key Drivers
Measuring current performance/scorecard
Provider Coding Education
Pain Management
Enteral Management
Discharge Pathway & Patient Education
Care pathway currently being developed and refined –
connecting to system observation LOS team

WIS team continues to focus on reducing length of stay for three key DRGs
26
Q1 2016
1.82 1.86
Q4 2015
1.87
Q2 2015
2.01
Q1 2015
2.08
Q3 2015
BUMCP DRG:775 Vaginal Delivery w/o Complications LOS (Days)
By quarter, 2015-2016
Q4 2015
3.09
Q3 2015
3.13
Q2 2015
2.93 2.94
Q1 2016
3.16
Q1 2015
BUMCP DRG:766 Cesarean Section w/o Complications LOS (Days)
By quarter, 2015-2016
1.76
Q1 2015
1.70
1.76
Q2 2015
1.66
Q3 2015
1.64
Q1 2016 Q4 2015
BUMCP DRG:795 Normal Newborn w/o Complications LOS (Days)
By quarter, 2015-2016 Discussion
Incremental improvements (2% reduction) in average length of
stay days for normal newborn deliveries quarter over quarter
during Jan 2015 to Feb 2016.
Expected length of stay is 1.79 days.
2015 LOS index of 0.89; best in Banner System*
Discussion
Incremental improvements (3% reduction) in average length of
stay days for vaginal deliveries without complications quarter over
quarter during Jan 2015 to Feb 2016.
Expected length of stay is 1.84 days.
2015 LOS index of 0.96; best in Banner System*
Discussion
Opportunity still exists for cesarean section without complications;
significant reduction seen during Q2 and Q3 2015, but trending
upward.
Expected length of stay is 2.71 days.
2015 LOS index of 1.09; best in Banner System*
*): Using geometric mean; excludes facilities with patient counts of <500 patients per year – source Premier Cs-Select

We have developed a high level scorecard for each Clinical Process Redesign project to monitor key
process and outcome measures
27
PRELIMINARY

28
PRELIMINARY


Milliman’s Index (LOS)
2014: 1.030
2015: 0.966
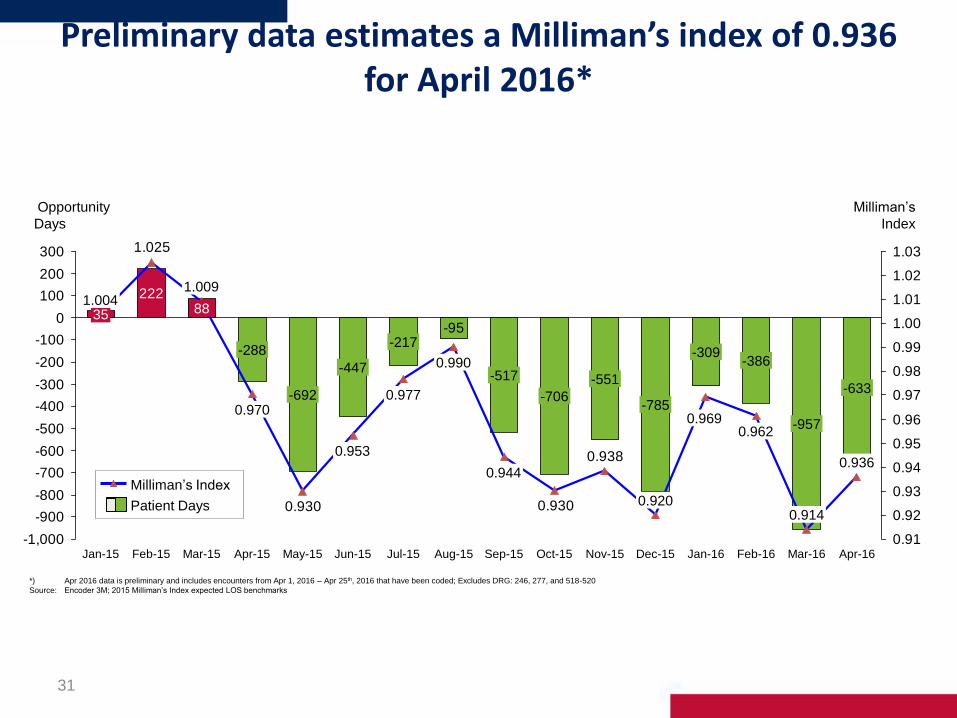
Preliminary data estimates a Milliman’s index of 0.936 for April 2016*
31
-95
222
0.938
0.9300.930
1.025
-1,000
-900
-800
-700
-600
-500
-400
-300
-200
-100
0
100
200
300
0.91
0.92
0.93
0.94
0.95
0.96
0.97
0.98
0.99
1.00
1.01
1.02
1.03
Opportunity
Days
-386
0.962
Jan-16
-309
0.969
Dec-15
-785
0.920
Nov-15
-551
Oct-15
-706
Apr-16
0.936
Mar-16
-957
0.914
Feb-16
35 1.004
-633
Milliman’s
Index
May-15
-692
Apr-15
-288
0.970
Mar-15
88
1.009
Feb-15 Jan-15 Sep-15
-517
0.944
Aug-15
0.990
Jul-15
-217
0.977
Jun-15
-447
0.953
Patient Days
Milliman’s Index
*) Apr 2016 data is preliminary and includes encounters from Apr 1, 2016 – Apr 25th, 2016 that have been coded; Excludes DRG: 246, 277, and 518-520
Source: Encoder 3M; 2015 Milliman’s Index expected LOS benchmarks
CPR to Reduce the Misuse and Overuse of Pharmaceuticals in the Management
of Clinical Conditions

Pharmacy drug cost averages $718 per adjusted weighted admission for Jan-Apr 2016 with an unfavorable variance of
$1.4MM year to date
33
$251
$96 $110$138
$142 $133$108
$138
$79$111
$127$130 $132 $129
$508
$667
$412
$552$593
$608
$470 $501$527 $430
$677 $588
$445
$631
$711
$469
$32$39$34$37$47$41$41$43$41$0$0
$876
$622
$24 $26
Apr-15
$688
Mar-15
$703
Dec-15
$738
Nov-15
$776
$21
Oct-15 Feb-15
$710
Jan-15
$549
Mar-16 Apr-16 Feb-16
$789
$28
Jan-16
$587
$16
Jul-15
$641
$29
Jun-15
$793
May-15
$729
$602
Sep-15
$659
$23
Aug-15
$671
731850 IV Solutions 733105 Infusion Drugs 733100 Pharmaceuticals
BUMCP Pharmacy Cost per Adjusted Weighted Admission 2015-2016 by month; AU:1122100 Pharmacy-Hosp in ($)

We identified several cost drivers and have focused our opportunity analyses surrounding the four key themes
34
Standardizing Practice
Developing specific inclusion and
exclusion criteria for when a
medication should be ordered and
administered
Preserving more expensive drugs
as a last resort when less
expensive first line therapies are
available
Other
Only allowing single dose orders;
no PRN or scheduled
Removing drug from care set
Evaluation of evidence and
literature to support the continued
use of drug
Enact “one time only” utilization
Remove from Formulary
Removing high cost drugs and auto
substituting equally efficacious
alternatives supported by evidence
based literature
Utilization of patients’ home
medications when available
Alternative Therapies
Identification of lower cost and
equality efficacious drug therapies
supported by evidence based
literature
Cost Drivers Grouped by Theme
112 preliminary cost savings hypotheses have
been identified by the Pharmacy CPR team
Potential cost savings of $590K-944K
identified

Next steps include prioritizing list of hypotheses for implementation and connecting with physician stakeholders
and councils to drive change
35
Opportunity Testing Cost Baselining &
Hypothesis Identification
Recommendations & High-Level
Implementation Plan
2 1 3
Prioritize improvement opportunities for
analysis
Analyze and validate high potential
improvement opportunities
Develop rough estimate of opportunity size
and time, cost and risk to implement
Obtain and validate pharmacy
administrations and spend at the patient
level
Build baseline of drug costs and cost
drivers
Conduct stakeholder interviews to
understand current operations and
processes
Analyze relative cost/pricing of key
services
Develop initial long list of opportunity
hypotheses
Prioritize opportunities for
implementation
Develop final list of recommended
opportunities
Refine financial and time estimates
Develop integrated,
high-level implementation
plan and timeline
Today
Pharmacy Clinical Redesign Approach to Developing Recommendations
Each hypotheses to be ranked and prioritized for
implementation based on “ease of implementation” and
“likelihood of cost savings”
Prioritization of the 112 cost saving hypotheses is underway with alignment to physician specialty and
stakeholders.
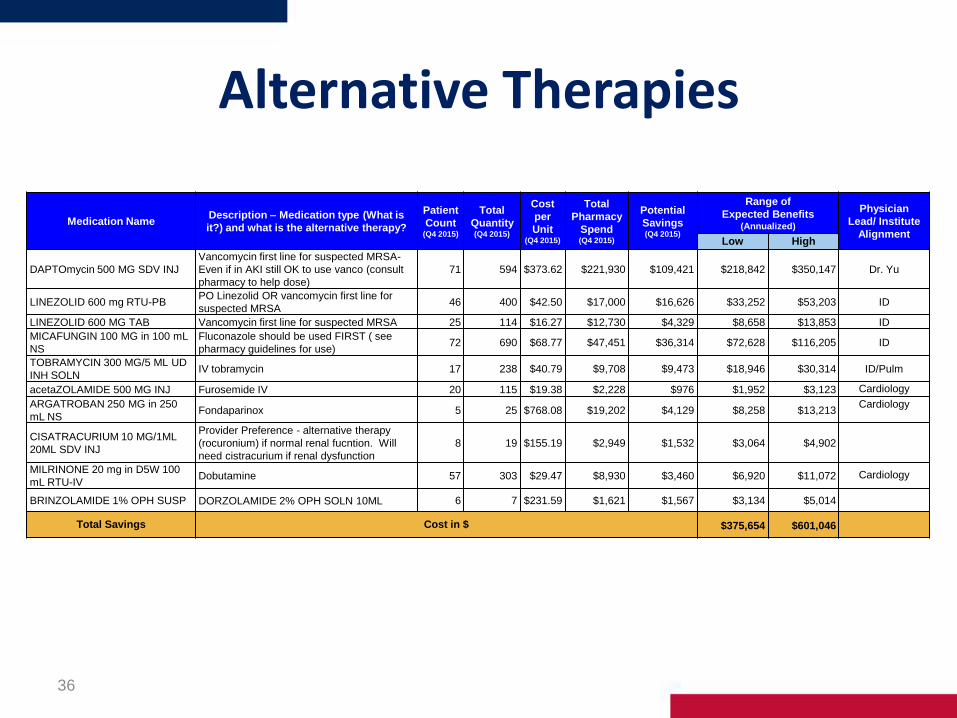
Alternative Therapies
36
Medication Name Description – Medication type (What is
it?) and what is the alternative therapy?
Patient
Count (Q4 2015)
Total
Quantity (Q4 2015)
Cost
per
Unit (Q4 2015)
Total
Pharmacy
Spend (Q4 2015)
Potential
Savings (Q4 2015)
Range of
Expected Benefits (Annualized)
Physician
Lead/ Institute
Alignment Low High
DAPTOmycin 500 MG SDV INJ
Vancomycin first line for suspected MRSA-
Even if in AKI still OK to use vanco (consult
pharmacy to help dose)
71 594 $373.62 $221,930 $109,421 $218,842 $350,147 Dr. Yu
LINEZOLID 600 mg RTU-PB PO Linezolid OR vancomycin first line for
suspected MRSA 46 400 $42.50 $17,000 $16,626 $33,252 $53,203 ID
LINEZOLID 600 MG TAB Vancomycin first line for suspected MRSA 25 114 $16.27 $12,730 $4,329 $8,658 $13,853 ID
MICAFUNGIN 100 MG in 100 mL
NS
Fluconazole should be used FIRST ( see
pharmacy guidelines for use) 72 690 $68.77 $47,451 $36,314 $72,628 $116,205 ID
TOBRAMYCIN 300 MG/5 ML UD
INH SOLN IV tobramycin 17 238 $40.79 $9,708 $9,473 $18,946 $30,314 ID/Pulm
acetaZOLAMIDE 500 MG INJ Furosemide IV 20 115 $19.38 $2,228 $976 $1,952 $3,123 Cardiology
ARGATROBAN 250 MG in 250
mL NS Fondaparinox 5 25 $768.08 $19,202 $4,129 $8,258 $13,213
Cardiology
CISATRACURIUM 10 MG/1ML
20ML SDV INJ
Provider Preference - alternative therapy
(rocuronium) if normal renal fucntion. Will
need cistracurium if renal dysfunction
8 19 $155.19 $2,949 $1,532 $3,064 $4,902
MILRINONE 20 mg in D5W 100
mL RTU-IV Dobutamine 57 303 $29.47 $8,930 $3,460 $6,920 $11,072 Cardiology
BRINZOLAMIDE 1% OPH SUSP DORZOLAMIDE 2% OPH SOLN 10ML 6 7 $231.59 $1,621 $1,567 $3,134 $5,014
Total Savings Cost in $ $375,654 $601,046

Remove from Formulary
37
Medication Name Description – Medication type (What is
it?) and what is the alternative therapy?
Patient
Count (Q4 2015)
Total
Quantit
y (Q4 2015)
Cost per
Unit (Q4 2015)
Total
Pharmacy
Spend (Q4 2015)
Potential
Savings (Q4 2015)
Range of
Expected Benefits (Annualized)
Physician
Lead/ Institute
Alignment Low High
ETHACRYNATE 50 MG INJ Other loop diuretic desensitization 2 3 $4,283.1
7 $12,850 $12,850 $25,700 $41,120 Cardiology
FOLIC ACID 5 MG/ML 10ML
MDV INJ PO folic acid 50 150 $32.30 $4,845 $4,839 $9,678 $15,485
MVI-12 10 ML SDV INJ PO MVI 55 172 $6.95 $1,195 $1,190 $2,380 $3,808
COMBIVENT RESPIMAT ORAL
INH Albuterol UD SVN Inh + Ipatropium UD SVN Inh 24 36 $228.50 $8,226 $8,209 $16,418 $26,269
Dr. Saggar/Lisa
DeRosa
COLESEVELAM 625 MG TAB Statins 3 54 $2.68 $145 TBD TBD TBD AMS / Cardiology
LANSOPRAZOLE 30 MG
DISSOLVE TAB PO pantoprazole or IV pantop if NPO 135 1313 $11.38 $14,942 $10,943 $21,886 $35,018 GI - Dr. Mills
ESTRADIOL VAG CR Hold med while in house OR have patient bring in from home 2 2 $193.82 $388 TBD TBD TBD
EZETIMIBE 10 MG TAB Hold med while in house OR have patient bring in from home 48 273 $8.07 $2,203 TBD TBD TBD
ERYthromycin 500 MG INJ Metoclopramide 5mg IV 18 71 $45.40 $3,223 $3,146 $6,292 $10,067 GI
ERYthromycin ES 200 MG/5 ML
BQ LIQ Metoclopramide 5mg PO 18 51 $321.34 $16,388 $16,384 $32,768 $52,429 GI
METHOCARBAMOL 1
GRAM/10ML SDV INJ Pharmacy to change to PO 9 55 $27.92 $1,536 $1,523 $3,046 $4,874 AMS
NITROPRUSSIDE 25 MG/ML
2ML SDV INJ Nicardapine / cevidipine 4 36 $820.10 $29,524 $13,450 $26,900 $43,040 Cardiology
Total Savings Cost in $ $145,068 $232,109

Standardizing Practice/Reducing Utilization
38
Medication Name Description – Medication type (What is
it?) and what is the alternative therapy?
Patient
Count (Q4 2015)
Total
Quantit
y (Q4 2015)
Cost per
Unit (Q4 2015)
Total
Pharmacy
Spend (Q4 2015)
Potential
Savings (Q4 2015)
Range of
Expected Benefits (Annualized)
Physician
Lead/ Institute
Alignment Low High
ALBUMIN 25% 100 ML INJ
Potential savings is based on being able to
better standardize use.
341 1992 $37.56 $74,820 TBD TBD TBD Dr. Khurana
kidney/hepatology
ALBUMIN 25% 50 ML INJ 76 449 $37.56 $16,864 TBD TBD TBD Dr. Khurana
kidney/hepatology
ALBUMIN 5% 250 ML INJ 261 946 $38.34 $36,269 TBD TBD TBD Dr. Khurana
kidney/hepatology
ALBUMIN 5% 500 ML INJ 318 1711 $39.59 $67,738 TBD TBD TBD Dr. Khurana
kidney/hepatology
AZTREONAM 2 GRAM INJ
Better standard practice needs to be
implemented to preserve more expensive
abx / broad spectrum. Should be used if no
other options available.
6 35 $48.61 $1,701 TBD TBD TBD ID
CEFTAROLINE 600 MG in NS 50
mL IVPB 9 95 $127.33 $12,096 TBD TBD TBD ID
ERTAPENEM 1 GRAM INJ 100 356 $68.35 $24,333 TBD TBD TBD ID
DESMOPRESSIN 4 MCG/1 ML 1
ML INJ
No other therapy available - should be
preserved for pt definite or suspected uremic
bleedine / DI
30 189 $38.13 $7,207 TBD TBD TBD Endo / SAFA
OCTREOTIDE 500 MCG in 100
mL NS Provider pref. Stop date for 2 days 110 469 $12.51 $5,867 TBD TBD TBD GI
EPOETIN 10,000 UNIT INJ
(DIALYSIS)
Should not be given if Hg > 11/12 -- often
times Hg is not checked prior to
administration
84 236 $112.16 $26,470 TBD TBD TBD
Total Savings Cost in $ TBD TBD

CPR to Reduce the Misuse and Overuse of Supplies in the Management of Clinical
Conditions
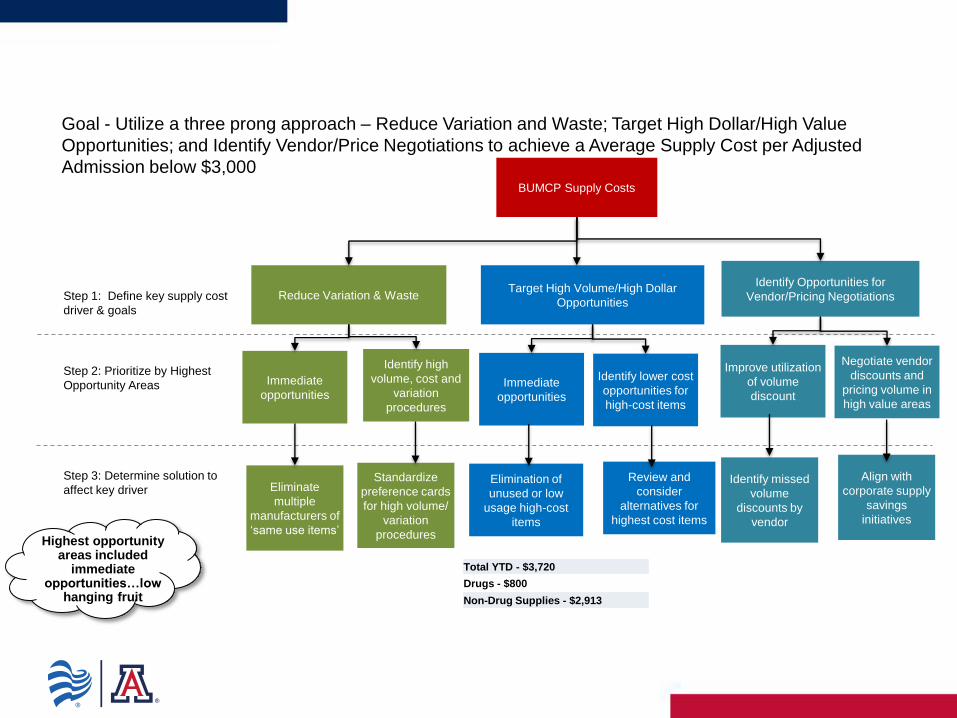
BUMCP Supply Costs
Reduce Variation & Waste Target High Volume/High Dollar
Opportunities Step 1: Define key supply cost
driver & goals
Step 2: Prioritize by Highest
Opportunity Areas
Step 3: Determine solution to
affect key driver
Identify Opportunities for
Vendor/Pricing Negotiations
Standardize
preference cards
for high volume/
variation
procedures
Immediate
opportunities
Identify high
volume, cost and
variation
procedures
Eliminate
multiple
manufacturers of
‘same use items’
Immediate
opportunities
Review and
consider
alternatives for
highest cost items
Identify lower cost
opportunities for
high-cost items
Improve utilization
of volume
discount
Negotiate vendor
discounts and
pricing volume in
high value areas
Align with
corporate supply
savings
initiatives
Identify missed
volume
discounts by
vendor
Elimination of
unused or low
usage high-cost
items
Highest opportunity areas included
immediate opportunities…low
hanging fruit
Goal - Utilize a three prong approach – Reduce Variation and Waste; Target High Dollar/High Value
Opportunities; and Identify Vendor/Price Negotiations to achieve a Average Supply Cost per Adjusted
Admission below $3,000
Total YTD - $3,720
Drugs - $800
Non-Drug Supplies - $2,913

Reduce variation and waste by standardizing preference cards for high-volume/high-value projects. Phase I - Selection criteria:
$1,672,647
$908,197
$616,539
$233,445 $232,958
50
66 67
23
36
0
10
20
30
40
50
60
70
80
$0
$200,000
$400,000
$600,000
$800,000
$1,000,000
$1,200,000
$1,400,000
$1,600,000
$1,800,000
TAVR Lumbar Fusion Cervical Fusion Aortic Valve CABG
Highest Cost Procedures Over 36% of Total OR Supply Cost in Q1 per
SurgiNet
Series1 Series2
Selection Criteria:
1. Highest Cost – over 36% of total OR Supply
cost
• TAVR
• Lumbar Fusion
• Cervical Fusion
• AVR
• CABG
2. Highest Volume
• I&D Lower Extremity
3. Alignment with Corporate Effort
• Hysterectomy
4. Highest Growth
• Ortho Trauma – 27% volume increase in
2016
5. Engaged Physician Leaders

Reduce variation and waste by standardizing preference cards for high-volume/high-value projects. Phase I - Estimated Savings by Surgery Type
Prmry Prcdr Desc
Q1 Count of
Procedures
Q1
AVERAGE
CASE COST
Q1 Used Cost
for Quarter
% of OR
Supply
Costs for
Quarter
per
Surginet
Data
Potential
Annualized
Savings -
Implementation
Standard Card
100% adoption*
Potential
Annualized
Savings -
Implementation
Standard Card -
50% adoption* Notes
High Dollar Spend
LUMBAR SPINAL FUSION 66 $13,760.56 $908,196.82 8% $239,067.28 $119,533.64 Neuro/MSKI - High Variation among surgeons - Standardization
CERVICAL SPINAL FUSION 67 $12,525.03 $616,539.29 6% $102,308.72 $51,154.36 Neuro/MSKI - High Variation among surgeons - Standardization
High Volume System Effort
HYSTERECTOMY 133 $1,468.92 $185,952.00 2% $208,493.64 $104,246.82
Women's Health - System effort pilot at BUMCP. Mourad already did
at Banner Desert
Highest Growth in Case Volume
ANKLE OPEN REDUCTION INTERNAL FIXATION 44 $1,252.11 $55,092.94 - $38,975.59 $19,487.80 MSKI - Highest Volume Ortho Trauma procedures
FEMUR INTRAMEDULLARY ROD INSERTION 28 $3,517.33 $98,485.26 - $3,957.02 $1,978.51 MSKI - Highest Volume Ortho Trauma procedures
TIBIA INTRAMEDULLARY ROD INSERTION 19 $3,714.64 $70,578.10 - $45,824.71 $22,912.35 MSKI - Highest Volume Ortho Trauma procedures
TIBIA OPEN REDUCTION INTERNAL FIXATION 14 $2,877.91 $40,290.75 - $11,307.01 $5,653.50 MSKI - Highest Volume Ortho Trauma procedures
SUBTOTAL $264,447.04 2% MSKI - Highest Volume Ortho Trauma procedures
High Dollar Spend
AORTIC VALVE REPLACEMENT TRANSCATHETER 50 $33,452.59 $1,672,647.00 16%
TAVR Team -Waste Reduction Review - Place high cost items in
hold bin. Dollar Amount to be determined
AORTIC VALVE REPLACEMENT 23 $10,149.77 $233,444.62 2%
CT Surgeons - Standardization and Waste Reduction Dollar Amount
to be determined
CORONARY ARTERY BYPASS GRAFT 36 $6,471.06 $232,958.11 2%
CT Surgeons - Standardization and Waste Reduction Dollar Amount
to be determined
IRRIGATION & DEBRIDEMENT LOWER EXTREMITY 152 $257.07 $39,074.01 0% Wound Institute - High use of Integra
Total Range of Annualized Savings $649,933.97 $324,966.99
*Lumbar Spinal Fusion - Calculated at average case cost of highest volume surgeons
*Cervical Spinal Fusion - Calculated at average case cost of highest volume surgeons
* Hysterectomy - Calculated at average case cost of highest volume surgeons

Teams and Institute Leads By Project Phase I
Project
Institute Physician Champion(s)
Lumbar and Cervical Spinal Fusion Neuro/MSKI Drs. Chutkan and Menendez
TAVR Cardiovascular Drs. Pershad, Fang, Amabile, Tasset (one tbd)
AVR and CABG Cardiovascular Drs. Fang, Amabile, Tasset (one tbd)
I & D Lower Extremity Wound Dr. Silverstein
Hysterectomy Women’s Health Dr. Mourad
Ortho Trauma MSKI Drs. Jones and Ringler

Return on Investment…?
• The CPR Team 600k Investment
• 2 FTEs (Senior Directors- Clinical Transformation)
• 3 Data Analysts
• 10 Physician leaders each paid at .1 FTE
• 2016 YTD vs 2015- 22 million more dollars in net income; Operating Margin increased from 2 % to 6%
• The Real Return on Investment… Physician Engagement
– Priceless

Questions?
“Better is possible. It does not take genius. It takes diligence. It takes moral clarity. It takes ingenuity. And above all, it takes a willingness to try”
― Atul Gawande, Better: A Surgeon's Notes on Performance