improving performance on numa systems - accueil - tel
TRANSCRIPT

HAL Id: tel-01549294https://tel.archives-ouvertes.fr/tel-01549294
Submitted on 28 Jun 2017
HAL is a multi-disciplinary open accessarchive for the deposit and dissemination of sci-entific research documents, whether they are pub-lished or not. The documents may come fromteaching and research institutions in France orabroad, or from public or private research centers.
L’archive ouverte pluridisciplinaire HAL, estdestinée au dépôt et à la diffusion de documentsscientifiques de niveau recherche, publiés ou non,émanant des établissements d’enseignement et derecherche français ou étrangers, des laboratoirespublics ou privés.
Improving performance on NUMA systemsBaptiste Lepers
To cite this version:Baptiste Lepers. Improving performance on NUMA systems. Performance [cs.PF]. Université deGrenoble, 2014. English. �NNT : 2014GRENM005�. �tel-01549294�

THÈSEPour obtenir le grade de
DOCTEUR DE L’UNIVERSITÉ DE GRENOBLESpécialité : Informatique
Arrêté ministériel : 7 août 2006
Présentée par
Baptiste Lepers
Thèse dirigée par Vivien Quémaet co-encadrée par Renaud Lachaize
préparée au sein du LIGet de L’Ecole Doctorale Mathématiques, Sciences et Technologies del’Information, Informatique
Amélioration de performance surles architectures NUMAImproving performance on NUMA systems
Thèse soutenue publiquement le 24/01/2014,devant le jury composé de :
Prof. Pascal FelberUniversité de Neuchâtel, Rapporteur
Dr. Erven RohouInria, Rapporteur
Prof. Andrzej DudaGrenoble INP, Examinateur
Dr. Gilles MullerInria, Examinateur
Dr. Gaël ThomasUPMC, Examinateur
Prof. Vivien QuémaINP Grenoble, Directeur de thèse
Dr. Renaud LachaizeUJF, Co-Encadrant de thèse


Abstract
Modern multicore systems are based on a Non-Uniform Memory Access (NUMA)
design. In a NUMA system, cores are grouped in a set of nodes. Each node has a
memory controller and is interconnected with other nodes using high speed interconnect
links. Efficiently exploiting such architectures is notoriously complex for programmers.
Two key objectives on NUMA multicore machines are to limit as much as possible the
number of remote memory accesses (i.e., accesses from a node to another node) and
to avoid contention on memory controllers and interconnect links. These objectives
can be achieved by implementing application-level optimizations or by implementing
application-agnostic heuristics. However, in many cases, existing profilers do not
provide enough information to help programmers implement application-level opti-
mizations and existing application-agnostic heuristics fail to address contention issues.
The contributions of this thesis are twofold. First we present MemProf, a profiler that
allows programmers to choose and implement efficient application-level optimizations
for NUMA systems. MemProf builds temporal flows of interactions between threads
and objects, which help programmers understand why and which memory objects are
accessed remotely. We evaluate MemProf on Linux on three different machines. We
show how MemProf helps us choose and implement efficient optimizations, unlike
existing profilers. These optimizations provide significant performance gains (up to
2.6x), while requiring very lightweight modifications (10 lines of code or less). Then we
present Carrefour, an application-agnostic memory management algorithm. Contrarily
to existing heuristics, Carrefour focuses on traffic contention on memory controllers
and interconnect links. Carrefour provides significant performance gains (up to 3.3x)
and always performs better than existing heuristics.
Keywords. NUMA, multicore, memory contention, profiling, memory manage-
ment, traffic management, remote memory accesses, locality.

Résumé
Les machines multicœurs actuelles utilisent une architecture à Accès Mémoire
Non-Uniforme (Non-Uniform Memory Access - NUMA). Dans ces machines, les
cœurs sont regroupés en nœuds. Chaque nœud possède son propre contrôleur mémoire
et est relié aux autres nœuds via des liens d’interconnexion. Utiliser ces architectures à
leur pleine capacité est difficile : il faut notamment veiller à éviter les accès distants
(i.e., les accès d’un nœud vers un autre nœud) et la congestion sur les bus mémoire et
les liens d’interconnexion. L’optimisation de performance sur une machine NUMA
peut se faire de deux manières : en implantant des optimisations ad-hoc au sein des
applications ou de manière automatique en utilisant des heuristiques. Cependant, les
outils existants fournissent trop peu d’informations pour pouvoir implanter efficacement
des optimisations et les heuristiques existantes ne permettent pas d’éviter les problèmes
de congestion. Cette thèse résout ces deux problèmes. Dans un premier temps nous
présentons MemProf, le premier outil d’analyse permettant d’implanter efficacement des
optimisations NUMA au sein d’applications. Pour ce faire, MemProf construit des flots
d’interactions entre threads et objets. Nous évaluons MemProf sur 3 machines NUMA
et montrons que les optimisations trouvées grâce à MemProf permettent d’obtenir des
gains de performance significatifs (jusqu’à 2.6x) et sont très simples à implanter (moins
de 10 lignes de code). Dans un second temps, nous présentons Carrefour, un algorithme
de gestion de la mémoire pour machines NUMA. Contrairement aux heuristiques
existantes, Carrefour se concentre sur la réduction de la congestion sur les machines
NUMA. Carrefour permet d’obtenir des gains de performance significatifs (jusqu’à
3.3x) et est toujours plus performant que les heuristiques existantes.
Mots-clés. NUMA, multicoeurs, congestion mémoire, analyse, profiling, gestion
mémoire, gestion du trafic, accès mémoire distant, localité.

Acknowledgments
I would like to thank the members of my PhD committee, Professor Pascal Felber,
Doctor Erven Rohou, Professor Andrzej Duda, Doctor Gilles Muller and Doctor Gaël
Thomas for their precious time and valuable suggestions for the work done in this
dissertation.
A special thanks to Vivien Quéma and Renaud Lachaize for supervising this thesis,
it has been a real pleasure to work with them. Thanks for the long hours and weekends
spent on articles and for pushing me to strive for excellence during these last years.
A big thanks to all the people I have collaborated with: Fabien Gaud, Alexandra
Fedorova and the whole team at SFU. I would also like to thank Gilles Muller for his
help during the early days of multicore in the Sardes team and Gaël Thomas for the
great discussions we had on our works.
I would also like to thank the whole Erods team and the previous Sardes team. A
special thank goes to all people I closely worked with, most of which became friends.
Thanks to the B218 Team – Fabien Gaud, Fabien Mottet and Sylvain Genevès – for
sparking my interest in multicore machines, for all the hikes and the stupid YouTube
videos. Thanks to Pierre-Louis Aublin for being such a good sport about our jokes on
his work and on Chinese girls. Thanks to Gautier Berthou for his great mood and for all
the great climbing sessions. Thanks to Jerémie Decouchant for the hiking sessions and
for all the work we have done together. Thanks to Amadou, Soguy, Alain and Ahmed
for the African food and for their great mood. And thanks to Michael Lienhardt for
sparking my interest in cycling.
Finally, a special thanks to my whole family without whom this thesis would not
have been possible. Thanks for the advices and for being supportive through these
years.
iii


Preface
The thesis presents the research conducted in the in the Sardes team (INRIA Greno-
ble – Rhône-Alpes / Laboratoire d’Informatique de Grenoble) and Erods (Laboratoire
d’Informatique de Grenoble) to pursue the Ph.D. in the specialty “Informatics” from
the Doctoral School “Mathématiques, Sciences et Technologies de l’Information, Infor-
matique” of the Université de Grenoble.
The research activities have been supervised by Vivien Quéma (Erods/Grenoble INP)
and Renaud Lachaize (Erods/UJF). Some of the works presented in this thesis were done
as an international research collaboration with the systems group at SFU in Vancouver,
Canada [1].
This thesis focuses on improving the performance of multicore applications on NUMA
systems. The contributions of this thesis are twofold: (i) a memory profiler designed to
help developers find and implement efficient optimizations on NUMA systems and (ii)
a dynamic memory management algorithm that automatically mitigate contention on
NUMA systems.
This thesis led to two publications in two international conferences:
• MemProf: A Memory Profiler for NUMA Multicore Systems. Renaud
Lachaize, Baptiste Lepers, and Vivien Quéma. In Proceedings of the USENIX
Annual Technical Conference (USENIX ATC), Boston, USA, June 2012 [2]
• Traffic Management: A Holistic Approach to Memory Placement on
NUMA Systems. Mohammad Dashti, Alexandra Fedorova, Justin Funston,
Fabien Gaud, Renaud Lachaize, Baptiste Lepers, Vivien Quéma, and Mark Roth.
In Proceedings of the International Conference on Architectural Support for Pro-
gramming Languages and Operating Systems (ASPLOS), Houston, USA, March
2013 [3]
v


Contents
Abstract i
Résumé ii
Acknowledgments iii
Preface v
Table of contents vii
Introduction 1
1 From UMA to NUMA multicore machines 3
1.1 Memory management in a multicore machine . . . . . . . . . . . . . 4
1.1.1 Virtual memory . . . . . . . . . . . . . . . . . . . . . . . . . 4
1.1.2 Fetching data . . . . . . . . . . . . . . . . . . . . . . . . . . 5
1.1.2.1 Caches . . . . . . . . . . . . . . . . . . . . . . . . 5
1.1.2.2 Inter-core communication . . . . . . . . . . . . . . 7
1.1.2.3 Cache coherency . . . . . . . . . . . . . . . . . . . 8
1.1.3 Prefetching unit . . . . . . . . . . . . . . . . . . . . . . . . . 9
1.2 Uniform Memory Access architectures (UMA) . . . . . . . . . . . . 10
1.2.1 Organization of UMA machines . . . . . . . . . . . . . . . . 10
1.2.2 Limitations of UMA . . . . . . . . . . . . . . . . . . . . . . 10
1.3 Non Uniform Memory Access architectures (NUMA) . . . . . . . . . 11
1.3.1 Organization of NUMA machines . . . . . . . . . . . . . . . 11
1.3.2 History of NUMA machines . . . . . . . . . . . . . . . . . . 11
1.4 Characteristics of the NUMA multicore machines used in the evaluations 12
1.4.1 Machine A - 16 cores, 4 nodes, HT1 links . . . . . . . . . . . 12
1.4.2 Machine B - 24 cores, 4 nodes, HT3 links . . . . . . . . . . . 14
1.4.3 Machine C - 48 cores, 8 nodes, HT3 links . . . . . . . . . . . 14
1.5 Challenges introduced by NUMA . . . . . . . . . . . . . . . . . . . 14
1.5.1 Remote access penalty . . . . . . . . . . . . . . . . . . . . . 14
1.5.2 Contention on interconnects and memory buses . . . . . . . . 15
1.5.3 Remote accesses versus contention . . . . . . . . . . . . . . 16
1.5.4 Differences with the NUMA machines used in the 80s . . . . 16
1.6 Classic optimizations on NUMA multicore machines . . . . . . . . . 16
vii

1.6.1 Memory allocation . . . . . . . . . . . . . . . . . . . . . . . 17
1.6.2 Memory migration . . . . . . . . . . . . . . . . . . . . . . . 17
1.6.3 Memory interleaving . . . . . . . . . . . . . . . . . . . . . . 18
1.6.4 Memory replication . . . . . . . . . . . . . . . . . . . . . . . 18
1.6.5 Thread Placement . . . . . . . . . . . . . . . . . . . . . . . . 18
1.6.6 Difficulty to choose and implement an optimization . . . . . . 18
1.7 Future architectures . . . . . . . . . . . . . . . . . . . . . . . . . . . 19
1.7.1 Large scale NUMA systems . . . . . . . . . . . . . . . . . . 19
1.7.2 Possible evolutions of memory . . . . . . . . . . . . . . . . . 20
1.7.3 Possible evolutions of multicore processors . . . . . . . . . . 21
1.7.4 GPGPU and accelerators . . . . . . . . . . . . . . . . . . . . 21
1.8 Conclusion . . . . . . . . . . . . . . . . . . . . . . . . . . . . . . . 22
2 Contributions 23
2.1 MemProf . . . . . . . . . . . . . . . . . . . . . . . . . . . . . . . . 23
2.2 Carrefour . . . . . . . . . . . . . . . . . . . . . . . . . . . . . . . . 24
I MemProf - Profiling memory accesses on NUMA multicore machines25
3 Existing profiling techniques 27
3.1 Hardware profiling facilities . . . . . . . . . . . . . . . . . . . . . . 28
3.1.1 Hardware counters . . . . . . . . . . . . . . . . . . . . . . . 28
3.1.1.1 Description . . . . . . . . . . . . . . . . . . . . . 28
3.1.1.2 Format of Hardware Counters on AMD processors . 29
3.1.1.3 Undocumented bugs on AMD processors . . . . . . 30
3.1.2 Instruction Based Sampling (IBS) . . . . . . . . . . . . . . . 31
3.1.2.1 Description . . . . . . . . . . . . . . . . . . . . . 31
3.1.2.2 Overhead of IBS . . . . . . . . . . . . . . . . . . . 31
3.1.2.3 Difference between HWC and IBS . . . . . . . . . 32
3.1.3 Precise Event Based Sampling (PEBS) . . . . . . . . . . . . 32
3.1.4 Lightweight profiling (LWP) . . . . . . . . . . . . . . . . . . 33
3.1.5 Hardware breakpoints . . . . . . . . . . . . . . . . . . . . . 33
3.2 Software profiling facilities . . . . . . . . . . . . . . . . . . . . . . . 34
3.2.1 Tracing . . . . . . . . . . . . . . . . . . . . . . . . . . . . . 34
3.2.2 System Monitors . . . . . . . . . . . . . . . . . . . . . . . . 35
3.2.3 Cycle accurate simulators . . . . . . . . . . . . . . . . . . . 36
3.2.4 Accessed bit . . . . . . . . . . . . . . . . . . . . . . . . . . 36
3.3 Determining the impact of memory on an application . . . . . . . . . 36
3.3.1 Impact of the speed of memory accesses . . . . . . . . . . . . 37
3.3.2 Is an application accessing memory locally? . . . . . . . . . . 38
3.3.3 Is an application creating contention? . . . . . . . . . . . . . 38
3.4 Existing profilers . . . . . . . . . . . . . . . . . . . . . . . . . . . . 40
3.5 Limitations of existing profilers . . . . . . . . . . . . . . . . . . . . . 42
3.6 Conclusion . . . . . . . . . . . . . . . . . . . . . . . . . . . . . . . 43

4 MemProf: a memory profiler for NUMA multicore machines 45
4.1 Overview . . . . . . . . . . . . . . . . . . . . . . . . . . . . . . . . 45
4.2 Timelines of thread-object access patterns . . . . . . . . . . . . . . . 46
4.3 Implementation . . . . . . . . . . . . . . . . . . . . . . . . . . . . . 47
4.3.1 Event collection . . . . . . . . . . . . . . . . . . . . . . . . 47
4.3.2 TEF and OEF construction . . . . . . . . . . . . . . . . . . . 49
4.4 Example usage . . . . . . . . . . . . . . . . . . . . . . . . . . . . . 50
4.5 Conclusion . . . . . . . . . . . . . . . . . . . . . . . . . . . . . . . 52
5 Evaluation 53
5.1 FaceRec . . . . . . . . . . . . . . . . . . . . . . . . . . . . . . . . . 53
5.2 Streamcluster . . . . . . . . . . . . . . . . . . . . . . . . . . . . . . 55
5.3 Psearchy . . . . . . . . . . . . . . . . . . . . . . . . . . . . . . . . . 57
5.4 Apache/PHP . . . . . . . . . . . . . . . . . . . . . . . . . . . . . . . 58
5.5 Overhead . . . . . . . . . . . . . . . . . . . . . . . . . . . . . . . . 60
5.6 Conclusion . . . . . . . . . . . . . . . . . . . . . . . . . . . . . . . 61
II Carrefour - Dynamic memory management on NUMA multicoremachines 63
6 Motivation 65
6.1 MemProf vs. dynamic memory management algorithms, advantages
and constraints of live diagnosis . . . . . . . . . . . . . . . . . . . . 66
6.2 Existing static and dynamic memory algorithms . . . . . . . . . . . . 67
6.2.1 Works done on UMA systems . . . . . . . . . . . . . . . . . 67
6.2.2 Linux - “First touch” and “interleave” allocation policies . . . 67
6.2.3 Solaris and Windows - Home node . . . . . . . . . . . . . . . 68
6.2.4 AutoNUMA . . . . . . . . . . . . . . . . . . . . . . . . . . 68
6.2.5 Verghese et al. - ASPLOS’96 . . . . . . . . . . . . . . . . . 68
6.2.6 DINO . . . . . . . . . . . . . . . . . . . . . . . . . . . . . . 69
6.2.7 Thread Clustering . . . . . . . . . . . . . . . . . . . . . . . . 70
6.2.8 Affinity Accept . . . . . . . . . . . . . . . . . . . . . . . . . 70
6.3 Limitations of existing dynamic memory management algorithms . . 70
6.4 Conclusion . . . . . . . . . . . . . . . . . . . . . . . . . . . . . . . 71
7 Carrefour 73
7.1 Overview . . . . . . . . . . . . . . . . . . . . . . . . . . . . . . . . 74
7.2 Profiling . . . . . . . . . . . . . . . . . . . . . . . . . . . . . . . . . 75
7.2.1 Global and per application metrics . . . . . . . . . . . . . . . 75
7.2.2 Capturing interactions between threads and pages . . . . . . . 76
7.3 Per application decisions . . . . . . . . . . . . . . . . . . . . . . . . 77
7.4 Per page decisions . . . . . . . . . . . . . . . . . . . . . . . . . . . . 78
7.5 Reducing the overhead . . . . . . . . . . . . . . . . . . . . . . . . . 78
7.5.1 Reducing the overhead of capturing interactions between threads
and pages . . . . . . . . . . . . . . . . . . . . . . . . . . . . 78
7.5.2 Avoiding bad per page decisions . . . . . . . . . . . . . . . . 80

7.6 Conclusion . . . . . . . . . . . . . . . . . . . . . . . . . . . . . . . 80
8 Evaluation 83
8.1 Single-application workloads . . . . . . . . . . . . . . . . . . . . . . 83
8.1.1 Performance comparison . . . . . . . . . . . . . . . . . . . . 83
8.1.2 Performance analysis . . . . . . . . . . . . . . . . . . . . . . 84
8.1.3 Limitations of Carrefour: the IS.D use case . . . . . . . . . . 88
8.2 Overhead . . . . . . . . . . . . . . . . . . . . . . . . . . . . . . . . 88
8.3 Conclusion . . . . . . . . . . . . . . . . . . . . . . . . . . . . . . . 89
Conclusion 91
Bibliography 93
List of figures 99
List of tables 101
Appendix 103
A Performance analysis of Carrefour on machine A 103
B Performance analysis of Carrefour on machine B 107
Introduction
Context
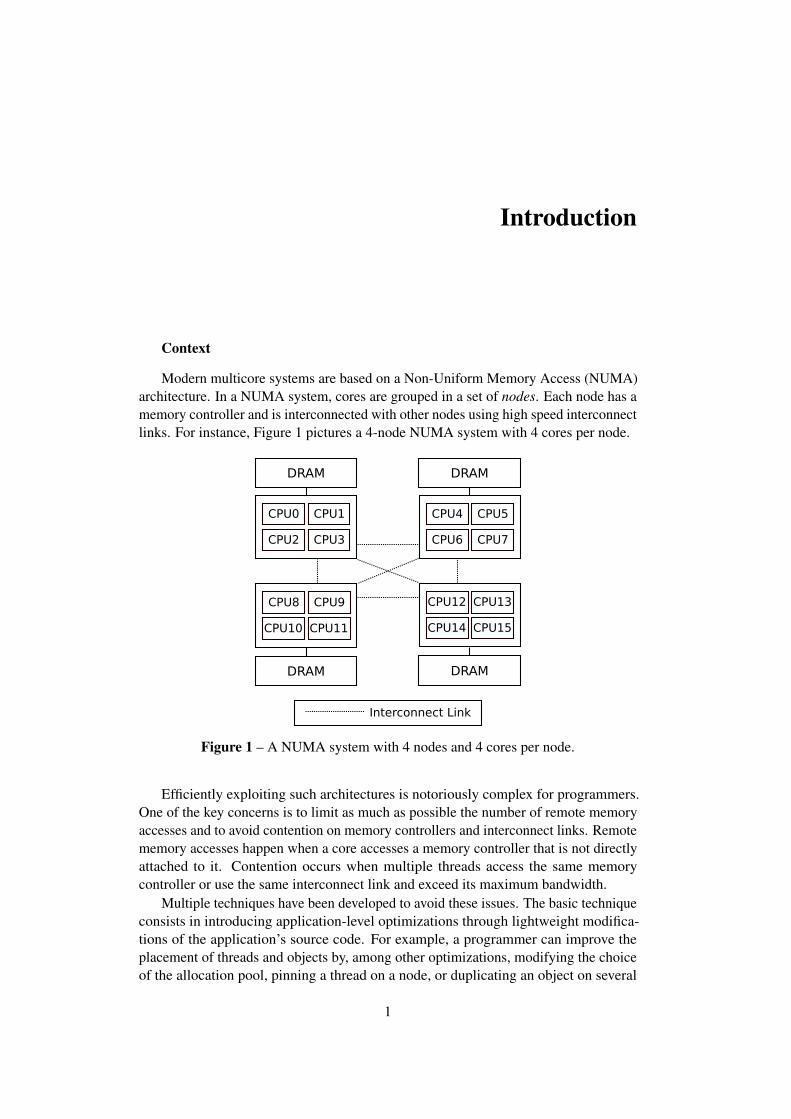
Modern multicore systems are based on a Non-Uniform Memory Access (NUMA)
architecture. In a NUMA system, cores are grouped in a set of nodes. Each node has a
memory controller and is interconnected with other nodes using high speed interconnect
links. For instance, Figure 1 pictures a 4-node NUMA system with 4 cores per node.
Interconnect Link
DRAM
CPU0 CPU1
CPU2 CPU3
DRAM
CPU4 CPU5
CPU6 CPU7
DRAM
CPU8 CPU9
CPU10 CPU11
DRAM
CPU12 CPU13
CPU14 CPU15
Figure 1 – A NUMA system with 4 nodes and 4 cores per node.
Efficiently exploiting such architectures is notoriously complex for programmers.
One of the key concerns is to limit as much as possible the number of remote memory
accesses and to avoid contention on memory controllers and interconnect links. Remote
memory accesses happen when a core accesses a memory controller that is not directly
attached to it. Contention occurs when multiple threads access the same memory
controller or use the same interconnect link and exceed its maximum bandwidth.
Multiple techniques have been developed to avoid these issues. The basic technique
consists in introducing application-level optimizations through lightweight modifica-
tions of the application’s source code. For example, a programmer can improve the
placement of threads and objects by, among other optimizations, modifying the choice
of the allocation pool, pinning a thread on a node, or duplicating an object on several
1

memory nodes. Yet, it is generally difficult to determine which optimizations apply
to a given application and implementing them requires a precise knowledge of the
interactions between threads and objects, i.e., knowing which threads access which
objects remotely. Currently no tool is able to provide this information.
Other techniques have been proposed to avoid NUMA issues. Most of these
techniques try to improve thread placement or memory placement automatically [4,
5, 6, 7, 8, 9, 10]. Yet, none of these techniques addresses contention issues on NUMA
machines (i.e., they only focus on limiting the number of remote memory accesses).
Contributions
In this context, our contributions are as follows:
• We implement and evaluate a NUMA profiler called MemProf. MemProf allows
developers to detect the causes of the remote memory accesses and to introduce
simple optimizations within complex and unfamiliar code bases. MemProf
achieves this result by building temporal flows of interactions between threads
and objects allocated by any application.
• We implement and evaluate a dynamic memory placement algorithm called
Carrefour. Previous NUMA-aware memory placement algorithms focused on
limiting the number of remote memory accesses. Carrefour takes a new approach
and focuses on limiting contention on memory controllers and interconnect links.
Organization of the document
The thesis is organized as follows: Chapter 1 explains why machines switched
from Uniform Memory Access architectures (UMA) to Non-Uniform Memory Access
architectures (NUMA), and presents the challenges introduced by NUMA. Chapter 2
motivates the two contributions of this thesis. Then, Chapters 3, 4 and 5 focus on
profiling. More precisely, Chapter 3 presents existing profiling tools and explains
why they are not sufficient to understand NUMA-issues. Chapter 4 presents the first
contribution of this thesis, MemProf, and Chapter 5 evaluates it. The last three Chapters
of this thesis focus on dynamic memory placement algorithms. Chapter 6 motivates
the need for a new memory placement algorithm. Chapter 7 presents the second
contribution of this thesis, Carrefour, and Chapter 8 evaluates it. After this last Chapter,
we conclude this thesis with perspectives for future works.
2

1From UMA to NUMA multicore machines
Contents
1.1 Memory management in a multicore machine . . . . . . . . . 4
1.1.1 Virtual memory . . . . . . . . . . . . . . . . . . . . . . . 4
1.1.2 Fetching data . . . . . . . . . . . . . . . . . . . . . . . . 5
1.1.2.1 Caches . . . . . . . . . . . . . . . . . . . . . . 5
1.1.2.2 Inter-core communication . . . . . . . . . . . . 7
1.1.2.3 Cache coherency . . . . . . . . . . . . . . . . . 8
1.1.3 Prefetching unit . . . . . . . . . . . . . . . . . . . . . . . 9
1.2 Uniform Memory Access architectures (UMA) . . . . . . . . . 10
1.2.1 Organization of UMA machines . . . . . . . . . . . . . . 10
1.2.2 Limitations of UMA . . . . . . . . . . . . . . . . . . . . 10
1.3 Non Uniform Memory Access architectures (NUMA) . . . . . 11
1.3.1 Organization of NUMA machines . . . . . . . . . . . . . 11
1.3.2 History of NUMA machines . . . . . . . . . . . . . . . . 11
1.4 Characteristics of the NUMA multicore machines used in the
evaluations . . . . . . . . . . . . . . . . . . . . . . . . . . . . . 12
1.4.1 Machine A - 16 cores, 4 nodes, HT1 links . . . . . . . . . 12
1.4.2 Machine B - 24 cores, 4 nodes, HT3 links . . . . . . . . . 14
1.4.3 Machine C - 48 cores, 8 nodes, HT3 links . . . . . . . . . 14
1.5 Challenges introduced by NUMA . . . . . . . . . . . . . . . . 14
1.5.1 Remote access penalty . . . . . . . . . . . . . . . . . . . 14
1.5.2 Contention on interconnects and memory buses . . . . . . 15
1.5.3 Remote accesses versus contention . . . . . . . . . . . . 16
1.5.4 Differences with the NUMA machines used in the 80s . . 16
1.6 Classic optimizations on NUMA multicore machines . . . . . . 16
1.6.1 Memory allocation . . . . . . . . . . . . . . . . . . . . . 17
1.6.2 Memory migration . . . . . . . . . . . . . . . . . . . . . 17
3

1.1. MEMORY MANAGEMENT IN A MULTICORE MACHINE
1.6.3 Memory interleaving . . . . . . . . . . . . . . . . . . . . 18
1.6.4 Memory replication . . . . . . . . . . . . . . . . . . . . . 18
1.6.5 Thread Placement . . . . . . . . . . . . . . . . . . . . . . 18
1.6.6 Difficulty to choose and implement an optimization . . . . 18
1.7 Future architectures . . . . . . . . . . . . . . . . . . . . . . . . 19
1.7.1 Large scale NUMA systems . . . . . . . . . . . . . . . . 19
1.7.2 Possible evolutions of memory . . . . . . . . . . . . . . . 20
1.7.3 Possible evolutions of multicore processors . . . . . . . . 21
1.7.4 GPGPU and accelerators . . . . . . . . . . . . . . . . . . 21
1.8 Conclusion . . . . . . . . . . . . . . . . . . . . . . . . . . . . . 22
In this chapter, we explain why machines evolved from a Uniform Memory Access
(UMA) architecture, in which all cores access all memory regions with the same
latency, to a Non Uniform Memory Access (NUMA) architecture, in which cores
access different memory regions with different latencies. This chapter is divided in
8 sections. First we explain how memory is managed in a multicore machine by the
operating system and by the hardware. Second, we describe UMA multicore machines
and explain their limitations. Third, we describe NUMA machines and their advantages
over UMA machines. Fourth, we present the NUMA machines used in the evaluation
Section of this thesis. Then, we explain challenges introduced by NUMA and the
techniques used to address these challenges. We conclude this chapter with an overview
of the possible evolutions of NUMA architectures and discuss how works done for
NUMA architectures could still apply on these new architectures.
1.1 Memory management in a multicore machine
We first describe the virtual memory mechanism, and show how it allows the
operating system to share physical memory between applications. Then we explain how
the hardware handles virtual memory addresses provided by the operating system and
how it fetches data from main memory. We explain how the hardware tries to minimize
the latencies of memory accesses using caches and prefetchers.
1.1.1 Virtual memory
Current multicore machines often run multiple applications at the same time. These
applications store their data in memory and have to share the physical addressable
space without overwriting each other’s data. Virtual memory allows applications to
manipulate memory as if they were the only application running on the system. The
operating system is in charge of maintaining the mapping between virtual memory
addresses manipulated by the applications and physical addresses used by the hardware.
When an application requests memory, the operating system returns a contiguous virtual
address space. This virtual address space is not necessarily contiguous in physical
address space (as illustrated in Figure 1.1).
4

Figure 1.1 – Physical to virtual memory mapping. The operating system is in
charge of maintaining the mapping between virtual memory regions and physical
memory.
The operating system manages virtual memory allocations and destructions at the
granularity of a “page”. A page represents a span of contiguous virtual and physical
address space (usually 4KB). The kernel stores mappings between pages’ virtual
addresses and pages’ physical addresses in a page table. Currently most processors
do the translation between virtual and physical addresses in hardware and require the
operating system to store the page table using a predefined layout. Figure 1.2 pictures
the layout of the page table used in x86_64 machines. On x86_64 machines, the page
table is a 4-level translation table. Each entry in the first 3 translation levels points to
a translation table of the next level. Entries of the 4th level contain physical address
spaces. To perform the translation, the hardware splits virtual addresses in five bit
ranges. The first 4 ranges are used as indexes in the 4 levels of the page table. The
last range is the address offset in the physical page. The hardware has to perform the
virtual to physical address translation for all memory access. To speed up the translation
process, recent translations are cached in a special buffer named Translation Lookaside
Buffer (TLB).
1.1.2 Fetching data
1.1.2.1 Caches
Arithmetic units of current processors perform operations on registers. The total
amount of data that can be stored in registers is very small (less that a kilobyte on current
processors), so processors often load data to and flush data from registers. Accessing
the main memory directly is slow: between 100 and 2000 cycles on modern hardware
(in comparison, arithmetic units are able to perform up to 4 operations on registers in
a cycle). To minimize accesses to the main memory, processors use caches that are
accessed with a much lower latency (between 3 and 60 cycles on modern hardware).
Maximizing the cache-hit rate is an important part of improving performance on
multicore hardware. It has been extensively studied in the literature [7, 11, 12, 13, 14].
Modern multicore processors usually have 3 levels of cache, as pictured in fig 1.3.
Caches cache data at the granularity of a cache line (usually 64B). Each transfer between
levels of caches or between caches and DRAM is done in 64B chunks.
5

1.1. MEMORY MANAGEMENT IN A MULTICORE MACHINE
Figure 1.2 – Page table format. The operating system segments the addressable
space in “pages”. The mapping between virtual addresses of pages and their
physical address is stored in a page table. On current x86_64 systems, the page
table has to be a 4-level hierarchical translation table.
Figure 1.3 – Caches. Modern multicore processors often have multiple levels of
cache. The latency required to access a data in cache is much lower than that of
accessing data in DRAM.
6

The first level of cache, called L1, is a small cache (usually 32KB or 64KB) that
is accessed with a low latency (3 or 4 cycles). To speed up lookups in the L1, L1
caches are often virtually indexed and physically tagged. The processor initiates the
lookup in the L1 cache using the virtual address of the load or of the store before the
virtual address has been translated to a physical address. This way, the translation of
the virtual address and the lookup in the cache can be parallelized. When the processor
finds a cache line that matches the requested virtual address, it waits for the virtual to
physical translation to complete and checks that the physical address tag of the cache
line matches the requested physical address. Despite its small size, because applications
tend to have a high spatial and temporal locality, the L1 cache often has a high hit rate
(often more than 98%).
If the requested data is not present in the L1 cache, the processor looks for it in the
L2 and L3 caches. L2 and L3 caches are bigger than L1 caches (between 512KB and
12MB) and are accessed with a higher latency. Typical latencies are: 12 cycles for L2
and 60 cycles for L3. If the requested data is not present in the caches, the core will
send a request to get the data from other cores’ caches or from the DRAM.
1.1.2.2 Inter-core communication
Figure 1.4 – Inter-core communications. When two cores share a cache (e.g.,
a L3), they communicate via this cache. Otherwise, they communicate using
interconnect links.
When a core wants to get data from another core’s cache, it has to communicate
with it. There are two main ways for cores to communicate, as pictured in Figure 1.4.
When two cores are located in the same processor, they communicate either (i) via their
common shared L3 or (ii) by sending requests to the other cores’ L2 and L1. When two
cores are located on different processors, they use interconnect links.
The interconnect links technology varies between processors models. For example,
AMD machines use the Hypertransport (HT) technology and Intel processors use the
QuickPath Interconnect (QPI) technology. Both technologies are “packet-based”: data
that transits via HT or QPI links are split in multiple packets of fixed size. Each packet
contains a header that indicates the source and the destination of the packet (similarly to
IP packets). When all processors are not directly interconnected, packets can be routed
and forwarded by processors to reach their destination. Table 1.1 presents the main
7

1.1. MEMORY MANAGEMENT IN A MULTICORE MACHINE
characteristics of HT and QPI technologies. The Hypertransport technology is more
general purpose and can be adapted depending on the constraints of the environment
it is deployed in. Current AMD processors use a mix of 8 and 16-bit HT links. Each
processor has between 4 and 6 HT links. These links are both used to interconnect
processors and to connect processors and I/O. QPI is less general purpose (it was
specifically developed to interconnect Intel processors between themselves and I/O).
Despite differences in their implementations, we measured on our machines that both
technologies are currently configured to achieve approximately the same maximal
bandwidth (6.6GB/s for HT links vs. 6.8GB/s for QPI links).
Hypertransport QuickPath Interconnect
Packet SizeN*32 bits 80 bits
(depends on the packet type) (64 useful bits)
Link width 2 to 32 bits 20 bits
Maximum bandwidth6.4GB/s (HT1)
12.8GB/s25.6GB/s (HT3)
Observed bandwidth 2.8GB/s (HT1)6.8GB/s
on our machines 3GB/s to 6.6GB/s (HT3)
Latency of a link24ns 21ns
(∼50 cycles @2.1GHz) (∼50 cycles @2.4Ghz)
Table 1.1 – Comparison between Hypertransport (AMD) and QuickPath Inter-
connect (Intel) technologies. The difference between the maximum bandwidth
supported by the specification and the observed bandwidth is due to links not
using the maximum width (e.g., current AMD processors use 8 or 16 bit links)
or not working at their maximum frequency.
1.1.2.3 Cache coherency
When cores communicate to get data, they do not “steal” data from each other’s
caches: the same data can be cached in multiple places at the same time. To maintain
coherence between all caches, the current processors rely on the MOESI protocol. The
objective of this protocol is to prevent processors to read outdated versions of data that
were modified by other processors. The MOESI protocol defines 5 possible cache line
states:
• M - Modified. The cache line contains the last version of the data and the last
version is present only in this cache line. The value in main memory is incorrect
(thus the value will have to be written in main memory when the cache line is
flushed).
• O - Owned. The cache line contains the last version of the data and this last
version is also present in other processors’ caches. The value in main memory is
incorrect. For a given data, only one cache line can be in the owned state; other
cache lines containing the same data have to be in the “Shared” state. Only the
“owner” of a cache line writes the last version of the data in memory when the
cache line is flushed.
8

• E - Exclusive. The cache line contains the last version of the data and the data is
not present in any other cache. The main memory also contains the last value.
The cache line does not need to be written in main memory when flushed.
• S - Shared. The cache line contains the last version of the data. The last version
of the data may also be in another processor cache. If all cache lines containing
this data are shared, the main memory is up to date. Otherwise the cache line
is “owned” by another cache, which will be responsible for writing the value to
memory. In all cases, when flushed, the cache line does not need to be written in
main memory.
• I - Invalid. The cache line contains an outdated version of the data.
When a processor writes a value in a cache line, it invalidates cache lines containing
the same data in other processors’ caches. Messages exchanged to maintain cache
coherency can consume a significant portion of the available interconnect bandwidth.
For example, on a 4-node machine with 16 cores, we measured that the cache coherency
protocol can represent up to 15% of the traffic of interconnect links.
Recent processors have been optimized to reduce the number of cache coherency
messages. HT Assist, available in AMD processors since the release of the Istanbul
family, is an example of such an optimization. HT Assist uses a part of the L3 as a
directory cache. The directory cache of a node keeps track of all cache lines that use
data coming from this node in the system. In a system using HT Assist, cache coherency
messages are sent only to the caches that actually contain a copy of the data and are not
broadcast to all caches [15].
1.1.3 Prefetching unit
Processors try to maximize the cache-hit ratio in order to reduce memory access
latencies. To this purpose, they try to predict which data will be used in the near future
to put them in the processor caches before they are requested. Prefetchers perform
this job. Prefetchers are entirely implemented in hardware, and the operating system
has very little control over their operations. On most processors, it is only possible to
disable prefetchers and/or to control the degree of “confidence”1 required to prefetch
data.
Current processors include multiple prefetchers that use different heuristics to
prefetch memory. For example, Opteron processors include 2 levels of prefetchers: one
per core and one per processor. Prefetchers work best when an application has regular
memory access patterns (called “stride patterns”: scanning an array, copying memory,
etc.) but are also able to prefetch complex memory access patterns (e.g., pointers
indirections used in object oriented programming). Current prefetchers rarely degrade
performance and can provide significant performance gains (for most applications,
activating the prefetcher results in a 5 to 15% increase in performance) [16].
1The meaning of “confidence” and its impact on the operations of the prefetcher is not clearly defined
in the processors’ documentations.
9

1.2. UNIFORM MEMORY ACCESS ARCHITECTURES (UMA)
1.2 Uniform Memory Access architectures (UMA)
1.2.1 Organization of UMA machines
Processors can be interconnected to the DRAM in multiple ways. The simplest
design consists in having a single memory controller to which all processors address
their memory requests. Using this design, all processors access all memory regions
with the same latency. This design is thus named Uniform Memory Access (UMA).
Figure 1.5 pictures a typical UMA machine with two 4-core processors. Both processors
share a bus to the DRAM.
Figure 1.5 – UMA. All processors share a single DRAM controller.
1.2.2 Limitations of UMA
In UMA machines, the bandwidth to the memory is limited by the bandwidth of
a single memory controller. Historically, the peak bandwidth of memory controllers
has grown much slower than the number of instructions per cycles that processors can
execute: since 1980, on average memory speed has increased by 10% per year while
processor speed has increased by 55% per year.
Current memory controllers can achieve a peak bandwidth of 17GB/s using DDR3
clocked at 266Mhz. This peak bandwidth is, in practice, not sufficient in many contexts.
If a processor sends more memory requests per second than the memory controller can
sustain, these requests are queued. As queues grow, so does the latency of memory
accesses. As seen in the previous sections, processors have tried to mask latencies of
memory accesses (e.g., using caches and prefetchers), but as the latency continues to
increase, it becomes more and more difficult to mask the costs of memory accesses.
This problem is known as the “memory wall” and has been extensively documented [17,
18, 19].
10

1.3 Non Uniform Memory Access architectures (NUMA)
1.3.1 Organization of NUMA machines
The goal of NUMA architectures is to increase the available bandwidth to the
DRAM. The key idea behind NUMA architectures is to have multiple memory con-
trollers. Cores in the machine are grouped into “nodes”; each node has its own memory
controller. Figure 1.6 pictures a NUMA machine with 8 cores grouped into 2 nodes. In
a NUMA machine, a core accesses memory controlled by the memory controller of its
node (“local memory”) directly. To access memory controlled by other memory con-
trollers (“remote memory”), the core has to send memory requests via the interconnect
links. This indirection, required to access remote memory, means that a core accesses
memory of its controller with a lower latency than that of other nodes. Because the
latency depends on the location of the memory accesses, this architecture is called “Non
Uniform” Memory Accesses (NUMA).
Figure 1.6 – NUMA. Cores are grouped into “nodes”. Each node has a DRAM
controller.
The maximum available bandwidth of a NUMA machine is the sum of the peak
bandwidth of each memory controller. On modern NUMA machines that only send
cache coherency messages when required, the maximum bandwidth can be achieved
when all cores access their local node. When all cores access their local node, no
cache coherency message is sent and the interconnect links are not used - thus avoiding
latencies or bandwidth limitations due to inter-node communications.
1.3.2 History of NUMA machines
One of the first successful commercial NUMA machines was the Honeywell Bull
XPS-100 released in the late 80’s. It could host between 2MB and 16MB of RAM that
were split in multiple memory banks. On such systems, the cost of a remote access was
13 times the cost of a local memory access (115 cycles vs. 9 cycles [20]).
NUMA machines in the early 90’s were mainly used in mainframes. NUMA only
appeared in personal computers in 2003 with the AMD Opteron family. Intel introduced
NUMA with the Nehalem family in 2007. Currently most processors produced for the
computer industry are based on a NUMA architecture. Processors used in embedded
11

1.4. CHARACTERISTICS OF THE NUMA MULTICORE MACHINES USED IN THE
EVALUATIONS
systems (e.g., smartphones) still mostly use UMA architectures, but will likely switch
to a NUMA architecture in the years to come [21].
1.4 Characteristics of the NUMA multicore machines used
in the evaluations
In this thesis, we evaluated NUMA effects and optimizations on 3 different ma-
chines. This section provides a detailed analysis of observable NUMA effects on
these machines. Table 1.2 summarizes the main characteristics of the 3 machines and
Figure 1.7 presents the topology of the 3 machines.
Machine A Machine B Machine C
Processor Family Opteron 8380 Opteron 6164 Opteron 6174
Processor Speed 2.5GHz 1.7GHz 2.2GHz
Number of4 4 8
NUMA nodes
Local Memory261 175 151
Access Latency (cycles)
Remote Memory 286 (1 hop)247
232 (1 hop)
Access Latency (cycles) 377 (2 hops) 337 (2 hops)
Memory controller7580MB/s 5850MB/s 6080MB/s
bandwidth
Interconnect technologyHT1 HT3 HT3
No HT Assist HT Assist HT Assist
Interconnect bandwidth
2850MB/s 4810MB/s 4590MB/s
(16-bit link) (16-bit link) (16-bit link)
2100MB/s 3830MB/s
(8-bit link) (16-bit link, 8 bits used)
2550MB/s
(8-bit link)
Table 1.2 – Main characteristics of the machines used in the evaluations.
1.4.1 Machine A - 16 cores, 4 nodes, HT1 links
Machine A has 4 AMD Opteron 8380 processors clocked at 2.5GHz with 4 cores
in each (16 cores in total) and 32GB of RAM. It features 4 memory nodes (each node
contains 4 cores and 8GB of RAM) interconnected with Hypertransport 1.0 links.
Table 1.2 summarizes the main characteristics of machine A. Machine A has the highest
local memory bandwidth of the three machines, but a low interconnect bandwidth.
Three cores are required to saturate their local memory controller. One core can saturate
an interconnect link. Because machine A does not use HT Assist, cache coherency
messages represent a significant portion of interconnect traffic (up to 15% on the studied
12

Figure 1.7 – Topology of the machines used in the evaluations. Some links in
machine C are unidirectional.
13

1.5. CHALLENGES INTRODUCED BY NUMA
applications). As pictured in Figure 1.7, nodes are partially connected (there is no direct
interconnect link between node 0 and node 3).
1.4.2 Machine B - 24 cores, 4 nodes, HT3 links
Machine B has 2 AMD Opteron 6164 HE processors clocked at 1.7 GHz with 12
cores in each (24 cores in total) and 48 GB of RAM. It features 4 memory nodes (i.e.,
6 cores and 12 GB of RAM per node) interconnected with Hypertransport 3.0 links.
Machine B has a low memory bandwidth, only 20% greater than interconnect links
bandwidth (see Table 1.2). One core is sufficient to saturate a local memory controller
or an interconnect link. As pictured in Figure 1.7, nodes are fully interconnected. Note
that the link between node 0 and 3 is an 8-bit link and that other links are 16-bit wide.
Experimentally, we measured that the bandwidth between node 0 and node 3 is 56%
smaller than that of other interconnect links.
1.4.3 Machine C - 48 cores, 8 nodes, HT3 links
Machine C has 4 AMD Opteron 6174 processors clocked at 2.2 GHz with 12 cores
in each (48 cores in total) and 256 GB of RAM. It features 8 memory nodes (i.e., 6
cores and 32 GB of RAM per node) interconnected with Hypertransport 3.0 links. As
for Machine B, Machine C use both 8-bit and 16-bit HT links; the bandwidth between
nodes varies from 2.5GB/s to 4.5GB/s (see Table 1.2). As pictured in Figure 1.7, nodes
are partially interconnected. The interconnect topology of Machine C is complex and
some links are unidirectional (e.g., sending data from node 3 to node 7 requires 2 hops
while sending data from node 7 to node 3 requires only 1 hop). One core is sufficient to
saturate a memory controller or an interconnect link.
1.5 Challenges introduced by NUMA
To maximize the usage of a NUMA machine, a developer has to minimize the
number of remote memory accesses and to make sure that the load is balanced between
memory controllers [5, 22, 23, 24, 25, 26, 27, 28]. In this section, we show on a set of
applications the impact of remote memory accesses and of memory controller contention
on performance. We use applications taken from the Parsec Benchmark suite [29],
from the NAS Benchmark suite [30], from the Metis Benchmark suite [31] and two
microbenchmarks (RandomRead and SequentialRead) that perform random reads to
the memory and sequential read to the memory respectively.
1.5.1 Remote access penalty
To measure the impact of remote accesses on performance, we run applications on
a node and force all of their memory to be either allocated on the local node or on a
remote node. We then compare the two execution times to measure the impact of remote
memory accesses on performance. To avoid contention effects on interconnect links and
memory buses, we run applications with only one thread. We verified experimentally
that applications were not saturating any interconnect link or memory bus.
14

0
20
40
60
80
100
Random
Read
SequentialRead
blackscholes
bodytrack
bt.B.x
bt.C.x
canneal
cg.B.x
cg.C.x
dedup
ft.B.x
ft.C.x
is.C.x
linearregression.sf
lu.B.x
matrixm
ult.sf
mg.B.x
mg.C
.x
pca.sf
sp.B.x
streamcluster
stringmatch.sf
swaptions
ua.B.x
ua.C.x
wc.sf
wr.sf
wrm
em.sf
x264
Pe
rfo
rma
nce
de
gra
da
tio
n d
ue
to
re
mo
te m
em
ory
acce
sse
s (
%)
machineAmachineBmachineC
Figure 1.8 – Impact of remote memory accesses on performance of various
applications.
Figure 1.8 shows the impact of remote memory accesses on performance on the
three machines presented in the previous section. Remote accesses penalty is on average
10%, with a maximum of 40%.
1.5.2 Contention on interconnects and memory buses
0
20
40
60
80
100
Random
Read
SequentialRead
blackscholes
bodytrack
bt.B.x
bt.C.x
canneal
cg.B.x
cg.C.x
dedup
ft.B.x
ft.C.x
is.C.x
linearregression.sf
lu.B.x
matrixm
ult.sf
mg.B.x
mg.C
.x
pca.sf
sp.B.x
streamcluster
stringmatch.sf
swaptions
ua.B.x
ua.C.x
wc.sf
wr.sf
wrm
em.sf
x264
Perf
orm
ance d
egra
dation
due t
o c
onte
ntion (
%)
machineAmachineBmachineC
Figure 1.9 – Impact of contention on performance of various applications.
To measure the impact of contention on performance, we run applications with as
many threads as the number of cores in the system. We compare the execution time of
each application in two configurations: (i) all memory allocated on a single node and
(ii) memory randomly placed and balanced between all nodes. The goal of this setup is
15

1.6. CLASSIC OPTIMIZATIONS ON NUMA MULTICORE MACHINES
to compare an experiment that puts the maximum possible contention on memory buses
(experiment i) with an experiment that puts the lowest possible contention on memory
buses (experiment ii). Note that the local access ratio between these two experiments
is theoretically the same, so performance differences are only due to the difference in
contention on memory nodes. Indeed, in a system with N nodes, in case (i), 1 node
accesses memory locally and N-1 nodes access memory remotely; if all nodes perform
approximately the same number of memory accesses, the local access ratio is 1/N. In
case (ii), when a thread performs a memory access, it has 1/N chance to perform a local
memory access (memory is randomly placed on all nodes).
Figure 1.9 shows the impact of contention on performance on the three machines
presented in the previous section. Contention penalty is on average 40%, with a
maximum of 90%.
1.5.3 Remote accesses versus contention
As Figures 1.8 and 1.9 show, on current hardware, contention on interconnects
and memory buses has a higher impact than remote memory accesses. This is not a
surprise considering the specifications of the studied machines: interconnect links and
memory buses have a low latency and a low bandwidth. Consequently, the impact of a
remote memory access is constant and “low”, while bandwidth of interconnects and
buses can easily be exceeded and create long waiting queues. For example, on machine
B, the cost of a remote memory access is constant (+72 cycles, 40% of the cost of a
local memory access) and 1 core can saturate a memory bus – so, when 24 cores are
accessing a memory bus at the same time, their bandwidth is divided by up to 24.
1.5.4 Differences with the NUMA machines used in the 80s
The main difference between current NUMA machines and NUMA machines built
in the 80-90’s is memory access latencies, and especially the difference between the
cost of a local access and a remote access. As we have seen in Section 1.3.2, the cost
of a remote memory access used to be 13 times the cost of a local access. On current
hardware, the cost of a remote memory access is less than 1.4 times that of a local
access, on all applications that we tested. Consequently, the impact of remote memory
accesses is less visible on current machines than it was in the 90’s.
On current machines, the main problem comes from contention. Contention could
also occur in the machines used in the 90’s, but it was not a major performance issue: if
contention occurred, it meant that the machine was doing remote memory accesses and
that the performance was already very low.
1.6 Classic optimizations on NUMA multicore machines
Multiple optimizations exist to avoid remote memory accesses and contention on
memory controllers. In this section we present the 5 main techniques used to optimize
applications on NUMA architectures. These techniques work on thread and memory
placement. For each technique, we explain how it can be used to optimize applications
on NUMA architectures and briefly describe some ways to implement it. For each
technique, we give insights on the situations in which the technique does and does
16

not apply. We conclude this section with a discussion on the difficulty to choose and
implement the best optimization.
1.6.1 Memory allocation
The simplest NUMA optimization consists in allocating data on the node from
which it will be the most accessed. This optimization works best when thread placement
is known in advance and memory accesses to allocated data are predictable. Memory
allocation is a static optimization: once a data has been allocated on a node, it stays on
the node. Memory allocation is unlikely to work well when threads migrate between
nodes or when data is accessed from multiple nodes.
The default allocation policy varies depending on the allocation library and the
operating system. For example, on Linux with the libc allocator, data is allocated on the
node from which it is first accessed. This heuristic guaranties that, if a thread allocates
data and continues to use it on the same node, then data will be accessed locally. To force
memory to be allocated on a node, a developer can use the numa_alloc_onnode
function, provided by the libnuma library. This function takes two arguments: the size
to allocate and the node on which to allocate the data.
Memory allocation works well on applications designed according to the no-sharing
principle. The key idea behind no-sharing is that data must be partitioned. When a
thread wants to access data located on a remote domain, it asks a thread located on the
remote domain to perform the work [32,33,34,35,36,37,38]. The no-sharing principle
eases the process of determining the “best” memory location for a given data, because
each data can only be accessed from one node. Note that the no-sharing principle is
challenging to implement because it requires a strict partition of functionalities and data
in the application. It is thus currently only used in a few applications.
1.6.2 Memory migration
Memory migration consists in migrating data on the node from which they are
the most accessed. Memory migration is a dynamic technique: the same data can be
migrated multiple times depending on the workload. Because migrating data from node
to node has a cost, memory migration works best on data that are accessed from a single
node during long periods of time. Memory migration is unlikely to work well on data
that are frequently accessed from different nodes.
Memory migration can be implemented in two ways: (i) by allocating a buffer of
memory on a specific node and copying the data in this buffer; this technique requires
updating all existing references to the data to point to the newly allocated buffer, or
(ii) by using system calls to migrate pages from a node to another node; this technique
is transparent from the application point of view (virtual addresses are unmodified)
but only works at the granularity of pages. To allocate a buffer on a specific node, a
developer can use the numa_alloc_onnode function. To migrate pages, a developer
can use the sys_migrate_pages system call.
17

1.6. CLASSIC OPTIMIZATIONS ON NUMA MULTICORE MACHINES
1.6.3 Memory interleaving
Memory interleaving consists in spreading memory randomly on multiple memory
controllers. Contrarily to other optimization techniques, memory interleaving does not
aim at improving memory locality but only at reducing memory controller contention.
Memory interleaving can be applied statically - by placing data randomly on nodes
during allocation - or dynamically - by periodically migrating memory to balance
load between memory controllers. Interleaving memory works best when a memory
controller is saturated. Because it can reduce locality, it often does not work on
applications that have a high memory access locality.
The OS can perform memory interleaving automatically. The numactl tool can
be used to this purpose. It is also possible to interleave memory of specific data using
the numa_alloc_interleaved function.
1.6.4 Memory replication
Memory replication consists in replicating data on multiple nodes and making sure
that threads access the replica located on their local node. When applicable, memory
replication provides optimal locality. Replication has an initial cost - the creation of the
replicas - and additional costs every time replicated data is written - because changes
must be propagated to all replicas. Consequently, replication works best on data that
are accessed read-mostly from multiple nodes.
Current unmodified operating systems do not support page replication. On an
unmodified kernel, a developer has to implement memory replication by hand. The
simplest way to implement replication is to allocate a replica on every node using the
numa_alloc_onnode function and protecting accesses to the allocated data using
reader/writer locks. Replication can be applied either statically by assigning a specific
replica to each thread or dynamically by choosing the correct replica every time a
memory access to the data is performed. To choose the correct replica dynamically, a
developer might rely on the getcpu system call to get the CPU and NUMA node on
which a thread is currently running.
1.6.5 Thread Placement
Thread placement consists in trying to place threads close to the data they are
accessing. Migrating a thread is costly and has many undesirable side effects (e.g., data
that were in cache have to be fetched again from memory). Thread migration also has
to be carefully controlled to avoid creating imbalance on CPUs (e.g., overloading a
CPU while leaving another CPU idle). So thread placement works best when threads
can be balanced on all cores close to their memory for long periods of time.
Threads can be pinned on a specific CPU or node using the
sched_setaffinity function.
1.6.6 Difficulty to choose and implement an optimization
Table 1.3 presents 5 memory access patterns and shows, for each memory access
pattern, the optimizations that make and do not make sense. We can see that no
optimization makes sense in all cases presented in the table. When faced with a NUMA
18

problem, a developer thus has to choose between optimizations. In order to choose
between these optimizations a developer has at least to know which data are accessed
remotely or are creating contention, if these data are accessed from multiple nodes
at the same time and if they are often modified. By looking at an application code,
it is not possible to know which data will be accessed remotely because applications
rarely control the placement of their threads and memory. It is also often impossible to
know if multiple threads access a data simultaneously: timing is notoriously hard to
understand in parallel applications. So, in the general case it is not possible to know,
just by looking at an application code, which optimization to choose. In chapter 3, we
explain why existing profilers do not provide enough information to choose between
optimizations.
Alloc. Migr. Inter. Repl.Thread
Plac.
Memory is accessed from 1 node X X X
Memory is accessed from multiple
nodes at different time intervals
X X X X
Memory is accessed from multiple
nodes at the same time
X X
Memory is often modified X X X X
Memory is accessed with a high lo-
cality
X X X X
Table 1.3 – Non-exhaustive list of workloads (lines) and NUMA optimizations
(columns). A tick means that the NUMA optimization may make sense for the
given workload.
1.7 Future architectures
Current multicore machines are NUMA. In this section we give insights on possible
evolutions of NUMA machines. We first explain how NUMA machines may evolve
as the number of NUMA nodes increase. Then we overview possible evolutions of
memory and processors and explain how works done for classical NUMA machines
could still apply on these new architectures.
1.7.1 Large scale NUMA systems
The current trend in multicore NUMA systems is to increase the number of cores
and the number of NUMA nodes. As the number of NUMA nodes increases, the
interconnect topology between these NUMA nodes is likely to change. For example, a
NUMA system with 512 nodes is unlikely to be fully interconnected (a full mesh would
require more than 260K interconnect links). The current solution used to build large
NUMA system (e.g., in super computers) is to use a fat-tree architecture. Figure 1.10
represents a 2-level fat-tree architecture. In fat-tree architectures, NUMA nodes are
clustered into super nodes; all nodes in a “super node” are interconnected via a router.
Super nodes are interconnected using high bandwidth interconnect links. On very
large-scale systems, like the Altix 512p, “super nodes” may even be clustered into
19

1.7. FUTURE ARCHITECTURES
Figure 1.10 – Fat tree architecture. NUMA nodes are interconnected via multi-
ples routers. Routers can be interconnected using high bandwidth interconnect
links.
“super node groups”, creating another hierarchy level. The advantage of fat-tree designs
is that high bandwidth links, that are costly and may have a high power consumption,
are only used for interconnect links that are the most likely to be used (links on “top”
of the fat-tree hierarchy).
Challenges in fat-tree based systems are similar to that of classical NUMA systems.
Memory accesses are still non-uniform and contention may occur on the interconnect
links of the bottom of the fat tree hierarchy or on memory controllers (e.g., if all nodes
access memory located on a single node). Fat-tree architectures also offer additional
challenges, compared to classical NUMA-based systems because of the interconnect
hierarchy between nodes. It is for example possible to do optimizations at the level of a
“super node” or at the level of “groups of super nodes” that would not make sense in
NUMA systems with a full mesh interconnect.
1.7.2 Possible evolutions of memory
As seen in section 1.3, memory speed has been growing more slowly than processors
speed for 20 years. Currently, the most promising approach to improve memory speed
comes from the Hybrid Memory Cube Consortium (HMCC) [39]. The key idea behind
the Hybrid Memory Cube is to stack multiple DRAM-dies in 3D. DRAM dies are
interconnected via a logic die that is in charge of routing requests between DRAM
dies. The peak bandwidth of interconnect links is 15Gb/s according to the specification
and current prototypes use 10Gb/s links. Current prototypes stack a maximum of 16
DRAM-dies, adding up to a maximum bandwidth of 160Gbs (20GB/s). To put this
figure in perspective, current DDR3 modules clocked at 266Mhz have a maximum
bandwidth of 17GB/s.
HMC is a promising approach to improve the bandwidth to the memory. According
to the specification, the maximum bandwidth of HMC could be up to 15 times the
bandwidth of a standard DDR3 module. That said, we believe that this improvement is
not sufficient to bring back UMA architectures. Indeed, current servers are built with 8
NUMA nodes, thus already achieving a peak bandwidth of 8 times the peak bandwidth
of DDR3. A single DRAM module that has a maximum bandwidth of 15 times DDR3
peak bandwidth is unlikely to be sufficient - even in the near future.
HMC could bring disparities in memory access latencies in the same memory chip.
Indeed, a HMC is composed of multiple DRAM dies that are interconnected with
low bandwidth links. Some workloads might introduce imbalance and contention on
interconnects inside the HMC. It will be interesting to see how works done in NUMA
20

machines apply inside a single HMC memory chip.
1.7.3 Possible evolutions of multicore processors
Since 2007, manycore processors have been presented to the research community.
In this section, we focus on 3 processors that, we believe, are representative of possible
evolutions of multicore processors: the Teraflops Research Chip and the Single-chip
Cloud Computer (SCC) presented by Intel in 2007 and 2009 and the TILE-Gx8072
processor released in 2011 by Tilera.
The Teraflops Research Chip is an 80-core processor. Cores are connected via
a 2D-torus (each core has 4 connections, 1 connection per neighbor). Memory is
directly integrated in the chip in order to reduce memory access latencies. Each core
is connected to one memory tile in the chip’s integrated memory. So, in a way, the
Teraflops Research Chip can be viewed as an embedded NUMA system: since each
core has a privileged access to a memory tile of the integrated RAM, memory access
latencies are non-uniform. The main difference lies in the memory access latencies:
because RAM is integrated in the chip, local accesses are much cheaper than that of
current NUMA machines and the difference between local and remote memory accesses
may be more important than in current NUMA machines.
The Single-chip Cloud Computer (SCC) and the Tilera TILE-Gx8072 processors
are very similar. The SCC is a 48-core processor and the TILE-Gx8072 is a 72-core
processor. Cores in the SCC are interconnected using a 2D-torus and cores in the TILE-
Gx8072 are connected using 5 independent mesh networks. In both processors, cores
are grouped into 4 nodes. Each node has its own memory controller. Both processors
can be seen as a 4 node embedded NUMA multicore machine.
All these processors raise problems than are already encountered in NUMA ma-
chines: the interconnect links between cores may be subject to contention and memory
accesses are non-uniform. However, optimizations in these processors are likely to
be more complex to implement, due to the complexity of the interconnect topology.
Indeed, a single interconnect link can be shared by a large number of nodes, even if
they are accessing different memory nodes. Solving contention problems with complex
interconnects is still an open issue.
1.7.4 GPGPU and accelerators
In addition to general-purpose multicore processors, machines also have co-
processors capable of doing general-purpose calculation. For example, since 2001,
graphic processing units (GPU) are able to perform general-purpose calculations using
shaders. Intel recently released the Intel MIC accelerator card, designed to speed
up calculations done in parallel algorithms. These accelerators communicate with
general-purpose multicore processors using the memory subsystem.
Memory management in accelerators introduces two main challenges: prefetching
memory on the accelerators before the accelerator actually needs it to minimize latency
(as it is the case with processor caches - except that on accelerators prefetching is done
manually and on larger scales) and avoiding to slow down memory accesses of general
purpose processors by limiting the traffic on the memory subsystem. Currently few
applications use these accelerators. These applications are generally manually tuned
21

1.8. CONCLUSION
for a specific architecture and run in controlled environments. It is currently difficult to
assess the impact that accelerators will have on performance of future NUMA systems.
Yet, we believe that some techniques used to detect and avoid contention and remote
memory accesses could still make sense on NUMA machines equipped with accelerators.
For example, a parallel can be drawn between remote memory accesses and expensive
communications between accelerators and main memory. Accelerators also open new
opportunities for optimizations that do not make sense in classical NUMA machines.
For example, it might be a good idea to put threads that communicate with accelerators
on the NUMA node that controls the accelerator to minimize communications latencies.
It will be interesting to see how these optimizations integrate with existing NUMA
optimizations.
1.8 Conclusion
In this chapter we have explained how memory is handled by current hardware. We
explained that machines went from UMA to NUMA to meet the increased memory
bandwidth needs of applications. We presented the challenges brought by NUMA and
classical optimizations used to overcome these challenges. We concluded with a brief
overview of possible evolutions of multicore machines and showed problems observed
in classical NUMA machines will likely be still present on these architectures.
22

2Contributions
In the previous chapter we have seen that NUMA machines are now mainstream
and are likely to continue being mainstream in the years to come. In this context, it is
increasingly important to understand and to improve the performance of applications
running on NUMA machines. We found out that developers were missing appropriate
tools to perform these tasks. The first contribution of this thesis addresses this issue: we
present MemProf, the first NUMA profiler allowing the capture of interactions between
threads and objects. Then we found out that no existing dynamic memory management
algorithm was able to address contentions issues detected using MemProf. The second
contribution of this thesis addresses this second issue: we present Carrefour, the first
dynamic memory management algorithm that aims at reducing contention on NUMA
machines. In this chapter, we briefly introduce these two contributions.
2.1 MemProf
Application-level optimization techniques suffer from a significant shortcoming: it
is generally difficult for a programmer to determine which technique(s) can be applied
to a given application/workload. Indeed, as we show in Chapter 4, diagnosing the
issues that call for a specific application-level technique requires a detailed view of the
interactions between threads an memory objects, i.e., the ability to determine which
threads access which objects at any point in time during the run of an application, and
additional information such as the source and target nodes of each memory access.
However, existing profilers like OProfile [40], Linux Perf [41], VTune [42] and Mem-
phis [43] do not provide this required information. Some of them are able to provide
this information in the specific case of global static memory objects but these objects
often account for a negligible ratio of all remote memory accesses. As an example,
for the four applications that we study in Chapter 5, global static memory objects are
involved in less than 4% of all remote memory accesses. For other kinds of objects,
the only data provided by existing profilers are the target memory address and the
corresponding program instruction that triggered the access.
23

2.2. CARREFOUR
In Chapter 4, we present MemProf, the first profiler able to determine the thread
and object involved in a given remote memory access performed by an application.
MemProf builds temporal flows of the memory accesses that occur during the run of
an application. MemProf achieves this result by (i) instrumenting thread and memory
management operations with a user library and a kernel module, and (ii) leveraging
hardware support from the processors (Instruction-Based Sampling) to monitor the
memory accesses. MemProf allows precisely identifying the objects that are involved
in remote memory accesses and the corresponding causes (e.g., inefficient object
allocation strategies, saturation of a memory node, etc.). Besides, MemProf also
provides additional information such as the source code lines corresponding to thread
and object creations and destructions. MemProf can thus help a programmer quickly
introduce simple and efficient optimizations within a complex, and unfamiliar code
base. We illustrate the benefits of MemProf on four case studies with real applications
(FaceRec [44], Streamcluster [45], Psearchy [46], and Apache [47]). In each case,
MemProf allowed us to detect the causes of the remote memory accesses and to
introduce simple optimizations (involving less than 10 lines of code), and thus to achieve
a significant performance increase (the gains range from 6.5% to 161%). We also show
that these application-specific optimizations can outperform generic heuristics.
2.2 Carrefour
Some of the memory optimizations found using MemProf could be done automati-
cally by a NUMA-aware kernel. Previous works on NUMA-aware memory placement
focused on maximizing locality of accesses and ignored contention issues. However, as
we found out in Chapter 1, current NUMA machines suffer more from contention than
from remote memory access latencies. This motivates the need for a new NUMA-aware
memory placement algorithm, that we call Carrefour. We looked at the problem from
a new perspective: Carrefour first tries to decrease contention on memory buses and
interconnect links and then tries to improve the locality of memory accesses.
Carrefour relies on multiple classic optimizations presented in Chapter 1 to limit
contention. In order to choose between these optimizations, Carrefour relies on ob-
servations made using hardware support from the processors (Hardware Counters and
Instruction Based Sampling). Implementing these observations efficiently on current
hardware presents several challenges because current hardware facilities cannot provide
accurate observations with a low overhead.
We implemented Carrefour as an addition to Linux and evaluated it with multiple
applications taken from the Parsec Benchmark suite [29], from the NAS Benchmark
suite [30], and from the Metis Benchmark suite [31]. Carrefour improves performance
of these applications by up to 3.6× and never hurts performance by more than 4%.
Moreover, Carrefour constantly outperforms other existing NUMA-aware memory
placement algorithms.
24

Part I
MemProf - Profiling memory
accesses on NUMA multicore
machines
25


3Existing profiling techniques
Contents
3.1 Hardware profiling facilities . . . . . . . . . . . . . . . . . . . 28
3.1.1 Hardware counters . . . . . . . . . . . . . . . . . . . . . 28
3.1.1.1 Description . . . . . . . . . . . . . . . . . . . 28
3.1.1.2 Format of Hardware Counters on AMD processors 29
3.1.1.3 Undocumented bugs on AMD processors . . . . 30
3.1.2 Instruction Based Sampling (IBS) . . . . . . . . . . . . . 31
3.1.2.1 Description . . . . . . . . . . . . . . . . . . . 31
3.1.2.2 Overhead of IBS . . . . . . . . . . . . . . . . . 31
3.1.2.3 Difference between HWC and IBS . . . . . . . 32
3.1.3 Precise Event Based Sampling (PEBS) . . . . . . . . . . 32
3.1.4 Lightweight profiling (LWP) . . . . . . . . . . . . . . . . 33
3.1.5 Hardware breakpoints . . . . . . . . . . . . . . . . . . . 33
3.2 Software profiling facilities . . . . . . . . . . . . . . . . . . . . 34
3.2.1 Tracing . . . . . . . . . . . . . . . . . . . . . . . . . . . 34
3.2.2 System Monitors . . . . . . . . . . . . . . . . . . . . . . 35
3.2.3 Cycle accurate simulators . . . . . . . . . . . . . . . . . 36
3.2.4 Accessed bit . . . . . . . . . . . . . . . . . . . . . . . . 36
3.3 Determining the impact of memory on an application . . . . . 36
3.3.1 Impact of the speed of memory accesses . . . . . . . . . . 37
3.3.2 Is an application accessing memory locally? . . . . . . . . 38
3.3.3 Is an application creating contention? . . . . . . . . . . . 38
3.4 Existing profilers . . . . . . . . . . . . . . . . . . . . . . . . . . 40
3.5 Limitations of existing profilers . . . . . . . . . . . . . . . . . . 42
3.6 Conclusion . . . . . . . . . . . . . . . . . . . . . . . . . . . . . 43
27

3.1. HARDWARE PROFILING FACILITIES
In this chapter, we describe existing profiling techniques used in NUMA multicore
machines. We first describe hardware and software techniques used to collect raw
data about the execution of applications (e.g., the number of cache misses). Then we
explain how existing profilers use these raw data and we explain how a developer might
use existing profilers’ outputs to analyze the behavior of their applications. We then
present a generic workflow that allows detecting that an application suffers from NUMA
effects. We then try to analyze an application that suffers from NUMA effects using
existing profilers and show that they do not provide sufficient information to choose
and implement an optimization.
3.1 Hardware profiling facilities
Modern processors embed multiple profiling facilities. In this section, we focus on
5 main available hardware-profiling facilities: hardware counters, hardware breakpoints,
Instruction Based Sampling, Precise Event Base Sampling, and Lightweight Profiling.
These facilities can be used to report information about the execution of instructions or
about embedded hardware features (e.g., the prefetcher).
3.1.1 Hardware counters
3.1.1.1 Description
Modern processors have a set of specialized registers dedicated to counting
hardware-related events. Hardware Counters registers are incremented every time
the event they monitor occurs.
Modern processors support hundreds of different hardware events [48]. These
events can be used to count basic hardware events (e.g., the number CPU clocks, the
number of cache misses, or the number of prefetch attempts done during a lapse of
time) or to dig up very precise information (e.g., the MOESI state of accessed cache
lines).
On Opteron and Bulldozer processors, there are two main types of hardware events:
“oncore” events and “offcore” events. Oncore events correspond to events that happen
inside a core, e.g., operations in the ALU or FPU, L1 or L2 accesses. Offcore events
correspond to events that happen outside a core: operations on the L3 and main memory,
operations done by the node prefetcher, etc. On Opteron processors, each core contains
4 hardware counter registers. These registers can be used to monitor all oncore and
offcore events. When an oncore event occurs, only hardware counter registers of the
core on which the event occurred are incremented. When an offcore event occurs, one
or multiple hardware counters of the node on which the event occurred are incremented.
Because the number of hardware counters that are incremented is not defined by the
specification (and actually varies from run to run), it is recommended that only one core
per node monitor a specific offcore event. The number of hardware counter registers
varies depending on the processor family. For example, Bulldozer processors have 6
28

counters per core that can only count oncore events and 4 counters per node dedicated
to offcore events.
These registers can be configured to generate an interrupt every time their value
exceeds a configurable threshold. Using this feature, it is for example possible to
generate an interrupt every 100K cache misses. When the interrupt is generated, values
in registers are saved and can be accessed by the interrupt handler. Special care must
be taken when analyzing the content of registers. Indeed, when the interrupt handler
is executed, registers may contain values of instructions that were executed before of
after the instruction that triggered the interrupt (this phenomenon is know as skid).
The skid is due to the fact that modern processors execute multiple instructions out
of order and in parallel. In practice, the skid is limited to +/- 2 instructions in AMD
Opteron and Bulldozer processors. The skid is not a problem when a developer wants
to find out which functions are generating a certain type of events because all the
instructions included in the skid are likely to belong to the same function. However, the
skid prevents developers from doing detailed analysis of instructions behavior because
values in register may correspond to values written by instructions that are different
from those which triggered the interrupt.
Per node Hardware Performance Events are even more limited than per core events
and can only be used to provide a general overview of the system performance. Even
though they might be configured to trigger interrupts, they cannot be used to provide
detailed analysis of thread or function behaviors. It is for example impossible to know
which functions do remote memory accesses using hardware counters. The reason
is that these events are monitored at the node level and interrupts are generated on a
random core of the node. The consequence is that the interrupt handler may be executed
on a core that is not responsible for the interrupt (e.g., not the core that did a memory
access). Thus the register values saved by the interrupt handler may not correspond to
the instruction that is responsible for the interrupt.
Most profilers use Hardware Performance Counters in sampling mode, e.g., Perf,
Oprofile, VTune and AMD CodeAnalyst. These profilers report the applications, the
functions or the instructions that triggered the most interrupts during the profiling
session (for the instructions, the analysis might be difficult to do, due to the skid,
as seen before). Some profilers use performance counters in counting mode [49] to
provide overviews of the system performance and detect anomalies with a low overhead.
These profilers watch “vital signs” of the system (e.g., the IPC) and only try to perform
detailed analysis when unexpected evolutions of these “vital signs” occur (e.g., a sudden
increase in the IPC might indicate a locking issue).
3.1.1.2 Format of Hardware Counters on AMD processors
Hardware counters are configured by writing into special registers called MSRs. In
this subsection we briefly describe the binary format of these MSRs. Understanding the
binary format of MSRs used by Hardware Counters is important because MSR values
often have to be passed as arguments to profilers. For example, Perf allows a developer
to monitor any hardware event using the -e rXXXX switch, where XXXX is the value
that Perf will write in the MSR.
On AMD processor, events are encoded with 3 hexadecimal digits E1E2E3. Some
events can be refined to count a subset of what they are normally counting using a unit
29

3.1. HARDWARE PROFILING FACILITIES
mask encoded with 2 hexadecimal digits U1U2. For example, table 3.1 presents the
impact of the unit masks on what event 1E0 is counting.
Unitmask Description
0x80 From Local node to Node 7
0x40 From Local node to Node 6
0x20 From Local node to Node 5
0x10 From Local node to Node 4
0x08 From Local node to Node 3
0x04 From Local node to Node 2
0x02 From Local node to Node 1
0x01 From Local node to Node 0
Table 3.1 – Event 1E0 counts memory accesses done from the monitoring node
to others nodes. The destination nodes are controlled using the unit mask. When
set to 00, the event counts nothing. When set to 01, the event only counts memory
accesses from the monitoring node to node 0. When set to FF, the event counts
memory accesses from the monitoring node to all other nodes.
The binary format of MSR on AMD processors is the following: the first hex digit
of the event has to be written to bits 36-39 of the MSR and the second and third digits
have to be written to bits 0-7. The unit mask has to be written to bits 8-15. So, for
example, the event 1E0 with a unit mask of FC is encoded as follows: 100000FCE0.
3.1.1.3 Undocumented bugs on AMD processors
Some events on AMD Opteron and Bulldozer processors are not properly counting
what is described in the documentation. In this subsection, we describe two of the main
undocumented bugs of HWC on AMD machines. We document these bugs because a
developer might want to use these events to understand NUMA issues.
Latency of memory accesses. On some machines, the latency of local memory
accesses is not properly counted. Instead of counting the number of cycles spent waiting
for memory, the hardware counter counts the number of unhalted cycles. No fix exists.
The latency of remote memory accesses is correct on all AMD processors that we have
tested, so it is still possible to get an idea of memory latencies by only monitoring the
latency of remote memory accesses (this can be achieved using proper unit masks for
the latency events).
Counting the number of memory accesses. AMD machines offer multiples
events to count the number of memory accesses: L3 cache misses (event 4E1), CPU to
DRAM requests (event 1E0), DRAM accesses (event E0) and CPU requests to Memory
(event E9, unit masks A8 and 98). Event 1E0 is the most precise event because it
allows precisely understanding the traffic between any pair of two nodes (see Table 3.1).
Unfortunately, event 1E0 is “over counting” memory accesses: on most applications,
the number of “memory accesses” seen using event 1E0 is roughly 3 times greater than
what it should be (e.g., on a memory benchmark, calculating the memory bandwidth
using this event gives 3 times the bandwidth that the benchmark is actually achieving).
30

We found that this “over counting” effect is due to two main hardware features: the
prefetcher and HT Assist. When disabling the prefetcher and HT Assist, event 1E0
is not over estimating the number of memory accesses anymore. The “over counting”
effect is not due to actual memory traffic. Rather, it seems that event 1E0 is counting
cache probes due to the prefetchers and HT Assist even though these probes are not
transmitted to the DRAM. Note that, even though event 1E0 is overestimating the
number of memory accesses, it is overestimating them in the same way on all nodes of
the system; it is thus still possible to use event 1E0 to compute the local access ratio of
applications or to compute the imbalance of memory accesses between nodes.
3.1.2 Instruction Based Sampling (IBS)
3.1.2.1 Description
Instruction Based Sampling is a hardware feature introduced by AMD Opteron
processors. When IBS is active, the processor randomly tags instructions that it ex-
ecutes. When a tagged instruction retires, the processor generates an interrupt and
provides detailed information about the execution of the instruction. Table 3.2 presents
a summary of the main information that IBS provides on tagged instructions. IBS
mainly provides information on the data that are accessed by tagged instructions, e.g.,
linear and physical addresses and the level of cache in which the data was found (if it
was found in cache).
Name Description
IbsDcL1TlbMiss True if the memory access induced a L1 TLB miss
IbsDcLinAd The virtual address of the data
IbsDcPhysAd The physical address of the data
NbIbsReqSrc The level of cache in which the data was found
IbsDcMissLat If the data was not found in cache, the latency of the memory access
Table 3.2 – Information provided by IBS on a tagged instruction.
IBS was first designed to help AMD improve the performance of their processors,
but is currently used by many profiling tools. Perf uses IBS as a replacement for
Hardware Performance Counters for some events when it is configured in “precise
mode”. For example, in “precise mode” Perf [41] uses IBS to report instructions that
miss in L2 cache. The mode is called “precise” because IBS has no skid. Perf and
Memphis also use IBS to find which global static objects miss in cache or are accessed
remotely. DProf uses IBS to find kernel objects that miss in cache.
IBS has two main limitations: (i) a high overhead and (ii) it only tags instructions
and ignores work done in background by hardware components (e.g., prefetchers). We
describe these two limitations in the next subsections.
3.1.2.2 Overhead of IBS
Current implementations of IBS do not include any hardware filtering facility (e.g.,
it is not possible to generate an interrupt only for instructions that miss in cache) so,
when a developer is interested in rare events (e.g., instructions that found their data
31

3.1. HARDWARE PROFILING FACILITIES
0
5
10
15
20
25
30
0 1e-05 2e-05 3e-05 4e-05 5e-05 6e-05 7e-05
Overh
ead (
%)
IBS frequency
Overhead of IBS IBS Frequency Overhead (%)
1 / 131K 0
1 / 90K 1.25
1 / 66K 4
1 / 37K 10
1 / 25K 15
1 / 16K 25
Figure 3.1 – Overhead of IBS, depending on IBS sampling frequency, with the
simplest IBS interrupt handler possible.
in a remote L1 cache), he may have to configure IBS to tag instructions with a high
frequency in order to have enough sample to do a meaningful analysis.
The overhead of IBS comes from (i) the cost of the interrupts and (ii) reading MSRs
to get information on the tagged instructions. Interrupts have direct and indirect costs.
Direct costs come from setting the processor in the “right condition” to handle the
interrupt: saving registers and fetching the interrupt handler code from caches or from
memory. The direct cost of an interrupt varies between 200 and 2000 cycles. Indirect
costs come from processor caches and pipelines pollution. Indirect costs are difficult
to estimate and depend on the application. Soares et al. [50] have shown that indirect
costs can have up to 3 times more impact on performance than direct costs of interrupts.
Reading MSRs has a cost of 350 cycles. IBS sets 7 registers per tagged instruction,
so the maximum overhead due to reading MSRs is 2450 cycles. Figure 3.1 presents
the overhead of IBS with an interrupt handler that reads the 7 IBS registers and exits.
The overhead is calculated with an application that increments a counter. We count the
time required by the application to perform 1 billion increments. We vary the period of
sampling (i.e., the number of instructions executed between every 2 interrupts). As we
can see, the overhead grows linearly with the sampling frequency.
3.1.2.3 Difference between HWC and IBS
The second and perhaps most important limitation is that IBS only works on retired
instructions and completely ignores work done in background by the processor. For
example, it is impossible to monitor memory accesses done by the prefetcher, cache
coherency messages, or even work done by instructions that do not retire (i.e., instruc-
tions that were executed speculatively in mis-predicted branches). HWC monitors work
done in background by the processor, thus observations made using IBS are sometimes
different from that made using HWC.
3.1.3 Precise Event Based Sampling (PEBS)
Precise Event Based Sampling (PEBS) is an extension of Hardware Performance
Counters that is only available on Intel processors [51]. HWC and PEBS are configured
and work in the same way. The main difference between HWC and PEBS is that PEBS
32

has no skid; a PEBS counter can thus be considered as a precise Hardware Performance
Counter. PEBS is currently only available on a subset of HWC events.
Because PEBS has no skid, the information present in registers when the interrupt
handler is triggered can be used to find important information about the execution
of an application. For example, by combining the content of registers with a binary
disassembly of the application, it is possible to know which virtual addresses are
accessed by the application1. If the PEBS register is configured to monitor cache
misses, it is thus possible to know which virtual addresses miss in cache. PEBS has
some limitations. In particular, as IBS, PEBS can only track events that are directly
induced by an instruction; if a memory access is due to the prefetcher, it cannot be
accounted for by PEBS.
PEBS is used by many profilers in place of HWC to provide more accurate profiling
results. For instance, Perf uses PEBS when the “precise” switch is active. VTune also
uses PEBS when the processor supports it.
3.1.4 Lightweight profiling (LWP)
Lightweight Profiling (LWP) is an extension of AMD processors that aims at
providing the same level of details as IBS with less overhead. To reduce overhead, LWP
relies on two main techniques: (i) a ring buffer, managed by the hardware, that is used
to store information about tagged instructions; interrupts are only sent when the buffer
is full, and (ii) filters; LWP allows developer to specify filters (e.g., a filter that allows
only monitoring instructions that miss in cache).
The LWP ring and LWP operations are manipulated using special instructions.
These instructions can be used in user mode, so LWP can be entirely controlled by an
application without any kernel support2.
Currently, LWP is not fully implemented in Hardware. It only stores basic informa-
tion about instructions being executed (the instruction pointer and a timestamp) and
filters are not implemented. In theory, LWP could be used in all profilers that use IBS
to provide the same information with less overhead.
3.1.5 Hardware breakpoints
Processors can be configured to generate an interrupt every time a load or a store
is performed on a range of virtual memory addresses. These interrupts are configured
using Hardware Breakpoint Registers. Modern processors usually have 4 Hardware
Breakpoint Registers. These registers are configured to monitor read or writes but not
both at the same time. Consequently, 2 registers are required to monitor all memory
accesses done on a virtual memory range.
The maximum size of the range of virtual addresses that a processor can monitor
depends on its family. Itanium processors let the system configure the beginning and
the end of the virtual address range. It is thus possible to generate an interrupt for
1A binary disassembly is required because virtual addresses accessed by instruction can be stored in
any general purpose register; only a disassembly of the binary indicates which registers are used by an
instruction to perform a load or a store2The kernel only needs to set a bit in a MSR register to allow LWP profiling. This can be done during
the kernel initialization.
33

3.2. SOFTWARE PROFILING FACILITIES
any range of virtual memory. Intel and AMD i386 and x86_64 processors are less
flexible and enforce a fixed range size equal to the size of a line of cache (64B). Because
of the limited number of register and because of the small range size, on i386 and
x86_64 machines, few profilers use Hardware Breakpoint Registers. These registers
are used in debuggers. Typical use of these registers include generating an interrupt
every time a variable is accessed (to track dependencies or to help understand complex
parallel access patterns), or checking accesses on some arrays’ boundaries (an interrupt
is generated when the application does a memory access on the cache lines located
before or after the array boundaries). Hardware Breakpoints usually induce a high
overhead when they are used on memory regions that are frequently accessed. Indeed,
an interrupt is generated on every access (even if the data is in cache).
Currently, the only profiler that uses Hardware Breakpoint Registers is DProf [12].
DProf uses Hardware Breakpoint Registers to monitor accesses done on specific kernel
structures. DProf only considers accesses done to one field of the monitored structure
at a time, so an application has to be launched multiple times to track accesses done to
different fields of a structure.
3.2 Software profiling facilities
In the previous section, we have presented hardware facilities that are used to help
understand applications’ performance. In this section, we present software techniques
that can be used to achieve the same goal. First, we present tracing tools that allow
developers to add code in existing binaries. Then, we present system monitors that
output statistics maintained by the kernel. Then, we present cycle accurate simulators
that can be used to simulate and understand hardware issues. We finally present the
“accessed bit” method that allows developers to find out which memory pages are
accessed by applications.
3.2.1 Tracing
The simplest software-based way to profile an application in software is to add trace
points (probes) in key functions of the application and of the kernel. A trace point adds
some monitoring logic to a function, e.g., it can record the number of times the function
is called, the total time spent in the function or code paths that lead to the function.
Trace points can be statically compiled in an application or dynamically added during
the execution of the application. Typical usages of trace points are monitoring time
spent in locks or finding code paths that lead to deadlocks or abnormally long critical
sections.
Trace points have many advantages: they often have little overhead and only impact
functions that the developer wants to trace. However, tracing is only relevant to analyze
precise portion of an application (e.g., a function or a lock): tracing all function calls
adds overhead and trace outputs are likely to be difficult to analyze.
Tracing can be done at the application level or at the kernel level. Current Linux
kernels are shipped with many tracing facilities. The easiest tracing tool to use is the
Perf Software Event subsystem. The Software Event subsystem counts functions calls
in the important parts of the kernel (e.g., it counts the number of page faults or the
34

number of context switches). Software Events are implemented to mimic the behavior
of Hardware Performance counters, and are used in Perf exactly as Hardware Counters:
an interrupt can be generated when the Software Event counter reaches a threshold
(“sampling mode”) and counters can be read using Perf syscalls as usual Hardware
Counters (“counting mode”). Beside Software Events, the kernel offers a wide range of
powerful tracing utilities. SystemTap [52], for example, allows a developer to insert
code at any location in the kernel. SystemTap inserts trace points dynamically in the
kernel by replacing the code that the kernel is executing (hot code swapping). Other
tracing tools like ptrace can also be used to track system calls and to gather system
calls arguments.
Pin [53] is a dynamic binary instrumentation tool: Pin adds functions (hooks) inside
any compiled binary according to rules defined by the developer. Pin dynamically adds
the hooks when the binary is loaded in memory, so no recompilation of the program is
required. Pin can be used as a classical tracing tool, but Pin also works at the instruction
level: rules can be defined on the instruction level (assembly code) or at the function
level. Using Pin, it is for example possible to count the number of load vs. the number
of stores executed by an application to compute the read/write ratio of the application.
In order to do that, a developer creates a rule that states that a “counting function”
should be called before each load and that another “counting function” should be called
before each store. At the end of the execution, the developer can compare the number
of times the “load counting function” has been called to the number of times the “store
counting function” has been called to compute read/write ratio of the application.
Pin is a powerful tool, but has some limitations. The first limitation is its overhead.
Pin adds approximately 30% overhead when it runs with an empty hook [54]. The
overhead grows with the number of hooks and the complexity of these hooks. Complex
hooks located in code path that are frequently used can easily add a 100x overhead to
the profiled application. The second limitation is that Pin does not take into account the
hardware. It is for example impossible, using Pin rules, to consider only instructions
that create cache misses.
3.2.2 System Monitors
System monitors are tools that are used to report the load of various components of
the machine, like the CPU load, the disks load or the network load. These tools usually
use statistics collected by the kernel (for example, the CPU load can be calculated by
computing the ratio of time occupied by the idle process).
The most used system monitor is the sar (System Activity Report) tool available
in most Linux and Solaris distributions. Sar reports global statistics on the system usage.
It can be used to monitor most important parts of the kernel or to get precise statistics
about I/Os (e.g., number of packets sent per second, type of the packets, average size
of the packets). Sar only reports statistics at the machine or CPU level. To get usage
statistics at the process level, a developer can use more specific tools like iotop
or disktop to visualize I/Os done by processes and to correct abnormal processes
behaviors. Some tools like latencytop can also be used to visualize abnormal
latencies in I/Os or locks per process.
35

3.3. DETERMINING THE IMPACT OF MEMORY ON AN APPLICATION
3.2.3 Cycle accurate simulators
A cycle accurate simulator is an application that simulates a complete machine
accurately. A cycle accurate simulator can be used to predict and to understand the per-
formance that an application would get on the simulated machine. The main advantage
of running an application on a cycle accurate simulator is that every single performance
issue can be tracked down to its root cause. Indeed, contrarily to a real machine that
only offers a handful of hardware counters to monitor its state, in a simulator it is
possible to monitor every single component of the simulated machine.
Cycle accurate simulators are thus powerful tools to understand the behavior of
an application. They are however rarely used. The main reason is that cycle accurate
simulators are notoriously hard to configure: every single aspect of the simulated
machine has to be taken into account to provide accurate results (e.g., the algorithms
used by the prefetcher or the algorithms used by the branch predictors which, most of
the time, are not publicly available). Most of the time it is not possible to configure the
simulator accurately using only documentation provided publicly by hardware vendors.
The second limitation of cycle accurate simulators is their overhead. Applications
running in a simulator usually run hundreds of time more slowly than application
running on bare metal.
3.2.4 Accessed bit
The accessed bit method is an hybrid approach that relies on the software and
the hardware to monitor accessed pages. The name “accessed bit” comes from the
“accessed bit” present in the page table: when the hardware accesses a memory page, it
sets the “accessed bit” of the page’s TLB entry to 1. The accessed bit is normally used
in LRU algorithms to swap pages that were not accessed recently, but can also be used
to track - in a coarse grain manner - accesses to pages.
The “accessed bit” method works as follow: (i) a daemon periodically resets the
accessed bit of all pages to 0 and after a short period of time (ii) the daemon scans
all pages and maintains statistics on all pages that were accessed since step (i). If the
daemon runs frequently enough, it is possible to compute statistics on page accesses.
This method has some limitations. First, the precision of the method depends on the
frequency of the scans. Since the scanning requires parsing all entries of all page tables,
it has a huge overhead when ran too frequently [55]. Second, this method is very coarse
grain, because it only identifies accesses at the page level. Third, it is not possible to
know which thread or which cores accessed the page during the time period, and if
the accesses to the page were resolved in cache or in memory. Thus, the “accessed bit”
method can only be use to compute coarse grain statistics about the “hotness” of pages.
3.3 Determining the impact of memory on an application
As we have seen in the previous section, a developer can use many software and
hardware profiling facilities to analyze applications. In this section, we first present
coarse grain techniques to see if an application is impacted by the speed of its memory
accesses (i.e., to understand if an application is impacted by contention or by the locality
of its memory accesses). Indeed, some application do very few memory accesses and
36

are not impacted by NUMA effects; it is best for a developer to check that an application
might be limited by its memory accesses before trying to perform any complex profiling.
Then we show how to profile DRAM accesses. We first show how to measure the
local access ratio of an application and then how to check if an application is creating
contention. Out of the 12 studied profiling facilities, only 4 can be used to try to
understand the impact of DRAM accesses on application: hardware counters, IBS,
LWP, PEBS and cycle accurate profilers. Indeed, hardware breakpoints and most
software approaches are not able to report any information about the type of memory
accesses an application is doing (i.e., they cannot distinguish an access done in cache
and an access done in DRAM).
3.3.1 Impact of the speed of memory accesses
Before starting to profile an application, a developer often wants to be sure that the
application is impacted by the speed of its memory access. The easiest way to know
if an application is impacted by the speed of its memory accesses is to compare the
performance of the two following setups:
• In the first setup, all threads of the application are located on one node and the
application allocates its memory locally. This can, for example, be achieve using
the following command line:
numactl --cpunodebind=0 --membind=0 <application>
• In the second setup, all threads of the application are located on one node and
the application allocates its memory remotely. This can, for example, be achieve
using the following command line:
numactl --cpunodebind=0 --membind=1 <application>
If the application performs better in the first setup than in the second setup, then
the application is impacted by the speed of its memory accesses. Indeed, in the second
setup, all memory accesses done by the application are done remotely so, on average,
all memory accesses of the second setup are 20% slower than that of the first setup.
If it is not possible to run the application using the previously described setups, a
developer can also measure the number of “Memory Accesses done Per Instruction”
(MAPI) of the application. If the MAPI is “high”, then the application is likely to be
impacted by the speed of its memory accesses; usually a MAPI over 0.005 is considered
“high” [56]. In order to compute the MAPI of an application, a developer can use the
Perf profiler as follows:
perf stat
-e r100000FFE0,rC0
<application>
Perf will report the number of memory accesses (event 100000FFE0) and the
number of instructions (event C0) done by the application. The MAPI is calculated by
dividing the number of memory accesses by the number of instructions.
37

3.3. DETERMINING THE IMPACT OF MEMORY ON AN APPLICATION
3.3.2 Is an application accessing memory locally?
If an application is impacted by the speed of its memory accesses, then a developer
might want to compute the local access ratio (LAR) of the application. If the LAR is
not 100%, then the application might be limited by the extra latency added by remote
memory accesses.
The local access ratio of an application can be calculated using the Perf profiler as
follows:
perf stat -e rA8E9,r98E9 <application>
Perf will report the number of local memory accesses (event A8E9) and the number
of remote memory accesses (event 98E9) done by the application. The LAR is calcu-
lated by dividing the number of local memory accesses by the total number of memory
accesses:#A8E9
(#A8E9+#98E9)with #XXXX representing the number of samples of event XXXX reported by Perf.
3.3.3 Is an application creating contention?
As we have seen in Section 1.5.3, contention is the main memory effect that can
degrade performance. Contention occurs when a memory bus or an interconnect link
operates at its maximum capacity.
AMD processors are interconnected using Hypertransport links. Each processor
has up to 6 Hypertransport links and each Hypertransport link can be subdivided into 2
sublinks. So, contention can appear on 1 of the 12 Hypertransport links of all processors.
The following command can be used to measure the load of the two sublinks of the first
Hypertransport links of all processors:
perf stat -A
-C ‘numactl --hardware | grep cpus | awk ’{print \$4}’ |
paste -s -d,‘
-e r1ff6,r17f6,r9ff6,r0x97f6
<application>
The load of the sublink 0, for all nodes, is computed as follows:
1−#17f6
(#17f6+#1ff6)The event 17F6 counts the number of NOP packets transmitted on the sublink 0 of link
0 and the event 1FF6 counts the total number of packets transmitted on the sublink 1
of link 0. NOP packets are transmitted when the sublink is idle. Because all packets
have the same size, it is possible to compute the load of the sublink by computing the
ratio of NOP packets over the total number of packets transmitted on the link. Note
that the Perf command is a bit more complex than the command used to compute the
LAR. The reason is that we want to have profiling results per node and not a global
average. The -A switch tells Perf to output the number of samples per CPU. And
because Hypertransport links are “per node components”, the command only starts
profiling on one CPU per node (-C switch that takes a list of CPUs as argument).
The same computation can be done to measure the load on the sublinks of the
Hypertransport links 1, 2, 3, 4 and 5 of all processors. Note that the maximum usage of
38

a sublink is not always 100%. The maximum usage depends on the processor family
and the width of the Hypertransport links. To measure the maximum usage of a link,
the easiest solution is to run the above profiling while running a memory benchmark
that makes all its memory accesses via the link that needs to be monitored. The link
usages observed using this benchmark can be used as the “maximum usage” values of
the links.
Measuring the load of a memory bus is trickier. To measure the load of a memory
bus, we count the number of 32-byte and 64-byte packets that transit through a memory
bus. We then multiply the number of packets by their size and compare the value to
the maximum bandwidth achievable by the bus. To get the number of 32- and 64-byte
packets that transit through a link, the following Perf command can be used:
perf stat -A
-C ‘numactl --hardware | grep cpus | awk ’{print \$4}’ |
paste -s -d,‘
-e r100002FF0,r1000057F0
<application>
The 100002FF0 event counts the number of 32-bit reads and write performed to
the local memory controller of the monitoring CPUs. The 1000057F0 event performs
the same operation of 64-bit reads and write. Both events are monitored per CPU (-A
switch). The load of a memory controller is computed as follows (the computation has
to be performed for each node):(#100002FF0+#1000057F0)
(Duration of the benchmark ∗ Maximum bandwidth of the node)
The maximum bandwidth of a node can be easily calculated using a memory
benchmark (e.g., all cores accessing sequentially an array located on the node).
To measure contention, an other solution is to measure the latency of memory
accesses. If the average latency of memory accesses done by the application is close to
the latency of memory accesses of an idle machine (see Table 1.2), then the application
does not create contention. On applications that create contention, we have observed
that the average latency may be up to 10 times that of an idle machine. The following
command can be used to measure the latency of memory accesses using Perf:
perf stat
-e r10000ffe2,r10000ffe3,r10000ffe4,r10000ffe5
<application>
The 10000ffe2 and 10000ffe4 events count the total number of cycles spent
doing memory accesses and the 10000ffe3 and 10000ffe5 events count the num-
ber of memory accesses. The average latency of memory accesses is calculated as
follows:(#10000ffe2+#10000ffe4)
(#10000ffe3+#10000ffe5)with #XXXX representing the number of samples of event XXXX reported by Perf.
Note that, as seen in Section 3.1.1.3, the latency counter might report wrong values for
local memory accesses. If it is the case, Perf can be configured to monitor only remote
memory accesses latencies.
39

3.4. EXISTING PROFILERS
3.4 Existing profilers
Profilers can be classified into three main categories: profilers that report global
statistics about the execution of an application (global profilers), profilers that analyze
work done by instructions (instruction-oriented profilers) and profilers that analyze
accessed data (data-oriented profilers). In this section we present these three types of
profilers and explain how they can be used to understand the behavior of an application.
Global profilers. Global profilers report general statistics about the execution of
an application. Global profilers consider applications as black boxes. They can only be
used to understand coarse-grain issues, e.g., the fact that an application is doing remote
memory accesses – without knowing what the application is accessing remotely.
The main advantage of global profilers is their lack of overhead. A global profiler
is usually scheduled just before and just after the execution of an application and not
scheduled in between.
Perf stat [41], used in the previous Section, is a global profiler. It is simple to use,
but rather limited: it can only be used to count the number of time monitored events
occur. The tool provides no further analysis. For advanced analysis, a developer can
use likwid-perfctr [57] that offers a predefined set of rules to compute useful metrics
(e.g., the MFlops count of an application). Miniprof [58] is an other global profiler; it
can compute most global metrics (e.g., MAPI, LAR) and can plot graphics showing the
evolution of these metrics during the execution of the application. Sar (see Section 3.2.2)
is also a global profiler; it reports global statistics about I/Os, scheduling and memory
usage.
Instruction-oriented profilers. Instruction-oriented profilers report the instruc-
tions (or functions) that account for most of the monitored events. For example, if a
developer monitors CPU cycles, these profilers will report the instructions (or functions)
in which most of the time is spent. Some profilers allow visualizing the evolution
of the “top functions” through time. Perf record/report/annotate [41], Oprofile [40],
VTune [42], AMD CodeAnalyst [59] are example of instruction profilers. Figure 3.2
(a) presents the output of Perf report on FaceRec. Figure 3.2 (b) presents the output of
Perf annotate on FaceRec. Using these two outputs a developer can find functions and
instructions that take time to execute.
Data-oriented profilers. Data-oriented profilers report the objects that account for
most of the monitored events. For example, if a developer monitors remote memory
accesses, these profilers will report objects that are the most accessed remotely.
Currently, few data-oriented profilers exist. Perf data [41], VTune [42], DProf [12]
and Memphis [43] are example of data-oriented profilers. DProf reports kernel objects
that create caches misses. DProf does not work on objects allocated outside the kernel.
Perf, VTune and Memphis only work on static globally allocated objects. Memphis
was specifically designed to find objects that are accessed remotely. Perf and VTune
can use PEBS events. They report the global static objects that account for most of the
monitored PEBS event. Perf also has an experimental support for IBS.
40

(a)
(b)
Figure 3.2 – Output of perf report (a) and perf annotate (b) on FaceRec. (a) The
transposeMultiplyMatrixL function represents 83% of the cycles and (b) most of
the time is spent in a loop that multiplies two matrices.
41

3.5. LIMITATIONS OF EXISTING PROFILERS
3.5 Limitations of existing profilers
This section studies whether existing profilers can help detecting inefficient patterns
such as the ones described in Section 1.6. We show below that these profilers are
actually not able to do so in the general case, because they cannot precisely determine
whether two threads access the same object (in main memory) or not3. We use FaceRec,
a face recognition application, as an example. FaceRec performs 63% of its memory
accesses remotely.
Using existing profilers, a developer can determine, for a given memory access
performed by a thread, the involved virtual and physical addresses, as well as the
corresponding source code line (e.g., a C/C++ statement) and assembly-level instruction,
and the function call chain. In order to extract inefficient thread/memory interaction
patterns from such a raw trace, a programmer has to determine if two given individual
memory accesses actually target the same object instance or not.
In the case of global statically allocated objects, the answer can be found by
analyzing the information embedded in the program binary and the system libraries,
from which the size and precise virtual address range of each object can be obtained.
This feature is actually implemented by tools like VTune and Memphis. Unfortunately,
according to our experience with a number of applications, this kind of objects only
account for a very low fraction of the remote memory accesses (e.g., less than 4% in all
applications studied in Section 5). In the more general case, i.e., with arbitrary kinds
of dynamically allocated objects, the output of existing profilers (addresses and code
paths) is not sufficient to reach a conclusion, as explained below.
First, existing profilers do not track and maintain enough information to determine
the enclosing object instance corresponding to a given (virtual or physical) memory
address. Indeed, as the lifecycle of dynamic objects is not captured (e.g., dynamic
creations/destructions of memory mappings or application-level objects), the address
ranges of objects are not known. Moreover, a given (virtual or physical) address can
be reused for different objects over time. In addition, virtual-to-physical mappings can
also evolve over time (due to the swapping activity or to page migrations) and their
lifecycle is not tracked either.
Second, the additional knowledge of the code path (function call chain and precise
instruction) that causes a remote memory access is also insufficient to allow determining
if several threads access the same memory object. Some applications are sufficiently
simple to determine the accessed object using only the code path provided by existing
profilers. However, in practice, we found that this was not the case on any of the
applications that we studied. In general, the code path is often helpful to determine the
object type related to a given remote memory access, but does not allow pinpointing the
precise object instance being accessed. Indeed, the internal structure and workloads of
many applications are such that the same function is successively called with distinct
arguments (i.e., pointers to distinct instances of the same object type), and only a subset
of these invocations causes remote memory accesses. For instance, in Section 5.1, we
will show the example of an application (FaceRec) that processes nearly 200 matrices,
and in which only one of them is involved in a large number of remote memory accesses.
3From the application-level perspective, these accesses correspond to object allocations, destructions,
as well as read or write operations.
42

3.6 Conclusion
In this chapter, we have described hardware and software profiling facilities avail-
able in NUMA multicore machines. We have explained how to detect that an application
is impacted by the speed of its memory accesses. We have presented existing profilers,
and we have seen that these profilers do not provide sufficient information to understand
NUMA effects in an application.
43

3.6. CONCLUSION
44

4MemProf: a memory profiler for NUMA
multicore machines
Contents
4.1 Overview . . . . . . . . . . . . . . . . . . . . . . . . . . . . . . 45
4.2 Timelines of thread-object access patterns . . . . . . . . . . . . 46
4.3 Implementation . . . . . . . . . . . . . . . . . . . . . . . . . . 47
4.3.1 Event collection . . . . . . . . . . . . . . . . . . . . . . 47
4.3.2 TEF and OEF construction . . . . . . . . . . . . . . . . . 49
4.4 Example usage . . . . . . . . . . . . . . . . . . . . . . . . . . . 50
4.5 Conclusion . . . . . . . . . . . . . . . . . . . . . . . . . . . . . 52
In this chapter, we present MemProf, the first NUMA profiler allowing the capture of
interactions between threads and objects. More precisely, MemProf is able to associate
remote memory accesses with memory-mapped files, binary sections thread stacks, and
with arbitrary objects that are statically or dynamically allocated by applications. This
chapter is organized as follows: we first give an overview of MemProf. Second, we
describe the output provided by MemProf. Finally, we describe how MemProf can be
used to detect patterns such as the ones presented in Section 1.6. MemProf code is
available for download at the following url: https://github.com/Memprof.
4.1 Overview
MemProf aims at providing sufficient information to find and implement appropriate
solutions to reduce the number of remote memory accesses. The key idea behind
MemProf is to build temporal flows of interactions between threads and in-memory
objects. Intuitively, these flows are used to “go back in an object’s history” to find out
which and when threads accessed the object remotely. Processing these flows allows
45

4.2. TIMELINES OF THREAD-OBJECT ACCESS PATTERNS
understanding the causes of remote memory accesses and thus designing appropriate
optimizations.
MemProf distinguishes five types of objects that we have found important for
NUMA performance troubleshooting: global statically allocated objects, dynamically-
allocated objects, memory-mapped files, sections of a binary mapped by the operating
system (i.e., the main binary of an application or dynamic libraries) and thread stacks.
MemProf associates each memory access with an object instance of one of these types.
MemProf records two types of flows. The first type of flow represents, for each
profiled thread, the timeline of memory accesses performed by this thread. We call
these flows Thread Event Flows (TEFs). The second type of flow represents, for each
object accessed in memory, the timeline of accesses performed on the object. We call
these flows Object Event Flows (OEFs).
These two types of flows give access to a large number of indicators that are useful
to detect patterns such as the ones presented in Section 1.6: the objects (types and
instances) that are accessed remotely, the thread that allocates a given object and the
threads that access this object, the node(s) where an object is allocated, accessed from
and migrated to, the objects that are accessed by multiple threads, the objects that are
accessed in a read-only or in a read-mostly fashion, etc. Note that different views can be
extracted from MemProf’s output, i.e., either focused on a single item (thread/object) or
aggregated over multiple items. In addition, the temporal information can be exploited
to detect some specific phases in an application run, e.g., read/write phases or time
intervals during which a memory object is accessed with a very high latency (e.g., due
to the intermittent saturation of a memory controller).
4.2 Timelines of thread-object access patterns
MemProf builds one Thread Event Flow (TEF) per profiled thread T . An example
of TEF is given in Figure 4.1 (a). The TEF of a given thread T contains a list of “object
accesses”; each “object access” corresponds to a main memory access performed by
T . The “object accesses” are organized in chronological order inside the TEF. They
contain: (i) the node from which the access is performed, (ii) the memory node that
is accessed, (iii) a reference to the Object Event Flow of the accessed object, (iv) the
latency of the memory access, (v) a boolean indicating whether the access is a read
or a write operation, and (vi) a function callchain. The TEF of a given thread T also
contains some additional metadata: the PID of T and the process binary filename. These
metadata allow computing statistics about threads of the same process and the threads
of a common application.
Object Event Flows (OEFs) provide a dual view of the information contained in
the TEFs. MemProf builds one OEF per object O accessed in memory. An example
of OEF is given in Figure 4.1 (b). The OEF of an object O is composed of “thread
accesses”, ordered chronologically. Each “thread access” corresponds to a memory
access to O. The “thread accesses” store similar information as the one found in “object
accesses”. The only difference is that instead of containing a reference to an OEF, an
“object access” contains a reference to the TEF of the thread accessing O.
The OEF of a memory object O also contains metadata about O: the type of the
object (among the 5 types described in Section 4.1), the size of the object, and the line
46

Thread Event Flow (TEF)
time
process id
application name
object accessaccessing node
accessed node
accessed object
latency
read/write
callchain
time
.
.
.
.
.
....
(a) (b)
Object Event Flow (OEF)
type [static object, dynamic object,
file, code or stack]
size
code location
node of allocation
TEF of the allocator thread
file path [for files or code]
[for dynamic
objects and files]
thread access
accessing node
accessed node
accessing thread
latency
read/write
callchain...
Figure 4.1 – The two types of flows built by MemProf. There is (a) a Thread
Event Flow per profiled thread, and (b) an Object Event Flow per object accessed
during the profiling session.
of code where the object was allocated or declared. Besides, there are some additional
metadata for a dynamically allocated object, as depicted in Figure 4.1.
4.3 Implementation
In this section, we present the implementation of MemProf for Linux. MemProf
performs two main tasks, illustrated in Figure 4.2. The first task (online) consists in
collecting events (thread creation, object allocation, memory accesses, etc.) that are then
processed by the second task (in an offline phase), which is in charge of constructing
the flows (TEFs and OEFs). We review each task in turn.
4.3.1 Event collection
The event collection task consists in tracking the life cycle of objects and threads,
as well as the memory accesses.
Object lifecycle tracking.
MemProf is able to track the allocation and destruction of different types of memory
objects, as described below.
MemProf tracks the lifecycle of dynamically allocated memory objects and memory-
mapped files by overloading the memory allocation functions (malloc, calloc,
realloc, free, mmap and munmap) called by the threads that it profiles. MemProf
can also be adapted to overload more specialized functions when an application does not
use the standard allocation interfaces. Function overloading is performed by linking the
profiled applications with a shared library provided by MemProf, through the dynamic
47

4.3. IMPLEMENTATION
Obje
ct
life
cycle
tra
ckin
g
O
verl
oadin
g o
f allocati
on f
uncti
ons
Kern
el hook
Tim
e t
1 ;
pid
p1
Mappin
g o
f bin
ary
'X
'
Tim
e t
2 ;
tid
ti2 ;
pid
p2
Cre
ati
on o
f th
read T
Tim
e t
0 ;
pid
p0
Alloc/F
ree o
bj0
Tim
e t
3 ;
tid
ti3 ;
pid
p3
Mem
. access o
n @
vir
t
Th
read
Even
t
Flo
wti
d
Ob
ject
Even
t
Flo
w
range
of
@vir
t
Event
collecti
on
TEF a
nd O
EF c
onstr
ucti
on
cre
ate update
update
create
update
insert
"obje
ct
access"
insert
"th
read a
ccess"
Ord
ere
d s
ets
of
events
Thre
ad lifecycle
tra
ckin
g
Kern
el hooks
Mem
ory
access t
rackin
g
IB
S s
am
ple
s
cre
ate
red-b
lack t
ree
hashm
ap
Figure 4.2 – Implementation of MemProf. MemProf performs two tasks: event
collection (online) and flow construction (offline). Due to space restrictions, we
only present the most important fields of the collected events.
48

linker’s LD_PRELOAD and dlsym facilities1.
MemProf tracks the lifecycle of code sections and global static variables with a
kernel module that overloads the perf_event_mmap function. This function is
called on every process creation, when the binary and libraries of the process are
mapped in memory. It provides the size, virtual address and “content” (e.g., file name)
of newly mapped memory zones.
For each kind of object, MemProf stores the virtual address of the created or
destroyed object. It also stores a timestamp, the tid of the calling thread, the CPUID on
which the function is called and a callchain. The timestamp is required to determine the
lifecycle of memory objects. The tid is necessary to know in which virtual address space
the object is allocated. The CPUID is needed for the corresponding OEF metadata. The
callchain is required to find the line of code where the object was allocated.
Thread lifecycle tracking. In order to detect thread (and also stack) creations and
destructions, MemProf overloads two kernel functions: perf_event_task and
perf_event_comm, which are called upon such events. The perf_event_task
function provides the thread id of newly created/destroyed threads, and the
perf_event_comm function provides the name of newly created threads. Mem-
Prof records these metadata and associates them with a timestamp and a pid.
Memory access tracking. Memory accesses are tracked using Instruction Based
Sampling (see Section 3.1.2). For tagged instructions that reference a memory location,
IBS collects the virtual and physical address of the location, the number of clock cycles
required to fetch the data, the level where the data was found in the memory hierarchy
(in one of the caches, in the local DRAM bank or in a remote DRAM bank), and the
access type (read or write). MemProf configures an IBS handler per cores and, when an
IBS interrupt occurs, MemProf stores this information in per core buffers. In addition
to the information provided by the IBS registers, the MemProf’s kernel module also
saves a timestamp, the CPUID of the core, as well as the thread id and stack boundaries
of the executing thread.
4.3.2 TEF and OEF construction
Once the events have been collected, MemProf builds (offline) the OEF and TEF of
the profiled application(s). Since the creation of TEF and OEF are costly, MemProf
only builds them for the threads and objects that a developer wants to study.
As illustrated in Figure 4.2, the events are first ordered by timestamp. MemProf
then iterates over the ordered list of events and builds the flows as follows. MemProf
creates a new TEF each time a new thread is created and an OEF each time a new object
is allocated. MemProf stores (i) the TEFs in a hashmap indexed by the tid of their
thread and (ii) the OEFs in a per-process red-black tree structure. This red-black tree
allows finding if a virtual address corresponds to a previously allocated object (e.g., if
an object O is allocated on the virtual address range [0x5− 0x10], then a request for
the address 0x7 will return the OEF of O).
1MemProf can thus work on applications whose source code is not available. However, its insight may
be somewhat restricted in such a case (e.g., given the lack of visibility over the accessed object types).
49

4.4. EXAMPLE USAGE
For each memory access to a given virtual address, MemProf (i) creates a “thread
access” and inserts it in the TEF of the thread that performed the memory access, and
(ii) searches in the red-black tree for the OEF that corresponds to the accessed virtual
address; if it exists, MemProf creates an “object access" and inserts it in the OEF. Note
that in most cases, the OEF exists in the red-black tree; the only exceptions are (i) when
a memory access targets the stack of a thread, and (ii) when the physical address is
outside the valid range of physical addresses2. MemProf assigns all memory accesses
performed on stacks to a single (per-process) OEF representing all stacks. Indeed, we
observed in practice that stacks represent only a small percentage of remote memory
accesses and it is thus sufficient to regroup all memory accesses performed on stacks in
a single OEF. Moreover, MemProf ignores physical addresses that are outside the valid
range of physical addresses.
4.4 Example usage
In this Section, we show how to use MemProf to profile an application. We use
FaceRec as an example. We first show how to collect samples. Then we show how to
interpret MemProf’s output and show how it can help choose between the optimizations
described in Section 1.6.
Profiling. Profiling an application is done in one line:
<memprof_path>/scripts/profile_app.sh <app>
The script loads the kernel module, starts IBS sampling and sets up required hooks to
monitor objects creations and destructions.
After the profiling session, three files will be created: ibs.raw, perf.raw and
data.processed.raw. The ibs.raw files contains the IBS samples. The perf.raw file
contains the process creation and destruction information. The data.processed.raw file
contains the object creation and destruction information.
Finding accesses that are accessed remotely. To get the objects that account for
most remote memory accesses, a developer can use the following command:
<memprof_path>/parser/parse
--perf perf.raw --data data.processed.raw ibs.raw
-L -u -a <app_name> --top-obj
The -L switch filters samples to keep only remote memory accesses. The -u switch
filters samples to keep only memory accesses done in userland (vs. in kernel). The
-a filters samples to keep only samples done by the profiled application. Finally the
--top-obj switch tells MemProf to show a list of the objects, sorted by the number of
samples that access the object. The output is a list of lines that look as follows:
274 - makeMatrix+0x59
6479348 [6479348 0% local]
[89.87% total] [...]
2The hardware creates IBS samples with such addresses when it monitors special assembly instructions
like rdtscll, which is used to read the timestamp counter.
50

This line represents the “top object” of FaceRec. The object unique id of the object
is 274. This number can be used in other commands of MemProf (see below); it is
an internal number used by MemProf and does not mean anything outside MemProf
scripts. The object was allocated in the makeMatrix function (exactly at the 59th
instruction after the beginning of the function). 6479348 remote memory accesses were
performed on the object. Note that because the -L switch is used (i.e., “consider only
remote memory accesses”), the total number of accesses reported by MemProf (first
occurrence of 6479348) is equal to the number of remote memory accesses (second
occurrence of 6479348). This object represents 89.87% of the remote memory accesses
and is thus a good candidate for optimization.
Outputting the OEF of an object. The --obj <uid> switch of MemProf is used
to output the OEF of the object <uid>. The uid corresponds to the unique identifier
outputted by the –top-obj switch (see previous paragraph). With our example, the
command line to plot the OEF of object #274 is:
<memprof_path>/parser/parse
--perf perf.raw --data data.processed.raw ibs.raw
-L -u -a <app_name> --obj 274
MemProf outputs the metadata associated with the object and the list of memory
accesses done to the object.
Object was allocated from the following path:
makeMatrix+0x59 [0x404220]
readSubspace [0x408eb4]
main [0x40194d]
Object is here: 7fe12a7ec010-7fe12b73edb0
OEF:
x readDouble
x readDouble
* readDouble
* readDouble
x readDouble
* readDouble
* readDouble
[...]
x transposeMultiplyMatrixL
x transposeMultiplyMatrixL
x transposeMultiplyMatrixL
x transposeMultiplyMatrixL
x transposeMultiplyMatrixL
x transposeMultiplyMatrixL
x transposeMultiplyMatrixL
[...]
Top functions accessing the object (#access, function):
6472048 99.90% transposeMultiplyMatrixL
[...]
Each x represents a load to the object. Each * represents a store to the ob-
ject. Each column represents a thread. As we can see on this excerpt, the object
is read and written by a single thread at the beginning of the execution. Then mul-
tiple threads access it in read only mode. The accesses are mostly done from the
51

4.5. CONCLUSION
transposeMultiplyMatrixL function. Note that this is a very raw output of the
OEF. It is possible to automatize the analysis of the OEF, e.g., to know if an object has
been written during a period of time.
Analyzing the OEF. The OEF shows two facts: one object represents 90% of all
remote memory accesses and this object is initialized by one thread and then accessed
in read-only by multiple threads. The best optimization in this case is to replicate the
object on all nodes and make sure that threads use a local replica. MemProf tells us
were the object is allocated, were it is initialized and were it is used. This information
is sufficient to implement replication properly.
4.5 Conclusion
In this chapter, we have presented MemProf. Memprof builds flows of interactions
between threads and objects. For each thread, MemProf builds a Thread Event Flow
(TEF) that contains the memory accesses performed by the thread. For each object,
MemProf builds an Object Event Flow (OEF) that contains the list of memory accesses
performed to the object. We have used MemProf on FaceRec, a facial recognition
application. We have explained how to analyze the Object Events Flows of FaceRec.
We have shown that the object that represents 90% of all remote memory accesses of
FaceRec can be replicated.
52

5Evaluation
Contents
5.1 FaceRec . . . . . . . . . . . . . . . . . . . . . . . . . . . . . . . 53
5.2 Streamcluster . . . . . . . . . . . . . . . . . . . . . . . . . . . 55
5.3 Psearchy . . . . . . . . . . . . . . . . . . . . . . . . . . . . . . 57
5.4 Apache/PHP . . . . . . . . . . . . . . . . . . . . . . . . . . . . 58
5.5 Overhead . . . . . . . . . . . . . . . . . . . . . . . . . . . . . . 60
5.6 Conclusion . . . . . . . . . . . . . . . . . . . . . . . . . . . . . 61
In this Chapter, we evaluate MemProf using four applications: FaceRec, Stream-
cluster, Apache and Psearchy on the three machines presented in Section 1.4. The
first three applications perform a significant number of remote memory accesses. The
last one performs fewer remote memory accesses but is memory-intensive. For each
application, we first try to optimize the application using the output of existing profilers,
i.e., instruction-oriented profilers like Perf and data-oriented profilers like Memphis.
We show that the latter do not give precise insights on what and how to optimize the
application. We then profile the application with MemProf and show that it allows
precisely pinpointing the causes of remote memory accesses and designing appropriate
optimizations to mitigate them. These optimizations are very simple (less than 10 lines
of code) and efficient on all machines presented in Section 1.4 (the gains range from
6.5% to 161%). Finally, we conclude this chapter by a study of the overhead induced
by MemProf.
5.1 FaceRec
FaceRec is a facial recognition engine of the ALPBench benchmark suite [60]. We
use the default workload included in the suite. FaceRec performs 63% of its memory
accesses on remote memory. We first try to optimize FaceRec using existing profilers.
53

5.1. FACEREC
We obtain a performance improvement ranging from 9% to 15%. We then try to
optimize FaceRec using MemProf. We obtain a performance improvement ranging
from 16% to 41%.
Optimization using existing profilers. Instruction-oriented profilers allow understand-
ing that most remote memory accesses are performed in one function (see the output of
the Perf profiler, presented in Table 5.1). This function takes two matrices as arguments
and performs a matrix multiplication. It is called on all matrices manipulated by the
application (using MemProf, we learn that 193 matrices are allocated during a run of the
default ALPBench workload). Instruction-oriented profilers do not allow determining
which matrices induce large numbers of remote memory accesses.
% of total remote accesses Function
98 transposeMultiplyMatrixL
0.08 malloc
Table 5.1 – Functions performing most remote memory accesses in FaceRec.
Data-oriented profilers show that no remote memory access is performed on global
statically allocated objects. Moreover, they allow gathering the list of virtual addresses
that are accessed remotely, together with the ratio of remote memory accesses that each
virtual address accounts for. Nevertheless, it is not possible to determine if a range of
accessed addresses represents one or more matrices. Indeed, FaceRec allocates matrices
of different sizes, and each range of virtual addresses can be used to store different
matrices during different time intervals (MemProf actually shows that FaceRec allocates
several matrices on the same virtual address ranges). Consequently, existing profilers
do not allow understanding which matrices induce many remote memory accesses.
The optimizations that can be envisioned using the output of existing profilers
are: (i) duplicating all matrices on all nodes, or (ii) interleaving the memory allocated
for all matrices on all nodes. Both optimizations require the developer to retrieve
all places in the code where matrices are allocated. We did not implement the first
optimization because it requires writing complex code to synchronize the state of
matrices whenever they are updated. Moreover, we know (using MemProf) that this
optimization will not induce good performance. Indeed, MemProf shows that some
matrices are often updated, and thus that the synchronization code would be frequently
triggered. We tried the second optimization, which is simple to implement: it consists
in replacing the calls to malloc with calls to numa_alloc_interleaved. This
optimization induces performance improvements of 15%, 9% and 13% on Machines
A, B and C respectively. Note that this optimization increases the number of remote
memory accesses, but decreases the contention on one of the memory nodes, hence the
performance improvement.
Optimization using MemProf. MemProf points out that most remote memory ac-
cesses are performed on a single matrix (see Table 5.2). This explains why the opti-
mization presented in the previous paragraph induced a performance improvement: it
decreases the contention on the memory node hosting this matrix. Using the OEF of this
matrix, we observe that, contrarily to some other matrices, this matrix is written only
54

once and then accessed in read-only mode by a set of threads1. The detailed analysis of
the OEF was presented in Section 4.4.
We leverage this observation as follows: we optimize FaceRec by duplicating this
matrix on all nodes after its initialization. As the matrix is never updated, we did not
have to write any synchronization code. The matrix occupies 15MB of memory. The
footprint overhead of this optimization is thus 45MB on machines A and B (4 nodes)
and 105MB on machine C (8 nodes). The implementation of the matrix duplication only
required 10 lines of code. We simply had to modify the readAndProjectImages
function that initializes this matrix so that it allocates one matrix per node. For simplicity,
we stored the various pointers to the matrices in a global array. Threads then choose
the appropriate matrix depending on the node they are currently running on. With
this optimization, FaceRec only performs 2.2% of its memory accesses on remote
memory (63% before the optimization). This results in performance improvements of
respectively 41%, 26% and 37% on Machines A, B and C.
% of total remote accesses Object
98.8 s->basis(csuCommonSubspace.c:455)
0.2 [static objects of libc-2.11.2.so]
Table 5.2 – Objects remotely accessed in FaceRec.
5.2 Streamcluster
Streamcluster is a parallel data-mining application included in the popular PARSEC
2.0 benchmark suite [61]. Streamcluster performs 75% of its memory accesses on
remote memory. We first try to optimize Streamcluster using existing profilers and
obtain a performance improvement ranging from 33% to 136%. We then try to optimize
Streamcluster using MemProf and obtain an improvement ranging from 37% to 161%.
This means that Streamcluster is an application for which existing profilers provide
enough information to successfully optimize the application, but that MemProf is able
to provide details that can be exploited to implement the optimization slightly more
efficiently.
Optimization using existing profilers. Instruction-oriented profilers allow understand-
ing that most remote memory accesses are performed in one function (see the output of
the Perf profiler, presented in Table 5.3). This function takes two points as parameters
(p1 and p2) and computes the distance between them. The following line of code does
remote accesses:
result += (p1.coord[i]-p2.coord[i])*(p1.coord[i]-p2.coord[i]). An analysis of the
assembly code shows that remote memory accesses are performed on the coord field
of the points. It is nevertheless not possible to know if all points or only part of them
induce remote memory accesses. Instruction-oriented profilers also allow understand-
ing that one of the memory nodes is more loaded than others (i.e., memory accesses
1As MemProf only samples a subset of the memory accesses, we checked this fact via source code
inspection.
55

5.2. STREAMCLUSTER
targeting this node have a higher latency).
% of total remote accesses Function
80 dist
18 pspeedy
1 parsec_barrier_wait
Table 5.3 – Functions performing most remote memory accesses in Streamclus-
ter.
Data-oriented profilers show that less than 1% of the remote memory accesses
are performed on global statically allocated data. Moreover, they show that threads
remotely access the same memory pages. This information is not sufficient to understand
if some “points” are more frequently remotely accessed than others (as was the case
with matrices in the FaceRec application), nor to understand if threads share data, or if
they access different objects placed on the same page.
Several optimizations can be proposed: (i) memory duplication, (ii) memory
migration, or (iii) memory interleaving. The first one performs poorly if objects are
frequently updated. The second one performs poorly if various threads simultaneously
access objects. As we have no information on these two points, and due to the fact
that these two optimizations are complex to implement, we did not try them. The
third possible optimization makes sense because one node of the system is saturated.
Interleaving the memory allows spreading the load of memory accesses on all memory
nodes, which avoids saturating nodes. The optimization works as follows: we interleave
all the dynamically allocated memory pages thanks to the numactl utility available
in recent Linux distributions. With this optimization, Streamcluster performs 80%
of its memory accesses on remote memory (75% before optimizing), but memory
accesses are evenly distributed on all nodes. This optimization improves performance
by respectively 33%, 136% and 71% on Machines A, B and C.
Optimization using MemProf. MemProf shows that most remote memory accesses
are performed on one array (see Table 5.4). Note that a set of objects accounts for 14%
of remote memory accesses, but they are not represented in Table 5.4, as each object
individually accounts for less than 0.5% of all remote memory accesses. The analysis of
the OEF of the array shows that it is simultaneously read and written by many threads.
The reason why MemProf allows pinpointing an array, whereas existing profilers point
out the coord fields is simple: the coord fields of the different points are pointers to
offsets within a single array (named “block" in Table 5.4). MemProf also outputs that
the array is allocated on a single node, and that the latency of memory accesses to this
node is very high (for instance, approximately 700 cycles on Machine B). Consequently,
to optimize Streamcluster, we chose to interleave the memory allocated for this array
on multiple nodes. This improves performance by respectively 37%, 161% and 82%
for Machines A, B and C. As expected, this optimization does not decrease the ratio
of remote memory accesses (75%), but it drastically reduces the average memory
latency to the saturated node (430 cycles on Machine B). Note that, using MemProf,
the optimization is more efficient: this comes from the fact that only a subset of the
memory is interleaved: the memory that is effectively the target of remote memory
56

accesses.
It is important to note that MemProf also gives information about the potential
benefits of the memory duplication and memory migration techniques discussed above.
Indeed, MemProf shows that the array is frequently updated (i.e., there is a high ratio
of write accesses), which indicates that memory duplication would probably perform
poorly. Moreover, the analysis of the OEF of the array shows that several threads
simultaneously access it, which indicates that memory migration would also probably
perform poorly.
% of total remote accesses Object
80.9 float *block(streamcluster.cpp:1852)
4.1 points.p(streamcluster.cpp:1865)
1 [stack]
Table 5.4 – Objects remotely accessed in Streamcluster.
5.3 Psearchy
Psearchy is a parallel file indexer from the Mosbench benchmark suite [46].
Psearchy only performs 17% of its memory accesses on remote memory but it is
memory intensive: it exhibits a high ratio of memory accesses per instruction. We first
try to optimize Psearchy using existing profilers and do not obtain any performance
gain (the only straightforward optimization to implement yields a 14-29% performance
decrease). We then try to optimize Psearchy using MemProf and obtain a performance
improvement ranging from 6.5% to 8.2%.
Optimization using existing profilers. Instruction-oriented profilers allow finding the
functions that perform most remote memory accesses (see the output of the Perf profiler,
presented in Table 5.5). The first function, named pass0, aims at parsing the content
of the files to be indexed. The second function is a sort function provided by the libc
library. In both cases, we are not able to determine which objects are targeted by remote
memory accesses. For instance, when looking at the assembly instructions that induce
remote memory accesses in the pass0 function, we are not able to determine if the
memory accesses are performed on the file buffers, or on the structures that hold the
indexed words. Indeed, the assembly instructions causing remote memory accesses are
indirectly addressing registers and we are not able to infer the content of the registers
by looking at the code.
Data-oriented profilers show that less than 1% of the remote memory accesses
are performed on global statically allocated data. As in the case of FaceRec and
Streamcluster, Data-oriented profilers show that threads access the same memory
pages. We do thus consider the same set of optimizations: (i) memory duplication,
(ii) memory migration, or (iii) memory interleaving. For the same reason as in
Streamcluster, we do not try to apply the first two optimizations (the analysis performed
with MemProf in the next paragraph validates this choice). The third possible
optimization does not make sense either. Indeed, contrarily to what we observed
57

5.4. APACHE/PHP
% of total remote accesses Function
45 pass0
40 msort_with_tmp
7.7 strcmp
3 lookup
Table 5.5 – Functions performing remote memory accesses in Psearchy.
for Streamcluster, no memory node is saturated. As this optimization is very simple
to implement, we nonetheless implemented it to make sure that it did not apply. It
decreases the performance by respectively 22%, 14% and 29% for Machines A, B and C.
Optimization using MemProf. MemProf points out that most remote memory
accesses are performed on many different objects. We also observe that these objects
are of three different types. We give in Table 5.6 the percentage that each type of
object accounts for with respect to the total number of remote memory accesses. More
interestingly, we observe, using the OEFs of all objects, that each object is accessed by
a single thread: the thread that allocated it. This means that threads in Psearchy do not
share objects, contrarily to what we observed in FaceRec and Streamcluster2. This
observation is important for several reasons. First, it implies that memory duplication
and memory migration are not suited to Psearchy. Second, it allows understanding
why threads — although not sharing objects — all access the same memory pages:
the reason is that all objects are allocated on the same set of memory pages. Using
this information, it is trivial to propose a very simple optimization: forcing threads
to allocate memory on the node where they run. As threads are not sharing objects,
this should avoid most remote memory accesses. We implemented this optimization
using the numa_alloc_local function. With this optimization, less than 2% of
memory accesses are performed on remote objects and the performance increases by
respectively 8.2%, 7.2% and 6.5% on Machines A, B and C.
% of total remote accesses Type of object
42 ps.table(pedsort.C:614)
38 tmp(qsort_r+0x86)
10 ps.blocks(pedsort.C:620)
Table 5.6 – Types of the main objects that are remotely accessed in Psearchy.
5.4 Apache/PHP
Apache/PHP [47] is a widely used Web server stack. We benchmark it using the
Specweb2005 [62] workload. Because machines B and C have a limited number of
2As MemProf only samples a subset of the memory accesses, we checked this fact via source code
inspection.
58

network interfaces, we could not use them to benchmark the Apache/PHP stack under
high load. On machine A, we observe that the Apache/PHP stack performs 75% of its
memory accesses on remote memory. We first try to optimize the Apache/PHP stack
using the output of existing profilers. We show that we are not able to precisely detect
the cause of remote memory accesses, and that, consequently, all our optimizations
fail. We then try to optimize the Apache/PHP stack using MemProf. We show that
MemProf allows precisely pinpointing the two types of objects responsible for most
remote memory accesses. Using a simple optimization (less than 10 lines of code), we
improve the performance by up to 20%.
Optimization using existing profilers. Instruction-oriented profilers allow finding
the functions that perform most remote memory accesses (see the output of the Perf
profiler, presented in Table 5.7). No function stands out. The top functions are related
to memory operations (e.g., memcpy copies memory zones) and they are called from
many different places on many different variables. It is impossible to know what they
access in memory.
% of total remote accesses Function
5.18 memcpy
2.80 _zend_mm_alloc_int
1.72 zend_hash_find
Table 5.7 – Top functions performing remote memory accesses in the
Apache/PHP stack.
Data-oriented profilers show that less than 4% of the remote memory accesses
are performed on global statically allocated data. They also show that many threads
remotely access the same set of memory pages. Finally, they show that some pages
are accessed at different time intervals by different threads, whereas other pages are
simultaneously accessed by multiple threads.
Several optimizations can be tried on Apache/PHP, based on the previously
described observations. The first observation we tried to leverage is the fact that some
pages are accessed at different time intervals by different threads. Because we did not
know which objects are accessed, we designed an application-agnostic heuristic in
charge of migrating pages. We used the same heuristic as the one recently described
by Blagodurov et al. [4]: every 10ms a daemon wakes up and migrates pages. More
precisely, the daemon sets up IBS sampling, “reads the next sample and migrates
the page containing the memory address in the sample along with K pages in the
application address space that sequentially precede and follow the accessed page”.
In [4], the value of K is 4096. Unfortunately, using this heuristic, we observed a slight
decrease in performance (around 5%). We tried different values for K, but without
success. This is probably due to the fact that we use a different software configuration,
with many more threads spawned by Apache.
The second observation we tried to leverage is the fact that some pages are
simultaneously accessed by multiple threads. As we did not expect Apache threads
to share memory pages (each thread is in charge of one TCP connection and handles
59

5.5. OVERHEAD
a dedicated HTTP request stream), we thought there could be a memory allocation
problem similar to the one encountered in Psearchy, where threads allocate data on a
remote node. We did thus try to use a NUMA-aware memory allocator, i.e., we replaced
all calls to malloc with calls to numa_alloc_local. This did not impact the
performance. Although no memory node was overloaded, we also tried to interleave the
memory using the numactl utility. This optimization did not impact the performance
either. Finally, we thought that the problem could be due to threads migrating from one
memory node to another one, thus causing remote memory accesses. Consequently,
we decided to pin all Apache threads and all PHP processes at creation time on the
different available cores, using a round-robin strategy. To pin threads and processes we
used the pthread_set_affinity function. This optimization had a negligible
impact on performance (2% improvement).
Optimization using MemProf. MemProf points out that Apache performs most of its
remote memory accesses on two types of objects: variables named apr_pools, that
are all allocated in a single function, and the pointer relocation table (PLT). The PLT is
a special section of binaries mapped in memory. It is used at runtime to store the virtual
address of the library functions used by the binary, such as the the virtual address of the
memcpy function. Using the OEF of the PLT and of the apr_pools objects, we found
that each of these objects is shared between a set of threads belonging to a same process.
Consequently, we decided to optimize Apache/PHP by pinning all threads belonging
to the same Apache processes on the same node. This modification requires less than
10 lines of code and induces a 19.7% performance improvement. This performance
improvement is explained by the fact that the optimization drastically reduces the ratio
of remote memory accesses. Using this optimization, the Apache/PHP stack performs
10% of its memory accesses on remote memory (75% before optimization).
5.5 Overhead
In this section, we study the overhead and accuracy of MemProf. Note that our
observations apply to our three test machines.
The main source of overhead introduced by MemProf is IBS sampling, whose rate
is configurable. In order to obtain precise results, we adjust the rate to collect at least
10k samples of instructions accessing DRAM. For most of the applications that we
have observed, this translates into configuring IBS with a frequency that is less than
one interrupt every 60K cycles, which causes a 5% slowdown. For applications that run
for a short period of time or make few DRAM accesses, it may be necessary to increase
the sampling rate. In all the applications that we studied, we found it unnecessary to go
beyond a sampling rate of one IBS interrupt every 20k cycles, which induces a 20%
slowdown (the application lasts less than 0.5s, hence the high sampling rate).
The costs of IBS processing can be detailed as follows. Discarding a sample (for
instructions that do not access DRAM) takes 700 cycles while storing a relevant sample
in a per-CPU buffer requires 2.7k cycles. The storage of samples is currently not heavily
optimized. A batch of 10k samples requires 2MB and we pre-allocate up to 5% of the
machine RAM for the buffers, which has proven acceptable constraints in practice.
The second source of overhead in MemProf is the tracking of the lifecycles of
60

memory objects and threads performed by the user library and the kernel module. The
interception of a lifecycle event and its online processing by the user library requires
400 cycles. This tracking introduces a negligible slowdown on the applications that
we have studied. The storage of 10k events requires 5.9MB in user buffers, for which
we pre-allocate 20MB of the machine RAM. The processing and storage overheads
induced by the kernel-level tracking are significantly lower.
Finally, the offline processing (required to build OEFs and TEFs) for a MemProf
trace corresponding to a 1-minute application run takes approximately 5 seconds.
5.6 Conclusion
We have evaluated MemProf on 4 applications. MemProf was systematically able to
identify the causes of remote memory accesses and help us to find simple and efficient
solutions. With lightweight modifications to the source code of the applications (less
than 10 lines of code), we were able to achieve significant performance improvements
(up to x2.6).
61

5.6. CONCLUSION
62

Part II
Carrefour - Dynamic memory
management on NUMA multicore
machines
63


6Motivation
Contents
6.1 MemProf vs. dynamic memory management algorithms, ad-
vantages and constraints of live diagnosis . . . . . . . . . . . . 66
6.2 Existing static and dynamic memory algorithms . . . . . . . . 67
6.2.1 Works done on UMA systems . . . . . . . . . . . . . . . 67
6.2.2 Linux - “First touch” and “interleave” allocation policies . 67
6.2.3 Solaris and Windows - Home node . . . . . . . . . . . . . 68
6.2.4 AutoNUMA . . . . . . . . . . . . . . . . . . . . . . . . 68
6.2.5 Verghese et al. - ASPLOS’96 . . . . . . . . . . . . . . . 68
6.2.6 DINO . . . . . . . . . . . . . . . . . . . . . . . . . . . . 69
6.2.7 Thread Clustering . . . . . . . . . . . . . . . . . . . . . . 70
6.2.8 Affinity Accept . . . . . . . . . . . . . . . . . . . . . . . 70
6.3 Limitations of existing dynamic memory management algo-
rithms . . . . . . . . . . . . . . . . . . . . . . . . . . . . . . . . 70
6.4 Conclusion . . . . . . . . . . . . . . . . . . . . . . . . . . . . . 71
In the first part, we have presented MemProf. MemProf allows finding and im-
plementing simple and efficient memory optimizations. In this chapter, we describe
existing dynamic memory management algorithms. Dynamic memory management
algorithms run along applications and try to optimize their memory accesses automati-
cally. We first explain the advantages and constraints of dynamic memory management
over profiling. Then we present the main algorithms currently used to manage memory
in NUMA systems. We conclude this chapter with an overview of the limitations of
existing algorithms.
65

6.1. MEMPROF VS. DYNAMIC MEMORY MANAGEMENT ALGORITHMS,
ADVANTAGES AND CONSTRAINTS OF LIVE DIAGNOSIS
6.1 MemProf vs. dynamic memory management algorithms,
advantages and constraints of live diagnosis
In the first part, we have seen how to find and fix NUMA-related issues using
MemProf. Most of the optimizations that were presented in this part are easy to
implement, so one might wonder if developing a new a dynamic memory management
algorithm is really useful. In this section, we try to answer this question and to explain
the advantages and constraints of dynamic memory management algorithms.
Limitations of profiling and advantages of dynamic memory management
heuristics. MemProf cannot be used in all situations. The main drawback of us-
ing MemProf is that it requires time, some expertise and access to the source code of
the application to implement a solution. Indeed, currently MemProf does not automati-
cally provide any all-inclusive solution to patch applications that suffer from NUMA
issues. Optimizations have to be manually implemented using information provided by
MemProf.
Another drawback of manual optimizations is that they might be difficult to imple-
ment on applications that have hard-to-predict memory access patterns, e.g., applications
whose memory accesses depend on the workload, like databases. Optimizations might
also be hard to implement when remote memory accesses are not performed on few
objects by few functions (as it was the case in the 4 applications used in the evaluation
of MemProf).
Finally, manual optimizations can only be tested on a limited set of machines. The
bottlenecks of an application may vary depending on the hardware it is executing on or
depending on whether or not the application is co-scheduled with other applications [4].
If the bottlenecks change, so do the optimizations required to circumvent these bottle-
necks. Consequently, manual optimizations work best in "HPC-like" environments in
which the exact context of execution of all applications is well known.
Dynamic memory management algorithms, on the contrary, do not suffer from these
drawbacks: optimizations are applied automatically, without requiring the source code
of applications; they adapt to workload changes and often work on multiple machines
and execution contexts. Even in situations where the context of execution is perfectly
controlled, dynamic memory management techniques might work better than manual
optimizations because they try to optimize all memory accesses – i.e., not only the
memory accesses done to the most accessed objects like manual optimizations do.
Limitations of dynamic memory management heuristics. Dynamic memory
management algorithms also have limitations. The main difficulty in dynamic memory
management is to try to predict what will happen in the future of the application’s exe-
cution based on what the application did in the past. This may not work if the memory
access patterns of the application frequently change. Using profiling, a developer has a
complete view of the execution of the application and may be able to detect that the
memory access patterns change over the application lifetime, and thus implement an
appropriate optimization.
The second limitation of dynamic memory management algorithms is the granularity
of observations. Because observations have to be made with low overhead, all existing
66

algorithms work (i) on average memory access statistics at the granularity of cache
lines or larger and (ii) consider applications as black boxes (i.e., they do not try to
link memory accesses with objects allocated by the application or functions of the
application). In some situations, coarse-grain observations might prevent the algorithm
from choosing the best optimization, e.g., an algorithm might think that two threads
share data, while they are accessing different objects located in the same memory page
or in the same cache line. Because costly analysis can be performed offline with a
profiler, a profiler can report much more precise information about memory accesses
than dynamic algorithms.
Conclusion. Profiling and dynamic algorithms are not really conflicting approaches.
Both have advantages and drawbacks. Profiling shines to understand complex mem-
ory access patterns, while dynamic algorithms can be used on most applications to
automatically improve performance effortlessly.
6.2 Existing static and dynamic memory algorithms
6.2.1 Works done on UMA systems
Before NUMA systems became commonplace, dynamic memory management
algorithms have been developed for UMA systems. Implemented heuristics focus on
improving the cache hit ratio.
Most of these heuristics rely on judicious thread placement to perform this task. For
instance, Boyd et al. [6] migrate threads close to the caches that contain data they use,
Tam et al. [7] try to improve cache efficiency by migrating threads that share data on
cores sharing a cache, and the works described in [8, 13, 63, 64] place threads on cores
so as to limit contention on shared caches (i.e., in order to limit cache trashing).
Because data located in cache is volatile and often change, few people have focused
on memory placement to improve cache efficiency. One notable exception is the work
by Kessler et al. [65]. The key idea behind this work is to force different application
to use different cache lines. This reduces the number of cache lines that a single
application may use, but eliminates cache trashing between applications. In order to
force applications to use different cache lines, Kessler et al. use a technique known
as “page coloring”. Each page is given a color that corresponds to the cache lines it is
be mapped to. The kernel then attributes different colors to different applications. An
application can only allocate pages of its color.
Some of the ideas used by these heuristics still make sense on NUMA systems.
However, in most cases, as identified by Blagodurov et al. [23], these heuristics may
hurt performance on NUMA systems because they create additional contention of
interconnects and memory buses.
6.2.2 Linux - “First touch” and “interleave” allocation policies
By default, Linux uses the “first touch” allocation policy: pages are allocated on
the node from which they are first accessed. This node may be different from the node
on which the malloc call was performed. The objective of first touch allocation is
to improve the co-location of threads and data. If a data is accessed from a single
67

6.2. EXISTING STATIC AND DYNAMIC MEMORY ALGORITHMS
node, then it will be accessed locally. This strategy improves locality when threads
located on different nodes share little data and when threads are not often migrated
between nodes. Linux can also be configured to interleave pages between nodes, but
this configuration has to be made manually by a developer: Linux does not provide any
dynamic algorithm to switch between the “first touch” and the “interleave” allocation
policies. In the evaluation (Chapter 8), we use the first touch allocation policy (default
Linux behavior) as the performance baseline.
6.2.3 Solaris and Windows - Home node
Solaris and Windows use the same allocation policy called the “home node” pol-
icy [66, 67]. The kernel attributes a “home node” to each application. The “home
node” has two main purposes: (i) when an application performs a memory allocation,
data is preferably allocated on the home node of the application and (ii) threads of
an application are preferably scheduled on the home node of the application. The
home node policy works best when threads of different applications can be clustered
on different nodes without creating CPU idleness. However, this policy can create
contention for multi-threaded application, because all memory tends to be allocated on
a single node.
6.2.4 AutoNUMA
AutoNUMA is a recent patch for Linux kernels [9]. It is currently not merged in the
main kernel branch but is likely to be in the years to come. AutoNUMA uses two main
techniques: it performs thread migrations and memory migrations. The idea behind
AutoNUMA is to migrate threads on the node they access the most and pages on the
node from which they are the most accessed. Thus, AutoNUMA focuses on improving
the locality of memory accesses.
Memory accesses are determined using page fault statistics. Periodically a daemon
unmaps pages. When these pages are accessed, page faults occur, allowing AutoNUMA
to compute statistics on threads and page locations. When a page induces two page-
faults in a row from the same node, the page is migrated to the node.
The main limitation of AutoNUMA is that it does not consider workloads with data
sharing: if a page is accessed from multiples nodes, then it is either migrated constantly
between nodes (which creates unnecessarily overhead) or it is ignored by the algorithm.
6.2.5 Verghese et al. - ASPLOS’96
In [5], Verghese et al. present a dynamic memory management algorithm for cache-
coherent NUMA machines. Their algorithm uses page migration and page replication
to improve locality. Figure 6.1 represents the 3 steps of the algorithm. First, only
“hot pages” are considered for migration and replication. A page is considered hot if
the number of memory accesses done to the page exceeds a threshold. The threshold
used in the paper depends on the application. Then, if a single thread accesses the
page and few pages have already been migrated, the page is migrated. The number
of “already migrated pages” is taken into account in order to limit the overhead of the
algorithm. If the page is shared, never written, and the machine still has free memory,
68
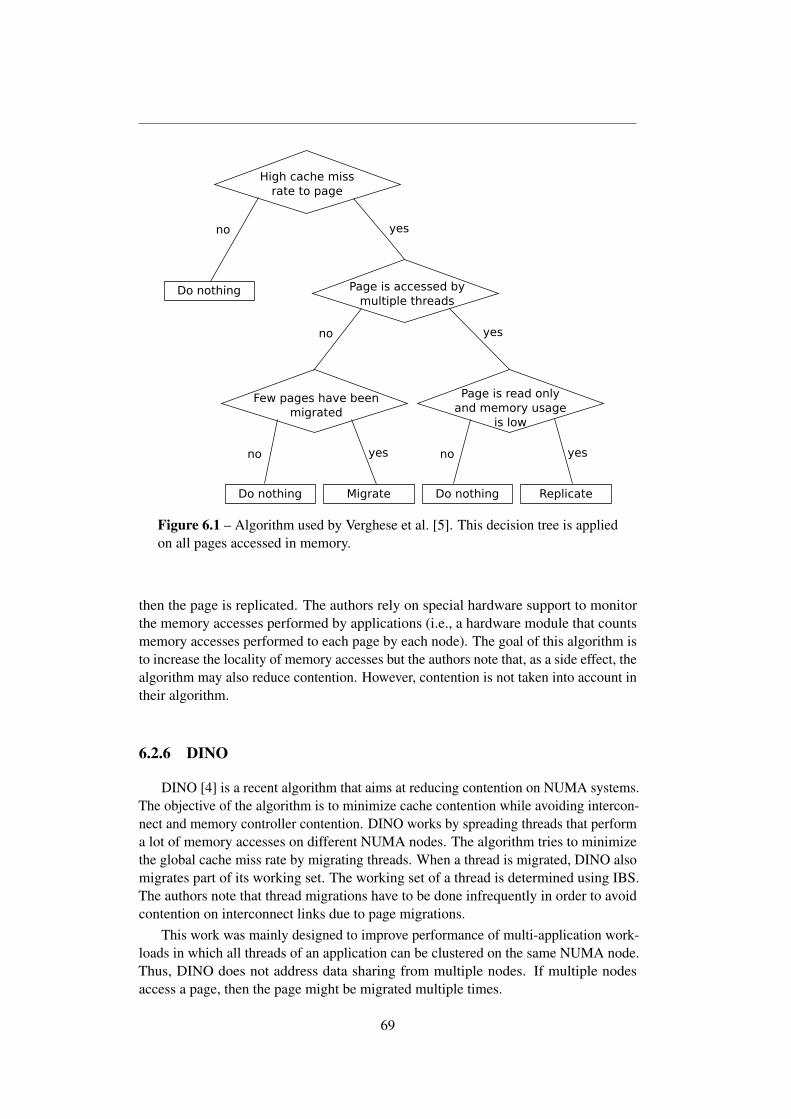
Do nothing
High cache miss
rate to page
Page is accessed by
multiple threads
Page is read only
and memory usage
is low
Few pages have been
migrated
Do nothing ReplicateDo nothing Migrate
no
nono
no
yes
yes
yesyes
Figure 6.1 – Algorithm used by Verghese et al. [5]. This decision tree is applied
on all pages accessed in memory.
then the page is replicated. The authors rely on special hardware support to monitor
the memory accesses performed by applications (i.e., a hardware module that counts
memory accesses performed to each page by each node). The goal of this algorithm is
to increase the locality of memory accesses but the authors note that, as a side effect, the
algorithm may also reduce contention. However, contention is not taken into account in
their algorithm.
6.2.6 DINO
DINO [4] is a recent algorithm that aims at reducing contention on NUMA systems.
The objective of the algorithm is to minimize cache contention while avoiding intercon-
nect and memory controller contention. DINO works by spreading threads that perform
a lot of memory accesses on different NUMA nodes. The algorithm tries to minimize
the global cache miss rate by migrating threads. When a thread is migrated, DINO also
migrates part of its working set. The working set of a thread is determined using IBS.
The authors note that thread migrations have to be done infrequently in order to avoid
contention on interconnect links due to page migrations.
This work was mainly designed to improve performance of multi-application work-
loads in which all threads of an application can be clustered on the same NUMA node.
Thus, DINO does not address data sharing from multiple nodes. If multiple nodes
access a page, then the page might be migrated multiple times.
69

6.3. LIMITATIONS OF EXISTING DYNAMIC MEMORY MANAGEMENT
ALGORITHMS
6.2.7 Thread Clustering
Thread Clustering [7] is an algorithm designed for UMA systems. The key idea
behind thread clustering is to co-locate (cluster) threads that share data on cores sharing
a cache. The authors mention that the algorithm can be “trivially” extended to NUMA
systems (i.e., most likely by clustering threads that share data on the same NUMA node).
The algorithm measures the “similarity” of memory accesses performed by distinct
threads using hardware facilities available in PowerPC processors. An equivalent
computation can be performed on AMD processors using IBS or on Intel processors
using PEBS. The algorithm compares accesses to cache lines and cluster threads that
access the same cache lines. The algorithm only clusters threads when clusters do not
create CPU idleness.
Note that, since Thread Clustering was designed for UMA systems, the authors do
not explain precisely how clusters would be placed on NUMA nodes (i.e., on the node
that is the most accessed by the cluster?) or if they would use memory migration to
place memory close to the threads accessing them.
The main limitation of Thread Clustering is that it was designed for workloads were
clusters of threads could be created without creating idleness. For instance, Thread
Clustering will not cluster two threads on the same core if it leaves another core idle.
Consequently Thread Clustering does not do anything on workloads composed of a
single multi-threaded application in which all threads share data.
6.2.8 Affinity Accept
Affinity-Accept is a recent evolution of the TCP stack for NUMA machines [10].
The objective of Affinity-Accept is to improve the locality of TCP connections. In a
system that runs Affinity-Accept, all computations induced by a single TCP connection
(kernel computations and userland computations) are performed on a single core. When
a new connection is established, Affinity-Accept chooses a core responsible for the
computations associated with the TCP connection depending on the current load of
cores.
Affinity-Accept only improves locality of workloads that do network processing.
6.3 Limitations of existing dynamic memory management
algorithms
As we have seen in the previous section, multiple heuristics have been designed
to manage memory on UMA and NUMA systems. Most of these heuristics focus on
improving the locality of memory accesses, but none focuses on contention. This is an
important limitation of existing heuristics: as we have seen in Section 1.5.3, contention
on interconnects and memory buses has a higher impact on performance than remote
memory accesses.
For example, no algorithm addresses the problem of data that is read and written by
a large number of threads spread across multiple NUMA nodes. Algorithms based on
thread placement would either take no decision or place all threads on a single NUMA
node – which would result in CPU idleness and degrade performance. Algorithm based
on memory placement will not try to change memory placement. Even DINO, that takes
70

contention issues into account, only acts on thread and memory placement if locality
can be improved. Consequently, these algorithms fail to address workloads that suffer
from contention but in which locality cannot be improved. This limitation, in practice,
prevents current algorithms from working on a wide range of applications. Table 6.1
presents a summary of existing techniques and their limitations three applications:
Streamcluster, FaceRec and FT from the NAS benchmark. In Streamcluster, all threads
read and write an array. In FaceRec, all threads read an array. In FT, threads mainly
manipulate their own data (the locality cannot be improved and memory should not be
migrated). As we can see, no algorithm is able to improve performance in all situations.
Some algorithms even degrade performance (e.g., the “home node” algorithm on FT)
because they create additional contention. The algorithm that seems to give the best
performance is that from Verghese et al. described in Section 6.2.4. Unfortunately this
algorithm does not handle pages shared in read/write mode and thus does not improve
the performance of Streamcluster. Also note that this algorithm has to be manually
tuned for all applications and that it relies on special hardware support to work (i.e., a
hardware module that counts memory accesses performed to each page by each node).
6.4 Conclusion
In this chapter, we have seen that profiling and dynamic memory management
algorithms are not antagonistic approaches. We have explained that dynamic memory
management algorithms are useful in a wide variety of situations – e.g., when the
context of execution of applications cannot be known in advance or when the source
code of applications is not available. As we have seen in this chapter, currently no
algorithm works (i) automatically and (ii) systematically on all applications. The main
reason is that current algorithms solely focus on locality and fail to tackle contention,
even though the impact of contention on current NUMA system is higher than that of
locality (see Section 1.5.3).
71

6.4. CONCLUSION
❵❵
❵❵❵❵❵❵❵
❵❵
❵❵❵
Work
load
Op
tim
izati
on
Asp
los’
96
[5]
Auto
NU
MA
[9]
Thre
ad
Clu
ster
ing
[7]
DIN
O[4
]A
ffinit
y-
acce
pt
[10]
Hom
enode
Man
ual
inte
rlea
vin
g
Str
eam
clust
er×
≈×
××
×≈
(Bes
topti
miz
atio
n:
inte
r-
leav
ean
arra
y)
does
noth
ing
(mem
ory
is
acce
ssed
in
R/W
and
loca
lity
cannot
be
impro
ved
)
wil
lm
igra
te
som
epag
es
but
not
bal
ance
the
load
idea
lly
does
noth
ing
(clu
ster
ing
would
crea
te
idle
nes
s)
wil
lnot
take
any
dec
isio
n
(no
thre
ad
mig
rati
on)
does
noth
ing
(no
I/O
)
wil
lnot
chan
ge
conte
nti
on
subopti
mal
(wil
l
inte
rlea
ve
obje
cts
that
sho
uld
no
tb
e
inte
rlea
ved
)
Fac
eRec
X≈
××
××
≈
(Bes
to
pti
miz
atio
n:
rep
lica
te
am
atri
x)
wil
lm
igra
te
som
epag
es
but
not
repli
cate
any
pag
e
does
noth
ing
(clu
ster
ing
would
crea
te
idle
nes
s)
wil
lnot
take
any
dec
isio
n
(no
thre
ad
mig
rati
on)
does
noth
ing
(no
I/O
)
wil
lnot
chan
ge
conte
nti
on
subopti
mal
(loca
lity
would
be
25%
inst
ead
of
100%
)
FT
X×
XX
X×
×
(Bes
topti
miz
atio
n:
do
noth
-
ing)
does
noth
ing
(Loca
lity
cannot
be
impro
ved
)
Deg
rades
per
form
ance
bec
ause
of
unnec
essa
ry
mig
rati
ons
does
noth
ing
(clu
ster
ing
would
crea
te
idle
nes
s)
wil
lnot
take
any
dec
isio
n
(no
thre
ad
mig
rati
on)
does
noth
ing
(no
I/O
)
wil
lcr
eate
conte
nti
on
deg
rades
per
form
ance
bec
ause
it
deg
rades
loca
lity
Tab
le6.1
–S
um
mar
yof
opti
miz
atio
ns
and
reas
on
why
they
do
not
work
inso
me
work
load
s.
72

7Carrefour
Contents
7.1 Overview . . . . . . . . . . . . . . . . . . . . . . . . . . . . . . 74
7.2 Profiling . . . . . . . . . . . . . . . . . . . . . . . . . . . . . . 75
7.2.1 Global and per application metrics . . . . . . . . . . . . . 75
7.2.2 Capturing interactions between threads and pages . . . . . 76
7.3 Per application decisions . . . . . . . . . . . . . . . . . . . . . 77
7.4 Per page decisions . . . . . . . . . . . . . . . . . . . . . . . . . 78
7.5 Reducing the overhead . . . . . . . . . . . . . . . . . . . . . . 78
7.5.1 Reducing the overhead of capturing interactions between
threads and pages . . . . . . . . . . . . . . . . . . . . . . 78
7.5.2 Avoiding bad per page decisions . . . . . . . . . . . . . . 80
7.6 Conclusion . . . . . . . . . . . . . . . . . . . . . . . . . . . . . 80
In this chapter, we present Carrefour, the first memory management algorithm that
aims at reducing contention on memory controllers and interconnect links. Carrefour
was done as an international research collaboration with the systems group at SFU in
Vancouver, Canada [1]. In this Chapter, I present my contributions to Carrefour. As we
have seen in the previous chapter, memory management on UMA and NUMA systems
has been studied for a long time, but existing memory management algorithms focus
solely on improving locality. Carrefour takes a radically new approach by focusing
first on reducing contention and then on improving locality. We begin this chapter with
an overview of the goals of Carrefour and of the algorithm. Then, in the next three
Sections, we detail the three main steps of the algorithm and explain how we managed
to reduce their overhead. Carrefour code is available for download at the following url:
https://github.com/Carrefour.
73

7.1. OVERVIEW
7.1 Overview
The workflow of Carrefour is pictured in Figure 7.1. Carrefour works in 3 main
steps: (i) profiling to gather metrics and page accesses statistics, (ii) per application
decisions, to decide whether to enable Carrefour for the applications and then whether
to enable page migration, page replication or page interleaving, and (iii) per page
decisions – actually migrating, replicating or interleaving pages. These three steps are
described in detail in the next three sections.
Carrefour always runs in background. We make sure that it has as little overhead as
possible. Two operations performed by Carrefour are costly: gathering pages accesses
statistics and per page decisions (these operations are highlighted in bold in Figure 7.1).
Carrefour uses Hardware Counters to compute metrics and IBS to gather page
accesses statistics. In theory all metrics could be computed using IBS only (as MemProf
does), but this would require a high sampling rate to be accurate, and thus induce too
much overhead [68]. Thus Carrefour uses Hardware Counters – that have a negligible
overhead – to guide the decision process. Hardware Performance Counters are used
to enable or to disable Carrefour and to decide whether migration, interleaving and
replication make sense for a given application (e.g., if we detect that the write ratio
is high, then Carrefour disables replication). Using these hints, Carrefour can take
appropriate “per page” decisions, even with few IBS samples. For example, even if
we do not see any write to a page, Carrefour will not replicate the page when the write
ratio is high – we thus avoid taking risky decisions when they are likely to degrade
performance.
The first step (profiling) runs continuously in background. Steps 2 and 3 run
every second. Steps 2 and 3 use and reset statistics collected by step 1. We found
experimentally that running steps 2 and 3 every second was the best way to take accurate
decisions with little overhead. However, note that, as Table 7.1 shows, the period at
which steps 2 and 3 run does not have to be set precisely: on Streamcluster, any period
between 0.5s and 2s provides the same result.
Per application profiling Per application decision Per page decision
Metrics
• Memory accesses per second
• Imbalance
• Local access ratio
• Memory read ratio
Page access tracking
• IBS samples
Memory contention
Enable migration
Enable interleaving
Enable replication
Migrate, interleave
or replicate page
Figure 7.1 – Workflow of Carrefour. The two boxes in bold (IBS sampling and
per page decisions) represent the costly parts of the workflow.
74

Period Streamcluster Completion time
0.1s 66s
0.25s 64s
0.5s 63s
1s 63s
1.25s 63s
1.5s 63s
2s 63s
3s 65s
5s 69s
Table 7.1 – Influence of the period at which Carrefour runs on the performance
of Streamcluster.
7.2 Profiling
7.2.1 Global and per application metrics
Carrefour uses Hardware Performance Counters and kernel statistics to collect
global and per application metrics. These metrics are used by Carrefour to enable or
disable migration, interleaving and replication on a per application basis. The goal of
using these metrics and the decision process is detailed in Section 7.3.
The full list of metrics collected by Carrefour is presented in Table 7.2 (a). Current
Opteron processors can only monitor up to 4 Hardware Counters at the same time, so
Carrefour tries to compute all the metrics using as few Hardware Counters as possible
to limit the multiplexing of counters. Carrefour computes 5 metrics that we detail in
turn:
• MAPTU. The MAPTU represents the number of Memory Accesses Per Time
Unit (per second in the case of Carrefour). It is calculated using time and event
0x1F01.
• MC-IMB. The MC-IMB represents the Memory Controller Imbalance. It is the
standard deviation of the load across all memory controllers, expressed as percent
of the mean. To calculate the imbalance, we re-use the same 0x1F0 event that
was used to calculate the MAPTU.
• MRR. The Memory Read ratio represents the percentage of memory accesses
that read memory (vs. memory accesses that write memory). The MMR is also
computed using the 0x1F0 event because this event allows distinguishing read
and write requests done to memory controllers.
• LAR. The Local Access Ratio is calculated using the 0x1E0 event. This event
allows computing the number of memory accesses done from each node to each
other node. To compute the LAR of a node, we divide the number of memory
1Event 0x1F0 counts the number of memory accesses received by each memory controllers. It is
monitored per node.
75

7.2. PROFILING
Global metrics
MAPTU Memory (DRAM) accesses per time
unit (microsecond)
MC-IMB Memory controller imbalance
LAR Local access ratio
Per-application metrics
MRR Memory read ratio. Fraction of
DRAM accesses that are reads
CPU% Percent CPU utilization
(a)
Per-page metrics
Number of ac-
cesses
The number of sampled data loads that
fell in that page
Access type Read-only or read-write
(b)
Table 7.2 – (a) Metrics collected using Hardware Counters and kernel statistics.
(b) Metrics collected using IBS.
accesses that this node performs to its local memory controller by the total number
of memory accesses that it performs.
• CPU%. In order to compute the percent of CPU used by each application,
Carrefour currently uses the ps command.
In order to collect these metrics, Carrefour configures hardware counters in counting
mode. In counting mode, counters count the number of times the event they monitor
occurs without generating any interrupt (see Section 3.1.1). The overhead of using
HWC in counting mode is negligible: it consists in 1 MSR read per event per second
(i.e., approximately 350 cycle per event per second).
7.2.2 Capturing interactions between threads and pages
In order to capture per page metrics (see Table 7.2 (b)), Carrefour uses IBS. Per page
metrics represent one of the two main sources of overhead of Carrefour. Section 7.5.1
details how we configured IBS frequency if order to limit the overhead of Carrefour.
When an IBS interrupt occurs, Carrefour stores the following information: (i) the
physical and virtual addresses of the page accessed by the sampled instruction, and (ii)
a boolean indicating whether the access is a read or a write. This information is stored
in a global red-black tree. The red-black tree is reset after each round of Carrefour.
The red-black tree is indexed by the physical address of the accessed page. Carrefour
relies on the assumption that a single physical address represents a single logical page
in memory during one round. In practice, this assumption is not a problem for the
workloads we consider: (i) no memory migration happens during the profiling phase of
76

Carrefour2 and (ii) we do not consider cases in which the swap is used3.
Currently, Carrefour only stores a maximum of 30K different pages in the red-
black tree. This number was chosen to limit the maximum number of migrations and
replications that Carrefour could perform in a second. Note that working on 30K
pages proved to be enough to balance load on all applications that we considered. The
precise value of this number is also not important, as shown in Table 7.3. The main
reason is that we use sampling to detect accessed pages. Pages that are frequently
accessed in memory are more likely to be in the first 30K seen pages than other pages.
Consequently, even if Carrefour does not consider all accessed pages, it is likely to
work on the “hottest” ones.
Number of pages Completion time
10K 66s
20K 63s
30K 63s
60K 63s
Table 7.3 – Influence of the number of pages considered by Carrefour on the
performance of Streamcluster.
7.3 Per application decisions
Per application decisions is the second step of the Carrefour algorithm. This step
runs every second. The first metric collected by Carrefour, the MAPTU, is used to
estimate the likelihood of contention on the machine. If the MAPTU is high, then the
global load on memory controllers is high. Note that the fact that the MAPTU be high
is not a guarantee that contention occurs in the system. However, if the MAPTU is low,
then we are sure that there is no contention on memory controllers (because the system
is not memory intensive). So, Carrefour takes a pessimistic approach by guessing that
contention might occur as soon as it sees memory accesses. If contention cannot occur,
then Carrefour is deactivated.
Carrefour only considers applications that use more than 10% of a single CPU.
This restriction was added to make sure that decisions taken by Carrefour would have a
significant impact on the global machine’s performance: if an application uses less than
10% of a CPU, it is unlikely that it represents a significant portion of the contention of
the machine. If an application uses more than 10% of a CPU and the MAPTU is high,
then Carrefour is activated for the application.
Then Carrefour decides whether it is necessary to enable or disable migration,
interleaving and replication. To this purpose, Carrefour uses the MC-IMB, the LAR and
2To the best of our knowledge, no widely deployed application currently performs memory migration.
Note that special rules could easily be added in Carrefour to detect applications that handle memory
placement on their own.3In practice, not considering cases in which the swap is used is not a problem when the objective is
to decrease memory contention: when the swap is used, the global bandwidth is often limited by the
bandwidth of disks which is far lower than that of memory. Also note that using workloads that fit in
memory is in line with current datacenters designs [18, 69].
77

7.4. PER PAGE DECISIONS
the MRR. The algorithm was mainly designed by the SFU Team is not fully described
in this thesis. The rationals behind the algorithms are simple. If the read ratio is low,
then replication is likely to be harmful and so it is deactivated. If the LAR is high,
then migrations are unlikely to improve performance, so migration is deactivated. The
same reasoning is done for interleaving: if imbalance on memory controller is low, then
interleaving is deactivated. The exact values of the thresholds can be found in [3]. The
goal of enabling or disabling interleaving, migration or replication per application is
to ensure that Carrefour will take as few “risky decisions” (i.e., decisions that could
degrade performance) as possible. Thus, optimizations are deactivated in situations in
which they are unlikely to improve performance.
7.4 Per page decisions
After deciding which techniques (i.e., migration, interleaving, replication) should be
enabled for each application, Carrefour takes per page decisions (step 3 of the Carrefour
workflow). A page can only be migrated, interleaved or replicated if migration, inter-
leaving or replication - respectively - have been enabled for the application it belongs
to. Carrefour then tries to choose the best available technique for each page.
Figure 7.2 pictures the per-page algorithm used by Carrefour. The algorithm is
kept very simple: if the page has been accessed from one node, then it is migrated. If
a page has been accessed by multiple nodes in read only mode, then it is replicated.
Otherwise the page is “interleaved”: placed on a node that is less loaded than the node
it is currently located on. The algorithm is similar to that used by Verghese et al. [5] but
tries to balance the load in more cases.
This algorithm is applied on all pages accessed more than twice during the profiling
phase of Carrefour. We eliminate pages accessed only once for two reasons: (i)
migrating, interleaving and replication a page is costly, so we try to avoid performing
these operations on pages that are infrequently accessed in memory, and (ii) 1 sample is
not enough to take accurate decisions (e.g., it is not possible to know if a page is shared
with only one sample). Two samples proved to be enough in practice to take accurate
decisions, thanks to the “per application decisions” taken in step 2.
7.5 Reducing the overhead
In the three steps described in the previous sections, two operations are costly:
capturing interactions between threads and pages and per page decisions. In this section
we show how we limited the overhead of these two operations in turn.
7.5.1 Reducing the overhead of capturing interactions between threads
and pages
The overhead of capturing interactions between threads and pages depends on the
frequency of IBS: the more IBS interrupts are generated, the higher the overhead. The
overhead has two main causes: the cost of handling IBS interrupts and the cost of
recording IBS data. We use two techniques to limit the overhead of these two costs. We
describe them below.
78

Page is accessed from
multiple nodes
Page has not
been written and replication
is enabled
Interleave Replicate
Migrate
no
no yes
yes
Figure 7.2 – Algorithm used by Carrefour. This decision tree is applied on all
pages accessed in memory. The “Migrate” and “Interleave” boxes will only
result in migrations or interleaving if migration or interleaving, respectively, are
enabled.
Considering all IBS samples. Carrefour tries to optimize memory accesses per-
formed to the DRAM. So, in theory, Carrefour should filter IBS samples to only compute
statistics on instructions that access the DRAM. However, few IBS samples indicate a
DRAM access and IBS has to be configured with a high sampling rate in order to have
enough samples of instructions that access DRAM to perform meaningful analyses4.
The first optimization consists in considering all IBS samples (i.e., even samples that hit
in cache), to get more samples with a lower IBS frequency and thus with less interrupts.
An unwanted side effect of this optimization is that Carrefour might migrate a page that
is mostly accessed in cache. In practice we found that this is not an issue: Carrefour
only works on applications that do a lot of memory accesses, and we found that, in
these applications, pages that are frequently accessed in cache are most of the time also
frequently accessed in memory. Also note that, since IBS does not consider accesses
made by the prefetcher, considering data that IBS sees in cache is also a way to account
for memory accesses done by the prefetcher.
Adapting IBS frequency. To reduce the overhead induced both by IBS interrupts
and by recording of IBS data, we use an adaptive sampling rate. We start with a
relatively high rate (1 IBS sample every 65K cycles). If after the step 3 we migrate,
replicate or interleave less than 10 pages, then we reduce the sampling rate by 4.
Otherwise we keep the sampling rate at 1 IBS sample every 65K cycles.
4As seen in Section 3.1.2 IBS cannot filter samples in hardware, so interrupts are generated for all
instructions tagged by IBS. The probability that a random instruction miss in cache is low - usually caches
have a hit rate that is more that 95%.
79

7.6. CONCLUSION
The key idea behind adapting the sampling rate is to reduce the overhead when we
think that Carrefour is not required. On the one hand, if Carrefour takes no decision,
then there is no point in capturing lots of interactions between threads and pages. On the
other hand, if Carrefour takes decisions, then we want these decisions to be as accurate
as possible – hence the high sampling rate. Our assumption is that the overhead induced
by the sampling rate has a much lower impact on performance than the benefits of
taking good memory placement decisions.
7.5.2 Avoiding bad per page decisions
These optimizations have been designed by the SFU Team; we briefly explain the
ideas in this subsection. Per page decisions are costly. Table 7.4 details the cost of
migrating (or interleaving) and replicating a page. Carrefour tries to take the “right”
decisions per page, but because decisions are based on incomplete statistics, and because
the workloads of the application may change, some of these decisions can degrade
performance. We identified two kinds of “bad decisions” that could hurt performance.
Decision Cost (in cycle)
Migrating a page ∼ 5200
Replicating a page5∼ 9000
Table 7.4 – Cost of per page decisions in Carrefour.
Ping-Pong effect. It is possible that during one round Carrefour sees that a page
is accessed exclusively from one node (and thus decides to migrate the page on this
node) and in the next round sees that the page is accessed from another node (and thus
migrates it to the other node). We call the frequent migration of a page between nodes
the “ping pong effect”. This could be due to inaccuracies in per page statistics (i.e., if
a page is shared but we have too few samples to detect it) or because the workload of
the application changes. In both cases, (i) constantly migrating pages between nodes is
costly and (ii) the migrations do not seem to improve the locality of memory accesses.
Carrefour detects such patterns and deactivates migration on a per page basis.
Avoiding replicating frequently written pages. Even on applications with a low
write ratio, some pages are frequently written. Carrefour might decide to replicate these
pages (i.e., because we use sampling, we may miss all writes to a page). If a page has
been frequently marked for replication and then written, then we permanently disable
replication for this page.
7.6 Conclusion
In this chapter, we have seen how Carrefour dynamically changes memory place-
ment to limit contention and improve locality on NUMA machines. Carrefour relies
5This cost only comprises the cost of duplicating the page table entries. It does not comprises the cost
of actually copying the page content on multiple nodes - this operation is performed lazily and depends on
the number of nodes that access the page.
80

on Hardware Counters and IBS to track memory accesses and to choose between op-
timizations. Carrefour first estimates the contention on the machine and then enables
migration, interleaving and/or replication for each application. We have seen that
gathering this information is costly and that Carrefour tries to limit its overhead by
adjusting the IBS sampling frequency. We have also seen how Carrefour mitigates the
effect of bad per page decisions by avoiding ping-pong effects and avoiding replicating
frequently written pages.
81

7.6. CONCLUSION
82

8Evaluation
Contents
8.1 Single-application workloads . . . . . . . . . . . . . . . . . . . 83
8.1.1 Performance comparison . . . . . . . . . . . . . . . . . . 83
8.1.2 Performance analysis . . . . . . . . . . . . . . . . . . . . 84
8.1.3 Limitations of Carrefour: the IS.D use case . . . . . . . . 88
8.2 Overhead . . . . . . . . . . . . . . . . . . . . . . . . . . . . . . 88
8.3 Conclusion . . . . . . . . . . . . . . . . . . . . . . . . . . . . . 89
In this Chapter, we evaluate Carrefour using 24 different applications taken from the
NAS Benchmark suite [30], the Parsec Benchmark suite [29], the ALPBench suite [44]
and the Metis Benchmark suite [31]. We use the machines A and B presented in
Section 1.4 to perform the evaluation1. Using these applications, we show that Carrefour
always outperforms existing memory management algorithms and never degrades
performance – even on applications that do not benefit from memory management. We
conclude this chapter with an overview of the overhead of Carrefour and a discussion
of the possible hardware evolutions that could be leveraged by Carrefour in order to
further reduce its overhead.
8.1 Single-application workloads
8.1.1 Performance comparison
Figures 8.3 and 8.4 present the performance of Carrefour, AutoNUMA and Manual
Interleaving compared to Linux on machines A and B. We can see that Carrefour con-
1We were not able to use machine C for the evaluation because Carrefour requires a custom kernel that
supports page replication - contrarily to MemProf that patches a running kernel. Unfortunately machine C
is a shared machine and changing its kernel is not allowed.
83

8.1. SINGLE-APPLICATION WORKLOADS
stantly outperforms AutoNUMA and Manual Interleaving - except on IS.D. Carrefour
provides important performance improvement (more than x2) on four applications. The
maximum performance degradation of Carrefour compared to Linux is 4% on IS.D on
machine B. On other applications the maximum performance degradation is below 2%.
In the next subsection, we study the IS.D case in more details.
8.1.2 Performance analysis
In order to understand the reasons for the performance impact of the different
policies, we use several metrics on a set of selected applications for which Car-
refour improves performance. The profiling results for all applications are available
in Appendix A and Appendix B for machine A and machine B respectively (Fig-
ures A.2, A.1, A.3, B.2, B.1, and B.3).
300 400 500 600 700 800 900
1000 1100 1200 1300
facerec
facereclong
pcafacesim
streamclusterL
ate
ncy o
f m
em
ory
accesses (
cycle
s)
LinuxAutoNUMA
Manual InterleavingCarrefour
Figure 8.1 – Latency of memory accesses of applications on machine A.
0.2 0.3 0.4 0.5 0.6 0.7 0.8 0.9
1
facerec
facereclong
pcafacesim
streamcluster
Local access r
atio (
%)
LinuxAutoNUMA
Manual InterleavingCarrefour
Figure 8.2 – Local Access ratio of applications on machine A.
84

-100
-50 0
50
100
150
200
250
face
recfa
cere
clon
gkm
eansm
atrix
multip
ly
pca
wc
wr
wrm
emBT.BCG.C
EP.CFT.CIS
.D
LU.B
MG.C
SP.AUA.B
UA.C
body
trackfa
cesimflu
idan
imat
e
stre
amclus
ter
swap
tionsx2
64
Performance improvement with respect to Linux (%)
Auto
NU
MA
Manual In
terleavin
gC
arr
efo
ur
Fig
ure
8.3
–P
erfo
rman
ceof
Car
refo
ur
on
mac
hin
eA
.
85

8.1. SINGLE-APPLICATION WORKLOADS
0
50
100
150
200
250
face
recfa
cere
clon
gkm
eansm
atrix
multip
ly
pca
wc
wr
wrm
emBT.BCG.C
EP.CFT.CIS
.D
LU.B
MG.C
SP.AUA.B
UA.C
body
trackfa
cesimflu
idan
imat
e
stre
amclus
ter
swap
tionsx2
64
Performance improvement with respect to Linux (%)
Auto
NU
MA
Manual In
terleavin
gC
arr
efo
ur
Fig
ure
8.4
–P
erfo
rman
ceof
Car
refo
ur
on
mac
hin
eB
.
86

0
50
100
150
200
facerec
facereclong
pcafacesim
streamcluster
Imbala
nce (
%) Linux
AutoNUMAManual Interleaving
Carrefour
Figure 8.5 – Imbalance of applications on machine A.
100 200 300 400 500 600 700 800 900
1000
facerec
facereclong
pcafacesim
streamcluster
Late
ncy o
f m
em
ory
accesses (
cycle
s)
LinuxAutoNUMA
Manual InterleavingCarrefour
Figure 8.6 – Latency of memory accesses of applications on machine B.
0.2 0.3 0.4 0.5 0.6 0.7 0.8 0.9
1
facerec
facereclong
pcafacesim
streamcluster
Local access
ratio (
%)
LinuxAutoNUMA
Manual InterleavingCarrefour
Figure 8.7 – Local Access ratio of applications on machine B.
0
50
100
150
200
facerec
facereclong
pcafacesim
streamcluster
Imbala
nce (
%) Linux
AutoNUMAManual Interleaving
Carrefour
Figure 8.8 – Imbalance of applications on machine B.
87

8.2. OVERHEAD
In detail, for each studied application, we plot:
• The latency of memory accesses (Figures 8.1 on machine A and 8.6 on machine
B). The latency of memory accesses is a good indicator of both contention and
locality. If the latency of memory accesses is higher in a configuration X than in
a configuration Y, it either means that there is more contention in X than in Y, or
that X is performing more remote memory accesses than Y. Note that difference
between latency values below 500 for machine A and 200 for machine B are
not really significant (i.e., the latency counter is not accurate for applications
that access memory with a “low” latency). We observe in Figures 8.1 and 8.6
that Carrefour either reduces the latency or performs as efficiently as the best
configuration.
• The local access ratio (Figures 8.2 on machine A and 8.7 on machine B). We can
see that Carrefour systematically improves the local access ratio.
• The load imbalance on memory controllers (Figures 8.5 on machine A and 8.8
on machine B). We can see that Carrefour systematically improves the imbalance
compared to default Linux. Carrefour doesn’t always achieve a perfect load
balance (as Manual Interleaving does) because it also tries to preserve a high
local access ratio.
In conclusion, Carrefour much better balances the load on memory controllers than
Linux and AutoNUMA. It also has a much higher ratio of local memory accesses than
other techniques. This is a consequence of Carrefour judiciously applying the right
techniques (interleaving, replication or migration) in places where they are beneficial.
Interleaving mostly balances the load; replication and migration in addition to balancing
the load improve the local access ratio.
Also note that, contrarily to other techniques, Carrefour never degrades performance.
For example, Manual interleaving has a very bad impact on workloads with a high
locality because it spreads data randomly on all nodes. Carrefour does a better job
because it also maximizes the locality of memory accesses.
8.1.3 Limitations of Carrefour: the IS.D use case
IS.D is an exception among the NAS benchmarks: on machine B (see Figure 8.4),
Manual interleaving improves its performance, while Carrefour does not better than
default Linux. That is because IS suffers from very short imbalance bursts that we are
not able to correct. Figure 8.9 presents the memory access pattern of IS.D observed
with a high frequency (hardware counter values are read every 50ms). We can see that
all nodes are accessed in turn for short periods of times (a bit less than 1s). When
Carrefour tries to balance the load it often reacts “too late” (meaning that the pages that
it moves will not be used in the next burst). Moving these pages has a small overhead
and does not help improving the local access ratio of IS.D.
8.2 Overhead
Carrefour incurs CPU and memory overhead. The first source of CPU overhead is
the periodic IBS profiling. To measure CPU overhead, we compared performance of
88

0
2e+06
4e+06
6e+06
8e+06
1e+07
1.2e+07
1.4e+07
1.6e+07
36 37 38 39 40 41
DR
AM
Acce
sse
s t
o N
od
es
time (s)
To node 0To node 1To node 2To node 3
Figure 8.9 – Number of memory accesses performed to each node, with a 50ms
resolution. The memory accesses repeat a pattern: first all nodes are equally
accessed, then all accesses are done to node 0, then to node 1, then to node 3 and
finally to node 2.
Carrefour with Linux on the applications where Carrefour does not yield any perfor-
mance benefits. We observed an overhead ranging between 0.2% and 4%. Adaptive
sampling rate in Carrefour is crucial to keeping this overhead low.
The first source of memory overhead is the allocation of data structures to keep
track of profiling data. This overhead is negligible: e.g., 5MB on Machine A with
32GB of RAM. Carrefour’s data structures are pre-allocated on startup to avoid memory
allocation during the runtime. Moreover, we limit the number of profiled pages to
30,000 to avoid the cost of managing dynamically sized structures. The second source
of memory overhead is memory replication. When enabled, replication introduces a
memory footprint overhead of 400MB (353%), 60MB (210%), 60MB (126%) and
614MB (5%) for Streamcluster, FaceRec, FacerecLong and PCA, respectively. On
other applications, replication is not enabled by Carrefour.
8.3 Conclusion
We have evaluated Carrefour, a new memory management algorithm for NUMA
systems that tries to limit contention on memory controllers and interconnects. We have
seen that Carrefour can provide significant performance improvements (up to x3.3). We
have seen that Carrefour never degrades performance by more than 4% on applications
for which memory management is not required.
However, the challenge in building Carrefour was the need to navigate around the
limitations of the performance monitoring units of our hardware as well as the costs of
89

8.3. CONCLUSION
replicating pages. In this conclusion, we draw some insights on the features that could
be integrated into future machines in order to further mitigate the overhead and improve
accuracy, efficiency and performance of traffic management algorithms.
First, Carrefour would benefit from hardware profiling mechanisms that sample
memory accesses with high precision and low overhead. For instance, it would be useful
to have a profiling mechanism that accumulates and aggregates page access statistics in
an internal buffer before triggering an interrupt. In this regard, the AMD Lightweight
Profiling [70] facility seems a promising evolution of profiling hardware. Unfortunately,
LWP is not fully implemented in current Bulldozer processors (e.g., accessed virtual
addresses are not recorded), so we were not able to test it.
Second, Carrefour would benefit from dedicated hardware support for memory
replication. We believe that there should be interfaces allowing the operating system
to indicate to the processor which pages to replicate. The processor would then be in
charge of replicating the pages on the nodes accessing it and maintaining consistency
between the various replicas (in the same way as it maintains consistency for cache
lines). Given that maintaining consistency between frequently written pages is costly,
we believe that such processors should also be able to trigger an interrupt when a page
is written too frequently. The OS would then decide to keep the page replicated or to
revert the replication decision. This hardware support can be made a lot more scalable
than cache coherency protocols, because it is not automatic, but controlled by the OS,
which, armed with better hardware profiling, will only invoke it for pages that perform
very little write sharing. So the actual synchronization protocol would be triggered
infrequently.
90

Conclusion
Modern multicore systems are based on a Non-Uniform Memory Access (NUMA)
architecture. We have explained advantages and challenges introduced by these ar-
chitectures. In this context, our contributions are twofold: (i) we introduced a new
profiling tool designed to help developers solve NUMA-issues and (ii) we introduced
a new dynamic memory management algorithm that focuses on reducing contention
on NUMA machines. These two contributions allowed us to drastically improve the
performance of multiple applications (by up to 3.3x). In this chapter, we describe some
future research directions that, we believe, would be interesting to follow.
Future research directions
Considering background traffic
MemProf and Carrefour only work on a portion of the traffic that travels through
memory buses and interconnect links. Most notably, they do not consider traffic induced
by I/Os (e.g., DMA accesses performed by the network interfaces) or by the cache
coherence protocol. They also ignore all traffic due to data fetched by the prefetcher
but not used by the applications (i.e., useless prefetched data). In some workloads,
the impact of this background traffic can be significant. For instance, a network card
sending data at 10Gb/s can use up to 45% of an interconnect link of machine A (10Gb/s
out of the maximum 22.4Gb/s that the link can sustain). In modern servers that usually
have multiple 10Gb NICs [71], the background traffic can create contention and slow
down both I/Os and applications running on the machine. Background traffic is likely
to increase in the near future, because servers will be equipped with co-processors
that will communicate using interconnect links. Future algorithms aiming at managing
memory traffic will have to take this traffic into account.
Considering asymmetry in the machine’s topology
MemProf and Carrefour consider that all memory buses have the same latency in the
absence of contention and the same maximum bandwidth. The same simplification is
made for interconnect links. However, multiple machines are built with an asymmetric
topology. For instance, one of the links in machine B has half the maximum bandwidth
of other links. Machine C is even more asymmetric, i.e., some links are unidirectional
(the latency from node X to node Y is not always the same as that from node Y to node
91

8.3. CONCLUSION
X) and links do not have the same maximum bandwidth. In this context, judiciously
choosing the nodes on which an application executes may prove to be important. For
instance, if all threads of an application share data, placing the application on two nodes
that are interconnected with a high-bandwidth link may perform better than placing it
on two nodes interconnected with a low-bandwidth link. As the number of nodes in
multicore NUMA machines increases, the interconnect topology is likely to become
more and more complex and asymmetric. Considering the topology in a thread or
memory placement algorithm is currently an open problem.
Memory placement in virtualized environments
In this thesis, we have focused on applications running in a non-virtualized en-
vironment. Virtualized environments introduce multiple challenges. First, memory
has to be managed on two levels: the host level and the guest level. If both levels
do not communicate on their memory placement decisions, it is likely that they will
make contradictory decisions or perform redundant work. Second, workloads in vir-
tualized environments may be more diverse and unpredictable than those running in
non-virtualized environments. For instance, in a Cloud, a NUMA machine may run
multiple VMs, each executing workloads of different clients. Designing heuristics that
work in these situations might prove to be more challenging than designing heuristics
for non-virtualized environments.
92

Bibliography
[1] SFU, (Simon Fraser University). http://www.sfu.ca/.
[2] R. Lachaize, B. Lepers, and V. Quéma, “MemProf: A Memory Profiler for NUMA
Multicore Systems,” in USENIX ATC, 2012.
[3] M. Dashti, A. Fedorova, J. Funston, F. Gaud, R. Lachaize, B. Lepers, V. Quema,
and M. Roth, “Traffic management: a holistic approach to memory placement
on numa systems,” in Proceedings of the eighteenth international conference
on Architectural support for programming languages and operating systems,
ser. ASPLOS ’13, 2013, pp. 381–394.
[4] S. Blagodurov, S. Zhuravlev, M. Dashti, and A. Fedorova, “A case for NUMA-
Aware Contention Management on Multicore Systems,” in Proceedings of
USENIX ATC, 2011.
[5] B. Verghese, S. Devine, A. Gupta, and M. Rosenblum, “Operating system support
for improving data locality on CC-NUMA compute servers,” in ASPLOS,
1996.
[6] S. Boyd-Wickizer, R. Morris, and M. F. Kaashoek, “Reinventing scheduling for
multicore systems,” in Proceedings of the 12th conference on Hot topics in
operating systems, ser. HotOS’09. Berkeley, CA, USA: USENIX Association,
2009, pp. 21–21.
[7] D. Tam, R. Azimi, and M. Stumm, “Thread Clustering: Sharing-Aware Scheduling
on SMP-CMP-SMT Multiprocessors,” in EuroSys, 2007.
[8] S. Blagodurov, S. Zhuravlev, and A. Fedorova, “Contention-aware scheduling on
multicore systems,” ACM Trans. Comput. Syst., vol. 28, pp. 8:1–8:45, 2010.
[9] AutoNUMA: the other approach to NUMA scheduling, LWN.net, Mar. 2012,
http://lwn.net/Articles/488709/.
[10] A. Pesterev, J. Strauss, N. Zeldovich, and R. T. Morris, “Improving network
connection locality on multicore systems,” in Proceedings of the 7th ACM
european conference on Computer Systems, ser. EuroSys ’12, New York, NY,
USA, 2012, pp. 337–350.
[11] E. Z. Zhang, Y. Jiang, and X. Shen, “Does cache sharing on modern cmp matter
to the performance of contemporary multithreaded programs?” in PPOPP,
2010.
93

BIBLIOGRAPHY
[12] A. Pesterev, N. Zeldovich, and R. T. Morris, “Locating cache performance bottle-
necks using data profiling,” in EuroSys, 2010.
[13] R. Knauerhase, P. Brett, B. Hohlt, T. Li, and S. Hahn, “Using OS Observations to
Improve Performance in Multicore Systems,” IEEE Micro, vol. 28, no. 3, pp.
pp. 54–66, 2008.
[14] J.-P. Lozi, F. David, G. Thomas, J. Lawall, and G. Muller, “Remote core locking:
migrating critical-section execution to improve the performance of multi-
threaded applications,” in Proceedings of the 2012 USENIX conference on
Annual Technical Conference, ser. USENIX ATC’12. Berkeley, CA, USA:
USENIX Association, 2012, pp. 6–6.
[15] P. Conway, N. Kalyanasundharam, G. Donley, K. Lepak, and B. Hughes, “Cache
hierarchy and memory subsystem of the amd opteron processor,” Micro, IEEE,
vol. 30, no. 2, pp. 16–29, 2010.
[16] H. Kang and J. L. Wong, “To hardware prefetch or not to prefetch?: a virtualized
environment study and core binding approach,” in Proceedings of the eigh-
teenth international conference on Architectural support for programming
languages and operating systems, ser. ASPLOS ’13, 2013, pp. 357–368.
[17] W. A. Wulf and S. A. McKee, “Hitting the memory wall: implications of the
obvious,” SIGARCH Comput. Archit. News, vol. 23, no. 1, pp. 20–24, Mar.
1995.
[18] B. Veal and A. Foong, “Performance Scalability of a Multi-Core Web Server,” in
Proceedings of Architectures for Networking and Communications Systems
(ANCS), December 2007.
[19] Y. Zhao, J. Shi, K. Zheng, H. Wang, H. Lin, and L. Shao, “Allocation wall: a
limiting factor of java applications on emerging multi-core platforms,” in
Proceedings of the 24th ACM SIGPLAN conference on Object oriented pro-
gramming systems languages and applications, ser. OOPSLA ’09, 2009, pp.
361–376.
[20] A. Cox, R. Fowler, and J. Veenstra, Interprocessor Invocation on a NUMA
Multiprocessor, ser. Department of Computer Science: Technical report.
University of Rochester, Department of Computer Science, 1990. [Online].
Available: http://books.google.fr/books?id=0FFMcgAACAAJ
[21] L. Benini, E. Flamand, D. Fuin, and D. Melpignano, “P2012: building an ecosys-
tem for a scalable, modular and high-efficiency embedded computing accel-
erator,” in Proceedings of the Conference on Design, Automation and Test in
Europe, ser. DATE ’12. San Jose, CA, USA: EDA Consortium, 2012, pp.
983–987.
[22] M. Awasthi, D. Nellans, K. Sudan, R. Balasubramonian, and A. Davis, “Handling
the problems and opportunities posed by multiple on-chip memory controllers,”
in PACT, 2010.
[23] S. Blagodurov, S. Zhuravlev, M. Dashti, and A. Fedorova, “A Case for NUMA-
aware Contention Management on Multicore Systems,” in USENIX ATC,
2011.
94

[24] W. Bolosky, R. Fitzgerald, and M. Scott, “Simple but Effective Techniques for
NUMA Memory Management,” in SOSP, 1989.
[25] R. P. LaRowe, Jr., C. S. Ellis, and M. A. Holliday, “Evaluation of NUMA Memory
Management Through Modeling and Measurements,” IEEE TPDS, vol. 3,
no. 6, pp. 686–701, 1992.
[26] T. Brecht, “On the Importance of Parallel Application Placement in NUMA
Multiprocessors,” in USENIX SEDMS, 1993.
[27] L. Tang, J. Mars, X. Zhang, R. Hagmann, R. Hundt, and E. Tune, “Optimizing
google’s warehouse scale computers: The numa experience,” in Nineteenth
International Symposium on High-Performance Computer Architecture, IEEE
Computer Society, Customer Service Center, 10662 Los Vaqueros Circle, P.O.
Box 3014, Los Alamitos, CA 90720-1314, 2013.
[28] L. Gidra, G. Thomas, J. Sopena, and M. Shapiro, “A study of the scalability
of stop-the-world garbage collectors on multicores,” in Proceedings of the
eighteenth international conference on Architectural support for programming
languages and operating systems, ser. ASPLOS ’13, 2013, pp. 229–240.
[29] C. Bienia, S. Kumar, J. P. Singh, and K. Li, “The PARSEC Benchmark Suite:
Characterization and Architectural Implications,” in PACT, 2008.
[30] D. H. Bailey, E. Barszcz, and J. T. Barton et al., “The NAS Parallel Benchmarks—
Summary and Preliminary Results,” in Supercomputing, 1991.
[31] Metis MapReduce Library, http://pdos.csail.mit.edu/metis/.
[32] A. Baumann, P. Barham, P.-E. Dagand, T. Harris, R. Isaacs, S. Peter, T. Roscoe,
A. Schüpbach, and A. Singhania, “The Multikernel: A New OS Architecture
for Scalable Multicore Systems,” in SOSP, 2009.
[33] S. Boyd-Wickizer, M. F. Kaashoek, R. Morris, and N. Zeldovich, “A software
approach to unifying multicore caches,” Tech. Rep. MIT-CSAIL-TR-2011-032,
2011.
[34] B. Gamsa, O. Krieger, and M. Stumm, “Tornado: Maximizing Locality and
Concurrency in a Shared Memory Multiprocessor Operating System,” in
OSDI, 1999.
[35] Z. Metreveli, N. Zeldovich, and F. Kaashoek, “Cphash: a cache-partitioned hash
table,” in PPoPP, 2012.
[36] I. Pandis, R. Johnson, N. Hardavellas, and A. Ailamaki, “Data-oriented transaction
execution,” Proc. VLDB Endow., vol. 3, pp. 928–939, September 2010.
[37] T.-I. Salomie, I. E. Subasu, J. Giceva, and G. Alonso, “Database engines on
multicores, why parallelize when you can distribute?” in EuroSys, 2011.
[38] X. Song, H. Chen, R. Chen, Y. Wang, and B. Zang, “A case for scaling applications
to many-core with OS clustering,” in EuroSys, 2011.
[39] H. M. C. Consortium, http://www.hybridmemorycube.org/.
[40] Oprofile, http://oprofile.sourceforge.net/.
[41] perf: Linux profiling with performance counters, https://perf.wiki.kernel.org/index.
php/Main_Page/.
95

BIBLIOGRAPHY
[42] Intel VTune Amplifier XE, http://software.intel.com/en-us/
intel-vtune-amplifier-xe.
[43] C. Mccurdy and J. Vetter, “Memphis: Finding and fixing numa-related perfor-
mance problems on multi-core platforms,” in In Proceedings of ISPASS, 2010.
[44] CSU Face Identification Evaluation System, http://www.cs.colostate.edu/
evalfacerec/index10.php.
[45] PARSEC Benchmark Suite, http://parsec.cs.princeton.edu/.
[46] S. Boyd-Wickizer, A. Clements, Y. Mao, A. Pesterev, M. F. Kaashoek, R. Morris,
and N. Zeldovich, “An Analysis of Linux Scalability to Many Cores,” in
Proceedings of OSDI, October 2010.
[47] Apache, The Apache HTTP Server Project. http://httpd.apache.org.
[48] BIOS and Kernel Developer’s Guide (BKDG) For AMD Family 10h Processors,
http://support.amd.com/us/Processor_TechDocs/31116.pdf.
[49] S. Bhatia, A. Kumar, M. E. Fiuczynski, and L. Peterson, “Lightweight, high-
resolution monitoring for troubleshooting production systems,” in Proceedings
of the 8th USENIX conference on Operating systems design and implemen-
tation, ser. OSDI’08. Berkeley, CA, USA: USENIX Association, 2008, pp.
103–116.
[50] L. Soares and M. Stumm, “Flexsc: flexible system call scheduling with exception-
less system calls,” in Proceedings of the 9th USENIX conference on Operating
systems design and implementation, ser. OSDI’10. Berkeley, CA, USA:
USENIX Association, 2010, pp. 1–8.
[51] P. A. G. for Intel Core i7 Processor and I. X. . processors, http://software.intel.
com/sites/products/collateral/hpc/vtune/performance_analysis_guide.pdf.
[52] SystemTap, http://sourceware.org/systemtap/.
[53] C.-K. Luk, R. Cohn, R. Muth, H. Patil, A. Klauser, G. Lowney, S. Wallace, V. J.
Reddi, and K. Hazelwood, “Pin: Building Customized Program Analysis
Tools with Dynamic Instrumentation,” in PLDI, 2005.
[54] M. M. Bach, M. Charney, R. Cohn, E. Demikhovsky, T. Devor, K. Hazelwood,
A. Jaleel, C.-K. Luk, G. Lyons, H. Patil, and A. Tal, “Analyzing parallel
programs with pin,” Computer, vol. 43, no. 3, pp. 34–41, Mar. 2010.
[55] X. Zhang, S. Dwarkadas, and K. Shen, “Towards practical page coloring-based
multicore cache management,” in Proceedings of the 4th ACM European
conference on Computer systems, ser. EuroSys ’09, 2009, pp. 89–102.
[56] F. Gaud, R. Lachaize, B. Lepers, G. Muller, and V. Quéma, “Scheduling applica-
tions on numa multicore platforms with an asymmetric interconnect topology.”
[57] Likwid-Peerfctr, https://code.google.com/p/likwid/wiki/LikwidPerfCtr.
[58] Miniprof, https://github.com/fgaud/Miniprof.
[59] AMD CodeAnalyst Performance Analyzer, http://developer.amd.
com/tools-and-sdks/heterogeneous-computing/archived-tools/
amd-codeanalyst-performance-analyzer/.
96

[60] M. lap Li, R. Sasanka, S. V. Adve, Y. kuang Chen, and E. Debes, “The ALPBench
Benchmark Suite for Complex Multimedia Applications,” in Proceedings of
ISWC, 2005, pp. 34–45.
[61] C. Bienia and K. Li, “PARSEC 2.0: A New Benchmark Suite for Chip-
Multiprocessors,” in Proceedings of the 5th Annual Workshop on Modeling,
Benchmarking and Simulation, 2009.
[62] SPEC, (Standard Performance Evaluation Corporation). SPECweb2005. http:
//www.spec.org/web2005/.
[63] A. Merkel, J. Stoess, and F. Bellosa, “Resource-Conscious Scheduling for Energy
Efficiency on Multicore Processors,” in EuroSys, 2010.
[64] S. Zhuravlev, S. Blagodurov, and A. Fedorova, “Addressing Contention on Multi-
core Processors via Scheduling,” in ASPLOS, 2010.
[65] R. E. Kessler and M. D. Hill, “Page placement algorithms for large real-indexed
caches,” ACM Trans. Comput. Syst., vol. 10, no. 4, pp. 338–359, Nov. 1992.
[66] NUMA Support in Windows, http://msdn.microsoft.com/en-us/library/windows/
desktop/aa363804(v=vs.85).aspx.
[67] J. Mauro and R. McDougall, Solaris Internals (2nd Edition). Upper Saddle
River, NJ, USA: Prentice Hall PTR, 2006.
[68] M. K. Dashti, “Implementation of resource contention management in the linux
kernel for multicore numa systems,” Ph.D. dissertation, Applied Sciences:
School of Computing Science, 2012.
[69] J. Ousterhout, P. Agrawal, D. Erickson, C. Kozyrakis, J. Leverich, D. Mazières,
S. Mitra, A. Narayanan, G. Parulkar, M. Rosenblum, S. M. Rumble, E. Strat-
mann, and R. Stutsman, “The case for ramclouds: scalable high-performance
storage entirely in dram,” SIGOPS Oper. Syst. Rev., vol. 43, no. 4, pp. 92–105,
Jan. 2010.
[70] AMD64 Technology Lightweight Profiling Specification, Aug. 2010, http://
support.amd.com/us/Processor_TechDocs/43724.pdf.
[71] M. Dobrescu, N. Egi, K. Argyraki, B.-G. Chun, K. Fall, G. Iannaccone, A. Knies,
M. Manesh, and S. Ratnasamy, “Routebricks: exploiting parallelism to scale
software routers,” in Proceedings of the ACM SIGOPS 22nd symposium on
Operating systems principles, ser. SOSP ’09, 2009.
97

BIBLIOGRAPHY
98

List of Figures
1 A NUMA system with 4 nodes and 4 cores per node. . . . . . . . . . 1
1.1 Physical to virtual memory mapping. The operating system is in charge
of maintaining the mapping between virtual memory regions and physi-
cal memory. . . . . . . . . . . . . . . . . . . . . . . . . . . . . . . . 5
1.2 Page table format. The operating system segments the addressable
space in “pages”. The mapping between virtual addresses of pages
and their physical address is stored in a page table. On current x86_64
systems, the page table has to be a 4-level hierarchical translation table. 6
1.3 Caches. Modern multicore processors often have multiple levels of
cache. The latency required to access a data in cache is much lower
than that of accessing data in DRAM. . . . . . . . . . . . . . . . . . 6
1.4 Inter-core communications. When two cores share a cache (e.g., a L3),
they communicate via this cache. Otherwise, they communicate using
interconnect links. . . . . . . . . . . . . . . . . . . . . . . . . . . . . 7
1.5 UMA. All processors share a single DRAM controller. . . . . . . . . 10
1.6 NUMA. Cores are grouped into “nodes”. Each node has a DRAM
controller. . . . . . . . . . . . . . . . . . . . . . . . . . . . . . . . . 11
1.7 Topology of the machines used in the evaluations. Some links in
machine C are unidirectional. . . . . . . . . . . . . . . . . . . . . . . 13
1.8 Impact of remote memory accesses on performance of various applica-
tions. . . . . . . . . . . . . . . . . . . . . . . . . . . . . . . . . . . . 15
1.9 Impact of contention on performance of various applications. . . . . . 15
1.10 Fat tree architecture. NUMA nodes are interconnected via multiples
routers. Routers can be interconnected using high bandwidth intercon-
nect links. . . . . . . . . . . . . . . . . . . . . . . . . . . . . . . . . 20
3.1 Overhead of IBS, depending on IBS sampling frequency, with the
simplest IBS interrupt handler possible. . . . . . . . . . . . . . . . . 32
3.2 Output of perf report (a) and perf annotate (b) on FaceRec. (a) The
transposeMultiplyMatrixL function represents 83% of the cycles and
(b) most of the time is spent in a loop that multiplies two matrices. . . 41
4.1 The two types of flows built by MemProf. There is (a) a Thread Event
Flow per profiled thread, and (b) an Object Event Flow per object
accessed during the profiling session. . . . . . . . . . . . . . . . . . . 47
99

LIST OF FIGURES
4.2 Implementation of MemProf. MemProf performs two tasks: event
collection (online) and flow construction (offline). Due to space re-
strictions, we only present the most important fields of the collected
events. . . . . . . . . . . . . . . . . . . . . . . . . . . . . . . . . . . 48
6.1 Algorithm used by Verghese et al. [5]. This decision tree is applied on
all pages accessed in memory. . . . . . . . . . . . . . . . . . . . . . 69
7.1 Workflow of Carrefour. The two boxes in bold (IBS sampling and per
page decisions) represent the costly parts of the workflow. . . . . . . 74
7.2 Algorithm used by Carrefour. This decision tree is applied on all
pages accessed in memory. The “Migrate” and “Interleave” boxes will
only result in migrations or interleaving if migration or interleaving,
respectively, are enabled. . . . . . . . . . . . . . . . . . . . . . . . . 79
8.1 Latency of memory accesses of applications on machine A. . . . . . . 84
8.2 Local Access ratio of applications on machine A. . . . . . . . . . . . 84
8.3 Performance of Carrefour on machine A. . . . . . . . . . . . . . . . . 85
8.4 Performance of Carrefour on machine B. . . . . . . . . . . . . . . . . 86
8.5 Imbalance of applications on machine A. . . . . . . . . . . . . . . . . 87
8.6 Latency of memory accesses of applications on machine B. . . . . . . 87
8.7 Local Access ratio of applications on machine B. . . . . . . . . . . . 87
8.8 Imbalance of applications on machine B. . . . . . . . . . . . . . . . . 87
8.9 Number of memory accesses performed to each node, with a 50ms
resolution. The memory accesses repeat a pattern: first all nodes are
equally accessed, then all accesses are done to node 0, then to node 1,
then to node 3 and finally to node 2. . . . . . . . . . . . . . . . . . . 89
A.1 Local Access ratio of applications on machine A. . . . . . . . . . . . 104
A.2 Latency of memory accesses on machine A. . . . . . . . . . . . . . . 105
A.3 Imbalance on machine A. . . . . . . . . . . . . . . . . . . . . . . . . 106
B.1 Local Access ratio of applications on machine B. . . . . . . . . . . . 108
B.2 Latency of memory accesses on machine B. . . . . . . . . . . . . . . 109
B.3 Imbalance on machine B. . . . . . . . . . . . . . . . . . . . . . . . . 110
100

List of Tables
1.1 Comparison between Hypertransport (AMD) and QuickPath Intercon-
nect (Intel) technologies. The difference between the maximum band-
width supported by the specification and the observed bandwidth is due
to links not using the maximum width (e.g., current AMD processors
use 8 or 16 bit links) or not working at their maximum frequency. . . 8
1.2 Main characteristics of the machines used in the evaluations. . . . . . 12
1.3 Non-exhaustive list of workloads (lines) and NUMA optimizations
(columns). A tick means that the NUMA optimization may make sense
for the given workload. . . . . . . . . . . . . . . . . . . . . . . . . . 19
3.1 Event 1E0 counts memory accesses done from the monitoring node
to others nodes. The destination nodes are controlled using the unit
mask. When set to 00, the event counts nothing. When set to 01, the
event only counts memory accesses from the monitoring node to node 0.
When set to FF, the event counts memory accesses from the monitoring
node to all other nodes. . . . . . . . . . . . . . . . . . . . . . . . . . 30
3.2 Information provided by IBS on a tagged instruction. . . . . . . . . . 31
5.1 Functions performing most remote memory accesses in FaceRec. . . . 54
5.2 Objects remotely accessed in FaceRec. . . . . . . . . . . . . . . . . . 55
5.3 Functions performing most remote memory accesses in Streamcluster. 56
5.4 Objects remotely accessed in Streamcluster. . . . . . . . . . . . . . . 57
5.5 Functions performing remote memory accesses in Psearchy. . . . . . 58
5.6 Types of the main objects that are remotely accessed in Psearchy. . . . 58
5.7 Top functions performing remote memory accesses in the Apache/PHP
stack. . . . . . . . . . . . . . . . . . . . . . . . . . . . . . . . . . . 59
6.1 Summary of optimizations and reason why they do not work in some
workloads. . . . . . . . . . . . . . . . . . . . . . . . . . . . . . . . . 72
7.1 Influence of the period at which Carrefour runs on the performance of
Streamcluster. . . . . . . . . . . . . . . . . . . . . . . . . . . . . . . 75
7.2 (a) Metrics collected using Hardware Counters and kernel statistics. (b)
Metrics collected using IBS. . . . . . . . . . . . . . . . . . . . . . . 76
7.3 Influence of the number of pages considered by Carrefour on the per-
formance of Streamcluster. . . . . . . . . . . . . . . . . . . . . . . . 77
101

LIST OF TABLES
7.4 Cost of per page decisions in Carrefour. . . . . . . . . . . . . . . . . 80
102

APerformance analysis of Carrefour on
machine A
103

0.2
0.3
0.4
0.5
0.6
0.7
0.8
0.9 1
face
recfa
cere
clon
gkm
eansm
atrix
multip
ly
pca
wc
wr
wrm
emBT.BCG.C
EP.CFT.CIS
.D
LU.B
MG.C
SP.AUA.B
UA.C
body
trackfa
cesimflu
idan
imat
e
stre
amclus
ter
swap
tionsx2
64
Local access ratio (%)
Lin
ux
Auto
NU
MA
Manual In
terleavin
gC
arr
efo
ur
Fig
ure
A.1
–L
oca
lA
cces
sra
tio
of
appli
cati
ons
on
mac
hin
eA
.
104

0
200
400
600
800
1000
1200
1400
face
recfa
cere
clon
g
kmea
nsmat
rixm
ultip
ly
pca
wc
wr
wrm
emBT.BCG.C
EP.CFT.CIS
.DLU
.BM
G.C
SP.AUA.B
UA.C
body
trackfa
cesimflu
idan
imat
e
stre
amclus
ter
swap
tionsx2
64
Latency of memory accesses (cycles)
Lin
ux
Auto
NU
MA
Manual In
terleavin
gC
arr
efo
ur
Fig
ure
A.2
–L
aten
cyof
mem
ory
acce
sses
on
mac
hin
eA
.
105

0
50
100
150
200
face
recfa
cere
clon
gkm
eansm
atrix
multip
ly
pca
wc
wr
wrm
emBT.BCG.C
EP.CFT.CIS
.D
LU.B
MG.C
SP.AUA.B
UA.C
body
trackfa
cesimflu
idan
imat
e
stre
amclus
ter
swap
tionsx2
64
Imbalance (%)
Lin
ux
Auto
NU
MA
Manual In
terleavin
gC
arr
efo
ur
Fig
ure
A.3
–Im
bal
ance
on
mac
hin
eA
.
106

BPerformance analysis of Carrefour on
machine B
107

0.2
0.3
0.4
0.5
0.6
0.7
0.8
0.9 1
face
recfa
cere
clon
gkm
eansm
atrix
multip
ly
pca
wc
wr
wrm
emBT.BCG.C
EP.CFT.CIS
.D
LU.B
MG.C
SP.AUA.B
UA.C
body
trackfa
cesimflu
idan
imat
e
stre
amclus
ter
swap
tionsx2
64
Local access ratio (%)
Lin
ux
Auto
NU
MA
Manual In
terleavin
gC
arr
efo
ur
Fig
ure
B.1
–L
oca
lA
cces
sra
tio
of
appli
cati
ons
on
mac
hin
eB
.
108

100
200
300
400
500
600
700
800
900
1000
face
recfa
cere
clon
g
kmea
nsmat
rixm
ultip
ly
pca
wc
wr
wrm
emBT.BCG.C
EP.CFT.CIS
.DLU
.BM
G.C
SP.AUA.B
UA.C
body
trackfa
cesimflu
idan
imat
e
stre
amclus
ter
swap
tionsx2
64
Latency of memory accesses (cycles)
Lin
ux
Auto
NU
MA
Manual In
terleavin
gC
arr
efo
ur
Fig
ure
B.2
–L
aten
cyof
mem
ory
acce
sses
on
mac
hin
eB
.
109

0
50
100
150
200
face
recfa
cere
clon
gkm
eansm
atrix
multip
ly
pca
wc
wr
wrm
emBT.BCG.C
EP.CFT.CIS
.D
LU.B
MG.C
SP.AUA.B
UA.C
body
trackfa
cesimflu
idan
imat
e
stre
amclus
ter
swap
tionsx2
64
Imbalance (%)
Lin
ux
Auto
NU
MA
Manual In
terleavin
gC
arr
efo
ur
Fig
ure
B.3
–Im
bal
ance
on
mac
hin
eB
.
110

111