improving packet delivery performance in water column
TRANSCRIPT
Research ArticleImproving Packet Delivery Performance in Water ColumnVariations through LOCAN in Underwater AcousticSensor Network
Rajeswari A ,1 Duraipandian N ,1 Shanker NR ,2 and Betty Elezebeth Samuel 3
1Department of Computer Science and Engineering, Velammal Engineering College, Chennai 66, India2Department of Electronics and Communication Engineering, Aalim Muhammed Salegh College of Engineering, Chennai 55, India3Department of Computer Science and Information Technology, Jazan University, Saudi Arabia
Correspondence should be addressed to Rajeswari A; [email protected]
Received 1 November 2019; Accepted 21 January 2020; Published 20 February 2020
Academic Editor: Sabrina Gaito
Copyright © 2020 Rajeswari A et al. This is an open access article distributed under the Creative Commons Attribution License,which permits unrestricted use, distribution, and reproduction in any medium, provided the original work is properly cited.
This paper proposes Lion Optimized Cognitive Acoustic Network (LOCAN) to reduce packet delay and packet loss during packettransmission in Underwater Acoustic Sensor Network (UWASN). Packet delay and packet loss in UWASN are because of watercolumn variations such as Doppler effect and geometric spreading (GS). Doppler effect forms due to sensor node’s motion andsea surface variations such as salinity and temperature. Geometric spreading (GS) occurs due to sediment drift wave fronts andfrequent changes in node’s location and depth. Water column variations change the amplitude of sound propagation, causingchannel coherence and multipath interference, which affect packet transmission. The existing UWASN algorithms focus only ontemperature and salinity variations. In LOCAN, channel selection through Lion Optimization Algorithm solves the problems ofwater column variation and improves the battery life, network lifetime, and throughput. The proposed algorithms show a betterresult in terms of efficiency, when compared to existing UWASN algorithms.
1. Introduction
In UWASN, acoustic signal propagates through water col-umn variations, direct, surface, and bottom reflected path.The propagating acoustic signal interacts with different watercolumn variations. The water column variations are spatialand temporal. The spatial variations are Doppler effect andtemperature. The temporal variations (TV) are GS, salinity,and other multipath path interaction on the surface or bot-tom of the sea surface. The Doppler effect forms due to thewater surface variations and movement of sensor nodes.The Doppler effects affect the acoustic signal sound intensityby defocusing and bending the signal and create a noncoher-ent communication between the acoustic nodes. The watercolumn variations cause the time spreading of acoustic signalwhich leads to multipath interference. The multipath inter-ference affects the packet transmission in UWASN. The GSleads to acoustical signal attenuation due to change in thelocation of the node and sedimentation drift. The change in
the distance of the nodes can be due to water column varia-tions such as solitons, eddies, internal waves, and internaltides. The sedimentation drift waves which carry sand parti-cles reduce the magnitude of acoustic signal, affect the direc-tion of signals, and change the nodes’ location.
In UWASN, high energy consumption and packet deliv-ery are challenging tasks for nodes in the network. Thesource node in the acoustic network determines the forward-ing relay set based on the forwarder’s local information.Fuzzy logic-based relay selection scheme is used for thedetermination of the relay node. The forwarding relay nodeset is determined after checking the channel link of the neigh-boring nodes. In the channel link, the data rate, and node’sdepth based on the source node, neighbor node is added inthe relay set or else discarded. From the relay set, fuzzylogic-based relay selection is used for selection of the opti-mum relay. Fuzzy logic algorithm performs based on twoinputs, namely, Packet Delivery Probability (PDP) andEnergy Consumption Ratio (ECR).
HindawiJournal of SensorsVolume 2020, Article ID 7960654, 16 pageshttps://doi.org/10.1155/2020/7960654
In Energy-Efficient Cooperative Opportunistic RoutingProtocol, the actual packet transmission happens when thesource node broadcasts the packet to the neighboring relayset and the nodes set a holding timer to avoid collision inpacket transmission. The process continues until the packetreaches the surface sink. In the above process, if the first bestrelay node fails to broadcast the packet, then the packet isforwarded by the second best relay node set. If the packetis successfully transmitted to the next hop destination, theother nodes drop the holding timer and packet. The relayset performance is evaluated through average packet deliveryratio, average end-to-end delay, average energy consump-tion, and average network delay [1].
The energy management in UWASN plays a vital rolebecause of the nonavailability of alternate energy sourcessuch as solar and fuel cells. The energy management isachieved through BEAR protocol, which calculates the rel-ative location distance from the sink and facilitating node.Furthermore, energy-efficient routing in underwater WSNis obtained through ECARP (Existing Channel AwareRouting Protocol) algorithm [2], with sonobuoy sink nodeon the surface. The ECARP algorithm performs in three-dimensional Euclidean spaces to forward the packet basedon the computation of the node’s distance and data rate,via the sink node and relay nodes. In addition, the latencyin end-to-end delay is solved through a cluster-based heu-ristic method. End-to-end delay plays a vital role in delaysensitivity of underwater communication. The optimisticrouting through a metric called EELjSuccessðFiÞ is imple-mented [3], where Fi represents the success in receivingthe packet for i node. The algorithm consists of packetforwarding prioritization method which reduces the end-to-end delay with increased energy cost.
The problems in underwater acoustic network are thespatial and temporal variation, propagation delay, andwater column variation. The propagation delay and spatialand TV are due to ocean current, salinity, and tempera-ture and affect reliable data transmission. Propagationdelay in underwater communication occurs because ofsalinity in seawater which is about 3.5 percent and consistsof NaCl, Cl, SO₄2-, Mg, Ca, Br-, and K. The salt in theseawater causes the problem of spectrum scarcity andlatency. The spectrum and latent problem needs an effi-cient algorithm to overcome the transmission delay, packetdelivery, and energy loss in the UWASN. However, thewater column variations such as geometric and Dopplereffects lead to amplitude variation in the propagating sig-nals. The amplitude variation increases the packet lossduring data transmission. Furthermore, the propagationdelay due to Doppler effect creates channel coherenceand multipath propagation. The above problems consumemore battery power and lead to high bit rate error. A pathloss occurs due to scattering, refraction, and dispersion inthe acoustic signal because of sedimentation drift andDoppler spread. In addition, GS occurs due to the expan-sion of wave fronts and increases the distance of propaga-tion. Furthermore, the multipath fading occurs due to thefact that sensor node location varies based on wave frontand sedimentation drift.
1.1. Contributions
(i) The problems of spatial and temporal water columnvariations such as Doppler, GS, and sedimentationdrift which occur in UWASN are solved throughthe proposed Lion Optimized Cognitive AcousticNetworks (LOCAN). LOCAN change the channeland bandwidth based on the water columnvariations
(ii) Doppler and GS are avoided through distancematrix topology framework in lion optimizationand reduce the delay due to channel coherence
(iii) The data transmission in different temperature andsalinity is optimized based on channel selection,bandwidth, and simulation results validated inUWASN test bed
The rest of this paper is organized as follows. Section 2introduces the optimization algorithm and explains the exist-ing system and the acoustic network. Section 3 proposes themethodology of the Cat Optimized and Lion Optimized Cog-nitive Acoustic Network algorithm. These algorithms aresimulated in the AquaSim simulation tool, and the resultsare shown in Section 4. The hardware implementation onthe test bed in Doppler and the GS environment is shownin Section 5. Finally, conclusion is in Section 6.
2. Related Work
2.1. Optimization Algorithm in UWASN. In WSN, efficientrouting from source to destination node performs throughdifferent algorithms such as AODV, DSR, joint energy-aware routing, and opportunistic routing. However, the opti-mization algorithms in WSN routing increase the battery lifeand improve the efficiency of routing with high throughput.The ant colony optimization algorithm [4] is applied inWSN for the improvement of routing in the network throughposition information and searching direction. The path selec-tion in the ant algorithm is according to the probabilistic rule,which consists of pheromone impact factor and heuristicinformation. The ant optimization algorithm increases thebattery life of a node and reduces energy consumption dueto the searching direction of destination node and transferthe data. Furthermore, Biogeography-Based Optimization(BBO) algorithm [5] increases the coverage area of the net-work in static and mobile sensor nodes. The algorithmincreases the coverage area on the basis of the immigrationand emigration rate calculation and dynamic deploymentproblem of sensor nodes which solves through fitness valuesand sorts the best coverage area. Furthermore, the glowwormswarm optimization algorithm [6] increases the coverage andenergy efficiency of the node by changing the intensity basedon the distance of the nodes. Furthermore, the harmonysearch algorithm [7] in cluster nodes increases the energyefficiency of sensor nodes and network lifetime through opti-mizing the distance between the cluster head and intraclusterheads of the node. The optimization algorithm finds applica-tion in UWASN for the improvement of the range and
2 Journal of Sensors
range-free localization for node location. The sequentialgreedy optimization algorithm performs node location inUWASN through the use of iteration and decision variablesin underwater sensor network. Further, the first-orderKarush-Kuhn-Tucker (KKT) algorithms does the analysisof diverging properties of the greedy algorithm during thelocalization of nodes [8]. The challenges in UWASN areDoppler scale which affect the signal path and need an esti-mating parameter for channels. The channel estimationhelps to increase the amplitude for each individual pathand reduction in time delay. The proposed algorithmshould identify the best path to the destination node inunderwater sensor network and avoid the multipath andreduce delay and improve packet transmission. Further-more, the optimization algorithms address the various chal-lenges such as optimal deployment, node localization, andclustering and data aggregation. Table 1 shows variousalgorithms in UWASN with advantages and disadvantages.
2.2. Inferences from Literature Survey. The existing WSNand UWASN perform the optimization algorithm for theimprovement of the battery life, network lifetime, and
throughput and minimizes the delay and packet loss.However, the challenging problems in UWASN are thespatial and temporal variation, Doppler and GS, andsalinity. The proposed optimization algorithms shouldconsider the above problems. The Cat (COCAN) and LionOptimization Algorithm (LOCAN) which is a multidi-mensional approach method and velocities of each dimen-sion change with fitness value identified solves the aboveproblem with iteration.
3. Methodology
3.1. Cat Optimization Algorithm in Underwater CognitiveAcoustic Network (COCAN). The cats spend most of the cat’stime in resting, still cautious about the surroundings andmoving objects nearby. The cautious nature and high alert-ness lead to the minimum time for chasing the prey and con-serve body energy. The cat nature is applied in UWASN forchannel selection according to the destination and surroundingenvironment, i.e., water column and conserves energy as CatOptimization Algorithm. The Cat Optimization Algorithm isgrouped into two modes such as seeking and tracing.
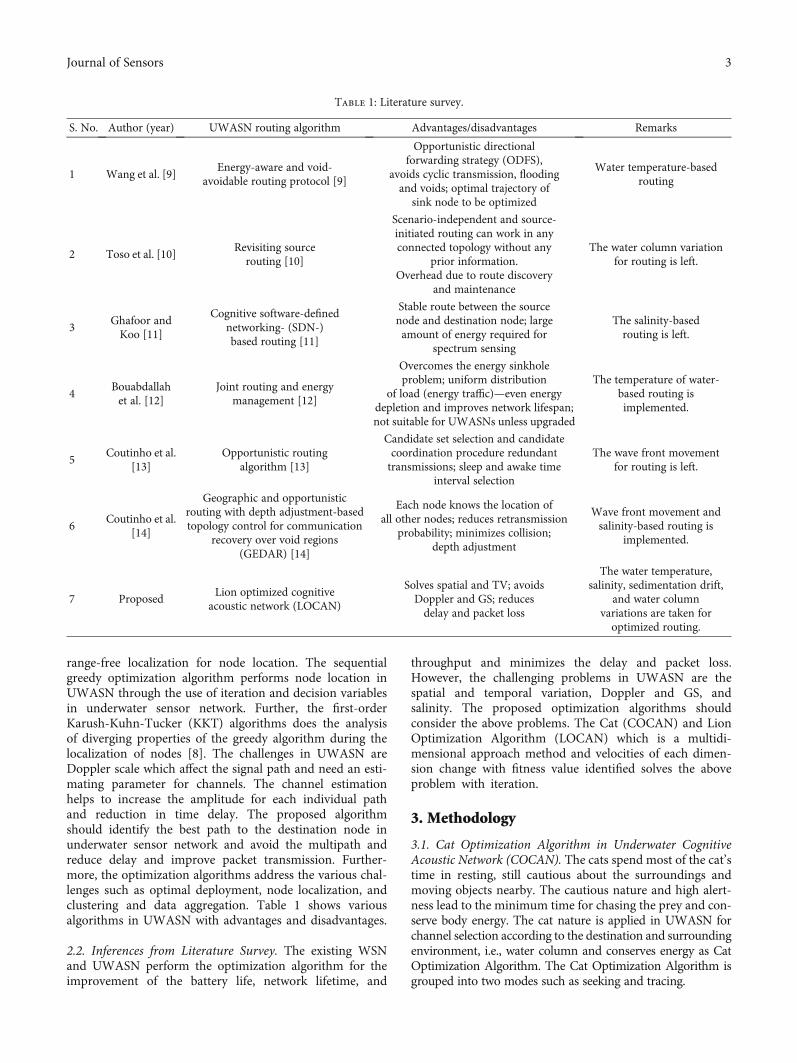
Table 1: Literature survey.
S. No. Author (year) UWASN routing algorithm Advantages/disadvantages Remarks
1 Wang et al. [9]Energy-aware and void-
avoidable routing protocol [9]
Opportunistic directionalforwarding strategy (ODFS),
avoids cyclic transmission, floodingand voids; optimal trajectory of
sink node to be optimized
Water temperature-basedrouting
2 Toso et al. [10]Revisiting sourcerouting [10]
Scenario-independent and source-initiated routing can work in anyconnected topology without any
prior information.Overhead due to route discovery
and maintenance
The water column variationfor routing is left.
3Ghafoor andKoo [11]
Cognitive software-definednetworking- (SDN-)based routing [11]
Stable route between the sourcenode and destination node; largeamount of energy required for
spectrum sensing
The salinity-basedrouting is left.
4Bouabdallahet al. [12]
Joint routing and energymanagement [12]
Overcomes the energy sinkholeproblem; uniform distribution
of load (energy traffic)—even energydepletion and improves network lifespan;not suitable for UWASNs unless upgraded
The temperature of water-based routing isimplemented.
5Coutinho et al.
[13]Opportunistic routing
algorithm [13]
Candidate set selection and candidatecoordination procedure redundanttransmissions; sleep and awake time
interval selection
The wave front movementfor routing is left.
6Coutinho et al.
[14]
Geographic and opportunisticrouting with depth adjustment-basedtopology control for communication
recovery over void regions(GEDAR) [14]
Each node knows the location ofall other nodes; reduces retransmission
probability; minimizes collision;depth adjustment
Wave front movement andsalinity-based routing is
implemented.
7 ProposedLion optimized cognitive
acoustic network (LOCAN)
Solves spatial and TV; avoidsDoppler and GS; reducesdelay and packet loss
The water temperature,salinity, sedimentation drift,
and water columnvariations are taken foroptimized routing.
3Journal of Sensors

In the seeking mode, the cat decides to move slowly andcautiously. It knows the environment for the movement.The seeking mode is represented through parameters suchas Seeking Memory Pool (SMP), Seeking Range of selectedDimension (SRD), Counts of Dimension to Change (CDC),and Self-Position Consideration (SPC). SMP is the numberof copies of each cat in the seeking process. SRD is themaximum difference between the new and old values inthe dimensions selected for mutation. CDC shows thedimensions of mutation. SPC is the Boolean variable repre-senting the current position of the cat as a candidate posi-tion for movement.
Algorithm 1 is the Cat Optimization Algorithm pseudo-code which performs for channel selection. In the algorithm,the nodes are initially distributed at random with a velocityand a self-position consideration value based on water col-umn variations. In addition, the fitness value represents thedistance between the source and destination node along withcurrent channel selection for packet transmission. The fitnessvalue is calculated until the termination condition is satisfiedaccording to water column variations. A similar fitness valueis calculated for all the nodes in the network for the bestchannel selection based on water column variations. More-
over, the cat selects the seeking mode only when SPC channelis one or else a tracing mode.
In the tracing mode, the cat chases the destination nodewith the velocity vi,d , i represents the source node and d thedimensions for water column variation. When the channelis selected across the dimension d for water column variation,every new channel of the source node is to be calculated asshown in Algorithm 1.
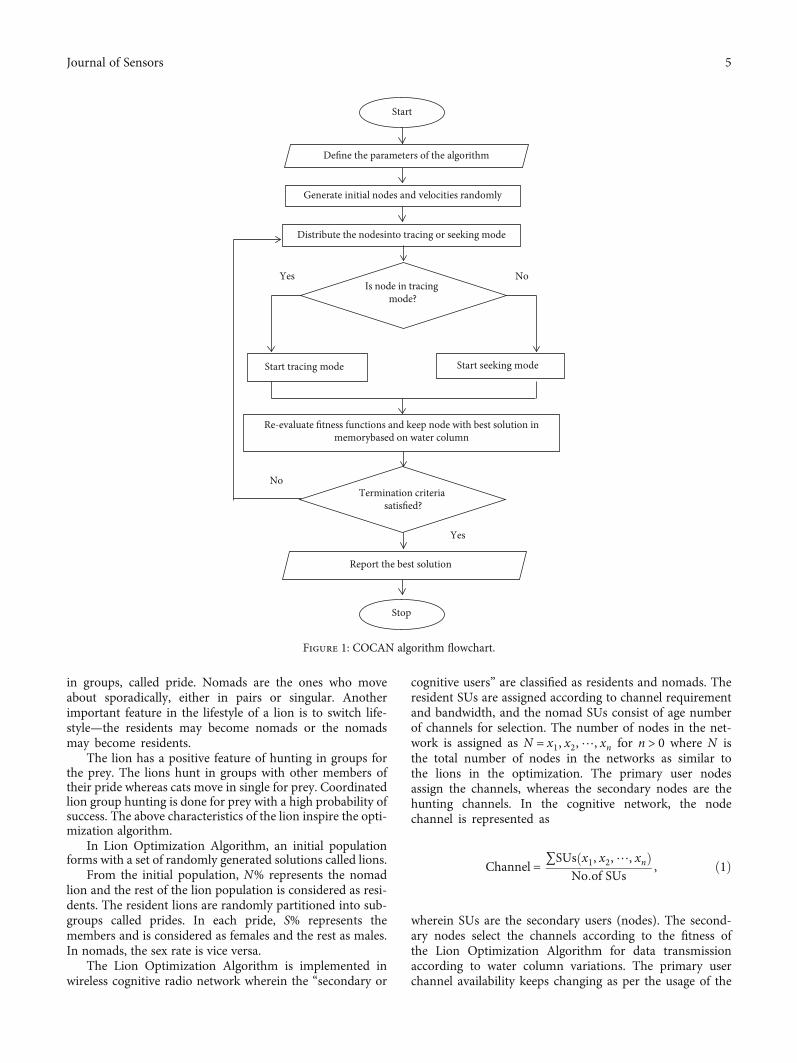
The workflow of the COCAN algorithm is shown inFigure 1. The next algorithm is the Lion Optimization Algo-rithm, which removes the problem in Cat OptimizationAlgorithm such as the dimension for water column variationestimation and mode to wait and analyze the channel selec-tion, which consumes time to a greater extent.
3.2. Lion Optimized Cognitive Acoustic Networks (LOCAN).The Lion Optimization Algorithm inspires the characteris-tics of a lion such as strong sexual dimorphism in socialbehavior, appearance, and lifestyle, i.e., hunting in groupand lifestyle switching. The Lion Optimization Algorithmincludes certain cat characteristics such as the high levelof cooperation and antagonism. The lion residing is oftwo types such as residents and nomads. Residents live
BeginInput parameters to the algorithmInitialize the nodes Xi (i = 1, 2,⋯, n), v, and SPC based on water column variation parameterWhile (termination criteria not satisfied or I < Imax)
Calculate the fitness function value for all the nodes and sort themXs =Node with best solution
For i = 1 : NIf SPC = 1Start seeking modeXnp = new position of nodes in underwater networkXcp = current position of nodes in underwater with parametersR = random number varies between 0 and 1 based on co-channel interferencePi = probability of current node i based on water column variationsFSi = fitness value of node i based on current Doppler effect and GSFSmax =maximum value of fitness function, FSmin =minimum value of fitness
function for different water column variations and channel selectionXnp = ð1 ± SRD × RÞ × Xcp
Pi =jFSi − FSbj
jFSmax − FSminj, 0 < i < j
ElseStart tracing modeXbest,d = position of the cat with the best solution in water column variationXi,d = position of the cat i in dimension d of water variation parametersc1 = a constantr1 = a random value in range [0,1]Xi,d,new = the new position of cat i in dimension d varying water column and selects the channelXi,d,old = current position of cat i in dimension d varying water column with current channel
vi,d = vi,d + r1 × c1ðXbest,d − Xi,dÞXi,d,new = Xi,d,old + vi,d
End ifEnd for i
End whilePost-processing the results and visualization
End
Algorithm 1: Cat Optimized Cognitive Acoustic Networks (COCAN) for UWASN.
4 Journal of Sensors
in groups, called pride. Nomads are the ones who moveabout sporadically, either in pairs or singular. Anotherimportant feature in the lifestyle of a lion is to switch life-style—the residents may become nomads or the nomadsmay become residents.
The lion has a positive feature of hunting in groups forthe prey. The lions hunt in groups with other members oftheir pride whereas cats move in single for prey. Coordinatedlion group hunting is done for prey with a high probability ofsuccess. The above characteristics of the lion inspire the opti-mization algorithm.
In Lion Optimization Algorithm, an initial populationforms with a set of randomly generated solutions called lions.
From the initial population, N% represents the nomadlion and the rest of the lion population is considered as resi-dents. The resident lions are randomly partitioned into sub-groups called prides. In each pride, S% represents themembers and is considered as females and the rest as males.In nomads, the sex rate is vice versa.
The Lion Optimization Algorithm is implemented inwireless cognitive radio network wherein the “secondary or
cognitive users” are classified as residents and nomads. Theresident SUs are assigned according to channel requirementand bandwidth, and the nomad SUs consist of age numberof channels for selection. The number of nodes in the net-work is assigned as N = x1, x2,⋯, xn for n > 0 where N isthe total number of nodes in the networks as similar tothe lions in the optimization. The primary user nodesassign the channels, whereas the secondary nodes are thehunting channels. In the cognitive network, the nodechannel is represented as
Channel = ∑SUs x1, x2,⋯, xnð ÞNo:of SUs , ð1Þ
wherein SUs are the secondary users (nodes). The second-ary nodes select the channels according to the fitness ofthe Lion Optimization Algorithm for data transmissionaccording to water column variations. The primary userchannel availability keeps changing as per the usage of the
Start
Define the parameters of the algorithm
Report the best solution
Generate initial nodes and velocities randomly
Distribute the nodesinto tracing or seeking mode
Start tracing mode Start seeking mode
Is node in tracing mode?
Re-evaluate fitness functions and keep node with best solution inmemorybased on water column
Termination criteria satisfied?
Stop
Yes
Yes
No
No
Figure 1: COCAN algorithm flowchart.
5Journal of Sensors
primary user according to wave fronts and water column var-iations. The primary user channel change is as follows:
Channel′ = Channel + rand 0, 1ð Þ × PI × Channel − SUð Þ,ð2Þ
wherein Channel′ represents the availability of next freereliable primary channel and the Channel in the aboveequation shows the current availability of the channel inthe network. Moreover, PI represents the percentage ofimprovement in SU’s fitness according to cochannel anal-ysis, divergence of signal, and water column variationparameters. The secondary users deploy at the left wingor right wing or at the center of the channels availablein the primary user network. The SUs are in search ofchannels continuously according to the variations in thewater column and new channels of the SUs are in the leftand the right wing as in
SUnpos =
rand 2 × Channel − SUcpos� �
, Channel� �
,
2 × Channel − SUcpos� �
< Channel,
rand Channel 2 × Channel − SUcpos� �� �
,
2 × Channel − SUcpos� �
> Channel,
8>>>>><>>>>>:
ð3Þ
whereas SUnpos represents the new positions of channelselection for the secondary user based on water columnparameters, SUcpos for the current channel position ofthe secondary user, and Channel represents the currentposition of the available primary channel. The new chan-nel position of the secondary user in the center calculatesas in
SUnpos =rand SUcpos, Channel
� �, SUcpos < Channel,
rand Channel, SUcpos� �
, SUcpos > Channel:
(
ð4Þ
The rand (SUcpos, Channel) function in equation (4)generates a random number between the current channelposition of the secondary user (SUcpos) and the currentposition of the available primary channel (Channel)according to the fitness of data transmission based on cur-rent parameter of water column.
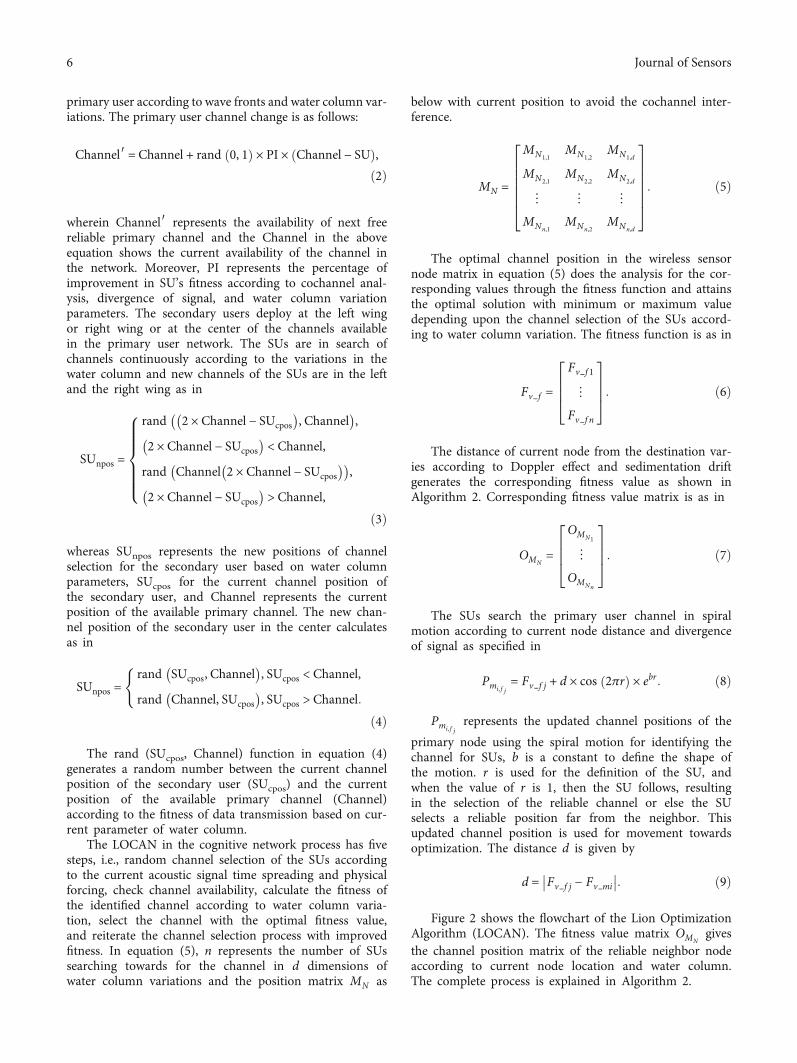
The LOCAN in the cognitive network process has fivesteps, i.e., random channel selection of the SUs accordingto the current acoustic signal time spreading and physicalforcing, check channel availability, calculate the fitness ofthe identified channel according to water column varia-tion, select the channel with the optimal fitness value,and reiterate the channel selection process with improvedfitness. In equation (5), n represents the number of SUssearching towards for the channel in d dimensions ofwater column variations and the position matrix MN as
below with current position to avoid the cochannel inter-ference.
MN =
MN1,1MN1,2
MN1,d
MN2,1MN2,2
MN2,d
⋮ ⋮ ⋮
MNn,1MNn,2
MNn,d
2666664
3777775: ð5Þ
The optimal channel position in the wireless sensornode matrix in equation (5) does the analysis for the cor-responding values through the fitness function and attainsthe optimal solution with minimum or maximum valuedepending upon the channel selection of the SUs accord-ing to water column variation. The fitness function is as in
Fv f =Fv f 1
⋮
Fv f n
2664
3775: ð6Þ
The distance of current node from the destination var-ies according to Doppler effect and sedimentation driftgenerates the corresponding fitness value as shown inAlgorithm 2. Corresponding fitness value matrix is as in
OMN=
OMN1
⋮
OMNn
2664
3775: ð7Þ
The SUs search the primary user channel in spiralmotion according to current node distance and divergenceof signal as specified in
Pmi, f j= Fv f j + d × cos 2πrð Þ × ebr: ð8Þ
Pmi, f jrepresents the updated channel positions of the
primary node using the spiral motion for identifying thechannel for SUs, b is a constant to define the shape ofthe motion. r is used for the definition of the SU, andwhen the value of r is 1, then the SU follows, resultingin the selection of the reliable channel or else the SUselects a reliable position far from the neighbor. Thisupdated channel position is used for movement towardsoptimization. The distance d is given by
d = Fv f j − Fv mi
�� ��: ð9Þ
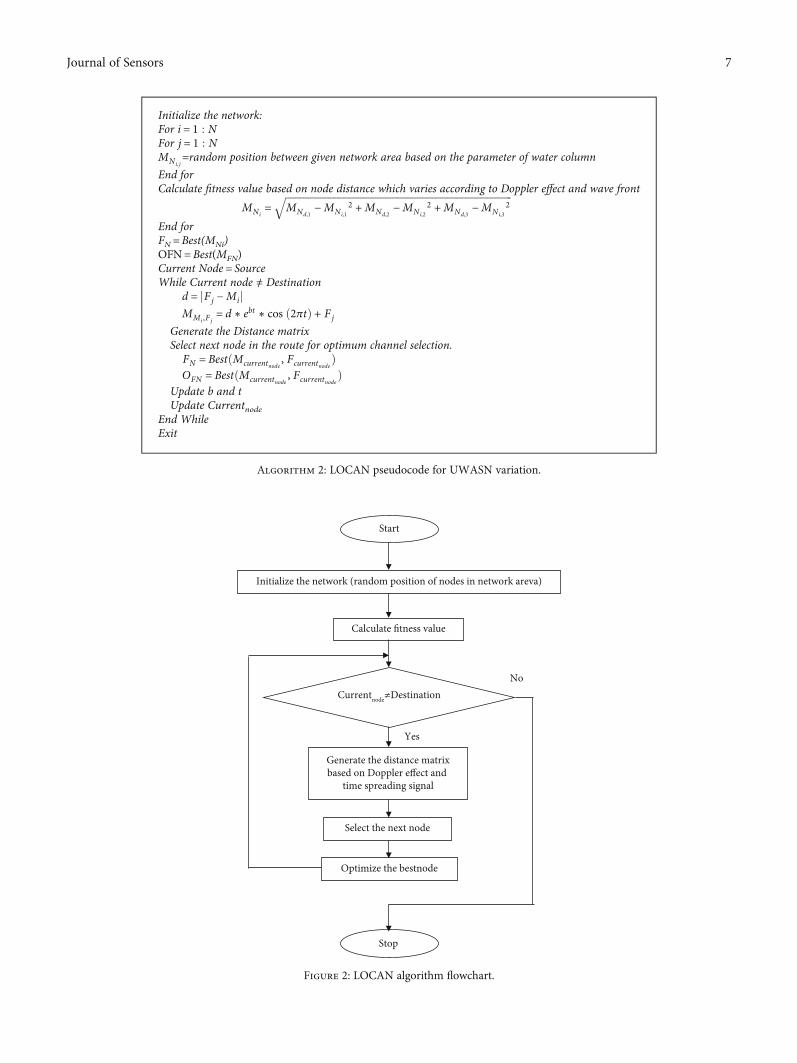
Figure 2 shows the flowchart of the Lion OptimizationAlgorithm (LOCAN). The fitness value matrix OMN
givesthe channel position matrix of the reliable neighbor nodeaccording to current node location and water column.The complete process is explained in Algorithm 2.
6 Journal of Sensors
Start
Initialize the network (random position of nodes in network areva)
Calculate fitness value
Currentnode≠Destination
Generate the distance matrixbased on Doppler effect and
time spreading signal
Select the next node
Optimize the bestnode
Stop
No
Yes
Figure 2: LOCAN algorithm flowchart.
Initialize the network:For i = 1 : NFor j = 1 : NMNi, j
=random position between given network area based on the parameter of water column
End forCalculate fitness value based on node distance which varies according to Doppler effect and wave front
MNi=
ffiffiffiffiffiffiffiffiffiffiffiffiffiffiffiffiffiffiffiffiffiffiffiffiffiffiffiffiffiffiffiffiffiffiffiffiffiffiffiffiffiffiffiffiffiffiffiffiffiffiffiffiffiffiffiffiffiffiffiffiffiffiffiffiffiffiffiffiffiffiffiffiffiffiffiffiffiffiffiffiffiffiffiffiffiffiffiffiffiffiffiMNd,1
−MNi,12 +MNd,2
−MNi,22 +MNd,3
−MNi,32
q
End forFN =Best(MNi)OFN=Best(MFN)Current Node = SourceWhile Current node ≠ Destination
d = jFj −MijMMi ,F j
= d ∗ ebt ∗ cos ð2πtÞ + Fj
Generate the Distance matrixSelect next node in the route for optimum channel selection.
FN = BestðMcurrentnode, Fcurrentnode
ÞOFN = BestðMcurrentnode
, FcurrentnodeÞ
Update b and tUpdate Currentnode
End WhileExit
Algorithm 2: LOCAN pseudocode for UWASN variation.
7Journal of Sensors
Algorithm 2 is used for the generation of an optimizedchannel selection. The implementation and results of thealgorithm are discussed in Section 4.
In the simulation, all the nodes are deployed at the samepoint and then disbursed to their desired positions in the tar-get area of 1200m × 1200m × 10m. The distance betweenthe nodes is set at 120m. The nodes are assigned with theproperties of underwater communication such as water col-umn variation and aligned in the form of a matrix accordingto the current position of node due to Doppler effect and GSnature due to sedimentation drift. They have a mild move-ment of 3 inches/sec as they are deployed in the underwaterenvironment. The underwater communication works under25 kHz frequencies. The parameters used for the configura-tion of the simulations are shown in Table 2.
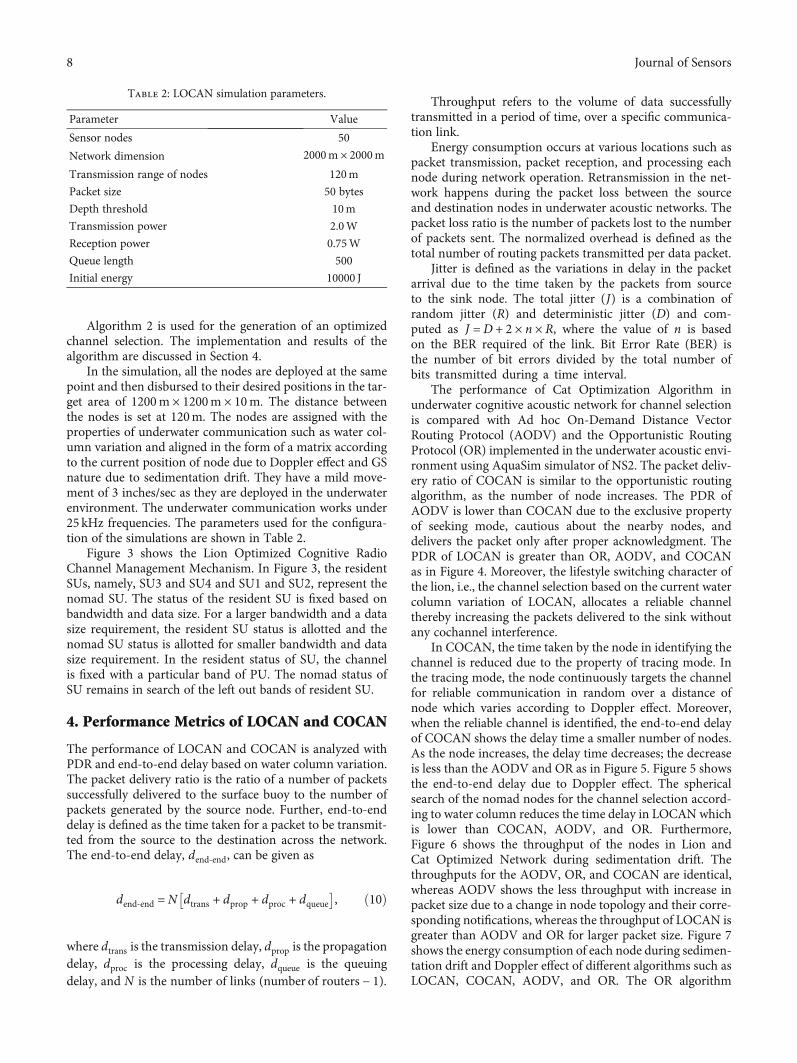
Figure 3 shows the Lion Optimized Cognitive RadioChannel Management Mechanism. In Figure 3, the residentSUs, namely, SU3 and SU4 and SU1 and SU2, represent thenomad SU. The status of the resident SU is fixed based onbandwidth and data size. For a larger bandwidth and a datasize requirement, the resident SU status is allotted and thenomad SU status is allotted for smaller bandwidth and datasize requirement. In the resident status of SU, the channelis fixed with a particular band of PU. The nomad status ofSU remains in search of the left out bands of resident SU.
4. Performance Metrics of LOCAN and COCAN
The performance of LOCAN and COCAN is analyzed withPDR and end-to-end delay based on water column variation.The packet delivery ratio is the ratio of a number of packetssuccessfully delivered to the surface buoy to the number ofpackets generated by the source node. Further, end-to-enddelay is defined as the time taken for a packet to be transmit-ted from the source to the destination across the network.The end-to-end delay, dend‐end, can be given as
dend‐end =N dtrans + dprop + dproc + dqueue� �
, ð10Þ
where dtrans is the transmission delay, dprop is the propagationdelay, dproc is the processing delay, dqueue is the queuingdelay, and N is the number of links (number of routers − 1).
Throughput refers to the volume of data successfullytransmitted in a period of time, over a specific communica-tion link.
Energy consumption occurs at various locations such aspacket transmission, packet reception, and processing eachnode during network operation. Retransmission in the net-work happens during the packet loss between the sourceand destination nodes in underwater acoustic networks. Thepacket loss ratio is the number of packets lost to the numberof packets sent. The normalized overhead is defined as thetotal number of routing packets transmitted per data packet.
Jitter is defined as the variations in delay in the packetarrival due to the time taken by the packets from sourceto the sink node. The total jitter (J) is a combination ofrandom jitter (R) and deterministic jitter (D) and com-puted as J =D + 2 × n × R, where the value of n is basedon the BER required of the link. Bit Error Rate (BER) isthe number of bit errors divided by the total number ofbits transmitted during a time interval.
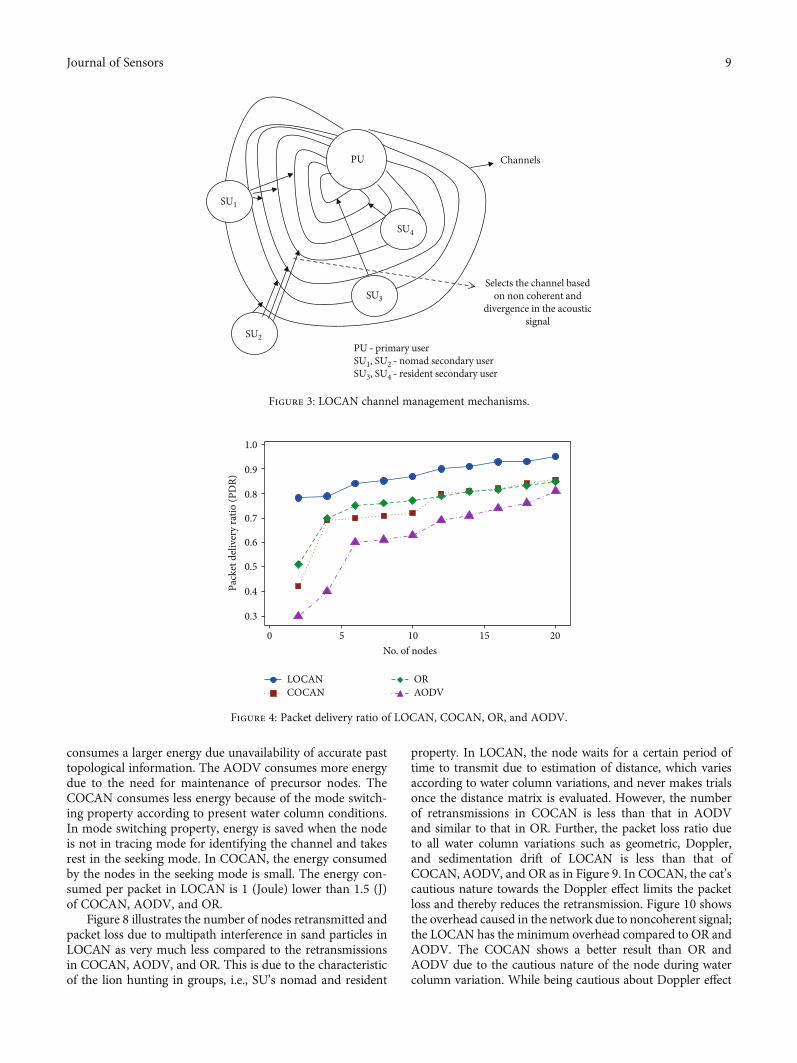
The performance of Cat Optimization Algorithm inunderwater cognitive acoustic network for channel selectionis compared with Ad hoc On-Demand Distance VectorRouting Protocol (AODV) and the Opportunistic RoutingProtocol (OR) implemented in the underwater acoustic envi-ronment using AquaSim simulator of NS2. The packet deliv-ery ratio of COCAN is similar to the opportunistic routingalgorithm, as the number of node increases. The PDR ofAODV is lower than COCAN due to the exclusive propertyof seeking mode, cautious about the nearby nodes, anddelivers the packet only after proper acknowledgment. ThePDR of LOCAN is greater than OR, AODV, and COCANas in Figure 4. Moreover, the lifestyle switching character ofthe lion, i.e., the channel selection based on the current watercolumn variation of LOCAN, allocates a reliable channelthereby increasing the packets delivered to the sink withoutany cochannel interference.
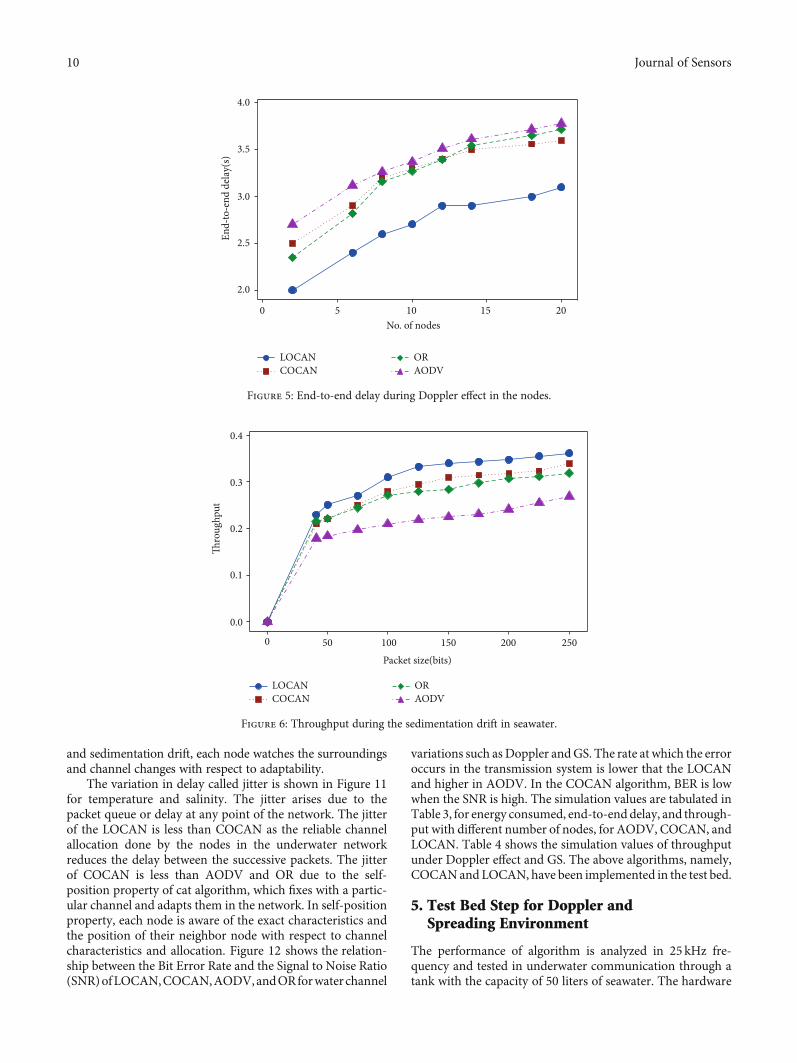
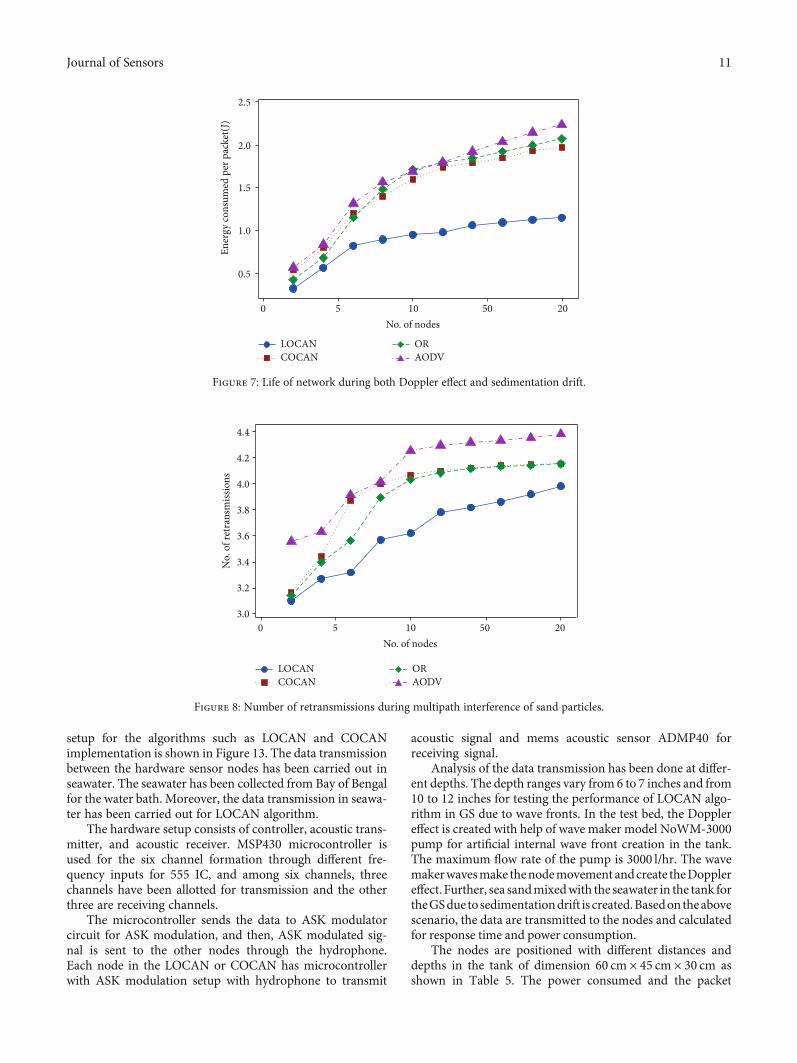
In COCAN, the time taken by the node in identifying thechannel is reduced due to the property of tracing mode. Inthe tracing mode, the node continuously targets the channelfor reliable communication in random over a distance ofnode which varies according to Doppler effect. Moreover,when the reliable channel is identified, the end-to-end delayof COCAN shows the delay time a smaller number of nodes.As the node increases, the delay time decreases; the decreaseis less than the AODV and OR as in Figure 5. Figure 5 showsthe end-to-end delay due to Doppler effect. The sphericalsearch of the nomad nodes for the channel selection accord-ing to water column reduces the time delay in LOCAN whichis lower than COCAN, AODV, and OR. Furthermore,Figure 6 shows the throughput of the nodes in Lion andCat Optimized Network during sedimentation drift. Thethroughputs for the AODV, OR, and COCAN are identical,whereas AODV shows the less throughput with increase inpacket size due to a change in node topology and their corre-sponding notifications, whereas the throughput of LOCAN isgreater than AODV and OR for larger packet size. Figure 7shows the energy consumption of each node during sedimen-tation drift and Doppler effect of different algorithms such asLOCAN, COCAN, AODV, and OR. The OR algorithm
Table 2: LOCAN simulation parameters.
Parameter Value
Sensor nodes 50
Network dimension 2000m × 2000mTransmission range of nodes 120m
Packet size 50 bytes
Depth threshold 10m
Transmission power 2.0W
Reception power 0.75W
Queue length 500
Initial energy 10000 J
8 Journal of Sensors
consumes a larger energy due unavailability of accurate pasttopological information. The AODV consumes more energydue to the need for maintenance of precursor nodes. TheCOCAN consumes less energy because of the mode switch-ing property according to present water column conditions.In mode switching property, energy is saved when the nodeis not in tracing mode for identifying the channel and takesrest in the seeking mode. In COCAN, the energy consumedby the nodes in the seeking mode is small. The energy con-sumed per packet in LOCAN is 1 (Joule) lower than 1.5 (J)of COCAN, AODV, and OR.
Figure 8 illustrates the number of nodes retransmitted andpacket loss due to multipath interference in sand particles inLOCAN as very much less compared to the retransmissionsin COCAN, AODV, and OR. This is due to the characteristicof the lion hunting in groups, i.e., SU’s nomad and resident
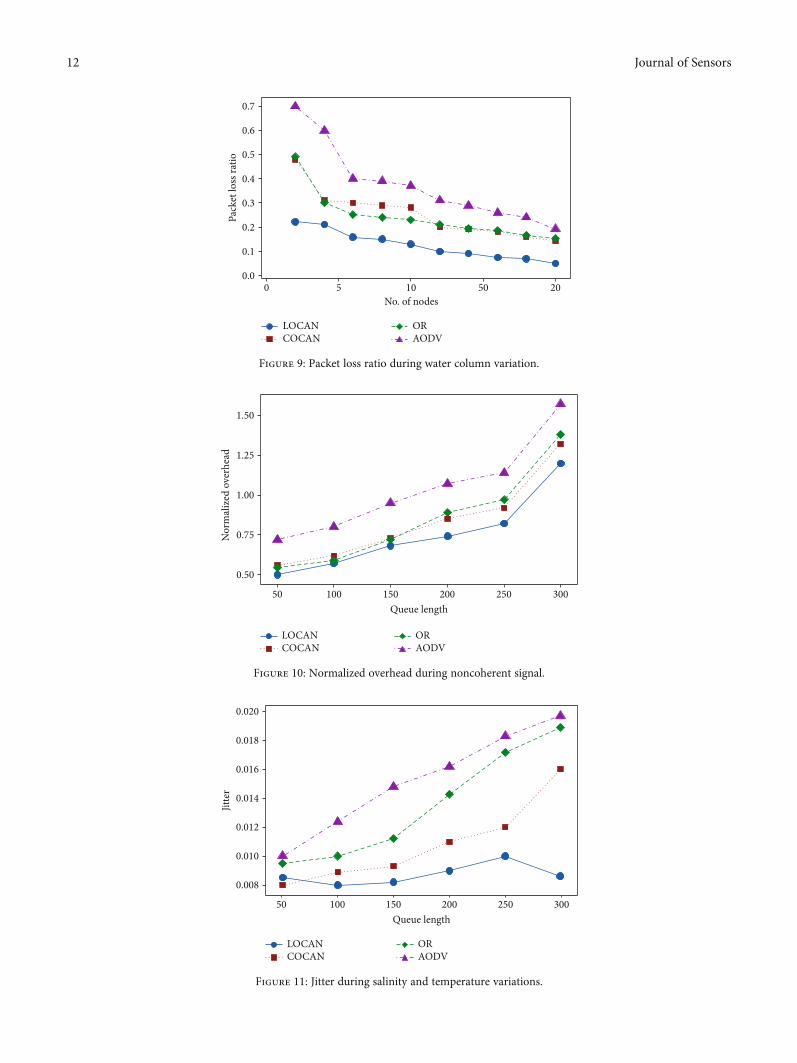
property. In LOCAN, the node waits for a certain period oftime to transmit due to estimation of distance, which variesaccording to water column variations, and never makes trialsonce the distance matrix is evaluated. However, the numberof retransmissions in COCAN is less than that in AODVand similar to that in OR. Further, the packet loss ratio dueto all water column variations such as geometric, Doppler,and sedimentation drift of LOCAN is less than that ofCOCAN, AODV, and OR as in Figure 9. In COCAN, the cat’scautious nature towards the Doppler effect limits the packetloss and thereby reduces the retransmission. Figure 10 showsthe overhead caused in the network due to noncoherent signal;the LOCAN has the minimum overhead compared to OR andAODV. The COCAN shows a better result than OR andAODV due to the cautious nature of the node during watercolumn variation. While being cautious about Doppler effect
Channels PU
SU2
SU3
SU4
SU1
PU ‑ primary userSU1, SU2 ‑ nomad secondary userSU3, SU4 ‑ resident secondary user
Selects the channel basedon non coherent and
divergence in the acousticsignal
Figure 3: LOCAN channel management mechanisms.
Pack
et d
elive
ry ra
tio (P
DR)
1.0
0.9
0.8
0.7
0.6
0.5
0.4
0.3
0 5 10 15 20No. of nodes
LOCANCOCAN
ORAODV
Figure 4: Packet delivery ratio of LOCAN, COCAN, OR, and AODV.
9Journal of Sensors
and sedimentation drift, each node watches the surroundingsand channel changes with respect to adaptability.
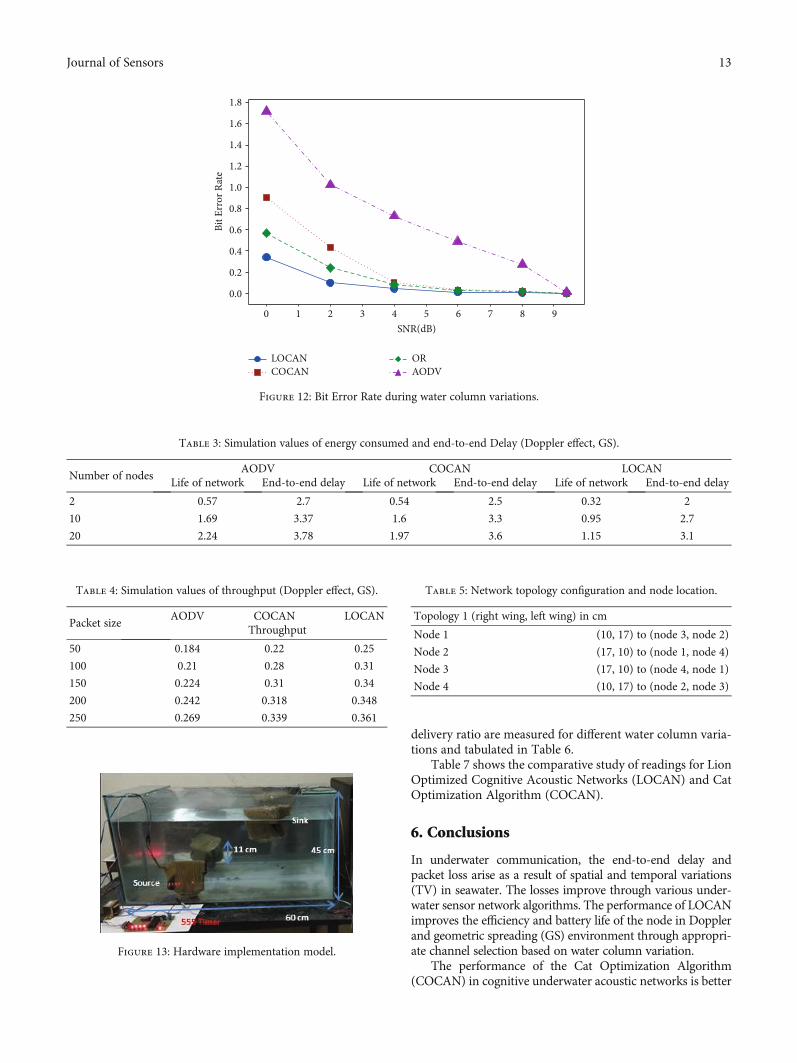
The variation in delay called jitter is shown in Figure 11for temperature and salinity. The jitter arises due to thepacket queue or delay at any point of the network. The jitterof the LOCAN is less than COCAN as the reliable channelallocation done by the nodes in the underwater networkreduces the delay between the successive packets. The jitterof COCAN is less than AODV and OR due to the self-position property of cat algorithm, which fixes with a partic-ular channel and adapts them in the network. In self-positionproperty, each node is aware of the exact characteristics andthe position of their neighbor node with respect to channelcharacteristics and allocation. Figure 12 shows the relation-ship between the Bit Error Rate and the Signal to Noise Ratio(SNR)ofLOCAN,COCAN,AODV,andORforwater channel
variations such asDoppler andGS. The rate at which the erroroccurs in the transmission system is lower that the LOCANand higher in AODV. In the COCAN algorithm, BER is lowwhen the SNR is high. The simulation values are tabulated inTable 3, for energy consumed, end-to-end delay, and through-put with different number of nodes, for AODV, COCAN, andLOCAN. Table 4 shows the simulation values of throughputunder Doppler effect and GS. The above algorithms, namely,COCANand LOCAN, have been implemented in the test bed.
5. Test Bed Step for Doppler andSpreading Environment
The performance of algorithm is analyzed in 25 kHz fre-quency and tested in underwater communication through atank with the capacity of 50 liters of seawater. The hardware
End‑
to‑en
d de
lay(
s)
4.0
3.5
3.0
2.5
2.0
0 5 10 15 20No. of nodes
LOCANCOCAN
ORAODV
Figure 5: End-to-end delay during Doppler effect in the nodes.
0.4
0.3
0.2
0.1
0.0
0 50 100 150 200 250Packet size(bits)
Thro
ughp
ut
LOCANCOCAN
ORAODV
Figure 6: Throughput during the sedimentation drift in seawater.
10 Journal of Sensors
setup for the algorithms such as LOCAN and COCANimplementation is shown in Figure 13. The data transmissionbetween the hardware sensor nodes has been carried out inseawater. The seawater has been collected from Bay of Bengalfor the water bath. Moreover, the data transmission in seawa-ter has been carried out for LOCAN algorithm.
The hardware setup consists of controller, acoustic trans-mitter, and acoustic receiver. MSP430 microcontroller isused for the six channel formation through different fre-quency inputs for 555 IC, and among six channels, threechannels have been allotted for transmission and the otherthree are receiving channels.
The microcontroller sends the data to ASK modulatorcircuit for ASK modulation, and then, ASK modulated sig-nal is sent to the other nodes through the hydrophone.Each node in the LOCAN or COCAN has microcontrollerwith ASK modulation setup with hydrophone to transmit
acoustic signal and mems acoustic sensor ADMP40 forreceiving signal.
Analysis of the data transmission has been done at differ-ent depths. The depth ranges vary from 6 to 7 inches and from10 to 12 inches for testing the performance of LOCAN algo-rithm in GS due to wave fronts. In the test bed, the Dopplereffect is created with help of wave maker model NoWM-3000pump for artificial internal wave front creation in the tank.The maximum flow rate of the pump is 3000 l/hr. The wavemakerwavesmake thenodemovement andcreate theDopplereffect. Further, sea sandmixedwith the seawater in the tank fortheGSdue to sedimentationdrift is created.Basedontheabovescenario, the data are transmitted to the nodes and calculatedfor response time and power consumption.
The nodes are positioned with different distances anddepths in the tank of dimension 60 cm × 45 cm × 30 cm asshown in Table 5. The power consumed and the packet
No. of nodes0 5 10 50 20
2.5
2.0
1.5
1.0
0.5
Ener
gy co
nsum
ed p
er p
acke
t(J)
LOCANCOCAN
ORAODV
Figure 7: Life of network during both Doppler effect and sedimentation drift.
No. of nodes0 5 10 50 20
4.4
4.0
4.2
3.8
3.6
3.4
3.2
3.0
No.
of r
etra
nsm
issio
ns
LOCANCOCAN
ORAODV
Figure 8: Number of retransmissions during multipath interference of sand particles.
11Journal of Sensors
No. of nodes0 5 10 50 20
0.7
0.5
0.6
0.4
0.3
0.2
0.1
0.0
Pack
et lo
ss ra
tio
LOCANCOCAN
ORAODV
Figure 9: Packet loss ratio during water column variation.
Queue length50 150100 200 250 300
1.25
1.50
1.00
0.75
0.50
Nor
mal
ized
ove
rhea
d
LOCANCOCAN
ORAODV
Figure 10: Normalized overhead during noncoherent signal.
Queue length50 150100 200 250 300
0.014
0.016
0.018
0.020
0.012
0.010
0.008
Jitte
r
LOCANCOCAN
ORAODV
Figure 11: Jitter during salinity and temperature variations.
12 Journal of Sensors
delivery ratio are measured for different water column varia-tions and tabulated in Table 6.
Table 7 shows the comparative study of readings for LionOptimized Cognitive Acoustic Networks (LOCAN) and CatOptimization Algorithm (COCAN).
6. Conclusions
In underwater communication, the end-to-end delay andpacket loss arise as a result of spatial and temporal variations(TV) in seawater. The losses improve through various under-water sensor network algorithms. The performance of LOCANimproves the efficiency and battery life of the node in Dopplerand geometric spreading (GS) environment through appropri-ate channel selection based on water column variation.
The performance of the Cat Optimization Algorithm(COCAN) in cognitive underwater acoustic networks is better
SNR(dB)0 2 4 61 3 5 7 8 9
1.6
1.8
1.2
1.4
1.0
0.8
0.6
0.4
0.2
0.0
Bit E
rror
Rat
e
LOCANCOCAN
ORAODV
Figure 12: Bit Error Rate during water column variations.
Table 3: Simulation values of energy consumed and end-to-end Delay (Doppler effect, GS).
Number of nodesAODV COCAN LOCAN
Life of network End-to-end delay Life of network End-to-end delay Life of network End-to-end delay
2 0.57 2.7 0.54 2.5 0.32 2
10 1.69 3.37 1.6 3.3 0.95 2.7
20 2.24 3.78 1.97 3.6 1.15 3.1
Table 4: Simulation values of throughput (Doppler effect, GS).
Packet sizeAODV COCAN LOCAN
Throughput
50 0.184 0.22 0.25
100 0.21 0.28 0.31
150 0.224 0.31 0.34
200 0.242 0.318 0.348
250 0.269 0.339 0.361
Figure 13: Hardware implementation model.
Table 5: Network topology configuration and node location.
Topology 1 (right wing, left wing) in cm
Node 1 (10, 17) to (node 3, node 2)
Node 2 (17, 10) to (node 1, node 4)
Node 3 (17, 10) to (node 4, node 1)
Node 4 (10, 17) to (node 2, node 3)
13Journal of Sensors
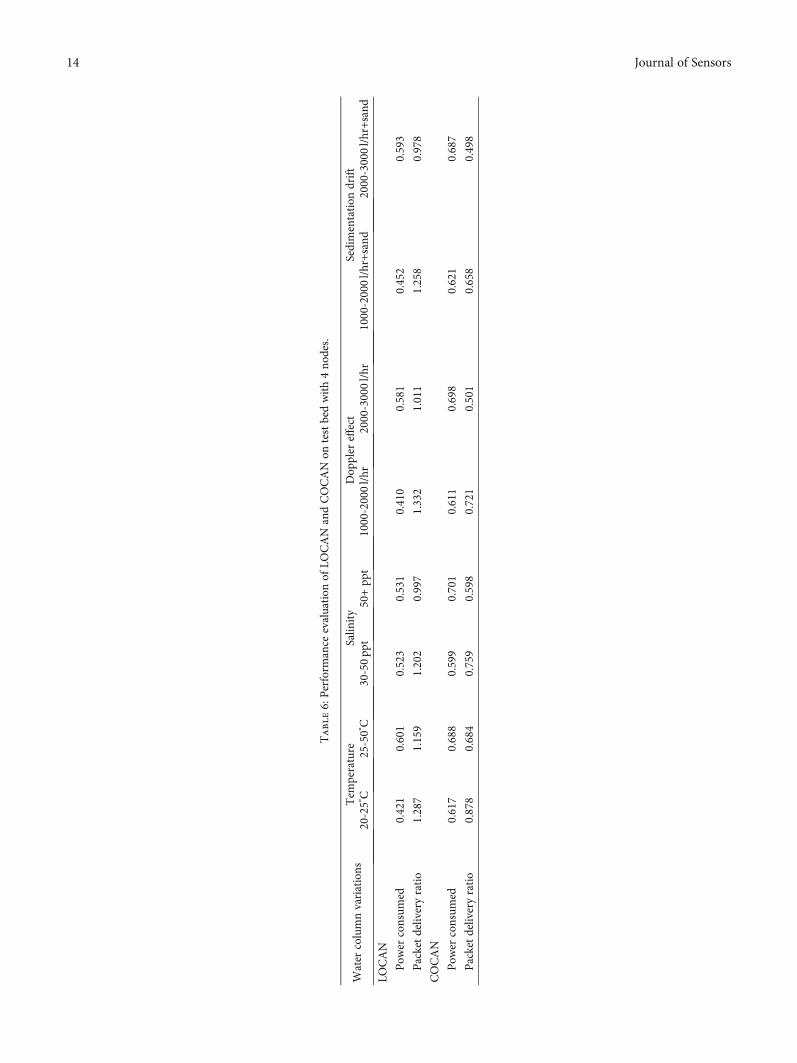
Table6:Perform
ance
evaluation
ofLO
CAN
andCOCAN
ontestbedwith4no
des.
Water
columnvariations
Tem
perature
Salin
ity
Dop
pler
effect
Sedimentation
drift
20-25°C
25-50°C
30-50pp
t50+pp
t1000-2000l/hr
2000-3000l/hr
1000-2000l/hr+sand
2000-3000l/hr+sand
LOCAN
Pow
erconsum
ed0.421
0.601
0.523
0.531
0.410
0.581
0.452
0.593
Packetdeliveryratio
1.287
1.159
1.202
0.997
1.332
1.011
1.258
0.978
COCAN
Pow
erconsum
ed0.617
0.688
0.599
0.701
0.611
0.698
0.621
0.687
Packetdeliveryratio
0.878
0.684
0.759
0.598
0.721
0.501
0.658
0.498
14 Journal of Sensors
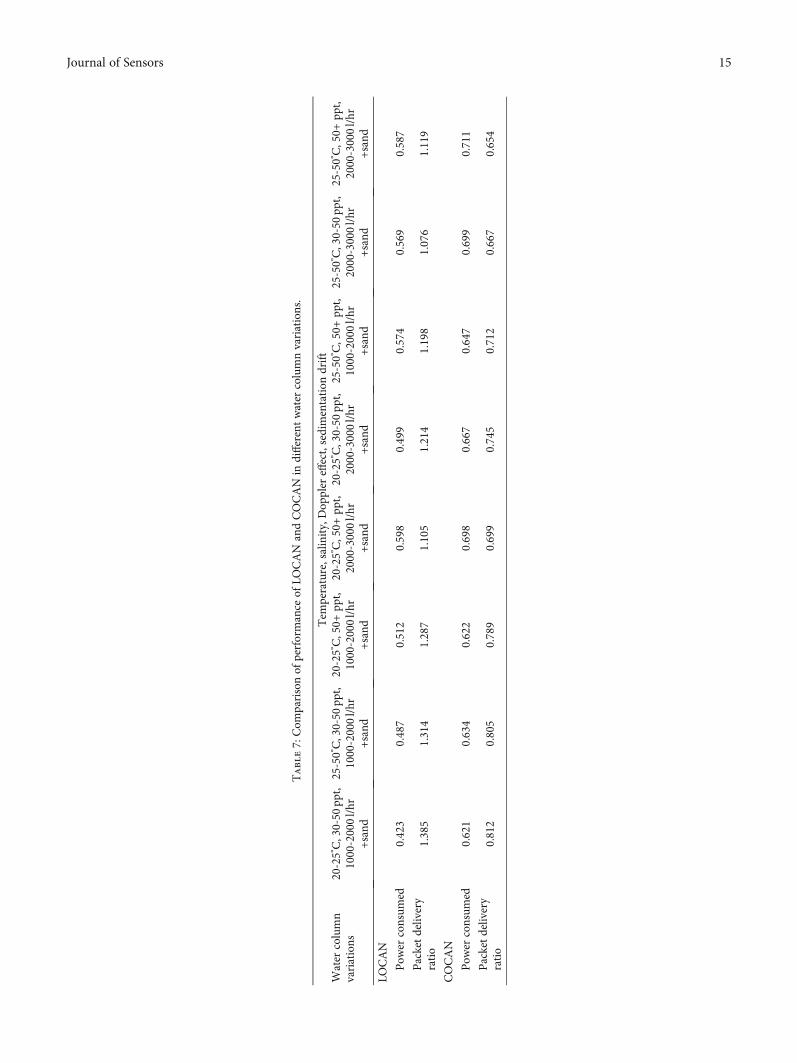
Table7:Com
parisonof
performance
ofLO
CAN
andCOCAN
indifferentwater
columnvariations.
Water
column
variations
Tem
perature,salinity,Dop
pler
effect,sedimentation
drift
20-25°C,30-50
ppt,
1000-2000l/hr
+sand
25-50°C,30-50
ppt,
1000-2000l/hr
+sand
20-25°C,50+
ppt,
1000-2000l/hr
+sand
20-25°C,50+
ppt,
2000-3000l/hr
+sand
20-25°C,30-50
ppt,
2000-3000l/hr
+sand
25-50°C,50+
ppt,
1000-2000l/hr
+sand
25-50°C,30-50
ppt,
2000-3000l/hr
+sand
25-50°C,50+
ppt,
2000-3000l/hr
+sand
LOCAN
Pow
erconsum
ed0.423
0.487
0.512
0.598
0.499
0.574
0.569
0.587
Packetdelivery
ratio
1.385
1.314
1.287
1.105
1.214
1.198
1.076
1.119
COCAN
Pow
erconsum
ed0.621
0.634
0.622
0.698
0.667
0.647
0.699
0.711
Packetdelivery
ratio
0.812
0.805
0.789
0.699
0.745
0.712
0.667
0.654
15Journal of Sensors
than that of the existing AODV algorithm. Energy saving dueto the cautious nature of cat inspired node performance andhigh alertness of the nodes. The multidimensional approachwith fitness values based on the input parameter of water col-umn environment enables the efficient performance of theLion Optimized Cognitive Acoustic Networks (LOCAN) toperform well than COCAN in the cognitive network.
The LOCAN algorithm can be tested in various environ-ments such as spherical, cylindrical, and macrocellularmobile environment.
Data Availability
No data were used to support this study.
Conflicts of Interest
The authors declare that there is no conflict of interestregarding the publication of this paper.
References
[1] M. A. Rahman, Y. Lee, and I. Koo, “EECOR: an energy-efficient cooperative opportunistic routing protocol for under-water acoustic sensor networks,” IEEE Access, vol. 5,pp. 14119–14132, 2017.
[2] Z. Zhou, B. Yao, R. Xing, L. Shu, and S. Bu, “E-CARP: anenergy efficient routing protocol for UWSNs in the Internetof underwater things,” IEEE Sensors Journal, vol. 16, no. 11,pp. 4072–4082, 2016.
[3] C.-C. Hsu,H.-H. Liu, J. L. Garcia Gomez, andC.-F. Chou, “Delay-sensitive opportunistic routing for underwater sensor networks,”IEEE Sensors Journal, vol. 15, no. 11, pp. 6584–6591, 2015.
[4] Y. Sun, W. Dong, and Y. Chen, “An improved routing algo-rithm based on ant colony optimization in wireless sensornetworks,” IEEE Communications Letters, vol. 21, no. 6,pp. 1317–1320, 2017.
[5] G. Wang, L. Guo, H. Duan, L. Liu, and H. Wang, “Dynamicdeployment of wireless sensor networks by biogeographybased optimization algorithm,” Journal of Sensor and ActuatorNetworks, vol. 1, no. 2, pp. 86–96, 2012.
[6] W.-H. Liao, Y. Kao, and Y.-S. Li, “A sensor deploymentapproach using glowworm swarm optimization algorithm inwireless sensor networks,” Expert Systems with Applications,no. , pp. 12180–12188, 2011.
[7] D. C. Hoang, P. Yadav, R. Kumar, and S. K. Panda, “Real-timeimplementation of a harmony search algorithm-based cluster-ing protocol for energy-efficient wireless sensor networks,”IEEE Transactions On Industrial Informatics, vol. 10, no. 1,pp. 774–783, 2014.
[8] Q. Shi, C. He, H. Chen, and L. Jiang, “Distributed wireless sen-sor network localization via sequential greedy optimizationalgorithm,” IEEE Transactions on Signal Processing, vol. 58,no. 6, pp. 3328–3340, 2010.
[9] Z. Wang, G. Han, H. Qin, S. Zhang, and Y. Sui, “An energy-aware and void-avoidable routing protocol for underwatersensor networks,” IEEE Access, vol. 6, pp. 7792–7801, 2018.
[10] G. Toso, R. Masiero, P. Casari, M. Komar, O. Kebkal, andM. Zorzi, “Revisiting source routing for underwater network-ing: the SUN protocol,” IEEE Access, vol. 6, pp. 1525–1541,2018.
[11] H. Ghafoor and I. Koo, “Cognitive routing in software-definedunderwater acoustic networks,” Applied Sciences, vol. 7, no. 12,article 1312, 2017.
[12] F. Bouabdallah, C. Zidi, and R. Boutaba, “Joint routing andenergy management in UnderWater acoustic sensor net-works,” IEEE Transactions on Network and Service Manage-ment, vol. 14, no. 2, pp. 456–471, 2017.
[13] R. W. L. Coutinho, A. Boukerche, L. F. M. Vieira, and A. A. F.Loureiro, “Design guidelines for opportunistic routing inunderwater networks,” IEEE Communications Magazine,vol. 54, no. 2, pp. 40–48, 2016.
[14] R. W. L. Coutinho, A. Boukerche, L. F. M. Vieira, and A. A. F.Loureiro, “Geographic and opportunistic routing for underwa-ter sensor networks,” IEEE Transactions on Computers, vol. 65,no. 2, pp. 548–561, 2016.
16 Journal of Sensors