improving nearest neighbour search in 3d ... and many more. in (boonsam et al., 2011), nearest...
TRANSCRIPT

IMPROVING NEAREST NEIGHBOUR SEARCH IN 3D SPATIAL ACCESS METHOD
A. Suhaibaha*
, A. A. Rahmana U. Uznir
a, F. Anton
b, and D. Mioc
b
aGeospatial Information Infrastructure (GeoI
2) Research Lab.,
Faculty of Geoinformation and Real Estate,
Universiti Teknologi Malaysia,
81310 Skudai, Johor, Malaysia
[email protected], [email protected], [email protected]
bDept. of Geodesy, National Space Institute, Technical University of Denmark,
Elektrovej 328, 2800 Kgs. Lyngby, Denmark
[email protected], [email protected]
Commission II, WG II/2.
KEY WORDS: Nearest Neighbour, 3D Data Clustering, 3D Spatial Access Method, 3D GIS, Data Management, Information
Retrieval
ABSTRACT:
Nearest Neighbour (NN) is one of the important queries and analyses for spatial application. In normal practice, spatial access
method structure is used during the Nearest Neighbour query execution to retrieve information from the database. However, most of
the spatial access method structures are still facing with unresolved issues such as overlapping among nodes and repetitive data
entry. This situation will perform an excessive Input/Output (IO) operation which is inefficient for data retrieval. The situation will
become more crucial while dealing with 3D data. The size of 3D data is usually large due to its detail geometry and other attached
information. In this research, a clustered 3D hierarchical structure is introduced as a 3D spatial access method structure. The
structure is expected to improve the retrieval of Nearest Neighbour information for 3D objects. Several tests are performed in
answering Single Nearest Neighbour search and k Nearest Neighbour (kNN) search. The tests indicate that clustered hierarchical
structure is efficient in handling Nearest Neighbour query compared to its competitor. From the results, clustered hierarchical
structure reduced the repetitive data entry and the accessed page. The proposed structure also produced minimal Input/Output
operation. The query response time is also outperformed compared to the other competitor. For future outlook of this research
several possible applications are discussed and summarized.
1. INTRODUCTION
Nearest neighbour analysis has always been an interesting topic
in computer science and geospatial science. The importance of
nearest neighbour information could be seen in various
applications such as image processing, pattern recognition and
Deoxyribonucleic Acid (DNA) sequencing. Numerous models
and techniques have been developed due to its popularity and
potential. In spatial databases, spatial access methods are used
to index and refine the search area to process nearest neighbour
queries. Most of the work or research on nearest neighbour
search is to focus on query point q, and retrieve k nearby objects
from a set of points P with respect to the Euclidean distance or
a network distance.
In order to efficiently retrieve the nearest neighbour
information, we proposed a spatial access method known as
clustered hierarchical structure. This structure is constructed
based on group clustering and transformed into a hierarchical
structure. Based on our previous work (Azri et al., 2015; Azri et
al., 2014), the structure produced a minimal coverage and
overlap percentage among nodes to avoid repetitive data entry.
Thus, in this paper, we proposed the clustered hierarchical
structure in order to retrieve nearest neighbour information. The
construction of hierarchical structure has been discussed in our
previous work. However, our focus in this paper is to test the
developed structure in retrieving the nearest neighbour
information.
This paper is organized as follows: problems and motivation
regarding the nearest neighbour information retrieval in 3D
database are discussed in the next section. In Section 3, the
concept of the proposed method is explained with its
implementation. Section 4 presents the analysis and results of
the experiment. Finally, the conclusions are presented in Section
5.
2. NEAREST NEIGHBOUR SEARCH USING SPATIAL
ACCESS METHOD
The significance of nearest neighbour information for the
marketing and business plan has been mentioned in several
researches such as (Akhbari et al., 2014; Kiekintveld et al.,
2007; Rodger, 2014). From this information, a lot of analysis
can be done such as identifying the best vehicle routing for
products delivery, strategize the target group of nearby
The International Archives of the Photogrammetry, Remote Sensing and Spatial Information Sciences, Volume XLII-2/W1, 2016 3rd International GeoAdvances Workshop, 16–17 October 2016, Istanbul, Turkey
This contribution has been peer-reviewed. doi:10.5194/isprs-archives-XLII-2-W1-69-2016
69

residential and many more. In (Boonsam et al., 2011), nearest
neighbour information is used to schedule the tour procedure for
transporting the products from one centre to another.
According to the first law of geography, everything is related to
everything else, but near things are more related than distant
things. Thus, inaccurate results will not optimize the business
and marketing strategy. Considering the business of franchising
and chain stores in urban areas with high rise multi-level
buildings, a 3D method is prominently required in order to
locate and identify the nearest neighbour information accurately.
3D information is required in the process of identification such
as at which level of the franchise unit will be located or is the
franchise unit located is at the best level for visibility purposes.
However, with the immense number of urban datasets, the
analysis and the efficiency of nearest neighbour information
retrieval will become more complex and crucial. In a database management system (DBMS) environment,
several tree structures are used to constellate data and
information such as R-Tree (Guttman, 1984), Quad Tree, BSP-
tree and kd-Tree. However, these structures are still facing the
issue of overlap between nodes. For instance, Oracle Database
provides a 3D R-Tree structure to deal with 3D data (Murray,
2009; Ravada et al., 2009). However, when the R-Tree is
extended into 3D space, the MBV of sibling nodes tends to
frequently overlap, and MBVs among nodes can even contain
other MBVs. In spatial databases, overlap between nodes is the
main reason for the low efficiency of queries due to multi-path
queries.
Due to critical overlap of sibling nodes and uneven size of
nodes in 3D R-Trees, a research was conducted in (Zhu et al.,
2007) to minimize the overlap and optimize the clustering
algorithm by introducing k-means clustering algorithm to put
forward an improved 3D R-Tree. From this experiment, by
using an improved algorithm, the overlapping of node is
minimized while balancing the volume of parallelepipeds.
However, using k-means would not drastically minimize the
overlap among nodes. This is due to the random selection of the
initial seed or cluster centre which will lead to unbalance
number of points in each cluster. This condition will increase
the risk of having serious overlap in the tree structure. Thus, an
improved method of clustering is needed to push the limits of
the 3D R-Tree structure in order to access nearest neighbour
information.
3. CLUSTERED HIERARCHICAL TREE STRUCTURE
3.1 Clustering Algorithm
In our previous work (Azri et al., 2015; Azri et al., 2014)
clustered hierarchical structure is developed based on partition-
based clustering as a clustering algorithm to group the objects.
Partition-based clustering is a method of clustering that requires
a pre-set number of clusters from the user. The commonly used
algorithm from this type of cluster is k-means algorithm. By
using this algorithm, data will be partitioned into k clusters (C1,
C2, …, Ck). The means for all instances in each cluster are then
calculated as cluster centres.
The linear complexity is one of the reasons of k-means
popularity. Even if the size of instances is large, this algorithm
is computationally attractive. Besides that, the k-means
algorithm offers simplicity, speed and adaptability to sparse data
(Dhillon and Modha, 2001). However, there is a function in k-
means algorithm that is inclined to focus cluster centres at one
point or area. Thus, any selection is very sensitive to the group
cluster and may make a difference for the end result.
To overcome this issue, clustered hierarchical tree used the k-
means++ algorithm invented by (Arthur and Vassilvitskii,
2007). The k-means++ algorithm is a variant of k-means
algorithm. It chooses cluster centres by using weighted squared
distance from the closest cluster centres. The initial seed of
cluster centres are defined and combined with the k-means
algorithm. The algorithm of k-means++ is described as follows.
From the clusters, hierarchical structure will be constructed.
Each parallelepiped is assigned as a child node to the tree. The
parent node is the constructed parallelepiped based on minimum
value of xmin, ymin and zmin of point location for all clusters and
maximum value of xmax, ymax and zmax of point location for all
clusters. Parent and child nodes for clustered hierarchical tree
structure are described in Figure 1.
Figure 1. Clustered Hierarchical Tree Structure
𝐷(𝑥)2
∑ 𝐷(𝑥)2𝑥∈𝑋
Input: P (object set), k (number of cluster)
Output: clusters
Step 1: Initialize k cluster centres.
Step 2: Choose one centre C1
Step 3: Repeat for 2 ≤ i ≤ k
Step 4: Choose Ci to be x ∈ X with D2 weighting
Step 5: while termination condition is not satisfied do
Step 6: Assign objects to the nearest cluster centre.
Step 7: Update cluster centres.
Step 8: end while
Parallelepiped ID
Child Node 1
(Xmin, Ymin, Zmin),
(Xmax, Ymax, Zmax)
Child Node 2
Parallelepiped ID
(Xmin, Ymin, Zmin),
(Xmax, Ymax, Zmax)
Parent Node
Parallelepiped ID, (Xmin, Ymin, Zmin), (Xmax, Ymax, Zmax)
Child Node 3
Parallelepiped ID
(Xmin, Ymin, Zmin), (Xmax, Ymax, Zmax)
The International Archives of the Photogrammetry, Remote Sensing and Spatial Information Sciences, Volume XLII-2/W1, 2016 3rd International GeoAdvances Workshop, 16–17 October 2016, Istanbul, Turkey
This contribution has been peer-reviewed. doi:10.5194/isprs-archives-XLII-2-W1-69-2016
70
Based on our previous work, minimum coverage and overlap
percentage among nodes can be achieved from the clustered
hierarchical structure. Table 1 shows the comparison of overlap
percentage between partition-based clustering hierarchical
structure and 3D R-Tree structure. From the table, proposed
clustered hierarchical tree structure produce minimum overlap
percentage. Eventhough the percentage is linearly increased
each time the number of dataset grew, the structure still keeping
it minimum compared to 3D R-Tree.
Table1. Overlap percentage analysis for varying number of
datasets (Azri et al., 2015)
Percentage of Overlap (%)
No. of
Datasets
Clustered Hierarchical
Tree
3D R-Tree
100,000
68%
92%
300,000
72%
95%
500,000
75%
97%
3.2 Nearest Neighbour Query using Clustered Hierarchical
The nearest neighbour information can be retrieved by
traversing the hierarchical structure from its parent node. The
traversal started by identifying the location of point query q.
The location of point query q will serve to identify to which
cluster it lies. Other clusters will be pruned to refine the search
area. The nearest object with minimum distance Dmin will be
identified as a nearest object to point query q. In this paper, two
types of nearest neighbour query are presented. The queries are
Single Nearest Neighbour Search and k Nearest Neighbour
(kNN).
3.2.1 Single Nearest Neighbour Search
Given a set of data points P and a query point q, and an integer
k = 1, the nearest neighbour query is to find a single point such
that for any 𝑝 ∈ (𝑃 − 𝑘NN) and any 𝑝′ ∈ 𝑘NN, dist (𝑝′, 𝑞) ≤dist(𝑝, 𝑞).
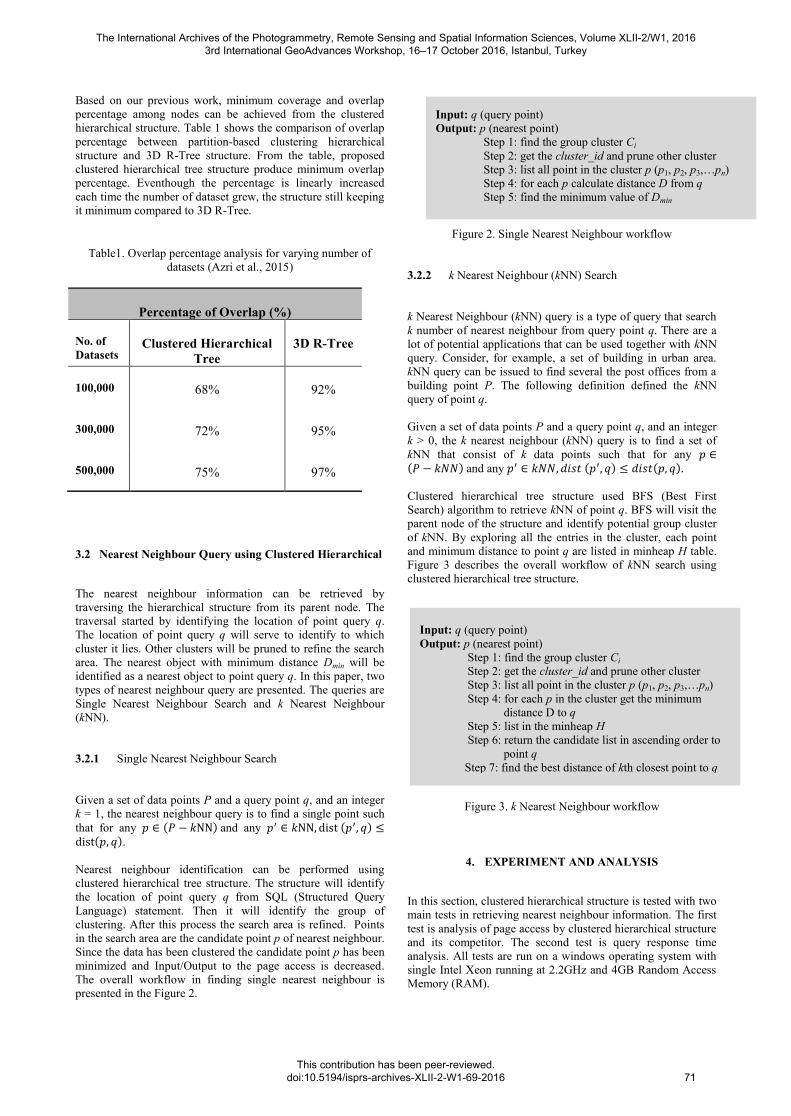
Nearest neighbour identification can be performed using
clustered hierarchical tree structure. The structure will identify
the location of point query q from SQL (Structured Query
Language) statement. Then it will identify the group of
clustering. After this process the search area is refined. Points
in the search area are the candidate point p of nearest neighbour.
Since the data has been clustered the candidate point p has been
minimized and Input/Output to the page access is decreased.
The overall workflow in finding single nearest neighbour is
presented in the Figure 2.
Figure 2. Single Nearest Neighbour workflow
3.2.2 k Nearest Neighbour (kNN) Search
k Nearest Neighbour (kNN) query is a type of query that search
k number of nearest neighbour from query point q. There are a
lot of potential applications that can be used together with kNN
query. Consider, for example, a set of building in urban area.
kNN query can be issued to find several the post offices from a
building point P. The following definition defined the kNN
query of point q.
Given a set of data points P and a query point q, and an integer
k > 0, the k nearest neighbour (kNN) query is to find a set of
kNN that consist of k data points such that for any 𝑝 ∈(𝑃 − 𝑘𝑁𝑁) and any 𝑝′ ∈ 𝑘𝑁𝑁, 𝑑𝑖𝑠𝑡 (𝑝′, 𝑞) ≤ 𝑑𝑖𝑠𝑡(𝑝, 𝑞).
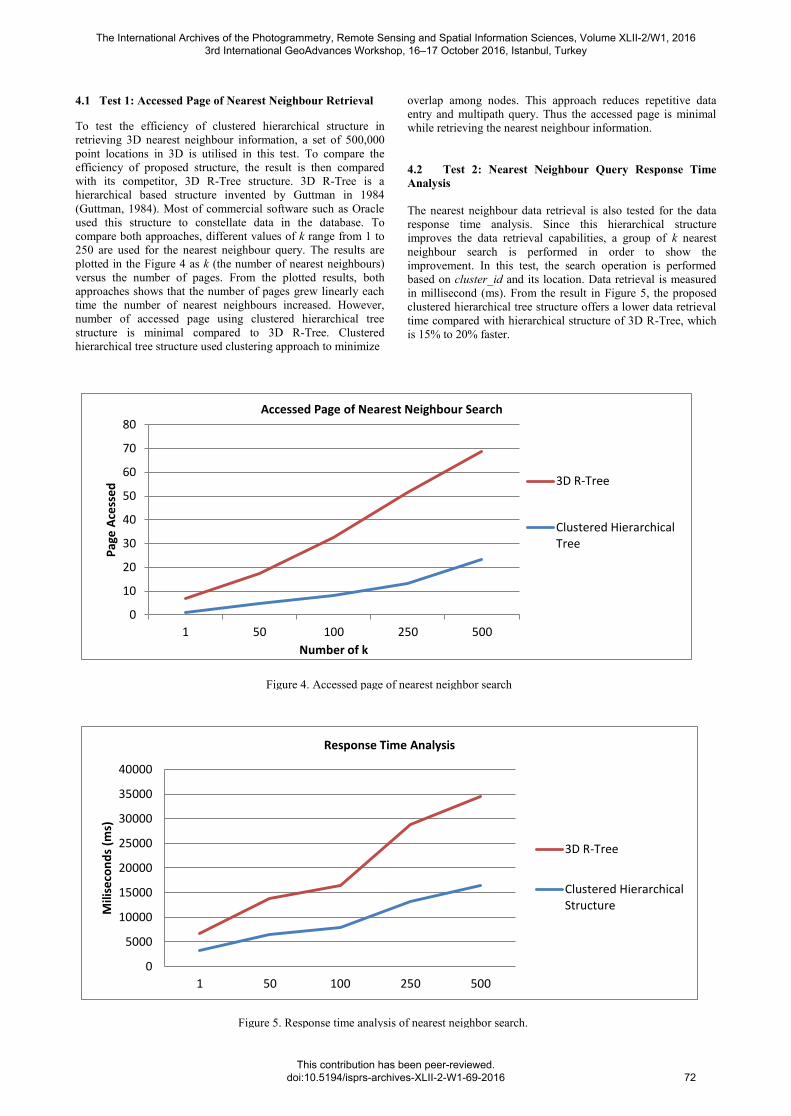
Clustered hierarchical tree structure used BFS (Best First
Search) algorithm to retrieve kNN of point q. BFS will visit the
parent node of the structure and identify potential group cluster
of kNN. By exploring all the entries in the cluster, each point
and minimum distance to point q are listed in minheap H table.
Figure 3 describes the overall workflow of kNN search using
clustered hierarchical tree structure.
Figure 3. k Nearest Neighbour workflow
4. EXPERIMENT AND ANALYSIS
In this section, clustered hierarchical structure is tested with two
main tests in retrieving nearest neighbour information. The first
test is analysis of page access by clustered hierarchical structure
and its competitor. The second test is query response time
analysis. All tests are run on a windows operating system with
single Intel Xeon running at 2.2GHz and 4GB Random Access
Memory (RAM).
Input: q (query point)
Output: p (nearest point)
Step 1: find the group cluster Ci
Step 2: get the cluster_id and prune other cluster
Step 3: list all point in the cluster p (p1, p2, p3,…pn)
Step 4: for each p calculate distance D from q
Step 5: find the minimum value of Dmin
Input: q (query point)
Output: p (nearest point)
Step 1: find the group cluster Ci
Step 2: get the cluster_id and prune other cluster
Step 3: list all point in the cluster p (p1, p2, p3,…pn)
Step 4: for each p in the cluster get the minimum
distance D to q
Step 5: list in the minheap H
Step 6: return the candidate list in ascending order to
point q
Step 7: find the best distance of kth closest point to q
The International Archives of the Photogrammetry, Remote Sensing and Spatial Information Sciences, Volume XLII-2/W1, 2016 3rd International GeoAdvances Workshop, 16–17 October 2016, Istanbul, Turkey
This contribution has been peer-reviewed. doi:10.5194/isprs-archives-XLII-2-W1-69-2016
71
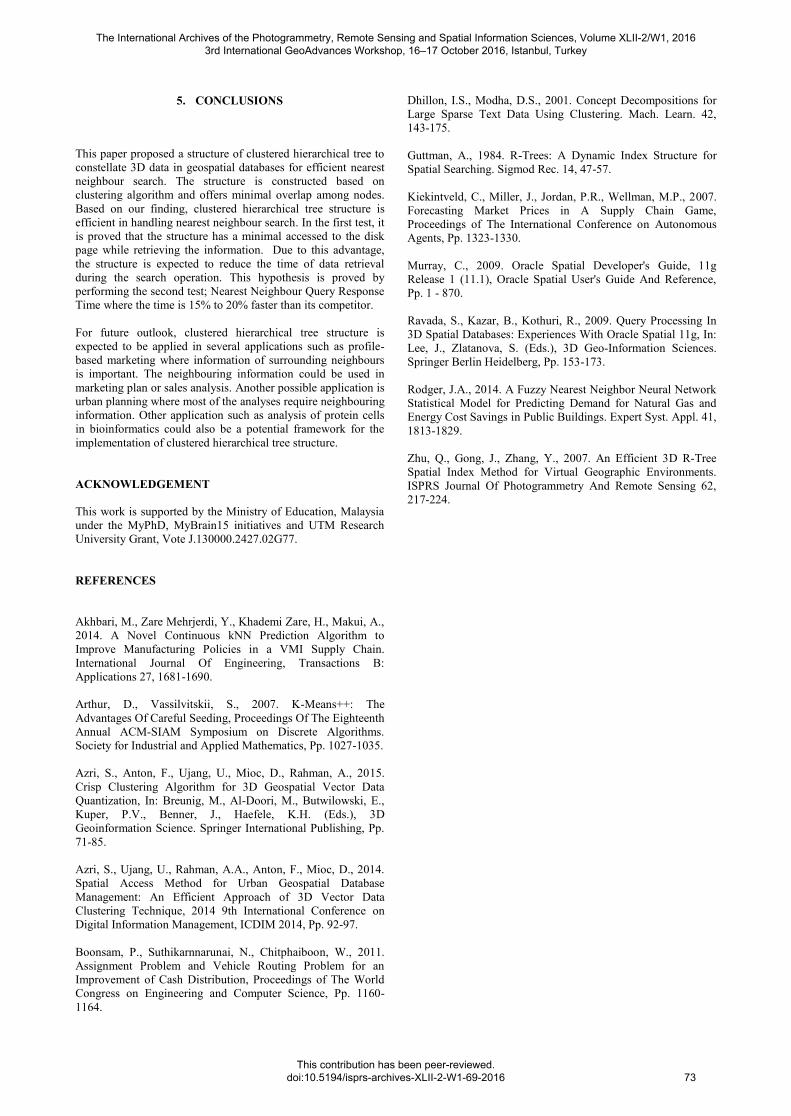
4.1 Test 1: Accessed Page of Nearest Neighbour Retrieval
To test the efficiency of clustered hierarchical structure in
retrieving 3D nearest neighbour information, a set of 500,000
point locations in 3D is utilised in this test. To compare the
efficiency of proposed structure, the result is then compared
with its competitor, 3D R-Tree structure. 3D R-Tree is a
hierarchical based structure invented by Guttman in 1984
(Guttman, 1984). Most of commercial software such as Oracle
used this structure to constellate data in the database. To
compare both approaches, different values of k range from 1 to
250 are used for the nearest neighbour query. The results are
plotted in the Figure 4 as k (the number of nearest neighbours)
versus the number of pages. From the plotted results, both
approaches shows that the number of pages grew linearly each
time the number of nearest neighbours increased. However,
number of accessed page using clustered hierarchical tree
structure is minimal compared to 3D R-Tree. Clustered
hierarchical tree structure used clustering approach to minimize
overlap among nodes. This approach reduces repetitive data
entry and multipath query. Thus the accessed page is minimal
while retrieving the nearest neighbour information.
4.2 Test 2: Nearest Neighbour Query Response Time
Analysis
The nearest neighbour data retrieval is also tested for the data
response time analysis. Since this hierarchical structure
improves the data retrieval capabilities, a group of k nearest
neighbour search is performed in order to show the
improvement. In this test, the search operation is performed
based on cluster_id and its location. Data retrieval is measured
in millisecond (ms). From the result in Figure 5, the proposed
clustered hierarchical tree structure offers a lower data retrieval
time compared with hierarchical structure of 3D R-Tree, which
is 15% to 20% faster.
0
10
20
30
40
50
60
70
80
1 50 100 250 500
Pag
e A
cess
ed
Number of k
Accessed Page of Nearest Neighbour Search
3D R-Tree
Clustered HierarchicalTree
0
5000
10000
15000
20000
25000
30000
35000
40000
1 50 100 250 500
Mili
seco
nd
s (m
s)
Response Time Analysis
3D R-Tree
Clustered HierarchicalStructure
Figure 4. Accessed page of nearest neighbor search
Figure 5. Response time analysis of nearest neighbor search.
The International Archives of the Photogrammetry, Remote Sensing and Spatial Information Sciences, Volume XLII-2/W1, 2016 3rd International GeoAdvances Workshop, 16–17 October 2016, Istanbul, Turkey
This contribution has been peer-reviewed. doi:10.5194/isprs-archives-XLII-2-W1-69-2016
72
5. CONCLUSIONS
This paper proposed a structure of clustered hierarchical tree to
constellate 3D data in geospatial databases for efficient nearest
neighbour search. The structure is constructed based on
clustering algorithm and offers minimal overlap among nodes.
Based on our finding, clustered hierarchical tree structure is
efficient in handling nearest neighbour search. In the first test, it
is proved that the structure has a minimal accessed to the disk
page while retrieving the information. Due to this advantage,
the structure is expected to reduce the time of data retrieval
during the search operation. This hypothesis is proved by
performing the second test; Nearest Neighbour Query Response
Time where the time is 15% to 20% faster than its competitor.
For future outlook, clustered hierarchical tree structure is
expected to be applied in several applications such as profile-
based marketing where information of surrounding neighbours
is important. The neighbouring information could be used in
marketing plan or sales analysis. Another possible application is
urban planning where most of the analyses require neighbouring
information. Other application such as analysis of protein cells
in bioinformatics could also be a potential framework for the
implementation of clustered hierarchical tree structure.
ACKNOWLEDGEMENT
This work is supported by the Ministry of Education, Malaysia
under the MyPhD, MyBrain15 initiatives and UTM Research
University Grant, Vote J.130000.2427.02G77.
REFERENCES
Akhbari, M., Zare Mehrjerdi, Y., Khademi Zare, H., Makui, A.,
2014. A Novel Continuous kNN Prediction Algorithm to
Improve Manufacturing Policies in a VMI Supply Chain.
International Journal Of Engineering, Transactions B:
Applications 27, 1681-1690.
Arthur, D., Vassilvitskii, S., 2007. K-Means++: The
Advantages Of Careful Seeding, Proceedings Of The Eighteenth
Annual ACM-SIAM Symposium on Discrete Algorithms.
Society for Industrial and Applied Mathematics, Pp. 1027-1035.
Azri, S., Anton, F., Ujang, U., Mioc, D., Rahman, A., 2015.
Crisp Clustering Algorithm for 3D Geospatial Vector Data
Quantization, In: Breunig, M., Al-Doori, M., Butwilowski, E.,
Kuper, P.V., Benner, J., Haefele, K.H. (Eds.), 3D
Geoinformation Science. Springer International Publishing, Pp.
71-85.
Azri, S., Ujang, U., Rahman, A.A., Anton, F., Mioc, D., 2014.
Spatial Access Method for Urban Geospatial Database
Management: An Efficient Approach of 3D Vector Data
Clustering Technique, 2014 9th International Conference on
Digital Information Management, ICDIM 2014, Pp. 92-97.
Boonsam, P., Suthikarnnarunai, N., Chitphaiboon, W., 2011.
Assignment Problem and Vehicle Routing Problem for an
Improvement of Cash Distribution, Proceedings of The World
Congress on Engineering and Computer Science, Pp. 1160-
1164.
Dhillon, I.S., Modha, D.S., 2001. Concept Decompositions for
Large Sparse Text Data Using Clustering. Mach. Learn. 42,
143-175.
Guttman, A., 1984. R-Trees: A Dynamic Index Structure for
Spatial Searching. Sigmod Rec. 14, 47-57.
Kiekintveld, C., Miller, J., Jordan, P.R., Wellman, M.P., 2007.
Forecasting Market Prices in A Supply Chain Game,
Proceedings of The International Conference on Autonomous
Agents, Pp. 1323-1330.
Murray, C., 2009. Oracle Spatial Developer's Guide, 11g
Release 1 (11.1), Oracle Spatial User's Guide And Reference,
Pp. 1 - 870.
Ravada, S., Kazar, B., Kothuri, R., 2009. Query Processing In
3D Spatial Databases: Experiences With Oracle Spatial 11g, In:
Lee, J., Zlatanova, S. (Eds.), 3D Geo-Information Sciences.
Springer Berlin Heidelberg, Pp. 153-173.
Rodger, J.A., 2014. A Fuzzy Nearest Neighbor Neural Network
Statistical Model for Predicting Demand for Natural Gas and
Energy Cost Savings in Public Buildings. Expert Syst. Appl. 41,
1813-1829.
Zhu, Q., Gong, J., Zhang, Y., 2007. An Efficient 3D R-Tree
Spatial Index Method for Virtual Geographic Environments.
ISPRS Journal Of Photogrammetry And Remote Sensing 62,
217-224.
The International Archives of the Photogrammetry, Remote Sensing and Spatial Information Sciences, Volume XLII-2/W1, 2016 3rd International GeoAdvances Workshop, 16–17 October 2016, Istanbul, Turkey
This contribution has been peer-reviewed. doi:10.5194/isprs-archives-XLII-2-W1-69-2016
73