improving methods for using existing land cover – land use
TRANSCRIPT

1
Improving methods for using existing land cover – land use
databases for agricultural statistics
A literature review
Contents Preface .......................................................................................................................................................... 2
1. Introduction .......................................................................................................................................... 3
2. The remote sensing products, an overview .......................................................................................... 4
3. The country approaches for Crop Area Estimation using remote sensing, an overview .......................... 9
Digital Image Analysis ................................................................................................................................. 13
4. RS techniques applied in support of agricultural application ................................................................. 15
4.1 Crop type classification and identification ........................................................................................ 15
4.2 Crop condition (monitoring) assessment .......................................................................................... 16
4.3 Crop area and yield estimation ......................................................................................................... 17
4.4 Mapping soil characteristics ............................................................................................................. 18
4.5 Precision farming practices ......................................................................................................... 18
5. Remote sensing techniques applied in support of Area Frame .............................................................. 18
6. The FAO approach using LCCS 3 the contribution to AF ..................................................................... 21
7. The Land Cover database generation ................................................................................................. 23
8. Land cover database generation in support to Area Frame: two case studies: Ethiopia and Pakistan
lessons learned ........................................................................................................................................... 26
9. What gaps are there and what about expected future developments and implementation? .............. 27
10. Conclusion and Recommendations....................................................................................................... 29
ANNEX I ....................................................................................................................................................... 31
Literature review ......................................................................................................................................... 31

2
Preface This report presents the main findings of a bibliographic research focused on the application of remote
sensing to agriculture and rural statistics. It was carried out in support of the Global Strategy Action Plan
which aims to provide specific guidelines to national and international statistical authorities on how to
produce basic data and information to guide decision–making at institutional and governmental level
and considering the general decline in quantity and quality of agricultural statistics. At this early stage of
the project, the work mainly dealt with the systematic creation of a catalogue of relevant literature and
any other inherent information; the research focused on the RS applications in agriculture and in
particular on the aspects and activities related to land cover database generation and classification
systems in support of the construction of the Area Frame sampling scheme.
A major effort was made to understand how the different Authors, statisticians and experts in the field
exploit the remote sensing products and technologies in different phases of the statistical analysis,
summarizing the state-of-art and identifying the future evolution, in particular, in relation to the
improvements and progress attained by new technologies in terms of their resolving capabilities in
spatial, spectral and temporal domain.
Sources of information are derived mainly from on-line catalogues and research engines from which the
relevant papers are available; the literature review focused on scientific publications, documentation
regarding national approaches for statistics in agriculture and when available , on operational projects.
This collection cannot be considered as complete due to the wide scope of the topics analyzed;
however, the basic guidelines for the continuation and extension of the research and the classification
of the documentations have been established.
The research was carried out during the first part of the consultancy; in the second part, the acquired
documentation was catalogued and partially analyzed. Finally, general considerations derived from the
collected papers presenting the state-of-art of the application of the remote sensing in agriculture and
operative experiences, are provided.
In the first part of the report, the actual and future RS products available are presented with their
approximate costs. The second part presents an overview of the various statistical approaches applied
around the world, highlighting the applications of the remote sensing products and techniques. The
third part presents, in more detail, remote sensing subject and its applications for agricultural statistical
analysis, especially in relation to the land use and land cover as a basis for statistics extraction,
stratification and sample allocation. In particular attention is given to the aspect linked to the generation
of a land cover database in LCCS 3 style as a tool to support the Area Frame. Finally the main gaps and
recommendations derived from this preliminary analysis are provided.
In ANNEX I, the main criteria adopted for the research and the list of the main scientific journals
consulted are listed.
Considering the timeframe available this report cannot be considered to be complete, however, it does
provide a general overview.

3
I would like to express a special thank you to Elisabetta Carfagna: ESS and John Latham: NRL for all the
support and clarifications provided.
1. Introduction The assessment of cultivated area is a long standing challenge that has confronted the accurate and
timely monitoring of agriculture. Nowadays, an evaluation of the two main components of crop
production (area and yield) can be supported and facilitated by the innovative satellite remote sensing
technologies which can provide timely, precise, objective and accurate information.
It is a general agreement that by using remote sensing technology, efficiency and accuracy of traditional
agricultural statistics and agriculture condition monitoring systems can be significantly improved. Their
utilization and exploitation is advocated and promoted as a powerful tool in many phases of the
assessment. In several papers, many Authors widely discuss and report all the strong aspects as well as
their present limitations (Carfagna, Gallego, Latham etc…).
The application of geospatial sciences has gained significant credibility over the past few decades. GIS,
Remote Sensing and Global Positioning System (GPS) are the most frequently applied tools that have
evolved rapidly in order to address a wide range of scientific problems within the agricultural monitoring
field. For what regards the agricultural production and agronomy, remotely sensed imagery is beneficial
in many related activities such as:
• crop type identification; • crop classification; • crop condition assessment; • crop yield estimation; • mapping of soil characteristics; • mapping of soil management practices; • compliance monitoring (farming practices). Furthermore, in the context of the area frame construction, crop type discrimination and monitoring, RS
have all been successfully applied in different phases of the process; sampling allocation on the ground
also requires the utilization of aerial photos and/or images. High quality land cover also provides an
updated baseline and has been especially useful for stratification. In this regard the generation of vector
databases or automatic classification products that produces can generate high quality raster digital
outputs that can improve the efficiency of sample allocation and indeed reduce sample size, thereby
improving overall efficiency.
The selection of an appropriate entry level for the use of RS and the generation of a product that can
improve overall efficiency has to be a key first parameter in the design and determination of how best
RS can contribute to the improved utilization of auxiliary variable e.g. RS for agricultural monitoring.
Appropriate technology utilization is also governed by such parameters as budget, timeframe, and size
of the area of interest.
4
This literature review has concentrated mainly on the applications of optical images to support the
development of improved agriculture statistics. Thermal Infrared Images and Microwave imagery have
more complex and specific procedures and methods of applications and processing. It is recommended
that due to their specificity they require a detailed specific module. At this stage of the work, they are
only briefly mentioned and reviewed.
For the main characteristics of the products and general principles of RS and its applications there are
excellent books and manuals [9, 10, 11] and several other lecture notes and tutorials are available on
line [e.g. 8]; there are also numerous pertinent remote sensing web sites and some, interesting ones are
shown in table 1.
Relevant http address for RS
http://satellite.rsat.com/rsat/tutorial.html
http://auslig.gov.au/acres/referenc/abou_rs4.htm
http://landsat.gsfc.nasa.gov/education/tutorials.html
http://www.ccrs.nrcan.gc.ca
http://earthengine.google.org/#intro Table 1 - RS links.
2. The remote sensing products, an overview Nowadays, the satellite companies offer a wide range of products with different characteristics and
functionalities.
The following table shows the main characteristics of some of the major optical remote sensing sensors
(medium, high and very high). These products and their characteristics are well known to the RS end-
users; as well the many technical experts; and are also widely utilized in a number of research and
operational applications.
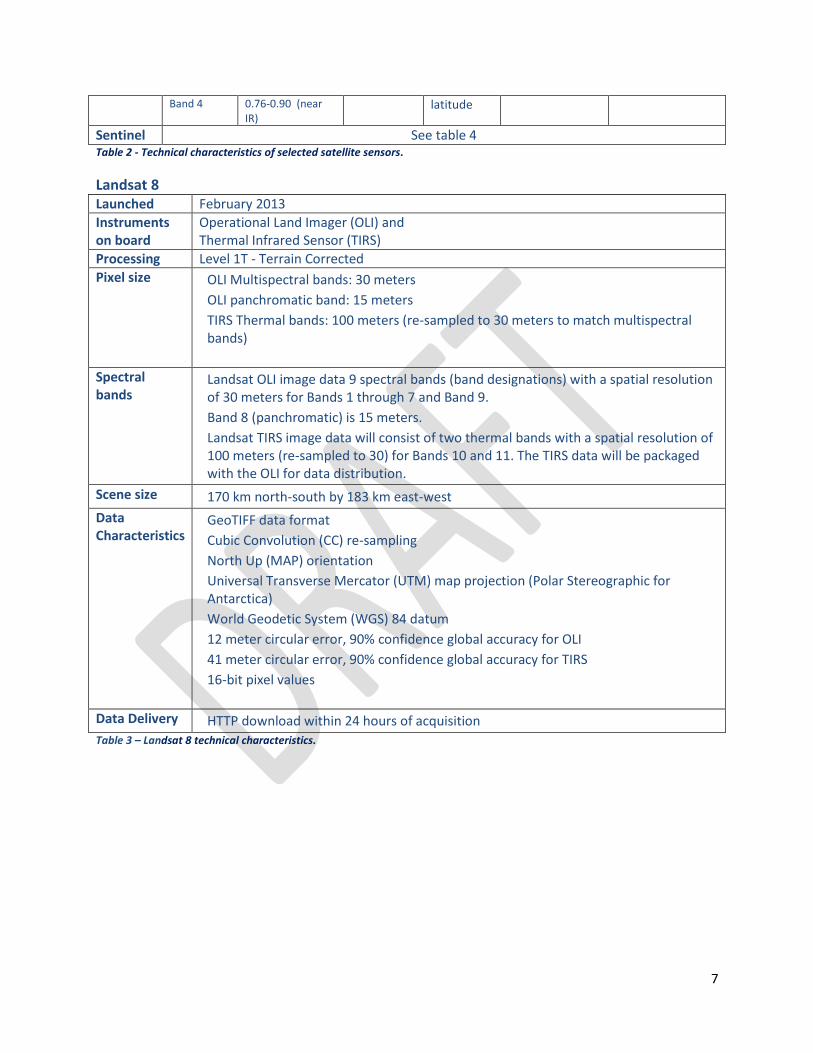
Recently, new interesting products have become accessible to the market e.g. Landsat 8 from USA-NASA
and Sentinel by EU, ESA is due to be launched in early 2014. These products offer significant promise
towards contributing to operational of the use of RS within agricultural surveys. Tables 4 and 5 provide
additional technical details
Landsat 8 is immediately downloadable while Sentinel products will be ready in 2014. The interesting
aspect is that they are both proposed as i no-cost products which opens a new perspective in particular
when surveys and analysis involve the coverage of wide territories at a national/regional level.
Sentinel is arranged in 5 missions which carry a range of different technologies, such as radar and multi-
spectral imaging instruments for Earth monitoring. Sentinel 1 and 2 are the mission that can be of
interest for agriculture, the others are dedicated to sea-surface topography, sea- and land-surface
temperature, ocean color and land color (Sentinel 3) and atmospheric monitoring (Sentinel 4-5).

5
Sensor Spectral Resolution Spatial Resolution
(m)
Re-visist time
(days)
Recommended Max. working scale (approx)
Approx Cost
Channel Wavelength range (µm)
Low/ medium NOAA-AVHRR
Channel 1 0.58-0.68 (red)
1100x1100 1 1:1.5 M 0.00015 $/kmq
Channel 2 0.725-1.1 (near IR)
Channel 3 3.55-3.93 (mid. IR)
Channel 4 11.3-12.6 (ther. IR)
Channel 5 11.4-12.4 (ther. IR)
MODIS Channel 36 From 0.620 To 2.155 250-1000 1 1:1.5 M free
MERIS Channel 15 From 0.39 To 1.04 300-1200 3 1:1.5 M free
SPOT VGT
Channel 1 0.50-0.59 (green)
1150x1150 1 1:1.5 M free Channel 2 0.61-0.68 (red)
Channel 3 0.79-0.89 (near IR)
Channel 4 1.58-1.75 (sh. w. IR)
High Landsat Channel 1 0.5-0.6 (green)
80x60 18
1:200.000/ 1:100.000 free
MSS Channel 2 0.6-0.7 (red)
Channel 3 0.7-0.8 (near IR)
Channel 4 0.8-1.1 (near IR)
TM/ETM Channel 1 0.45-0.52 (blue)
30x30
16
Channel 1 0.52-0.60 (green)
Channel 3 0.63-0.69 (red)
Channel 4 0.76-0.9 (near IR)
Channel 5 1.55-1.75 (sh. w. IR)
Channel 6 10.4-12.5 (ther. IR)
120x120
Channel 7 2.08-2.35 (sh. w. IR)
30x30
ETM Pancro 0.52-0.9 15x15
Landsat 8 See table 3
SPOT-XS Band 1 0.50-0.59 (green) 20x20 5- 2.5 26
1:100.000 1:5000
Band 2 0.61-0.68 (red)
Band 3 0.79-0.89 (near IR)
SPOT Pancro 0.51-0.73 10x10 1:50.000
ASTER 3 Bands VNIR (near IR) 15
16 1:100.000
0.0152$/kmq 6 Bands SWIR (near IR) 30 5 Bands TIR ((ther. IR) 90
IRS Pancro 0.5-0.75 5.8x5.8
24
1:15.000 0.33$/kmq
IRS LISS
Band 2 0.52-0.59 (green)
23.5x23.5 1:100.000 0.114$/kmq Band 3 0.62-0.68 (red)
Band 4 0.77-0.86 (near IR)
Band 5 1.55-1.7 (near IR)

6
IRS WiFS
Band 3 0.62-0.68 (red)
188x188 5 1:500.000 Band 4 0.77-0.86 (near IR)
DMC Band 1 0.52-0.60 (green)
22 3/1 1:100.000
Ortho-rectified $ 592 per image $ 0.12 per km2
Band 2 0.63-0.69 (red)
Band 3 0.77-0.90 (near-IR)
DMC Nigeria Sat-2 2015
Pancro 0.52-0.898 2.5
Now on demand
1:100.000 1:5.000
Band 1 0.448-0.517(blue)
5 Band 2 0.527-0.606
(green)
Band 3 0.63-0.691 (red)
Band 4 0.776-0.898 (near-IR)
DMC3 2015
Pancro 1 R,G,B,NIR 4
ALOS Band 1 0.42-0.50 (blue)
10 46 1:100.000 $ 0.1004 $/kmq Band 2 0.52-0.60 (green)
Band 3 0.61-0.69 (red)
Band 4 0.76-0.89 (near-IR)
Very high Pleiades Pancro 0.47-0.83 0.7 1 day (43°
off-nadir) 4 days (30° off-nadir) 5 days (20° off-nadir) 13 days (5° off-nadir)
Very detailed < 1:5000
13 $/kmq
Band 1 (B0) 0.43-0.515(blue)
2.8
Band 2 (B1) 0.50-0.62 (green)
Band 3 (B2) 0.59-0.71 (red)
Band 4 (B3) 0.74-0.94 (near IR)
RapidEye Band 1 0.44-0.51 (blue)
5 5
Very detailed < 1:5000
1.28 $/kmq Band 2 0.52-0.59 (green)
Band 3 0.63-0.685 (red)
Band 4 0.76-0.85 (near IR)
GeoEye-1 Pancro 0.40-0.80 0.5
21
Very detailed < 1:5000
25-40 $/kmq Band 1 0.45-0.51 (blue)
2.0 Band 2 0.51-0.80 (green)
Band 3 0.655-0.69 (red)
Band 4 0.78-0.92 (near IR)
Quickbird Pancro 0.45-0.90
0.6-2.4
1-3.5 days, depending on latitude (30° off-nadir)
Very detailed < 1:5000
28-40 $/kmq Band 1 0.45-0.52 (blue)
Band 2 0.50-0.60 (green)
Band 3 0.63-0.69 (red)
Band 4 0.76-0.90 (near IR)
IKONOS Pancro 0.45-0.90
0.8-3.2
Approx. 3 days at 40°
Very detailed < 1:5000
20-35 $/kmq Band 1 0.45-0.52 (blue) Band 2 0.50-0.60 (green)
Band 3 0.63-0.69 (red)
7
Band 4 0.76-0.90 (near IR)
latitude
Sentinel See table 4 Table 2 - Technical characteristics of selected satellite sensors.
Landsat 8 Launched February 2013
Instruments on board
Operational Land Imager (OLI) and Thermal Infrared Sensor (TIRS)
Processing Level 1T - Terrain Corrected
Pixel size OLI Multispectral bands: 30 meters
OLI panchromatic band: 15 meters
TIRS Thermal bands: 100 meters (re-sampled to 30 meters to match multispectral bands)
Spectral bands
Landsat OLI image data 9 spectral bands (band designations) with a spatial resolution of 30 meters for Bands 1 through 7 and Band 9.
Band 8 (panchromatic) is 15 meters.
Landsat TIRS image data will consist of two thermal bands with a spatial resolution of 100 meters (re-sampled to 30) for Bands 10 and 11. The TIRS data will be packaged with the OLI for data distribution.
Scene size 170 km north-south by 183 km east-west
Data Characteristics
GeoTIFF data format
Cubic Convolution (CC) re-sampling
North Up (MAP) orientation
Universal Transverse Mercator (UTM) map projection (Polar Stereographic for Antarctica)
World Geodetic System (WGS) 84 datum
12 meter circular error, 90% confidence global accuracy for OLI
41 meter circular error, 90% confidence global accuracy for TIRS
16-bit pixel values
Data Delivery HTTP download within 24 hours of acquisition
Table 3 – Landsat 8 technical characteristics.

8
Sentinel 1 Launched 2013
Instruments on board
Sentinel-1 is a polar-orbiting all-weather, day-and-night radar imaging
C-band imaging radar mission
Processing
Pixel size 5×20
Spectral bands
is expected to provide coverage over Europe, Canada and main shipping routes in 1–3 days, regardless of weather conditions
Scene size swath width of 250 km
Data Characteristics
Data Delivery Radar data will be delivered within an hour of acquisition
Table 4a – Sentinel1 - technical characteristics
Sentinel 2 Launched 2014
Instruments on board
Sentinel-2 is a polar-orbiting, multispectral high-resolution imaging mission
Processing Level-1 image processing includes:
- a) Radiometric corrections: straylight/crosstalk correction and defective pixels exclusion, de-noising, de-convolution, relative and absolute calibration - b) Geometric corrections: co-registration inter-bands and inter-detectors, ortho-rectification.
Level 2 image processing includes:
- a) Cloud screening - b) Atmospheric corrections: including thin cirrus, slope and adjacency effects correction - c) Geophysical variables retrieval algorithms: e.g. fAPAR, leaf chlorophyll content, leaf area index, land cover classification.
Level 3 provides spatio-temporal synthesis
Simulation of cloud corrections within a Level 2 image
Pixel size < 1 ha MMU (Minimum Mapping Unit) fully achievable with 10 m 4 bands at 10 m, 6 bands at 20 m and 3 bands at 60 m spatial resolution (the latter is dedicated to atmospheric corrections and cloud screening)
Spectral bands
Optical payload with visible, near infrared and shortwave infrared sensors comprising 13 spectral bands). 0.4-2.4 µm (VNIR + SWIR)
Scene size swath width of 290 km
Data Characteristics
Revisit time of five days at the equator (under cloud-free conditions) and 2–3 days at mid-latitudes
Data Delivery
Table 4b – Sentinel2 - technical characteristics.

9
3. The country approaches for Crop Area Estimation using remote
sensing, an overview Since the 1970's, the United States and other developed countries have taken the lead in conducting
acreage and yield estimation of major food crops (wheat, corn, rice, etc.). These were implemented in
the early 70/80s’through the Lacie and then Agristars programmes and then operationalized nationally
through a series of major projects and now form a regular operation technology and monitoring system.
To-date, crop area and yield estimation through the use of auxiliary variables especially the increased
use of remotely sensed satellite measurements by the United States and the European Union are the
most significant although several developing country programs have been implemented e.g. Libya;
Latham 1981/82/83, Sudan Wigton, et al Morocco. Bousafour et al..
The United States National Aeronautics and Space Administration, the National Oceanic and
Atmospheric Administration (Large Area Crop Inventory Experiment, 1974-1978), completed the
experiment of measuring the area, yield and production of the world’s major wheat-producing area. This
was the first work on agricultural monitoring by remote sensing measurements and has become a
milestone (Jerry et al., 1979). After the LACIE program, the United States launched AGRISTARS, Ag20/20
and other agricultural resources survey projects.
The European Union (EU) launched the MARS program in 1989 which experimented on surveying crops
by using remote sensing techniques in a large area and finally became a practical operating system.
MARS can monitor and forecast crop information on three levels: Community, regional and national (F.
J. Gallego, 1999). Following the MARS program, the EU launched the LUCAS program which investigated
the land use situation based on an area sampling frame. LUCAS was implemented on a national,
Member States and international scale (Delince, 2001; Gallego, 2004).
Furthermore, during the 20th century, the rapid development of applications in crop area and yield
estimation by remote sensing technology have been achieved, more precisely : the Food and Agriculture
Organization (FAO) established a global early warning food information system to monitor and forecast
global crop yield; Canada uses the NOAA satellites to realize crop water measurement, disaster warning,
yield forecasting in large areas; Russia use MODIS to estimate crop acreage in the south of Russia; South
Africa estimate crop area with the support of remote sensing data and unmanned aerial vehicles; Brazil
monitor crop acreage and yield in the south of Brazil using remote sensing data.
In 2008 The “Group of Earth Observation” prepared a useful excursus on the best practices for Crop
Area Estimation [31] carried out by several national agencies. The main parameters analyzed are listed
below; however, they were not always available:
Scale of Coverage;
Input data;
Spatial resolution;
Sampling Design;
Image analysis;
Accuracy evaluation;

10
User acceptance;
Cost/benefit;
Software;
Manual;
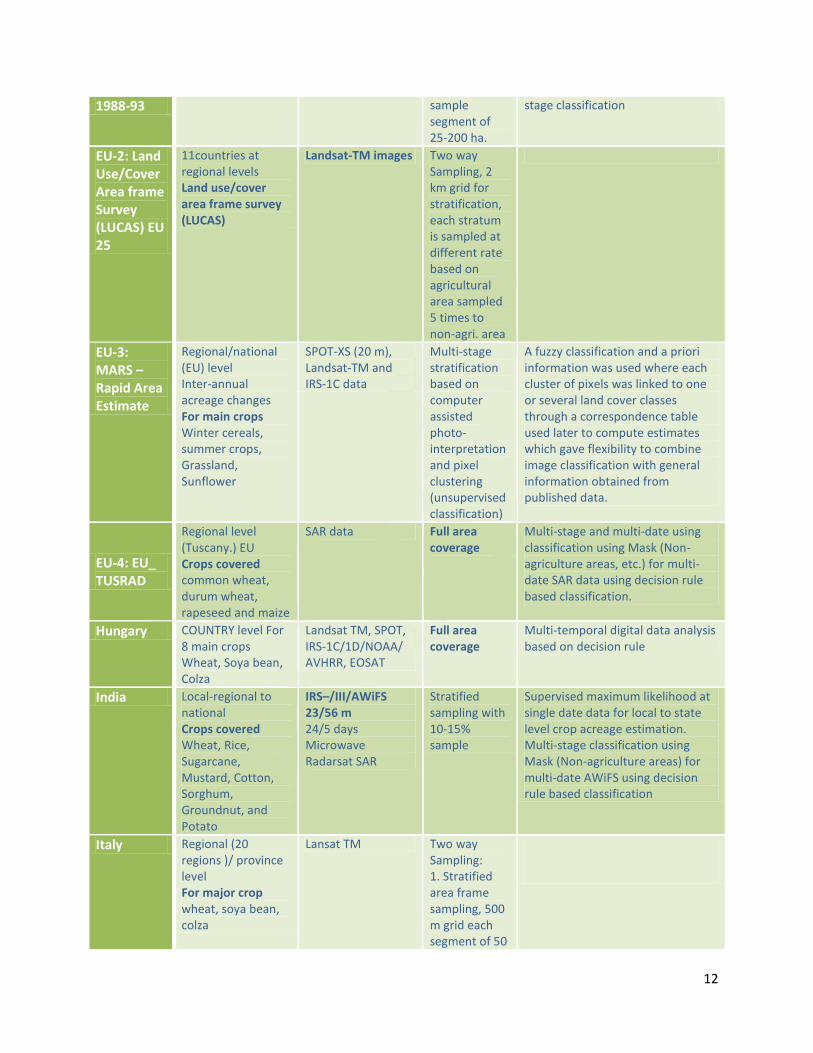
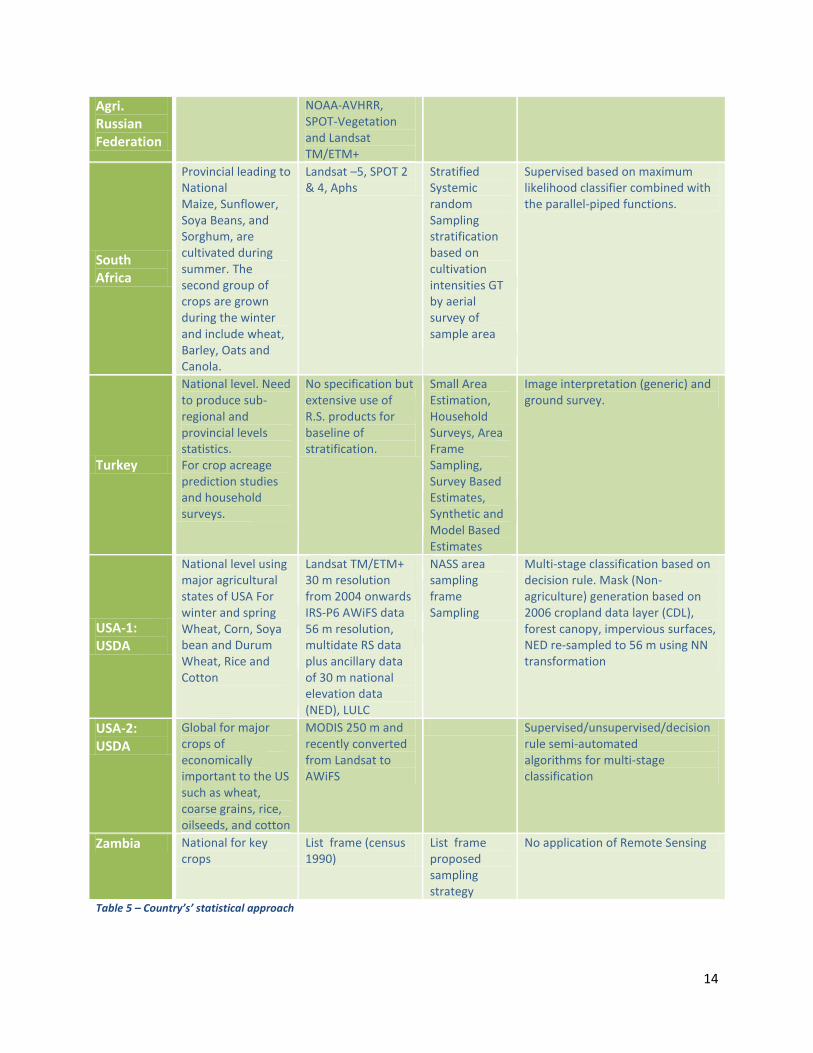
Sources. Table 5 summarizes, the most important features for the countries analyzed. The table is integrated with
other cases extracted from a collection of different publications and papers when the topic referred to a
country/regional level.
Country Scale of Coverage Crop covered
Input data Spatial resolution
Sampling design
Image Analysis
Argentina
Regional / province Landsat and Medium Resolution (SAC-C, 175 m pixel size) imagery
Stratified Sampling based on digital cadastral maps and other ancillary data
Digital analysis
Belgium &Poland
National Meris, SPOT & Landsat
Full area coverage will be input to Area Frame Sampling (AFS)
Arable land cover mask generation based on Corine land cover (CLC) product. Decision rule based classification using Temporal coverage for Fraction of Green Vegetation (GLCV).
Brazil
State level for Rice, Wheat and Soya bean
NOAA/AVHRR, Landsat TM, Recently switched to (MODIS 250 m res.).
Full area coverage
NDVI image thresholding based on decision rule, on image differencing of NDVI images
Canada
National level using major agricultural states. For Potatoes as single crop
Optical and SAR (VV-VH) data, future plan for polarimetric SAR data from Radarsat -2
Sampling of RS data followed by regression estimator
Multi-temporal classification based on decision rule.
Prince Edward Island (PEI), Canada
Province level for Potato
Medium resolution, Earth Observation (EO) satellite data
Stratified Sampling combined with a regression estimator
China National level to global level (26 countries,
NOAA/AVHRR, SPOT-VGT, Landsat TM, ALOS and
Full area coverage with remote
Multi-temporal satellite data, Spectral profile based on NDVI.

11
representing 80% grain production) Eight crops - winter and spring Wheat, early Rice, semi-late Rice and late Rice, spring and summer maize and Soya bean.
Radarsat presently switched to MODIS,
IRSP6/AWIFS,BJ-1 and HJ-1a/b
sensing data Transect sampling for crop types
Colombia
National level Colombian National Agri. Survey (NAS). and Colombian Legumes Survey (LS)
No mentioned ASF with coverage of 37,900,546 has (169,587 SSUs in 31,588 PSUs). LS coverage of 10,874 has (588 sampling units).
Ethiopia, Niger and Zimbabwe
National level, pilot area in Ethiopia. For crop/non crop area
Lansat ETM+ / AWiFS other inputs are sample of high resolution images as main variable and the moderate resolution images and other ancillary information included: the SDRN-FAO processed SRTM 90 meter digital elevation model; the FEWSNET primary livelihood zones for Niger; the agro-ecological zones defined by the Water Requirement Satisfaction Index (WRSI) for Zimbabwe; and the International Research Institute woody biomass map for Ethiopia as co-variables
Sampling frame at 2 km grid and Sample area at 0.5 km.
Field survey/ GT by photo-interpretation on Ikonos and Quickbird
Ethiopia National SPOT 5m From 2008 AF Land cover using LCCS and object
based stratification methodology
EU-1: EU-MARS
EU countries at regional levels
Landsat TM, SPOT Stratified Sampling,
Supervised/unsupervised/decision rule Mask(Non-agriculture)/multi-
12
1988-93 sample segment of 25-200 ha.
stage classification
EU-2: Land Use/Cover Area frame Survey (LUCAS) EU 25
11countries at regional levels Land use/cover area frame survey (LUCAS)
Landsat-TM images Two way Sampling, 2 km grid for stratification, each stratum is sampled at different rate based on agricultural area sampled 5 times to non-agri. area
EU-3: MARS – Rapid Area Estimate
Regional/national (EU) level Inter-annual acreage changes For main crops Winter cereals, summer crops, Grassland, Sunflower
SPOT-XS (20 m), Landsat-TM and IRS-1C data
Multi-stage stratification based on computer assisted photo-interpretation and pixel clustering (unsupervised classification)
A fuzzy classification and a priori information was used where each cluster of pixels was linked to one or several land cover classes through a correspondence table used later to compute estimates which gave flexibility to combine image classification with general information obtained from published data.
EU-4: EU_ TUSRAD
Regional level (Tuscany.) EU Crops covered common wheat, durum wheat, rapeseed and maize
SAR data Full area coverage
Multi-stage and multi-date using classification using Mask (Non-agriculture areas, etc.) for multi-date SAR data using decision rule based classification.
Hungary COUNTRY level For 8 main crops Wheat, Soya bean, Colza
Landsat TM, SPOT, IRS-1C/1D/NOAA/ AVHRR, EOSAT
Full area coverage
Multi-temporal digital data analysis based on decision rule
India Local-regional to national Crops covered Wheat, Rice, Sugarcane, Mustard, Cotton, Sorghum, Groundnut, and Potato
IRS–/III/AWiFS 23/56 m 24/5 days Microwave Radarsat SAR
Stratified sampling with 10-15% sample
Supervised maximum likelihood at single date data for local to state level crop acreage estimation. Multi-stage classification using Mask (Non-agriculture areas) for multi-date AWiFS using decision rule based classification
Italy Regional (20 regions )/ province level For major crop wheat, soya bean, colza
Lansat TM Two way Sampling: 1. Stratified area frame sampling, 500 m grid each segment of 50

13
ha. 2. Regression estimator
Iran
Country, provincial level (rice, wheat & barley, and other annual crops
No mentioned stratified two stage sub-sampling for crop survey
Libya
National & Regional (Area Gefera Plain, Jebel Achdar)(1981/82/83)
Landsat MSS/TM Aerial photos
Multi year /Multi seasonal Stratified Random Sample Area Frame
Digital Image Analysis
Kazakhstan
Local level, Pilot project Cereals: winter Wheat, spring Barley combined together
MODIS 250 m, IRS LISS-III 23 m
Full area coverage
Morocco
Country SPOT 5-10m AFS. Stratified sampling based on image interpretation
Visual interpretation using 10 stratum (land cover classes)
Norway
Country level for natural resources
APh for fieldwork. Lucas linked to Eurostat. AF sampling at intersection of 18x18 km. PSU 1500x600m inside 10 SSU.
No detail how the R.S. data are used.
Pakistan
District level (Rahim Yar Khan Dist.) Crops covered winter crops, summer crops, double cropping, and dominant pluri-annual and permanent crops
SPOT VEGETATION data for stratification and SPOT4&5 HRV for digital analysis
Stratified sampling based on NDVI profiles at district level
Multi-stage and multi-date using classification using Mask (Non-agriculture areas, etc.) for multi-date SPOT classification and regression estimator
Pakistan National SPOT 5m Land cover using LCCS and object
based stratification methodology
Russia-1 ISPRA
County level leading to National level For winter crop and sunflower
Multidate weekly composited MODIS / SPOT –VGT, Landsat TM /ETM+, NOAA/AVHRR data
Full area coverage
Decision rule based classification
Russia-2 Ministry of
National level For winter crop and sunflower
Terra/Aqua-MODIS (250 m) and SPOT 2&4 - HRV/HRVIR,
Full area coverage
Decision rule based classification
14
Agri. Russian Federation
NOAA-AVHRR, SPOT-Vegetation and Landsat TM/ETM+
South Africa
Provincial leading to National Maize, Sunflower, Soya Beans, and Sorghum, are cultivated during summer. The second group of crops are grown during the winter and include wheat, Barley, Oats and Canola.
Landsat –5, SPOT 2 & 4, Aphs
Stratified Systemic random Sampling stratification based on cultivation intensities GT by aerial survey of sample area
Supervised based on maximum likelihood classifier combined with the parallel-piped functions.
Turkey
National level. Need to produce sub-regional and provincial levels statistics. For crop acreage prediction studies and household surveys.
No specification but extensive use of R.S. products for baseline of stratification.
Small Area Estimation, Household Surveys, Area Frame Sampling, Survey Based Estimates, Synthetic and Model Based Estimates
Image interpretation (generic) and ground survey.
USA-1: USDA
National level using major agricultural states of USA For winter and spring Wheat, Corn, Soya bean and Durum Wheat, Rice and Cotton
Landsat TM/ETM+ 30 m resolution from 2004 onwards IRS-P6 AWiFS data 56 m resolution, multidate RS data plus ancillary data of 30 m national elevation data (NED), LULC
NASS area sampling frame Sampling
Multi-stage classification based on decision rule. Mask (Non-agriculture) generation based on 2006 cropland data layer (CDL), forest canopy, impervious surfaces, NED re-sampled to 56 m using NN transformation
USA-2: USDA
Global for major crops of economically important to the US such as wheat, coarse grains, rice, oilseeds, and cotton
MODIS 250 m and recently converted from Landsat to AWiFS
Supervised/unsupervised/decision rule semi-automated algorithms for multi-stage classification
Zambia National for key crops
List frame (census 1990)
List frame proposed sampling strategy
No application of Remote Sensing
Table 5 – Country’s’ statistical approach

15
4. RS techniques applied in support of agricultural application A great deal of research has been carried out to develop and improve the techniques for the
identification and classification of crops by using multispectral and multi-temporal remote sensing data.
Fields of application such as crop area estimation [03a], crop condition monitoring [03b] and crop yield
estimation [03c] benefit from the spectral reflectance of this data. Theoretically it is supposed to link a
unique spectral signature to a specific crop type to aid for crop identification and indeed to then support
consistency of classification. However, when two crops have the same or similar spectral signature in a
given date, then a multi-date data set is required to identify them. To-date a considerable amount of
work has been done and this literature review highlights the fact that many studies have been dedicated
to testing and developing automatic techniques as fast, effective, timely and cheaper mapping tools to
classify, identify and monitor crops with different agricultural applications. A brief review of the
agricultural applications in remote sensing is provided and the main fields of application are toward so:
1. Crop type classification and crop identification.
2. Crop condition (monitoring) assessment.
3. Crop area and yield estimation.
4. Mapping of soil characteristics.
5. Precision farming.
It is important to stress that the application of remote sensing for the generation of land cover and its
associated database generation has not until recently been considered as valuable support in
agricultural statistics. However recent applications now consider it as a imperative for stratification, and
improved sample allocation and reduced sample size.
4.1 Crop type classification and identification National and international statistical agencies and other agriculture related organizations have a number
of reasons to identify and report on cropped area [see 03d] and yield to provide an estimate of
production. RS imagery as explained previously can be a surrogate for rapid estimates of such
information and can assist with survey design and its efficiency. Remote sensing techniques can play a
vital role and can contribute significantly in the identification and classification of different crops, and
the determination of their associated acreage and conditionality and potential yield and in turn
estimation of production multispectral and multi-temporal data are often used for this purpose.
Scientific investigators have often been confronted with the problem of automatic identification and
classification of the crop types in a timely and cost efficient manner. Crucial factors appear to be the
timely availability of imagery coincident with field survey, the possibility to manage two or three
different images of different periods of acquisition and conduct an adequate field verification
programme as part of the validation exercise; the complexity and heterogeneity of the agricultural
landscape and the presence or absence of homogeneous crops in the study area have also been an
important factor that greatly contributes to the quality, timeliness and efficiency and in turn the
ultimate accuracy of the final estimate.

16
An example is given in [21]; the authors consider LISS-IV and IKONOS images to discriminate sugar cane
and onion in a restricted area using Maximum Likelihood Classification (MLC). Particular attention is
given to the date of images to improve the definition of the crop types during the different stages of
growth. The overall accuracy in discrimination is from 82 to 86 % for one crop and from 91 to 94% for
the other; in order to ascribe to the presence of mixed cultures and monoculture has a better
discrimination level.
Finally, the correct and accurate identification of crop types can be attributed to the following well-
known factors:
-spectral and spatial resolution linked to the remote sensing product chosen and /or available;
-percentage of occurrence of pure or mixed pixels, that influence the spectral signature;
-field crop size;
-multi-date dataset availability.
4.2 Crop condition (monitoring) assessment An important group of applications concern the crop condition monitoring [see 03b]. Recurring passages
of the satellite are fundamental to monitor crops in a timely and accurate fashion. Crop condition
monitoring is also very useful in crop acreage and crop yield estimation. The monitoring of crop
condition is important to identify location specific sites, on farm, where growth has decreased or is
impaired. This can provide necessary information to improve timely decisions regarding the
management of the crops. Remote sensing imagery provides the required spatial overview of the farm
land. They can be helpful in identifying crops affected by less than optimal or stress related conditions
(scarcity of water and nutrient, pest attack, disease outbreak and weather conditions, physical
parameter and crop indices) and by their early detection they can provide farmers with the opportunity
to mitigate the effects; but also to monitor the outcome of their treatment.
Some researchers emphasize the fact that a clear definition about crop condition has not yet been
established.
Vegetation indices for direct monitoring
Many useful indexes for crop condition monitoring have been defined and are widely utilized in remote
sensing agriculture applications. These indexes are relatively easy to derive: the different band values
ratio do not required complex computation efforts however the interpretation of the output needs to
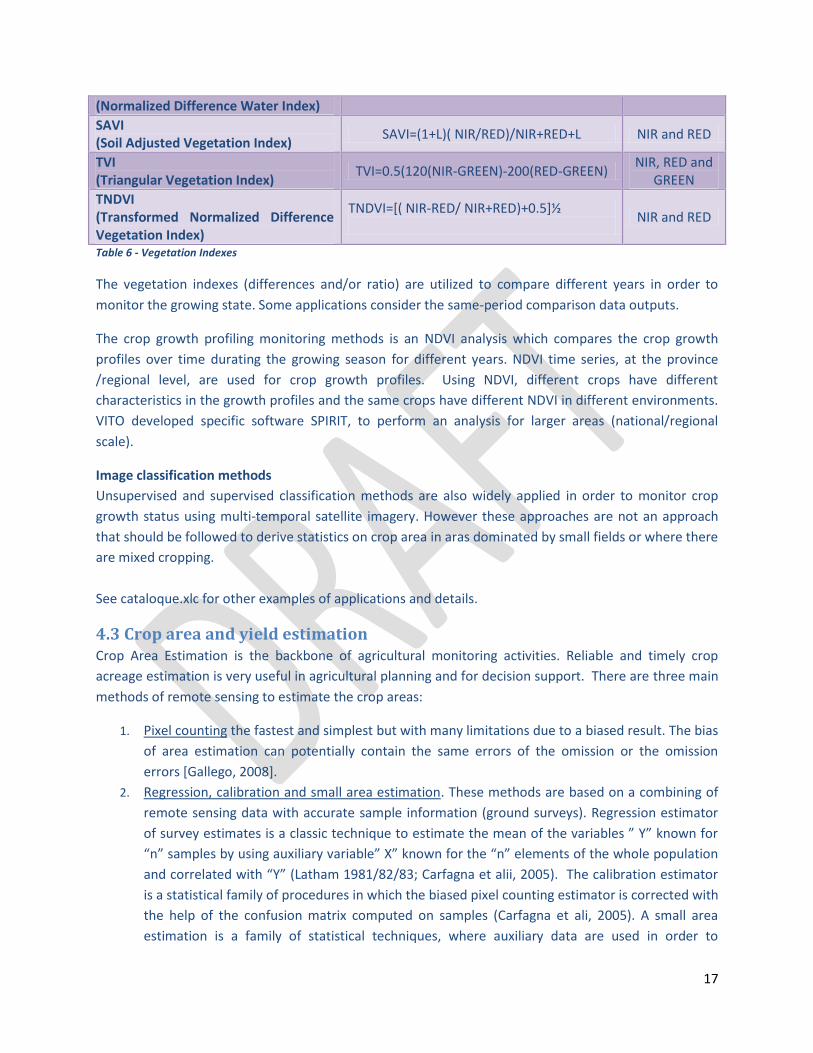
be carefully analyzed. Table 6 shows some of the most utilized and useful vegetation Indexes.
Vegetation index Formula Bands
RVI (Ratio Vegetation Index)
RVI=NIR/RED NIR and RED
NDVI (Normalized Difference Vegetation Index)
NDVI=NIR-RED/ NIR+RED NIR and RED
NDWI NDWI=NIR-SWIR/ NIR+SWIR NIR and SWIR
17
(Normalized Difference Water Index)
SAVI (Soil Adjusted Vegetation Index)
SAVI=(1+L)( NIR/RED)/NIR+RED+L NIR and RED
TVI (Triangular Vegetation Index)
TVI=0.5(120(NIR-GREEN)-200(RED-GREEN) NIR, RED and
GREEN
TNDVI (Transformed Normalized Difference Vegetation Index)
TNDVI=[( NIR-RED/ NIR+RED)+0.5]½
NIR and RED
Table 6 - Vegetation Indexes
The vegetation indexes (differences and/or ratio) are utilized to compare different years in order to
monitor the growing state. Some applications consider the same-period comparison data outputs.
The crop growth profiling monitoring methods is an NDVI analysis which compares the crop growth
profiles over time durating the growing season for different years. NDVI time series, at the province
/regional level, are used for crop growth profiles. Using NDVI, different crops have different
characteristics in the growth profiles and the same crops have different NDVI in different environments.
VITO developed specific software SPIRIT, to perform an analysis for larger areas (national/regional
scale).
Image classification methods
Unsupervised and supervised classification methods are also widely applied in order to monitor crop
growth status using multi-temporal satellite imagery. However these approaches are not an approach
that should be followed to derive statistics on crop area in aras dominated by small fields or where there
are mixed cropping.
See cataloque.xlc for other examples of applications and details.
4.3 Crop area and yield estimation Crop Area Estimation is the backbone of agricultural monitoring activities. Reliable and timely crop
acreage estimation is very useful in agricultural planning and for decision support. There are three main
methods of remote sensing to estimate the crop areas:
1. Pixel counting the fastest and simplest but with many limitations due to a biased result. The bias
of area estimation can potentially contain the same errors of the omission or the omission
errors [Gallego, 2008].
2. Regression, calibration and small area estimation. These methods are based on a combining of
remote sensing data with accurate sample information (ground surveys). Regression estimator
of survey estimates is a classic technique to estimate the mean of the variables ” Y” known for
“n” samples by using auxiliary variable” X” known for the “n” elements of the whole population
and correlated with “Y” (Latham 1981/82/83; Carfagna et alii, 2005). The calibration estimator
is a statistical family of procedures in which the biased pixel counting estimator is corrected with
the help of the confusion matrix computed on samples (Carfagna et ali, 2005). A small area
estimation is a family of statistical techniques, where auxiliary data are used in order to

18
downscale sample results to smaller populations where the sample itself is unable to provide
sufficient statistical support.
3. Area Frame surveys. Satellite image support area frame in several ways: to define sampling unit
for stratification and as graphic document for ground surveys and quality control. The
application of the remote sensing imagery to the AF preparation is extensively described in the
next paragraph. In particular, Gallego (2008) highlights that the stratification based on coarse
photo-interpretation of satellite images were cheap and proved cost-efficient. A further analysis
executed using land cover data base prepared with CORINE legend reaffirm the high efficiencies
for the stratification.
4.4 Mapping soil characteristics Information about the soil is beneficial in agricultural management and development. Remote sensing
imagery provides a synoptic overview of the study area makes it possible to map the soil types and
related characteristics in a fast and more effective way in respect to the traditional soil samplings and
laboratory analysis that although they are very precise are slow and costly. A great deal of research has
been carried out using microwave (active and passive) remote sensing for mapping soil characteristics
(Soil Salinity, Ravine Erosion Inventory, Sand Dune Characterization, Soil Texture and Hydraulic
Proprieties, Soil Drainage and Soil Surface Roughness).
4.5 Precision farming practices Precision farming is an emerging methodology which is designed to link management actions to site
specific soil and crop conditions and place inputs of fertilizing, herbicides and pesticides when there is a
need to maximize the farm efficiency and minimize the environmental contaminations. For precision
agriculture it is important to locate the exact position in the field which is totally based on RS, GIS and
GPS and GNSS technology.
Many of these applications are well illustrated in several papers and articles; please see cataloque.xlc for
specific details.
5. Remote sensing techniques applied in support of Area Frame In this paragraph the canonical steps for the construction of the area frame are presented; particular
emphasis is given to the steps where the remote sensing products and technologies are involved.
Conventional area frame sampling survey is a type of agricultural probability sample surveys activity
which is introduced as a vehicle for conducting surveys to gather information regarding crop acreage,
cost of production, farm expenditures, yield and production, livestock inventories and other agricultural
items; it is a costly and time-consuming methods that requires a basic data set (aerial-photographs
/images) topographic and thematic (land cover/use) maps or databases. In addition, a meticulous and
laborious work to delineate strata, primary survey units (PSUs) and then segments is required as well
qualified staff with strong statistical background. The aim of this paragraph is to present the steps where
the RS products are involved and try to evaluate the efforts.
19
The concept of area frame sampling is “dividing the total area to be surveyed into N small blocks
(Segments) without any overlap or omission, furthermore select a random sample of n small blocks and
get the desired data for reporting units of the population that is in the sample blocks”. Stratification of
survey area into number of strata and, again strata into PSUs, for reducing sampling variance, regarding
the homogeneity within a stratum is very important to gather more accurate estimates. The
stratification and the correct definition of the strata are therefore significant steps of the process.
The final stage-sampling units of an area frame are land areas called segments, which should not be
overlap and must cover the entire survey area. These land parcels can be determined based on factors
such as ownership or based simply on easily identifiable boundaries or square segments defined by
straight lines forming squares whose end points are established by map coordinates (FAO, 1996).
Segments will eventually be visited by an interviewer to gather agricultural information (Houseman,
1975).
The survey is a very expensive undertaking that involves an important logistic effort. Field data
collection is carried out by enumerators that complete a questionnaire by personal interviews with the
holder or other respondent who can provide information on the tract included in each selected sample
segment; it is vital that the enumerators are in the field at the proper time for gathering the desired
information. The enumerator uses the topographic map or a road map showing segment location to
identify routes of access and arrive at the segment; the enumerator check the good delineation of the
boundaries and commences the surveys with the nearest occupied dwelling or by approaching the
nearest visible worker in a field inside a segment. The next step is to identify the holder of a tract within
the segment. The holder helps the enumerator delineate the tract on the transparent overlay of the
segment photo.
The data collection, in addition to completion of a questionnaire, involves the identification and
measurement of cultivated areas. For each sample segment, the enumerator uses an aerial photo
enlargement (or a map or scale drawing), which includes the boundaries of the segment. This is called
the segment photo. For each tract within a given sample segment the enumerator delineates on the
segment photo the boundaries of the tract and the boundaries of all fields included in the tract. The
enumerator verifies the crops planted and other uses of land for each field, information provided also by
the holder. During the interview, the enumerator may also use a transparent grid on the segment photo
to verify, approximately, the reported area of fields. Such identified agricultural areas in each sample
segment can be measured. The checking of area estimates made by holders and /or enumerators
provides a very important feature concerning data reliability (Houseman, 1975; Latham 1982).
Area frames are critical to producing quality estimates, as they provide complete coverage with land
areas being represented in a probability survey with a known chance of selection (Cotter and Tomczak,
1994). This frame does not become out dated rapidly over time unless the population extends into areas
not covered by the frame (FAO, 1996).
To prepare an area frame, the first requirement is the availability of up-to-date cartographic materials.
The resolution must be sufficient to allow stratification and the subsequent subdivision of these strata

20
into PSUs, which must have recognizable permanent physical boundaries. PSUs are usually constructed
on photography or satellite images that show the boundaries of the strata. They are transferred to maps
for measurements. Each PSU must be measured and assigned a target number of segments. The number
of segments in each stratum is summed again to provide the total in the frame. Then a two-stage
probability sample of segments is selected from each stratum using a replicated selection procedure.
Each sample segment is constructed on small mosaics of aerial photography on which the boundary of
the corresponding PSU have been transferred. Finally, the selected sample segments are located on
aerial photo enlargements used to control field data collection (FAO, 1996).
Step One: Prepare the frame materials, Delineate frame limits, and measure total frame area. This step provides the approach of large area stratification. At this point the decision is which product
must be used (photo-mosaics, available ortho-photomaps, satellite images, only maps, or to use a
combination of any or all of these). Once the material is ready, the necessary boundaries are drawn to
delineate the potential sample units and frame limits.
Delineate and measure areas covered with water (Lakes, large rivers, etc.), heavy forest, high mountains, national parks, military reserves, and other non-agricultural land, except urban areas.
Outline and measure the urban and agro-urban strata. Central portion of the city is defined as non-agricultural. Area with high population density that also includes patches of agriculture is delineated as agro-urban agriculture.
Delineate strata in agricultural lands. The strata, in agriculture areas, are defined by proportion of cultivated land, predominance of certain crops, average size of cultivated fields and special sites of agricultural activities.
Step Two: Transfer strata boundaries to map. Measure and field verify the strata. The review strata boundaries are transferred from satellite images or photo mosaics to maps. At this step strata should be measured and the total area compared with available data. Step Three: Construct PSUs.
Construct PSUs. PSU should reflect on a small scale what are seen to be the stratum characteristics.
Transfer PSUs to maps and order PSUs. In this step, the PSUs are transferred to the maps.
Measure area of PSUs.
Assign measures of size to PSUs, strata and to total Frame.
As PSU areas are determined and approved, they are entered on another listing sheet. Next, segments
are assigned to the PSUs as determined by the area of PSU and the target size of segments in that
stratum. The number of assigned segments is equal to the area of the PSU divided by the target size of
the segments in the stratum, and the results approximated to the nearest integer. The measure of size
of the PSU should be an integer.

21
The availability of a reliable and consistent land cover data base can be an important element to
optimize, improve and speed–up the different processes in the Area Frame construction. As opposed to
stratification which is generally carried out with images, APhs or maps and an approximate identification
of the different land cover classes and is not carried out using appropriate skills, tools and background
material.
When the stratification is homogeneous there is less a margin for a sampling error while if it is less
homogeneous, the sampling error is higher. The availability of a consistent land cover data base can
provide the necessary support for the correct delineation of the strata and the reduction of the sampling
variance. An example is reported by Latham 1982, in Libya and Gallego, 2008 for EU survey using land
cover map prepared with CORINE legend.
All the outputs described in Step One would have been available immediately with high precision if a
valid land cover database had been prepared. The percentage of agriculture types of crops and many
other features of interest could be immediately “extracted” from the land cover database and the
accuracy of the land cover data could be found through a QA of the database. In addition, the digital
data base can be easily reprocessed or updated when new images and/or data become available.
Systematic reviews of the land cover/agriculture changes can be implemented every year, if necessary,
whenever a new image data set is acquired and a digital database is available.
The other steps described in parts two and three are standard procedures usually performed in a GIS
environment rapidly with a high level of accuracy. Any GIS software can provide a strong support for
the correct overlap of a different data set as well as the optimization of the routes and calculation of the
boundaries.
Furthermore, prior the survey, a digital segmentation (object-based) of the PSUs and the Segments on
the image/APhs can be generated. The resulting georefenced vector database could be useful to the
enumerator in the field. The segmentation quickly generates an accurate vector file with the delineation
of the physical boundaries and the vectorialization of the main features and their linked attributes (e.g.
area and perimeters). If the updated images dataset are available before the fieldwork, a previous
calculation of the crop extensions can be executed with - very little effort in terms of cost and time
In addition, the digital database is a strong framework for successive surveys.
6. The FAO approach using LCCS 3 the contribution to AF
Whilst stratification is considered a important step in the Area Frame development for the generation of
homogenous strata, the creation of “good” information baseline seems not to be considered to be taken
into account by many statistical designers; therefore, many statisticians end-users manage and use the
information available rather than create ad hoc database.

22
The land cover derived from satellite imagery and classified with any type of approach provides a
convenient illustration of the landscape information. This data is immediately treated by users who are
unaware of the intrinsic meaning of the geographic information so that the majority of the time its
related accuracy, is completely ignored. The underlying perceptions of the information differ, however,
among the various actors according to their disciplinary perceptions. In other words, there is confusion
in the way different users treat land cover information, which originates in part from how land cover
information is both defined and generated (Comber et al. 2004).
Digital (or not) land cover/land use information is transferred from the producers to the end-users and,
in the majority of cases, it provides a useful surrogate with which the stratification is performed.
There is also a continuous misunderstanding among the different users between the land cover and land
use concept.
Land cover is the observed (bio) physical cover of the earth’s surface and includes vegetation and man-
made features, as well as bare rock, bare soil and inland water surfaces.
Land use is a description of how people utilize the land (Comber, 2006). Land use is characterized by the
arrangements, activities and inputs people undertake in a certain land cover type to produce change or
maintain it. Land use establishes a direct link between land cover and the actions of people in their
environment.
From satellite interpretation it is possible to capture land cover features of the land while their
utilization is linked with many other factors (e.g. social, cultural, economic etc.) that can be defined only
when ancillary information becomes available.
A number of classification schemes have been devised over the past years for classifying and recording
land cover and land use features and for monitoring their changes.
FAO-NRL geospatial unit has a wide experience in land cover mapping. It has also defined and developed
a new standardized classification system. In 2002, the unit proposed the Land Cover Classification
System (LCCS2) scheme which later evolved into LCCS3 Land Cover Meta-Language (LCML). The ISO
standardization approval as standard on Geographic Information ISO TC-211 came in July 2012. LCCS3 is
based on the idea that it is more important to standardize the attributed terminology rather that the
final categories. LCCS works by creating a set of standard diagnostic attributes (called classifiers) to
create/describe different land cover classes (ISO19144-2-2012, LCCSDiGregorio, 2011). The classification
method offers an important innovation in respect to the other classification systems previously adopted
(e.g. CORINE Land Cover, USGS Anderson Classification, etc.). The LCML is based on the utilization of the
classifiers as class elements that are defined unambiguously worldwide and provides the classification
rules to describe land cover types. The application of the LCML assists in the adoption of actual map
changes rather than changes in semantics and definitions as they occur by using any other predefined
classification system which often contains a great deal of overlapping classes and sometimes even
contains gaps. In order to overcome these limitations the application of the national legend based on

23
the land cover classification system is a fundamental element to achieve consistent mapping and
monitoring activities.
Several advantages can be derived from the utilization of an LCCS 3 land cover database, here below is a
brief description of the main points:
clear and systematic description of the L.C. classes;
LCCS supports a concrete standardization of different L.C. data base;
it rationalizes and links field and remote sensing derived data;
the use of LCCS sustains a high flexibility of the thematic content of a data base;
it allows the introduction of new procedures of accuracy analysis of data ( LCCS Digregorio,
2011);
it can be developed as a multipurpose database and be useful in many environmental
applications.
On the contrary, there are not so many disadvantages. When a mapping activity is planned the
definition of the land cover in LCCS3 is not a complex task. The software, tutorial and support from the
FAO HQ are available and free of charge and an ad-hoc training course can be arranged if and when
required.
7. The Land Cover database generation The purpose of this paragraph is to briefly present the phases of the land cover database preparation
from the preprocessing up to its generation.
The FAO NRL mapping approach is a multifaceted procedure derived by the decadal experience in
building up detailed national multipurpose databases; for its production, specific and standardized
mapping procedures have been set up to assure a reliable, consistent and comparable product.
24
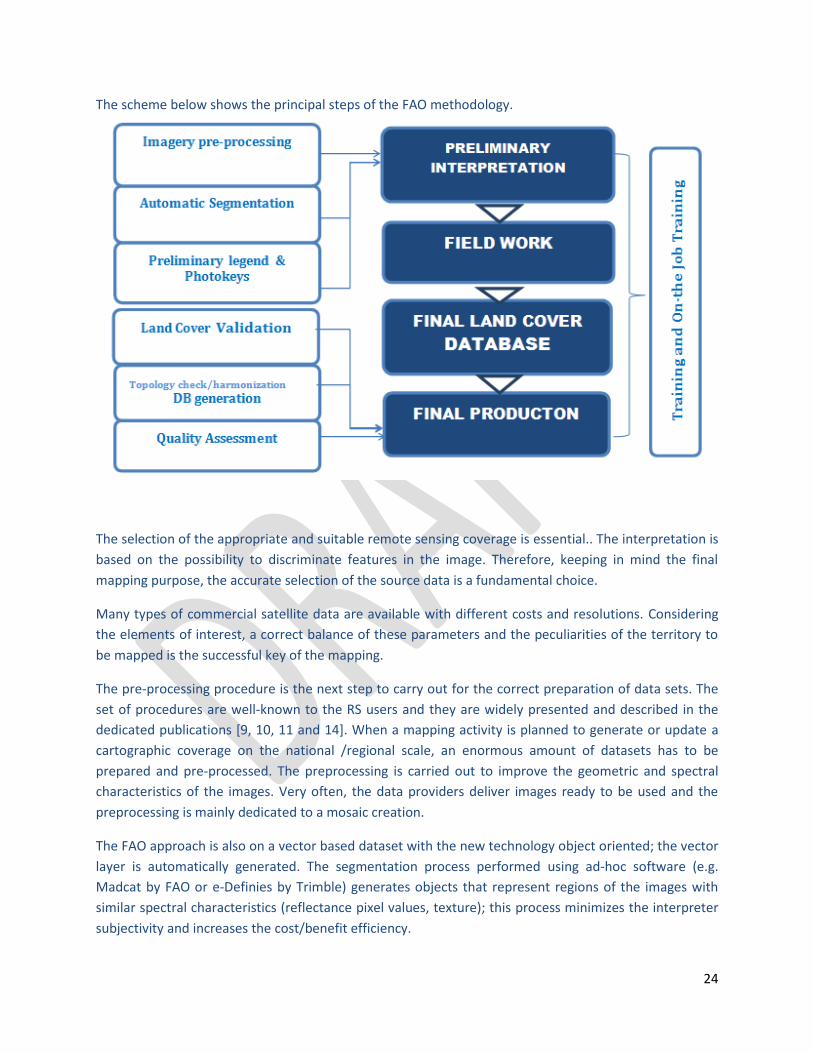
The scheme below shows the principal steps of the FAO methodology.
The selection of the appropriate and suitable remote sensing coverage is essential.. The interpretation is
based on the possibility to discriminate features in the image. Therefore, keeping in mind the final
mapping purpose, the accurate selection of the source data is a fundamental choice.
Many types of commercial satellite data are available with different costs and resolutions. Considering
the elements of interest, a correct balance of these parameters and the peculiarities of the territory to
be mapped is the successful key of the mapping.
The pre-processing procedure is the next step to carry out for the correct preparation of data sets. The
set of procedures are well-known to the RS users and they are widely presented and described in the
dedicated publications [9, 10, 11 and 14]. When a mapping activity is planned to generate or update a
cartographic coverage on the national /regional scale, an enormous amount of datasets has to be
prepared and pre-processed. The preprocessing is carried out to improve the geometric and spectral
characteristics of the images. Very often, the data providers deliver images ready to be used and the
preprocessing is mainly dedicated to a mosaic creation.
The FAO approach is also on a vector based dataset with the new technology object oriented; the vector
layer is automatically generated. The segmentation process performed using ad-hoc software (e.g.
Madcat by FAO or e-Definies by Trimble) generates objects that represent regions of the images with
similar spectral characteristics (reflectance pixel values, texture); this process minimizes the interpreter
subjectivity and increases the cost/benefit efficiency.

25
Consecutively, the segmented layers are interpreted by the remote sensing experts using semi-
automatic procedures for clustering polygons with similar land cover characteristics. Although, the most
important part of image interpretation is carried out visually on the monitor for a finer distinction of the
different land cover units.
Setting up the land cover legend is a critical step and is the explanatory key of the land cover database.
It must reflect as much as possible and synthesize the land cover classes present in the area of interest.
Therefore, when possible, its preparation is performed in collaboration with the country experts that are
familiar with the specific land cover characteristics of the area and are able to enrich the legend in
detail.
LCCS is a comprehensive, standardized a priori land cover classification system well designed to meet
any user requirements. The preliminary version of the legend was created using LCCS at the beginning of
the project. During the interpretation the version is modified whenever any new element is identified.
Only upon completion of the interpretation activity is the final version of the legend achieved. To avoid
subjective interpretations and in order to have a common reference of the land cover types present in
the study areas, an attempt to create a photo-keys album must be performed at an early stage for all
the interpreters involved in the mapping activity.
Once these preliminary steps are completed the work is dedicated to the image interpretation. This is
the core of the creation of the data base and is the longest, complex and hard-working part of the work.
It implies the control of a huge amount of polygons (from 40.000 and 100.000 per Landsat scene) and
the identification in the scenes of similar land units and /or complex association of land cover types. It
also requires a consistent work of labeling using the thematic categories present in the legend.
Upon completion of the preliminary interpretation, a fieldwork campaign is strongly suggested for the
following reasons:
• enhance the reliability of the database; • minimize the interpretation errors; • improve the knowledge of the interpreters in remote sensing interpretation by recognizing o-- the ground the detectable features visible in the image. Alternatively, the validation can be performed using Google Earth, by taking advantage of the high
resolution images available.
The final review of the interpretation is a crucial step for the consolidation of the database. The
harmonization work must generate a consistent land cover model of the area minimizing the differences
from the subjectivities of the various interpreters. In order to achieve this the final phase must be
controlled by a limited number of remote sensing experts. In addition, the technical and semantic
aspects should be checked with great detail. The final database must have a correct topology (the
correct geometric arrangement of point, line and polygon features) and a correct arrangement of the
attribute’s table. to do so, FAO has developed several procedures that require skilled GIS experts.

26
The duration, accuracy and quality of the results are strictly linked to various different factors such as
number of total images covering the study areas; their resolution and the skill of the remote sensing and
GIS experts.
Moreover, the involvement and the synergic approach with national experts in the production is an
essential part of the process: local knowledge and familiarity with the study area and its features have
been considered key factors for the creation of a reliable national data base. Different procedures and
“on-hands training” have been developed to assure this vital contribution in the mapping activities of
the national experts.
To reach a final multipurpose land cover database is a complex and time consuming issue which must be
executed with the involvement of a quantity of national subjects and actors. The end product is a good
quality and useful baseline which can improve the area frame analysis and support many agricultural
activities.
Related to this aspect, the following is also recommended:
strengthen the national capacity in mapping activities;
support the national capacity to produce the land cover baseline and to generally manage
remote sensing data and related issues;
convey national Institutions to finalize a common multitasking product;
catalyze interest and improve awareness on agricultural related products.
8. Land cover database generation in support to Area Frame: two
case studies: Ethiopia and Pakistan lessons learned FAO NRL geospatial unit assisted the Government of Ethiopia and Pakistan, in the process of improving
the generation of reliable agricultural statistical data supporting and implementing the generation of a
standardized and harmonized land cover database using the LCCS classification system. The mapping
activity includes the development of national capacity on land cover data base generation.
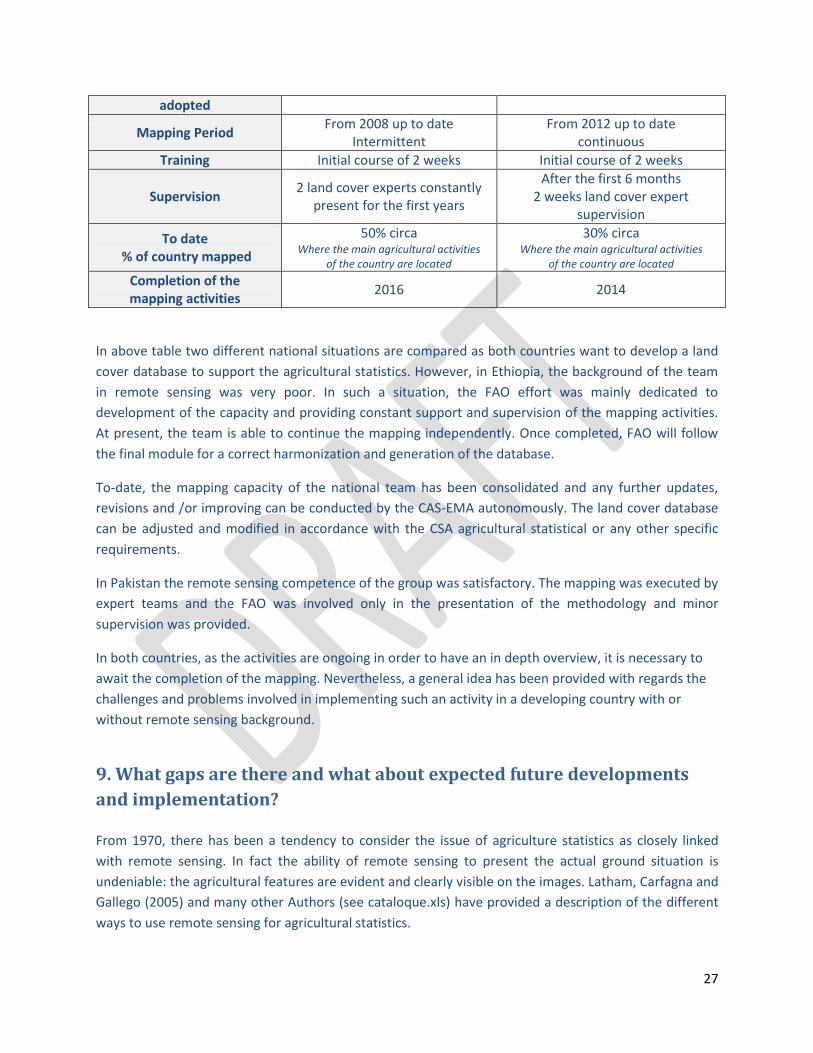
In the table below, the main features related to the two projects.
Ethiopia Pakistan Technical support Agency FAO FAO
Implementing Agency CSA Central Statistical Authority EMA Ethiopia Mapping Agency
SUPARCO National Space Agency of Pakistan
Data used SPOT 5 5m resolution
2085 scenes Dated 2006-2007
SPOT 5 m resolution 310 scenes Dated 2012
Team 12-15 persons
with no background in RS 10 persons
with background in RS
Methods Segmentation Object-based Segmentation Object-based
LC Classification system FAO - LCCS2 FAO- LCCS3
27
adopted
Mapping Period From 2008 up to date
Intermittent From 2012 up to date
continuous
Training Initial course of 2 weeks Initial course of 2 weeks
Supervision 2 land cover experts constantly
present for the first years
After the first 6 months 2 weeks land cover expert
supervision
To date % of country mapped
50% circa Where the main agricultural activities
of the country are located
30% circa Where the main agricultural activities
of the country are located Completion of the mapping activities
2016 2014
In above table two different national situations are compared as both countries want to develop a land
cover database to support the agricultural statistics. However, in Ethiopia, the background of the team
in remote sensing was very poor. In such a situation, the FAO effort was mainly dedicated to
development of the capacity and providing constant support and supervision of the mapping activities.
At present, the team is able to continue the mapping independently. Once completed, FAO will follow
the final module for a correct harmonization and generation of the database.
To-date, the mapping capacity of the national team has been consolidated and any further updates,
revisions and /or improving can be conducted by the CAS-EMA autonomously. The land cover database
can be adjusted and modified in accordance with the CSA agricultural statistical or any other specific
requirements.
In Pakistan the remote sensing competence of the group was satisfactory. The mapping was executed by
expert teams and the FAO was involved only in the presentation of the methodology and minor
supervision was provided.
In both countries, as the activities are ongoing in order to have an in depth overview, it is necessary to
await the completion of the mapping. Nevertheless, a general idea has been provided with regards the
challenges and problems involved in implementing such an activity in a developing country with or
without remote sensing background.
9. What gaps are there and what about expected future developments
and implementation? From 1970, there has been a tendency to consider the issue of agriculture statistics as closely linked
with remote sensing. In fact the ability of remote sensing to present the actual ground situation is
undeniable: the agricultural features are evident and clearly visible on the images. Latham, Carfagna and
Gallego (2005) and many other Authors (see cataloque.xls) have provided a description of the different
ways to use remote sensing for agricultural statistics.

28
However, there are many factors that limit the intensive application of remote sensing in agricultural
statistics in particular for what regards the production of land cover database in support of an area
frame.
The gaps that limit the intensive application of remote sensing products are mainly linked to:
technical capacity;
costs of the product;
appropriate technical structures (including hardware, software and know-how).
In addition, the statistical analysts have a limited background in remote sensing and very often a team of
remote sensing experts are not included in the staff that carries out the statistics analysis.
In general, from a remote sensing point of view, this can be highlighted as follows:
limited staff and capacity of the units dedicated to the collection, processing, analysis and
elaboration of products for the agricultural statistics.
lack of adequate technical tools, standardized methodology and approach to support the
agricultural data production tasks;
insufficient funding allocation for remote sensing applied to agricultural statistics;
lack of coordination and agreement among the experts;
lack of capacity to analyze accurately the gaps in the database;.
difficulties in accessing existing data with no metadata or indication of quality for data users;
lack of reliable and accurate databases.
On the contrary, from the agricultural statistical side, the main gaps in many developing countries are:
lack of adequate technical tools, statistical methodology and survey framework to support data
production tasks;.
insufficient funding allocation for agricultural statistics from development partners and national
budgets;
lack of institutional coordination which results in the lack of harmonized and integrated data
sources;
lack of capacity to analyze data in a policy perspective which results in a significant waste of
resources as large amounts of raw data are not properly used;
difficulties for data users in accessing existing data with no metadata or indication of quality.
An important aspect to be considered when using Remote Sensing products is the question of choosing
the appropriate products with appropriate spatial resolution. In the section 2 (table 2), the spatial
resolution of the main products is presented. However, different applications in crop area estimation or
monitoring require different pixel size/pixel purity.
This aspect should be deeply analyzed for a final correct definition of guidelines.
The complexity of the landscape is also an important element that must be investigated in relation to
the spatial sampling requirements for agricultural assessment. The acceptable coarsest pixel size for

29
both area estimation and crop growth monitoring is matter described by Duveiller and Defourny, in their
conceptual framework published in 2010. They present a small exercise to demonstrate the requirement
in terms of pixel size to monitor agriculture over different landscapes.
10. Conclusion and Recommendations In this report, several applications of remote sensing technologies for agriculture statistics are
presented. However, the field is vast and a review of the bibliographic papers should follow.
To-date, it has emerged that a great deal of technical progress in the field of remote sensing has been
carried out in recent years. The products, available on the market, demonstrate strong improvements in
pixels of resolution, spectrum, revising time and a considerable reduction in market prices.
Remote sensing is an important tool for collecting information to be treated and integrated with
conventional statistic surveys.
While new technology offers many possibilities to assist the production of accurate, updated and
reliable agricultural data, however, the professional capacity of the actual operators does not
accompany this fast moving technology..
Instead applications of remote sensing for statistical analysis should be expanded particularly in the
following directions:
1. Expansion of applications and know-how in the use of remote sensing for land cover production,
survey and monitoring.
2. Creation and improvement on national capacity level in the management of remote sensing products
in close collaboration with the statistical units.
In developing countries the approach is very different. The lessons learned in Ethiopia and Pakistan
demonstrate that the different capacity of management and utilization of remote sensing make it
possible to generate the available product in a relatively short timeframe.
Therefore, the agricultural national centers and/or regional sub-centers should be equipped with a remote sensing/GIS unit for the following:
graphical support for ground work ;
to furnish tools to improve the sampling design of a ground survey (stratification);
create and manipulate basic information for area estimation;
to evaluate the accuracy of available database;
to produce land cover data base ;
provide an indication of quality control.

30
3. Define precision and accuracy of the remote sensing product in relation to the landscape on which specific guidelines should be prepared.
4. Define the relation between the land cover prepared with a specific MMU and sampling baseline.

31
ANNEX I
Literature review This report documents the main findings about a literature review carry out mainly from the various
sources. The research was performed using the following keys:
Period: 2000 to present Keywords : Agricultural statistic; Area Sampling Frame; Remote Sensing; Crop acreage; Accuracy, Estimation, terrain mapping . The main catalogues and links consulted are listed below:
ScienceDirect From FAO David Lubin Memorial Library on line catalogue the following links were available. Scopus Wiley Online Library Springer Link Taylor and Francis Online Google and Google Scholar The main scientific journals analyzed are:
Advances in Agronomy
Advances in Space Research
Agricultural Economics
Agriculture, Ecosystems and Environment
Agricultural Water Management
Applied Geography
Computer and Electronics in Agriculture
Computer and Sciences
ITC Journal
International Journal of Applied Earth Observation and Geoinformation
International Journal of Agricultural and Statistical Sciences
International Journal of Remote Sensing
International Society for Tropical Ecology
International Statistical Review
Journal of the Indian Society of Remote Sensing
Journal of Photogrammetry and Remote Sensing
Journal of Rural Studies
Precision Agriculture
Remote Sensing
Remote sensing of Environment

32
Society of Agricultural Engineering
Transactions of the ASABE
Tropical Ecology
WSEAS Transactions on Environment and Development
The web sites of Agencies, Institutions, for the operative projects refer to
CGIAR IFAD IRRI Crops for the Future Research Centre (CFF) USDA MARS AGRIT Work Bank
1. World Bank Research Observer Useful links are: Project EUCLID And finally universities and scientific venues and national statistical web sites to survey more relevant
information on the matter.
The articles and papers are organized in a structured db. The arrangement utilized is presented in the
figure XXX.
The following paragraphs are categorized with a geographical criterion in order to point out the
differences in school of thought, approaches and operational projects/activities.