improving low power and shutdown psa … · improving low power and shutdown psa methods and data...
TRANSCRIPT

Unclassified NEA/CSNI/R(2005)11/VOL1 Organisation de Coopération et de Développement Economiques Organisation for Economic Co-operation and Development 21-Sep-2005 ___________________________________________________________________________________________
English text only NUCLEAR ENERGY AGENCY COMMITTEE ON THE SAFETY OF NUCLEAR INSTALLATIONS
IMPROVING LOW POWER AND SHUTDOWN PSA METHODS AND DATA TO PERMIT BETTER RISK COMPARISON AND TRADE-OFF DECISION-MAKING VOLUME 1: SUMMARY OF COOPRA AND WGRISK SURVEYS
Joint Report Produced by the Committee on the Safety of Nuclear Installations (CSNI) Working Group on Risk Assessment and the Cooperative Probabilistic Risk Assessment (COOPRA) program
CAUTION: It is important to note that the information contained in this report was gathered from two surveys, one by COOPRA and the other by WGRisk, which were performed over several years. Since this information is subject to changes, advancements, etc., the reader should take these types of occurrences into account.
JT00189882
Document complet disponible sur OLIS dans son format d'origine Complete document available on OLIS in its original format
NE
A/C
SNI/R
(2005)11/VO
L1
Unclassified
English text only

NEA/CSNI/R(2005)11/VOL1
2
ORGANISATION FOR ECONOMIC CO-OPERATION AND DEVELOPMENT
Pursuant to Article 1 of the Convention signed in Paris on 14th December 1960, and which came into force on 30th September 1961, the Organisation for Economic Co-operation and Development (OECD) shall promote policies designed:
− to achieve the highest sustainable economic growth and employment and a rising standard of living in Member countries, while maintaining financial stability, and thus to contribute to the development of the world economy;
− to contribute to sound economic expansion in Member as well as non-member countries in the process of economic development; and
− to contribute to the expansion of world trade on a multilateral, non-discriminatory basis in accordance with international obligations.
The original Member countries of the OECD are Austria, Belgium, Canada, Denmark, France, Germany, Greece, Iceland, Ireland, Italy, Luxembourg, the Netherlands, Norway, Portugal, Spain, Sweden, Switzerland, Turkey, the United Kingdom and the United States. The following countries became Members subsequently through accession at the dates indicated hereafter: Japan (28th April 1964), Finland (28th January 1969), Australia (7th June 1971), New Zealand (29th May 1973), Mexico (18th May 1994), the Czech Republic (21st December 1995), Hungary (7th May 1996), Poland (22nd November 1996), Korea (12th December 1996) and the Slovak Republic (14 December 2000). The Commission of the European Communities takes part in the work of the OECD (Article 13 of the OECD Convention).
NUCLEAR ENERGY AGENCY
The OECD Nuclear Energy Agency (NEA) was established on 1st February 1958 under the name of the OEEC European Nuclear Energy Agency. It received its present designation on 20th April 1972, when Japan became its first non-European full Member. NEA membership today consists of 28 OECD Member countries: Australia, Austria, Belgium, Canada, Czech Republic, Denmark, Finland, France, Germany, Greece, Hungary, Iceland, Ireland, Italy, Japan, Luxembourg, Mexico, the Netherlands, Norway, Portugal, Republic of Korea, Slovak Republic, Spain, Sweden, Switzerland, Turkey, the United Kingdom and the United States. The Commission of the European Communities also takes part in the work of the Agency.
The mission of the NEA is: − to assist its Member countries in maintaining and further developing, through international co-operation, the
scientific, technological and legal bases required for a safe, environmentally friendly and economical use of nuclear energy for peaceful purposes, as well as
− to provide authoritative assessments and to forge common understandings on key issues, as input to government decisions on nuclear energy policy and to broader OECD policy analyses in areas such as energy and sustainable development.
Specific areas of competence of the NEA include safety and regulation of nuclear activities, radioactive waste management, radiological protection, nuclear science, economic and technical analyses of the nuclear fuel cycle, nuclear law and liability, and public information. The NEA Data Bank provides nuclear data and computer program services for participating countries.
In these and related tasks, the NEA works in close collaboration with the International Atomic Energy Agency in Vienna, with which it has a Co-operation Agreement, as well as with other international organisations in the nuclear field.
© OECD 2005 Permission to reproduce a portion of this work for non-commercial purposes or classroom use should be obtained through the Centre
français d’exploitation du droit de copie (CCF), 20, rue des Grands-Augustins, 75006 Paris, France, Tel. (33-1) 44 07 47 70, Fax (33-1) 46 34 67 19, for every country except the United States. In the United States permission should be obtained through the Copyright Clearance Center, Customer Service, (508)750-8400, 222 Rosewood Drive, Danvers, MA 01923, USA, or CCC Online: http://www.copyright.com/. All other applications for permission to reproduce or translate all or part of this book should be made to OECD Publications, 2, rue André-Pascal, 75775 Paris Cedex 16, France.

NEA/CSNI/R(2005)11/VOL1
3
Committee on the Safety of Nuclear Installations (CSNI)
The CSNI of the OECD Nuclear Energy Agency (NEA) is an international committee made up of senior scientists and engineers. It was set up in 1973 to develop, and co-ordinate the activities of the Nuclear Energy Agency concerning the technical aspects of the design, construction and operation of nuclear installations insofar as they affect the safety of such installations. The Committee’s purpose is to foster international co-operation in nuclear safety among the OECD Member countries.
The CSNI constitutes a forum for the exchange of technical information and for collaboration between organizations, which can contribute, from their respective backgrounds in research, development, engineering or regulation, to these activities and to the definition of the programme of work. It also reviews the state of knowledge on selected topics on nuclear safety technology and safety assessment, including operating experience. It initiates and conducts programmes identified by these reviews and assessments in order to overcome discrepancies, develop improvements and reach international consensus on technical issues of common interest. It promotes the co-ordination of work in different Member countries including the establishment of co-operative research projects and assists in the feedback of the results to participating organizations. Full use is also made of traditional methods of co-operation, such as information exchanges, establishment of working groups, and organization of conferences and specialist meeting.
The greater part of the CSNI’s current programme is concerned with the technology of water reactors. The principal areas covered are operating experience and the human factor, reactor coolant system behaviour, various aspects of reactor component integrity, the phenomenology of radioactive releases in reactor accidents and their confinement, containment performance, risk assessment, and severe accidents. The Committee also studies the safety of the nuclear fuel cycle, conducts periodic surveys of the reactor research programmes and operates an international mechanism for exchanging reports on safety related nuclear power plant accidents.
In implementing its programme, the CSNI establishes co-operative mechanisms with NEA’s Committee on Nuclear Regulatory Activities (CNRA), responsible for the activities of the Agency concerning the regulation, licensing and inspection of nuclear installations with regard to safety. It also co-operates with NEA’s Committee on Radiation Protection and Public Health and NEA’s Radioactive Waste Management Committee on matters of common interest.
Cooperative Probabilistic Risk Assessment (COOPRA) Research Program
COOPRA is a U.S. Nuclear Regulatory Commission (USNRC) sponsored organization that includes member organizations from other countries. The goals of COOPRA are to improve probabilistic safety assessment (PSA) technology through the timely sharing of research information, and optimize use of members' resources through coordinated and cooperative research projects. COOPRA provides an international forum for technical experts to exchange information on safety assessments for commercial nuclear power plants.
The COOPRA organization consists of a Steering Committee and working groups in various technical areas of interest. The Steering Committee consists of representatives from each member organization, and meets annually. The first Steering Committee meeting was held in October 1997. Currently COOPRA has three working groups: fire-induced damage to electrical cables and circuits, low power and shutdown, and risk-informed decision-making. The working groups identify key technical/regulatory issues, formulate and execute collaborative research and development projects, report on work progress at Steering Committee meetings, and provide members with timely information, research results, and reports on working group activities.
************ The opinions expressed and the arguments employed in this document are the responsibility of the authors and do not
necessarily represent those of the OECD or COOPRA.
Requests for additional copies of this report should be addressed to:
Nuclear Safety Division OECD Nuclear Energy Agency Le Seine St – Germain 12 blvd. des Iles 92130 Issy-les-Moulineaux France

NEA/CSNI/R(2005)11/VOL1
4
ABSTRACT
The mission of the CSNI is to assist Member countries in maintaining and further developing the scientific and technical knowledge base required to assess the safety of nuclear reactors and fuel cycle facilities. COOPRA objectives are to improve the sharing of Probabilistic Safety Assessment (PSA) information, and to facilitate the efficient development and use of needed PSA tools.
The mission of the CSNI Low Power and Shutdown (LPSD) Working Group (WG) on Risk Assessment is to advance the understanding and utilization of PSA in ensuring continued safety of nuclear installations in Member countries. In pursuing this goal, the WG shall recognize the different methodologies for identifying contributors to risk and assessing their importance. While the WG shall continue to focus on the more mature PSA methodologies for Level 1, Level 2, internal, external, shutdown, etc., it shall also consider the applicability and maturity of PSA methods for considering evolving issues such as human reliability, software reliability, ageing issues, etc., as appropriate.
The COOPRA LPSD working group is charged with the responsibility to assess their Member country’s plant operations at LPSD conditions. The sharing of information is expected to provide each of the Member country the means from which to render informed regulatory decisions for the benefit of public health and safety.
Each organization had developed a questionnaire to gather information from Member countries on LPSD PSAs experiences. The responses cover a broad spectrum of LPSD PSA topics, and identifies work for improving risk-informed trade-off decisions, using PSA techniques, between LPSD and full power operational states. Each organization recognized potential benefit for improving the state-of-the-art by combining the wealth of experiences from the questionnaire responses into a common report.
This report provides a summary of the current LPSD PSAs in Member countries, covering the elements which make up the PSAs. This report: (1) identifies the uses of the LPSD PSAs; (2) summarizes current approaches, aspects, and good practices; (3) identifies and defines differences between methods and data in full power and LPSD PSAs; and, (4) identifies guidance, methods, data, and basic research needs to address the differences. The responses to the questionnaires are provided in the Appendixes.
CAUTION: It is important to note that the information contained in this report was gathered from two surveys, one by COOPRA and the other by WGRisk, which were performed over several years. Since this information is subject to changes, advancements, etc., the reader should take these types of occurrences into account.
• Volume 2 of this series contains the responses from the CSNI/WGRisk Survey
• Volume 3 of this series contains the responses from the COOPRA Survey

NEA/CSNI/R(2005)11/VOL1
5
TABLE OF CONTENTS
ABSTRACT ................................................................................................................................................... 4
EXECUTIVE SUMMARY ............................................................................................................................ 6
1. INTRODUCTION ............................................................................................................................. 12
2. SUMMARY OF RESPONSES.......................................................................................................... 15
2.1 Scope and Objectives ..................................................................................................................... 15 2.2 Plant Operational States ................................................................................................................. 15 2.3 Initiating Events ............................................................................................................................. 20 2.4 Risk Metrics ................................................................................................................................... 24 2.5 Sequence Analysis.......................................................................................................................... 26 2.6 System Modelling........................................................................................................................... 29 2.7 Data ................................................................................................................................................ 30 2.8 Human Reliability Analysis (HRA) ............................................................................................... 32 2.9 Quantification / Sensitivity Studies / Uncertainties........................................................................ 33 2.10 Plant Damage States (PDSs)..................................................................................................... 35 2.11 Containment Performance ........................................................................................................ 36 2.12 Consequence Analysis .............................................................................................................. 37 2.13 Results of the LPSD PSA / Insights.......................................................................................... 37 2.14 Strengths and Weaknesses of the LPSD PSAs ......................................................................... 44
3. COMPILATION OF RESEARCH IDENTIFIED TO IMPROVE RISK-INFORMED DECISION-MAKING ........................................................................................................................ 46
3.1 Summary of Research Identified .................................................................................................... 54
4. INFORMATION RELATED TO ISSUES IDENTIFIED................................................................. 55
5. CONCLUDING REMARKS............................................................................................................. 56
REFERENCES ............................................................................................................................................. 56

NEA/CSNI/R(2005)11/VOL1
6
EXECUTIVE SUMMARY
Background
This report is a joint product of the Committee on the Safety of Nuclear Installations (CSNI) Low Power and Shutdown Working (LPSD) Group and the International Cooperative PRA Research Program (COOPRA) Low Power and Shutdown Working Group.
Committee on the Safety of Nuclear Installations (CSNI) Low Power and Shutdown Working Group
Set-up in 1973, the CSNI is an international committee made up of senior scientists and engineers, with broad responsibilities for safety technology and research programmes. The technical fields of nuclear reactor safety interest into which the CSNI has designated working groups (WGs) are Operating Experience, Analysis and Management of Accidents, Integrity of Components and Structures and Risk Assessment. It also has set up special expert groups on Human and Organisational Factors and Fuel Safety Margins. Along with experts groups formed from time to time, the CSNI also maintains a small working group on nuclear fuel cycle safety. While all of groups have detailed programmes involving important aspect, this report will focus specifically on B.5 Low Power and Shutdown Events.
The CSNI Working Group on Risk Assessment (WGRisk) has sponsored several studies related to the understanding of accident risks during LPSD operations. For example, a 1996 study compiled practices for safety improvement for nuclear plants at LPSD (Task 93.1; originally Task 13).
Member counties have also performed studies to better understanding LPSD risks. These include: France is developing guidance on acceptable methods for probabilistic safety analysis (PSA) including LPSD; Germany is performing a LPSD PSA and plans to write a LPSD PSA procedure guide as a follow up; the Japanese Nuclear Society is developing guidance for LPSD PSA. In 1999, the USNRC collected information on current LPSD PSA methods and tools to evaluate their capability to support regulatory decision making, and a simplified approach to estimating LERF has been developed.
International Cooperative PRA Research Program (COOPRA) Low Power and Shutdown Working Group
The LPSD COOPRA working group has gathered information from its member countries on LPSD in order to: assess LPSD operating experience; identify technical work required for quantifying the risk of commercial nuclear power plants during LPSD conditions; identify cooperative programs that will assist the member countries in quantitatively determining the risk during LPSD conditions; and provide the tools and a forum for technical exchange that will enable the member countries to make informed technical and regulatory decisions specific to their country’s needs.
The LPSD COOPRA working group has produced a status report of LPSD PSA results provided by its members and identified many areas of common interest. Examples include: initiating events, supporting analysis, fire, screening and splits in plant operating states (POSs), boron dilution, cold over-pressurization, human reliability analysis, common cause failures, repair and recovery of equipment, and equipment mission time. Topical reports completed are: (1) Initiating Events, and (2) Report On
NEA/CSNI/R(2005)11/VOL1
7
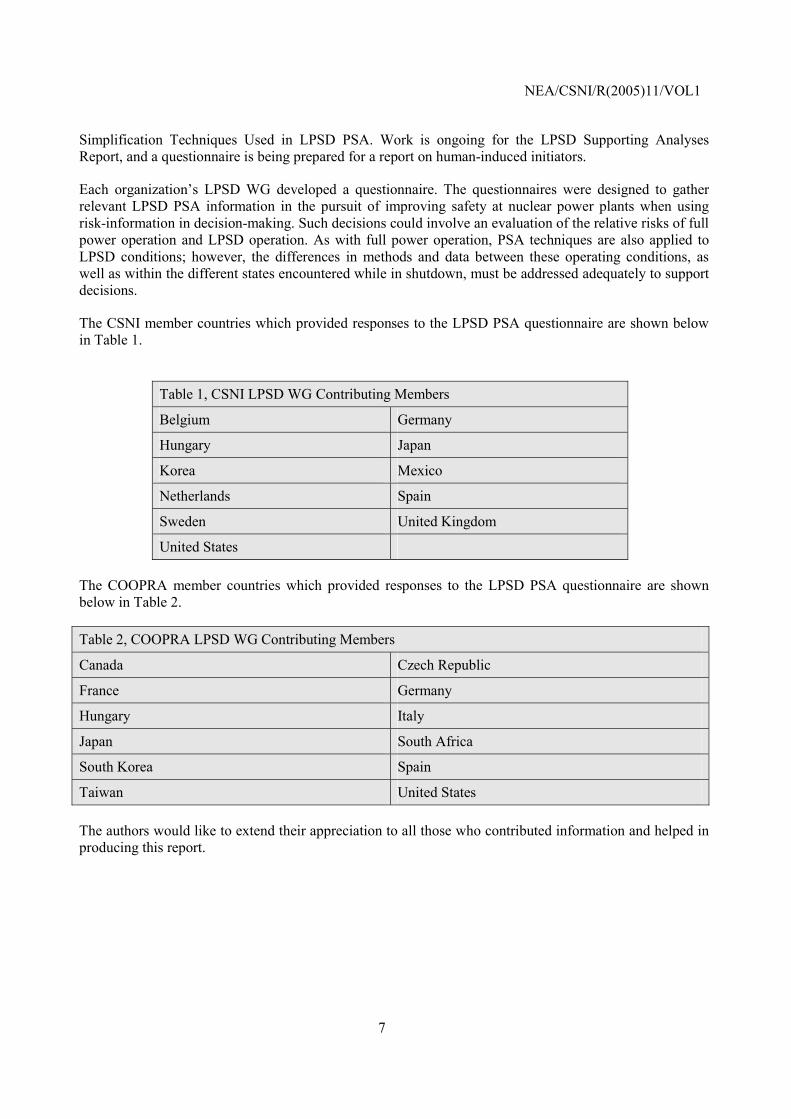
Simplification Techniques Used in LPSD PSA. Work is ongoing for the LPSD Supporting Analyses Report, and a questionnaire is being prepared for a report on human-induced initiators.
Each organization’s LPSD WG developed a questionnaire. The questionnaires were designed to gather relevant LPSD PSA information in the pursuit of improving safety at nuclear power plants when using risk-information in decision-making. Such decisions could involve an evaluation of the relative risks of full power operation and LPSD operation. As with full power operation, PSA techniques are also applied to LPSD conditions; however, the differences in methods and data between these operating conditions, as well as within the different states encountered while in shutdown, must be addressed adequately to support decisions.
The CSNI member countries which provided responses to the LPSD PSA questionnaire are shown below in Table 1.
Table 1, CSNI LPSD WG Contributing Members
Belgium Germany
Hungary Japan
Korea Mexico
Netherlands Spain
Sweden United Kingdom
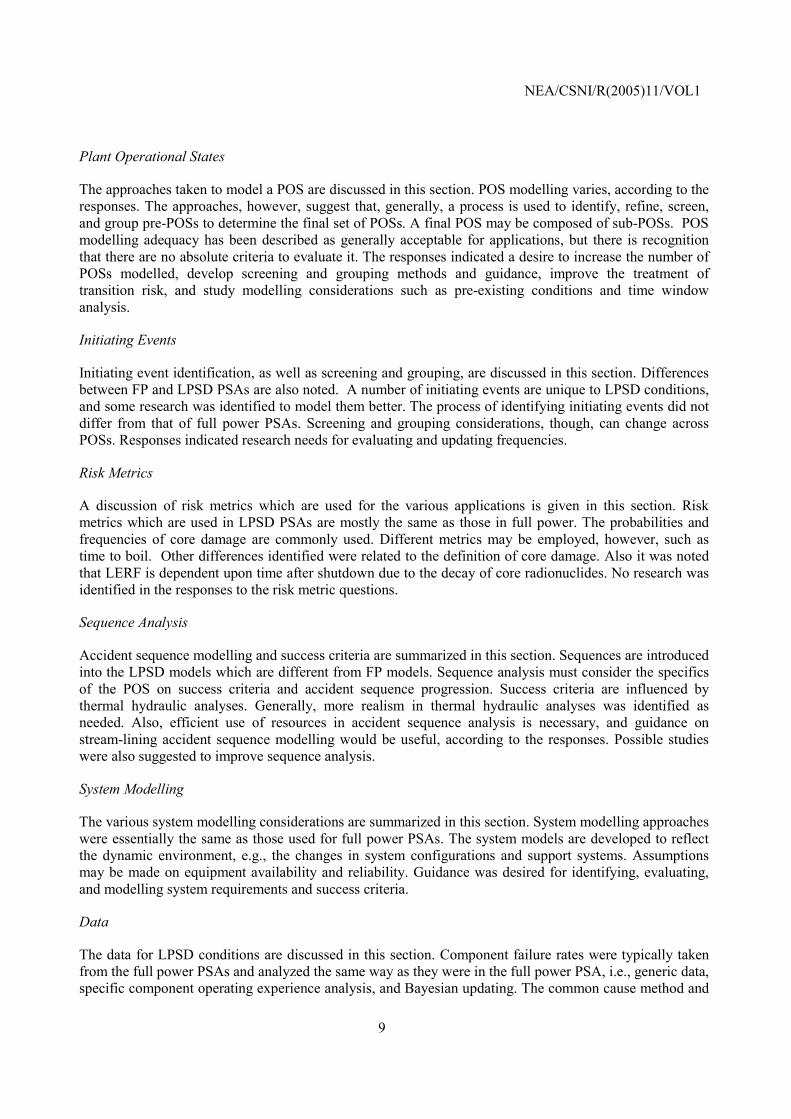
United States The COOPRA member countries which provided responses to the LPSD PSA questionnaire are shown below in Table 2.
Table 2, COOPRA LPSD WG Contributing Members
Canada Czech Republic
France Germany
Hungary Italy
Japan South Africa
South Korea Spain
Taiwan United States The authors would like to extend their appreciation to all those who contributed information and helped in producing this report.

NEA/CSNI/R(2005)11/VOL1
8
Objectives
This report is a joint product of the CSNI and COOPRA member country responses to their respective LPSD PSA questionnaires. The questionnaires support the aims of this task.
The objectives are: (1) to identify differences between methods (and associated data) used in full power (FP) and LPSD PSAs that are of sufficient importance that they preclude, or substantially limit, the decision maker’s ability to make meaningful risk comparisons or risk trade-offs among these operational conditions; and, (2) to define needed data collection or methods development to overcome these differences.
Report Summary
Responses to the COOPRA and CSNI questionnaires identified the LPSD PSA experiences, and methods and data development needs. The responses to the COOPRA surveys were documented in 2001, and the CSNI WGRisk survey was completed more recently. Information provided in both surveys support this joint report.
Member countries have performed LPSD PSAs to some degree, mainly a Level 1 analysis. Member countries have confidence in existing models and approaches to support trade-off decisions; however, improvements in methods and data are desired. Much work has been identified for Level 1 yet. Common interests are in modelling POSs, initiating events, sequence analysis, data, human reliability analysis, and external events modelling. Interest also exists for developing Level 2 capability. Research identified would be useful for both a configuration risk monitor and an “average” LPSD PSA model approach.
Collectively, responses show a desire to develop those characteristics seen to be strengths needed in an analysis. LPSD PSA model strengths, according to the responses, include their detail, completeness, and ability to be used for any application. Strengths in the supporting work for a LPSD model include approaches which are systematic, efficient, stable, and realistic.
Structure of the Report
Following the introduction, the report provides a brief summary of important LPSD PSA elements. These summaries include the differences identified in the responses between FP and LPSD PSAs. Following the summaries, a compilation of identified research is given, which includes desired data collection and methods development, for improving risk-informed trade-off decisions for both the CSNI and COOPRA LPSD WGs.
An overview of this summary report is given below by section. The details of the questionnaire and responses are provided in the Appendixes.
Scope and Objectives of the LPSD PSA
An overview is provided of the international scope and objectives of the LPSD PSA studies in this section. The scope and objectives influence the modelling of LPSD PSA elements such as plant operating states. Each member country has a LPSD PSA study to some degree. Most have only a Level 1 PSA, and fewer have a Level 2 or a Level 3 scope model. The responses have indicated an interest in developing LPSD PSA capability beyond Level 1. The uses of these models are also tabulated.
NEA/CSNI/R(2005)11/VOL1
9
Plant Operational States
The approaches taken to model a POS are discussed in this section. POS modelling varies, according to the responses. The approaches, however, suggest that, generally, a process is used to identify, refine, screen, and group pre-POSs to determine the final set of POSs. A final POS may be composed of sub-POSs. POS modelling adequacy has been described as generally acceptable for applications, but there is recognition that there are no absolute criteria to evaluate it. The responses indicated a desire to increase the number of POSs modelled, develop screening and grouping methods and guidance, improve the treatment of transition risk, and study modelling considerations such as pre-existing conditions and time window analysis.
Initiating Events
Initiating event identification, as well as screening and grouping, are discussed in this section. Differences between FP and LPSD PSAs are also noted. A number of initiating events are unique to LPSD conditions, and some research was identified to model them better. The process of identifying initiating events did not differ from that of full power PSAs. Screening and grouping considerations, though, can change across POSs. Responses indicated research needs for evaluating and updating frequencies.
Risk Metrics
A discussion of risk metrics which are used for the various applications is given in this section. Risk metrics which are used in LPSD PSAs are mostly the same as those in full power. The probabilities and frequencies of core damage are commonly used. Different metrics may be employed, however, such as time to boil. Other differences identified were related to the definition of core damage. Also it was noted that LERF is dependent upon time after shutdown due to the decay of core radionuclides. No research was identified in the responses to the risk metric questions.
Sequence Analysis
Accident sequence modelling and success criteria are summarized in this section. Sequences are introduced into the LPSD models which are different from FP models. Sequence analysis must consider the specifics of the POS on success criteria and accident sequence progression. Success criteria are influenced by thermal hydraulic analyses. Generally, more realism in thermal hydraulic analyses was identified as needed. Also, efficient use of resources in accident sequence analysis is necessary, and guidance on stream-lining accident sequence modelling would be useful, according to the responses. Possible studies were also suggested to improve sequence analysis.
System Modelling
The various system modelling considerations are summarized in this section. System modelling approaches were essentially the same as those used for full power PSAs. The system models are developed to reflect the dynamic environment, e.g., the changes in system configurations and support systems. Assumptions may be made on equipment availability and reliability. Guidance was desired for identifying, evaluating, and modelling system requirements and success criteria.
Data
The data for LPSD conditions are discussed in this section. Component failure rates were typically taken from the full power PSAs and analyzed the same way as they were in the full power PSA, i.e., generic data, specific component operating experience analysis, and Bayesian updating. The common cause method and

NEA/CSNI/R(2005)11/VOL1
10
data are the same as those used for full power analyses. Differences exist, however, between full power and LPSD data in their evaluation and inclusion in the model. Examples of this are provided in this section. The responses indicate a need for developing data, databases, and guidance. These activities would be useful for both a configuration risk monitor and the standard LPSD PSA approach which incorporates average test and maintenance unavailabilties.
Human Reliability Analysis
Insights show the importance of human reliability analysis in LPSD PSAs. The various approaches to modelling human reliability are noted in this section. Previous HRA methods are used and/or modified to address different considerations encountered during LPSD operation. Generally, improvements of HRA methods were identified which would involve enhancing existing techniques (for high-priority issues), studying the importance of errors of commission, modelling long recovery times, and modelling uncertainty. Due to the large modelling effort, simple and stable HRA techniques are desirable. Simulator data would also be useful.
Quantification / Sensitivity Studies / Uncertainties
A summary of the responses is presented on the types of LPSD PSA quantification, sensitivity studies, and uncertainty considerations in this section. Quantification may be performed with a configuration risk monitor, or with a model which evaluates risk metrics using average test and maintenance data. These different approaches lead to different baselines from which risk is evaluated and insights are gained. Insights are also gained by performing sensitivity studies and uncertainty analyses. Guidance on incorporating uncertainty and sensitivity analysis techniques into LPSD analyses was identified as desirable. Quantification techniques such as dynamic modelling (e.g., Markov processes) may also be desirable to study.
Plant Damage States
Plant damage states are discussed in this section. In general, the plant damage state characteristics are different, new PDSs are required, and full power PDSs may no longer be relevant. Examples of differences between full power and LPSD PSAs are noted. No research was identified.
Containment Performance
Containment performance, severe accident analysis, and Level 2 phenomenology responses are summarized in this section. Experience gained from Level 2 analyses are presented. Differences between full power and LPSD PSAs can be important, and examples are given. Modelling accident sequence progression was identified as a research area.
Consequence Analysis
Consequence analyses for the LPSD studies performed are summarized in this section. Experience gained from Level 3 analyses are presented. Further study of potential source terms would improve insights gained from LPSD PSA Level 3 analyses.
Results of the LPSD PSA / Insights
Results and insights gained from the LPSD studies, and the confidence in allowing risk trade-off studies, are summarized in this section. Most studies estimated internal initiating events CDF only. A few analyses have included radionuclide release and health effects and addressed internal flood and fire, and seismic events. The analyses cover different reactor types including VVER, Westinghouse PWR, General Electric

NEA/CSNI/R(2005)11/VOL1
11
BWR, and French PWRs. Level 1 results are provided. Level 3 results are noted for a PWR midloop study and for a BWR cold shutdown study.
Strengths and Weaknesses of LPSD PSAs
The strengths and weaknesses identified in the responses are noted in this section. LPSD PSA model strengths include their detail, completeness, and ability to be used for any application, and strengths in the supporting work for a LPSD model include approaches which are systematic, efficient, stable, and realistic.

NEA/CSNI/R(2005)11/VOL1
12
1. INTRODUCTION
The decision to perform work at full power (FP) or low power/shutdown (LPSD) will consider risks during each operational state. The risks involved will depend on the type of work, which, in turn, will be associated with an outage type. Decisions may need to be made in the context of performing work at power to avoid the risk of shutting the unit down; to decrease power in order to perform certain work; or to shutdown the unit to the hot standby, hot shutdown, cold shutdown, or refuelling endstate. If a shutdown and subsequent startup is required for a pressurized water reactor (PWR), for example, the following operational modes may be encountered in transcending from/to FP operation (Technical Specification mode 1):
• Power operation (mode 1)
• Startup (mode 2)
• Hot standby (mode 3)
• Hot shutdown (mode 4)
• Cold shutdown (mode 5)
• Refuelling (mode 6)
For a boiling water reactor (BWR) design, the mode designation is slightly different:
• Power operation (mode 1)
• Startup (mode 2)
• Hot shutdown (mode 3)
• Cold shutdown (mode 4)
• Refuelling (mode 5)
In some instances, cold shutdown or refuelling may not be the desired endstate. For example, there may be a justification to hold in hot shutdown. More generally, according to the questionnaire responses, applications of LPSD PSAs are desired for outage types other than refuelling such as unplanned outages, lengthy outages, and those which do not necessarily involve going to midloop (PWR). Justification of such operations, among others, may require an assessment of risk.

NEA/CSNI/R(2005)11/VOL1
13
LPSD probabilistic safety assessment (PSA) techniques may be used in evaluating specific operations and maintenance. The LPSD PSA model would need to be capable of adequately assessing the different POSs that are encountered. Therefore, the differences between FP and LPSD models need to be identified, and the appropriate methods and data need to be implemented in order to provide a meaningful comparison of competing risks.
While a model for FP operation may be useful for some LPSD operational regions, in general, such a model will need to be changed, or a model specific to the state of interest would need to be generated. The FP state is typically referred to as POS 0. Other POSs to be modelled will need to take into account differences between FP and LPSD operations.
The differences apply to many aspects of the PSA. A natural framework to illustrate some examples is the structure of the POS. The POS may be thought of as a state that exists for a specified time period during which important modelling characteristics are defined. The FP state characteristics include the unit’s power (100%) and associated physical parameters, the existence of normally aligned systems and standby systems, the types of initiating events that can occur, the plant response, the success criteria of mitigation systems in the event of certain accidents, as well as others. Theses types of considerations will change as the POS changes.
If a unit proceeds to shutdown for a refuelling outage, for example, some changes in characteristics are:
• FP to LP are:
− Reactor power level
− Transfer of automatic functions to manual such as reactor control and steam generator control
• LP to hot SD, some changes are:
− Reactor critical to subcritical
− Transient likelihood (e.g., loss of main feedwater)
• Hot SD to cold SD, some changes are:
− Use of standby systems, for example, transferring heat removal to the residual heat removal (RHR) system
− Some automatic actuations may need to be blocked
− Initiating events may not be applicable (e.g., anticipated transient without scram), may be screened out (e.g., main steam line break), or may be new (e.g., loss of RHR).
− Technical Specification requirements
− Evolutions
− Procedures
− Maintenance

NEA/CSNI/R(2005)11/VOL1
14
− Mitigative equipment availability decreases
− Reactor coolant system boundary may be opened
− Containment may be opened
− Decay heat decreases
• Cold SD to refuelling, changes include:
− Plant configuration − Fuel movement
Differences between FP and LPSD PSAs have been identified in the responses to the questionnaires. The summary of responses for each PSA element in the questionnaire is provided below. A summary is then presented of improvement and research needs to overcome the limitations of the LPSD PSAs in order to help make risk-informed trade-off decisions.

NEA/CSNI/R(2005)11/VOL1
15
2. SUMMARY OF RESPONSES
2.1 Scope and Objectives
To begin the modelling for risk trade-off assessments, the scope and objectives of the LPSD PSA model must be determined. The details of setting up the model and accounting for the differences between POSs would then follow.
It is important to first determine the intended application, and then to pursue the work in the scope and level of detail which will meet the application’s requirements. The Member countries have identified scope and uses for LPSD PSAs. These are summarized below. Table 3, WGRisk Low Power and Shutdown PSA Levels and Uses, below shows there is a spectrum of plant-specific and generic uses for the purposes of the nuclear industry and regulators. The scope ranges from Level 1 through Level 3, and, as the responses show, the level of detail also has a wide degree of variation.
The scope of the LPSD models includes external event initiators for some models, but the majority of models cover internal events and Level 1. Also, the sources considered were mostly from the core within the reactor vessel.
2.2 Plant Operational States
In this section, approaches to POS modelling are discussed, including considerations for pre-POSs, screening, and grouping. POS descriptions compiled from the responses are also summarized, including transition modelling. POS modelling adequacy is also discussed. Finally, differences in LPSD and FP POSs are noted.
Modelling
The intended application of the model is an important consideration. Each response to the questionnaire indicated that models existed for planned refuelling outages. These recognize the need to evaluate the risk over the whole outage, from reactor power descent, to refuelling, and to reactor power ascent. The risk analyses take into consideration normal and unusual LPSD activities. These models, though, may be incomplete for some types of planned refuelling outages which involve unique activities that have not yet occurred at the plant, such as steam generator replacement, and require appropriate analyses for their inclusion. Responses indicate that the planned refuelling outage model can be easily adaptable to unplanned outages. In some instances, unplanned outage studies are performed. Such conditions could arise from a forced shutdown due to Technical Specification requirements. These recognize the need to evaluate the risk for conditions that would be different from the LPSD model for refuelling outages. Table 4 (below) and Table 5 (in the Results of the LPSD PSA / Insights section) provides a brief description of the models for the CSNI and the COOPRA LPSD WG Member countries, respectively.
Which POSs to include in the model must be determined. At a high level, the structure for identifying POSs is set up and a process is applied to refine, screen, and group the initial set of POSs (pre-POSs).

NEA/CSNI/R(2005)11/VOL1
16
General (inter-related) considerations for pre-POSs identification are noted to be the following:
• The outage type such as refuelling, extended outages, drained, non-drained, etc.
• The operating condition such as defined by the technical specification mode.
• The plant state such as the reactor boundary status, systems configurations, etc.
• Plant physical parameters such as pressure, temperature, level, decay heat load, etc.
• Critical safety functions required for preventing core damage and radionuclide releases
• Operator response times
• Plant response to an initiating event, e.g., primary and secondary responses for a given set of mitigation systems available
• Plant activities, e.g., transferring fuel, containment leaktight test, primary circuit leaktight test, outages of specific systems
• Plant experiences, e.g., LPSD events and operations logs
These inter-related considerations are used for defining and providing structure to the POSs. They provide a basis for defining the boundaries of a POS, or structuring the POS around technical requirements and outage practices, for example.
Once the pre-POS set is decided upon, the number of POSs may be decreased or increased by further analyses. Screening and grouping may be performed to simplify the number for evaluation. This was performed for the majority of the models. Other approaches, however, did not to perform screening and grouping. Screening techniques have been related to conservative analyses of core damage frequency or time to boiling. Grouping techniques have considered mitigation systems, system diversity, similar safeguards requirements, and plant response. On the other hand, it may be necessary to split a POS, increasing the POS number to be analyzed. For example, time to core damage could be a splitting criterion. A pre-POS may need to be subdivided further if the time to core damage changes significantly within its time interval. Another example of a splitting criterion is the presence of a steam bubble in the pressuriser, if the reactor coolant system boundary is intact. The end result may be a set of POSs or a set of POSs in which each POS contains several defined sub-states. After screening and grouping, the number of POSs in the LPSD models ranges from a minimum of 2 to a maximum of 28.

NEA/CSNI/R(2005)11/VOL1
17
Table 3, Low Power and Shutdown PSA Levels and Uses
Member Country CSNI COOPRA Levels and Uses
Belgium X Level 1 performed for Periodic Safety Review, and to identify operational practice modifications
Canada X Level 1 uses include maintenance planning which help in optimizing maintenance programs and the development of provisions and procedures.
Czech Republic X Level 1 internal PSA including flood, fire, and the refuelling pool.
France X Level 1 internal PSA uses include technical specifications improvements, and plant modifications to reduce sequence frequencies
Germany X X Level 1 internal PSA. Applications have been related to technical specifications improvements.
Hungary X X
Level 1 for Periodic Safety Review, safety upgrading measures, and some work or consideration given to configuration control/management, feedback to safety improvement, precursor event studies, and technical specifications improvements. Level 2 is currently being performed.
Italy X Level 1, 2, and 3 PSA completed for AP600 design, including flood and fire. Level 1 PSA completed for SBWR design.
Japan X X Level 1 performed for Periodic Safety Review. Level 2 being considered. Level 3 would be applied to discussions for Safety Goal and LERF as technical bases.
Korea X X
Level 1 to identify areas where improvement is needed (schedule, procedures, or plant equipment) and prioritize as necessary, and to decide between competing risks. Internal events and internal flood and fires included.
Mexico X Level 1 to support safety improvements, changes to the licensing basis, etc.
Netherlands X
The scope is Level 1, 2, and 3, including internal and external initiating events. The PSA is used for risk monitoring (including configuration control during shutdown), optimizing test and maintenance strategies (e.g., maintenance shifted from shut-down to full power state), optimization of Technical Specifications, etc.
South Africa X
Level 1, 2, and 3 PSA for internal events. The scope also includes the spent fuel, fuel handling, and waste treatment. The LPSD PSA has been used for some technical specifications as a supporting basis and has led to modifications and improvements. Risk management, risk compliance, and maintenance planning are also applications of the PSA. This included addressing the findings of the periodic review, risk ranking of components, systems and safety issues, and risk-informed emergency measures. A feasibility study was started on performing risk balance analyses (risk monitor).
Spain X X Level 1 scope with application to risk-informed in-service inspections, and others which require shutdown risk assessment or characterization. Future applications may include risk monitors.

NEA/CSNI/R(2005)11/VOL1
18
Table 3, Low Power and Shutdown PSA Levels and Uses
Member Country CSNI COOPRA Levels and Uses
Sweden X
Level 1 and 2 for assessing safety, Periodic Safety Review, measure plant safety level, identify plant weaknesses, identify manual actions, provide a basis for instantaneous risk applications. Intended applications include mapping risk and identification of strength and weaknesses, analysis of plant changes and follow up as part of the Forsmark safety index, and comparing CDF to safety goals. Future applications identified are Technical Specification optimization, FSAR applications, and risk monitoring.
Taiwan X Level 1 internal LPSD PSA. Improvement of procedures, maintenance planning. Mid-loop applications.
United Kingdom X Full scope Level 3, including internal and external initiating events. Uses include demonstrating Safety Cases, modification support during shutdown, and possible risk-informed decision making.
United States X X
Levels 1, 2, and 3, including internal and external initiating events. LPSD PSAs may be used to support risk-informed regulatory activities, for example making changes to the licensing basis using Regulatory Guide 1.174, events assessment, inspection and enforcement, maintenance rule, and PSA standards. LPSD PSAs have been used in evaluating the design of advanced reactors, developing tools for evaluating risk significance of inspection findings, and for proposed rulemaking.
Table 4, LPSD Models
Outage Types Modelled CSNI Member Model Description
Planned Unplanned Other Belgium PWR, 2 POSs X Germany PWR, 13 POSs X Transition
Hungary VVER 440/213, 24 POSs X Transition during shutdown and startup phases
Japan BWR PWR
X X Transition
Korea APR-1400, 23 POSs X Mexico BWR, 7 POSs X
Netherlands PWR, 28 POSs X
Unplanned easy to model. Transition. Non-drained maintenance without RHR. Drained maintenance with RHR. Drained maintenance outage. Short refuelling outage. Long refuelling outage.
Spain PWR, 15 POSs BWR, 11 POSs
X Unplanned easy to model.

NEA/CSNI/R(2005)11/VOL1
19
Table 4, LPSD Models (continued) Outage Types Modelled
CSNI Member Model Description Planned Unplanned Other
F1/2 X R1 X X Transition. R2-4 X Transition. B2 X Transition. O1 X X Transition. O2 X X
Sweden
O3 X X United Kingdom PWR X X Transition in some cases.
United States
PWR, 15 POSs, 1 detailed POS modelled BWR, 7 POSs, 1 detailed POS modelled
X X
Descriptions
POSs are described in the responses. The descriptions provide insights into the operations, system considerations, physical phenomena, plant response, etc, that are important for the POS other than the boundary conditions. Some examples include cooldown, heat sink availability, natural circulation, and systems success criteria.
The boundary conditions distinguish the end of one POS and the beginning of another POS. The Technical Specification modes may serve this purpose. However, LPSD models have found it useful to consider other conditions. A simplified approach may consider only a delineation of whether or not the RHR system is connected. A refined approach may consider many subdivisions of the Technical Specification modes. The durations of POSs for such approaches can be as short as 1 hour. Others may find that the POS boundaries do not necessarily correspond to the start or end of a Technical Specification mode. A POS could include part of the cold shutdown and part of the refuelling mode.
Component maintenance outages can also be associated with the POS definition. Theoretically, different POSs should be defined for each “deterministic” component unavailability; however, depending on the level of detail associated with the system models, this may prove too difficult or require more resources than are available.
Average outage durations, based on duration times actually observed for the POSs, are used. The duration of each POS was determined by a detailed review of shutdown schedule plans and past operational records.
Transition modes generally were not modelled in the LPSD PSAs; rather, the LPSD PSAs accounted for an average risk condition within a defined state as opposed to the transitional risk associated with the actual process of moving from one state to another. However, several responses did indicate that transition risk was included, or modelled to some degree. Some examples of transition risks modelled are: (1) electrical power shifted to offsite in hot early shutdown; (2) tripping the turbine and using the turbine bypass to remove decay heat; and (3) draining to midloop.

NEA/CSNI/R(2005)11/VOL1
20
Modelling Adequacy
POS modelling adequacy has been described as generally acceptable for the applications, but there is recognition that there are no absolute criteria to evaluate it. A level of conservatism and detail in the approach provides a degree of confidence for the quality of the final POS set. An evaluation of key parameters also provides some assurance if they are practically constant.
Differences
Differences in LPSD and FP POSs include:
1. The need to model pre-existing conditions.
2. Time window analysis. A POS (e.g., midloop operation) can occur at different times in the outage. The time after shutdown impacts the success criteria for systems to prevent core damage, the progression of the accident, possible releases, and consequences. The time windows are characterized by a time interval and a representative decay heat level.
The differences between the LPSD and the FP states can appear in many of the PSA elements, i.e., initiating events, risk metrics, etc. Identified differences are provided below.
2.3 Initiating Events
In this section, methods of identification of initiating events are noted, and screening and grouping (quantitative and qualitative) practices are summarized. The responses’ on the adequacy and completeness of initiating event modelling are noted. Differences between the operating states are also presented.
Identification
Identification of LPSD initiating events methods is similar to those applied to the at-power PSA models; however, some initiators are quite different from those at full power. The effort is extensive since each POS is considered. Methods, which may be combined into a tiered approach, are:
• Literature reviews of full power PSA studies, LPSD PSA studies, event reports, procedures, etc.
• Logic diagrams which consider safety parameters and their applicable POSs; or, which identify groups of initiating events, break them down into possible initiating events, and re-group as identified initiating events
• Plant-specific evaluations such as the location that a LOCA could occur, equipment impacted by an initiator, system configuration, initiation/actuation/isolation signals, equipment performance, plant activities, and human errors.
• Techniques such as failure mode and effect analysis, hazard and operability analysis, master logic diagram, heat balance fault trees
• For every initiating event, the POSs with the highest demands on the system functions were established. In a second step, the initiating events for detailed analysis were selected by expert judgement.

NEA/CSNI/R(2005)11/VOL1
21
An example of a three-tiered approach is: (1) develop a master logic diagram and a safety parameter review, (2) complete system load reviews, and (3) review LPSD literature.
The starting point for determining LPSD initiating events is usually the full-power list. This is then supplemented by those categories judged unique to LPSD. Estimating LPSD initiating event frequencies involves identifying the unique categories of events that have the potential to result in an initiating event for a POS and then quantifying each unique category. These categories include internal causes and others, such as the erroneous change of the operational loop, erroneous draining of the operational loop, maintenance activities, erroneous system alignment, heavy load drop, and other interactions. The frequency of each category of event is quantified, and these frequencies are then combined to produce POS-specific initiating event frequencies for each initiating event.
In general, initiating events are related to:
• core cooling
• level control
• inventory control
• subcriticality control
• pressure control
• temperature control
• reactor coolant system boundary status
• containment status/activities
Human errors during shutdown were accounted for to reflect the increased level of activity at shutdown for the majority of the models. This leads to consideration of unique initiating events such as flow diversion. It also leads to adjustments of initiating event frequencies such as loss of RHR. Reviews of maintenance and operating procedures, as well as past events, are performed to identify situations with the potential for human error, evaluate its significance, and take steps to ensure the likelihood is minimized and contingency plans can be developed.
Unique initiating events were considered in detail. They are plant-specific and depend upon the POS. Their identification may involve consideration of the loss of systems that are normally in standby during FP operation, but are relied upon during shutdown, refuelling, and startup. Examples include those systems which remove decay heat. Systems, structures, and components that are relied upon during FP operation are also considered since their operational or availability characteristics may become different. Switchyard configuration and control, for example, can have an impact on the likelihood of a loss of offsite power. In addition, systems that are normally in standby may be kept in standby during shutdown. A spurious actuation of emergency core cooling system (ECCS) injection, for example, may be a concern for a rapid cooldown or may be a concern for pressurized thermal shock.
Screening and Grouping
Screening and grouping of initiating events have been performed for the majority of LPSD PSA models. This was done to simplify the analyses.

NEA/CSNI/R(2005)11/VOL1
22
Screening involved both quantitative criteria and qualitative considerations. If the frequency of occurrence is sufficiently small, the event is screened out. The thresholds indicated for this were < 10-6 per year or <10-7 per year. These frequencies have been used with qualifications: < 10-6 per year for events with consequences deemed as not harsh, and <10-7 per year for events with harsh consequences (e.g., reactor pressure vessel rupture). However, qualitative considerations may suggest further consideration of the event even if it meets the threshold, such as a containment bypass scenario. One study did not screen except on boron dilution scenarios whose total core damage probability remains below 1% of the total yearly core damage probability. Finally, one general recommendation provided for quantitative screening was that it should not be based only on duration of the corresponding POS, but that conditional risk during the POS should somehow be considered.
Qualitative considerations for screening out an initiating event include: (1) time for event progression to unfold, (2) POS system configuration, (3) plant-specific features, (4) expected likelihood of occurrence and ease of mitigation, and (5) the number of “barriers” for man-induced LOCAs (e.g., administrative control, leakage indication, check valve, inadvertent opening of a valve, inadvertent start of a pump) that would have to fail.
Grouping has been performed by consideration of the following:
• thermal hydraulic analyses
• plant response
• system success criteria evaluation
• scenario timing
• physical location
Grouping allows the use of the same event tree for initiators with similar plant responses, and simplifies the analyses.
Initiating Event Model Adequacy and Completeness
The models have considered elements of the methods to address the adequacy and completeness of the set of initiators. Adequacy and completeness of the sets are generally believed to be sufficient for their intended purposes. This is attributable to the approaches taken which rely on comparison and consideration of initiating events identified in previous LPSD PSA studies, consideration of operational experience, plant evaluations, and application of methods such as a master logic diagram. On the other hand, approaches may not have provided any formal justification. However, if the intended application requires more rigor (e.g., to support a regulatory analysis), then the scope of the set may need to be re-examined and revised.
Differences
The process of identification of initiating events did not differ from that of full power. The responses noted, however, the following for initiating events identification:
1. The amount of time available to produce a significant challenge to systems or operator actions. In some instances, a significant challenge to systems can occur in a relatively short time (e.g., certain draindown scenarios). In other cases, there may be a long time for operators to diagnose and correct the event.

NEA/CSNI/R(2005)11/VOL1
23
2. There are a number of unique events at shutdown such as loss of RHR, loss of natural circulation, and boron dilution.
3. Identifying plant-specific initiating events can be more resource intensive.
4. Initiating events caused by human error need to be accounted for in the initiating event analyses.
Some differences were identified for the screening and grouping of initiating events:
1. As a consequence of changes in system availability, some groups cannot be retained because the plant response is different when the plant is descending or ascending in power.
2. Different types of LOCAs are treated only as a group and not individually, or according to size.
Other differences identified in initiating events include the following:
1. The frequency of LOCAs due to pipe ruptures
2. The frequency of LOCAs due to flow diversions and draindowns
3. The transient frequency during low power
4. Over-pressure events at low temperature
5. Boron dilution events
6. Internal fires, floods, and seismic initiators
7. Area initiators.
8. Crane failures and heavy load drops
9. “Per demand” events such as reaching midloop are modelled. Such events may have been incorporated into the model as a frequency.
10. “Probability” events such as situation-specific human errors important for LPSD operation may have been incorporated into the frequency estimate.
NEA/CSNI/R(2005)11/VOL1
24
2.4 Risk Metrics
The LPSD studies have considered different metrics to measure risk. Ultimately, the metrics are part of the plant safety assessment in the decision-making process. The metrics range from boiling of the bulk inventory, to damage of the core, to the affects of radionuclide releases on individuals and society. This section discusses the metrics from the responses. Results and insights are presented in a later section.
Level 1
The frequency of core damage (CDF) is the most commonly used metric. The definition of core damage can reflect conservatism or realism in the calculations. LPSD models may use the emergency core cooling criteria. The maximum cladding temperature is commonly focused upon for determining the start of core damage. The following considerations also have been used: (1) level at the top of active fuel; (2) level at one-third core height; (3) core heatup; (4) first gap release; (5) prolonged dry-out of the core with no means of available injection; (6) exceeding primary system test pressure; and (7) stored energy greater than a specified value of calories per gram. Exceeding the defined criteria represents the onset of core damage.
The above definitions have been employed for full power analyses, and have also been applied in LPSD analyses. Application of the same criteria can be conservative in some instances. For some applications, realism in the definition of core damage may be desirable. Further analyses may show the level used for full power operation could be lower for a LPSD model. For example, a lower decay heat could allow a lower water level in the core before the onset of core damage.
For each POS, the CDF is estimated. The POS duration is evaluated to be applied in the calculation of the average CDF. Also, a conditional CDF can be calculated, conditional on being in the given POS. CDF may be expressed in units of per year (annual average) or in per hour.
In some instances, the core damage probability is calculated, instead of the frequency, for risk integration over the entire outage. Also, since the duration of POSs differs, comparisons of core damage risk among the states were made based on core damage probability depending on the state duration rather than the frequency. The decision was supported by the fact that some of the initiating events could be characterized by probability of occurrence rather than frequency. For example, some human errors that lead to a plant transient have the potential to be committed during special actions performed during shutdown, thus belonging to the group of initiating events characterized by probability of occurrence.
Another risk metric noted was the so-called system damage states (SDS) which endanger core cooling. A system damage state occurs if the operational and safety systems for fuel cooling are not available. They do not consider accident management and repair measures.
Fuel damage frequency (FDF) may also be calculated which covers, in addition to CDF, also risk from the fuel in the spent fuel pool.
Level 2/ LERF
Risk-informed applications consider the large, early release frequency (LERF) for decision-making (in addition to CDF). LERF is generally defined as the frequency of accidents leading to significant, unmitigated releases from containment in a time frame prior to effective evacuation of the close-in population such that there is the potential for early health effects. Also, a measure of the frequency of large/small uncontrolled release (different from LERF) may be calculated.
NEA/CSNI/R(2005)11/VOL1
25
Level 3
Very few LPSD studies have completed Level 3 consequence analyses. The Level 3 metrics are related to individual and societal health risks as a consequence of a release. These measures help to address nuclear power plant safety policies. Environmental risk management, for example, has the following objectives and steps:
• Verifying that pre-set criteria and objectives for individual and societal risk have been met. This includes identifying, quantifying and assessing the risk.
• Reducing the risk, where feasible, until an optimum level is reached (i.e., based on the as-low-as-reasonably-achievable principle).
• Maintaining the risk at this optimum level.
Also, Level 3 analyses may be compared against safety goals.
Risk measures for Level 3 consequence analyses include:
• Maximum individual total dose for a single source
• Maximum individual mortality risk for all sources together and for a single source
• Group risk
• Early fatality risk
• Total latent cancer risk
• Population dose within 50 miles of the plant
• Population dose within 1000 miles of the plant
• Individual early fatality risk – 0 to 1 mile
• Individual latent cancer risk – 0 to 10 miles
Level 2 and 3 measures provide more comprehensive information than Level 1 measures. Regulatory application studies such as rule-making or the inspection program utilize these types of results. The insights gained are also useful for trade-off studies when investigating maintenance unavailability at-power versus at-shutdown.
Differences
1. Most responses did not identify any differences. However, some are:
2. The core damage definition uses “uncovery of the top of active fuel without imminent recovery” while a LPSD study may use a lower core height (e.g., 2.5 feet above the core bottom) due to a lower decay heat during shutdown.

NEA/CSNI/R(2005)11/VOL1
26
3. For a reactivity initiation accident, core damage was defined as when re-criticality is attained due to boron dilution.
4. LERF is dependent on time after shutdown due to the decay of radionuclides.
2.5 Sequence Analysis
The responses have confirmed that the processes for full power and LPSD PSAs are similar, i.e., the use of event trees and fault trees. However, the LPSD PSAs can be sufficiently different from full power to warrant new sequences (related to new initiating events), changes in fault tree trees to reflect system configuration and equipment availability, success criteria, and possibly the sequence endstate.
Sequences
Unique initiators and conditions, of course, introduce new event trees and sequences for evaluation. Examples of possible changes in sequences (other than the initiating event itself) identified in the responses were (1) inclusion of unique mitigation capabilities for decay heat removal (e.g. reflux cooling), (2) the observation that recirculation is not needed for some late time windows, (3) the availability or unavailability of heat sinks (e.g., steam generators), and (4) inclusion of the fraction of time spent in a POS.
Changes in system configuration and equipment availability are related to low power and shutdown procedures, activities, and maintenance. These changes are evaluated for each accident sequence impacted.
Screening and Grouping
Sequences are screened and grouped also. Screening is based on a specified mission time and a specified frequency truncation level. Sequences with low contribution have been grouped with other sequences.
Success Criteria
Success criteria may be the same as used in the FP analyses. One reason for this could be that success criteria are not defined as less than full flow from a pump due to the difficulty of determining and modelling the combinations of failures that would lead to the reduced flow. It should be noted, though, that success criteria could be different than that used in the FP analyses, even more stringent in some instances.
Success criteria development is dependent on the data available. Lack of historical, experimental, or simulator data results in developing data based on engineering judgment.
The changing level of decay heat is an important consideration. “Time windows” may be defined after shutdown related to success criteria. In general, whenever the success criteria for one system or mitigating function changes, a new time window should be defined. However, there is a trade-off between the accuracy of the model and the level of effort needed to arrive at a solution. Thus, the number of time windows ultimately defined may involve compromise.
Success criteria are also influenced by thermal hydraulic and core physics analysis and the availability, or lack thereof, of information, as well as the particular POS configuration. Analysis may have used codes such as those used at FP, different codes if judged not to be applicable for shutdown conditions, or hand calculations. In some instances, no thermal hydraulic analyses were performed. The different applications for these codes are summarized below.
NEA/CSNI/R(2005)11/VOL1
27
Thermal Hydraulics
Overall, the responses indicated that thermal hydraulic analyses are difficult to perform for LPSD conditions, and conservatism may be used in the calculations. Assumptions had to be made that the FP success criteria was applicable to the LPSD conditions due to lack of information or supporting analyses in some instances. This type of assumption may be conservative. However, some success criteria can be more stringent that the FP cases. For example, the success criteria for a large break LOCA in a BWR cold shutdown study required flow from two low-pressure coolant injection pumps to prevent core damage rather than from only one pump for the same type of accident if it were to occur at FP. For a PWR, it was found that feed and spill success criteria in some cases turned out to be more stringent than that of feed and bleed in the FP PSA. These observations underline the importance of performing thermal hydraulic analyses and relating the results to the POS.
A number of thermal hydraulic codes and their uses, or considerations for, LPSD PSAs were identified:
RELAP5/mod2: Modelling reflux cooling by steam generators when auxiliary feedwater is not available
Modelling gravity feed when the steam generators are isolated
RELAP5/mod2, ATHLET: Defining LOCA categories and success criteria for nominal operational
mode assuming different break sizes and available safety system configurations
Clarifying some success criteria of LOCA event trees related to shutdown states when (1) cooling down is in progress, but hydro-accumulators are isolated from the primary circuit, and (2) the reactor is open, heat removal is ensured by the secondary side decay heat removal system, and there is natural circulation in the primary circuit
ATHLET, ATHLET-KIKO3D: Identification and evaluation of boron dilution scenarios SMATRA, SMABRE, ∀-Flow RELAP/mod3, TREAT/NC: Evaluating reflux cooling success criteria MELCOR, simplified codes: Modelling gravity injection
Determining the number of low-pressure injection pumps needed for a large LOCA during low decay heat conditions (BWR)
Determining system decay heat removal adequacy (BWR)
Determining time to various conditions (e.g., core damage, overpressurisation of piping, and isolation set-points)
MAAP-4, MELCOR: Determining success criteria CATHARE loss of heat removal and primary break calculations were used to: (a)
estimate the maximum time available to activate safety injection for break sizes that do not activate the automatic water makeup, and (b) assess the efficiency of the countermeasures

NEA/CSNI/R(2005)11/VOL1
28
Core Physics
One of the primary areas of concern appears to be risk of reactivity accidents caused by either accidents outside the vessel or inherent in-vessel rapid boron dilution. Uncertainty exists in some scenarios about the possibility of insufficient mixing between non-borated and borated water and the formation of a slug of non-borated water that may move into the core and cause prompt. The responses indicate a general interest in studying boron dilution scenarios further.
In the BWR design, reactivity accidents are not related to boron dilution. Analyses considered refuelling accidents (e.g., incorrect placement of a fuel bundle during refuelling).
Another problem area identified is associated with the risk of cold overpressurisation. In the case of a residual heat removal system break, stresses are introduced during two time frames. The first occurs when the primary water is cooled due to the depressurization resulting from the break and the cold water injected by safety injection. The second occurs when pressure increases after the break is isolated. The combination of these two events introduces two kinds of stresses: (1) thermal stresses on the reactor vessel during the cooling and (2) mechanical stresses during the repressurisation. These can provoke brittle fracture of the reactor vessel. Core damage sequences, in the first stage, have been quantified with conservative assumptions.
Endstates
Endstates of accident sequences are also important to consider. The analyses must identify where to stop the sequence. This requires defining the success state, and defining the core damage state (discussed previously). Stable conditions are required for sequence success. The success endstate may be related to a system-specific mission time. The sequence may also be stopped at hot shutdown if the reactor coolant boundary was intact or at cold shutdown if the reactor coolant boundary was breached.
Differences
Differences identified in accident sequences are:
1. POS-specific scenarios such as inadvertent boron dilution, drop of a heavy load, pressurized thermal shock, and loss of natural circulation.
2. Unique mitigation measures such as gravity feed, reflux cooling, or others that depend on the specific plant configuration.
3. Unique assumptions for the fire analysis such as limiting events and associated core damage scenarios to loss of decay heat removal, LOCA, and loss of offsite power from mode 4 through 6.
4. Success criteria for the mitigation features may require consideration of longer mission times for systems, the use of different systems, differences in the number of components needed, operator diagnosis and response, etc.
5. Success criteria analyses calculations may require code modification or special input parameters.
6. A large number of success criteria analyses may need to be performed for specific events such as boron dilution scenarios.
7. Demand rates on components.

NEA/CSNI/R(2005)11/VOL1
29
8. Initiating event frequencies change across POSs, and the sequence frequencies also change in relative importance (e.g., the type of transients (and their frequencies) will depend on the POS).
9. No credit may be taken for a mitigation system in the sequence due to uncertainty in its availability.
10. Inclusion of the fraction of time spent in the POS.
2.6 System Modelling
Basically, the approach used in full power is the same used for LPSD system modelling. The system fault trees for full power were modified, when necessary, to represent new top events or developing new fault trees for systems not modelled in full power.
Systems (safety and non-safety) have been modelled by means of large fault trees where the support systems are analyzed separately from the frontline systems and linked for quantification. Different boundary conditions are taken into account by means of “house events.”
The failure modes and the associated component boundaries represented in the fault trees were partly defined by standard physical component boundaries, partly by available component reliability data. This means that component boundaries and failure modes were determined on a case-by-case basis, especially during modelling of electrical and instrumentation and control support systems.
Recovery of equipment has generally not been included in the PSA. However, recovery is desired to be included for more realistic analyses. Recovery considerations may include taking into account the training and operational practices, the available time for mitigation, and the potential to call other personnel.
Differences
The system models are set up to reflect the dynamic environment. This involves changes to both front line and support system fault trees for the different POSs. The POSs definitions show that changes occur in the electrical power system status and alignment, the decay heat removal method, emergency core cooling component alignment and availabilities, and plant activities. Other differences are:
1. System modelling needs to consider more initiating events and accident sequences as compared to full power PSAs
2. Human interactions have greater importance than in the full power case
3. Assumptions on equipment are made. Examples are:
3.1. all safety systems (except emergency diesel generator) are assumed to be capable of manual start only
3.2. credit is taken for an automatic switchover of the charging pump(s) suction from the volume control tank to the refuelling water storage tank if required
3.3. one train of emergency core cooling systems and associated emergency diesel generator are unavailable
3.4. maintenance unavailability modelling

NEA/CSNI/R(2005)11/VOL1
30
3.5. alteration of system alignments (e.g., hot leg alignment of safety injection during cold shutdown)
4. Inclusion of preventive maintenance.
5. Different systems, structures, or components may actually be, or assumed to be, unavailable.
6. Development of new trees, or conversions from full power models, for systems.
2.7 Data
Initiating event frequencies, unavailabilities, unreliabilities, and common cause failure data are addressed in the responses. The gathering and assessment of data includes the review of databases, studies, and FP models. Most studies used the data methods from the FP PSAs with modifications to account for conservatism, the POS, and plant-specific operational experiences.
Generic / Plant-specific Data
Generic data is noted to be acceptable to use if it is perceived to be conservative, or the current databases do not support a more specific approach. Where plant-specific data is used, the Bayes method is applied.
Common Cause Failures
The common cause failures data used is typically the same as for full power. However, there is recognition that this is an area which should receive further attention due to unique shutdown conditions. Methods applied are discussed in detail in the appendixes.
Databases
For the French PWR studies, national databases were accessed on a major scale in order to obtain a large amount of data, such as the French Reliability Data Acquisition System and the Event File databases, as well as files of statistical data. To make the studies realistic, it frequently is necessary to support the data collection by performing onsite investigations to allow for the inclusion of certain site-specific characteristics.
Internationally accessible sources have also been used, e.g., UAES-TECDOC-478, EIREDA, Swedish T-Book, and IEEE database. The data were gathered and combined by the approach described in the German Risk Study. It assumes that point values of the source data follow a lognormal distribution, thus the combined mean value and the error factor were defined by putting them into an appropriate coordinate system. The latter pair of data characterized the prior distribution of the generic data.
Some CCF data was consulted in: NUREG/CR-5801, NUREG-1150 studies, NUREG/CR-6143, and NUREG/CR-6144.
Plant-specific data were used in determining estimates for maintenance unavailabilities and fractions of time spent in each POS.
Differences
The following differences between the FP and LPSD models are noted.
1. The initiating event frequencies are changed. This involves scaling frequencies (but not necessarily all) to account for influencing factors such as the lower pressures and the time spent in a POS.

NEA/CSNI/R(2005)11/VOL1
31
Human errors are also factored into the frequencies since they could dominate the frequency of occurrence.
2. It is necessary to decide which systems, structures, and components (SSCs) to include in the scope of modelling for test and maintenance unavailabilties. SSCs to be considered in the model include those that are required by Technical Specifications, as well as those that are kept operable voluntarily. The probabilities used for these unavailabilities may use the Technical Specification Limiting Condition For Operation, or POS-specific data. With respect to full power unavailabilities, LPSD unavailabilities can be smaller or much greater.
3. The component types on which to gather plant-specific data for unreliability.
4. The mission times for systems may differ. The responses show significant differences in the modelling of mission times.
5. Failure data for extended operations.
6. Human error probabilities.
7. The applicability of initiators that have occurred in specific POSs should be analyzed to develop consistent statistics before normalisation of the frequencies to a “per calendar year” basis occurs. For instance, the likelihood of LOOP, or other transient types, might be different for different POSs, according to plant design or operational practices. Therefore, LOOPs that have occurred should be assigned to a specific POS when estimating the statistics (number of POS-specific LOOPs divided by the total time in a POS in years), rather than doing a general estimation (total number of LOOPs in total number of calendar years) and multiplying by the mean fraction of the year in a POS.
8. Test intervals may be different from the nominal test frequency during full power because of operational demands during the plant shutdown.

NEA/CSNI/R(2005)11/VOL1
32
2.8 Human Reliability Analysis (HRA)
The responses for human reliability analysis reflect the importance of this modelling element for LPSD PSAs. The majority of models incorporated specific aspects in detail, utilizing existing HRA methodologies that have been applied in full power PSAs. Human error probabilities (HEPs) were evaluated for three basic types: (1) errors occurring prior to an initiating event (Type A), (2) those causing the initiating event (Type B), and (3) those occurring after the initiator (Type C).
Methods
Changes in the methodologies from the full power approaches may have been necessary. The HRA estimates, for example, need to account for the unique LPSD conditions such as the long time available for operator response for some accident sequences, or the lack of formal procedures. Some methods used are:
• Technique for Human Error Rate Prediction (THERP)
• Success Likelihood Index Method (SLIM) modified
• Systematic Human Action Reliability Procedure (SHARP)
• Operator Reliability Experiment / Human Cognitive Reliability (ORE/HCR)
• Accident Sequence Evaluation Program (ASEP)
• ‘Hitline’
• A Technique for Human Event Analysis (ATHEANA)
• EdF
• Cognitive Reliability and Error Analysis Method (CREAM)
It is necessary to perform evaluations for each POS, and thus, to evaluate a large number of human error probabilities. The large number of evaluations has resulted in the development of efficient HRA procedures. Improving efficiency, though, possibly by simplifying the HRA, is noted to be desirable.
In some instances, limitations of the methods have been encountered. For example, a method may not support the time scope of the accident sequence (such as applying THERP for times outside of its quantification ranges). Modelling human errors of commission have also been challenging. However, methods have been consulted and applied for LPSD conditions. The development of ATHENA helps to improve this modelling aspect.
Dependencies have also been considered. It was noted that dependency on diagnosis may be complete due to the short time available for operators to take mitigation measures. With regard to planning maintenance considerations, it was noted that separation of maintenance tasks showed that no within-crew dependence had to be assumed between the train level HEPs for modelling pre-initiator actions. However, within a system, complete dependency for maintenance tasks that affect multiple components is modelled.
Data
Plant-specific information is taken into account in the human error probability quantification by review of

NEA/CSNI/R(2005)11/VOL1
33
procedures, walkdowns, and interviews, for example. Other sources of information include field data on human errors, event reports, and expert opinion. Information such as simulator data is a noted limitation for quantifying the human error probabilities in the responses. EdF simulator experience, though, has found application. A decision tree approach to integrate inputs from the varied sources has been applied.
Differences
Differences between FP and LPSD models are noted below.
1. There are increased opportunities for making significant errors.
2. For a cold shutdown study, adjusting (generally downward) the recommended level of stress associated with an action
3. For a cold shutdown study, giving credit for operators correctly diagnosing and carrying out a non-
proceduralised action if, on the basis of the site reviews, it was judged that the operators had a clear understanding of the event in question and of the requirements for responding to the event
4. For a cold shutdown study, consistent use of a HEP to represent failure to diagnose is the most
important difference in the PSA for shutdown POSs. That is, for each initiating event, and each shutdown POS, the probability that the operator fails to diagnose is modelled. Given failure to diagnose, it is assumed that core damage would result
5. In shutdown modes some accidents develop very slowly. As a result, a long time is available to
respond to the situation. This time may exceed even 10 hours. Such extra long response times have not been address in the full power PSA
6. In general, the emergency operating procedures are not very well developed for low power modes,
or they are not even available 7. In most of the shutdown modes there are several parallel and sometimes concurrent activities
which may affect the ability of operators and other plant staff to respond to an accident 8. Due to excessive maintenance, safety related systems are taken out of service. As a result, there
can be fewer indications of an accident in the main control room and/or local action may be needed
2.9 Quantification / Sensitivity Studies / Uncertainties
This section discusses the quantification tools, insights on quantification, sensitivity studies, and uncertainties. Differences between the operational states are also noted.
Codes and Applications
The quantification of the LPSD models uses computer codes that have supported full power PSA calculations. Quantification tools included NURPRA, IRRAS (which has become SAPHIRE), Risk Spectrum, LESSEPS, KIRAP, and TRIM. Temporal dependence, which in some cases may be important to model, may be analyzed in detail with Markov graphs. Event tree sequences are evaluated by event tree linking, cutest generation, and post-processing. The risk metric evaluation must be performed for each POS. To support the evaluations, it is necessary to account for basic event changes such as for initiating events, system configurations, human reliability analyses, component unavailability, unreliability, and

NEA/CSNI/R(2005)11/VOL1
34
common cause likelihood for each state. The increased complexity in a LPSD model gives rise to more event tree and fault tree logic rules and flags for switching different types of states on and off.
The type of application is important in model quantification. Configuration risk monitors may evaluate risk metrics based on the plant’s current (or projected) configuration, given the plant is in a POS. Nominal or average test and maintenance (T&M) equipment and system unavailability is not used. The baseline risk corresponds to a zero T&M unavailability from which changes are evaluated. Other applications use a nominal or average baseline risk from which to assess plant changes. This requires evaluating the T&M unavailabilities and the mean POS duration. The planned equipment and system outages cannot be considered as independent occurrences over a specified outage period. Including non-zero T&M can be important for the baseline risk estimate in assessing the change in risk, as well as in obtaining risk insights. Gathering data and evaluating T&M can be an intensive effort, and guidance on this task would be useful, given that plant outages differ from one to the next. In addition, the advantages and disadvantages of the configuration risk monitor and the “average T&M” LPSD PSA model may need to be considered in decisions. For example, POS durations (e.g., midloop) vary in length, and it may be determined that a model that is structured on an average POS duration may not accurately reflect the actual POS duration (e.g., extended midloop).
Sensitivity and Uncertainty Studies
The calculations may include estimates of importance measures, uncertainty analysis, and sensitivity studies. Importance measures such as Fussel-Vesely, Risk Decrease Factor, and Risk Increase Factor were evaluated and used to gain POS risk insights. Integrating risk across the outage is also performed to provide global insights.
Common insights are related to potential human errors. Human performance is of interest since it is related to all time periods and aspects of LPSD accident sequences. It is found to be important in sensitivity studies where mitigation of an initiator (perhaps also human-error related) is highly dependent upon operator action. If reliable equipment is capable of mitigating the accident without operator intervention, the importance of human errors decreases. Therefore, the adequacy of procedures and training, or lack thereof, is examined and improved as needed to decrease risk.
Sensitivity studies have also been determined to be useful in assessing the importance of technical, procedural, and administrative aspects. Some sensitivity analyses performed involved:
• recovery action for restoration of a shutdown cooling train
• fire suppression action
• operator action for LOCA isolation
• operator actions taken from operational experience
• operator actions analyzed by HRA
• LOCA frequencies
• equipment survivability
• plant conditions assumptions

NEA/CSNI/R(2005)11/VOL1
35
• CCF modelling of operating equipment
• simultaneous unavailability of safety systems due to maintenance
Uncertainty analysis was addressed to varying degrees. Analysis was performed to address modelling uncertainty (incompleteness of PSA logic models and limitations in adequacy) as well as parameter uncertainty (input data). Some contributors to these types of uncertainties in the LPSD models may be:
• not including forced shutdown
• no or limited consideration of internal fires, flooding, or external hazards
• not considering risk from other potential sources (spent fuel pool, interim storage facility)
• limited knowledge of accident sequence development
• level of detail due to lack of knowledge
• weaknesses of plant documentation
Differences
Differences identified in the responses are:
1. The need to consider the fraction of the time in the POS.
2. Calculations are more time consuming
2.10 Plant Damage States (PDSs)
There are seven studies which have defined PDSs. PDSs contain the input data for the LPSD Level 2 study. The PDSs modelling process is similar to that of full power studies. Also, there are similarities in the PDS definitions or descriptions for full power and LPSD conditions. For example, it in necessary to address the status of the reactor coolant system boundary, the emergency core cooling systems, and AC power. However, there are some important differences.
Differences
Differences noted are:
1. In general, the characteristics are different, new PDS states are required, and full power PDSs may no longer be relevant. For LPSD, the containment system status is questioned, but the characteristics such as the bypass paths may be different. Another example is fuel location (e.g. in-vessel or in-pool). In addition, it may also be necessary to introduce new considerations such as “Human Errors”. Some important full power considerations such as “Cooling for Reactor Coolant Pump Seals” may not be included for the LPSD PDSs. Furthermore, it may be decided to factor the time after shutdown into the PDSs. In addition to these observations, the PDS modelling approach may include a PDS that does not involve core damage. Venting is required in this state, though, which leads to minor unfiltered releases of radioactive materials.
NEA/CSNI/R(2005)11/VOL1
36
2. Descriptive initiating events for the set of PDSs change in relative importance. LOCAs may become relatively more important for the PDSs, for example. Other initiating events identified as important include loss of offsite power and transients.
3. A direct comparison of LPSD and FP PDSs may not be possible. For example, a station blackout during full power operation will have a different accident progression than a station blackout during mid-loop operation.
2.11 Containment Performance
Methods
FP studies have been consulted in developing the trees (e.g., containment event trees , accident progression trees, and decomposition event trees). From these studies, simplifications are made specific to the POS being modelled.
The trees consider decay heat level, containment bypass, arrest of core melt, early containment failure, cooling of core melt within the reactor pressure vessel cavity, and late containment failure, and possibly other top events. Some early containment failure phenomena considered are steam or hydrogen production and in-vessel steam explosion. Some late containment failure phenomena considered are hydrogen burn and basemat melt-through. The important phenomena are containment-specific, and should take into account the outage impact on containment systems.
MELCOR or MAAP may have been used to determine the timing of key events. Key events may be the onset of core damage, vessel failure, the amount of hydrogen produced, containment failure, and the migration and release of fission products from containment. To address some data issues, expert judgment has been used. Practices have also incorporated uncertainty distributions for branch probabilities.
Differences
Differences noted are:
1. The containment can be open at shutdown. Timing of key events has been compared to containment closure times to assess the likelihood of recovering containment closure. The minimal time to close containment is an important consideration to decrease health effects. For PWRs, this time may be directly linked to the status of the cold leg boundary integrity for some POSs.
2. The containment event trees are generally smaller, due to some simplifying considerations such as having an open containment.
3. The accident sequence phenomena changes in importance for LPSD conditions. The containment analyses consider physical phenomena such as steam and hydrogen containment failure mechanisms, direct containment heating, etc; however, some of these phenomena may decrease or increase in importance depending on factors such as outage-induced mitigation unavailabilities, decay heat levels, and containment status.
4. The likelihood of failing to arrest core damage before vessel breach in the accident sequence progression can be high due to plant configurations that can impede actions.

NEA/CSNI/R(2005)11/VOL1
37
2.12 Consequence Analysis
Codes and Applications
Codes and their applications include:
COSYMA: Track atmospheric dispersion and deposition, and provide instruction on which pathways and critical group risks should be considered.
MACCS: Track atmospheric dispersion and deposition, and calculate the effects of the radioactivity on the population and environment.
Ramsdell model: Estimate relative concentrations downwind of the reactor. Wilson model
MELCOR: Calculate point estimate release fractions.
SURSOR: Predict source terms for accident progression bins using a parametric approach. It uses parameters that identify the fraction of fission products released to the vessel before vessel breach, to the containment, and to the environment
GGSOR: Predict source terms for accident progression bins using a parametric approach. It accounts for two releases from containment. The first release occurs roughly at the time of containment failure. The second begins after the first is finished.
PARTITION: Reduce the very large number of source terms into a smaller number of representative terms for input into the consequence analysis.
Differences
Differences are:
1. Radiological release modelling used the same codes, but modifications to them were necessary.
2. Severe accident phenomenology will also be different. When RHR is in service, the pressure is low and low pressure accident phenomenology is important.
3. The source term considerations. Source terms can be different due to the decay of short-lived radioisotopes such as iodine and tellurium after shutdown. Longer lived radioisotopes such as ruthenium can be released from fuel if an air environment can exist to cause fuel cladding air- oxidation.
2.13 Results of the LPSD PSA / Insights
Level 1
Most studies estimated internal initiating events CDF only. Few analyses have addressed internal flood, fire, and seismic events, or, included radionuclide release and health effects. The analyses cover different reactor types including VVER, Westinghouse PWR, General Electric BWR, French PWRs. The CDFs range from approximately 1E-4/ry to 1E-7/ry. Results are reproduced from the Appendixes in Table 5. Risk insights and profiles into the LPSD risk versus full power risk are discussed below.

NEA/CSNI/R(2005)11/VOL1
38
Insights for PWRs were identified for CDF. All studies noted the importance of managing risk during midloop operation. At midloop, the water level is relatively low and the steam generators may be isolated by nozzle dams or loop stop valves. Risk insights during this period included maintaining steam generator(s) available along with auxiliary feedwater, and ensuring sufficient pressure relief with the nozzle dams installed. Lack of redundancy of the low pressure ECCS systems contributes to risk during this reduced inventory period. In addition, it is important to reflect in analyses level instrumentation which is relied upon during midloop for successful operation of the RHR system and for accident mitigation strategies. Accident sequences involving failure to correctly diagnose the situation and take proper actions can be important to overall risk. With respect to fire risk during midloop operation, the potential for loss of RHR or loss of multiple electrical busses due to fires should be considered. Midloop operation evaluations may result in modifications, procedures, and plant improvements.
In general LOCA initiators are also found to be a dominant LPSD contributor for CDF. LOCAs can be induced mostly by inadvertent human actions rather than hardware failures.
Another important scenario is the loss of natural circulation, and the dominant contributor to this accident type can be related to a heavy load drop which affects the secondary side decay heat removal capability.
One PWR study found the results show that risk during an outage is dominated by those plant operational states when the reactor vessel is open for refuelling and the water level is low in the reactor. Plant states which follow boration and in which primary temperature is above 150ΕC are the next in terms of risk significance. Other important POSs are characterized by an open reactor vessel with refuelling water level, and POSs in which heat is removed from the reactor by means of natural circulation and the primary circuit is pressurized. This kind of distribution is mostly explained by two factors: the difference between the average lengths of the POSs and the reduction in automatic plant responses in some plant operational states.
Risk analyses found that cold over-pressurization was important for PWRs and led to plant modifications to reduce the risk. While cold over-pressurization is typically associated with PWRs, one BWR study noted that it was an initiating event consideration.
The cold shutdown CDF profile for one BWR was given as follows: 50% LOCA, 33% SBO, and 17% Other. The CDF risk profile shows that LOCAs may become more relatively more important during cold shutdown than at full power.
External Events
External events insights are plant-specific. Internal fires and floods, sometimes considered as part of external risk analyses, have a relatively higher CDF than seismic events. LPSD seismic CDF has been found to be in the E-7 and E-8 per year range in two studies. External events CDF during midloop was found in another study to be in the E-7 per year range from different initiators.
Spent Fuel Pool
One study evaluated the CDF for fuel in the fuel pool. The estimate was in the E-7 per year range, and considered loss of support systems (SBO) and loss of fuel pool cooling.

NEA/CSNI/R(2005)11/VOL1
39
Level 3
One PWR study presented Level 3 insights. It was found that the mean risk of offsite early health effects is over two orders of magnitude lower for accidents during mid-loop operation than for full power in spite of the lack of mitigative features. This is due to the natural decay of the radionuclide inventory (because the accidents occur a long time after shutdown) particularly the short-lived isotopes of iodine and tellurium, which are primarily associated with early health effects. The statistical measures for latent cancer fatalities differ by a factor of approximately three, although the statistical measures for population dose (1000 miles) for mid-loop and full power operations are similar. This difference is largely explained by differences in the latent cancer versus dose relationship in the different versions of MACCS used in the two studies.
For the BWR cold shutdown study mentioned above, Level 3 insights were also presented. The overall conclusion was that the risk was comparable to full power risk.
Confidence in Results
Generally, there is confidence in the LPSD PSA results. However, factors were identified which may decrease the level of confidence with respect to full power studies. These included:
• Uncertainties existing in:
− Human error analyses
− Accident mitigation strategies
• Assumptions needing re-evaluation, such as those used in thermal hydraulic analyses
• Plant practice changes
Lack of information at the time of the study, resulting in known issues (e.g.., maintenance induced LOCAs) not being included in the study
Despite these types of limitations, risk trade-off studies between full power and shutdown states can be performed. The responses indicate that judgement and deterministic views can be used in decisions.
Differences
Differences noted between FP and LPSD studies are:
1. The PWR internal event CDF results can be of the same order of magnitude. The midloop CDF can be an order of magnitude lower than the full power CDF. A different study found the LPSD internal events CDF during midloop to be comparable to the CDF during power.
2. For a PWR midloop study, the seismic CDF was much smaller than the FP analyses.
3. For a BWR cold shutdown study, the internal events LPSD CDF are of the same order of magnitude as the FP CDF.

NEA/CSNI/R(2005)11/VOL1
40
Table 5, Summary of LPSD Results
Scope
Country Plant Type Date
Of PRA
Leve
l
Inte
rnal
Floo
d
Fire
Seis
mic
Oth
er
Operating States
Modelled
Method/ Approach
Used CDF
Release Frequency
Early/Latent
Health Effects
Comments
Canada
Typical CANDU 6 Design (700 MWe)
Two loop Pressurized Heavy Water design (AECL)
1995 currently being updated
1 Y Y Y N N
Nominalpower & LPS (3 main POS for the shutdown state)
ET/FT TBD NA NA
Czech Republic
Dukovany (4 units)
VVER 440/V213
1997 – 1998 1 Y Y Y N Refuellin
g Pool
All below 55% Nominal Power
Small ET Large FT
TBD NA NA
Preliminary results only. Quantification not completed.
France Standard 900 MWe
PWR (France) 1990 1 Y N N N N All ET/FT 1.6E-5 NA NA Update in progress.
Germany Neckarwestheim, Unit2
PWR Konvoi-Type 2000 1 Y N N N N 13 S-ET/L-FT
2.5E-6 (SDS core cooling) 3.5E-8 (SDS-deboration)
NA NA
SDS do not consider AM measures and repair. SDS (deboration) considers the forming of unborated coolant due to evaporation-condensation mode after loss of RHR chains.
Hungary Paks 2 VVER 440/213
1997 updated 1999
1 Y N N N N
All with one or no turbines running (24 POSs)
ET/Ft with POS specific maintenance unavailabilities
3.5E-5 NA NA
Yearly CD probability for a planned refuelling outage.
Italy SBWR Simplified BWR (USA) 1991 1 Y N N Y N Nominal
through LPS ET/FT Not Provided NA NA
Collaboration with General Electric
Italy AP600 Advanced PWR/W 1996 3 Y Y Y N N Nominal
through LPS ET/FT Not Provided
Not Provided
Not Provided
Collaboration with NRC for design

NEA/CSNI/R(2005)11/VOL1
41
Table 5, Summary of LPSD Results
Scope
Country Plant Type Date
Of PRA
Leve
l
Inte
rnal
Floo
d
Fire
Seis
mic
Oth
er
Operating States
Modelled
Method/ Approach
Used CDF
Release Frequency
Early/Latent
Health Effects
Comments
certification
Japan Typical 1100 MWe BWR
BWR/ GE BWR 5
1994 1998: Updated
1 Y N N N N All (7 POSs) ET/FT THERP
1.0E-7/RY NA NA
Japan Typical 1100 MWe PWR
PWR/W 4-loop
1994 1998: Updated
1 Y N N N N All (19 POSs) ET/FT THERP
1.3E-6/RY NA NA
Korea KSNP 1000MW PWR 1994-2000 1 Y N N N N 17 ET/FT 1.73E-6/Y
(mid-loop) NA NA
South Africa
Koeberg 900 MWe PWR (Fr) 2 Units
1997 Updated 1981, 2001
3 Y N N N
Spent fuel, Fuel Handling, Waste Treatment
11 LPSD states with 54 substates
ET/FT 1.35E-5/Y 4.9E-7 (LPSD LERF)
Under review
Spain Asco 1&2 PWR/W Large Dry 1997 1 Y
Not Yet
Not Yet
N N Screening analysis of all POSs
Thorough qualitative and partially quantitative screening. More thorough data and human reliability analyses.
2.2E-5/Y NA NA
Results are average per calendar year. The variability of conditional (i.e., instantaneous) risks during different POSs is discussed in the PSA. It does not provide numerical results.
Taiwan Chinshan BWR4/GE 1996 1998 updated
1 Y N N N N Refuelling shutdown only
ET/FT Modified ASEP
1.5E-6/Y NA NA
Taiwan Kousheng BWR6/GE 1996 1998
1 Y N N N N Refuelling shutdown only
ET/FT Modified
3.0E-6/Y NA NA

NEA/CSNI/R(2005)11/VOL1
42
Table 5, Summary of LPSD Results
Scope
Country Plant Type Date
Of PRA
Leve
l
Inte
rnal
Floo
d
Fire
Seis
mic
Oth
er
Operating States
Modelled
Method/ Approach
Used CDF
Release Frequency
Early/Latent
Health Effects
Comments
updated ASEP
Taiwan Maanshan PWR/W 3-Loop
1996 1998 updated
1 Y N N N N Refuelling shutdown only
ET/FT Modified ASEP
3.2E-5/Y NA NA
USA Grand Gulf BWR Mark III
1994
Phase 1:1 Phase 2:3
Y Y
N Y
N Y
N Y
N N
Phase 1: All POSs (Screening) Phase 2: POS 5 (Cold Shutdown) during refuelling (Detailed)
ET/FT with average plant specific maintenance unavailabilities and simplified HRA ET/FT with plant and POS specific maintenance unavailabilities and detailed human reliability analysis
Not provided 2E-6/Y Internal 2.3E-8/Y Flood >1E-8/Y Fire 7.1E-8/Y 2.5E-9/Y Seismic (1993 LLNL Hazard curve) (EPRI Hazard
NA Not Provided
NA Early fatality risk: 1.4E-8/Y Total latent cancer risk: 3.8E-3/Y

NEA/CSNI/R(2005)11/VOL1
43
Table 5, Summary of LPSD Results
Scope
Country Plant Type Date
Of PRA
Leve
l
Inte
rnal
Floo
d
Fire
Seis
mic
Oth
er
Operating States
Modelled
Method/ Approach
Used CDF
Release Frequency
Early/Latent
Health Effects
Comments
Curve)
USA Surry PWR/W 3-loop Subatmospheric
1994
Phase 1:1 Phase 2:3
Y Y
N Y
N Y
N Y
N N
Phase 1: All POSs (Screening) Phase 2: 3 POSs (Midloop Operation during refuelling and drained maintenance outages)
ET/FT with average plant specific maintenance unavailabilities and simplified HRA ET/FT with plant and POS specific maintenance unavailabilities and detailed human rel. analysis
Not provided 4.9E-6/y-Int 4.8E-6/y-FL 2.5E-5/y-FI 3.5E-5/y-S*
NA Not Provided
NA Early fatality risk: 1.6E-7/Y Total latent cancer risk: 5.5E-2/Y
*using 1993 LLNL Hazard Curve; 8.6E-8/Y seismic using EPRI Hazard Curve
NEA/CSNI/R(2005)11/VOL1
44
2.14 Strengths and Weaknesses of the LPSD PSAs
The responses also provided a perspective on the strengths and weakness of the LPSD PSAs carried out. These are listed below. Strengths are associated, in general, with (1) detailed models, (2) use for any application, (3) systematic approaches, (4) processes that provide confidence, (5) an expanded scope, and (6) performing sensitivity analyses to evaluate modelling weaknesses. Weaknesses are associated, in general, with (1) lack of detail, (2) lack of realism, and (3) lack of model completeness.
Strengths
Strengths noted about the PSAs are:
• The main strength of the analysis carried out is that the model is very detailed, and allows the use of the model and results for practically any application.
• The detailed classification of the POS and related initiating events can be one of the major strengths of the analysis.
• The whole process followed is considered a strength of the analysis: accuracy, level of detail, review process. This process provides the model with a confidence that allow it to be used.
• Complete analysis from full power to cold shutdown and back to full power again.
• A very thorough study of operator actions has been conducted and documented.
• A systematic identification of initiating events and sequences was performed.
• The detailed analysis of the POS initiating events actually analyzed used event and fault trees (i.e., the use of multiple systems to respond to the initiating event).
• The detailed consideration of dependency among human actions within sequences is a strength.
• The performance of sensitivity calculations to understand the impact of various modelling changes.
• The consideration of different outage types and the time window approach are the strengths of the study.
• The main strength is the comprehensive nature of the review of shutdown operation and the advice it has provided back to operations during shutdown.
• The PSA has shown the importance of the initiating events. It has led to significant improvements (procedures, availability of redundancies, …) and led to insights on weak points during LPSD operation.

NEA/CSNI/R(2005)11/VOL1
45
Weaknesses
Weaknesses noted about the PSAs are:
• The main weakness is related to the fact that a detailed model requires a long calculation time.
• The lack of detailed modelling development regarding realistic LPSD conditions is a major weakness.
• Identification of man made initiating events, area events, external events (hazards), Level 2, fault trees (system modelling and dependencies), developing of methods (qualitative and repeatability).
• The main weakness is that some conservative assumptions have been necessary to make (e.g., about system requirements).
• Not modelling some types of initiating events (e.g., maintenance-induced LOCAs) is a weakness.
• Inability to model the complete set of know pre-existing conditions relevant for all outage types.
• Modelling only a single outage (e.g., refuelling).
• The lack of modelling transitions between POSs.
• The details relevant to the progression of accidents and the subsequent development of the source term for conditions unique to shutdown are needed.
• Interactions with the plant need to be closer to ensure that the mitigating strategies modelled are consistent with the plant’s understanding.
• Simplifying assumptions need further analysis.
• A weakness has been the use of average maintenance, which does not cover any ‘specific’ outage and requires data changes in order to model specific POSs.
• Weaknesses may be seen in the completeness with regard to IEs in POSs after refuelling, in other than analyzed outage and a systematic analysis of possible human induced IEs.

NEA/CSNI/R(2005)11/VOL1
46
3. COMPILATION OF RESEARCH IDENTIFIED TO IMPROVE RISK-INFORMED DECISION-MAKING
Desired improvements and research to address risk-informed trade-off decisions have been identified by the CSNI and COOPRA member countries. These needs are provided below by section. A summary of the research identified then follows.
Figure 1 provides a graphical representation of how the identified research corresponds to a full PSA, i.e., from Level 1 through Level 3. Most needs are identified with considerations addressed during the Level 1 analyses. The applications for a LPSD PSA were generally identified under the scope and objective responses.
CSNI
Scope and Objectives
1. Model outage types other than refuelling - Such outages may be unplanned, lengthy, or not drained to midloop.
2. Improve the treatment of unplanned outages- To enhance the completeness of information used in risk-informed decision-making, unplanned outages should be examined. To accomplish this, licensing requirements should be examined to identify conditions that require a plant to perform an unplanned shutdown. Those that do not involve equipment used to mitigate accidents should be eliminated. For the remaining equipment, an efficient method for analyzing the risk associated with the unplanned outage should be developed.
3. Assess the risk contribution of outages that are not refuelling outages and do not necessarily involve going to midloop. This may include shutdowns that do not have cold shutdown as an endstate.
POSs
1. Increase the number of POSs modelled. More POSs would help in risk-informed decision-making. Improving the methods and data for LPSD would be useful, as well as providing guidance on increasing the number of POSs.
2. Develop screening and grouping methods and guidance. Guidance on screening and grouping methods, and guidance, for POSs would help in modelling LPSD PSAs efficiently.

NEA/CSNI/R(2005)11/VOL1
47
OVERVIEW OF RESEARCH TOPICS IDENTIFIED
MATCHED TO FULL RISK ANALYSIS
FRONT-END ANALYSIS
BACK-END ANALYSIS
LEVEL 1 LEVEL 2 LEVEL 3 Initiating event frequency
Core damage frequency / Other Risk Measure
Plant damage state frequencies
Containment event tree/ accident progression analysis
Source term analysis/ LERF
Consequence Analysis Input
Risk Measure
Section
Plant operational states
Initiating events
Sequence analysis
System modeling
Data
Human reliability
analysis
Section
Containment performance
Section
Quantification / * Sensitivity Studies /
Uncertainties
Other Research Topics * * Scope unspecified (may extend beyond Level 1)
Section
Consequence Analysis
NEA/CSNI/R(2005)11/VOL1
48
3. Improve the treatment of transition risk- To enhance the completeness of LPSD analyses, the degree to which transition risk is currently accounted for in shutdown analyses should be identified and the issues associated with transition risk should be investigated and prioritized. For those issues that are deemed a high priority, develop or enhance current techniques to incorporate them into an analysis of shutdown conditions. These types of issues include ensuring modelling consistency between states, incorporating frequencies and conditional probabilities, reflecting current plant operations, scope of the PSA, modelling human errors, etc. Improved data would be useful.
4. Improve the inclusion of pre-existing conditions in the models. Identifying pre-existing conditions important for each POS and including these types of conditions in the model would be an improvement. This would allow use of different baseline models from which to assess changes.
5. Study of time window analysis for the models. The time windows relate time after shutdown to success criteria. Different definitions of time windows may be possible. Also, as supporting thermal hydraulic codes evolve, or if assumptions are changed, the time window analyses may have to be revisited.
Initiating Events
1. Identify events involving combinations of human errors, or combinations of human errors and other failure mechanisms. This would involve a review of past events. The information may identify generic insights that could be used for identification, screening, grouping, or initiating event quantification.
2. Improve the frequency estimate of LOCAs due to pipe ruptures. The frequency of LOCAs due to pipe ruptures is affected by the temperatures and pressures encountered. Reduction factors are applied to account for the smaller frequency as a result of lower temperatures and pressures. Better estimates of these reduction factors would result in more realistic frequency estimates.
3. Improve the current understanding of draindown events and update frequencies- Because past analyses have found that these types of events can be important, past draindown events should be examined to identify factors that influence their occurrence. Frequency of LOCAs due to flow diversions and draindowns can be affected by human errors and outage practices. Events and operational evaluations could be useful in estimating this frequency and in determining what factors influence their occurrence. Risk analyses should be updated to include the data and insights. As part of the supporting work for the above, methods for identifying flow diversion paths and draindown paths should be developed or improved. While this work would help to support the quantification effort, it would also provide the qualitative insights to help improve shutdown operational procedures.
4. Improve the estimates of the transient frequency during low power. Operational practices and control of systems such as feedwater can influence the likelihood of a transient during a shutdown.
5. Update the frequency of over-pressure events at low temperature. Current LPSD practices should be accounted for in the frequency.
6. Improve the treatment of fast-acting reactivity insertions- To help ensure the adequate treatment of this issue, the significance of the following set of issues should be investigated: (1) potential pathways for un-borated water injection, (2) mitigative effects of mixing in the core region and mixing in the piping, and (3) maximum damage that could be expected if a slug of un-borated water moves through the core region. For those issues determined to be important, develop or
NEA/CSNI/R(2005)11/VOL1
49
enhance current techniques to incorporate them into an analysis of shutdown conditions, including a quantification methodology.
7. Improve the treatment of internal fire, flood, and seismic initiators- LPSD analyses have shown that risk from these initiators can be important contributors to specific plants (e.g., fire can be a dominant contributor to CDF). As such, it is important to identify the shutdown-specific conditions and activities that affect internal fire, flood, and seismic analyses. Once done, issues that are already adequately examined using current fire, flood, and seismic methodologies should be identified. The effects on CDF and risk of the remaining issues should be prioritized. For those issues deemed a high priority, develop or enhance current techniques to incorporate them into an analysis of shutdown conditions.
8. Improve treatment of area events.
9. Improve treatment of crane failures associated with heavy load lifts inside containment. Because accidents resulting from crane failures are not usually included in LPSD analyses, develop or enhance existing techniques to model crane failures during LPSD conditions. Also, update the frequency of crane failures.
Sequence Analysis
1. Develop guidance on establishing success criteria.
2. Develop guidance on cold overpressurisation sequence analysis.
3. Enhance the streamlining of accident sequence analysis- Because LPSD risk has been found to be as important as full-power risk, and because resources should be used effectively to identify the more risk-significant conditions, current information should be examined to identify sets of conditions that generally make a plant state more risk-significant, or conversely, make a plant state less risk-significant. Characteristics of initiating events that can make them important even in a less risk-significant state should also be identified. Once identified, guidelines should be developed to determine which conditions and initiating events should be analyzed. To further enhance the wise use of resources, guidance should be developed on how many plant systems (capable of mitigating an accident sequence) to include in the accident sequence development process.
4. Verify by experimentation reflux cooling and gravity feed for the PWR design.
5. Evaluate the fuel temperature transient following a LOCA for the BWR design.
System Modelling
1. Define the margin of conservatism more precisely in code verification, especially in the cooling model for the uncovered fuel.
2. Improve the modelling of boron dilution events. The mixing of injected un-borated coolant and borated coolant in the cold leg was difficult to model.
3. Provide guidance on basic approaches to identify, evaluate, and model system requirements and success criteria.
4. Examine current thermal-hydraulic tools to ensure their efficient operation- Thermal-hydraulic calculations play an important roll in determining both success criteria and the time available for
NEA/CSNI/R(2005)11/VOL1
50
operators to respond to events. To increase the usefulness of thermal-hydraulic calculations, developers of the tools used to perform these calculations should be questioned to ascertain whether the tools function efficiently for shutdown conditions. Selected calculations should be performed to verify efficient operation during selected shutdown conditions. If necessary, areas where efficiency is lacking should be addressed by performing code modifications.
5. Develop guidance on establishing success criteria.- Because establishing success criteria is vitally important to correct accident sequence development, LPSD conditions should be examined to identify those that would affect the determination of success criteria. Guidance should then be developed to facilitate the appropriate consideration of these LPSD conditions.
6. Improve analysis of reflux cooling effect by the steam condensation in the steam generator.
Data
1. Improve databases. Databases for (1) component failure probability, (2) common cause failure probability, and (3) human errors should be improved.
2. Develop failure data for extended operations- To increase the realism necessary for risk-informed regulatory decision-making, currently available data should be examined to ascertain whether or not it is sufficient to produce failure rate estimates for components that experience extended periods of operation during shutdown conditions. If sufficient information is available, appropriate failure rates should be developed for the components.
3. Develop guidance on the correct application of full-power common-cause failure (CCF) models to LPSD conditions- Because correct use or implementation of any PRA model is important, guidance should be developed on what common-cause factors should be reviewed to account for LPSD conditions. Furthermore, specific guidance should be developed on how to adjust full-power CCF models to account for LPSD conditions.
4. Modelling “average” maintenance unavailabilities. Guidance on modelling average maintenance unavailabilities for a baseline risk model is desirable.
HRA
1. Improve HRA used for LPSD conditions- To help ensure that human actions are adequately analyzed during LPSD conditions, LPSD issues that can affect an HRA should be identified and prioritized. For those issues deemed a high priority, develop or enhance existing HRA techniques to incorporate into LPSD analyses. Ascertain whether errors-of-commission are important to LPSD risk. If important, develop or enhance current techniques to efficiently model and incorporate errors-of-commission into LPSD analyses.
2. Improve treatment of techniques to model long recovery times. One area of uncertainty lies in the use of current HRA techniques to estimate human reliability for LPSD recovery times that frequently extend for many hours.
3. Improve dynamic modelling for realistic operator actions.
4. Improve methods and data for modelling errors of commission.

NEA/CSNI/R(2005)11/VOL1
51
5. Improve error factor assumptions. Differences exist in the uncertainties in human error probabilities at FP and LPSD. Human error probability uncertainties are important in risk decision-making.
6. Improve or develop simplified and stable HRA methods. Due to the large modelling effort, it is desirable to improve efficiency.
Quantification / Sensitivity Studies / Uncertainties
1. Develop guidance on incorporating uncertainty and sensitivity analysis techniques into LPSD analyses- To enhance the usefulness of risk information from LPSD analyses and to provide a more complete understanding of what can be important to risk, guidance on using full-power uncertainty and sensitivity techniques as part of LPSD analyses should be developed.
2. An uncertainty analysis method is desirable for the low frequency of human error induced LOCAs.
3. Identify and study possible Markov process applications for low power and shutdown analyses.
Containment Performance
1. Model accident sequence progression. Improvements would help reduce uncertainties in modelling accident sequence progression.
Consequence Analysis
1. Further study of potential source terms. Air-oxidation of the fuel cladding can result in the release of ruthenium. Further study of the potential for air-ingestion into the core region and fuel cladding air-oxidation (e.g., if the vessel head is off) would add to the current knowledge base of this phenomenon.
Other Areas for Improvement and Research
1. Develop guidance on how to use full-power models in LPSD analyses- Because of the importance of systems analysis to probabilistic risk assessment (PRA ) and because conversion of full-power models for use in LPSD analyses is an efficient use of resources, guidance for converting full-power system models into models for use during LPSD analyses should be developed.
2. Development of an on-line maintenance and/or risk configuration control program, such as a risk monitor.
3. Development of methods that are qualitative and repeatable.
4. Comparison of plant designs using PSAs- A frequently quoted weakness of PSAs is that different assumptions and simplifications are the major causes of the differences in the results. It is therefore necessary to compare the PSAs of similar plants to determine if the differences in the results are based on real difference in design and operation of the plants. Such a comparison would also identify unique accident scenarios analysed by one plant but not the others.
5. Establish a LPSD baseline model- To support the use of LPSD risk assessment information in risk-informed regulatory decision-making, a baseline model for LPSD conditions should be developed.

NEA/CSNI/R(2005)11/VOL1
52
The model should account for forced and unplanned outages–at a minimum, accounting for historical forced and unplanned outages.
6. Provide guidance on simplified thermal-hydraulic calculations- Because thermal-hydraulic calculations play an important roll in determining both success criteria and the time available for operators to respond to events, a workshop should be conducted to identify whether simplified thermal-hydraulic calculations are sufficient. If simplified calculations are deemed appropriate, then the minimum set of thermal-hydraulic modelling requirements for these simplified calculations should be identified.
7. Develop LPSD Standards. LPSD PSAs can use many different approaches (e.g., POS modelling). A standard would help to ensure the PSAs are developed in a manner to meet requirements.
8. Investigate potential for spent fuel pool fuel misloading- Since plants are increasing the storage capacity of their spent fuel pools beyond their original limits and fuel misloading is not usually analyzed as part of a shutdown analysis, the current understanding of risk resulting from these activities should be improved. To accomplish this, the process used to develop new spent fuel reracking schemes to achieve additional storage capability should be examined to determine whether or not it is sufficient to prevent potential fuel damage resulting from fuel misloading.
COOPRA
POSs
1. Develop a standardized process, while maintaining the capabilities to accurately estimate POS-specific initiating event frequencies and to select the more important scenarios for detailed analysis.
Initiating Events
1. Perform analyses to determine the frequencies of LOCAs in low power and shutdown states.
2. Develop a detailed methodology to identify and quantify software failures.
3. Develop a simple and better way of considering maintenance unavailabilities connected with the POS definition and screening analysis methodologies. New or adapted software to consider the maintenance schedule part of the plant outage schedule in a LPSD PSA may be necessary.
4. Perform analysis of recovery actions and a methodology for incorporating recovery into LPSD
PSAs.
Sequence Analysis
1. Refine and adapt through appropriate validation and verification of thermal-hydraulic codes against available experimental separate and integral effect tests.
2. Minimize the potential conservatism being introduced for some sequences by more realistic
thermal-hydraulic calculations for low power and shutdown transient or accident scenarios.
3. Study the risk of criticality due to natural primary circulation blockage and the formation of cold water slugs (i.e., boron dilution).

NEA/CSNI/R(2005)11/VOL1
53
4. Develop a consistent methodology based on experimental results and validated analytical methods. This requires (e.g., experimental investigations of flow mixing in the primary circuit and reactor vessel for qualification of CFD codes and modelling of mixing processes and the implementation of mixing models in coupled thermal-hydraulic and 3D neutronic codes for realistic analysis of boron dilution accident conditions.
5. Consider performing mixing experiments to test and verify the correct modelling of the mixing
phenomena.
6. Investigate the issue associated with mixing of boron in more detail to determine whether slugs of pure water can occur and be transported through the core.
7. Perform studies on structural mechanic issues for cold over-pressurization. The objective is to
appreciate in more realistic conditions the importance of the risk related to cold over-pressursation transients.
8. Examine available fire and internal flood risk analysis methodologies to determine whether
enhancements can be made to allow these analyses to be performed in a more cost effective manner.
9. Develop a methodology for developing sequences and crediting recovery beyond 24 hours.
Data
1. Develop a methodology for selecting or identifying the duration of LPSD POSs. This should be supplemented by a methodology for developing sequences and crediting recovery beyond 24 hours.
HRA
1. Perform analysis of recovery actions and develop a methodology for incorporation of recovery actions into LPSD PSA.
2. Improve HRA method for taking into account the problems specific to shutdown situations. These
problems include in particular: a. Omission and commission errors in the application of normal operation procedures b. The recovery actions with important intervention delays c. The dependencies between human actions d. The lack of representative simulator experiments.
3. Extend HRA methodology to take into account knowledge-based behaviour, cognitive errors and
data based on operational experience.
4. Evaluate the effect of introducing symptom-based emergency operating procedures on the risk.
5. Develop guidance on how to recover or even replace equipment into some type of plant operating (or emergency) procedure for the most risk significant scenarios.

NEA/CSNI/R(2005)11/VOL1
54
Other Areas for Improvement and Research
1. Analyze internal fires and floods as well as external hazards such as earthquakes for the low power
and shutdown states.
3.1 Summary of Research Identified
The LPSD PSA approaches, models, insights, and uses are at different levels of progression in the advancement of the technology. The questionnaire responses identify the methods and data that are used and that need further work in order to help make risk-informed trade-off decisions. The scope of improvements and research needs covers the whole set of PSA elements. Insights gained from the responses indicate that the activities which would help in LPSD PSA advancement are generally related to: (1) developing guidance, (2) developing and improving methods, (3) improving and developing databases and updating data, and (4) conducting basic research.
Developing Guidance
Guidance could be developed and used in assessing the application of a FP model to LPSD, developing a LPSD model with a sufficient number of POSs, including and evaluating modelling considerations for an outage type, and addressing key issues that are important for trade-off decision-making. This could be accomplished by addressing objectives identified such as improving the level of detail, modelling efficiency, realism, and establishing standard requirements. Such guidance would help in constructing a PSA that can be used for the intended application and in providing confidence in the results.
Developing and Improving Methods
In addition to developing guidance, methods that need to be improved or developed are identified in the responses. Improvement and development of methods are related to modelling aspects, both deterministic and probabilistic, and to the evaluation and quantification of the PSA elements. Qualitative methods that are repeatable are also desirable. Addressing these issues will improve the technical adequacy of the PSA.
Improving and Developing Databases and Updating Data
Databases for component failure probabilities, common cause failure probabilities, human error probabilities, and initiating event frequencies, and other data to model POSs and differences between POSs need to be improved, developed, or updated. Improving and developing databases and updating shutdown specific data would provide better estimates that are more reflective of LPSD operations. This work would result in better comparisons between POSs.
Conducting Basic Research
The responses have indicated that basic research is needed in some areas. This type of research is mainly associated with performing experiments, evaluating computer codes, or performing studies. These types of activities would help to improve realism, decrease uncertainties, and gain insights.

NEA/CSNI/R(2005)11/VOL1
55
4. INFORMATION RELATED TO ISSUES IDENTIFIED
The above discussions have: (1) summarized the responses to the questionnaire and noted differences between FP and LPSD approaches, (2) identified strengths and weaknesses, and (3) identified improvement and research needs. The detailed responses relate to the issues identified and are provided in the Appendixes. The information contained in the Appendixes provides methods descriptions, for example, in modelling POSs, initiating events, sequence analysis, and HRA. The information may also provide guidance by example of the studies performed to-date.
It is also noted that other organizations have been performing work on related LPSD topics. Their work is noted below for reference.
• International Atomic Energy Agency (IAEA): A report titled “Probabilistic Safety Assessment of Nuclear Power Plants for Low Power and Shutdown Modes” (IAEA-TECDOC-1144) was published in March 2000. In addition, within the framework of its international PSA review team (IPSART) service, IAEA has reviewed two LPSD PSAs for VVER plants.
• European Commission: The European Commission is sponsoring work to harmonize Level 1 and LPSD PSA methods and data.
• American Nuclear Society (ANS): The ANS is developing a LPSD PSAs standard.

NEA/CSNI/R(2005)11/VOL1
56
5. CONCLUDING REMARKS
Existing studies show that the risk measures between FP and LPSD operations can be comparable, and that the risk insights and profiles can be different. LPSD risk analyses are used for decision-making purposes such as for regulatory applications, or for configuration risk management. This report has summarized the current LPSD PSA modelling practices and insights. Data and method differences between FP and LPSD PSAs have been identified that are important in making meaningful risk comparisons and trade-off decisions between these operational conditions. The report has also defined guidance, data collection, methods development, and basic research needs to overcome these differences based on the responses to the CSNI and COOPRA LPSD WG questionnaires. The approaches taken to overcome the differences between FP and LPSD risk assessments should take into account characteristics identified to be strengths. LPSD PSA model strengths include their detail, completeness, and ability to be used for any application, and strengths in the supporting work for a LPSD model include approaches which are systematic, efficient, stable, and realistic.
REFERENCES
1. Vol. 2, Appendix: WGRisk Survey on Low Power and Shutdown PSA
2. Vol. 3, Appendix: COOPRA Survey on Low Power and Shutdown PSA

NEA/CSNI/R(2005)11/VOL1
57
NOMENCLATURE
BWR Boiling Water Reactor
CDF Core Damage Frequency
CNRA Committee on Nuclear Regulatory Activities
COOPRA Cooperative Probabilistic Risk Assessment
CSNI Committee on the Safety of Nuclear Installations
ECCS Emergency Core Cooling System
FP Full Power
HRA Human Reliability Analysis
HEP Human Error Probability
LERF Large Early Release Frequency
LOCA Loss of Coolant Accident
LOOP Loss of Offsite Power
LP Low Power
LPSD Low power and Shutdown
NEA Nuclear Energy Agency
PDS Plant Damage State
POS Plant Operational State
PSA Probabilistic Safety Assessment
PWR Pressuriser Water Reactor
RHR Residual Heat Removal
SBO Station Blackout
SD Shutdown
T&M Test and Maintenance
WG Working Group