improving “just-in-time, just-in-sequence” delivery in ... · improving “just-in-time,...
TRANSCRIPT

UNIVERSITAT POLITÈCNICA DE CATALUNYA OPE – ORGANIZACIÓN DE LA PRODUCCIÓN Y DE EMPRESA (ASPECTOS
TÉCNICOS, JURÍDICOS Y ECONÓMICOS EN PRODUCCIÓN )
Improving “just-in-time, just-in-sequence” delivery in first-tier suppliers
Joaquín Bautista · Jordi Fortuny-Santos (ETSEIB-UPC)
OPE-WP.2015/12 (20151208)
(Documento científico-técnico: 20151208)
http://futur.upc.edu/OPE http://www.prothius.com

Improving “just-in-time, just-in-sequence” delivery in first-tier suppliers J Bautista · J Fortuny
1
Improving “just-in-time, just-in-sequence” delivery in first-tier suppliers
Joaquín Bautista · Jordi Fortuny-Santos ∗
ETSEIB, Universitat Politècnica de Catalunya, 08028 Barcelona, Spain
Abstract
This research was conducted at the Barcelona School of Engineering (ETSEIB) and promoted by the Nissan factory in Barcelona. In this paper, first, the concept of synchronous manufacturing is explored. After several improvement ideas are spotted within the Nissan plant, the paper focuses on the suppliers. An intervention approach is proposed. Suppliers are categorized and selected suppliers are analyzed (by means of three case studies, each one corresponding to a different type of supplier). This research contributes to understanding how synchronous manufacturing and delivery can be extended to suppliers and the existing drawbacks. The critical variables in synchronous manufacturing and delivery and the relations between them are identified in a conceptual model termed the M-S Model. Implications for suppliers are derived, allowing us to improve the performance of the whole synchronous manufacturing system. A piece of software is developed to help companies schedule a smooth flow of components, making synchronous manufacturing easier. Results may help decision makers develop a supply management system, including policies, procedures and the necessary resource deployment. Keywords: Lean manufacturing, Douki Seisan, automotive industry, synchronous manufacturing
1. Introduction
“Production of the redesigned, aluminum-bodied Ford F-150 has been slowed by a shortage of frames from a supplier’s plant in Kentucky, according to workers and a UAW official” (Bunkley, 2015). This quotation from Automotive News shows the importance of suppliers for OEMs (Original Equipment Manufacturers, such as Ford Motor Corporation). Shortage of frames causes a slowdown in the production of trucks (“Ford is canceling Saturday’s overtime shift at the Kansas City plant because it doesn’t have enough Metalsa-supplied frames”) and therefore a failure to meet customer demand( “Demand for our F-150 is sky high”).
Fifty years ago, a car assembler dealt with more than 2,000 suppliers (Womack et al., 1990), but today, rather than coordinating all the suppliers, an assembler deals with a small number of companies, referred to as first-tier suppliers, which deliver aggregate parts or entire systems (Klier, 1994). The others fall into the second and third tiers of the supplier pyramid. Since
e-mail: [email protected] (J Bautista)· [email protected] (J Fortuny)

Improving “just-in-time, just-in-sequence” delivery in first-tier suppliers J Bautista · J Fortuny
2
this system has greater informational efficiency (Klier, 1994), the thesis of the authors of this paper is that situations such as the one described by Bunkley can be improved with a better coordination between the OEM and its first-tier supplier, on the basis of the principles of synchronous manufacturing and with the help of a management system. This hypothesis is backed by the findings of Liker et Wu (2000) that the performance of American suppliers depends on the specific customer. Suppliers perform much better when they are supplying Japanese automakers such as Honda, Nissan or Toyota than when they are supplying American automakers such as Ford, GM and Chrysler. In consequence, the logistics practices and the management policies of the automakers on supply-chain management seem to have a profound impact on the supplier’s ability to deliver parts just-in-time.
Currently, industrial companies heavily rely on management systems, as evidenced by the 1,138,155 organizations certified according to ISO 9001 quality management standard and the 1,6091,294 certificates (ISO 9001, ISO 14001, ISO/TS 16949, and so forth) issued worldwide in 2014 (ISO, 2015). Management systems can be defined as documented systematic frameworks designed to manage an organization's policies, procedures and processes, aimed at smooth functioning through standard practices, in order to build sustainably organizations and to promote continuous improvement with tested tools and techniques. This approach is related to the contingency theory of organizational structure (Pfeffer, 1982), which states that companies adapt their structures to the changes promoted by contextual factors in order to improve their performance (Luo et Donaldson, 2013).
In consequence, our research should develop an innovative system to support the management of just in time, just in sequence supplies. This should help decision makers establish policies, procedures, processes, standard practices, a certain organizational structure and allocate human, material and financial resources needed to deploy supply management, while taking into account the variables involved in each particular case. Beach et al. (2001) contend that a holistic approach to research design should be adopted when carrying out this type of production management research because the study of topics such as strategic flexibility cannot rely on quantitative methods alone, which fail to capture the essence of the issue. The qualitative research methodology is based on interviews with engineers and area managers at Nissan’s Barcelona plant and some of its suppliers. Following Schwandt (2000), academics from Barcelona School of Engineering (ETSEIB) were directly involved with Nissan’s participants (Bautista, 2004) in an attempt to fully understand requirements and issues by means of collaborative work on this project.
The rest of the paper is organized as follows:
In order to satisfactorily fulfill a research project for a company, it is necessary to know such company’s needs and wants and to understand their reasons. In our case, that means knowing Nissan Production Way (NPW) and how it differs from the general lean manufacturing paradigm, which is based on Toyota’s production system. Although there are not many references in literature, in section 2, the fundamentals of NPW are discussed. Both the importance of synchronous manufacturing (or Douki Seisan) for Nissan and how it is different from Toyota’s lean manufacturing are highlighted. In section 3, we review the starting situation at Nissan’s plant and we plan a desirable but achievable situation. We list the benefits that new situation would convey. Once, there is a plan to solve the internal problems at Nissan, its philosophy can be extended to suppliers. In section 4, we develop an intervention model or a roadmap for the development of suppliers. In section 5, suppliers are classified into three groups according to their ability to manufacture and deliver parts in

Improving “just-in-time, just-in-sequence” delivery in first-tier suppliers J Bautista · J Fortuny
3
synchronicity with the car manufacturer, and a supplier from each group is selected for this project. Suppliers are analyzed and opportunities for improvement are spotted. In sections 5 and 6, a conceptual model is derived from previous phases in order to explain the relationships between relevant variables. These relationships allow us to draw conclusions for Nissan and its suppliers in order to improve their ability to manufacture in synchrony. Finally (section 6), a decision-aid piece of software is developed.
2. The Nissan Production Way and the Douki Seisan concept
After World War II, Japan’s priority was to re-build its economy, and probably many companies shared the same goals. With none of the financial resources or economies of scale available to the American auto giants, the Japanese automotive industry realized that, if they were to take on the American automakers, they would have to work in a different way. However, each company developed its own method.
In the 1970s and 1980s, Japanese companies in a number of industries started conquering western markets. Quoting Cusumano (1989) “By the early 1980s, the Japanese automobile industry had become famous throughout the world for the quality of its products as well as for the productivity of its labor force.” It became evident that low prices could not be justified by low wages (Hayes et Pisano, 1996). The transplants of Japanese companies to the United States proved that North American employees achieved as good results as Japanese workers. Hayes et Pisano (1996) concluded that a new paradigm of manufacturing management had emerged.
The term “lean manufacturing” was coined at the MIT’s International Motor Vehicle Program (IMVP) (Holweg, 2007) and it refers to a system that requires less resources as compared to American mass production methods. Although Krafcik (1988), from the IVMP, was the first person who used the word “lean” in a research paper, Womack et al. (1990), also from the IVMP, made the term “lean” known worldwide through their books and they identified “lean” with the Toyota Production System (TPS) (Wolf, 1991), also known as “Just-in-Time” or JIT (Sugimori et al., 1977) because in Toyota’s low-inventory, mixed-model approach material was pulled “just in time” through the manufacturing process at the order of kanban cards. “Lean” also refers to Toyota’s fight against consumption of resources in wasteful activities (such as transportation tasks, keeping and managing inventory, unnecessary motion, waiting, over-production, unnecessary work and lack of quality) that do not add value to the product (Ohno, 1988).
The Nissan Production system was first studied and compared with TPS by Cusumano (1989). After the War, Nissan developed their own tools based in their own principles, and therefore in the 1980s its manufacturing systems were different to that of Toyota -although some methods were the same such as the “action plate method” or Kanban-. The differences include a preference for automation and information systems in Nissan. In 1971, Nissan started using a computerized system “to coordinate vehicle orders with materials and component procurement, in house parts production, transport and final delivery of completed automobiles to dealers” (Cusumano, 1989). In consequence, while Toyota focused on waste, Nissan focused on synchronicity, but both techniques contribute to streamline production and to avoid inventories.
While Toyota was developing TPS, it surely benefited from the experiences and innovations of Honda, Kawasaki, Nissan and others (New, 2007). After the Oil Crisis, the Toyota Production System began to spread across Japan. Some companies became pupils of Toyota

Improving “just-in-time, just-in-sequence” delivery in first-tier suppliers J Bautista · J Fortuny
4
and therefore, their production systems, such as the Kawasaki Production System, (Production engineer, 1988) are based on TPS (Yonemitsu, 1999). However, the systems developed by other companies such as Nissan, Canon or Honda , which share principles and tools with Toyota, seem not to have captured the attention of the western audience (Arnold, 2007). However, Nissan’s production system may interest western companies, because the synchronization philosophy of Nissan is adequate for the characteristics of western-type low-volume, high-variety, high-tech manufacturing (Netland, 2012).
Nissan developed the Nissan Production Way (NPW) to outline its synchronized production philosophy. The idea was to manufacture according to the real consumer order, thus coordinating all operations and materials. Based on Gemba Kanri or Shop-floor management (The factory is managed based on the real situation on shop-floor compared to the plan) (Netland, 2012), the NPW, as defined in 1994, is made up of two basic principles: the never ending synchronization with the customer, in terms of quality, cost and time (this is different from Toyota’s JIT pull system) and the never ending quests to identify problems and put in place solutions (like the continuous improvement –or kaizen- pillar of TPS). To support the overall objective of synchronous manufacturing, Nissan employs several complementary tools and techniques (Szwejczewski et Jones, 2012) such as JIT, Total quality management (TQM), Total Productive Maintenance (TPM) and the so-called QC Story (QCS) problem solving technique (Kume, 1992).
Established in 1997 (De Goldfiem, 2003), the spinal cord of NPW is Douki Seisan (DS) or synchronous flow. DS can be described as a manufacturing methodology that transfers customers’ orders to all the processes at same time in order to achieve a continuous and smooth production flow without defects, without breakdowns, without inventories (Lotfi et al., 2014) helping cut lead time across the supply chain. The ideas of flow, quality, low inventories and machine availability are shared with the TPS. Synchronous manufacturing requires sharing information along the supply chain and efficient procurement and manufacturing systems without any disruptions. Thus, manufacturing (in terms of types and quantities of products) can be scheduled and sequenced and all processes can start their operations. This conception is very different to traditional batch-and-queue manufacturing where the number of units that are manufactured is different from the number of units requested by the customers and products are manufactured beforehand: Sometimes too soon, making inventories pile up, and sometimes too late, leading to stock-outs.
DS requires keeping the manufacturing sequence that was previously scheduled for the mixed-product assembly lines (Bautista et Cano, 2008). As a consequence, all processes can manufacture parts and subassemblies according to the same schedule and a reliable and smooth operation of the manufacturing process, without much delay and with few inventories between stations, is possible. Otherwise, synchronicity gets lost and inventories increase, both spontaneously (because of the lack of coincidence between the parts manufactured by a certain supplier and the parts used in Nissan’s assembly line) and in a planned way because “just-in-case” inventories are necessary to assure the availability of parts.
To comprehend all the elements in the supply chain, DS can be divided in five different categories (Our paper is mainly devoted to category 3):
C1. Category 1: The order in which vehicles are manufactured sticks to the scheduled deadline and scheduled sequence. This includes all the steps from the manufacturing process including welding, painting and final assembly.

Improving “just-in-time, just-in-sequence” delivery in first-tier suppliers J Bautista · J Fortuny
5
C2. Category 2: Parts and subassemblies manufactured in the Nissan’s facilities flow toward the assembly line as they are processed in perfect synchronicity.
C3. Category 3: Integrated scheduled production and delivery. Suppliers are synchronized with the assembly line and they produce according to the schedule (make-to-order) and also deliver according to the schedule. In production logistics, this last feature is also known as “Just in Sequence (JIS)” delivery, which is an advancement of JIT because the supplier not only ensures that the necessary parts are delivered in time in the necessary quantity, but also that the sequence of the parts is correct (Siemens, 2015). Components arrive at an assembly line in a specific order at the moment they are needed and workers on the assembly line can unpack them directly from shipping containers and install them, without a stop in storage or the need for sorting. As a result, companies minimize the amount of supplies they have in storage to cut costs and streamline operations. Otherwise, since in car manufacturing many components from a variety of sources have to be pulled together, if the car assembler keeps inventories for the assembly line, it sinks capital, it needs warehouse space to store them and it needs resources for handling them. Resources would be consumed in an inefficient way, and the OEM might experience situations where the company was in urgent needs for parts, but had to wait because the supplier was neither flexible enough nor used to rapid delivery (WiseGEEK, 2015). Helper (1991) empirically found that, in order to enhance long-term competitiveness, it is important to encourage suppliers to develop capabilities of JIT production and delivery. Monden (1994) stated that JIS is absolutely necessary to avoid inventories when products have many versions and parts are big.
C4. Category 4: Transportation facilities (ships, trucks) are managed in order to avoid delays in delivery and final products waiting to be shipped.
C5. Category 5: DS aims at synchronization with the customer. Order lead time (time from customer order received to customer order delivered) has to be short (car assembled and delivered to customer within two weeks of order). This requires a flexible manufacturing system and the cooperation of the dealers and the sales department.
3. The initial situation vs. the desired situation
A task force -made up of several ETSEIB faculty and some engineers from Nissan- discussed key issues related to synchronous manufacturing, defined the starting point, the objectives and possible approaches. Interviews with engineers from Nissan’s plant and seven visits to the factory allowed the researchers to understand the different production processes and to model them according to the SIPOC (Suppliers-Inputs-Process-Outputs-Customers) method which is used in process improvement (Parkash et Kaushik, 2011). The manufacturing of each vehicle starts with the production of parts in the suppliers’ premises, continues with the assembly process and ends with the delivery of the car to the client. Each step has its own customer and each step is related to others: a problem in one operation affects the downstream processes. Researchers followed the process from the moment a car frame is picked, taken to the line where the floor pan pieces are welded together and the power train components are placed onto the chassis. The body is built up on a separate assembly line from the chassis. When the process is finished, the body is taken to the painting process. The painted shell proceeds through the interior assembly area where workers assemble seats, door and trim panels, and many other parts of the vehicle. The body and chassis assemblies are mated near the end of the production process. For a quick reference, see Advameg (2015).

Improving “just-in-time, just-in-sequence” delivery in first-tier suppliers J Bautista · J Fortuny
6
Mainly due to problems in the paint processes, many times the original sequence is changed. Besides, except some large parts, suppliers do not deliver parts in synchronicity with the manufacturing process. In consequence, Nissan and the suppliers have to keep inventories. The performance of the manufacturing process is measured through some quantitative indicators:
• Actual Production Lead time (APLT). In Nissan, this term refers to days of work-in-process inventory (WIP). It is measured as the time, in days, that the manufacturing process can be fulfilled with the available inventories (Equation 1).
𝐴𝑃𝐿𝑇 = 𝑊𝐼𝑃!"#$%&& 𝐷𝑎𝑖𝑙𝑦_𝑝𝑟𝑜𝑑𝑢𝑐𝑡𝑖𝑜𝑛!"#$%&&∀ !"#$%&&
(1)
• Scheduled Sequence Achievement Ratio (SSAR). Equation 2 shows the percentage of vehicles that keep the scheduled sequence. A vehicle is considered correct (OK) when it has not been overtaken by another vehicle according to the scheduled sequence and incorrect when it has been overtaken by one or more vehicles (Van der Merwe, 2010). If the scheduled sequence is 1-2-3-4-5-6-7-8 (numbers represent the position in the sequence of the scheduled vehicles) and the real completion order is 4-3-2-1-8-7-6-5, only two vehicles (4 and 8) would be OK, yielding a SSAR value of 25 per cent (see Figure 3).
𝑆𝑆𝐴𝑅!"#$ = 𝑉𝑒ℎ𝑖𝑐𝑙𝑒𝑠_𝑛𝑜𝑡_𝑜𝑣𝑒𝑟𝑡𝑎𝑘𝑒𝑛!"#$ 𝑇𝑜𝑡𝑎𝑙_𝑣𝑒ℎ𝑖𝑐𝑙𝑒𝑠!"#$ (2)
• Scheduled Time Achievement (STAR). Equation 3 shows the percentage vehicles that reach the end of the process on time (less than ±1 hour with respect to the scheduled time). This indicator dramatically worsens when the scheduled sequence changes.
𝑆𝑇𝐴𝑅!"#$ = 𝑉𝑒ℎ𝑖𝑐𝑙𝑒𝑠_𝑜𝑛_𝑡𝑖𝑚𝑒!"#$ 𝑇𝑜𝑡𝑎𝑙_𝑣𝑒ℎ𝑖𝑐𝑙𝑒𝑠!"#$ (3)
Besides solving the above mentioned internal problems, performance indicators would improve with DS category 3 concept, which is related to the suppliers. The desired situation can be expressed as:
(a) The scheduled sequence should be reliable. Therefore, it should not be changed, keeping SSAR over 90%.
(b) Suppliers must know the information about the scheduled sequence sufficiently in advance.
(c) This way, suppliers may manufacture their products according to their client’s sequence and put them in bins. This way, the risks associated with batch manufacturing (inventories and shortages) are removed.
(d) Transportation to the client’s plant should be done in sorted containers, full of sorted bins. Workers on the assembly line would easily find, just-in-time, the parts that they need, in the required order.
Besides, the achievement of the above goals would help to improve the results of other important objectives (Thun et al., 2007) such as:

Improving “just-in-time, just-in-sequence” delivery in first-tier suppliers J Bautista · J Fortuny
7
(i) Reduction in the inventories of parts and components. This reduction is based on shorter production runs. However, frequent setups leave less time for production and applicability of this method requires a tradeoff between holding cost and setup cost.
(ii) Reduction in the amount of plant space taken up by the inventories. The free space can be used, if desired, to increase the capacity of the system.
(iii) Reduction in logistic costs (Gudehus et Kotzab, 2012). Less inventories convey less warehouses and all the associated costs (rent, handling, maintenance...).
(iv) Product availability and wait time. Synchronization between supplier and automaker may reduce the chance of experiencing stock-outs.
(v) Flexibility of the production process. Short production runs allow short manufacturing lead times and quick changes from one product to another.
(vi) New product launch. Market competition drives manufacturers to continuously offer new products. New product launch requires flexibility.
4. The development of an intervention framework
As stated before, the first problem to solve is the internal lack of compliance with the scheduled sequence. The next step to improve DS is to extend synchronous manufacturing and synchronous delivery to suppliers, aiming at the achievement of DS category 3, in order to remove batch manufacturing (and its associate risks of overstocks and shortages). The importance of JIT-JIS procurement, and the fragile conditions it relies upon, were already stated by Ford (1923) “We have found in buying materials that it is not worthwhile to buy for other than immediate needs…If transportation were perfect and an even flow of materials could be assured, it would not be necessary to carry any stock…Raw materials would arrive on schedule and in the planned order and amounts, and go from the railway cars into production.” Currently, the integration of suppliers, based on building and maintaining a long term relationship, through collaborative risk, cost and information sharing (Sánchez and Pérez, 2001) is a key principle of lean manufacturing. Even quality management standards state that management should establish relationships with suppliers and partners to provide and facilitate communication with the aim of mutually improving the effectiveness and efficiency of their processes (ISO, 2009). This way, supplier relationship management becomes mandatory for certified companies.
The research strategy adopted was a multiple case study as prescribed by Yin (2009). Its tools follow the basic methods of the case study: Interviews and in situ observations. As for the objectives, this research is in part descriptive as it depicts the manufacturing and distribution practices adopted by the studied companies. However, It is also exploratory (Maxwell, 2004) and. since qualitative research is inductive, not deductive, this paper does not try to give empirical support to any well-known theories but to develop a model from the results of the study. Our knowledge of the DS and JIT-JIS concepts allows us to analyze the variables implied in synchronous manufacturing and delivery, providing greater insight into this topic.
In the early stages of the project, eight suppliers where considered to take part in this study, in order to gain insight into the characteristics of the automotive industry (different technologies, different ways to manage operations). However, the research team spotted some drawbacks in that approach: many resources and efforts would be devoted to compiling information on the suppliers, the way they actually worked, and trying to improve their operations. Maybe it

Improving “just-in-time, just-in-sequence” delivery in first-tier suppliers J Bautista · J Fortuny
8
would even be necessary to reach a global agreement with the suppliers. Researchers understood that the project should not focus on the way suppliers work but it should develop a new way of working, based on the advantages of synchronous manufacturing and help selected suppliers achieve the goals of DS.
Finally, we worked with only three companies. Each one corresponded to a different type of supplier. This research criterion of “theoretical sample” (Strauss et Corbin, 2000) refers to any type of purposeful sampling, in which the research team selects cases based on their broad potential of contributing to the development and testing of theoretical propositions, in contrast to the concept of statistical sample. Consequently, we believe that our experience can be generalized to develop a model for assessing and improving the suppliers’ ability to manufacture and deliver parts according to the DS philosophy.
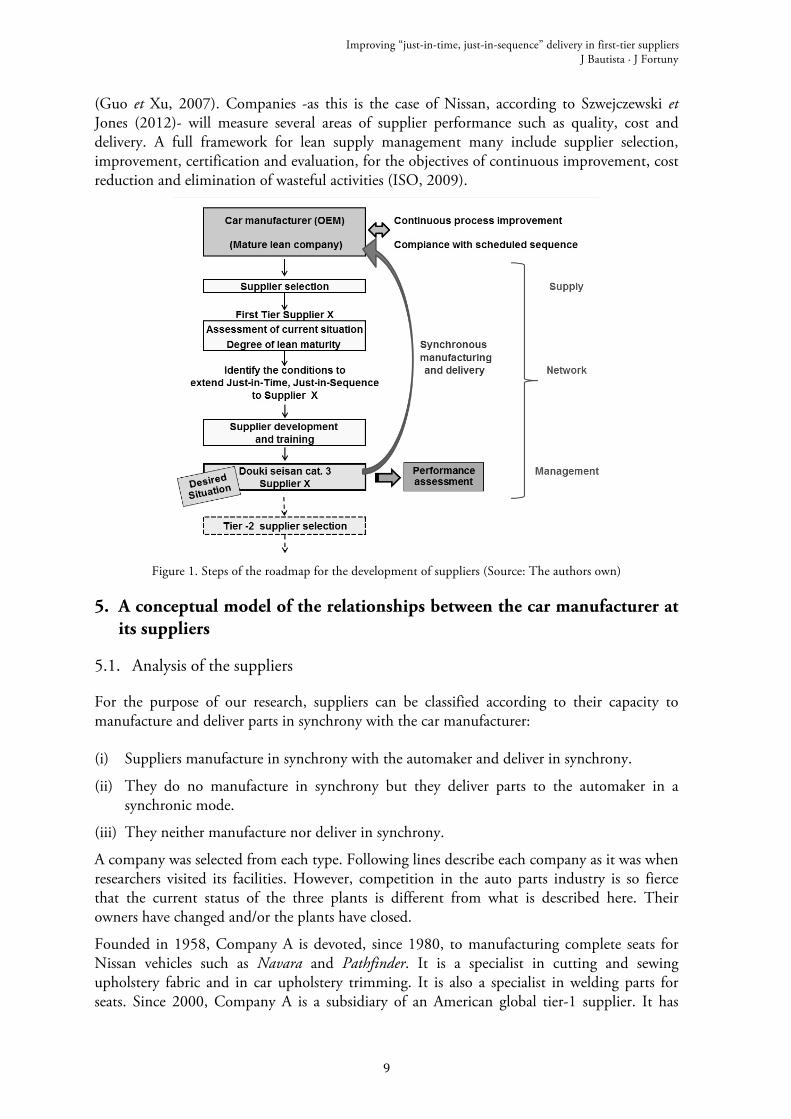
Again, for every supplier, an improvement project requires assessing the present situation, defining the desired situation and finally discovering how to reach the final situation from the starting point. We have developed and intervention framework or roadmap for the development of suppliers (Figure 1) that includes several steps: selection of a supplier (previously done); assessment of the level of leanness of the supplier, its experience in synchronous manufacturing and delivery and its willingness to adopt such practices; convenience and difficulties to implement or to improve synchronous manufacturing and delivery; supplier development; performance assessment.
The situation of each company on the maturity path to lean manufacturing and its capacity and willingness to adopt lean tools was assessed by means of interviews. Some models are available to formally evaluate lean practices that refer to important issues such as inventory, team approach, processes, maintenance, layout and handling, scheduling and setup, suppliers, or quality (Almomani et al. (2014). A method followed by several researchers in literature (Taj, 2005), because of its simplicity, is the Strategos Lean assessment tool (SLAT) developed by Quarterman Lee at Strategos Inc. (Lee, 2015). Depending on the level of leanness, and following the work of MacDuffie et Helper (1999) about suppliers of Honda in North America, it may be necessary to help suppliers change their production systems in order to align it with the lean manufacturing philosophy (Liker et Wu, 2000).
The following, crucial, step is to identify the necessary conditions for suppliers to operate on a JIT, JIS basis. Some studies on manufacturer-supplier relationship focus on supplier integration in product development, in quality program, long term relationship, on time delivery, frequency of schedule changes, extent and mode of information interchange, and so on (Sharma et al., 2011). These studies describe the quality of the relationship, but they do not analyze the Physics that make synchronous manufacturing possible. The quantitative effect (in terms of cost) on the supplier of different lot size strategies has only been studied by David et Eben-Chaime (2003). They conclude that imposing a lot-for-lot production on the supplier is uneconomical and delivery on demand can be met without intervening in the supplier’s operations. Surely this independence from the OEM is true. However, David et Eben-Chaime rely on EOQ-type equations, which assume constant demand, which is not the case. They also argue that changeover hampers short production runs. Notwithstanding, SMED (Single minute exchange of dies), one of the tools of Toyota’s lean manufacturing, allows companies to reduce changeover time (Cakmakci, 2009) and therefore its setup cost, while freeing time for manufacturing and making smaller lots possible.
The last step is the assessment of the supplier in terms of the degree of synchronicity achieved. The global measurement of supplier performance is an important part of supplier management
Improving “just-in-time, just-in-sequence” delivery in first-tier suppliers J Bautista · J Fortuny
9
(Guo et Xu, 2007). Companies -as this is the case of Nissan, according to Szwejczewski et Jones (2012)- will measure several areas of supplier performance such as quality, cost and delivery. A full framework for lean supply management many include supplier selection, improvement, certification and evaluation, for the objectives of continuous improvement, cost reduction and elimination of wasteful activities (ISO, 2009).
Figure 1. Steps of the roadmap for the development of suppliers (Source: The authors own)
5. A conceptual model of the relationships between the car manufacturer at its suppliers
5.1. Analysis of the suppliers
For the purpose of our research, suppliers can be classified according to their capacity to manufacture and deliver parts in synchrony with the car manufacturer:
(i) Suppliers manufacture in synchrony with the automaker and deliver in synchrony.
(ii) They do no manufacture in synchrony but they deliver parts to the automaker in a synchronic mode.
(iii) They neither manufacture nor deliver in synchrony.
A company was selected from each type. Following lines describe each company as it was when researchers visited its facilities. However, competition in the auto parts industry is so fierce that the current status of the three plants is different from what is described here. Their owners have changed and/or the plants have closed.
Founded in 1958, Company A is devoted, since 1980, to manufacturing complete seats for Nissan vehicles such as Navara and Pathfinder. It is a specialist in cutting and sewing upholstery fabric and in car upholstery trimming. It is also a specialist in welding parts for seats. Since 2000, Company A is a subsidiary of an American global tier-1 supplier. It has

Improving “just-in-time, just-in-sequence” delivery in first-tier suppliers J Bautista · J Fortuny
10
more than 250 employees. Company A is a type one company because seats are manufactured in synchronicity with the automaker and delivered in synchronicity. Since 1989, Company A’s facilities are located in El Prat de Llobregat, 5 km away from Nissan's plant (Zona Franca). Company A also delivers seats to Seat in Martorell. When the company was visited, the lay-out for a new vehicle was being planned: three families of products (seats) would be necessary for the different configurations of the SUV, and they would be manufactured in two mixed-model lines, one for the front seats and another one for the back seats. Additional products would be made in a work cell.
Company B, performs "synchro" deliveries to Nissan of plastic auto interior parts (such as instrument panels and door trim panels) from a nearby warehouse which keeps a couple of days in inventory. The warehouse is replenished from the supplier's plant, where parts are manufactured in batches. Founded in 1990, Company B was first a subsidiary of a French company, specialized in the manufacturing and commercialization of plastics. Since 1999, Company B is a subsidiary of a North American manufacturer, spun off from Ford Motor Company. The facilities of Company B are located in Igualada, 69 km away from Nissan. Company B has nearly 200 employees. Company B manufactures plastic parts for Seat and, mainly, for Nissan.
Company C, with 500 employees, is a family-owned company born in Barcelona in 1947. Since 1991 it has been stamping parts for Nissan and other companies, such as the full frame assembly for Nissan Pathfinder SUV and Nissan Navara Pick up (around 200,000 vehicles per year) in its facilities in Sant Andreu de la Barca, 27 km away from the Nissan factory. Company C neither manufactures nor delivers in synchrony. Since it was considered a strategic supplier, Nissan bought Company C in 2006 in order to guarantee the availability of frames, their quality as well as the competitiveness and survival of Company C.
5.2. Detection of improvement opportunities
After the analysis of the selected suppliers, the research team highlighted four different problems whose study seemed to be feasible and the solution of which would contribute to the category 3 DS objective, mainly taking into account that the car manufacturer was about to launch a new model into the market:
(i) To compute the lot size that would yield a better synchronicity for a given demand and for a known production rate and setup time.
(ii) To compute the transfer lot size (and frequency) taking into account the existing constraints about transportation from the manufacturing plant to the buffer warehouse in order to improve synchronicity.
(iii) To compute the transfer lot size (and the response time between order release and order receipt) taking into account the existing constraints about transportation the buffer warehouse to the car assembly plant in order to improve synchronicity.
(iv) To compute WIP in the manufacturing plant and in the buffer warehouse as a function of the degree of synchronization between the supplier and the OEM.
5.3. The M-S model
In order to solve the previous questions, a conceptual model is required. It is a set of concepts and rules that represent the logic relationships between the elements of the empirical situation.

Improving “just-in-time, just-in-sequence” delivery in first-tier suppliers J Bautista · J Fortuny
11
It can be derived from the relevant elements found in the “analysis” and “detection of improvement opportunities” stages. After that, the following step would be to develop indicators that would allow the companies to capture the situation, performance and evolution of the integrated scheduled production and delivery system towards the goal of DS. These indicators ought to show the results of the managerial decisions and would allow comparisons between companies.
The relationship between a company and its supplier can be modelled (see Figure 2) as the relationship between two systems (Bautista, 2004). The Main (M) system has several attributes such as a sequence of units that has been previously scheduled (Sm), a vector of time values (tm), including cycle time, process time, setup time. In turn, the Supplier system (S) has a sequence of units (Ss) that can be similar or not to Sm; and their own time vector (ts). Between M and S, there is a flow of information and a flow of physical products. M has to send information about the schedule (Sm) to the Supplier sufficiently in advance (tms), where tms is the response time of the Supplier. tsm is the transfer time vector from the Supplier to the Main system and qsm is a vector of transfer lots from S to M.
The M-S model can be extended like a net of elemental relationships because a company may have several suppliers and, in turn, a supplier may have their own supplier(s).
Since Company A is very close to Nissan’s factory, tsm is as small as 10 minutes and frequent deliveries are possible. Every 15 minutes, a 15 minute-sequenced schedule for the following 15 minute time cube is available (tms). Short production runs and small delivery lots are possible, making DS possible. However, Company B is further away. One hour (tsm) is necessary to take parts to Barcelona. Besides, some processes have long setup times (ts). In consequence, the response time (tms) of this supplier is high, hindering synchronicity. Nissan has to send information on Sm in advance while Company B has to reduce the setup time in order to reduce lot size and response time.
If the distance from the supplier facilities to the Nissan factory played an important role in achieving synchronous manufacturing, Company C was not so far away from Barcelona, so synchrony seemed possible to achieve. According to Szwejczewski et Jones (2012), the suppliers of the Sunderland Plant (United Kindom), which are based within 50 km of the factory, deliver the required parts in the right order every two hours to match the specifications of each vehicle. It was suggested that an approximate sequence should be available six days in advance (which is the global maximum tms allowed by Nissan. When a car body comes out of the painting process (as stated before, this step seems to make pre-scheduled sequences fail) it moves to the Painted Body Storage area, where body shells are sorted (as much as possible) according to the scheduled sequence. The corresponding chassis will be required in 72 minutes. Therefore, the real tms for Company C is 72 minutes. To achieve this goal, it is necessary to implement a warehouse near Nissan’s plant (500 m). Company C manufactures car frames according to the approximate schedule, and sends them to the warehouse in groups of 16 units (two containers with 8 frames each). Once the real schedule is known (bodies coming out of the painting process), frames can be sent to Nissan’s chassis line just-in-time, just-in-sequence in groups of five or ten.

Improving “just-in-time, just-in-sequence” delivery in first-tier suppliers J Bautista · J Fortuny
12
Figure 2. The M-S model: The relationship between a company (M) and its suppliers (S) · Source: Adapted from
Bautista et Fortuny (2015). LEGEND · Sm: sequence of units (vehicles) in the main system; Ss: sequence of units (parts) in the supplier system; tm: time vector in the main system (cycle time, process time, set-up time...); ts: time vector in the supplier system; tsm: transfer time vector from the supplier to the main system; tms: response time of
the supplier; qsm: vector of transfer lots from supplier to the main system.
6. Practical implementations
According to the improvement opportunities detected in the plant tours and interviews with the suppliers, four problems can be defined:
• Given the bill of materials (BOM) of a system and a production plan, find the ideal sequence of finished products that maximizes regularity in the consumption of parts and components.
• Given a sequence Sm, a sequence Ss and all other attributes of M and S, determine the existent degree of synchronization between both sequences. Find the inventory level required to meet a certain production plan.
• Given a sequence Sm, determine a sequence Ss that maximizes the degree of synchronization between both sequences. Determine the inventory levels required to meet a certain production plan.
• Given a production plan, determine the sequence Sm that minimizes the value of the average inventory in the system for a certain degree of synchronization. This problem falls out of the scope of the study.
Since regularity in manufacturing favors synchronous production and delivery (Monden, 1994), we study what sequence Sm causes an even consumption of parts. The lack of regularity of a sequence in M can be measured through the irregularity rate index (SQD) (Bautista et al., 2000). The SQD index is the sum of the quadratic discrepancies between the real consumption of each part, cycle by cycle, and the ideal consumption of each part, which corresponds to consumption at a constant pace (Equation 4). All parts and components are included in this index on a cycle basis. Obviously, besides an ideal consumption of parts, DS requires that this consumption coincides with the demand of parts caused by Sm.
𝑆𝑄𝐷 = 𝑅𝑒𝑎𝑙 𝑐𝑜𝑛𝑠𝑢𝑚𝑝𝑡𝑖𝑜𝑛 − 𝐼𝑑𝑒𝑎𝑙 𝑐𝑜𝑛𝑠𝑢𝑚𝑝𝑡𝑖𝑜𝑛 !
∀!"#$∀!"#$%
(4)
Synchronous manufacturing and delivery between S and M is not always feasible because a variety of conditions about lead times and quantities must be met. However, even if S is able

Improving “just-in-time, just-in-sequence” delivery in first-tier suppliers J Bautista · J Fortuny
13
to manufacture and deliver JIT-JIS, synchronization will not be always achieved. In order to monitor the degree of synchronicity between a real sequence and an ideal one, with the experience of SSAR (Equation 2) and STAR (Equation 3), we define two new indicators (Lead time, as defined in Equation 1, is also used):
• The Scheduled Sequence Achievement Ratio Extended (SSARX) measures the percentage of parts that are not overtaken by parts from lots which should have been processed beforehand. If the scheduled sequence is (1-2-3-4)-(5-6-7-8), where parenthesis show the lots, and the real completion order is 4-3-2-1-8-7-6-5 (see Figure 3), SSAR is 25 % but SSARX is 100% because lot 2 never overtakes lot 1 (Equation 5).
𝑆𝑆𝐴𝑅𝑋 =𝑃𝑎𝑟𝑡𝑠 𝑢𝑛𝑑𝑒𝑟 𝑐𝑜𝑛𝑡𝑟𝑜𝑙 𝑛𝑜𝑡 𝑜𝑣𝑒𝑟𝑡𝑎𝑘𝑒𝑛 𝑏𝑦 𝑝𝑎𝑟𝑡𝑠 𝑓𝑟𝑜𝑚 𝑝𝑟𝑒𝑣𝑖𝑜𝑢𝑠 𝑙𝑜𝑡𝑠
𝑇𝑜𝑡𝑎𝑙 𝑎𝑚𝑜𝑢𝑛𝑡 𝑜𝑓 𝑝𝑎𝑟𝑡𝑠 𝑢𝑛𝑑𝑒𝑟 𝑐𝑜𝑛𝑡𝑟𝑜𝑙 ×100 (5)
• The Scheduled Time Achievement Ratio Extended (STARX) computes the percentage of parts that get to the end of the process on time (in less than ±1 hour of the scheduled manufacturing time for the lot) with respect to the scheduled completion time of the lot (Equation 6).
𝑆𝑇𝐴𝑅𝑋 =𝑃𝑎𝑟𝑡𝑠 𝑢𝑛𝑑𝑒𝑟 𝑐𝑜𝑛𝑡𝑟𝑜𝑙 𝑤𝑖𝑡ℎ𝑖𝑛 𝑡ℎ𝑒 𝑠𝑐ℎ𝑒𝑑𝑢𝑙𝑒𝑑 𝑚𝑎𝑛𝑢𝑓𝑎𝑐𝑡𝑢𝑟𝑖𝑛𝑔 𝑡𝑖𝑚𝑒 𝑜𝑓 𝑡ℎ𝑒 𝑙𝑜𝑡𝑠
𝑇𝑜𝑡𝑎𝑙 𝑎𝑚𝑜𝑢𝑛𝑡 𝑜𝑓 𝑝𝑎𝑟𝑡𝑠 𝑢𝑛𝑑𝑒𝑟 𝑐𝑜𝑛𝑡𝑟𝑜𝑙 ×100 (6)
Figure 3. An example of SSARX index. Two real sequences are compared with a reference sequence (numbers
represent the position in the sequence of the scheduled vehicles) · Source: Adapted from Bautista (2004)
With the aim to get a smooth flow of the necessary components, a decision-aid software program was developed. This tool is intended to simplify the obtainment of different production schedules and the assessment of inventory levels and workloads. The software was implemented in Microsoft’s Visual Basic for Applications (VBA) on an Excel spreadsheet. Its main features are:
1. It can include a bill of materials (BOM) from any process in the system. Two versions were designed. One for company C’s frames and another for Nissan’s bumpers.
2. It can display a multi-level BOM explosion. 3. It can compute a manufacturing sequence of units that ensures a constant rate of
consumption of all the necessary components. Users may also key in a specific sequence and the program makes a comparison between the two sequences.
4. It can compute when each component is needed. 5. It can display the consumption of a component over time for a particular sequence.
Improving “just-in-time, just-in-sequence” delivery in first-tier suppliers J Bautista · J Fortuny
14
6. It can display the deviation between real consumption of parts and smooth consumption (at a constant rate) in order to compute the necessary inventories of parts and the amount of inventories generated by manufacturing.
7. It can compute transfer lot sizes. 8. It can compute the time it takes to get a transfer lot. 9. It can compute, lot by lot, the necessary inventory or the inventory generated by a
sequence that is not synchronized with another sequence that gives the real consumption over time.
10. It can compute the SSARX index (Equation 5) of a sequence and compare it with another. 11. It can compute the STARX index (Equation 6) of a sequence and compare it with
another.
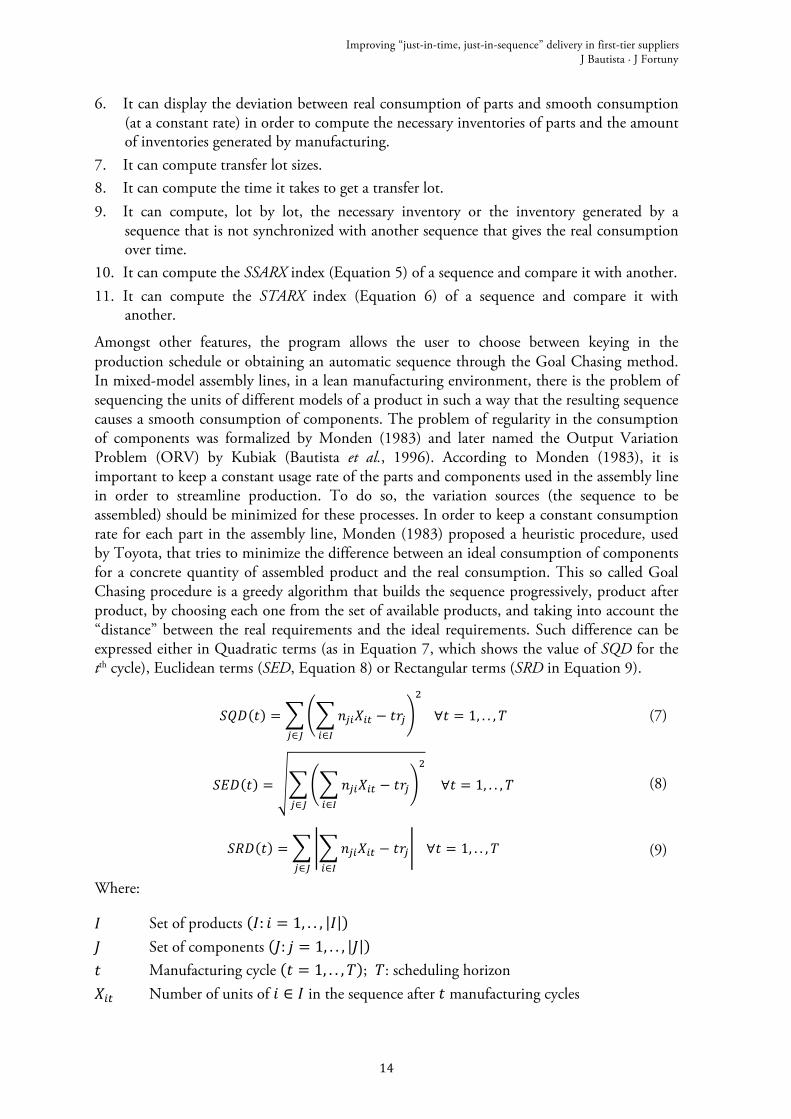
Amongst other features, the program allows the user to choose between keying in the production schedule or obtaining an automatic sequence through the Goal Chasing method. In mixed-model assembly lines, in a lean manufacturing environment, there is the problem of sequencing the units of different models of a product in such a way that the resulting sequence causes a smooth consumption of components. The problem of regularity in the consumption of components was formalized by Monden (1983) and later named the Output Variation Problem (ORV) by Kubiak (Bautista et al., 1996). According to Monden (1983), it is important to keep a constant usage rate of the parts and components used in the assembly line in order to streamline production. To do so, the variation sources (the sequence to be assembled) should be minimized for these processes. In order to keep a constant consumption rate for each part in the assembly line, Monden (1983) proposed a heuristic procedure, used by Toyota, that tries to minimize the difference between an ideal consumption of components for a concrete quantity of assembled product and the real consumption. This so called Goal Chasing procedure is a greedy algorithm that builds the sequence progressively, product after product, by choosing each one from the set of available products, and taking into account the “distance” between the real requirements and the ideal requirements. Such difference can be expressed either in Quadratic terms (as in Equation 7, which shows the value of SQD for the tth cycle), Euclidean terms (SED, Equation 8) or Rectangular terms (SRD in Equation 9).
𝑆𝑄𝐷 𝑡 = 𝑛!"𝑋!" − 𝑡𝑟!!∈!
!
!∈!
∀𝑡 = 1, . . ,𝑇 (7)
𝑆𝐸𝐷 𝑡 = 𝑛!"𝑋!" − 𝑡𝑟!!∈!
!
!∈!
∀𝑡 = 1, . . ,𝑇 (8)
𝑆𝑅𝐷 𝑡 = 𝑛!"𝑋!" − 𝑡𝑟!!∈!!∈!
∀𝑡 = 1, . . ,𝑇 (9)
Where:
𝐼 Set of products 𝐼: 𝑖 = 1, . . , 𝐼 𝐽 Set of components 𝐽: 𝑗 = 1, . . , 𝐽 𝑡 Manufacturing cycle 𝑡 = 1, . . ,𝑇 ; 𝑇: scheduling horizon 𝑋!" Number of units of 𝑖 ∈ 𝐼 in the sequence after 𝑡 manufacturing cycles
Improving “just-in-time, just-in-sequence” delivery in first-tier suppliers J Bautista · J Fortuny
15
𝑛!" Amount of component 𝑗 ∈ 𝐽 required by each unit of product 𝑖 ∈ 𝐼 𝑟! Ideal consumption rate for component 𝑗 ∈ 𝐽
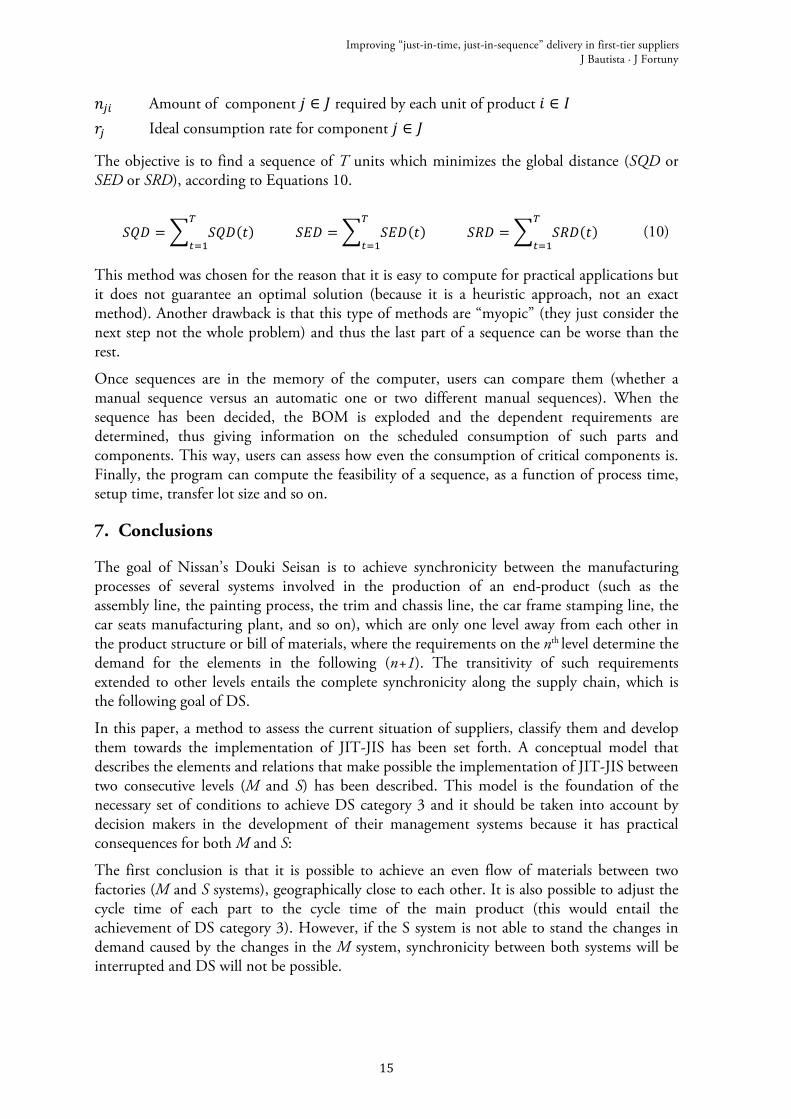
The objective is to find a sequence of T units which minimizes the global distance (SQD or SED or SRD), according to Equations 10.
𝑆𝑄𝐷 = 𝑆𝑄𝐷 𝑡!
!!! 𝑆𝐸𝐷 = 𝑆𝐸𝐷 𝑡
!
!!! 𝑆𝑅𝐷 = 𝑆𝑅𝐷 𝑡
!
!!! (10)
This method was chosen for the reason that it is easy to compute for practical applications but it does not guarantee an optimal solution (because it is a heuristic approach, not an exact method). Another drawback is that this type of methods are “myopic” (they just consider the next step not the whole problem) and thus the last part of a sequence can be worse than the rest.
Once sequences are in the memory of the computer, users can compare them (whether a manual sequence versus an automatic one or two different manual sequences). When the sequence has been decided, the BOM is exploded and the dependent requirements are determined, thus giving information on the scheduled consumption of such parts and components. This way, users can assess how even the consumption of critical components is. Finally, the program can compute the feasibility of a sequence, as a function of process time, setup time, transfer lot size and so on.
7. Conclusions
The goal of Nissan’s Douki Seisan is to achieve synchronicity between the manufacturing processes of several systems involved in the production of an end-product (such as the assembly line, the painting process, the trim and chassis line, the car frame stamping line, the car seats manufacturing plant, and so on), which are only one level away from each other in the product structure or bill of materials, where the requirements on the nth level determine the demand for the elements in the following (n+1). The transitivity of such requirements extended to other levels entails the complete synchronicity along the supply chain, which is the following goal of DS.
In this paper, a method to assess the current situation of suppliers, classify them and develop them towards the implementation of JIT-JIS has been set forth. A conceptual model that describes the elements and relations that make possible the implementation of JIT-JIS between two consecutive levels (M and S) has been described. This model is the foundation of the necessary set of conditions to achieve DS category 3 and it should be taken into account by decision makers in the development of their management systems because it has practical consequences for both M and S:
The first conclusion is that it is possible to achieve an even flow of materials between two factories (M and S systems), geographically close to each other. It is also possible to adjust the cycle time of each part to the cycle time of the main product (this would entail the achievement of DS category 3). However, if the S system is not able to stand the changes in demand caused by the changes in the M system, synchronicity between both systems will be interrupted and DS will not be possible.

Improving “just-in-time, just-in-sequence” delivery in first-tier suppliers J Bautista · J Fortuny
16
Secondly, if the S system has to work in batches (for example, because of processes with long setup time), the synchronicity between M and S will be lost and inventories of parts will pile up.
Because of the previous conclusions and due to the transitivity principle, some conditions to effectively implement DS along the supply chain are: (1) the M system must produce according to a reliable plan; (2) Production must be as even as possible in order to need a constant rate of supplies of parts and components; (3) manufacturing lead time in any S must be flexible in order to be adjusted to the needs of M; (4) setup times must be as short as possible and (5) order lead times must be reliable and as short as possible.
In future works, the model here described will be extended, taking into account the impact caused by demand uncertainty on the satisfaction of the necessary conditions to implement synchronous manufacturing and delivery, DS or JIT-JIS.
Acknowledgements. This work was funded by the Ministerio de Economía y Competitividad (Spanish Government) through the FHI-SELM2 ( TIN2014-57497-P ) project.
References
Advameg Inc. (2015) “Automobile”, How products are made, Vol.1, available at: http://www.madehow.com/Volume-1/Automobile.html (Accessed 9 November, 2015).
Almomani, M.A, Abdelhadi, A., Mumani, A., Momani, A. and Aladeemy, M. (2014), “A proposed integrated model of lean assessment and analytical hierarchy process for a dynamic road map of lean implementation”, International Journal of Advanced Manufacturing Technology, No.72, pp. 161–172.
Arnold, P. V. (2007), “Honda and the Toyota shadow”, Reliable plant, No. March, available at: http://www.reliableplant.com/Read/5195/honda-toyota (Accessed 9 November, 2015).
Bautista, J. (2004), Modelo de gestión para la innovación de la secuencia de suministros. Resumen para la dirección de NMISA, Universitat Politècnica de Catalunya, Barcelona, pp. 21-35.
Bautista, J. and Cano, J. (2008), “Minimizing work overload in mixed-model assembly lines”, International Journal of Production Economics, Vol.112 No. 1, pp. 177-191
Bautista, J. and Fortuny-Santos, J. (2015), “A conceptual model to manage supply sequences in automotive industry for Nissan Barcelona”, paper presented at the 2015 International Conference on Industrial Engineering and Industrial Management, Aveiro, 6-8 July 2015, International Conference on Industrial Engineering and Operations Management. International IIE Conference. Engineering Systems and Networks: the way ahead for industrial engineering and operations management". Aveiro, pp. 1-8.
Bautista, J., Companys, R. and Corominas, A. (1996), “Heuristics and exact algorithms for solving the Monden problem”, European Journal of Operational Research, Vol.88 No.1, pp. 101-113.
Bautista, J., Companys, R., Vila, A., Pereira J., Mateo, M. (2000), “Aplicación de la CLP al problema de secuencias regulares con restricciones en una cadena de montaje de automóviles”, paper presented at Congreso sobre Técnicas de Ayuda a la Decisión en la Defensa, Madrid, 12-15 December 2000, Congreso sobre Técnicas de Ayuda a la Decisión en la Defensa: Actas, Ministerio de Defensa, Madrid, pp. 289-309.
Beach, R., Muhlemann, A.P., Price, D.H.R., Paterson, V. and Sharp, J.A. (2001), “The role of qualitative methods in production management research”, International Journal of Production Economics, Vol.74 No.1–3, pp.201–212.

Improving “just-in-time, just-in-sequence” delivery in first-tier suppliers J Bautista · J Fortuny
17
Bunkley, N. (2015), “Ford F-150 output pinched by frame shortage, workers say” Automotive News, No. May 29, 2015. http://www.autonews.com/article/20150529/OEM01/150529839/ford-f-150-output-pinched-by-frame-shortage-workers-say (Accessed 9 November, 2015).
Cakmakci, M. (2009), “Process improvement: performance analysis of the setup time reduction- SMED in the automobile industry”, The International Journal of Advanced Manufacturing Technology, Vol.41 No.1, pp. 168-179.
Cusumano, M.A. (1989), The Japanese Automobile Industry: Technology and Management at Nissan and Toyota, Published by The Council on East Asian Studies, Harvard University and distributed by The Harvard University Press, Cambridge.
David, I. et Eben-Chaime, M. (2003), “How far should JIT vendor–buyer relationships go?”, International Journal of Production Economics, Vol.81–82, pp. 361–368.
De Goldfiem, F. (2003), “Nissan un cran de plus dans la modernisation”, L'Usine Nouvelle, No.2888. http://www.usinenouvelle.com/article/nissan-un-cran-de-plus-dans-la-modernisation.N36490 (Accessed 9 November, 2015).
Ford, H. (1923), My Life and Work, Doubleday, Page and Company, New York, pp. 143-145.
Gudehus, T. et Kotzab H. (2012), “Chapter 6. Logistic Costs and Controlling”, in Gudehus, T. et Kotzab H. (Ed.), Comprehensive Logistics, Springer Verlag, Berlin-Heildeberg, pp. 129-155.
Hayes, R.H. et Pisano, G. P. (1996), "Manufacturing Strategy: At the Intersection of Two Paradigm Shifts", Production and Operations Management, Vol.5 No.1, pp. 25–41.
Helper, S. (1991) Helper, S. (1991), “How much has really changed between US automakers and their suppliers?”, Sloan Management Review, Vol.15 No. 4, pp. 15-28.
Holweg, M. (2007). "The genealogy of lean production", Journal of Operations Management, Vol.25 No.2, pp. 420–437.
ISO (2009), ISO 9004:2009, Managing for the sustained success of an organization -- A quality management approach, ISO, the International Organization for Standardization, Geneva.
ISO (2015), The ISO Survey of Management System Standard Certifications – 2014, Executive summary, ISO, the International Organization for Standardization. http://www.iso.org/iso/iso_survey_executive-summary.pdf?v2014 (Accessed 9 November, 2015).
Klier, T.H. (1994) “The impact of lean manufacturing on sourcing relationships”, Economic Perspectives, No. July , pp. 8-18.
Krafcik, J.F. (1988), "Triumph of the lean production system", Sloan Management Review, Vol.30, No.1, pp. 41–52.
Kume, H. (1992), “The QC Story”, in Kume, H. (Ed.), Statistical methods for quality improvement, 3A Corporation, Tokyo, pp. 191-206.
Lee, Q. (2015), “Assessment for lean manufacturing. A benchmarking tool”, Strategos Inc. available at: http://www.strategosinc.com/assessment.htm (Accessed 16 November, 2015).
Liker, J.K. et Wu, Y.C. (2000), “Japanese automakers, U.S. Suppliers and supply-chain superiority”, MIT Sloan Management Review, Vol. 42 No. 1, pp. 81-94.
Lotfi, G., Safwat, A. and Mohamed, D.M. (2014) “Modeling the Performance in a Just in Time Context Using Goal Programming Approach”, Modern Management Science & Engineering, Vol.2 No.1, pp. 68-84.
Luo, B.B. et Donaldson, L. (2013), Misfits in Organization Design. Information Processing as a Compensatory Mechanism, Lex Journal of Organization Design, Vol.2 No.1, pp. 2-10.

Improving “just-in-time, just-in-sequence” delivery in first-tier suppliers J Bautista · J Fortuny
18
MacDuffie, J.P. et Helper, S. (1999), “Creating lean suppliers: Diffusing lean production through the supply chain”, in: Liker, J.K., Fruin, W.M, and Adler, P.S. (Ed.), Remade in America. Transplanting & transforming Japanese management systems, Oxford University Press, New York, pp. 154-202.
Maxwell, J.A. (2009), Qualitative research design: An Interactive approach, 2 ed, Sage Publications, Thousand Oaks.
Monden, Y. (1983), Toyota Production System: Practical Approach to Production Management, 1 ed. Industrial Engineeering and Management Press, Norcross.
Monden, Y. (1994), Toyota Production System, an Integrated Approach to Just-In-Time, 2 ed. Industrial Engineeering and Management Press, Norcross.
Netland, T. (2012), “Nissan Production Way: A better alternative to TPS?”, Better Operations, available at: http://better-operations.com/2012/08/30/nissan-production-way-a-better-alternative-to-tps/ (Accessed 16 November, 2015).
New, S. J. (2007), “Celebrating the enigma: the continuing puzzle of the Toyota Production System”, International Journal of Production Research, Vol.45 No.16, pp. 3545-3554.
Ohno, T. (1988), Toyota Production System: Beyond Large-Scale Production, Productivity Press, Cambridge.
Parkash, S. et Kaushik, V.K. (2011), “Supplier Performance Monitoring and Improvement (Spmi) through Sipoc Analysis and Pdca Model to the Iso 9001 Qms in Sports Goods Manufacturing Industry”, LogForum, Vol.7 No. 4, pp. 1-15.
Pfeffer, J. (1982), Organizations and Organization Theory, Pitman, Marshfield.
Production Engineer (1988) “Kawasaki's production system. Price Waterhouse looks east”, Production Engineer, Vol.67 No.7 pp. 43-43.
Sánchez, A.M. et Pérez, M.P. (2001), “Lean indicators and manufacturing strategies”, International Journal of Operation & Production Management, Vol.21 No.11, pp. 1433-1451.
Schwandt, T.A. (2000), “Three epistemological stances for qualitative inquiry: Interpretivism, hermeneutics, and social constructionism”, in Denzin, N.K. et Lincoln, Y.S. (Ed.), Handbook of qualitative research, 2nd ed., Sage, Thousand Oaks, pp.189-213.
Sharma, S.K., Gupta, R.D., Kumar. A. and Singh, B. (2011), “Supplier issues for lean implementation”, International Journal of Engineering Science and Technology, Vol.3 No.5, pp. 3900-3905.
Siemens (2015) Just-in-Time, Just-in-Sequence, Solution at a glance, available at http://w3.siemens.com/mcms/mes/en/industry/discretemanufacturing/automotiveoem/pages/just-in-time-just-in-sequence.aspx (Accessed 9 November, 2015).
Strauss, A. et Corbin, J. (2000), “Grounded theory methodology: an overview”, in Denzin, N.K. et Lincoln, Y.S. (Ed.), Handbook of qualitative research, 2nd ed., Sage, Thousand Oaks, pp. 273-285.
Szwejczewski, M. et Jones, M. (2012), Learning From World Class Manufacturers, Palgrave Macmillan, Basignstoke, pp. 104-106.
Sugimori, Y., Kusunoki, K., Cho, F. and Uchikawa, S. (1977), “Toyota production system and Kanban system Materialization of just-in-time and respect-for-human system”, International Journal of Production Research, Vol.15 No.6, pp. 553-564.
Taj, S. (2005), “Applying lean assessment tools in Chinese-hi tech industries”, Management Decision, Vol. 43 No. 4, pp. 628-643.
Improving “just-in-time, just-in-sequence” delivery in first-tier suppliers J Bautista · J Fortuny
19
Thun, J.H., Marble, R. P. and Silveira-Camargos, V. (2007), “A conceptual framework and empirical results of the risk and potential of just in sequence - a study of the German automotive industry”, Journal of Operations and Logistics, Vol. 1 No.2, pp. 1–13.
Van der Merwe, S.J. (2010) Optimizing the S.S.A. Ratio level indexes of the PBS process in Nissan’s production plant, University of Pretoria, Pretoria.
WiseGEEK (2015), What Does "Just in Sequence" Mean?, WiseGEEK clear answers for common questions, available at http://www.wisegeek.com/what-does-just-in-sequence-mean.htm (Accessed 9 September 2015).
Wolf, B.M. (1991), “Book Reviews. The Machine that Changed the World by James P. Womack, Daniel T. Jones and Daniel Roos, Rawson Associates-Macmillan Publishing, New York, 1990”, Journal of International Business Studies, Vol.22 No.3, pp. 533-538.
Womack, J.P., Jones, D.T. and Roos, D. (1990), The Machine That Changed the World. The Story of Lean Production, Rawson Associates, Macmillan Publishing Company, New York.
Yin, R.K. (2009), Case Study Research. Design and Methods, 4 ed., Applied social research methods, v. 5, Sage Publications, Thousand Oaks.
Yonemitsu, T. (1999), “A Guide to the Kawasaki Production System”, Kawasaki Technical Review, No.142, available at: https://www.khi.co.jp/english/rd/tech/142/ne142g00.html (Accessed 9 November, 2015).