improving health outcomes of your population using · pdf filesimul8 corporation scenario...
TRANSCRIPT

Improving Health Outcomes of Your Population using SimulationDiscover how simulation can be used totackle key population health issues such as stroke care, dementia planning and pre-natal care to enable healthcare delivery networks to deliver on the Triple Aim of quality of care, cost and better health for populations.
www.SIMUL8Health care.com
Population HealthDelivering excellent quality of care, at lower cost, while improving the health of the population is the challenge of the IHI’s Triple Aim. How populations might need healthcare and choose to access services is a complex management task. Networks of integrated healthcare delivery partners need to work together to understand how to improve clinical outcomes and patient satisfaction efficiently.
Better care coordination, increased focus on patients with multiple chronic diseases and more efficient processes will make a big difference in patients’ lives and the smooth functioning of a healthcare system, as well as reducing costs.
Many questions need to be answered by networks embarking on this work:
• Where should we invest your limited resources and maximize Return on Investment (ROI)?
• How will we be affected by shifting demographics and insurance coverage?
• Which interventions will be effective in achieving targets such as 30-day readmissions?
• How can we incentivize our system to improve?
Simulation can help healthcare delivery networks to answer these questions and more by providing evidence on how to meet the Triple Aim objectives of quality of care, costs and better healthcare for populations.
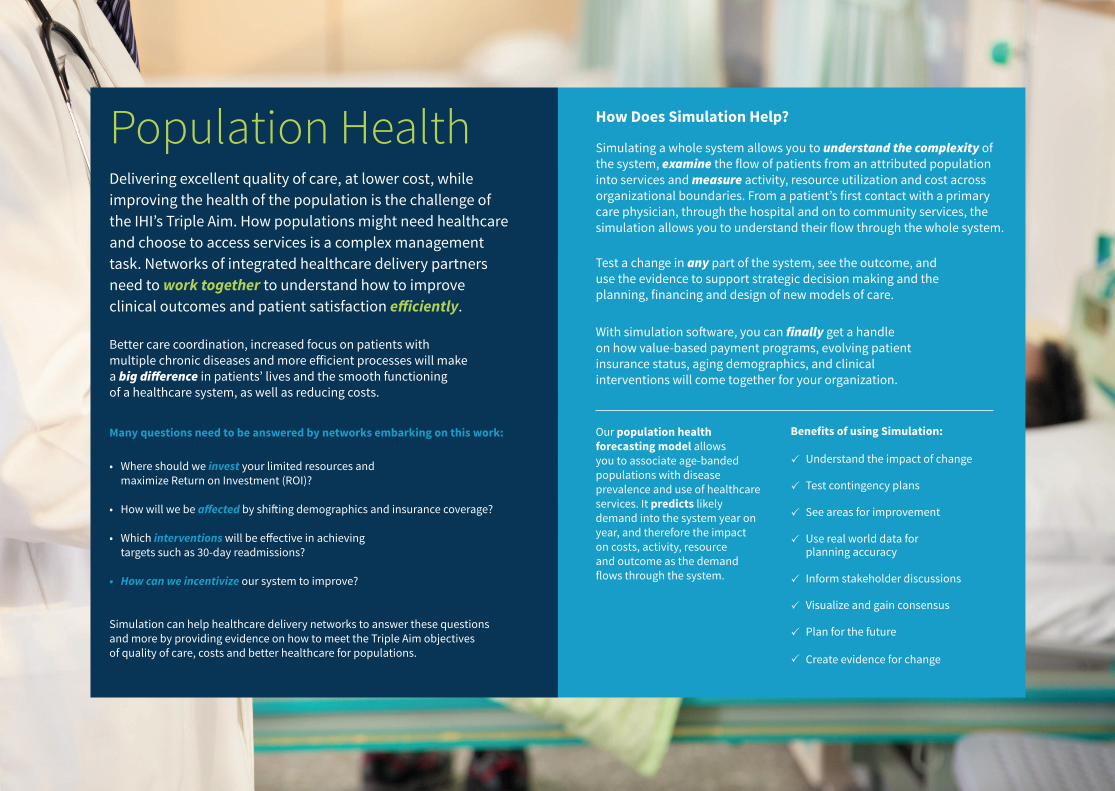
How Does Simulation Help?
Simulating a whole system allows you to understand the complexity of the system, examine the flow of patients from an attributed population into services and measure activity, resource utilization and cost across organizational boundaries. From a patient’s first contact with a primary care physician, through the hospital and on to community services, the simulation allows you to understand their flow through the whole system.
Test a change in any part of the system, see the outcome, and use the evidence to support strategic decision making and the planning, financing and design of new models of care.
With simulation software, you can finally get a handle on how value-based payment programs, evolving patient insurance status, aging demographics, and clinical interventions will come together for your organization.
Our population health forecasting model allows you to associate age-banded populations with disease prevalence and use of healthcare services. It predicts likely demand into the system year on year, and therefore the impact on costs, activity, resource and outcome as the demand flows through the system.
Benefits of using Simulation:
Understand the impact of change
Test contingency plans
See areas for improvement
Use real world data for planning accuracy
Inform stakeholder discussions
Visualize and gain consensus
Plan for the future
Create evidence for change
Improving Stroke CareThe Impact of Faster Treatment and Accelerated Discharge to Rehabilitation
As the population ages, the number of stroke and transient ischemic attack (TIA) patients is expected to continue to increase. Evidence shows that care must be delivered within a very short time frame, and the question for healthcare providers ishow to ensure that access to the best care is available, in order to produce the best patient outcomes. This pathway model has been used by multiple health delivery networks to examine these questions.
Key Facts
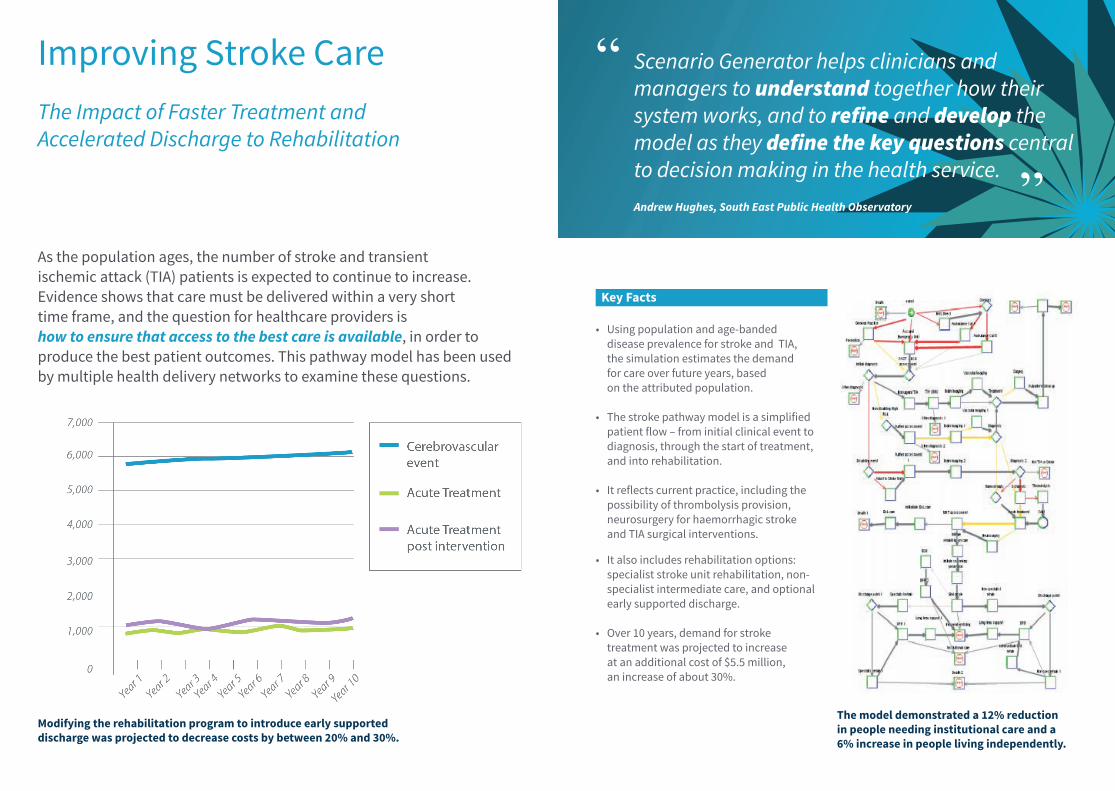
• Using population and age-banded disease prevalence for stroke and TIA, the simulation estimates the demand for care over future years, based on the attributed population.
• The stroke pathway model is a simplified patient flow – from initial clinical event to diagnosis, through the start of treatment, and into rehabilitation.
• It reflects current practice, including the possibility of thrombolysis provision, neurosurgery for haemorrhagic stroke and TIA surgical interventions.
• It also includes rehabilitation options: specialist stroke unit rehabilitation, non-specialist intermediate care, and optional early supported discharge.
• Over 10 years, demand for stroke treatment was projected to increase at an additional cost of $5.5 million, an increase of about 30%.
Scenario Generator helps clinicians and managers to understand together how their system works, and to refine and develop the model as they define the key questions central to decision making in the health service.Andrew Hughes, South East Public Health Observatory
Modifying the rehabilitation program to introduce early supported discharge was projected to decrease costs by between 20% and 30%.
The model demonstrated a 12% reduction in people needing institutional care and a 6% increase in people living independently.
“
”
Planning for DementiaEarlier Diagnosis & Providing the Right Service at the Right Time
Key Facts
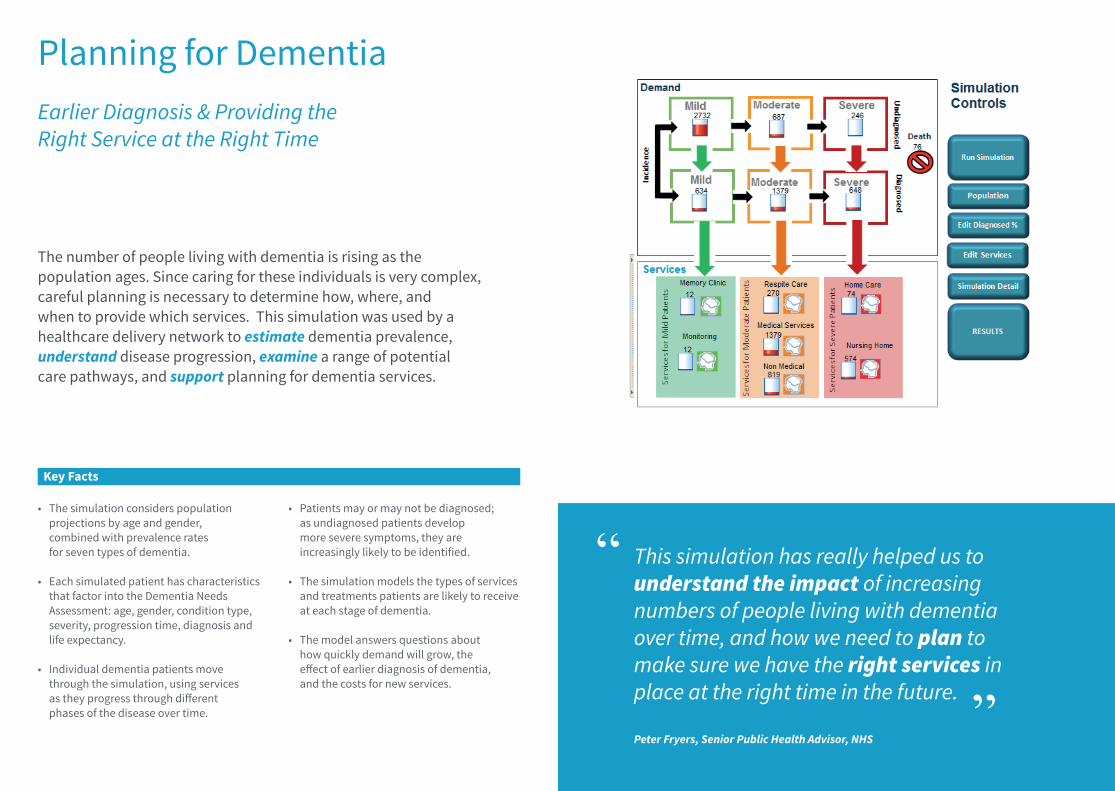
• The simulation considers population projections by age and gender, combined with prevalence rates for seven types of dementia.
• Each simulated patient has characteristics that factor into the Dementia Needs Assessment: age, gender, condition type, severity, progression time, diagnosis and life expectancy.
• Individual dementia patients move through the simulation, using services as they progress through different phases of the disease over time.
• Patients may or may not be diagnosed; as undiagnosed patients develop more severe symptoms, they are increasingly likely to be identified.
• The simulation models the types of services and treatments patients are likely to receive at each stage of dementia.
• The model answers questions about how quickly demand will grow, the effect of earlier diagnosis of dementia, and the costs for new services.
This simulation has really helped us to understand the impact of increasing numbers of people living with dementia over time, and how we need to plan to make sure we have the right services in place at the right time in the future.
Peter Fryers, Senior Public Health Advisor, NHS
“
”
The number of people living with dementia is rising as the population ages. Since caring for these individuals is very complex, careful planning is necessary to determine how, where, and when to provide which services. This simulation was used by a healthcare delivery network to estimate dementia prevalence, understand disease progression, examine a range of potential care pathways, and support planning for dementia services.

HIV
In Allegheny County, healthcare providers wanted to know the impact of screening on treatment costs, particularly if appointments were increased from twice a year to four times a year to improve adherence.
The simulation modeled population demand and the expected infection rates if patients were not diagnosed. These results were then validated against local
data. The simulation model tested the impact of more patients being screened, receiving treatment themselves and also reducing infection rates.
Results over 5 years showed that increased screening reduced complications and new infections, reducing costs in years 4 and 5, although the number of appointments increased.
GRAPHS FOR HIV: The numbers of patients with HIV symptoms decrease with screening, and again with increased follow up support to improve adherence when compared with the baseline. >>
Simulation was used to develop population-based plans which predict how the triple aim of improving patient outcomes and the per capita cost of care can be achieved.
Population demand is simulated using age-banded population and disease
prevalence (ICD-10) to forecast demand over time. The same methodology was
used to model HIV patient demand.
Scenario Generator
Scenario Generator is a discrete event simulation tool developed for strategic planning in population health. Using Scenario Generator, both the HIV and Hepatitis C disease pathways were modeled over a 5 year period. We tested the impact of interventions aimed at diagnosing more patients, on the burden of disease, the average cost per patient treated, patient outcomes and capacity requirements over time. While HIV and Hepatitis C are chronic conditions, they are treatable if patients can be identified and treatment adherence improved.
Achieving the Triple Aim with Simulation:HIV & Hepatitis C
Written by:
Claire CordeauxExecutive Director, HealthcareSIMUL8 Corporation
Brittany HagedornHealthcare Lead, USASIMUL8 Corporation
Scenario Generator is the only simulation software tool for strategic planning that enables design and simulation of care pathways within whole health and human service systems.
Age-banded population projections
DemandAge-banded
diseaseprevalence
182,443 Hep C 0.3%(HPA 2007)
406(55% not Genotype 1)
2% diagnosed
x =
Only 2% of Hepatitis C patients are diagnosed. Those who remain undiagnosed can deteriorate and develop liver disease if left untreated.
HIV patients are living longer with treatment, however 30% remain undiagnosed and will develop complications.
250,000,000
200,000,000
150,000,000
100,000,000
50,000,000
0
Year 1 Year 2 Year 3 Year 4 Year 5
Screening Costs
Costs
2,500
2,000
1,500
1,000
500
0
Year 1 Year 2 Year 3 Year 4 Year 5
Baseline HIV Symptoms
Screening HIV Symptoms
Support ART HIV Symptoms
Hepatitis C
In NHS payer organizations, healthcare providers wanted to understand the impact of increased screening and new drug therapies on cure rates. They also wanted to understand the impact on cost, when the cost of not treating patients with liver disease resulting from Hepatitis C were taken into account.
The simulation modeled population demand over 5 years along with the cost of the deteriorating patient if treatment was not available against the cost and capacity requirements of treatments, including new triple therapies now available.
The simulation found that by year 2 onwards, if 5% rather than 2% of patients were diagnosed and triple therapy was available, the overall costs would be less than the current state.
GRAPHS FOR HEPATITIS C: Comparing number of patients cured against the baseline (2% diagnosed and dual therapy only), introducing triple therapy and increasing patients diagnosed to 5%. >>
3,500,000
3,000,000
2,500,000
1,000,000
500,000
0
Year 1 Year 2 Year 3 Year 4 Year 5
2,000,000
1,500,000
9
8
5
2
1
0
Year 1 Year 2 Year 3 Year 4 Year 5
4
3
7
6
Costs dual therapy only(2% diagnosed)
Costs dual therapy only(5% diagnosed)
Costs triple therapy(2% diagnosed)
Costs triple therapy(5% diagnosed)
Patients cured dual therapy only(2% diagnosed)
Patients cured dual therapy only(5% diagnosed)
Patients cured triple therapy(2% diagnosed)
Patients cured triple therapy(5% diagnosed)
Undiagnosed
601-753
New Infections
46-131
Screening
0
Late Diagnosis
601-753601-753
Diagnostics
46-131
Infected
53-139
Infect Others
601-753
End
516-708
STOP
Start
2,532
www.SIMUL8Health care.com
User Interface
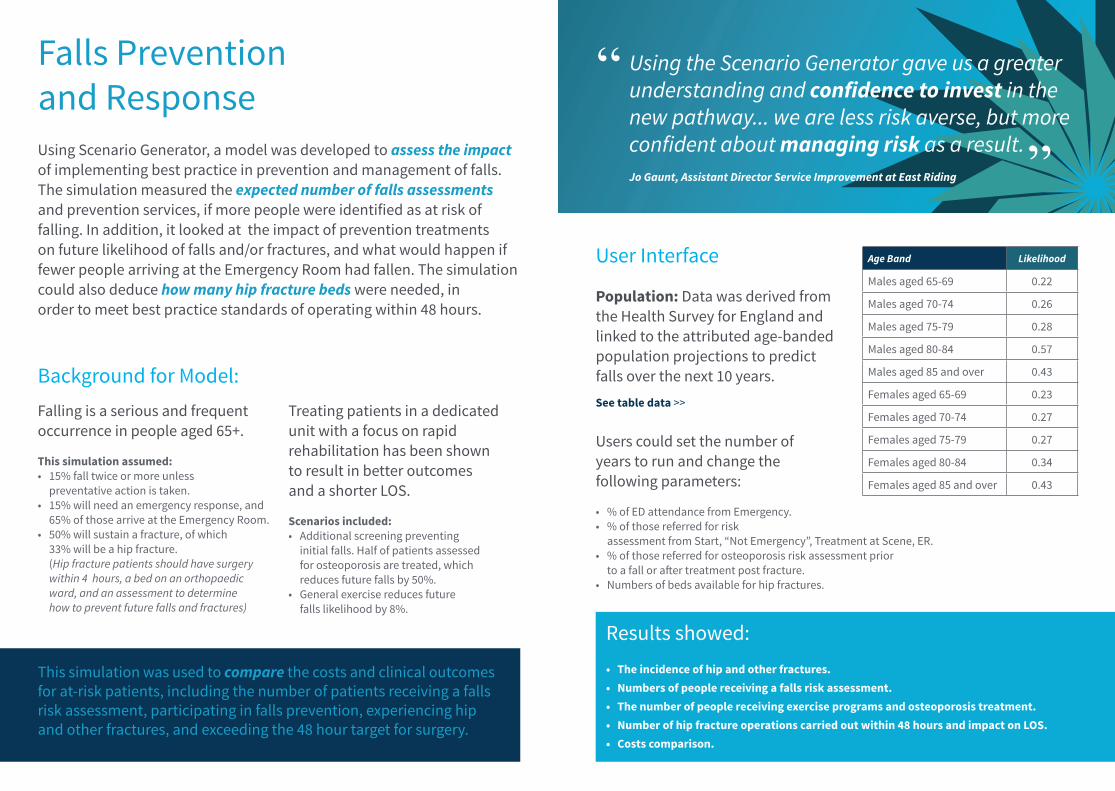
Population: Data was derived from the Health Survey for England and linked to the attributed age-banded population projections to predict falls over the next 10 years.See table data >>
Users could set the number of years to run and change the following parameters:
• % of ED attendance from Emergency.• % of those referred for risk
assessment from Start, “Not Emergency”, Treatment at Scene, ER.• % of those referred for osteoporosis risk assessment prior
to a fall or after treatment post fracture.• Numbers of beds available for hip fractures.
Falls Preventionand ResponseUsing Scenario Generator, a model was developed to assess the impact of implementing best practice in prevention and management of falls. The simulation measured the expected number of falls assessments and prevention services, if more people were identified as at risk of falling. In addition, it looked at the impact of prevention treatments on future likelihood of falls and/or fractures, and what would happen if fewer people arriving at the Emergency Room had fallen. The simulation could also deduce how many hip fracture beds were needed, in order to meet best practice standards of operating within 48 hours.
Using the Scenario Generator gave us a greater understanding and confidence to invest in the new pathway... we are less risk averse, but more confident about managing risk as a result.Jo Gaunt, Assistant Director Service Improvement at East Riding
“
”
Falling is a serious and frequent occurrence in people aged 65+.
This simulation assumed:• 15% fall twice or more unless
preventative action is taken.• 15% will need an emergency response, and
65% of those arrive at the Emergency Room.• 50% will sustain a fracture, of which
33% will be a hip fracture.(Hip fracture patients should have surgery within 4 hours, a bed on an orthopaedic ward, and an assessment to determine how to prevent future falls and fractures)
Background for Model:Treating patients in a dedicated unit with a focus on rapid rehabilitation has been shown to result in better outcomes and a shorter LOS.
Scenarios included:• Additional screening preventing
initial falls. Half of patients assessed for osteoporosis are treated, which reduces future falls by 50%.
• General exercise reduces future falls likelihood by 8%.
This simulation was used to compare the costs and clinical outcomes for at-risk patients, including the number of patients receiving a falls risk assessment, participating in falls prevention, experiencing hip and other fractures, and exceeding the 48 hour target for surgery.
Results showed:• The incidence of hip and other fractures.• Numbers of people receiving a falls risk assessment.• The number of people receiving exercise programs and osteoporosis treatment.• Number of hip fracture operations carried out within 48 hours and impact on LOS.• Costs comparison.
Age Band Likelihood
Males aged 65-69 0.22
Males aged 70-74 0.26
Males aged 75-79 0.28
Males aged 80-84 0.57
Males aged 85 and over 0.43
Females aged 65-69 0.23
Females aged 70-74 0.27
Females aged 75-79 0.27
Females aged 80-84 0.34
Females aged 85 and over 0.43
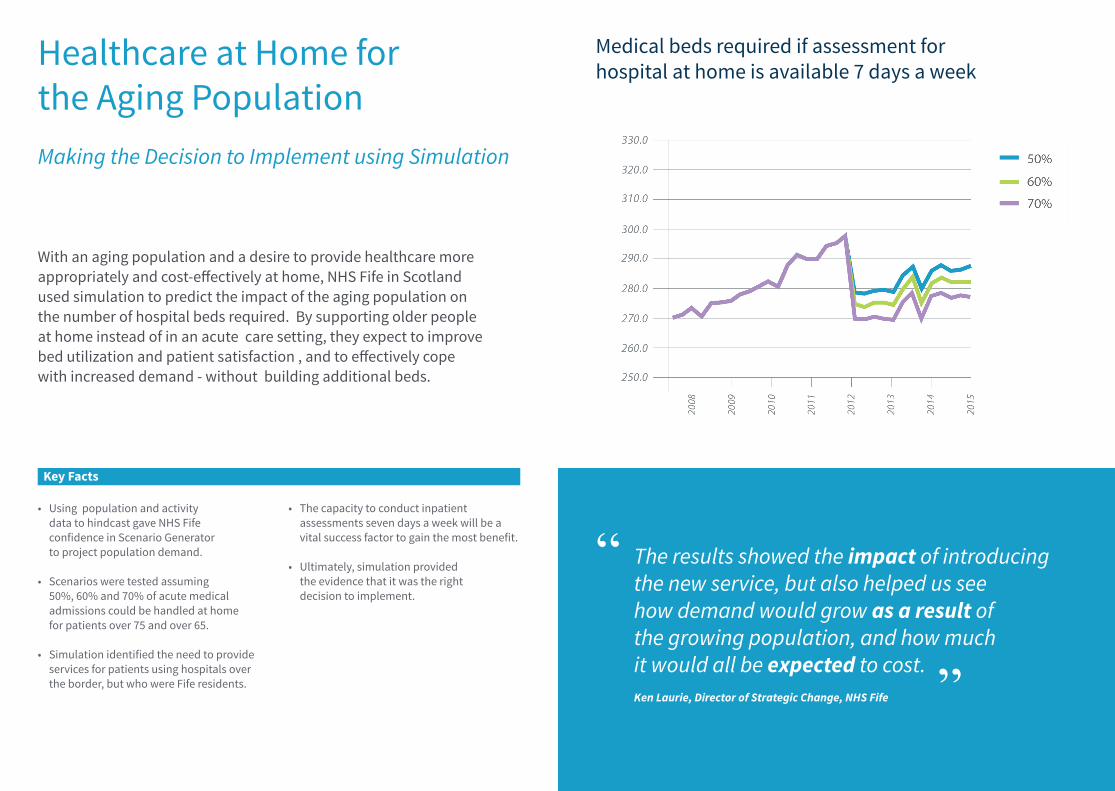
Healthcare at Home for the Aging PopulationMaking the Decision to Implement using Simulation
Key Facts
• Using population and activity data to hindcast gave NHS Fife confidence in Scenario Generator to project population demand.
• Scenarios were tested assuming 50%, 60% and 70% of acute medical admissions could be handled at home for patients over 75 and over 65.
• Simulation identified the need to provide services for patients using hospitals over the border, but who were Fife residents.
• The capacity to conduct inpatient assessments seven days a week will be a vital success factor to gain the most benefit.
• Ultimately, simulation provided the evidence that it was the right decision to implement.
The results showed the impact of introducing the new service, but also helped us see how demand would grow as a result of the growing population, and how much it would all be expected to cost.Ken Laurie, Director of Strategic Change, NHS Fife
“
”
With an aging population and a desire to provide healthcare more appropriately and cost-effectively at home, NHS Fife in Scotland used simulation to predict the impact of the aging population on the number of hospital beds required. By supporting older people at home instead of in an acute care setting, they expect to improve bed utilization and patient satisfaction , and to effectively cope with increased demand - without building additional beds.
Medical beds required if assessment forhospital at home is available 7 days a week

The Impact of Prenatal Care for Uninsured WomenClinical Outcomes, Bed Utilization and Costs
Mount Sinai Hospital is an academic teaching facility providing acute care in Toronto, where they treat a high number of patients experiencing complications related to delivery. Using Scenario Generator and population data from the Toronto Central Local Health Integration Network (LHIN), Mount Sinai simulated maternity services and tested improvement scenarios for insured vs. uninsured women and the impact of service changes on patient care outcomes, bed capacity utilization, and cost.
Key Facts
• Many uninsured women do not receive enough prenatal care because they lack healthcare coverage and access to care.
• This results in unnecessary emergency room visits, higher rates of C-sections, and more complications in newborns, and increased cost of services.
• The hospital used population and age-banded fertility rates to forecast the number of insured and uninsured pregnancies over the next five years.
• Mount Sinai tested the impact of starting a prenatal clinic for uninsured women, intended to monitor the pregnancies of this vulnerable community.
• The simulation predicted a 2% reduction in bed utilization by reducing elective C-sections by 5%, which equated to a $37k reduction in costs per year.
• Since completing the project, Mount Sinai has found partners interested in implementing the service together, and a private donor to support the start-up of the pre-natal clinic.
When asked where they wish to spend their final days, 60% of patients say “at home”, but in reality, most end of life care is delivered in a hospital. Through a series of workshops, a wide stakeholder group used simulation to understand the services needed by patients in their final year, in order to develop a plan to better support patient wishes. This was used to set policy on resource decisions for end of life care.
Key Facts
• Many providers may be involved in care, depending on the patient’s needs – including specialty doctors, primary care physicians, community nurses, hospice, and social services.
• The network analyzed the cause and location of mortality over 2 years and grouped patients by cause of death including cancer, chronic disease, and frailty.
• The data showed that of the two largest groups by cause of death, people with cancer were more likely to be identified as at the end of their life and therefore more likely to die at home or in a hospice whilst people with chronic disease were less likely to be identified and more likely to die in hospital.
• Based on these results, the network focused on chronic disease and used the simulation to test the impact of an admissions database and a 24/7 rapid response service.
• Results showed that this would better meet patient’s wishes and also reduce the network’s total cost of care, even after factoring in the cost of the new services.
• This prompted the network to integrate their care strategies for End of Life and Chronic Conditions – to improve outcomes and reduce costs, both during and at the end of their life.
Supporting End of Life Care at HomeFinding Ways to Meet the Patient’s Wishes
It’s a great way of focusing on the things we can do that will really make a difference. We would definitely use simulation again when working through an issue like this.
West Kent CCG
“”
Scenario Generator was the only tool available to build a case for developing pre-natal services for this vulnerable population and without it we wouldn’t have come as far along in the process in terms of having evidence for decision makers.
Simone Atungo, Director Community Development & Integration, Mount Sinai Hospital
“
”

Scenario Generator is the only simulation software tool for strategic planning that can predict population health, costs, capacity utilization and patient outcomes.
Understand the impact of change
Develop evidence base for health network decisions
Real world data matched to key population characteristics
Inform stakeholder discussions
Forecast forward and plan for the future today
Used in the US, Canada, Australia, the UK NHS and Europe – Scenario Generator is providing the evidence for change.
To find out more visit:SIMUL8Healthcare.com/scenario-generator
Try our stroke model for population health and see how simulation can improve strategic decision making in your organization.
SIMUL8Healthcare.com/stroke-pathway