improving empirical mode decomposition using support vector machines … · 2015-11-24 ·...
TRANSCRIPT

Sensors 2008, 8, 2500-2508
sensors ISSN 1424-8220 © 2008 by MDPI
www.mdpi.org/sensors
Full Research Paper
Improving Empirical Mode Decomposition Using Support Vector Machines for Multifocus Image Fusion
Shaohui Chen, Hongbo Su *, Renhua Zhang, Jing Tian and Lihu Yang
Key Laboratory of Water Cycle and Related Land Surface Processes, Institute of Geographic Sciences
and Natural Resources Research, Chinese Academy of Sciences, 11A, Datun Road, Chaoyang District,
Beijing 100101, China; E-mails: [email protected] (R. Z.); [email protected] (J. T.);
[email protected] (L. Y.)
* Author to whom correspondence should be addressed; E-mail: [email protected]
Received: 3 March 2008 / Accepted: 31 March 2008 / Published: 8 April 2008
Abstract: Empirical mode decomposition (EMD) is good at analyzing nonstationary and
nonlinear signals while support vector machines (SVMs) are widely used for classification.
In this paper, a combination of EMD and SVM is proposed as an improved method for
fusing multifocus images. Experimental results show that the proposed method is superior to
the fusion methods based on à-trous wavelet transform (AWT) and EMD in terms of
quantitative analyses by Root Mean Squared Error (RMSE) and Mutual Information (MI).
Keywords: Multifocus Image Fusion, Empirical Mode Decomposition, ‘À-trous’ Wavelet
Transform, Support Vector Machines
1. Introduction
Due to the limited depth-of-focus of optical lenses, cameras cannot be focused simultaneously on all
objects at different distances from them to gain a clear image [1]. On the other hand, many pattern-
related processing tasks, such as machine vision and target tracking, are better implemented using
focused images rather than defocused ones [2]. Therefore, it is often advantageous to construct an
image with every object in focus using image fusion methods by fusing the multifocus images taken
from the same view point under different focal settings [3].

Sensors 2008, 8
2501
Up to now, various methods at pixel, feature or decision levels have been presented for image fusion
[3-5]. Arithmetic algorithms at the pixel level often cause undesirable side effects such as reduced
contrast [6]. Another alternative approach using image block and spatial frequency suffers from a
tradeoff between block size and the quality of the fused image. That means using a large image block
will lead to a less clear image while using a small image block may lead to saw-tooth effect [7].
Another family of methods has been explored based on undecimated ‘à-trous’ wavelet transform
(AWT) [8], [9]. The basic idea is to implement an AWT on each multifocus image, and then fuse all
wavelet coefficients by their magnitudes to produce one composite wavelet representation, from which
the focused image can be recovered by performing the inverse AWT (IAWT) [2].
Empirical mode decomposition (EMD) is a more recent signal processing method for analyzing non-
linear and nonstationary data, which was developed by Huang et al. [10, 11]. The final representation
of signal is an energy-frequency distribution that gives not only sharp identifications of salient
information but also other “smoother” part of the signal. The EMD is a highly efficient and adaptive
method and offers higher frequency resolution and more accurate timing of nonlinear and nonstationary
signal events than traditional integral transform techniques [12-16]. In this paper, a combination of
EMD and support vector machines (SVMs) is proposed to produce a better EMD representation of the
fused image from fusing multifocus images.
The SVM is a supervised classification method that outperforms many conventional approaches in
many applications [2]. The improvement of the EMD based multifocus image fusion using the SVM is
presented in Section 2. An experiment in Section 3 illustrates that the presented method produces the
focused images better than the traditional fusion methods based on EMD and AWT quantitatively.
2. Fusion Principle
Here, the processing of two images A and B is considered, though the algorithm can be extended to
handle more than two. Each multifocus image is firstly decomposed by EMD into one residue and a
series of intrinsic mode functions (IMFs). Then a SVM is trained to determine which IMF plane is
clearer at each location at each level. In the end, the focused image is recovered by carrying out the
inverse EMD (IEMD).
2.1. EMD-based multifocus image fusion using the SVM
The EMD can represent the details and smooth part of an image and this framework is well suitable
to fuse images by managing different IMFs [12-17]. For a two-dimensional image, the EMD process
that generates the IMFs is summarized as follows [12]:
1) Treating the original image I as the initial residue I0.
2) Connecting all the local maxima and minima along rows using constructed smooth cubic splines
to get upper envelope uer and lower envelope ler. Similarly, upper envelope uec and lower envel-
ope lec along columns are also obtained. The mean plane ul is defined:

Sensors 2008, 8
2502
( ) 4/ccrr leueleueul +++= (1)
Then, the difference between I0 and ul is ulI - 01 =ω (2)
This is one iteration of the sifting process. Because the value of ul decreases rapidly for the first
several iterations and then decreases slowly, this suggests that the appropriate number of iterati-
ons can be used as the stopping criterion. Hence, the appropriate number of iterations to build
IMFs is used in this paper. This sifting process is ended until ω1 becomes an IMF. The residue
is obtained by:
101 - ωII = (3)
3) Treating the residue as the new input dataset. A series of {ωi} 1≤i≤J is obtained by repeating 2)
until IJ is a monotonic component (J denotes the decomposition levels). I can be recovered by
IEMD:
J
J
jj II +=∑
=1
ω (4)
Figure 1 shows one example of the EMD. The original image is downloaded from http://www.inria-
lpes.fr/is2/people/pgoncalv(accessed in April 2007). The original image contains three kinds of patterns.
The two modes and the residue show that patterns vary in size from the smallest to the largest.
Figure 1. (a) the original image; (b) IMF1; (c) IMF2; (d) the residue.
(a) (b) (c) (d)
Multifocus image fusion method based on the EMD is to fuse the residues and the IMFs by the
activity levels to produce a composite decomposition of the fused image. However, this simple fusion
rule sometimes may not produce optimal EMD representation of the fused image when adjacent EMD
coefficients are jointly considered to take fusion judgment where a decision fusion rule is needed. With
the SVM, one expects much room for improvement over the activity level based fusion schemes.
The SVMs are a set of related supervised learning methods used for classification and regression.
Interested readers may consult [18] for details. Given a group of labeled patterns {(xj, yj)}. xj and yj are
the pattern and the corresponding class label, respectively. Training a SVM is equivalent to tackling a
quadratic programming problem (QPP) in a number of variables equal to the number of patterns. The
solution to the QPP has the following form:

Sensors 2008, 8
2503
CxxKxxKyab
bxxKyxy
i
L
isiriii
L
iiii
≤≤+−=
+=
∑
∑
=
=
α
α
0)],(),([21
),(sgn)(
1
1 (5)
Figure 2. Schematic flowchart of the proposed algorithm.
JB
JA AJω
JC
JBS
JAS
BJω
CJω
AJ
Sω
BJ
Sω BS1ω
AS1ω
A1ω
C1ω
B1ω
K(xi, x) is the kernel function used to calculate the inner production of xi and x which means
respectively the support vector and validated input vector. L is the number of support vectors. αi is the
coefficient corresponding to xi. C is a user-defined regularization parameter. yr is different from ys.
Based on the outputs of the SVM corresponding to the inputs, the activity level based fusion rule
can be upgraded to the decision fusion rule in such a way that the trained SVM can be used to pick out
the focused EMD coefficients for preserving the salient information at each pixel location at each level.
2.2. The procedure of the proposed method
The proposed method (Figure 2) takes the following steps:
1) Extract generalized spatial frequency (S) of each pixel of A and B using a small window (W) cen-
tered at the current pixel position according to formula (6). In this paper, the W of 3×3 is used.
Let I and I(m, n) denote A or B and its gray value at (m, n), respectively. Then SI(m, n) is given by:
∑∈
−=Wlk
I nmIlkInmS),(
),(),(),( (6)
S is used to measure the overall activity level of a pixel value because it is a manner that gray
value switches to its neighbors.
2) Collect training patterns as follows: ( ) ( ){ } NnMmBBAA nmynmSnmynmS <≤<≤ 0,0),(),,(,),(),,( (7)
),(),(1),(),(
),(),(1),(),(
nmSnmSnmynmy
nmSnmSnmynmy
BABA
BABA
<−=−=>=−=
(8)
where M and N are the dimensions of A and B.
3) Train a SVM using the training patterns obtained 2). The kernel function used has the following
form:

Sensors 2008, 8
2504
)/||),(),(||||||exp(),(1
0
1
0
MNnmBnmAxxxxKM
m
N
njiji ∑∑
−
=
−
=
−−−= (9)
where xi and xj denote the training patterns given by equations (7) and (8).
4) Decompose A and B with EMD along rows and columns to J levels, resulting in a residue and a
total of J IMF planes, respectively.
5) Derive the S value of the EMD coefficients of A and B at each position at each level according to formula (6), denoted by ),( nmS A
jω and ),( nmS B
jω(1≤j≤J).
6) Perform the fusion based on the outputs of the SVM. If the SVM output is positive, coefficients
for the corresponding position of the fused image will come from A, and vice versa. In other words, the fused coefficient ),( nmC
jω at level j is given by:
JjnmSynmSynm
nmSynmSynmnm
Aj
Bj
Aj
Bj
Bj
AjC
j ,,1)),(()),((),(
)),(()),((),(),( L=
≥
<=
ωω
ωω
ωω
ω (10)
where )),(( nmSy Ajω
and )),(( nmSy Bjω
are the outputs of the SVM obtained in 3) by inputting the S
value obtained in 5).
7) Finally, the fused image is recovered by implementing IEMD according to formula (4).
In Figure 2, the position (m, n) has been omitted in order to be concise.
3. Experiments
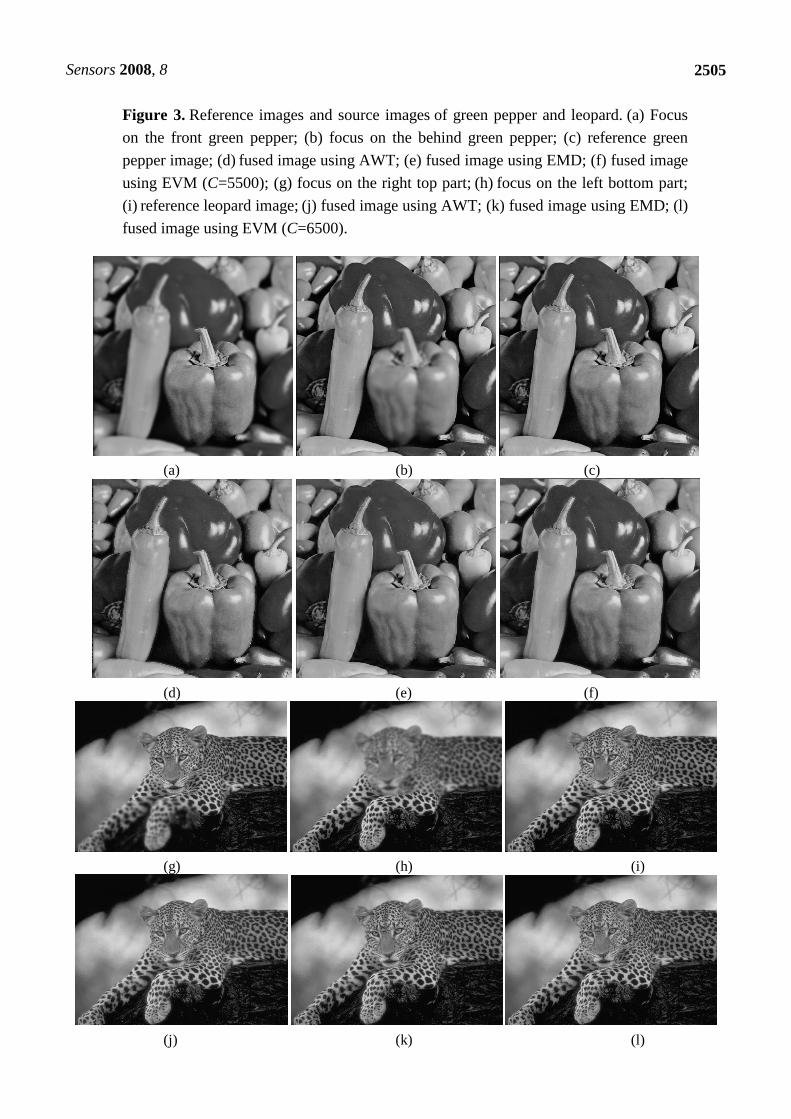
In this section, multifocus image fusion based on the AWT, the EMD, and the proposed method is
tested on two sets of images: green pepper (512×512) and leopard (480×360). Each reference image
[Figures 3(c) or 3(i)] contains one or more objects that are all in good focus. Two pairs of out-of-focus
images [Figures 3(a) and 3(b); Figures 3(g) and 3(h)] are produced from the reference images by first
blurring one object to obtain an image, and then blurring another object to produce second image.
When performing the AWT based fusion algorithm, because multiresolution analysis based on à
trous filter can preserve translation invariance, short decomposition/reconstruction filters are needed to
avoid ringing artifacts [19]. Max scheme choosing is used to select the significant coefficient, à trous
filter 2-1/2 (1/16, 1/4, 3/8, 1/4, 1/16), together with a decomposition level of three, coefficient based
activity. For the EMD, cubic spline function, along with two levels of decomposition and coefficient
based max scheme is used. For performing the proposed method termed EVM (Empirical support
Vector Machine), the SVM20 with the radial basis function is used, and this software was downloaded
from TUhttp://liama.ia.acUT.cn/PersonalPage/lbchen/svm20.zip (accessed in 2004). Based on formulae (6),
(7), and (8), the training patterns are abstracted from the input images. In this experiment, each pixel in
the multifocus images generates one training pattern. The fused images produced by the three methods
are shown in Figures 3(d)-(f) and Figures 3(j)-(l).
Two evaluation criteria are used. They are the Root Mean Squared Error (RMSE)
( )∑∑−
=
−
=
−=1
0
1
0
2),(),(1 M
m
N
n
nmInmFMN
RMSE (11)
between the fused image F and the reference image I, and the Mutual Information (MI)
)()(
),(log),(
21
21,2
1 121,
1 2khkh
kkhkkhMI
IF
IFL
k
L
kIF∑∑
= == (12)
Sensors 2008, 8
2505
Figure 3. Reference images and source images of green pepper and leopard. (a) Focus
on the front green pepper; (b) focus on the behind green pepper; (c) reference green
pepper image; (d) fused image using AWT; (e) fused image using EMD; (f) fused image
using EVM (C=5500); (g) focus on the right top part; (h) focus on the left bottom part;
(i) reference leopard image; (j) fused image using AWT; (k) fused image using EMD; (l)
fused image using EVM (C=6500).
(a) (b) (c)
(d) (e) (f)
(g) (h) (i)
(j) (k) (l)

Sensors 2008, 8
2506
Here, hF,I is the normalized joint gray level histogram of images F and I, hF and hI are the
normalized histograms of F and I, and L is the number of gray levels. RMSE is used to measure the
difference between F and I. MI is used to measure the reduction in uncertainty about I compared with F,
so a less RMSE and a larger MI are preferred. Quantitative comparison of their performance is shown
in Tables 1 and 2.
Table 1. Performance of the three fusion methods on processing Figure 3(a) and (b)
AWT EMD EVM
RMSE 5.2075 3.0118 2.6166
MI 2.5338 3.8520 3.9093
Table 2. Performance of the three fusion methods on processing Figure 3(d) and (e)
AWT EMD EVM
RMSE 3.8077 3.2249 2.7220
MI 1.7062 3.2331 3.4211
As can be found from Tables 1 and 2, the EVM exhibits significant improvements over the AWT
and EMD. The fused images produced by the EVM are nearly a combination of the good-focus parts of
the input images. In comparison, the fused images produced by the AWT and EMD are inferior.
The key reason for the superiority of the EVM over the AWT and EMD is the usage of generalized
spatial frequency in representing image clarity, which produces good input features for the SVM in
deciding which input image has the better focus at a specific pixel position.
Figure 4. (a) The effect of the C on the RMSE; (b) the effect of the C on the MI.
(a) (b)
The SVM requires the presetting of a regularization parameter [C in formula (5)] that trades off the
margin with training errors. In general, using the C value too large or too small is undesirable, and this
is corroborated by Figures 4(a) and (b), which show the effects of the C on the RMSE and MI by the
EVM with radial basis function (Kernel) and linear basis function (Linear) on processing Figures 3(a)

Sensors 2008, 8
2507
and (b), respectively. Initially, the parameter C is set to 5000. Then the C value is added and subtracted
by 2000 each time. Figures 4(a) and (b) are plot using the RMSE and MI values of the fused images
corresponding to the values of the C. In general, using a C value too large or too small is undesirable
because the performance is relatively stable over a large range of C.
4. Conclusions
In this paper, we study the wedding of EMD and SVM for fusing images with different focuses of
the same scene in order to get an image with every object in focus. The EMD is used for the multireso-
lution decomposition, while the SVM is employed to find the multifocus image with the better focus at a
given pixel position. Based on the outputs of the SVM, the fusion scheme based on the activity level of
the EMD coefficients can be improved to the decision fusion rule. This fusion scheme is used to select
the source multifocus image that has the best focus at each pixel location. Experiments corroborate that
the proposed method does better than the traditional AWT and EMD based fusion schemes in fusing
multifocus images in terms of the evaluation based on RMSE and MI. By working on the EVM fused
image rather than on the original defocused image, vision-related processing tasks can be expected to
yield more accurate results. Compared with the separate AWT and EMD based methods, the EVM
based method is more computational intensive when implemented to perform real-time image fusion.
However, overall evaluation shows that it is a promising method.
In remote sensing community, one of the most challenging tasks is fusion of images with different
imaging geometry and spatial resolution, for example, synthetic aperture radar images and Landsat
Thematic Mapping images. In the future, we intend to extend the proposed fuser to merge multisensor
images. Another is the fusion of images with obviously different pixel sizes and spectral properties,
such as Moderate Resolution Imaging Spectroradiometer (MODIS) images and TM images [20]. Here,
the fusion problem for the SVM then becomes how to choose the input image with the best spectral
and spatial response at each location.
Acknowledgements
This work was supported jointly by the Program of "One Hundred Talented People" of the Chinese
Academy of Sciences (CAS), the State Key Development Program for Basic Research of China with
grant number 2007CB714401-3, and the National Key Project of Scientific and Technical Supporting
Programs Funded by Ministry of Science & Technology of China (NO. 2006BAC08B0407). The auth-
ors thank the anonymous reviewers for their suggestions which greatly improved the paper.
References
1. Wang, W.W.; Shui, P. L.; Song, G.X. Multifocus image fusion in wavelet domain. Proceedings of
the 2th International Conference on Machine Learning and Cybernetics 2003, 2887-2890.
2. Li, S.T.; Kwok, J.T.; Tsang, I.W.; Wang, Y.N. Fusing Images With Different Focuses Using
Support Vector Machines. IEEE Transactions on neural networks 2004, 15, 1555-1561.
3. Huang, W.; Jing, Z.L. Multifocus image fusion using pulse coupled neural network. Pattern
Recognition Letters 2007, 28, 1123-1132.
Sensors 2008, 8
2508
4. Li, M.; Cai, W.; Tan, Z. A region-based multi-sensor image fusion scheme using pulse-coupled
neural network. Sensors 2008, 8, 520-528.
5. Piella, G. A general framework for multiresolution image fusion: from pixels to regions. Pattern
Recognition Letters 2006, 27, 1948-1956.
6. Li, S.T.; Kwok, J.T.; Wang, Y.N. Multifocus image fusion using artificial neural networks. Pattern
Recognition Letters 2002, 23, 985-997.
7. Li, S.T.; Kwok, J.T.; Wang, Y.N. Combination of images with diverse focuses using the spatial
frenquency. Information Fusion 2 2001, 169-176.
8. Mallat, S. G. A theory for multiresolution signal decomposition: The wavelet representation. IEEE
Transactions on Pattern Analysis and Machine Intelligence 1989, 11, 674-693.
9. Dutilleux, P. An implementation of the ‘algorithme à trous’ to compute the wavelet transform. In
Wavelets: Time-Frequency Methods and Phase Space. J. M. Combes, A. Grossman, and Ph.
Tchamitchian, Eds.; Springer-Verlag: Berlin, Germany, 1989; pp. 298-304.
10. Huang, N.E.; Shen, Z.; Long, S.R. The empirical mode decomposition and the Hilbert spectrum
for nonlinear and non-stationary time series analysis. Proc. R. Soc. Lond. 1998, A 454, 903-995.
11. Huang, W.; Shen, Z.; Huang, N.E.; Fung, Y.C. Nonlinear indicial response of complex non-
stationary oscillations as pulmonary hypertension responding to step hypoxia. Proc. Natl. Acad.
Sci. USA 1999, 96, 1834-1839.
12. Chen, S.H.; Su, H.B.; Zhang, R.H.; Tian, J. Fusing remote sensing images using à trous wavelet
transform and empirical mode decomposition. Pattern Recognition letters 2008, 29, 330-342.
13. Flandrin, P.; Rilling, G.; Goncalves, P. Empirical mode decomposition as a filter bank. IEEE
Signal Processing Letters 2004, 2,112-114.
14. Yang, Z.H.; Qi, D.X.; Yang, L.H. Signal period analysis based on Hilbert-Huang transform and its
application to texture analysis. Proceedings of the third international conference on image and
graphics 2004, 430-433.
15. Hariharan, H.; Gribok, A.; Abidi, M.A. Image fusion and enhancement via empirical mode
decomposition. Journal of Pattern Recognition Research 2006, 1, 16-31.
16. Zhao, Z.D.; Pan, M.; Chen, Y.Q. Instantaneous frequency estimate for non-stationary signal.
Proceedings of the 5th World Congress on Intelligent Control and Automation 2004, 4, 3641-3643.
17. Nunes, J.C.; Bouaoune, Y.; Delechelle, E.; Niang, O.; Bunel, Ph. Image analysis by bidimensional
empirical mode decomposition. Image and Vision Computing 2003, 21, 1019-1026.
18. Vapnik, V.N. An Overview of Statistical Learning Theory. IEEE Transactions on neural networks
1999, 5, 988-999.
19. Garzelli, A. Possibilities and Limitations of the Use of Wavelets in Image Fusion. Proceedings of
IEEE International Geoscience and Remote Sensing Symposium 2002, 1, 66-68.
20. Pal, S.K.; Majumdar, T.J.; Bhattacharya, A.K. ERS-2 SAR and IRS-1C LISS III data fusion: A
PCA approach to improve remote sensing based geological interpretation. ISPRS Journal of
Photogrammetry & Remote Sensing 2007, 61, 281-297.
© 2008 by MDPI (http://www.mdpi.org). Reproduction is permitted for noncommercial purposes.