improving collaborative forecasting performance in …
TRANSCRIPT

1
IMPROVING
COLLABORATIVE FORECASTING
PERFORMANCE
IN THE FOOD SUPPLY CHAIN
A thesis submitted for the degree of
DOCTOR OF PHILOSOPHY
by
Can Eksoz, BSc, MSc
Operations and Supply Chain Systems Group (OASIS)
Brunel Business School
Brunel University, London
June 2014

2
Abstract
The dynamic structure of the Food Supply Chain (FSC) distinguishes itself from
other supply chains. Providing food to customers in a healthy and fresh manner
necessitates a significant effort on the part of manufacturers and retailers. In practice,
while these partners collaboratively forecast time-sensitive and / or short-life
product-groups (e.g. perishable, seasonal, promotional and newly launched
products), they confront significant challenges which prevent them from generating
accurate forecasts and conducting long-term collaborations. Partners’ challenges are
not limited only to the fluctuating demand of time-sensitive product-groups and
continuously evolving consumer choices, but are also largely related to their
conflicting expectations. Partners’ contradictory expectations mainly occur during
the practices of integration, forecasting and information exchange in the FSC.
This research specifically focuses on the Collaborative Forecasting (CF) practices in
the FSC. However, CF is addressed from the manufacturers’ point of view, when
they collaboratively forecast perishable, seasonal, promotional and newly launched
products with retailers in the FSC. The underlying reasons are that while there is a
paucity of research studying CF from the manufacturers’ standpoint, associated
product-groups decay at short notice and their demand is influenced by uncertain
consumer behaviour and the dynamic environment of FSC. The aim of the research
is to identify factors that have a significant influence on the CF performance.
Generating accurate forecasts over the aforementioned product-groups and
sustaining long-term collaborations (one year or more) between partners are the two
major performance criteria of CF in this research.
This research systematically reviews the literature on Collaborative Planning,
Forecasting and Replenishment (CPFR), which combines the supply chain practices
of upstream and downstream members by linking their planning, forecasting and
replenishment operations. The review also involves the research themes of supply
chain integration, forecasting process and information sharing. The reason behind
reviewing these themes is that partners’ CF is not limited to forecasting practices, it
also encapsulates the integration of chains and bilateral information sharing for
accurate forecasts. A single semi-structured interview with a UK based food

3
manufacturer and three online group discussions on the business oriented social
networking service of LinkedIn enrich the research with pragmatic and qualitative
data, which are coded and analysed via software package QSR NVivo 9.
Modifying the results of literature review through the qualitative data makes it
possible to develop a rigorous conceptual model and associated hypotheses. Then, a
comprehensive online survey questionnaire is developed to be delivered to food
manufacturers located in the UK & Ireland, North America and Europe. An
exploratory data analysis technique using Partial Least Squares (PLS) guides the
research to analyse the online survey questionnaire empirically. The most significant
contributions of this research are (i) to extend the body of literature by offering a
new CF practice, aiming to improve forecast accuracy and long-term collaborations,
and (ii) to provide managerial implications by offering a rigorous conceptual model
guiding practitioners to implement the CF practice, for the achievement of accurate
forecasts and long-term collaborations.
In detail, the research findings primarily emphasise that manufacturers’
interdepartmental integration plays a vital role for successful CF and integration with
retailers. Effective integration with retailers encourages manufacturers to conduct
stronger CF in the FSC. Partners’ forecasting meetings are another significant factor
for CF while the role of forecasters in these meetings is crucial too, implying
forecasters’ indirect influence on CF. Complementary to past studies, this research
further explores the manufacturers’ various information sources that are significant
for CF and which should be shared with retailers. It is also significant to maintain the
quality level of information whilst information is shared with retailers. This result
accordingly suggests that the quality level of information is obliquely important for
CF.
There are two major elements that contribute to the literature. Firstly, relying on the
particular product-groups in the FSC and examining CF from the manufacturers’
point of view not only closes a pragmatic gap in the literature, but also identifies new
areas for future studies in the FSC. Secondly, the CF practice of this research
demonstrates the increasing forecast satisfaction of manufacturers over the
4
associated product-groups. Given the subjective forecast expectations of
manufacturers, due to organisational objectives and market dynamics, demonstrating
the significant impact of the CF practice on the forecast satisfaction leads to
generalising its application to the FSC. Practitioners need to avail themselves of this
research when they aim to collaboratively generate accurate forecasts and to conduct
long-term collaborations over the associated product-groups.
The benefits of this research are not limited to the FSC. Manufacturers in other
industries can benefit from the research while they collaborate with retailers over
similar product-groups having a short shelf life and / or necessitating timely and
reliable forecasts. In addition, this research expands new research fields to academia
in the areas of the supply chain, forecasting and information exchange, whilst it calls
the interest of academics to particular product-groups in the FSC for future research.
Nevertheless, this research is limited to dyad manufacturer-retailer forecast
collaborations over a limited range of product-groups. This is another opportunity for
academics to extend this research to different types of collaborations and products.
Key words: Food industry; Collaborative forecasting; Forecast satisfaction; External
integration; Internal integration; Group forecasting; Forecasters; Information types;
Information quality

5
Publications based on this research
Journal publications:
Eksoz, C., Mansouri, S. A., Bourlakis, M. “Collaborative Forecasting in the Food
Supply Chain: A Conceptual Framework”, International Journal of Production
Economics (Date of first submission: 20th
September 2013, date of major &
minor revision request: 04th
March 2014, date of second submission: 12th
June
2014)
Eksoz, C., Mansouri, S. A., Bourlakis, M. and Aktas E. “Improving collaborative
forecasting performance in the food chain: Empirical evidence from
manufacturers”, Journal of Operations Management (Date of -expected-
submission: in October 2014)
Conference proceedings:
Eksoz, C., Mansouri, A. and Doran, D. (2012), “Exploring Collaborative
Forecasting in the UK Food Supply Chain”, in the 4th
World Conference on
Production and Operations Management, Amsterdam, The Netherlands, 1st – 5
th
July 2012
Eksoz, C. and Mansouri, A. (2012), “Long-term and Accurate Collaborative
Forecasting Between Supply Chain Members: An Empirical Study in the UK
Food Sector”, in the 32nd
Annual International Symposium on Forecasting (ISF)
Conference, Boston, USA, 24th
– 27th
June 2012
Eksoz, C. and Mansouri, A. (2012), “A Conceptual Framework for Collaborative
Forecasting in the UK Food Supply Chain”, in the 23rd
Annual Production and
Operations Management Society (POMS) Conference, Chicago, Illinois, USA,
20th
– 23rd
April 2012
Awards based on this research
Brunel Business School, OASIS Research Centre – Conference Fee Award for
the 4th
World Conference on Production and Operations Management,
Amsterdam, The Netherlands
Brunel University, Brunel Graduate School – Vice-Chancellor’s Travel Prize
Award for the 23rd
Annual Production and Operations Management Society
(POMS) Conference, Chicago, Illinois, USA

6
Acknowledgements
Firstly, I would like to thank my supervisors Dr Mansouri and Professor Bourlakis
for their genuine support, incentive and guidance through my research journey. Dr
Mansouri guided me very professionally in terms of staying focused on the research
problems that are substantial in practice and pursuing the research in a particular
field without departing from the major subject of my research. Even more
importantly, he has been an excellent role model of an academic by demonstrating an
authentic ambition for research and a marvellous enthusiasm in terms of exploring
new ideas. His continuous encouragement to attend diverse academic workshops and
summits has been another contribution for me in enhancing technical skills and
expanding my academic network.
I cannot overlook the fantastic leadership and the elaborative role of Professor
Bourlakis. His status not only enabled me to drive the research on a correct and
trustworthy path, but also to improve myself as a meticulous researcher. Therefore,
he is going to be a unique reference for me whilst I build my future career in the
academic field. His extensive background and knowledge in the food industry is also
a building block of my research, because conducting research in his area of expertise
has been a kind of spur for me to exceed expectations. Further, benefiting from his
experience has been an invaluable opportunity in terms of being an expert in the
same research field as him.
Secondly, I would like to specially thank Professor Önkal, who supervised me
during the first six months of my PhD journey. Her invaluable counselling and
continuous support constitute the raw materials of this research. I am extremely
pleased to follow her research philosophy in the field of forecasting. I am delighted
to acknowledge all the kindness and support of Dr Aktas. Her assistance enabled me
to improve my analytical skills and to take lessons from her academic experience.
Thirdly, I am grateful to my mother, father and sister for their eternal support and
exhorting me to cope with the difficulties that I faced through this journey. Their
relief always helps me to break down my personal boundaries and to achieve more
than expected. I hope that completing this research will be only a beginning point to
make them proud of me.

7
Finally, my appreciation goes to all the practitioners who contributed to online group
discussions on the professional page of LinkedIn and the survey questionnaire. I am
grateful to a supply chain manager of a food manufacturer who shared his frank
views through the data collection process of this research. Having these
practitioners’ comments and experience has become one of the building stones of
this research in terms of providing rigid managerial implications. I am deeply
thankful to Brunel Business School for awarding me the “GTA Scholarship
Program” and creating an opportunity of being awarded with a PhD degree. I want to
record my sincere thanks to all members of the Business School due to their
friendliness and helpfulness.
Declaration
I hereby declare that I am the only author of this thesis, and this thesis does not
include any material that has been submitted previously, in whole or in part, for the
award of any other academic degree or diploma in this or any other university.
I declare that the idea of exploring research problems and the development of this
comprehensive thesis, namely Improving Collaborative Forecasting Performance in
the Food Supply Chain, are entirely my own work. I also certify that the effort that
has been put into through the review of literature, data collection and analysis, and
reporting belongs to me. Therefore, the thesis does not infringe on copyrights of
anyone nor violate any proprietary rights, including any ideas, techniques,
quotations, or any other material from the work of other authors. Wherever
contributions of other authors are involved in this thesis, a particular attention has
been paid to indicating this in accordance with academic rules.
I also certify that all information shared in this thesis has been obtained and
conveyed to the reader in conformity with ethical procedures.
Can Eksoz

8
LIST OF CONTENTS
CHAPTER 1: INTRODUCTION……………………………………………………...15
1.1. BACKGROUND OF CPFR ............................................................................. 15
1.2. DESCRIPTION OF COLLABORATIVE FORECASTING (CF) PROBLEMS ............. 16
1.3. RESEARCH AIM AND OBJECTIVES ................................................................. 17
1.4. RESEARCH QUESTIONS ................................................................................ 19
1.5. FOOD SUPPLY CHAIN (FSC) ........................................................................ 22
1.5.1. Supply Chain in the Food Industry .................................................... 22
1.5.2. FSC in Europe and North America .................................................... 23
1.5.3. Environmental uncertainties in the FSC ............................................ 24
1.5.4. Time-sensitive and / or short-life product-groups in the FSC ........... 26
1.5.4.1. Perishable and seasonal products ................................................... 26
1.5.4.2. Promotional products ..................................................................... 27
1.5.4.3. Newly launched products ............................................................... 28
1.6. RESEARCH APPROACH AND PHILOSOPHY ..................................................... 29
1.7. RESEARCH STRATEGY ................................................................................. 31
1.8. THESIS OUTLINE .......................................................................................... 33
2.CHAPTER 2: LITERATURE REVIEW…………………………………………….36
2.1. OVERVIEW .................................................................................................. 36
2.2. SYSTEMATIC REVIEW METHODOLOGY ......................................................... 37
2.2.1. Systematic review protocol ................................................................ 39
2.2.2. Analysis of systematic review and data extraction ............................ 42
2.2.3. Results of systematic review process ................................................. 43
2.3. COLLABORATIVE PLANNING, FORECASTING AND REPLENISHMENT (CPFR) 52
2.3.1. Steps of CPFR .................................................................................... 54
2.3.2. CF in practice .................................................................................... 60
2.3.2.1. CF for perishable and seasonal products ........................................ 61
2.3.2.2. CF for promotional products .......................................................... 62
2.3.2.3. CF for newly launched products .................................................... 64
2.4. SALES AND OPERATIONS PLANNING (S&OP) AND OTHER PRACTICES IN THE
FSC……………………………………………………………………………….67
2.4.1. Vendor Managed Inventory (VMI) ..................................................... 70

9
2.4.2. Quick Response (QR) ......................................................................... 72
2.4.3. Efficient Consumer Response (ECR) ................................................. 73
2.5. SUPPLY CHAIN INTEGRATION ...................................................................... 78
2.5.1. Barriers that prevent the integration of FSC ..................................... 80
2.5.2. Integration between manufacturers and retailers .............................. 83
2.6. FORECASTING PROCESS ............................................................................... 88
2.6.1. Forecasting strategies ........................................................................ 90
2.6.2. Forecasting method selection criteria ............................................... 94
2.6.3. Duration of forecasts ......................................................................... 95
2.6.4. Comparison of forecasting methods................................................... 97
2.6.5. Accuracy measurement techniques .................................................... 99
2.6.6. Forecasting meetings ....................................................................... 100
2.6.7. Role of forecasters............................................................................ 106
2.7. INFORMATION SHARING ............................................................................ 108
2.7.1. Manufacturer-retailer information .................................................. 111
2.7.1.1. Retailer information ..................................................................... 111
2.7.1.2. Manufacturer information ............................................................ 114
2.7.2. Quality level of information ............................................................. 119
2.7.3. Role of Information Technology (IT) systems in CF ........................ 122
2.8. SUMMARY ................................................................................................. 126
3.CHAPTER 3: DEVELOPMENT OF HYPOTHESES AND CONCEPTUAL
MODEL……………………………………………………………………………….130
3.1. OVERVIEW ................................................................................................ 130
3.2. THEORETICAL BACKGROUND AND HYPOTHESIS DEVELOPMENT ................ 131
3.2.1. The CF practice................................................................................ 135
3.2.1.1. Trust and commitment ................................................................. 137
3.2.1.2. A joint business plan .................................................................... 139
3.2.1.3. Consensus-based internal forecasts .............................................. 139
3.2.1.4. Sharing of order forecasts ............................................................ 141
3.2.2. Integration of manufacturers ........................................................... 144
3.2.2.1. External integration ...................................................................... 144
3.2.2.2. Internal integration ....................................................................... 147
3.2.3. Forecasting process ......................................................................... 150

10
3.2.3.1. Forecast horizon ........................................................................... 151
3.2.3.2. Group forecasting ......................................................................... 153
3.2.3.3. Forecasters’ competence .............................................................. 155
3.2.1. Information sharing ......................................................................... 157
3.2.1.1. Information types ......................................................................... 158
3.2.1.2. Information quality....................................................................... 159
3.3. SUMMARY ................................................................................................. 164
4.CHAPTER 4: RESEARCH METHODOLOGY AND DATA COLLECTION……170
4.1. OVERVIEW ................................................................................................ 170
4.2. RATIONALE FOR RESEARCH METHODOLOGY ............................................. 171
4.2.1. Research approaches and philosophies ........................................... 171
4.2.2. Research strategies and triangulation ............................................. 179
4.3. RESEARCH DESIGN .................................................................................... 185
4.4. DATA COLLECTION PROCESS – MIXED DESIGN ........................................... 190
4.4.1. Rationale for using social networking sites for academic research 192
4.5. QUALITATIVE DATA COLLECTION PROCESS ............................................... 195
4.5.1. A single semi-structured interview ................................................... 196
4.5.1.1. Rationale for employing semi-structured interview ..................... 196
4.5.1.2. Process of the semi-structured interview ..................................... 198
4.5.1.3. Qualitative analysis of the semi-structured interview .................. 198
4.5.1.4. Outcomes of the semi-structured interview ................................. 200
4.5.2. Three online group discussions ........................................................ 205
4.5.2.1. Rationale for employing online group discussions ...................... 205
4.5.2.2. Process of the online group discussions ....................................... 208
4.5.2.3. Qualitative analysis of the group discussions .............................. 210
4.5.2.4. Outcomes of the online group discussions ................................... 211
4.6. QUANTITATIVE DATA COLLECTION PROCESS ............................................. 215
4.6.1. Rationale for employing online survey questionnaire ..................... 216
4.6.2. Design of the online survey questionnaire ....................................... 219
4.6.3. Target population and sampling ...................................................... 222
4.6.3.1. Sampling frame ............................................................................ 223
4.6.3.2. Sampling technique ...................................................................... 228
4.6.3.3. Sample size................................................................................... 229

11
4.6.4. Quantitative data collection stages .................................................. 230
4.6.4.1. Stage – 1: Social networking service LinkedIn ........................... 230
4.6.4.2. Stage – 2: Online databases of Bloomberg, FEMA and Osiris .... 232
4.6.4.3. Stage – 3: Websites of food and beverage federations ................ 233
4.6.4.4. Stage – 4: Personal contacts of the author ................................... 233
4.6.5. Assessment of sample size and response rate .................................. 235
4.6.5.1. Characteristics of sample data ...................................................... 236
4.6.5.2. Comparison analysis for sample size and response rate .............. 237
4.6.5.3. Types of data analysis technique ................................................. 238
4.7. SUMMARY ................................................................................................. 242
5.CHAPTER 5: DATA ANALYSIS AND FINDINGS……………………………...246
5.1. OVERVIEW ................................................................................................ 246
5.2. RATIONALE FOR USING PARTIAL LEAST SQUARES (PLS) ........................... 247
5.3. DEVELOPMENT OF A FORMATIVE CONSTRUCT: THE CF PRACTICE............. 250
5.4. DESCRIPTIVE STATISTICS .......................................................................... 254
5.5. NON-RESPONSE BIAS ................................................................................. 262
5.6. MEASUREMENT MODEL FOR REFLECTIVE CONSTRUCTS ............................. 263
5.7. MEASUREMENT MODEL FOR THE FORMATIVE CONSTRUCT ........................ 268
5.8. MODEL FIT FOR THE CONCEPTUAL MODEL ................................................ 273
5.9. FINDINGS FOR THE STRUCTURAL MODEL ................................................... 280
5.10. SUMMARY ................................................................................................. 289
6.CHAPTER 6: DISCUSSION AND CONCLUSIONS……………………………..293
6.1. OVERVIEW ................................................................................................ 293
6.2. SCOPE OF RESEARCH AND KEY CONTRIBUTIONS ........................................ 293
6.2.1. Scope of chapter one – Introduction ................................................ 294
6.2.2. Scope of chapter two – Literature review ........................................ 294
6.2.3. Scope of chapter three – Development of hypotheses and conceptual
model…………………………………………………………………………………..296
6.2.4. Scope of chapter four – Research methodology and data
collection………………………………………………………………………………298
6.2.5. Scope of chapter five – Data analysis and findings ......................... 300
6.3. THEORETICAL AND MANAGERIAL IMPLICATIONS....................................... 304

12
6.3.1. The CF practice in the FSC ............................................................. 304
6.3.2. Integration of supply chain .............................................................. 308
6.3.3. Group based forecasting .................................................................. 313
6.3.4. Information exchange....................................................................... 318
6.4. FUTURE RESEARCH AND LIMITATIONS ....................................................... 322
LIST OF ABBREVIATIONS………………………………………………………...329
REFERENCES………………………………………………………………………..330
APPENDIX-I: A SINGLE SEMI-STRUCTURED INTERVIEW…………………...352
APPENDIX-II: ONLINE GROUP DISCUSSION -1………………………………...354
APPENDIX-II: ONLINE GROUP DISCUSSION -2………………………………...355
APPENDIX-II: ONLINE GROUP DISCUSSION -3………………………………...356
APPENDIX-III: ITEMS OF SURVEY AND RELEVANT REFERENCES………...357
APPENDIX-IV: STATEMENTS OF ETHICS APPROVAL………………………..360

13
LIST OF FIGURES
Figure 2.1. Systematic review protocol ................................................................................... 40
Figure 2.2. Publication trend of systematically reviewed articles ........................................... 44
Figure 2.3. Geographical distribution based on the affiliation of the first author .................... 46
Figure 2.4. Methodological contributions of journals .............................................................. 47
Figure 2.5. Methodological contributions of articles ............................................................... 48
Figure 2.6. CPFR Model – Manufacturer and retailer tasks .................................................... 53
Figure 2.7. CPFR process model ............................................................................................. 57
Figure 2.8. S&OP Process ........................................................................................................ 67
Figure 3.1. The CF practice ................................................................................................... 143
Figure 3.2. Conceptual Model ................................................................................................ 162
Figure 4.1. Systematic approach of research ......................................................................... 185
Figure 4.2. Multi-items scale development procedure ........................................................... 188
Figure 4.3. Strategic research process - Flowchart ................................................................ 189
Figure 4.4. Structural and chronological data collection process .......................................... 191
Figure 5.1. Two-construct model for the external validity of the CF practice ...................... 273
Figure 5.2. Results of the structural model ............................................................................ 281
LIST OF TABLES
Table 1.1. Supply chain characteristics in Europe and North America ................................... 23
Table 2.1. The three-stage approach of systematic review ...................................................... 37
Table 2.2. Primary and complementary keywords................................................................... 41
Table 2.3. Classification of systematic review analysis ........................................................... 43
Table 2.4. Classification of journals ........................................................................................ 45
Table 2.5. List of articles selected based on their contributions to the food industry,
research themes and product-groups ................................................................................ 51
Table 2.6. Objectives and benefits of collaboration practices along with the role of
partners in these collaborations ........................................................................................ 77
Table 2.7. Strengths and weaknesses of techniques used for forecasting meetings .............. 105
Table 2.8. Requirements for manufacturers and retailers for CPFR implementation ............ 116
Table 3.1. Relevant references of formative variables constituting the CF practice ............. 143
Table 3.2. Relevant references of hypotheses ........................................................................ 163

14
Table 4.1. Major differences between deductive and inductive approaches to research ....... 172
Table 4.2. Epistemological research philosophies / paradigms ............................................. 174
Table 4.3. Methodological aspect of the current research ..................................................... 178
Table 4.4. Data collection methods of research strategies ..................................................... 180
Table 4.5. LinkedIn-based online group discussions ............................................................. 210
Table 4.6. Survey questionnaire oriented studies................................................................... 218
Table 4.7. Target regions of the sampling frame ................................................................... 226
Table 4.8. Outcomes of quantitative data collection stages ................................................... 235
Table 5.1. Results of descriptive statistics ............................................................................. 255
Table 5.2. Frequency level of product-groups considered in CF ........................................... 257
Table 5.3. Chi-Square tests of product-groups in different regions ....................................... 258
Table 5.4. Frequency level of product-groups considered in different regions ..................... 259
Table 5.5. Independent T-statistics for non-response bias ..................................................... 262
Table 5.6. Analysis procedures for reflective constructs in the measurement model ............ 263
Table 5.7. Results of reliability analysis ................................................................................ 264
Table 5.8. Results of discriminant validity ............................................................................ 266
Table 5.9. Constructs and measurement items ....................................................................... 267
Table 5.10. Analysis procedures for formative construct in the measurement model ........... 269
Table 5.11. Weights and T-statistics of formative items ....................................................... 270
Table 5.12. Multicollinearity statistics ................................................................................... 271
Table 5.13. Analysis procedures for the structural model ..................................................... 275
Table 5.14. Variance explained, communality and redundancy ............................................ 276
Table 5.15. Effect size of independent variables (ƒ²) ............................................................ 277
Table 5.16. Results of blindfolding procedure ....................................................................... 279
Table 5.17. Effect size of endogenous variables (q²) ............................................................. 280
Table 5.18. Results of hypothesis testing ............................................................................... 287
Table 6.1. Contributions to theory, methodology and practice .............................................. 303

15
CHAPTER 1: INTRODUCTION
1.1. Background of CPFR
Collaborative Planning, Forecasting and Replenishment (CPFR) is one of the
efficient business practices that underpins the process management and information
sharing activities between partners for better demand visibility in supply chains
(Siefert, 2003). The history of CPFR dates back to 1996, when Wal-Mart and
Warner-Lambert in the USA incorporated three sub-stages of planning, forecasting
and replenishment in a joint project. Several reasons led to the development of
CPFR, such as reducing inventory level, comparing sales and forecasts, taking
timely decisions and providing homogeneity among supply chain members (Ireland
and Crum, 2005).
A number of studies have been conducted on CPFR and its components in several
industries (Sari, 2008; Småros, 2007; Danese, 2007; Aviv, 2007; 2002; 2001).
However, case studies concluded that manufacturers and retailers cannot accomplish
accurate Collaborative Forecasting (CF) for the long-term, for a period of one year or
more, when time-sensitive and / or short-life product-groups are subject to
collaborations in the Food Supply Chain (FSC) (Småros, 2007). In essence, FSC is a
challenging platform for partners in terms of conducting long-term collaborations
(Småros, 2003). Generating accurate forecasts becomes even more difficult when
perishable, seasonal, promotional and newly launched products are taken into
account (Adebanjo, 2009; Du et al., 2009; Småros, 2007; Adebanjo and Mann,
2000).
Literature has attributed the failure to implement long-term and accurate CF to
multiple reasons. Along with the dominance of retailers (Aviv, 2007; Småros, 2007),
lack of trust and commitment between partners appeared as leading barriers (Vlachos
and Bourlakis, 2006; Fliedner, 2006; 2003). Manufacturers’ lack of confidence in
generating sales forecasts, long lead-times and production plans, and their poor
interdepartmental integration appeared to be other reasons too (Småros, 2007; Helms
et al., 2000), followed by inadequate information exchange between partners (Zhou
and Benton Jr, 2007; Taylor and Fearne, 2006). Retailers’ naive forecasting process,
and reluctant and opportunistic behaviours during information sharing have likewise

16
been considerable barriers to long-term collaborations (Taylor and Xiao, 2010;
Taylor, 2006). By observing the European grocery sector, Småros (2007)
emphasised the existing gap between theory and practice, and stressed the scarcity of
empirical studies investigating manufacturers’ role in CF for further insight into the
academic field and practice.
1.2. Description of Collaborative Forecasting (CF) problems
In FSC, it is not apparent how manufacturers and retailers can sustain long-term
collaborations (Du et al., 2009; Småros, 2007; Vlachos and Bourlakis, 2006). There
are hurdles preventing both manufacturers and retailers from benefiting from CF in
the food industry, which has an uncertain environment and enables partners to
merchandise products that have volatile demand (Du et al., 2009; Aviv, 2007;
Småros, 2007). Particularly, partners confront considerable barriers to foresee the
demand for perishable, seasonal, promotional and newly launched products (Du et
al., 2009; Adebanjo, 2009; Ali et al., 2009; Småros, 2007; Taylor, 2006).
FSC harbours the short shelf life of perishable and seasonal products that necessitate
substantial care and effort in managing their freshness and shelf availability. This
relies on partners’ forecasting and operational practices, such as production,
distribution and inventory management (Ahumada and Villalobos, 2009; Du et al.,
2009). In a similar vein, managing the demand for promotional products is difficult
because of different duration and discounts offered, which, in turn, cause sales
variability, inefficient production, excessive / deficient stocks, and deteriorating
customer service (Ramanathan and Muyldermans, 2010; Adebanjo and Mann, 2000).
Forecasting newly launched products is likewise a challenge for partners due to a
lack of historical data, demand variability and uncertainty about consumer choices
(Yan and Dooley, 2014; Småros, 2003; Bitran and Mondschein, 1997).
Studies in the FSC further focused on partners’ unsteady forecast collaborations
(Nakano, 2009; Danese, 2007; Småros, 2007) and supply chain integration (Van der
Vaart et al., 2012; Flynn et al., 2010; Van der Vaart and Van Donk, 2008). Some
studies considered demand management (Adebanjo, 2009; Taylor and Fearne, 2006;
Taylor, 2006), the forecasting process (Danese and Kalchschmidt, 2011; Davis and

17
Mentzer, 2007; Zotteri et al., 2005; Adebanjo and Mann, 2000) and information
sharing between partners (Özer et al., 2011; Sanders, 2008; Zhou and Benton Jr,
2007; Hill and Scudder, 2002). Literature suggests that conducting efficient CF is
profitable for partners (Aviv, 2007; 2001). CF enables manufacturers to increase
sales and cycle times and to reduce the inventory level and capacity building costs,
while forecast accuracy and product flow are improved in collaborations (Fliedner,
2006). It likewise allows retailers to increase service levels and sales, to improve
order response, and to reduce inventory levels as well as the volume of products that
perish (Fliedner, 2003).
1.3. Research aim and objectives
By extending the study of Småros (2007), this research investigates CF over the
dyad manufacturer-retailer collaborations in the FSC. The particular focus is
manufacturers and their practices that occur throughout the integration of supply
chain, the forecasting process and information sharing with retailers. In this regard,
the aim of this research is:
To identify factors that have a significant influence on achieving the
Collaborative Forecasting Performance of manufacturers, when they
collaboratively forecast perishable, seasonal, promotional and newly launched
products with retailers in the FSC. Criteria of the Collaborative Forecasting
Performance for manufacturers are (i) to improve the forecast accuracy of
associated product-groups and (ii) to conduct long-term collaborations with
retailers (one year or more).
Accordingly, the aim of the current research is translated into three core objectives.
The primary objective is:
To analyse the supply chain integration of manufacturers both externally and
internally, in which external integration spans their relation with retailers and
internal integration surrounds their interdepartmental relations.
The rationale of this objective encompasses partners’ conflicting expectations that
occur during their forecasting and information sharing practices which prevent long-

18
term CF (Fang and Meng, 2010; Småros, 2007; Aviv, 2007; 2002). Hence, the
literature needs further clarification about manufacturers’ integration in the FSC,
while they apply CF in conjunction with retailers. Following this, the second
objective of this research is:
To examine the forecasting process of manufacturers, when they generate the
forecasts of related product-groups within their departments, and when they
aggregate these forecasts with retailers’ forecasts in group meetings.
The justification of this objective is connected with manufacturers’ incoherent
forecasts and their horizon, which are estimated within different departments with
the aim being to achieve departmental objectives over different sources (Småros,
2007; Helms et al., 2000). Manufacturers’ multiple forecasts cause additional
inventory and exacerbate internal-external conflicts that prevent them from coming
to a consensus with retailers (Taylor and Fearne, 2006; Fliedner, 2006; 2003; Helms
et al., 2000). Given the evidence from the literature, it is reasonable to address
manufacturers’ forecasting process in this research and to shed light on their CF in
practice. The final objective of this research is:
To investigate manufacturers’ information sharing, when they exchange various
information sources with retailers, and when the quality of information shared
plays a vital role in the forecast accuracy of associated product-groups.
The rationale of this objective is associated with manufacturers’ unstructured
information sharing process, which causes complexities not only between
departments, but also with retailers (Zhu et al., 2011; Chang et al., 2007; Zhou and
Benton Jr, 2007; Chen et al., 2000). Further examination seems essential to clarify
the way/s of sharing correct information in an adequate form by adding further
insight into the debates about sharing correct information (Zotteri et al., 2005).
Considering the significance of information sharing in supply chains, practitioners
need more implications to learn how they can benefit from information sharing in
collaborations (Zhou et al., 2014; Zhou and Benton Jr, 2007). Therefore, this
research finally addresses the manufacturers’ information sharing practice to broaden
the knowledge on CF and to provide implications for practice.

19
1.4. Research questions
The research questions of this research are built upon the three major objectives that
were addressed in the previous section. Each research question addresses the
particular research theme of this research, and examines their impact on the CF of
manufacturers in the FSC. In response to the first objective of this research, where
the purpose is to analyse the supply chain integration of manufacturers both
externally and internally throughout CF, the first research question is formulated as:
R.Q.1: What factors in terms of manufacturers’ supply chain integration
influence their collaborative forecasts with retailers in achieving long-term and
accurate CF?
To answer this research question, manufacturers’ behaviours and operational
practices in the chain as well as technological infrastructure for internal and external
information exchange are scrutinised (Van der Vaart et al., 2012; Stevens, 1989).
Externally, forecasting and information sharing practices that are contrary to
retailers’ expectations are taken into account due to the negative impact of these
conflicts on the long-term CF (Fang and Meng, 2010; Småros, 2007; Aviv, 2007;
2002). Internally, manufacturers’ insufficient interdepartmental integration is
considered which engenders conflicting and multiple forecasts, generated based on
departmental objectives and harm collaborations with retailers (Fliedner, 2006;
Helms et al., 2000). In this respect, the first research question relies largely on
manufacturers’ internal and external coordination, and investigates associated factors
to reveal their impact on the forecast accuracy and the duration of forecast
collaborations.
The following research question represents the second objective of this research,
where the intention is to examine the forecasting process of manufacturers. The
forecasting process in this research is twofold. The first process involves
manufacturers’ internal procedures whereby associated department/s generates the
forecasts of related product-groups. The second process refers to the group meetings,
where manufacturers and retailers meet to aggregate their own forecasts and to have

20
a consensus on a single forecast. In this respect, the second research question is
formulated as:
R.Q.2: What factors in terms of manufacturers’ forecasting process influence
their collaborative forecasts with retailers in achieving long-term and accurate
CF?
In terms of the forecasting process of manufacturers, the forecasting literature
becomes the focus of the current research to reveal a broad range of future research
fields. However, in reply to the second research question, this research exhibits a
selective attitude not only to extend the literature to rigorous contributions, but also
to offer applicable implications to practice. Herein, in addition to manufacturers’
incompatible departmental forecasts that exacerbate internal-external conflicts
(Taylor and Fearne, 2006; Fliedner, 2006; 2003; Helms et al., 2000), the horizon of
forecasts is addressed (Småros, 2007; Aviv, 2002; 2001). By considering partners’
group meetings, their overlapping expectations that prevent consensus on a single
forecast are examined (Kerr and Tindale, 2011; Fliedner, 2006). The role of
forecasters are also analysed due to their considerable impact on decisions given
through CF and group meetings (Önkal et al., 2012; 2011; Småros, 2007; Lawrence
et al., 2006).
Finally, the third objective of this research makes it possible to form the final
research question. The final question addresses manufacturers’ diverse information
sources, which are likely to be beneficial in CF if they are shared with retailers. This
question further interrogates the quality of these information sources in an attempt to
add insight to the forecast accuracy of associated product-groups, due to their time-
sensitive and / or short-life features in the FSC. The final research question is as
follows:
R.Q.3: What factors in terms of manufacturers’ information sharing influence
their collaborative forecasts with retailers in achieving long-term and accurate
CF?

21
Information sharing is a key practice not only to enhance transparency,
organisational performance and forecast accuracy, but also to build trustworthy
collaborations in the FSC (Fischer, 2013; Barratt and Oliveira, 2001). However,
manufacturers’ unstructured information sharing process causes complexities
between departments (Zhu et al., 2011; Chang et al., 2007) and accordingly prevents
long-term CF with retailers (Småros, 2007; Aviv, 2007). Such information sharing
related challenges become even more important since environmental uncertainties
(e.g. promotions, advertising and seasonality) are subject to collaborations, which
raise the importance of selecting relevant / correct information and controlling their
quality in the FSC (Taylor and Fearne, 2006; Zotteri et al., 2005). Given the scarcity
of research in the literature closing this gap, manufacturers’ different types of
information sources should be examined to clarify what sort of data is beneficial in
CF to be shared with retailers (Zotteri et al., 2005). Having a clear understanding
about which information and in which form it is beneficial is vital to generate
accurate forecasts for perishable, seasonal, promotional and newly launched products
due to their either short-life or high demand variability.
Furthermore, problems in terms of irregular information sharing, late responses and
lack of Information Technology (IT) systems expand the existing gap (Sari, 2008;
Taylor, 2006; Taylor and Fearne, 2006). Hence, this research considers the
significance of agility in information sharing as a cornerstone of CF and Supply
Chain Management (SCM) (Aviv, 2007; Li et al., 2006; Aviv, 2001), and
interrogates various benchmarks to maintain the quality level of information shared
with retailers (Zhou et al., 2014; Zhou and Benton Jr, 2007).

22
1.5. Food Supply Chain (FSC)
1.5.1. Supply Chain in the Food Industry
SCM is a considerable area for both academics and practitioners. Its popularity is
apparent with an increased number of publications, conferences and courses devoted
to it. By definition, it is “the systemic, strategic coordination of the traditional
business functions and the tactics across these business functions within a particular
company and across business within the supply chain, for the purposes of improving
the long-term performance of the individual companies and the supply chain as a
whole” (Mentzer et al., 2001, p. 18).
However, FSC distinguishes itself from other supply chains due to its complicated,
dynamic and fragile environment, where the quality and availability of products are
crucial, because the primary purpose of FSC is to “guarantee the provision of safe
and healthy products that are fully traceable from farm to fork” (Bourlakis and
Weightman, 2004, p. 2). FSC considers various interests in it such as quality,
forecasting, logistics and IT, and it harbours various partnerships among suppliers,
manufacturers and retailers. However, the shelf life of products and price variability
emerge as significant concerns (Ahumada and Villalobos, 2009), while the types of
information shared between partners are vital for forecasts due to the heterogeneous
structure of FSC (Zotteri et al., 2005), in addition to the supportive role of IT for the
integration of partners (Devaraj et al., 2007).
On the other hand, long lead-times and demand uncertainties have become important
barriers for partners in conducting effective supply chain practices (Lowe and
Preckel, 2004). For instance, Zhou and Benton Jr, (2007) addressed the product and
process related uncertainties in supply chains, namely supply chain dynamism. Their
empirical results revealed that uncertainties in supply chains encourage partners to
enhance information sharing and supply chain practices while high level information
exchange improves the efficiency of manufacturers’ delivery operations. In this
context, the vulnerable structure of FSC calls on manufacturers and retailers to build
and maintain tight collaborations in an effort to have a competitive advantage in the
market (Fischer, 2013; Perez et al., 2010; Alvarez et al., 2010). Further, in response
to short-term and inaccurate CF practices in the FSC, it is essential that their long-

23
reaching integration be built based on their continuous information sharing and
forecasting practices (Van der Vaart et al., 2012; Småros, 2007).
1.5.2. FSC in Europe and North America
The literature has documented how the food industry and its chain have an ascending
trend in European countries in terms of conscious consumption, demand for fresh
products and changing market structure (Ahumada and Villalobos, 2009). Regarding
the CPFR practice that was developed based on the USA market (ECR Europe,
2002), the application of CPFR in North America, for instance, seems much easier
than Europe due to retailers’ engagement in forecasts and partners’ adoption of
large-scale collaboration (Småros, 2003).
In practice, due to the efficient collaboration of Heineken in North America forecast
errors have been reduced by 15 percent and the lead-times have been reduced by half
(Fliedner, 2006; Hill Jr and Mathur, 1999). However, observations in the European
grocery sector have emphasised the CF challenges of partners, which, in turn, raises
the importance of academic research into CF in the FSC of Europe and North
America to close the gap between theory and practice (Småros, 2007). ECR Europe
(2001) stressed the major differences between European and North American supply
chains to clarify major requirements in applying CPFR, where these differences are
presented in Table 1.1.
Table 1.1. Supply chain characteristics in Europe and North America
European Supply Chains North American Supply Chains
Geographic
*Limited geographic area
*Consumers equally distributed
throughout the area
*Shorter delivery distances
*Large geographic area
*Consumers are fragmented throughout the
area
*Longer delivery distances
Marketplace
*Heterogeneous, based on the
cultural orientation in each country
*Wide variety of store formats
*Homogeneous
*Limited amount of store formats
Promotions *High level promotional activities;
multiple promotions within one outlet
*Everyday low price strategy and therefore
lower level of promotional activities
Technology *Average utilisation of technology *Sophisticated utilisation of technology
Cultural
Habits
*Reserved willingness to collaborate
*Conservative orientation
*Moderate willingness to collaborate
Source: ECR Europe (2001, p. 29)

24
FSC in Europe harbours a high product range and uncertainties connected with the
environment, demand, price or the economy; it is therefore a requirement for
partners to share responsibilities in collaborations (Ahumada and Villalobos, 2009;
Aviv, 2007; Sanders and Manrodt, 2003; Mentzer et al., 2000). High level
promotions are a rather important concern in the heterogeneous European market,
calling for close integration between partners (ECR Europe, 2001). However, the
effort shown by manufacturers and retailers seems insufficient for long-term
collaborations and accurate forecasts of time-sensitive products (Småros, 2007;
2003).
Particularly, manufacturers’ internal conflicts are important concerns for reliable
supply chain integration in collaborations (Flynn et al., 2010). These internal
conflicts (e.g. lack of data, poor IT systems and communication) that occur owing to
poor organisational structure are more likely to occasion decayed perishable /
seasonal products in the FSC (Vlajic et al., 2012). For instance, while case studies in
Europe have illustrated retailers’ deficiencies in terms of forecasting, information
recording and sharing (Taylor and Fearne, 2006; Småros, 2002), manufacturers’
shortcomings related to a lack of interdepartmental integration and production
capacity, and long lead-times (Småros, 2005). In North America, however, partners
effectively manage such conflicts and IT related obstacles by building their
collaboration over similar objectives and investing in IT systems (ECR Europe,
2001). Overall, these limited analyses are evidence that the literature needs
additional clarification for successful CF between manufacturers and retailers by
addressing partners’ forecast collaboration in Europe and North America (Småros,
2007; 2005).
1.5.3. Environmental uncertainties in the FSC
Studies in the retail chain have hypothesised that environmental uncertainties have a
causal impact on the structure of collaborations that partners build (Mentzer et al.,
2000). In other words, environmental uncertainties in the FSC are likely to motivate
partners to develop more efficient and transparent collaborations. Related evidence
also stressed the negative correlation between environmental uncertainties and
supply chain performance (Zhou and Benton Jr, 2007). However, further

25
understanding is required in terms of clarifying how environmental uncertainties
influence the form of partnerships (Mentzer et al., 2000).
It is clear that uncertainties differ based on market conditions, where relevant
information collected from the market has a significant impact on forecasts (Sanders
and Manrodt, 2003). Partners’ forecasting process has a strong interconnection with
unexpected external factors because of their impact on demand uncertainty (Davis
and Mentzer, 2007). It has been argued that interpreting environmental issues and
responding to them in the food industry encourage partners to improve their
capability of dealing with demand uncertainties (Davis and Mentzer, 2007). On the
other hand, although studies aimed to explore the factors that influence companies’
choices on the application of forecasting methods, environmental uncertainties
appeared to be one of the indicators. The underlying reason is environmental
ambiguities that limit the amount of reliable information. This obstacle obliges
companies to apply subjective information that involve rumours, such as
competitors’ events, and necessitate forecasters’ interpretation based on judgmental
adjustments rather than applying quantitative forecasting methods (Sanders and
Manrodt, 2003).
Partners’ organisational characteristics seem influential in integrating their supply
chain (Van der Vaart et al., 2012; Flynn et al., 2010) and rapid information exchange
with each other underpins their forecasting process in a heterogeneous market,
causing ambiguities (Aviv, 2007). However, there are still mysteries with regard to
environmental uncertainties, the forecasting methods employed and information that
is obtained from such an uncertain environment (Sanders and Manrodt, 2003).
Therefore, further studies need to be dedicated to partners’ collaborative operations
in the dynamic FSC. In this sense, examining the themes of supply chain integration,
forecasting process, and information sharing, and then contextualising their relation
with CF seem an attractive approach to extend the literature and to provide
implications for practice (Van der Vaart et al., 2012; Småros, 2007; Taylor and
Fearne, 2006; Sanders and Manrodt, 2003; Mentzer et al., 2000).

26
1.5.4. Time-sensitive and / or short-life product-groups in the FSC
In FSC, due to the short shelf life of perishable and seasonal products, substantial
care needs to be shown to manage their freshness and shelf availability, with this
effort relying on the practices of forecasting, production, distribution and inventory
management (Adebanjo, 2009; Du et al., 2009; Småros, 2007; Adebanjo and Mann,
2000). Managing demand for promotional products is another difficulty since several
factors influence sales and provoke demand variability such as promotion types,
duration and discounts (Ramanathan and Muyldermans, 2010; Adebanjo and Mann,
2000). On the other hand, collaboratively forecasting newly launched products is a
challenge for partners due to a lack of historical information, demand variability and
unpredictable consumer choices (Småros, 2003; Bitran and Mondschein, 1997).
While environmental uncertainties accumulate with product based difficulties,
estimating accurate forecasts and conducting long-term CF become a substantial
challenge for practitioners (Ahumada and Villalobos, 2009; Småros, 2007; Taylor,
2006; Bourlakis and Weightman, 2004).
The literature is rich in studies that have been dedicated to particular product-groups
such as perishable and seasonal products (Ahumada and Villalobos, 2009; Du et al.,
2009), promotions (Ramanathan and Muyldermans, 2010) or newly launched
products (Yan and Dooley, 2014; Småros, 2003). However, comprehensive studies
encapsulating multiple product-groups in an attempt to bring a new dimension to
existing forecasting knowledge in the FSC are rare (Småros, 2007). To close this
gap, this research involves multiple product-groups while CF is addressed from the
manufacturers’ point of view in the FSC. This approach is most likely to draw the
attention of practitioners due to appealing implications for practice.
1.5.4.1.Perishable and seasonal products
Studies regarding perishable and seasonal products (e.g. milk, eggs, meat, cake,
vegetables and fruits) have shown that these products’ short shelf life and volatile
demand, and uncertain weather conditions, along with the instant price changes that
occur owing to deterioration, prevent efficient demand management in the FSC (Du
et al., 2009; Lowe and Preckel, 2004). Partners’ inconsistent practices connected
with distribution, production planning and information sharing and forecast

27
decisions not only worsen demand management, but also reduce the quality and shelf
life of products (Du et al., 2009; Taylor and Fearne, 2006; Lowe and Preckel, 2004).
For instance, Francis et al. (2008) observed the poor skills of UK based
manufacturers in terms of production, processing, inventory and lead-time activities
that negatively influence the shelf life of products.
Following this, case studies and related literature stressed the significance of
production systems by manufacturers in addition to retailers’ unsophisticated
forecasting processes (Ahumada and Villalobos, 2009; Småros, 2007; Taylor and
Fearne, 2006). On the other hand, survey based studies pointed out the importance of
IT systems associated with preserving the quality of seasonal and perishable
products in the FSC (Hill and Scudder, 2002). Given the analysis of empirical and
pragmatic evidence, it seems that the capabilities and operational practices of
manufacturers play an important role in collaboratively forecasting perishable and
seasonal products with retailers. This brings into prominence the examination of
these short shelf life product-groups, while manufacturers aim to collaboratively
forecast them with retailers.
1.5.4.2.Promotional products
Despite valuable studies which aimed to improve forecast accuracy and to reduce the
bullwhip effect in collaborations (Nakano, 2009; Danese, 2007), practitioners are yet
to generate reliable forecasts when promotion and advertising related factors are
taken into account (Chang et al., 2007). In essence, the bullwhip effect is “the
phenomenon of demand variability amplification along a supply chain, from the
retailers, distributors, manufacturers, and the manufacturers’ suppliers, and so on”
(Lee et al., 2000, p. 626). Partners’ effective information sharing is an important
determinant in terms of reducing bullwhip effect and easing CF with each other
(Aviv, 2007). In practice, production surplus / shortage, inventory shortage and lack
of customer service are some of the significant drawbacks of the UK based food
manufacturers when they collaboratively forecast promotions with retailers
(Adebanjo and Mann, 2000). It is clear that generating reliable forecasts for
promotions is more complicated than forecasting non-promoted products, and
companies have difficulties in understanding the underlying reasons for poor

28
promotional forecasts (Barratt, 2004). Accordingly, this research uses this gap as an
opportunity, and addresses promotional products in CF to provide implications for
food practitioners (Adebanjo, 2009).
As regards the necessity of elaborating CPFR based on different products and market
characteristics (Danese, 2007), promotions seem important opportunities to be
analysed in the FSC, because these products significantly influence demand
variability, and accordingly oblige partners to conduct stronger forecast
collaborations (Taylor and Fearne, 2006). In the Greek FSC, Vlachos and Bourlakis
(2006), for instance, identified the close relationships of manufacturers and retailers
during promotions with the intention of further benefiting from collaborations.
Related studies discussed how partners need to consolidate their information sharing
over promotional, assortment and replenishment plans, and to make both
technological and operational changes for better demand transparency (Du et al.,
2009; Taylor and Fearne, 2006; Småros, 2002). From a different viewpoint,
judgmental adjustments have been discussed in the forecasting literature due to their
good effort on intermittent demand, where demand is fast but arrives in a short
period, like promotions (Syntetos et al., 2009). Nevertheless, the literature needs
more evidentiary studies demonstrating optimum ways of generating accurate
forecasts for promotions while partners share information and generate forecasts
collaboratively (Ramanathan, 2012; Ramanathan and Muyldermans, 2010).
1.5.4.3.Newly launched products
Observations in the European grocery sector uncovered the time-based forecast
differences, when newly launched products were the focus of partners (Småros,
2007). Broadly, a retailer estimated a lower forecast than actual demand and the
supplier’s forecast for the first nine months of launching. However, while related
products’ sales were pursued for more than nine months, the retailer’s forecast
overtook the supplier’s one because of accumulated historical information. For this
reason, it was recommended that retailers apply the supplier’s forecasts for efficient
inventory levels during the first six months after product release, in which the
supplier employed both quantitative forecasting methods and judgmental
adjustments to produce forecasts through this period (Småros, 2007; 2002).

29
In addition, sharing historical information about subsequent products with
manufacturers is beneficial in terms of generating more accurate forecasts (Småros,
2003). The underlying reason is that the demand variability of new products
occurring through launching escalates price changes (Bitran and Mondschein, 1997).
Taking into account the lack of information for new products, generating accurate
forecasts becomes even more challenging for partners, necessitating the share of
historical data (Helms et al., 2000). In essence, retailers will indirectly benefit from
sharing historical information with manufacturers due to the increased forecast
accuracy of manufacturers’ forecasts, which are recommended to be used by retailers
when products are newly launched. Intrinsically, these practical outcomes further
suggest that it is essential for practitioners not only to give importance to
manufacturers’ forecasts, but also to conduct rigid and regular meetings to be able to
collaboratively forecast newly launched products.
However, it is indispensable to allocate a great deal of time and effort to forecasting
meetings and to managing production capacity effectively (Småros, 2007). In
practice, retailers’ inadequate forecasting skills give rise to generate defective
forecasts for new products (Adebanjo, 2009). These implications raise the
importance of examining newly launched products in CF to be able to add additional
insight to the forecasting literature and the forecasting practices of partners. By
relying on rigid evidence and existing gaps in the literature, this research involves
four different types of product-groups: perishable, seasonal, promotional and newly
launched products. It also intends to bring more understanding to the CF practices of
manufacturers, since these product-groups are the focus of their collaboration with
retailers in the FSC (Småros, 2007).
1.6. Research approach and philosophy
In academic and business research, there are two major approaches, the inductive
and deductive approach. The inductive approach is “a theory-building process,
starting with observations of specific instances, and seeking to establish
generalisations about the phenomenon under investigation”. However, the deductive
approach is “a theory testing process which commences with an established theory or

30
generalisation, and seeks to see if the theory applies to specific instances” (Hyde,
2000, p. 83).
The methodological approach of this research is based on the deductive approach,
which “begins with and applies a well-known theory” (Wilson, 2010, p. 7). The
reasons behind following this approach are that this research, particularly, (i) focuses
on the well-known CPFR practice, conducted between manufacturers and retailers,
and (ii) aims to identify factors that have a significant influence on achieving the
Collaborative Forecasting Performance of manufacturers in the FSC. To accomplish
the aforementioned aim, the current research developed a comprehensive conceptual
model and related hypotheses by systematically reviewing the literature on the
research themes of CPFR, supply chain integration, the forecasting process and
information sharing. This aspect accordingly calls for features of the deductive
approach, necessitating the development of hypotheses relating to an existing theory
and the design of a quantitative research strategy to test associated hypotheses
(Ghauri and Grønhaug, 2005).
The inductive approach relies on a qualitative data collection strategy to develop a
theory as an outcome of research. This is why it aims to gain more insight into the
research context, and is more flexible, allowing changes through the research process
(Wilson, 2010). This research benefits from these features of the inductive approach,
and underpins its quantitative research strategy with qualitative sources. In other
words, the methodological premise of this research relies on a mixed method. Mixed
method is “the type of research in which a researcher or team of researchers
combines elements of qualitative and quantitative research approaches (e.g. use of
qualitative and quantitative viewpoints, data collection, analysis, inference
techniques) for the purposes of breadth and depth of understanding and
corroboration” (Johnson et al., 2007, p. 123). Above all, a mixed method enables this
research to encapsulate philosophical developments that guide the direction of data
collection and analysis process using a mixture of qualitative and quantitative
approaches (Creswell and Plano Clark, 2011).

31
As far as the research philosophies are considered, the methodological literature
offers diverse philosophies to develop concrete knowledge about a specific
phenomenon, such as positivism and interpretivisim (Wilson, 2010). While these
research philosophies adopt different paths to extend existing knowledge about a
particular phenomenon, this research is built upon a positivist research philosophy. A
positivist approach adopts an objective perspective. It necessitates empirical research
that is built upon a deductive approach (Lee and Lings, 2008).
In summary, the current research focuses on the deductive approach to empirically
test an associated conceptual model and hypotheses. Whilst the deductive approach
of this research leads to explaining causal and hypothetical relationships in the
conceptual model, gathering qualitative data from practitioners underpins the
methodological rigour of this research by providing generalisable findings to the
literature and for practice. Therefore, a mixed method directs the data collection and
analysis process of this research. To offer unbiased and objective outcomes to the
literature, a positivism research philosophy leads the research methodology of this
research.
1.7. Research Strategy
Strategically, the data collection process of the current research is built upon an
online survey method. However, the development of the online survey is based on
systematic and grey literature review processes, and additional qualitative sources.
The qualitative sources of this research involve the outcomes of a single semi-
structured interview, conducted with a UK based food manufacturer, and three
online group discussions, conducted over the business oriented social networking
service of LinkedIn. The current research coded and analysed these qualitative data
by using the QSR NVivo 9 qualitative software package, which made it possible to
distil the crucial views of practitioners.
Given the requirements of the deductive approach and positivist philosophy,
necessitating empirical validation, it is reasonable to adopt a quantitative strategy
(Wilson, 2010). Quantitative data collection allows this research to “draw a large and
representative sample from the population of interest, measure the behaviour and

32
characteristics of that sample, and attempt to construct generalisations regarding the
population as a whole” (Hyde, 2000, p. 84). On the other hand, a qualitative strategy
is more connected with the inductive approach to develop a theoretical model
(Wilson, 2010). It enables the researcher to gather detailed data on a limited number
of individuals or groups (Patton, 1991). Considering the aim and objectives of this
research, which relies on the CF practice and its complementary conceptual model, it
is worth gathering additional qualitative data to generalise the empirical findings of
research into the FSC. While the survey questionnaire is the most popular data
collection strategy for a deductive approach (Saunders et al., 2007), interviews, case
studies, group discussions and observations are common ways to gather qualitative
data in academic research (Wilson, 2010). In recent years, social media networks,
such as Facebook, LinkedIn and / or Twitter, have also become attractive tools to
reach target respondents through quantitative and qualitative data collection
processes (Mirabeau et al., 2013; Efthymiou and Antoniou, 2012).
Hence, the professional social media page LinkedIn contributed this research to
reach the respondents of three online group discussions and an online survey, which
also looked for respondents from online databases, websites of the food and
beverage federations and the personal contacts of the author. The survey respondents
of this research are food manufacturers, which are located in the UK & Ireland,
North America and Europe. For data analysis, an exploratory approach, the Partial
Least Squares (PLS) technique, was used to empirically test causal relationships and
to validate the conceptual model of this research (Peng and Lai, 2012; Vinzi et al.,
2010). To justify PLS as the most appropriate technique for data analysis, Peng and
Lai (2012)’s pragmatic assumptions became the baseline of the data analysis process.
Overall, by following the mixed method paradigm (Creswell and Plano Clark, 2011),
this research’s structural strategy is sequential (Wilson, 2010; Saunders et al., 2007),
and is organised as follow:
Step 1 - involves the systematic review of literature on the research themes of CPFR,
supply chain integration, the forecasting process and information sharing. This
allowed the research to build initial propositions and a preliminary conceptual model
based only on peer-reviewed academic journal articles.

33
Step 2 - relies on a single semi-structured interview that was conducted with a
supply chain manager of a UK based food manufacturer. This step made it possible
to distil the literature-based propositions and to modify the conceptual model for
implications for practice.
Step 3 - focuses on the three online group discussions that were conducted over the
professional social networking service of LinkedIn. Like the single interview, group
discussions extended the purification process of the literature-based propositions to
reinforce the validity of the research findings in practice.
Step 4 - involves the grey literature review process that was conducted over the
associated research themes by focusing the research propositions, and in which it
comprised related conference papers, business oriented reports and other related
sources (Weintraub, 2000). This step aimed at developing the research hypotheses
and the conceptual model by gathering further data from non-peer reviewed articles
as an extension of the peer-reviewed articles.
Step 5 - comprises the development of the online survey based on the outcomes of
the systematic and grey literature review processes and qualitative data.
1.8. Thesis outline
The current research consists of six chapters. The content of each chapter is briefly
described as follows:
Chapter 1: Introduction - presents the background of CPFR as a core research
theme, and outlines the major CF problems. The research aim and objectives are
elaborated, followed by making explicit the research questions of the research and
justifying their rationale as the representatives of research objectives. Then, further
insights are added into the FSC in Europe and North America. Time-sensitive and /
or short-life product-groups are subsequently clarified as the reason behind linking
this research to the four product-groups, including perishable, seasonal, promotional
and newly launched products. Finally, the research approach and philosophy, and the
strategy are summarised to clarify the methodological approach of the current
research.

34
Chapter 2: Literature Review – initially elucidates the systematic review
methodology, and then a systematic review protocol is introduced. The process
followed to analyse the systematic review and to extract related data is then
described, followed by discussing the results of the systematic review process. The
research themes of CPFR, supply chain integration, the forecasting process and
information sharing are respectively elaborated as the outcomes of both systematic
and grey literature review processes. In addition, alternative collaboration practices
that are used in the FSC are discussed and compared to provide managerial
implications for practice.
Chapter 3: Development of Hypotheses and Conceptual Model – clarifies the
theoretical concepts considered through the hypothesis development process. The CF
practice is then scrutinised along with its formative items to explain its domain
concept as a contribution to theory. Following this, the hypotheses are critically
discussed to make explicit the existing gap in the literature. Finally, the conceptual
model of the current research is outlined.
Chapter 4: Research Methodology and Data Collection – adds clear insight to the
methodological approach and philosophical perspective of this research. The
rationale for the mixed method paradigm is then provided, followed by the
explanation of the research design. Data collection process – mixed design is
elucidated, where the qualitative and quantitative data collection processes are
subsequently justified. Following this, the target population and sampling of the
online survey is discussed, and this is followed by the description of the quantitative
data collection stages. Finally, the research sample size and response rate are
assessed to justify the reliability of usable samples and the data analyses technique
chosen for the empirical analysis.
Chapter 5: Data Analysis and Findings – begins with the justification of the data
analysis technique of PLS, followed by theoretically validating the development of a
formative construct, namely the CF practice. Descriptive statistics of the survey are
then discussed, which makes it possible to identify the significant contributions to
the literature relating to particular regions and product-groups. The analysis of the

35
non-response bias is then presented. Next, the data analysis process is amplified by
presenting related analysis procedures, used to evaluate both the measurement and
structural model of the current research. Finally, the findings and conceptual model
are elaborated as the core contributions of this research, answering the research
questions and closing the gap in the literature.
Chapter 6: Discussion and Conclusions – firstly addresses the scope of the
research to clarify the way followed to accomplish the research aim and objectives
and to respond to the research questions in a logical and justifiable manner.
Secondly, the scope of each chapter is summarised to give an emphasis on the
contributions offered to theory, methodology and practice. Thirdly, a particular
attention is paid to theoretical and managerial implications. Key contributions to the
theoretical knowledge are elaborated in an attempt to clarify how this research made
it possible to narrow down the existing gap on the business initiative of CF in the
FSC. Managerial implications for practice are propounded by interpreting the major
contributions of the research. Finally, future research opportunities and the
limitations of this research are addressed to open new research fields to the literature
and to call the attention of academics towards particular research subjects.

36
2. CHAPTER 2: LITERATURE REVIEW
2.1. Overview
This chapter encapsulates the extensive literature review process of the current
research, consisting of a systematic and grey literature review. To begin with, the
systematic review methodology and the protocol of this research are explained.
Then, the approach adopted to analyse and extract the systematically reviewed
literature is discussed. The results of the systematic review are presented afterwards.
The research themes of the current research are subsequently elaborated based on the
outcomes of systematic and grey literature. This elaboration allows the research to
critically filter relative contributions, future research suggestions and the limitations
of past studies. Overall, this approach allows the research to:
Systematically extend the body of the literature over the research themes of
CPFR, supply chain integration, the forecasting process and information sharing.
Enrich findings of the systematic review with grey literature, making it possible
to draw further data from non-peer reviewed articles for managerial implications.
Develop innovative connections between different research themes and critique
their relation to uncover existing gaps in the literature.
Provide a clear understanding about associated theories and terminologies
relating to the CF practices of manufacturers.
Be aware of the appropriate research methodologies in the literature, and choose
the most appropriate one/s to generalise research findings in the FSC.
Select the most pragmatic and theoretical factors that the literature has
overlooked in terms of adding insight to the CF of manufacturers in the FSC.
Identify a significant literature gap and create a solid platform in an attempt to
form applicable hypotheses in response to the research questions of this research.

37
2.2. Systematic review methodology
The systematic review process of this research is guided by the research questions as
recommended by Tranfield et al. (2003). The research questions of this research
were previously elaborated in Section 1.4. Research questions. Systematic review
requires a detailed article search, however; it brings additional transparency to the
research field, and mitigates bias by providing a scientific approach (Cook et al.,
1997).
Tranfield et al. (2003, p. 207) define a systematic review as a process of
“synthesising research in a systematic, transparent, and reproducible manner with the
twin aim of enhancing the knowledge base and informing policymaking and
practice”. In essence, this definition implies that the review undertakes a guideline
role for managers in making evidence-related decisions in practice. The three-stage
approach of Tranfield et al. (2003), adapted from CRD (2001), is the baseline of the
systematic review process of the current research. These stages consist of (i)
planning; (ii) conducting, and (iii) reporting the review, and are presented in Table
2.1.
Table 2.1. The three-stage approach of systematic review
Stage I Planning the review Phase 0: Identification for the need for a review
Phase 1: Preparation of a proposal for a review
Phase 2: Development of review protocol
Stage II Conducting the review Phase 3: Identification of research
Phase 4: Selection of studies
Phase 5: Study quality assessment
Phase 6: Data extraction and monitoring process
Phase 7: Data synthesis
Stage III Reporting the review
Phase 8: The report and recommendations
Phase 9: Getting evidence into practice
Source: Tranfield et al. (2003, p. 214); CRD (2001)

38
In the first stage of the systematic review (Stage I: Planning the review), the first step
made it possible to identify the underlying reasons calling for systematic review of
the CF problems of partners in the FSC. This step plays a vital role in terms of
addressing diverse problems in the FSC that prevent partners from conducting
accurate and long-term forecast collaborations over the time-sensitive and / or short-
life product-groups. Associated CF problems were previously addressed in Section
1.2. Description of Collaborative Forecasting (CF) problems. The logic behind the
review was then explained by the development of three research questions, focusing
on the three research themes of supply chain integration, the forecasting process and
information sharing. Following this, a proposal was generated for the rationale for a
systematic review. Subsequently, a new review protocol was built to follow through
the synthesis of the literature. This protocol is further clarified in the following
section.
In the second stage (Stage II: Conducting the review), the review protocol was
followed, which became the prospectus for the systematic review process in terms of
identifying and selecting articles, and assessing their relevance. Through these steps,
the research questions became the major guideline. This made it possible to ensure
that associated articles contribute to the research by offering answers to the research
question/s, and help to close the gap in the literature. The quality of associated
articles was assessed based on the guidelines of Tranfield et al. (2003) and Eakin and
Mykhalovskiy (2003). The quality assessment procedures of the review process are
elaborated in Section 2.2.2. Analysis of systematic review and data extraction.
Through the data extraction process, the outcomes of the review were coherently
recorded. To enhance the clarity of data synthesis, this process was consistently
monitored too.
In the final stage (Stage III: Reporting the review), this research reported the findings
to explore existing literature gaps relating to the CF practices of manufacturers,
preventing accurate forecasts and the implementation of long-term collaborations
with retailers in the FSC. Accordingly, the research platform was built upon the
systematic review, and it was then enriched by qualitative data obtained through the
interview and three group discussions. After the qualitative data collection process,

39
this research did not complete the review process, unlike the suggestion by Tranfield
et al. (2003). Instead, the review continued based on the final form of the
propositions to develop hypotheses and to build the final conceptual model.
During the second phase of the literature review, the research rather followed a grey
literature review. Grey literature “comprises newsletters, reports, working papers,
theses, government documents, bulletins, fact sheets, conference proceedings and
other publications distributed freely, available by subscription or for sale”
(Weintraub, 2000, p. 54). While the systematic review enhanced the quality of the
current research owing to the contributions of articles published in high-ranking
academic journals, it adversely limited the research to peer-reviewed journal papers
(Tranfield et al., 2003). However, following the grey literature allowed this research
to go beyond the peer-reviewed academic journals and to underpin research findings
with non-peer reviewed articles (Thomé et al., 2012). The logic behind conducting
the grey literature is also to unveil a wide range of peer-reviewed articles
contributing to the research, where a limited number of peer-reviewed articles
contributing to the research questions were linked to the results of the systematic
review.
2.2.1. Systematic review protocol
The aim of the systematic review protocol in this research is fourfold: Firstly, the
review protocol aimed to provide a clear understanding of the existing CF problems
of partners in the FSC. The reason behind having this insight is to identify in which
processes manufacturers and retailers confront difficulties that prevent them from
conducting accurate and long-term CF for the time-sensitive and / or short-life
product-groups. This insight allowed the research to reveal three major research
themes of supply chain integration, the forecasting process and information sharing
as potential spheres that give rise to the conflicts of partners.
Secondly, the review protocol aimed to interrogate these three research themes. To
accomplish this purpose, three research questions were developed, with each
question focusing on a different research theme in an attempt to examine them
thoroughly. In addition, particular keywords were selected to be searched for in the

40
title, keywords and abstracts of articles. Thirdly, the current research was aimed to
be conducted over these research themes to explore relevant articles offering answers
to the research questions as the underlying reasons for CF problems. Finally, the
intention of the protocol became to develop inclusion-exclusion criteria to limit the
article selection process through the systematic review. The review protocol of this
research is shown in Figure 2.1, while the keywords chosen by the protocol are
presented in Table 2.2.
Source: Developed by the author
*Exploring the CF problems of partners in the FSC *Developing the research questions based on partners’ problems
preventing accurate and long-term CF in the spheres of supply chain
integration, the forecasting process and information sharing
*Searching articles based on primary keywords
*Specifying primary keywords over the research themes of supply
chain integration, the forecasting process and information sharing *Specifying complementary keywords regarding the rationale of the
research questions and related product-groups
*Filtering articles based on three inclusion criteria: 1- Aim of article should be related to the CF problems considered 2- Research questions/hypotheses of article should argue pertinent
factors for the research questions 3- Findings of article should provide either supportive or contrary
insights to the research questions and/or to the research themes
More than 5000
articles
964 peer-reviewed
articles
230 peer-reviewed
articles
68 peer-reviewed
articles
*Completing the article selecting process
*Distilling residual articles based on complementary keywords
*Excluding unpublished and non-peer reviewed articles
24 peer-reviewed
articles
Process Article Outcome
92 peer-reviewed
articles
*Applying a cross-referencing approach *Linking the peer-reviewed articles from the results of grey literature
review process
*Comparing the synthesis of results
1) Research
questions
formulation
2) Settling
articles
3) Literature
search
5) Inclusion
criteria
4) Exclusion
criteria
6) Critical
comparison
7) Cross-referencing approach & support
of grey literature
8) Final decision
Steps
October
2010
Date
January
2011
December
2012
March
2013
Figure 2.1. Systematic review protocol

41
Table 2.2. Primary and complementary keywords
Research themes Primary keywords
Supply chain integration Supply chain integration / collaboration / partnership, collaborative forecasting, CPFR, food
industry / policy
Forecasting process Forecasting, demand management
Information sharing Information sharing / transfer / exchange
Research questions Complementary keywords
RQ.1 Internal / interdepartmental, external, vertical, horizontal
RQ.2 Forecasting methods/techniques, quantitative/qualitative/statistical, judgment/adjustment,
combination, group forecasting/decision, consensus, forecasters
RQ.3 Information systems, information type/s, quality, value, agility
Product-groups Product / item, perishable / short-life, seasonal / seasonality, promotion / promotional, special
event, new / newly launched
Source: Developed by the author
Through the review process, in addition to the forecasting process and information
sharing themes that are the focus of CF (Småros, 2007), this research benefited from
the wide-scale research theme of supply chain integration to conduct a well-rounded
review process by using primary keywords. Supply chain integration is not limited to
manufacturers’ relationship with retailers and suppliers, it also involves diverse
forecasting and supply chain practices as well as the flow of information and goods
over strategic and operational collaborations (Flynn et al., 2010; Mentzer et al.,
2000).
Hence, the systematic review process addresses the supply chain integration related
literature by considering its link with CF, the forecasting process and information
sharing. Thereby, the review process distinguishes itself from related systematic
reviews regarding overall supply chain integration (e.g. see Fabbe-Costes and Jahre
(2008) for a systematic review of supply chain integration). Following this, the
complementary keywords were used to purify the results of the primary keywords
and to uncover the rationale for the research questions and product-groups involved.
The review analysed specific databases such as Scopus, Elsevier, Emerald, ABI
Informs, Wiley, Taylor & Francis, Supply chain forum, EBSCO HOST, AJBR and
JSTOR.
The search using primary keywords found more than 5000 articles from peer-
reviewed journals and conference proceedings. To avoid possible duplication
between journal and conference papers, the systematic review process was limited to

42
peer-reviewed journals, which is common in systematic studies (e.g. Burgess et al.
(2006)). The use of complementary keywords limited the research sample of papers
from 964 to 230, which were examined based on the inclusion criteria (see Figure
2.1). As a result, 68 peer-review articles were extracted. In time, a cross-referencing
approach and the outcomes of the grey literature review process made it possible to
find additional relevant papers, which resulted in 24 more articles. Overall, the
systematic review process was concluded with 92 articles. It is worth emphasising
that academic studies that systematically review the literature can consider cross-
disciplinary approaches or alternative ways to enhance the number of related papers
(Tranfield et al., 2003). In this case, cross-referencing is a common way of achieving
this relevance (see e.g. Shukla and Jharkharia (2013)). However, in addition to the
cross-referencing approach, one of the distinguishing features of this research was to
conduct a grey literature review process. This approach made it possible to underpin
the outcomes of a systematic review with additional peer-review journal articles, and
to explore non-peer reviewed articles that support the research findings from
practitioners’ point of view.
2.2.2. Analysis of systematic review and data extraction
The articles identified through the systematic review process represent diverse areas
and illustrate heterogeneous findings explored in different circumstances (e.g. the
extent of collaboration, geography, different product-groups and industries). The
current research adopted tables and graphical forms to illustrate the outcomes of the
systematic review (Sargeant et al., 2006; CRD, 2001). The analysis originates from
three classes to extract evidence-related data, with the dimensions of classification
for analysis being presented in Table 2.3. The first class was devoted to the
“characteristic” of articles, which provides descriptive knowledge in terms of
publication years, journals, methodology and country. The second class (feature)
summarises the aim, research questions / hypotheses, and relevant findings of the
articles. The article purification then aims to highlight the problem relevance in the
associated research themes and to showcase evidence-related hypotheses. This
approach followed through the analysis of the review accordingly led the research to
maintain the rigour of the review process.

43
Table 2.3. Classification of systematic review analysis
Classes Dimensions 1-Characteristic Year, journal, methodology, country
2-Feature Aim, research questions/hypotheses, findings
3-Problem
relevance
Supply chain integration
Forecasting process Information sharing
Source: Developed by the author
As far as the quality assessment of systematic reviews is concerned, this research
initially appraised the quality of primary research through a review of specific
procedures (Tranfield et al., 2003; Popay et al., 1998). Then, the review’s internal
quality was reinforced over the research questions, inputs of the author of this
research to the review, an assessment of sampling and data collection, and judgment
of the findings. This made it possible to convey the review process to the reader in a
transparent and logical manner (Eakin and Mykhalovskiy, 2003), which, in turn,
enhanced the quality of the data (Popay et al., 1998). In this respect, the systematic
review protocol was used to shed light on the judgment of sampling and the data
collection process, with enhancing the reader’s understanding of the conceptual
model offered by this research.
2.2.3. Results of systematic review process
The systematic review process of the current research includes articles published
from 1971 to 2013. However, the predominance of papers contributing to the review
(67 out of 92) were published in the last decade (see Figure 2.2.). Through the
review process, journals were separated based on their primary coverage topic areas
as noted on their website. To enhance the understanding of journal classification,
four different categories were concisely defined, with related journals presented in
Table 2.4. Accordingly, Operations Management (OM) journals constituted 55.4
percent of the articles, followed by Forecasting and Decision-Making (F&DM)
journals (21.7 percent), SCM and Logistics (SCM&L) journals (15.2 percent) and
Information-Systems and Management (IS&M) journals (7.6 percent). This research
incorporated three more journals under these classifications as well: the Academy of
Management Journal was listed under the OM while the Journal of Retailing and
Industrial Marketing Management were considered as part of the SCM&L.

44
Figure 2.2. Publication trend of systematically reviewed articles
Source: Developed by the author
1
5
11
8
8
4
10
8
2
1
4
5
5
6
2
3
1
2
1
1
1
1
1
1
0 2 4 6 8 10 12
2013
2012
2011
2010
2009
2008
2007
2006
2005
2004
2003
2002
2001
2000
1999
1997
1996
1995
1994
1989
1986
1979
1974
1971
Number of articles consulted

45
Table 2.4. Classification of journals
No List of journals Primary
focus
Number of
articles
considered
1 International Journal of Production Economics OM 17
2 International Journal of Forecasting F&DM 15
3 Management Science OM 7
4 Supply Chain Management: An International Journal SCM&L 6
5 Journal of Operations Management OM 6
6 European Journal of Operational Research OM 4
7 International Journal of Operations & Production Management OM 5
8 OMEGA The International Journal of Management Science OM 3
9 Expert Systems with Applications IS&M 2
10 International Journal of Production Research OM 2
11 Information & Management IS&M 2
12
International Journal of Physical Distribution & Logistics
Management SCM&L 2
13 Journal of Forecasting F&DM 2
14 Journal on the Practice of Operations Research, Interfaces OM 2
15 Technological Forecasting & Social Change F&DM 2
16 The Academy of Management Journal OM 2
17 Alliance Journal of Business Research OM 1
18 Applied Soft Computing IS&M 1
19 Business Process Management Journal OM 1
20 Decision Support Systems IS&M 1
21 Industrial Management & Data Systems IS&M 1
22 Industrial Marketing Management SCM&L 1
23 International Journal of Logistics: Research and Applications SCM&L 1
24 Journal of Behavioral Decision Making F&DM 1
25 Journal of Retailing SCM&L 1
26 Journal of Retailing and Consumer Services SCM&L 1
27 Manufacturing & Service Operations Management OM 1
28 Supply Chain Forum: An International Journal SCM&L 1
29 The International Journal of Logistics Management SCM&L 1
F&DM journals cover forecasting techniques, judgments, decision making and group decisions
SCM&L journals cover supply chain and logistics channel and retail practices
IS&M journals cover data management systems, soft computing and technologies
OM journals cover operational practices, production, service, marketing, economics, statistics and
mathematics
Source: Developed by the author
In terms of geographical distribution (see Figure 2.3), based on the affiliation of the
first author, the articles were predominantly published in the USA (35.9 percent) and
in the UK (23.9 percent). US authors contributed primarily with surveys (27 percent)
and experiments, where hypotheses are tested under particular conditions developed
and controlled by researcher/s, (15 percent), whereas the UK based authors
contributed mostly by experiments (36 percent) and case studies (32 percent).

46
Survey-related papers (20 articles), experiment-related papers (17 articles) and case
studies (17 articles) prevailed in the sample of the review. However literature review
(13 articles) and simulations (10 articles) contributed to the review too.
Figure 2.3. Geographical distribution based on the affiliation of the first author
Source: Developed by the author
3
2
1
2
3
3
1
2
1
1
1
5
1
1
4
1
2
1
2
22
33
0 5 10 15 20 25 30 35
Australia
Brazil
Canada
Chile
China
Finland
France
Germany
Greece
Hong Kong
India
Italy
Japan
South Korea
The Netherlands
Singapore
Sweden
Taiwan
Turkey
UK
USA
Number of articles published

47
As far as the methodological contributions of the journals is considered, presented in
Figure 2.4, overall 82.4 percent of case studies were published in SCM&L (41.2
percent) and OM (41.2 percent) journals. 66.7 percent of conceptual papers were
offered by the OM journals, followed by SCM&L (16.7 percent) and IS&M (16.7
percent) journals. While context analysis was solely regarded by F&DM, these
journals played a prominent role related to experiments by 47.1 percent, followed by
OM journals (35.3 percent). Literature reviews were largely published in the OM
journals with a 61.5 percent share, while the role of F&DM journals in the literature
was considerable as well (38.5 percent). Like literature review, mathematical-
modelling and simulation related publications largely featured in the OM journals 75
percent and 70 percent respectively. Only 20 percent of simulation related papers
were published in the F&DM journals. OM journals provided a significant amount of
survey based papers to the review with 65 percent, followed by SCM&L (20 percent)
and F&DM (10 percent) journals.
Figure 2.4. Methodological contributions of journals
Source: Developed by the author
Case StudyConceptual
Paper
Context
AnalysisExperiment
Literature
Review
Mathematic
al-
Modelling
Simulation Survey
F&DM 11.8% 0.0% 100.0% 47.1% 38.5% 0.0% 20.0% 10.0%
SCM&L 41.2% 16.7% 0.0% 5.9% 0.0% 12.5% 0.0% 20.0%
IS&M 5.9% 16.7% 0.0% 11.8% 0.0% 12.5% 10.0% 5.0%
OM 41.2% 66.7% 0.0% 35.3% 61.5% 75.0% 70.0% 65.0%
0.0%
20.0%
40.0%
60.0%
80.0%
100.0%
Res
earc
h m
eth
od
s o
f j
ou
rnal
s (%
)
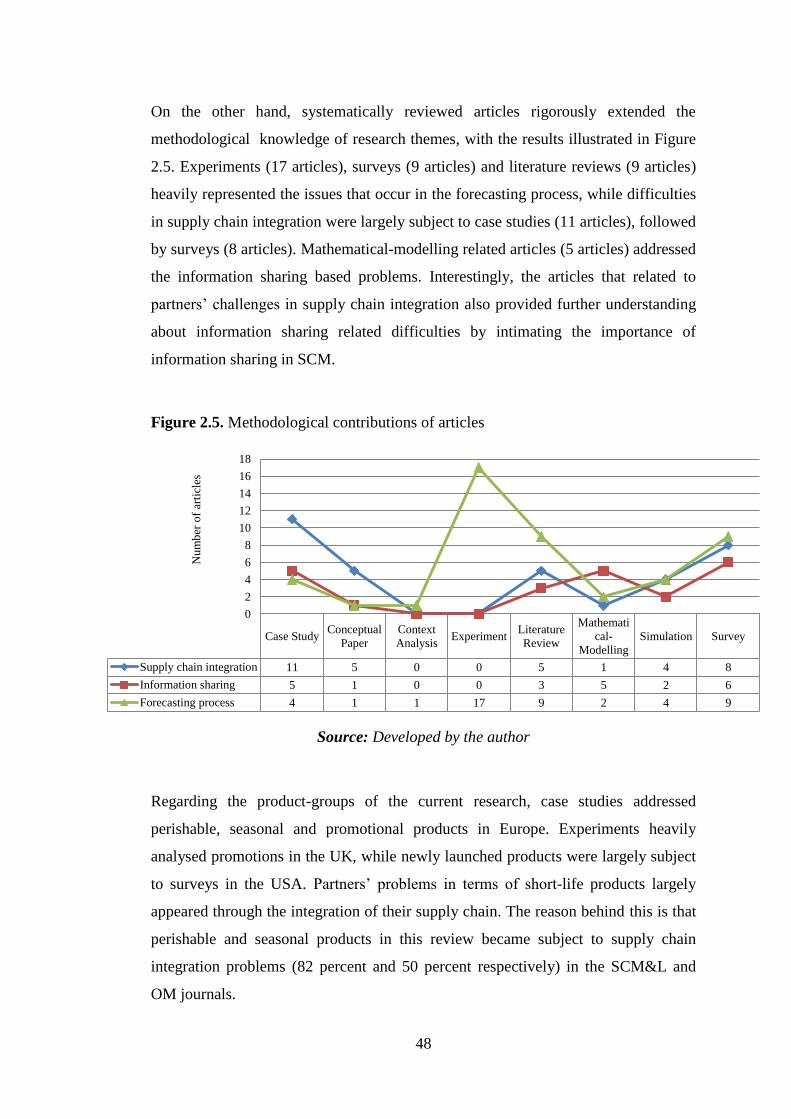
48
On the other hand, systematically reviewed articles rigorously extended the
methodological knowledge of research themes, with the results illustrated in Figure
2.5. Experiments (17 articles), surveys (9 articles) and literature reviews (9 articles)
heavily represented the issues that occur in the forecasting process, while difficulties
in supply chain integration were largely subject to case studies (11 articles), followed
by surveys (8 articles). Mathematical-modelling related articles (5 articles) addressed
the information sharing based problems. Interestingly, the articles that related to
partners’ challenges in supply chain integration also provided further understanding
about information sharing related difficulties by intimating the importance of
information sharing in SCM.
Figure 2.5. Methodological contributions of articles
Source: Developed by the author
Regarding the product-groups of the current research, case studies addressed
perishable, seasonal and promotional products in Europe. Experiments heavily
analysed promotions in the UK, while newly launched products were largely subject
to surveys in the USA. Partners’ problems in terms of short-life products largely
appeared through the integration of their supply chain. The reason behind this is that
perishable and seasonal products in this review became subject to supply chain
integration problems (82 percent and 50 percent respectively) in the SCM&L and
OM journals.
Case StudyConceptual
Paper
Context
AnalysisExperiment
Literature
Review
Mathemati
cal-
Modelling
Simulation Survey
Supply chain integration 11 5 0 0 5 1 4 8
Information sharing 5 1 0 0 3 5 2 6
Forecasting process 4 1 1 17 9 2 4 9
0
2
4
6
8
10
12
14
16
18
Nu
mb
er o
f ar
ticl
es

49
Promotions were connected with the challenges that occur during supply chain
integration (60 percent) and the forecasting process (40 percent) across several
industries (according to the SCM&L and OM journals). This result accordingly
uncovers partners’ ongoing forecasting problems while they collaboratively forecast
promotional products, in addition to the difficulties that occur during integration.
Like promotions, partners’ conflicts in the forecasting process (50 percent) and
supply chain integration (56 percent) augmented while newly launched products
were referred to in different industries via OM journals. The review also found that
several articles focused on a number of industries and conducted research over
multiple product-groups (particularly surveys and case studies).
Overall, the systematic review process builds a solid basis for the current research.
The contributions of articles reviewed add further insight into the problems of
partners that occur through supply chain integration, in the forecasting and
information sharing processes. Addressing these problems over the associated
product-groups is another important contribution of the review process. However,
the findings are not limited to these outcomes. The review process uncovers the
publication trend of articles and their region by extending the body of literature as a
guideline for researchers. This enhances the understanding of academics over the
trend and countries, conducting research on the related research themes connected
with the CF problems of partners.
Further, the results extend the literature by providing a solid classification of the
journals, as OM, F&DM, SCM&L and IS&M journals based on their primary
coverage topic areas. Presenting these journals’ methodological domain makes it
possible to acquire a clear vision in terms of following appropriate methodologies for
future research, with the aim being to publish in associated journals. The clarification
of journals’ methodological mission therefore exposes the existing methodological
gap that needs to be filled by future research. In addition, to raise the awareness of
product-groups and the importance of research themes in the FSC, the current
research selected 28 articles from the results of the systematic review process. These
articles are presented in Table 2.5.

50
The criteria for selecting these 28 articles are threefold. Firstly, these articles
indispensably related to the food industry, while some of them involve additional
industries, such as textiles, tourism and pharmaceutical. Secondly, the articles extend
the body of literature to at least one of the three research themes: supply chain
integration, the forecasting process, information sharing. Some articles also add
insight into the multiple research themes by building a linkage between associated
research themes. Finally, while these articles extend the body of knowledge in the
food industry over at least one of three research themes, they also shed light on at
least one of the four product-groups of this research.

51
Table 2.5. List of articles selected based on their contributions to the food industry, research themes and product-groups
Articles Research themes Industry Product-groups
N
o Articles Country Methods
Supply chain
integration
Forecasting
process
Information
sharing Food Others Perishable Seasonal Promotional New
1 Aburto and Weber (2007) Chile Mathematical-modelling x
x
x
2 Adebanjo (2009) UK Case study x
x
x
3 Ahumada and Villalobos (2009) USA Literature x
x
x x
4 Ali et al. (2009) Turkey Experiment
x
x
x
5 Alon et al. (2001) USA Experiment
x
x
x
6 Bitran and Mondschein (1997) Chile Mathematical-modelling x
x
x x
7 Ching-Chin et al. (2010) Taiwan Simulation x x x x
8 Danese (2007) Italy Case study x
x x
x
9 Danese (2006) Italy Case study x x x x x
10 Davis and Mentzer (2007) USA Context analysis
x
x x
x x
11 Du et al. (2009) China Case study x
x
x x
12 Fildes et al. (2009) UK Simulation &
Mathematical-modelling x
x x
x
13 Fliedner (2006) USA Conceptual paper x
x x x
x
14 Flynn et al. (2010) USA Survey x
x x
x
15 Francis et al. (2008) UK Case study x
x
x
16 Hill and Scudder (2002) USA Survey x x x x
17 Nakano (2009) Japan Survey x x x x
18 Paiva (2010) Brazil Survey x
x x
x
19 Ramanathan and Muyldermans (2010) UK Case study x x x x
20 Ramanathan (2012) UK Case study x x x
21 Småros (2003) Finland Case study x
x
x x
22 Småros (2007) Finland Case study x
x
x x x x
23 Taylor and Fearne (2006) UK Case study x x x x x
24 Taylor (2006) UK Case study x
x
x x x
25 Vijayasarathy and Robey (1997) USA Survey x x x x
26 Vlachos and Bourlakis (2006) Greece Survey x
x
x
27 Vlajic et al. (2012) The
Netherlands Conceptual paper x x x x x
28 Zotteri et al. (2005) Italy Mathematical-modelling x x x x
Source: Developed by the author

52
2.3. Collaborative planning, forecasting and replenishment (CPFR)
The Voluntary Interindustry Commerce Standards (VICS) Association defines CPFR
as a “business practice that combines the intelligence of multiple trading partners in
the planning and fulfilment of customer demand” (VICS, 2004, p. 5). In essence,
CPFR plays a bridge role among partners’ sales and marketing operations to enhance
product availability and to reduce inventory and delivery costs, because the
objectives of CPFR are to (VICS, 2002):
Provide better supply-demand coordination through an effective information
sharing
Manage processes based on partners’ exceptions, and
Meet end customers’ needs with a strong collaboration, which is organised well
and lacking in restrictions
The history of CPFR dates back to the 1990s, when Wal-Mart and Warner-Lambert
in the USA incorporated three sub-stages of planning, forecasting and replenishment
in a joint project (Ireland and Crum, 2005). Important studies adopted CPFR and its
components in various industries by revealing concrete contributions (Sari, 2008;
Danese, 2007; Småros, 2007; Aviv, 2007). The CPFR framework appeals to buyer-
seller relations in multiple industries, such as retail, textiles and consumer packaged
goods. FSC is also a suitable domain for CPFR, which provides an excellent
platform for partners in managing supply chain processes jointly, comparing sales
and order forecasts, and taking timely decisions (Burnette, 2010; Ireland and Crum,
2005; Siefert, 2003).
The reason behind the benefits of CPFR in the FSC is that while partners confront
difficulties in integrating their information sharing and forecasting processes, CPFR
seems a strong solution due to its capability of not only jointly managing promotions
but also underpinning interdepartmental synchronisation and minimising
departments’ multiple forecasts (Barratt and Oliveira, 2001; Sherman, 1998).
Multiple forecasts are significant barriers to CF as they give rise to internal-external
conflicts in collaborations (Helms et al., 2000). CPFR is an effective practice for
partners to reduce inventory costs and the waste of consumer goods over long-term
partnerships (Lapide, 2010). The collaboration of Wal-Mart and P&G is a good

53
example from practice, where they jointly developed forecasts and replenishment
operations, and gained favour by improving information sharing and reducing the
waste of consumer goods in the FSC (Attaran, 2004). The CPFR aspect consists of
the three prime processes of planning, forecasting and replenishment. These
processes constitute four important activities to improve the collaborative
performance of manufacturers and retailers (see Figure 2.6) (VICS, 2004):
Figure 2.6. CPFR Model – Manufacturer and retailer tasks
Source: VICS (2004, p. 11)

54
Strategy & Planning: Identify baseline rules for collaboration, and select product
or product-groups merchandised by developing a joint business plan for a
particular period
Demand & Supply Management: Share Point-of-Sales (POS) data and additional
sources to fulfil the forecasting and shipment requirements over the period
Execution: Set orders, share delivery plans and consider the number of products
in stock and on retail shelves. Then, record sales and make payment
Analysis: Track the joint business plan in comparison with the execution
progress made. Then, aggregate the results to measure performance parameters.
Accordingly, share perceptions to improve the previously developed plan for
continuous improvement in collaboration
Despite these activities as the guideline of CPFR, practitioners confront significant
challenges through the implementation of CPFR. These challenges are primarily to
(VICS, 2002):
Choose collaborative partners and relevant products
Set up a performance measurement policy between partners
Settle partners’ organisational approach, according to the CPFR approach, and
Transform the organisational structure based on CPFR, if required
2.3.1. Steps of CPFR
The CPFR processes of planning, forecasting and replenishment link with each
other, and each process needs to be adopted by partners to achieve the objectives of
CPFR. This achievement relies on the nine consecutive steps of CPFR (Ireland and
Crum, 2005; VICS, 2002). In this way, steps 1-2 represent planning while steps 3-8
entirely clarify the CF practice, whilst step 9 adds insight to the replenishment
process of CPFR. Whilst these steps are interpreted below in accordance with Siefert
(2003)’s elaboration, the CPFR process model is presented in Figure 2.7.
Interpretations are also enriched with associated articles to add further insight into
the problems that occur through CPFR.

55
STEP 1: Develop a collaboration agreement
Develop CPFR mission statement: Establish a common rationale for cooperation,
trust and availability of sources
Determine CPFR goals and objectives: Identify attainable objectives and tasks
that require agreement to measure performance. Define associated business
activities and overall criteria connected with purchasing exceptions and order
forecasting
Discuss competencies, resources and systems: Show willingness and
determination for required competencies, resources and systems to contribute to
the CPFR process: "which department or functional groups are ready and able to
contribute to the process long-term? which additional capabilities must be
expanded or outsourced?"
Define collaboration points and responsible business functions: Identify the
extent of collaboration and responsibilities for both sides
Determine information sharing needs: Clarify the types of information that are
required for collaboration. Define how frequently and in which way information
sharing will be conducted. Inform the partner company about how long a
response time is acceptable before the request for information, and what
forecasting methods are the base of forecasting
Define service and ordering commitment: Structure the order and delivery
commitments which need to be measured mutually to generate firm orders
Determine resource involvement and commitments: Reciprocally identify
sources that will be available through the CPFR processes (e.g. time and number
of employees devoted to collaboration). Have an agreement on the ways of
improving processes continuously
Resolve differences between partners in the CPFR processes: Consult pre-
established rules to solve disagreements and differences
Regularly review cycle for CPFR agreement: Assess the process on a regular
basis and evaluate success of the collaboration
Publish front-end agreement: Initiate combined agreements. Update objectives
and / or benchmark criteria for new demand and improvement, if required

56
STEP 2: Create a joint business plan
Engage corporate strategies in a single business plan
Consider the experience of category management and business planning to
identify roles and objectives in collaboration
Regard the requirements of continuous product based information exchange (e.g.
minimum order, required lead-time for orders and order frequency)
It is clear that partners need to follow the same vision to underpin their collaboration
both internally and externally, where having a different organisational culture is
likely to harm their agreement on a single business plan (Johnston et al., 2004;
Ireland and Bruce, 2000). Partners confront difficulties connected with building trust
and commitment to each other, which in turn prevent them from proceeding with
their agreements in CPFR (Fliedner, 2006). Building trust and long-standing
collaborations relies upon their effective information sharing and continuous
willingness given to build a positive memory / experience in the partner’s mind
(Fischer, 2013; Özer et al., 2011).
Effective information sharing also underpins forecasts, and eases integration in
supply chains (Ha et al., 2011; Nyaga et al., 2010). Nevertheless, there is a scarcity
of empirical research blending partners’ diverse practices in an attempt to offer clear
guidance to know the way/s of commencing close collaboration and sustaining tight
integration for long-term partnerships. Whilst the literature is limited to a number of
case studies that address these challenges over a limited number of companies
(Ramanathan and Gunasekaran, 2014; Småros, 2007), the current research is
committed to closing the existing gap from the manufacturers’ point of view. The
following steps constitute the CF of partners, which is the focus of this research.

57
Figure 2.7. CPFR process model
Source: VICS (2002, p. 4)

58
STEP 3: Create sales forecasts
Employ POS data and retailer’s promotional plan to generate sales forecasts, in
which using these information sources enhances the reliability of forecasts
STEP 4: Identify exceptions for sales forecasts
Define products that were accepted as exceptions to sales forecasts to have an
agreement on forecasts. It is important to identify exception criteria for each
product in STEP 1
STEP 5: Resolve / collaborate on exception items
Jointly identify exceptions in an effective time period for stronger forecasts
STEP 6: Create order forecasts
Link the POS data of the retailer to the manufacturer’s inventory strategy for
separately estimated order forecasts
Order quantity needs to be estimated based on “inventory target per product” and
“the destination of product”
Respond to the questions of “how much advance notice is necessary to transport
the product to its destination? and does the order information reflect temporal
differences?"
Apply short-term forecasts for actual orders, and long-term forecasts for tracking
the business plan which was developed jointly
STEP 7: Identify exceptions for order forecasts
Identify the products entailing exceptions between partners to ease agreement on
a single order forecast
STEP 8: Resolve / collaborate on exception items
Commonly identify and clarify exceptions with efficient communication in a
timely manner
Reflect potential changes to forecast
Enhance the speed of information sharing to make timely decisions for a reliable
order forecast
59
STEP 9: Generate Order
Generate order forecast as the actual order of the retailer
Order generation can be managed by either retailer or manufacturer
Managing the process of order generation depends on partners’ forecasting skills,
available information and access to information over appropriate IT systems
In essence, the CPFR steps, from 3 to 8, encapsulate partners’ entire forecasting
process to create a good platform for replenishment operations. Although the CPFR
approach dedicates step 9 to partners’ replenishment operations (Ireland and Crum,
2005; VICS, 2002), it rather represents the consensus step in terms of finalising the
forecasting process and initiating the order replenishments between partners. Given
the combination of these steps, from 3 to 9, it largely plots partners’ continuous
effort put into exchanging knowledge, generating timely forecasts within their
departments, and most importantly meeting to solve exceptions occurring over the
products that they collaborate on. Implementing these steps in a timely manner
necessitates rigorous internal-external forecasting and information sharing, and an
appropriate technological platform for continuous information exchange, yet these
requirements appear to be substantial obstacles of partners (Fliedner, 2006; 2003).
There is as a broad consensus that partners’ agreement on a single vision, joint
business plan and willingness to solve exceptions are important facets that benefit
from CPFR (Danese, 2007; McCarthy and Golicic, 2002; Ireland and Bruce, 2000).
The literature is rich in views supporting the claim that partners need to have good
IT systems to conduct timely information sharing, and to generate a single but
reliable single forecast within their departments (Danese, 2006; Fliedner, 2003;
McCarthy and Golicic, 2002; Helms et al., 2000). However, a gap in practice
appears with collaborations subject to time-sensitive and / or short-life products
(Adebanjo, 2009; Småros, 2007; Taylor and Fearne, 2006). Hence, these product-
groups are the major interest of this research. In addition, the literature has limited
knowledge elaborating major internal-external forecasting practices and IT systems
required for CF apart from clarifying the types of information which should be
exchanged between partners (Fliedner, 2006; Danese, 2006; Barratt and Oliveira,
2001; Helms et al., 2000). Generalising these practices based on the dynamic

60
structure of the FSC and specific product-groups are a substantial contribution to
extending the literature and to enlightening food practitioners (Ramanathan, 2013;
Ramanathan and Muyldermans, 2010; Danese, 2007).
2.3.2. CF in practice
Since 1998, the processes of CPFR have been tested by more than three hundred
companies across the world, and case studies have illustrated its benefits in terms of
inventory reductions (10-40 percent) and product availability at stores (2-8 percent)
(VICS, 2004). Partnerships between Unilever and Sainsbury’s, Nabisco and
Wegmans, Wal-Mart and Sara Lee Branded Apparel, as well as Kraft and
Sainsbury’s along with Lowes Home Improvement and Whirlpool are only a number
of prominent examples that appear in practice (VICS, 2010; ECR Europe, 2001;
Ireland and Bruce, 2000). For instance, the outcomes of the Wal-Mart and Sara Lee
Branded Apparel collaboration were increased sales (45 percent) and market share
(12 percent), while the Nabisco and Wegmans partnership led to sales growth (for
nuts: 32 percent, for milk: 8 percent) and inventory reduction (18 percent) (Ireland
and Bruce, 2000).
Although CPFR is a promising practice to improve supply chain, European-based
practitioners often do not pay sufficient attention to it (Forslund and Jonsson, 2007).
Despite valuable books and guidelines devoted to CPFR in terms of guiding
practitioners (Ireland and Crum, 2005; Siefert, 2003; VICS, 2002), there is a
significant gap with regard to the CF practices of partners in the dynamic FSC
(Småros, 2007). The importance of this gap has further risen over time. The reason
behind the lack of implementation of CPFR is more likely to hinge upon its unclear
objectives perceived by practitioners. Whilst objectives of CPFR were to enhance
supply-demand coordination, to manage exceptions, and to meet consumer demand
(VICS, 2002), this objective, over time, has transformed to “add value to the supply
chain by improving forecast accuracy” (Mello, 2013, p. 28).
In other words, improving forecast accuracy has come to the forefront of
collaborations, whilst the literature is limited when it comes to guiding partners in

61
generating accurate forecasts for time-sensitive and / or short-life product-groups in
the FSC (Du et al., 2009; Adebanjo, 2009; Ali et al., 2009; Taylor, 2006). This
shortage enhances the importance of this research, because it aims to increase the
forecast accuracy of time-sensitive and /or short-life product-groups and the duration
of collaborations between partners in the FSC. Småros (2007) studied four separate
CF projects in the European grocery sector. These projects focused on a single
retailer and four manufacturers, providing dairy, meat, confectionery and chemical
products to the retailer. The current research discusses these time-sensitive product-
focused CF projects, and reviews the findings and arguments of related studies
below.
2.3.2.1.CF for perishable and seasonal products
The first project of Småros (2007) was dedicated to retailer-dairy manufacturer
collaboration, and aimed to enhance the store level forecast accuracy as well as the
efficiency of replenishment over twenty different products. Although partners’
forecasts were adequately accurate at the supply chain level, similar results could not
be accomplished at the store level. It is noteworthy that forecasts were on a
centralised basis and were generated based on a top-down approach, and the retailer
did not normally apply centralised forecasting approach. Because of this,
unsuccessful forecasts at the store level prevented the project from being conducted
long-term. In this respect, Småros (2007) argued that despite the retailer’s reluctance
to make costly technological investments for better demand management, the lack of
investment in IT systems is not an obstacle for long-term CF.
The top-down approach is intrinsically an appropriate process for generating
consensus forecasts in CF. In this approach, forecasters initially use aggregate data to
generate aggregate forecasts, and these forecasts are then disaggregated to obtain the
forecast of each product or item (Zotteri et al., 2005). However, the bottom-up
process, which was mostly used by the retailer, is a more independent forecast
generation process, which does not seem appropriate to generate consensus forecasts
(Fliedner, 2006). In this case, the retailer’s unfamiliarity with a centralised
forecasting approach seems to be one of the underlying reasons for generating

62
inaccurate forecasts at the store level. In essence, this limited case study built upon a
single retailer raises doubts on the forecasting skills of retailers in CF.
Considering the role of IT systems, McCarthy and Golicic (2002), for instance,
stressed that costly technological investments are important barriers to CF when they
examined the collaborations of three different manufacturers. Their outcome is in
line with the study by Fliedner (2003), while Sari (2008) similarly emphasised that
the necessity of IT systems limits partners adopting CPFR for a broad product range.
Case studies in the UK FSC likewise supported this consensus when they illustrated
that partners’ different IT systems caused forecast errors and administrative costs
(Taylor and Fearne, 2006; Taylor, 2006). Relying on these contradictory views and
limited arguments, it seems that there is not a clear map guiding practitioners in
generating accurate forecasts for perishable and seasonal products in CF. Therefore,
it is worthwhile to interrogate the related literature and to explore the factors that
play a vital role in the forecast accuracy of associated products.
2.3.2.2.CF for promotional products
The second project of Småros (2007) referred to the retailer-meat manufacturer
collaboration, and aimed to improve the forecast accuracy of promotional products.
To accomplish this intention, the partners started to estimate forecasts four weeks
prior to promotions by using a newly developed forecasting tool. This tool
considered the number of sales as before-during-after promotions, types of
promotions and replacement of substitutions. However, a lack of historical
information, wide product range of promotions and diverse promotion types directed
partners to apply judgmental adjustments to statistical results. In this respect, lack of
data, unsophisticated IT systems, and forecasters’ lack of experience lowered the
quality of promotional forecasts. The results of this observation illustrated retailers’
limited forecasting skills and sources at the retailer-driven CF practice level, which,
in turn, harmed partners’ information sharing. Meanwhile, Småros (2007) asserted
that similar problems are not likely to occur with manufacturer-driven CF practices,
The study by Ramanathan and Muyldermans (2010) expanded the observations of
Småros (2007), and demonstrated that weather conditions, special days and product

63
rank are strong indicators of promotional forecasts, apart from promotion type,
duration and discounts. Considering the volatile demand for promotions, sustaining
product availability on shelves depends on partners’ usage of diverse types of
information in forecasting (Cachon and Fisher, 2000). Owing to the impact of
external factors on the demand, these data are likely to be representative of recent
changes, such as weather conditions and special events. To benefit from these
sources that are valuable temporarily, they need to be exchanged in a timely manner
and in an adequate form (Li and Wang, 2007; Forslund and Jonsson, 2007). In other
words, the quality and value of information should be sustained until promotional
forecasts are generated, and are converted to actual orders. Whilst the literature
reports contradictory views as to whether or not IT systems affect long-term CF
(Sari, 2008; Småros, 2007; Fliedner, 2006), partners’ different IT choices in practice
caused delayed information exchange, which, in turn, worsened the demand
management of promotions (Taylor, 2006). Although few studies have observed
manufacturers’ loss of data due to departments’ lack of cross-functional
communication (Småros, 2007), partners in the FSC confronted difficulties about
maintaining data availability and sustaining real-time information exchange with
each other (Taylor and Fearne, 2006).
A case study by Adebanjo (2009) brought a different dimension to promotional
forecasts by emphasising the role of lead-times and limited flexibility in the demand
due to consumers’ habituation to particular promotions. This is to say,
manufacturers’ capabilities play an even more important role when promotions are
subject to CF, whilst it is more problematic to forecast promotions compared to non-
promoted products (Barratt, 2004). Accordingly, collaboratively forecasting
promotions makes manufacturers liable to supply products to retailers on time and to
be flexible so as to cope with volatile demand. Whilst manufacturers’ long lead-
times raise concerns about their skills of providing timely deliveries (Småros, 2007),
promotions’ short-time sales representing complex discounts are most likely to entail
variability on sales and inventory levels, and to influence production efficiency
(Ramanathan and Muyldermans, 2010). If manufacturers cannot match demand and
supply, the quality of customer service will be reduced (Adebanjo and Mann, 2000),
which will in turn worsen their collaboration with retailers. This, in turn, implies the

64
importance of effective inventory management and delivery operations when
manufacturers collaboratively forecast promotions with retailers. In this respect,
interrogating manufacturer’ operations, both at the internal and external level, which
are likely to affect promotional forecasts and accordingly collaborations with
retailers, is promising to extend the limited knowledge of case studies in the FSC.
2.3.2.3.CF for newly launched products
Through the third project of Småros (2007), when the manufacturer shared initial
demand forecasts of newly launched confectionery products with the retailer, these
forecasts were used by the retailer to evaluate both space on the shelves and the
amount of replenishment in stores. At the end of second, fourth, sixth and eighth
weeks of launching the products, the manufacturer had access to retailers’ POS data,
which enabled them to improve existing forecasts. Partners’ strong communication
at the distribution level underpinned forecasts with additional information, involving
recent changes about logistics and category management. This effective information
sharing enabled the manufacturer not only to rapidly react both to demand changes
and stock-out, but also to enhance accuracy by 7 percent. However, the limitation of
this project was to refer long-life new confectionery products. As far as the short-life
newly launched product-groups are concerned, the literature is lacking in studies
guiding practitioners in aligning the demand for and supply of such products in the
FSC (Småros, 2007).
Despite long-life new products, the manufacturer’s responsive production system
became another contributor to reliable forecasts. Investing in a production system
allowed the manufacturer to tailor production planning and scheduling against
instant demand changes, and to enhance the delivery performance by 2.6 percent. It
is also known that sharing POS data with manufacturers helps them to improve
production planning (Goodwin, 2005). If the forecast data received from retailers
include errors, it contrarily engenders over / under production and costs in terms of
distribution and inventory (Thomassey, 2010). Whilst it can be argued that both
manufacturers’ production skills and retailer data are likely to be an indicator of
matching the supply of and demand for new items, manufacturers have additional
difficulties in combining production planning and forecasting (Nakano, 2009). It is

65
known that POS data of retailers do not include uncertainties in sales, hence
manufacturers need to evaluate potential uncertainty and then plan their production
(Goodwin et al., 2010). As far as newly launched products are concerned in CF,
partners are more likely to confront fluctuating sales. This accordingly calls for
manufacturers' skills of interpreting retailer data and matching forecasts and
production, which is a common problem of manufacturers that gives rise to either
excessive stock or stock out (Helms et al., 2000). This problem calls for partners’
mutual support and effective coordination to synchronise their forecasting and to
sustain high quality information sharing through the collaboration on new items
(Yan and Dooley, 2014).
Another observation by Småros (2007) was the long lead-times that harmed
manufacturers’ benefits from forecast updates, while partners’ different planning
horizons and preferences about aggregation levels inhibited them from obtaining
better forecasts. Taking into account the dominance of retailers in Europe (Hogarth-
Scott and Parkinson, 1993), Småros (2007)’ observations not only remonetised the
role of power in CF, but also raised the importance of lead-time management for
manufacturers. This is because retailers’ satisfaction from CF is associated with short
replenishment times and high service levels, whilst manufacturers can benefit from
replenishment operations during effective information exchange (Aviv, 2001).
Exchanging information allows manufacturers to obtain further information with
regard to the market and products, and then to improve their forecasts against
demand variability (Chang et al., 2007). These improved forecasts help retailers in
managing inventory effectively against the fluctuating demand for newly launched
products (Småros, 2003).
This conclusion adds further understanding to the observations of Småros (2007), in
which the manufacturer showed desire for long-term CF and having access to POS
data for better accuracy. The retailer, on the other hand, was concerned with the
short lead-times for better inventory management, rather than focusing on forecast
accuracy. Therefore, partners’ different expectations from forecasts and
collaboration seem to be one of the most significant barriers to long-term and
accurate CF (Fliedner, 2006). This conflict calls for managerial commitment for

66
internal-external transformation, trust to share knowledge and joint forecasts to
achieve consensus (Barratt, 2004). The impact of power between partners is another
issue, where the availability of data for retailers is likely to underpin their dominance
in collaborations, which inversely affect information sharing and make long-term
collaborations costly apart from reducing supply chain performance (He et al.,
2013). Instead of power, partners need to contribute to collaboration by sharing the
relevant information about new item/s that are planned for launch (Yan and Dooley,
2014), which is an important gap in collaborations (Ramanathan, 2013; McCarthy
and Golicic, 2002; Barratt and Oliveira, 2001).
The final project of Småros (2007) aimed to update forecasts for new chemical
products. In this project, the lack of motivation of forecasters and long production
intervals became an important barrier to forecast accuracy. Further, lack of
interdepartmental communication caused a loss of POS data by manufacturers.
While these limited observations imply that short production plans are better for
accurate forecasts, manufacturers’ lack of interdepartmental coordination seems to
be a considerable indicator of forecasts and collaboration. The literature also stressed
how a lack of internal coordination, communication and trust, and differing needs of
the departments of manufacturers cause multiple forecasts, escalating internal-
external conflicts (Barratt, 2004; Helms et al., 2000; Ireland and Bruce, 2000).
However, there is a paucity of empirical work addressing manufacturers’ internal
relation in CF. Interdepartmental relations became even more important when
partners intend to collaboratively forecast newly launched products in the dynamic
FSC (Småros, 2007; 2005). Given the benefits of interdepartmental coordination,
easing process alignment and the success of partnerships (Barratt, 2004), the
business practice of Sales and Operations Planning (S&OP) seems to be an option
for manufacturers. S&OP “can be characterised as the long-term planning of
production and sales relative to the forecast demand and the complementary resource
capacity planning” (Olhager, 2013, p. 6839). For that reason, this practice is further
elaborated in the following section.

67
2.4. Sales and Operations Planning (S&OP) and other practices in the
FSC
S&OP began as an extension of Manufacturing Resource Planning (MRP), easing
the coordination of internal information sharing for manufacturers (VICS, 2002). By
definition, it is “a formal process led by Senior Management that on a monthly basis
evaluates the time-phased rolling projections for new products, demand, supply and
the resulting financials” (VICS, 2010, p. 6) (See Figure 2.8). Its objectives are to
analyse the performance and objectives of relevant departments to ensure they
proceed with a single outlook, and to align the company’s demand forecast and
supply-service practices via integrated business plans (VICS, 2002).
Figure 2.8. S&OP Process
Source: VICS (2010, p. 7)
S&OP starts with pre-established meetings of salespeople to build demand forecasts,
referring to target sales rather than production. Then, forecasts are adjusted based on
marketing plans, including advertisements, promotions, newly launched products
and potential obsolescence. Afterwards, the operation department considers the
forecasts of salespeople to generate inventory, supply chain and production plans
over MRP to meet forecasts. Finally, the formal S&OP meeting is held with
representatives of sales / marketing, operations and finance departments to finalise
the future S&OP plan, and to identify the meeting cycle alongside responsibilities
(Grimson and Pyke, 2007). Given the dynamic structure of FSC, manufacturers need
to be more agile in the operations of information sharing, forecasting and production.

68
Building a good internal coordination with S&OP is likely to enhance their
capability of rapidly reacting to instant demand changes (Nakano, 2009).
From the forecasting standpoint, S&OP aims to “develop a consensus-based set of
forecasts and plans that include input from a number of functional areas, such as
demand-side managers from sales, customer service, and marketing, and supply-side
managers from manufacturing, logistics, and procurement” (Mello, 2013, p. 27).
Regarding the manufacturers’ multiple forecasts, because of a different outlook of
departments and lack of cross-functional communication, causing loss of information
(Småros, 2007; Fliedner, 2006; Helms et al., 2000), S&OP is an alternative option to
synchronise their internal-external relation in CF with retailers. S&OP seems to be a
remedy for manufacturers to improve their forecasting skills in matching supply and
demand. However, market uncertainties worsen information sharing with retailers,
which obliges manufacturers to apply safety stocks (Mello, 2013). Safety stock is
arguably not a good option for short-life products. In such a case, it is also beneficial
for manufacturers to convey departments’ cross-functional communication to an
external level by linking S&OP and CF in collaborations with retailers (VICS,
2010).
The logic behind this is that S&OP is a decision making process to synchronise the
strategic, operational and financial plans of a company in having a consensus on a
single plan, in which such a plan comprehends overall risks, opportunities and the
actions that should be done strategically in the long-term (e.g. 18 to 24 months).
Whilst S&OP is more a planning focused internal approach, CPFR moves this
practice to the external level by creating consensus between partners, where it
further evolves partners’ supply chain from a scanty push system to a more customer
focused pull system systematically. Therefore, merging S&OP and CPFR can help
partners to develop an integrated business plan, which, in turn, foster the
management of supply chain and provides competitive advantage (VICS, 2010).
In practice, the collaboration of The Lowe’s Home Improvement and Whirlpool is a
good example of the combination of CPFR and S&OP. Partners initially worked on
customer focused marketing strategies for better order forecasts and inventory levels.

69
Then, the focus became the alignment of sales and forecasting plans, which also
helped them to be involved in promotions, launching new items and planning special
events. Such a linkage of CPFR and S&OP enabled Whirlpool as a manufacturer to
enhance sales growth by 12 percent, to reduce inventory costs by 5 percent and to
improve timely deliveries by 3 percent along with increased flexibility and faster
decision making (Smith et al., 2010).
In case of having long production lead-times and seasonal products in S&OP, a long
planning horizon is essential (e.g. 12 months) whilst a short horizon seems adequate
for short lead-times and mature products (Grimson and Pyke, 2007). Given the
benefits of long-term capacity management (e.g. timely deliveries, flexibility and
cost), the long-term planning focused S&OP helps manufacturers to align production
and forecasts, and to effectively manage production capacity (Olhager et al., 2001).
Studies concluded that formally conducted S&OP allows salespeople to share the
logic behind decisions given to tailor forecasts. In detail, while salespeople
deliberately inflate or deflate forecasts to meet corporate objectives (e.g. product
availability or exceeding quotas), S&OP, in this case, enables consensus on forecasts
by allowing upstream and downstream members to interpret forecasts at meetings
(Byrne et al., 2011). When partners make an effort to deal with market uncertainties,
they should regularly revise responsibilities and improve S&OP by either adding
additional processes to feed forecasts with new information or removing redundant
ones to prevent duplicated forecasts (Nakano, 2009).
In the vulnerable FSC, partners not only confront external dynamics (e.g. economic
conditions, unexpected events, seasonality and promotions) (Bourlakis and
Weightman, 2004), but are also involved in internal dynamics that appear due to
poor organisational structure (e.g. lack of data, poor information systems and
communication). Such disturbances occasion decayed perishable / seasonal products,
with settling these conflicts resting upon the extent to which partners integrate
internally and externally (Vlajic et al., 2012). Hence, inter-organisational interaction
is important to manage demand against such shortcomings and product-related
ambiguities (Davis and Mentzer, 2007). S&OP brings about the alignment of
demand and supply through departments’ cross-functional integration (Oliva and

70
Watson, 2011), and it eases the development of long-term plans for production,
sales, demand forecasting and capacity management (Thomé et al., 2012). This is
why merging S&OP with the CF practices of manufacturers is most likely to remedy
their internal conflicts, which will in turn enhance forecast accuracy and satisfaction
for long-term collaborations. In addition to S&OP, the SCM literature has also paid
close attention to the practices of Vendor Managed Inventory (VMI), Quick
Response (QR) and Efficient Consumer Response (ECR), (Ramanathan, 2010; Choi
and Sethi, 2010; Grimson and Pyke, 2007; Micheau, 2005; Kurt Salmon Associates,
1993). These practices are discussed to review the SCM literature.
2.4.1. Vendor Managed Inventory (VMI)
In the 1980s, VMI emerged as a pilot project conducted between Wal-Mart and P&G
(Ramanathan, 2010). VMI is a partnership initiative that relies on “information
sharing among the members in an attempts to match supply and demand as closely
as possible” (Angulo et al., 2004, p. 101). It aims to “provide the right product, to
the right place, at the right time, in the right quantity, at the least cost” (ECR Europe,
2002, p. 83). Therefore, it gives responsibility to manufacturers through continuous
replenishment operations (Sari, 2008). This initiative received strong attention in
various industries. Nestle and Tesco (Watson, 2005), Boeing and Alcoa (Micheau,
2005) and Electrolux Italia (De Toni and Zamolo, 2005) as well as Glaxomithkline
(Danese, 2004) are a number of leading companies that benefited from VMI.
During VMI, suppliers’ responsibility is to replenish customers’ inventory, where
the inventory control is transformed from decentralised to centralised systems.
Retailers need to share POS data with suppliers for better demand visibility and
inventory management (Aviv, 2002). VMI enables retailers to focus on the
management of spaces on shelves rather than managing inventory (Mishra and
Raghunathan, 2004). VMI provides competitive advantage to retailers by sustaining
product availability and reducing order and inventory costs (Waller et al., 1999). On
the other hand, manufacturers gain favour from it by reducing bullwhip effect
(Disney and Towill, 2003). VMI not only helps partners to improve their logistics
capabilities, but also to enhance the efficiency of coordination with each other to be
more flexible against demand changes. Particularly, it links partners’ logistics

71
operations, and improves the delivery operations. This brings about the alignment of
inventory and demand (Mason and Lalwani, 2006). This is why retailers gain
competitive advantage while improved logistics skills of manufacturers helps them
to be more responsive to demand.
Technological infrastructure is a requirement for VMI to conduct timely information
sharing from retailers to suppliers, which, in turn, reinforces their replenishment
operations (Sari, 2008). Earlier studies stressed that product tracking systems are
important to estimate the timely product quantity required (Waller et al., 1999). Case
studies exemplified the low cost feature of VMI providing competitive advantage in
the clothing industry (Chang et al., 2009) while simulations revealed its capability
in responding to demand volatility, which occurs due to discounts or price changes
(Disney and Towill, 2003).
As opposed to long-term VMI partnerships in the USA, relevant literature
documented different outlooks in the UK grocery sector with regard to over prices
and inventory costs inducing lack of trust and short-term collaborations (Peck,
1998). There is a consensus that VMI limits the usage of retail information (Yao et
al., 2007; Angulo et al., 2004; Aviv, 2002). In essence, retailers can reduce order
costs, inventory monitoring operations and increase product availability, but VMI is
not satisfactory during promotions (Ramanathan, 2010; Sari, 2008). For instance, the
grocery chain Spartan Stores ceased the implementation of VMI with suppliers due
to VMI’s inadequate features of dealing with promotions (Simchi-Levi et al., 2003).
The reason behind this limitation of VMI is that manufacturers make an effort to
manage replenishment operations with limited data (Sari, 2008). In other words,
retailers give responsibility manufacturers to manage their inventory, but share
limited data, such as POS. Retailers’ closeness to the market allows them to have
additional data that represent consumer behaviours and external demand indicators
(e.g. weather and market structure). Along with promotional data, these sources are
important clues to react to instant demand changes (Aviv, 2002). Therefore, time-
sensitive feature of promotions requires partners to share diverse information types
in a timely manner (Forslund and Jonsson, 2007; Cachon and Fisher, 2000).

72
2.4.2. Quick Response (QR)
The history of QR dates back to the middle of the 1980s, when it was developed to
cope with global difficulties of the clothing industry in the USA (Choi and Sethi,
2010) and to quickly react to demand changes with an effective inventory
management (Iyer and Bergen, 1997). Its objectives are not only to align the chain of
suppliers and buyers and to eliminate costs (ECR Europe, 2002), but also to reduce
lead-times over effective replenishment operations, which accordingly leads to
improving inventory turnover due to mitigated safety stock (Achabal et al., 2000).
The structure of QR relies on retailers’ POS data, shared over Electronic Data
Interchange (EDI) to produce demand forecasts and to schedule production alongside
distribution (Choi and Sethi, 2010). EDI is “the computer to computer transmission
of information between partners in the supply chain” (ECR Europe, 2001, p. 104).
Partners mostly favour QR because relevant products have a short shelf life and
volatile demand, and because lead-time is long for replenishment operations (Choi
and Sethi, 2010). Although QR originated in the USA, it is popular in European
countries as well. Common challenges of QR are related to its practical utilisation
and the adoption of EDI or related IT systems by practitioners (Fernie, 1994). For
instance, practitioners in the UK grocery sector confronted stock management and
lead-time-related difficulties, complementary to their poor partnerships. Staying in a
long-term collaboration and regularly exchanging data seem to be remedy to these
difficulties, with bringing about accurate forecasts as well as efficient replenishment
and logistics practices (Whiteoak, 1999).
Conducting tight relationships and regular data exchange necessitates good IT
infrastructure in collaborations (Fliedner, 2006; 2003). Given the importance of IT
systems in QR, previous studies concluded that partners’ technological barriers are
related to adoption (e.g. overlapping managerial commitment and vision issues) and
/ or implementation (e.g. inadequate information, close collaboration and stationary
business practices) (Fernie, 1994). Studies in the agricultural industry highlighted
how partners need to conduct transparent information sharing and to use relevant
information for better demand management, where the role of IT systems in
collaborations escalates (Zhao et al., 2010). In connection with partners’

73
technological challenges, Fiorito et al. (1995) pointed out the necessity of having a
clear understanding about responsibilities and required information, and frequency of
delivery. According to Choi and Sethi (2010), exploiting QR depends on the
partners’ level of vertical integration, quality of information shared and forecasting
methods used to align supply-demand as well as the IT systems used to exchange
data. Previous studies stressed the role of inventory services, where manufacturers
cannot benefit from QR whilst retailers can, in case of having larger than 50 percent
inventory service (Iyer and Bergen, 1997).
In essence, because IT systems transformed over time, the popularity of QR has risen
in the FSC, and it became a good option for retailers in responding to consumers not
only to meet demand but also to compensate for complaints. For instance, studies
found that retailers exploit QR to respond to consumer complains via discount
coupons. In case of not accomplishing QR, it has been observed that retailers’ loss at
stores can rise to € 950,000 a year (Goudarzi et al., 2013). Given the analysis of
these studies regarding QR from the retailers’ point of view, it is possible to say that
retailers do not face IT related difficulties from a monetary point of view. The issue
appears from the manufacturers’ point of view whether they have a good IT
infrastructure to align supply-demand, to conduct timely deliveries and to conduct
tight collaborations with retailers (Choi and Sethi, 2010).
2.4.3. Efficient Consumer Response (ECR)
Kurt Salmon Associates (1993) introduced ECR as a logistics management practice
in 1992. ECR considers the demand driven logistics approach of the clothing and
motor manufacturing industries and it is in line with the objectives of Just-In-Time
(JIT) and QR, where it was then applied in the grocery sector (Peck, 1998). ECR
Europe (2002, p. 87) defines ECR as “a joint initiative by members of the supply
chain to work to improve and optimise aspects of the supply chain to create benefits
for the consumer e.g. lower prices, more choice variety, better product availability”.
ECR aims to minimize costs in supply chains and to meet consumer needs in
connection with the processes of efficient replenishment, promotion, store
assortment and product introduction (Alvarado and Kotzab, 2001; Robins, 1994).

74
Through these four processes, partners get benefit from a continuous replenishment
programme and category management (Kurnia and Johnston, 2003).
The efficient product replenishment process aims to minimise replenishment times
and costs, with manufacturers obliged to provide correct products to correct places in
the correct amount and at the right time. This process relies on the implementation of
a continuous replenishment programme in an attempt to minimise stock levels
(Harris et al., 1999). An efficient promotion process focuses on eliminating
redundant promotions over new and alternative promotions. “Pay for performance”
and “forward commit” are two alternative options that manufacturers apply in ECR.
For instance, “pay for performance” is connected with rewarding retailers based on
the number of products sold to customers and bought from manufacturers
(Washburn, 1995). “Forward commit” is about delivering a single retailer order to
multiple stores or warehouses. In this option, retailers gain favour from discounts
given for a limited time of promotions by manufacturers (Martin, 1994).
As far as the store assortment process is concerned, this process is managed at the
store level, and aims to enhance efficiency for better inventory and shelf
management. Improving store assortment in ECR requires the close collaboration of
manufacturers and retailers (Kurt Salmon Associates, 1993), as well as the good
category management (Kurnia et al., 1998). In the product introduction process,
partners need to make good effort to develop new items, to launch them in the
market and to mitigate associated costs collaboratively (Kurt Salmon Associates,
1993). As in the store assortment process, partners again focus on category
management to monitor the performance of newly launched products in the market
(Harris et al., 1999).
In the USA, the interest of companies in ECR rose to cope with supply level
difficulties, such as inventory and delivery practices, while their European
counterparts used ECR for demand management (Fernie, 1994). Following this,
long-term collaborations in the USA improved supply chain efficiency over the time-
consuming face-to-face meetings. However, these meetings kept away a large
number of small manufacturers from long-term collaborations (Peck, 1998). In spite

75
of limited long-term collaborations, retailers gained benefits from service and
reduced inventory levels alongside associated costs because of manufacturers’ full
responsibility for replenishments, forecasts and deliveries (Kurt Salmon Associates,
1993). In the UK, Tesco and Sainsbury’s are good examples that earned competitive
advantage via ECR. They, for instance, identified a number of obligations, in which
manufacturers should fulfil them to conduct successful collaborations with retailers.
They are (Fearne and Hughes, 2000, p. 765):
Proactive relationships across all aspects of the business (moving away from
exclusive buyer/account manager contact to multi-functional linkages across the
business)
Complete electronic integration (now accessible for even the smallest suppliers
as costs have come down with time and experience)
Information sharing (directed at improving and increasing existing business and
inevitably drives exclusive / closed supply chains, which goes some way to
offsetting the risk of sharing information with suppliers)
Innovation (new product development, marketing, supply chain management)
Ability to assist / shape customer’s view of the category and its future
development (strategic relationship)
Customer specific products, services and investments (supply chain
exclusively)
Financial stability (retailers do not want to invest in key suppliers if they are
going to go bankrupt!)
Supply chain management (integrity and efficiency)
Cost management (ability to measure and analyse them and take positive action
– open book feasibility)
Product range management (ECR related issues such as category planning and
new product development)
Promotion and merchandising (tends to be retailer led in fresh produce but
supplier led in fast moving consumer good)

76
These obligations conclude that those manufacturers distinguishing themselves from
others should primarily focus on long-term partnerships by following a single vision
with retailers, and they need to be innovative by focusing new product development
(Fearne and Hughes, 2000). In essence, ECR is more extensive than QR, and covers
suppliers as well (VICS, 2002). It not only considers partners’ internal practices
(VICS, 2002), but also gives further emphasis to timely and accurate information
sharing (Fiorito et al., 1995). This necessity increases the importance of information
sharing and its enabler IT systems for strategic partnerships. The aforementioned
analyses and pragmatic views are clear evidence that manufactures have
responsibilities at the operational and managerial level to satisfy retailers and to
sustain long-term collaborations. Nevertheless, adequate attention has not been paid
to their standpoint in the FSC, which necessitates future research to close this gap
(Småros, 2007).
In summary, partners have alternative practices (e.g. S&OP, VMI, QR and ECR) to
build promising partnerships in the FSC. Their objectives and benefits along with the
required responsibilities of partners are summarised in Table 2.6 for managerial
implications. Despite their different procedures, partners’ challenges are common.
For instance, S&OP eases internal integration and allows manufacturers to follow a
single plan for supply-demand alignment, yet market uncertainties (e.g seasonality
and promotions) escalate demand volatility. This calls for high quality information
sharing (Mello, 2013). VMI limits diverse information exchange between partners,
which in turn restricts its application for promotions (Sari, 2008). Similarly, IT
related obstacles in QR require close internal-external integration and sophisticated
forecasting processes, where exchanging quality information is non-ignorable too
(Choi and Sethi, 2010). Diverse processes of ECR require manufacturers’ continuous
effort and innovation through promotions and new product development. It is
therefore requisite to satisfy retailers by investing in IT and improving forecasting
skills through long-term collaborations (Fearne and Hughes, 2000).

77
Table 2.6. Objectives and benefits of collaboration practices along with the role of partners in these collaborations
Objectives Benefits Responsibilities of Manufacturers & Retailers Relative References
S&OP
*To analyse the performance and
aspect of relevant departments to
ensure they proceed on a single outlook
*To align company’s demand forecast and supply-service practices via
integrated company plans
*To develop a consensus-based set of
forecasts and plans
*Increasing profits rather than reducing costs
*Improving interdepartmental integration
*Matching demand-supply on an integrated plan *Easing internal consensus on a single forecast
*Increasing sales growth
*Reducing inventory costs *Improving delivery performance
*Enhancing internal-external flexibility
*Increasing speed of decision making
*Focusing on long planning horizon if production lead-time is long and
products are seasonal *Focusing on short planning horizon if production lead-time is short
and products are mature
*Having a clear understanding about the impact of forecasts on the production, delivery plans and procurement
*Continuously improving processes and eliminating redundancy
*Cross-functionally sharing new and diverse information *Aligning forecasts and production by linking sales plans
*Consistently improving sales and future plans (e.g. promotions and
advertising) *Focusing on long-term and strategic collaborations
Baumann (2010); Byrne et al. (2011);
Feng et al. (2008); Grimson and Pyke
(2007); Mello (2013); Nakano (2009);
Olhager (2013); Olhager et al. (2001);
Oliva and Watson (2011); Smith et al.
(2010); Thomé et al. (2012); VICS
(2010; 2002)
VMI
*To match supply-demand as closely
as possible
*To provide the right product, to the
right place, at the right time, in the right quantity, at the least cost
*Enhancing visibility on retailers’ demand and inventory
level
*Utilising the logistics operations of partner to maintain product availability
*Providing flexibility to conduct consistent collaborations *Providing competitive advantage in the market
*Reducing order and operation costs for retailers along
with increased product availability *Improving capability of responding to instant demand
changes
*Replenishing inventory of retailers *Sharing POS data, promotional plans and external demand indicators
(e.g consumer behaviours, market and weather conditions) with
manufacturers *Investing in IT systems
*Conducting timely and continuous information sharing *Following a single vision over prices and inventory costs
*Showing mutual trust and commitment
*Investing in product tracking systems for visible supply chain
Angulo et al. (2004); Aviv (2002); Chang
et al. (2009); Danese (2004); Disney and
Towill (2003); De Toni and Zamolo
(2005); ECR Europe (2002); Mason and
Lalwani (2006); Mishra and Raghunathan
(2004); Peck (1998); Ramanathan
(2010); Sari (2008); Simchi-Levi and
Zhao (2003); Waller et al. (1999);
Watson (2005); Yao et al. (2007)
QR
*To align the supply chain of partners
*To eliminate supply chain and
inventory costs
*To reduce lead-times through effective replenishment operations
*Responding to instant demand changes
*Effectively managing inventory and product availability *Easing the demand management of short shelf life
products that have volatile demand *Becoming preference while lead-time is long for
replenishment operations
*Mitigating bullwhip effects *Accelerating the speed of delivery operations
*Sharing POS data with manufacturers
*Investing in IT systems
*Showing mutual trust and commitment
*Linking forecasting, logistics and replenishment practices *Having a clear understanding about responsibilities, information
shared and frequency of delivery operations *Conducting high quality information sharing
*Employing product based effective forecasting methods
*Focusing on long-term and strategic collaborations
Angulo et al. (2004); Achabal et al.
(2000); Choi and Sethi (2010); ECR
Europe (2002; 2001); Fernie (1994);
Fiorito et al. (1995); Goudarzi et al.
(2013); Iyer and Bergen (1997); Whiteoak
(1999); Zhao et al. (2010)
ECR
*To eliminate supply chain and
inventory costs
*To meet consumer needs through efficient replenishment, promotion,
store assortment and product
introduction processes
*Reducing costs of product development and service
*Enhancing product variety and availability at stores *Improving inventory and delivery practices
*Easing demand management in case of having good IT systems
*Being preferred for promotions and launching new items
*Providing competitive advantage in the market
*Sharing POS data with manufacturers
*Replenishing inventory of retailers
*Managing delivery operations effectively *Investing in IT systems
*Conducting timely and continuous information sharing *Conducting high quality information sharing
*Showing mutual trust and commitment
*Focusing on long-term and strategic collaborations *Investing in new product development and forecasting skills
Alvarado and Kotzab (2001); Angulo et
al. (2004); ECR Europe (2002); Fearne
and Hughes (2000); Fernie (1994); Fiorito
et al. (1995); Harris et al. (1999); Kurnia
and Johnston (2003); Kurnia et al. (1998);
Kurt Salmon Associates (1993); Martin
(1994); Peck (1998); Robins (1994);
VICS (2002); Washburn (1995)
Source: Developed by the author

78
2.5. Supply chain integration
Supply chain integration is “the degree to which a manufacturer strategically
collaborates with supply chain partners and collaboratively manages intra- and inter-
organisational processes, in order to achieve effective and efficient flows of products
and services, information, money and decisions, to provide maximum value to
customers” (Flynn et al., 2010, p. 58). The integration of manufacturers has been
categorised into four stages in the literature. The first stage is more quick fix based,
and there is not a tight integration or effective communication either between
departments or with partners. Departments manage their processes independently,
and only collaborate to solve potential crises. The second stage is more functional,
and focuses on the flow of items. The intention at this stage is to reduce costs instead
of improving supply chain performance. Manufacturers mostly use MRP systems to
manage their short-term plans, but there is a lack of transparency about demand
(Stevens, 1989).
At the third stage, there is high visibility from purchasing raw materials to delivering
end products. Production and demand are well synchronised in the medium term
plans, but the focus is more tactical than strategic. In other words, manufacturers aim
to respond to demand instead of collaborating with retailers and / or suppliers. In the
final stage, manufacturers’ integration is transformed from product-based to
consumer-based integration by extending their integration to the supplier and
consumer level. Collaboration with partners commences at the early stage of product
development, and focuses on strategic objectives. It involves high level IT systems
for effective information exchange, and requires long-term commitment between
partners (Mason and Lalwani, 2006; Stevens, 1989).
In essence, supply chain integration is a promising research field and therefore a
plethora of research has been dedicated to it by examining manufacturers’
relationships with either suppliers or customers. However, the study by Flynn et al.
(2010) specifically extended the supply chain integration literature to manufacturers’
interdepartmental relationships by bringing a new dimension to the field.
Manufacturers’ integration in the supply chain not only refers to external operations
with suppliers and / or retailers, but also involves the internal functions of a company

79
as an extension of external coordination over strategic and technological efforts
(Sahin and Robinson Jr., 2005).
In this respect, the current research reviews the related literature as an extension of
CPFR to be able to reinforce the integration of manufacturers both internally and
externally through their CF practices with retailers. Van der Vaart et al. (2012)
categorised the integration practices as “planning information”, involving partners’
information sharing to accomplish better supply chain plans, and “joint
improvement”, working collaboratively to modify supply chain processes for less
cost and joint decisions. In other words, while timely and accurate data exchange
play a vital role to implement effective supply chain plans (Devaraj et al., 2007),
CPFR creates a platform for partners to integrate their supply chain (Van der Vaart
et al., 2012). By focusing on Dutch and Spanish manufacturers, a survey by Van der
Vaart et al. (2012) discovered that partners’ IT infrastructure and organisational
behaviours influence their integration whilst supply chain complexity is influential
on supply chain performance by implying transparent planning. Underpinning these
empirical results, the literature has stressed that IT systems, effective inventory
management and building mutual trust during inter-intra organisational
collaborations are the core elements to integrate in chains (Power, 2005; Handfield
and Nichols, 1999; Akkermans et al., 1999).
In consideration of manufacturers’ strategic collaborations, Flynn et al. (2010)
investigated relations between operational-business performance and supply chain
integration. Their hierarchical regression based results revealed that manufacturers’
interdepartmental relations are vital for operational and business performance.
Customer integration has a significant impact on their operational performance,
whilst competitive environment, the trust factor and organisational characteristics
seem to be important factors for the integration practices of partners. These
outcomes make it possible to argue that in addition to strong interdepartmental
relations, manufacturers should give emphasis to integration with retailers for
promising results in the supply chain. In this case, it is promising to interrogate this
argument by considering the dynamic structure of FSC and partners’ trust related

80
challenges in collaborations (Vlachos and Bourlakis, 2006; Bourlakis and
Weightman, 2004).
An exploratory study with a consumer electronics firm by Oliva and Watson (2011)
revealed that although partners intend to sustain diverse needs of top managements,
they are likely to integrate during collaboration. However, partners’ planning
processes play a vital role for the quality level of information exchanged and the
alignment of demand and supply, which, in turn, hints at how partners’ planning
process is important for reliable information sharing and better forecasts. On the
other hand, by relying on both interview and empirical results about the relations of
e-procurement and supply chain performance, Chang et al. (2013) emphasised the
major role of integration for supply chain performance compared to data exchange
and to partners’ mutual commitment in collaborations. They also demonstrated that
information exchange has a positive impact on supply chain integration, and their
results seem to be in line with the study by Van der Vaart et al. (2012). Overall,
these strong discussions underline the necessity of critical elements for the internal
and external coordination of manufacturers, which are imperative to be analysed in
the FSC.
2.5.1. Barriers that prevent the integration of FSC
The food industry has been subject to various studies to identify the primary
expectations of supply chain members on collaborations. Regarding the partners’
different expectations from collaborations that limit large-scale CF (Småros, 2007),
it is apparent that there are several determinants for effective supply chain
integration in the FSC, such as trust, commitment, information sharing, category
management and physical distribution. However, whether these elements have an
impact on the length of collaborations is a considerable mystery in literature and
practice (Småros, 2007; Vlachos and Bourlakis, 2006; Aviv, 2002). Practitioners still
do not have a clear understanding about strategically forming their collaborations,
which plays a key role in long-term partnerships (Ramanathan et al., 2011; Barratt,
2004). Despite relevant propositions addressing long-term CF in the FSC (Eksoz and
Mansouri, 2012), there is a scarcity of empirical research shedding light on the
development of long-term collaborations (Ramanathan and Gunasekaran, 2014).

81
For manufacturers, trust is a building block of collaborations. On the other hand,
retailers’ initiatives rely on information exchange, physical distribution, category
management and commitment, whilst they prefer multifaceted collaborations. These
antecedents are likely to reduce agreement in relationships (Vlachos and Bourlakis,
2006), which in turn prevent the alignment of supply and demand. These
misalignments may be excessive-few items, and errors related to timeliness, location
or Stock-Keeping-Units (SKUs) (Simatupang and Sridharan, 2002). If manufacturers
are capable of meeting retailers’ expectations in connection with product availability,
this will lead to get further benefit from collaborations (Aviv, 2007). In essence, a
study by Gallear et al. (2012) brought an interesting dimension to collaborations by
demonstrating the importance of monitoring corporate responsibility and of
enhancing internal awareness about the partnerships, where adopting strong
partnerships enhances corporate performance.
In other words, manufacturers should have a clear understanding about their internal
and external responsibilities, which, in turn, plays a key role in collaborative
performance. These blind sides of manufacturers are likely to be improved with the
strategic initiative of S&OP. Whilst satisfying retailers depends upon product
availability (Aviv, 2007) requiring timely alignment of demand and supply
(Simatupang and Sridharan, 2002), S&OP can help manufacturers to generate timely
forecasts through departments’ cross-functional integration (Oliva and Watson,
2011). Given the forecasting benefits of S&OP, for high-volume and short-life
products, it is a worthwhile option in forecasting perishable, seasonal, promotional
and / or newly launched products in CF (Olhager, 2013). While manufacturers have
a long-term strategic production and demand forecasting plans (Thomé et al., 2012),
their organisational structure becomes more transparent and efficient which ease the
development of long-term collaborations with retailers. Therefore, it is reasonable to
scrutinise this linkage between S&OP and CF to achieve long-term and accurate
collaborative forecasts in the FSC.
Disagreements exacerbate when data flows between partners and when forecasts
emanate within departments and / or in forecast meetings (Småros, 2007; 2002). In
practice, manufacturers have a tendency to bind retailers over a plan for additional

82
demand information, which is used to enhance forecast accuracy as opposed to long
lead-times. Conversely, retailers give less importance to forecast accuracy due to
short lead-times, and focus on managing store level demand instead of aggregating
demand (Småros, 2007; 2005). Although manufacturers can obtain further benefits
from retailers who have good forecasting skills, retailers’ opportunistic behaviours
about taking advantage of manufacturers limit information sharing with each other
which, in turn, causes loss of trust (Taylor and Xiao, 2010).
Fundamentally, retailers’ information leads manufacturers to reduce inventory levels
and related costs in addition to increased supply chain performance (Lee et al.,
2000). Danese (2007), for instance, categorised the level of CPFR practices as basic,
developing and advanced CPFR. While basic CPFR refers to simple information
sharing, developing CPFR more deeply regards the exchange of demand, production
related data, promotions and order planning. On the other hand, advanced CPFR
stresses high level transparency through information sharing. However, it is still
uncertain about what disruptions through information sharing influence partners’
inventory regimen and products’ quality (Li et al., 2006), and to what extent partners
need to integrate and to exchange information in collaborations (Devaraj et al.,
2007).
Partners are more likely to conduct closer collaborations through order processing
and promotional activities compared to the practices in connection with business
strategy and sales forecasts (Vlachos and Bourlakis, 2006). Collaborations that lack a
single strategy seem to be very difficult to increase forecast accuracy. The reason is
that conducting strong information sharing and preserving product availability rely
largely on partners’ joint business plan and agreement on a single consensus forecast
(Ireland and Crum, 2005; Siefert, 2003). For instance, the cross-case analysis by
Danese (2007) in Europe illustrated how although partners conduct simple
information sharing, their joint business and sales forecast plans allow them to
accomplish CPFR goals, which are to either reduce inventory costs or increase
responsiveness against instant demand changes. Previous studies have already
emphasised the importance of engaged business plans and tight partnerships to align
demand and supply in chains (Simatupang and Sridharan, 2002). Adopting a single

83
business plan leads partners to explore and manage potential events that affect
demand and supply, such as promotions, changes in inventory, opening or closing
new stores and launching new items (VICS, 2004).
Partners’ power is likewise likely to affect their CF. Aviv (2007) stressed that if
manufacturers dominate in supply chains, their forecast expectation increases and
this, in turn, harms their forecasting skills when it comes to predicting retailers’
demand correctly. Contrary views supported the idea that manufacturers play a
leading role, because they decide wholesale prices whilst retailers are in a follower
position (Zhu et al., 2011). However, it was affirmed that retailers’ leadership role
makes CF more beneficial due to their closeness to market (Aviv, 2007).
Observations in the FSC exacerbated these arguments relating to the power of
partners. For instance, when Danese (2007) interviewed a manager who was
representing a world-wide retailer, the manager claimed that generating joint
promotional and sales forecasts with manufacturers does not provide a particular
benefit, because they (the retailer) has enough power to collect the required
information from the market without conducting close collaborations.
On the other hand, the recent study by Bourlakis et al. (2014) found that large
manufacturers are the “sustainability performance champions” in the FSC, and
efficiency, flexibility, responsiveness and product quality are important factors to
manage sustainability. The authors also claimed that manufacturers need to play a
pivotal role in meetings for sustainable FSC while He et al. (2013) advocated the
restriction of power among partners for better information exchange and supply
chain performance. Relying on these contradictory and limited studies that did not
pay attention to partners’ CF practices, interrogating manufacturers’ responsibilities
in the chain and their impact in the forecasting meetings will be an intriguing area to
extend the literature.
2.5.2. Integration between manufacturers and retailers
Studies devoted to manufacturer-retailer relationships in the FSC have underlined the
partners’ substantial problems that occurred due to overlapping expectations
throughout their information sharing and forecasting process (Fang and Meng, 2010;

84
Småros, 2007; Taylor and Fearne, 2006). Manufacturers’ long lead-times, production
plans, poor interdepartmental integration, different forecasting approaches and
excessive information requests from retailers became the challenges of CF (Småros,
2007; Helms et al., 2000). Retailers’ naive forecasting process, and reluctant and
opportunistic behaviours during information exchange were discussed as inhibitors
of the long-term and accurate CF (Taylor and Xiao, 2010; Taylor, 2006; Småros,
2002). Despite adverse opinions, refusing the core contribution of IT systems to
collaborations (Småros, 2007; Barratt, 2004), their costly investments seem to be a
substantial barrier to not only long-term CF, but also the utilisation of CF in a broad
range of product-groups (Sari, 2008; Fliedner, 2003; McCarthy and Golicic, 2002).
In practice, manufacturers and retailers endeavour to consolidate their relationships
for operational planning, information sharing and forecasting practices in an attempt
to enhance organisational profitability. For instance, when Mentzer et al. (2000)
examined strategic and operational collaboration models, they found that while
partners aim to achieve long-term objectives, they collaborate strategically, which
enables them to develop new products and to enter new markets effectively. The
underlying reasons for this success in the strategic collaborations are not only the
technological infrastructure and expertise of manufacturers (Droge et al., 2004), but
also their strong interdepartmental coordination, which underpins strong
communication with retailers as one of the core elements of long-term relations
(Paulraj et al., 2008).
These results add further insight into the attitudes of retailers in practice. Tesco and
Sainsbury’s, for instance, identified similar requirements for manufacturers to be
able to conduct long-term collaborations, such as collaborating strategically,
investing IT in systems and improving forecasting skills (Fearne and Hughes, 2000).
Although collaborating operationally improves the performance of operational
practices, it is not a permanent and consistent practice between partners. The
underlying reason is that operational collaborations are based upon short-term
decisions, which are made to improve corporate performance and operational
efficiency, such as product quality, customer service, inventory levels and timely
deliveries (Lambert and Stock, 1993). On the other hand, strategically collaborating

85
partners gain possession of competitive advantage in the market owing to long-term
decisions, which are made to conjoin their information sharing and forecasting
processes (Mentzer et al., 2000). Partners’ strategic collaboration induces reciprocal
trust, continuous information sharing as well as constructive discussions to cope with
potential exceptions (Flynn et al., 2010).
Empirical studies called for “openness, positive mutual understanding, honesty and
respect” for effective information sharing (Ha et al., 2011, p. 59). In a similar vein,
when Spence and Bourlakis (2009, p. 293) examined the supply chain responsibility
in the case study of Waitrose, they summarised the focuses of “power, partnership,
supply chain integration, negotiation, honesty, openness and trust” for sustainable
collaboration in the FSC. Building a mutual vision and improving organisational
capability seem to be inevitable for partners to cope with uncertainties in the FSC.
There is, however, a paucity of empirical studies investigating the impact of the
aforementioned factors and the ways of building satisfactory collaborations based on
particular market conditions, like in the dynamic structure of FSC (Bourlakis and
Weightman, 2004; Mentzer et al., 2000).
From a different point of view, Sanders (2008) devoted an empirical study to the
computer industry in an attempt to clarify how IT influences buyer-supplier
coordination. The author demonstrated that using IT for a “structured internal
information sharing” is necessary to implement operational coordination, which
provides operational benefits (e.g. fewer production costs and effective inventory
management). However, conducting strategic coordination depends upon the usage
of IT for an “unstructured internal information sharing”, which provides strategic
benefits (e.g. strong relationships and high sales volume). In the study by Sanders
(2008), “structured internal information sharing” represents the old process of firms
showing benefits in a short period. “Unstructured internal information sharing”
rather focuses on new processes, and is more flexible yet its long-run benefits.
Whilst there are contrary views who argued that it is not necessary to invest in IT
systems for the long-term integration of supply chains (Småros, 2007; Barratt, 2004),
the usage of IT for partners’ planning is the prerequisite for strategic coordination

86
(Sanders, 2008). These systems bring agility to information sharing, which is crucial
for CF (Aviv, 2007) and support several manufacturer practices, such as production
planning, inventory management and delivery (Thonemann, 2002). In reply to these
opposed views, it is promising to analyse the uncertain role of IT systems over the
integration of manufacturers in the FSC.
Fliedner (2006) argued that that when manufacturers increase the level of
collaboration with retailers, it brings consistency to their production scheduling and
inventory plans, with this consolidation engendering the supply of retailers’ short-
term demand. The author also highlighted the point that the high response rate of
manufacturers reduces product obsolescence and stock level, while investing in IT
systems makes it possible to conduct effective information sharing. Nevertheless,
implementing such investments is costly, which not only restricts information
exchange but also the implementation of long-term CF for a wide range of product-
groups (Sari, 2008; Fliedner, 2003; McCarthy and Golicic, 2002).
There is further evidence in the literature that partners’ overlapping forecasting
approaches worsen the supply chain planning and collaborations (Fildes et al., 2009;
Sari, 2008; Fliedner, 2006; Mentzer et al., 2000). The case study by Francis et al.
(2008) compared the collaborative principles of the UK and Argentine beef
foodservice sectors. The authors observed that lack of contracts, high prices and
responsibilities of the UK based manufacturers are barriers to building long-term
plans with retailers. Manufacturers’ logistics, production, storage and lead-time-
related problems have a significant impact on the shelf life of products. Despite the
authors’ remedy of a lean paradigm, the existing gap in the partners’ supply chain
operations became their keynote by calling further attention to manufacturers’
operations and capabilities in the FSC.
When Van der Vaart and Van Dook (2008, p. 45) critically reviewed the survey
based literature to analyse the relation between supply chain integration and its
performance, they categorised SCM factors to three groups. They are “practices”,
including EDI, VMI and production planning, “patterns”, such as supplier visits,
face-to-face meetings and consistent performance evaluation of suppliers, and

87
“attitudes”, involving trust, commitment, long-term collaborations, joint decision
making and share of responsibility. The authors additionally raised the question of
whether practices, patterns and attributes have an impact on each other, and of the
conditions that influence the partners’ attitude in collaborations. Furthermore, the
role of power and business conditions on supply chain integration appeared as other
question mark, which await empirical answers from academics.
Past literature has demonstrated how partners’ business and operational performance
are important for competitiveness (Mentzer et al., 2000) but there are different views
about whether strong collaborations are more important than the collaborations that
are conducted in a balance based on these performances (Flynn et al., 2010).
According to Du et al. (2009), to be one step ahead of competitors, partners should
improve their information sharing and have sustainable decision making
mechanisms, which are the omission of product-based collaborations, such as
collaborations that are built upon perishable products (Mentzer et al., 2000). The
intrinsic reason behind these naive collaborations is that partners’ relations in the
FSC rely heavily upon the structure of markets and the products traded with each
other (Duffy and Fearne, 2004). This outcome makes the investigation of partners’
CF on particular product-groups more attractive and encouraging to add further
insights into the managerial implications.
Related case studies have concluded that although partners attribute the demand
variability of perishable products to seasonality and unexpected events, their
promotional plans obstruct effective demand management (Taylor and Fearne,
2006). Price changes and special events including Christmas, Easter and holidays
likewise influence customers’ buying behaviour (Zotteri et al., 2005). Managing
demand against these ambiguities therefore requires inter-organisational interaction,
concerning the capabilities of interpreting vagueness on demand and then making
correct decisions (Davis and Mentzer, 2007). It is known that partners’ behaviours
are the key promoter of supply chain performance, requiring willingness,
commitment and flexibility in response to the complexities about long lead-times
and high demand variability (Van der Vaart et al., 2012). Whilst the first objective of
this research is to examine the integration practices of manufacturers based on time-

88
sensitive and / or short-life product-groups in CF, there is a consensus that calls for
further investigation on the partners’ product-based collaborations (Danese, 2007;
Taylor, 2006; Taylor and Fearne, 2006). Therefore, this research is committed to
closing this gap in the literature whilst CF is a promising practice to dedicate future
research by considering the dynamic structure of FSC (Småros, 2007).
2.6. Forecasting process
When companies employ a decentralised forecasting process, where each department
generates its own forecast separately, it leads forecasters to gain experience and to
reduce potential bias (Moon et al., 2003). However, overlapping forecasts are most
likely to occur if relevant departments estimate different forecasts, and such conflicts
pose a danger for partners’ collaborations. To limit the likelihood of this happening,
each department needs to employ the same information. In practice, different
departments of manufacturers generate their own forecasts based on departmental
objectives and sources (Helms et al., 2000). These forecasts not only engender
excessive inventory and loss of information, but also exacerbate internal-external
conflicts that limit manufacturers reaching consensus with retailers (Taylor and
Fearne, 2006; Fliedner, 2006; 2003; Helms et al., 2000). The UK FSC also
witnessed similar problems in retailers, where overlapping forecasts triggered
forecast variability and provoked disagreements with manufacturers (Taylor and
Fearne, 2006). It is important to recall that the major concern of the current research
is manufacturers. Therefore, their internal conflicts have the precedence for the
review of the forecasting literature, but the forecasting capabilities of retailers and
their role in CF are concurrently matters to be scrutinised.
Although previous studies have highlighted the supportive role of retailers in CF
(Aviv, 2002; 2001), their drawbacks in the forecasting process are apparent in the
European grocery sector as the reason for diminishing accuracy and limited long-
term CF, which imposed on partners’ different planning horizons and data
aggregation levels (Småros, 2007). For manufacturers, the underlying reason for
multiple forecasts is linked to a lack of confidence in generating sales forecasts and
to forecasters’ diverse views. For instance, “marketing may use forecasts with an
emphasis on trends occurring in the marketplace, while finance needs a forecast with

89
an emphasis on budgeting. Sales may adapt a forecast based on sales quotas and
production may create what they consider to be a better forecast based on their
experience and production capacity and efficiency. Purchasing may also adjust a
forecast to reflect their view points and experience and create what they consider to
be a better forecast” (Helms et al., 2000, p. 394).
In practice, USA based collaborative practices became a good example for Europe
based companies to improve forecast collaborations due to the good infrastructure of
USA based organisations easing collaborations, yet partners’ business structure and
forecasting processes are likely to differ from country to country (ECR Europe,
2001). The impact of organisational structure and forecasters seem other concerns
for the choice of forecasting method and accuracy (Fildes et al., 2009) while the
product life cycle and lead-times have a significant impact on the productivity in the
forecasting process (Fliedner, 2006). Partners are confronted with forecasting
problems while uncertainties in terms of the environment and demand (e.g.
seasonality and promotions) were handled in their forecasting process (Taylor and
Fearne, 2006). Hence, it is reasonable to argue that apart from the manufacturers’
organisational structures, which differ based on their region, the role of forecasters
likewise seems to be a promising facet to be analysed for better CF in the FSC.
Previous studies have shown that partners’ diversified capabilities in CF enhance
accuracy. For instance, while a manufacturer attributes the demand variability to
weather conditions and makes adjustments in this sense, a retailer can refer to
promotional plans to mitigate uncertainty about demand. Accordingly, having a low
relation between the influences of weather conditions and promotional plans
increases the accuracy. However, if partners’ adjustments on forecasts rely on the
same basis, such as weather conditions or promotions, it negatively influences
forecast accuracy (Aviv, 2001). In essence, this clarification further signifies the
importance of forecasters, who have different approaches in forecasting meetings.
This is the reason why forecasters’ diverse and constructive conflicts enhance the
reliability of forecasts and increase order response rates along with profitability by
reducing the amount of deteriorated products (Fliedner, 2006). Taking into account
the skills of forecasters seem to be an important matter for timely and reliable

90
consensus forecasts, while jointly generating forecasts is already an a requirement
for a transparent forecasting process (Taylor, 2006).
In CF, partners should primarily have an agreement on corporate objectives over a
unified business plan, and relying on a mutual calendar with regard to the frequency
and horizon of forecasts are necessary (Fliedner, 2006). Then, the forecasting
process should be initiated within centralised information sharing by estimating
independent forecasts and sharing them afterwards (Aviv, 2007; Siefert, 2003).
Independently generated forecasts make it possible to provide transparency, share
diverse information and have consensus on a single forecast, which are the building
blocks of CF, yet these practices cannot be accomplished due to partners’ different
choices of forecasting method (Fliedner, 2006). Overall, the aforementioned
evidence points to the need for future research for transparent CF (Småros, 2007),
while diverse forecasting methods (Fildes et al., 2009) , forecast meetings (Kerr and
Tindale, 2011) and forecasters’ role (Byrne et al., 2011) become primary topics to be
analysed in the FSC (Taylor and Fearne, 2006; Aviv, 2001).
2.6.1. Forecasting strategies
In the forecasting process, incorporating forecasting methods relies on four different
approaches: model building, decomposition, forecast combinations and judgmental
adjustments (Webby and O'Connor, 1996). Model building depends on judgments to
choose variables, structure a model and define parameters in generating quantitative
forecasts (Sanders and Ritzman, 2004). Decomposition separates historical series,
forecasts them, and then composes separated forecasts (Lawrence et al., 2006).
Forecast combinations, however, approach individual forecasts irrespective of
judgmental or quantitative forecasting, and combine them by taking their either
simple or weighted averages, while judgmental adjustments are made after the
generation of quantitative forecasts. The forecasting literature has emphasised the
pragmatic and objective features of forecast combinations and judgmental
adjustments (Webby and O'Connor, 1996). This is because, whilst the performance
of combinations drew the attention of practitioners (Clemen, 1989; Lawrence et al.,
1986), adjustments became a strong alternative to them (Lawrence et al., 2006;
Webby and O'Connor, 1996).

91
In FSC, combining and / or adjusting forecasts within companies seem to be
alternative solutions to multiple forecasts by departments, which not only increase
the number of internal conflicts (Fliedner, 2006; Taylor and Fearne, 2006; Helms et
al., 2000), but also hamper the consensus with retailers (Hill, 1999). Furthermore, as
a remedy to forecasters’ lack of confidence over sales forecasts from manufacturers
(Taylor and Fearne, 2006; Helms et al., 2000), these strategies appear as exit roads in
collaborations. For instance, McCarthy et al. (2006) documented that 53 percent of
companies work cross-functionally to incorporate multiple forecasts of different
departments whilst 54 percent employ CF. The literature has also manifested the
benefits of combinations when the environment is uncertain, having fluctuating
demand and diverse information sources, and when it is difficult to select appropriate
forecasting method/s (Lawrence et al., 2006; Sanders and Manrodt, 2003;
Armstrong, 2001). Judgmental adjustments are the reassuring approach to increase
forecast accuracy based upon contextual information, which is not used in
quantitative forecasting methods, such as the influence of promotions or special days
(Goodwin, 2002; Goodwin and Fildes, 1999; Webby and O'Connor, 1996).
For combinations, deciding whether to take a simple average or weighted average is
still questionable. Some views consider that equal weighting of constituent forecasts
is suitable (Sanders and Ritzman, 2004; Clemen, 1989). In essence, this approach
makes it possible to improve forecast accuracy in proportion to the number of
forecasts combined based on historical information (see Lawrence et al. (1986)).
However, weighting forecasts based on demand variability is not negligible due to
improved accuracy while judgment-based forecasting methods rely on contextual
information (e.g. advertising, delivery, experience and environmental cues) (Sanders
and Ritzman, 1995). Although the performance of combinations was attributed to the
negative correlation of constituent forecasts, further insight is essential to understand
the optimal way of combining quantitative and judgment-based forecasting methods
(e.g. manager’s opinion, jury of executive opinion and sales force composite)
(Goodwin, 2002; Goodwin, 2000a).
On the other hand, judgmental adjustments consist of two steps. In the first step,
decision should be made about whether the result of quantitative forecasting method

92
needs changes. If it is necessary, the direction and size of adjustments should be
evaluated as the second step of this forecasting strategy (Lawrence et al., 2006). In
fact, past literature claimed that statistical forecasts superior to judgmental
adjustments (Angus-Leppan and Fatseas, 1986), yet the availability of contextual
data, which can be obtained through either experience or from the environment,
underpins the reliability of adjustments (Sanders and Ritzman, 1995). Although
adjustments effectively improve accuracy over the contextual information (Goodwin,
2002; Goodwin and Fildes, 1999), their effort depends upon the accuracy of
quantitative forecasting methods, implying the characteristics of series used (Webby
and O'Connor, 1996). Goodwin (2000b) clearly showed its impact by considering the
trend, seasonality and promotional influences on adjustments.
According to a survey by Sanders and Manrodt (1994), which relies on the view of
124 respondents, 57.3 percent of companies use judgment-based forecasting methods
owing to forecast accuracy, difficulty of procuring information for quantitative
methods, ease of use and cost. However, 44.7 percent apply judgmental adjustments
(e.g. inflating or deflating statistical results) to add environment and product based
information along with previous experiences. In essence, 70.4 percent of forecasters
seem to prefer deflating forecasts, but organisational behaviours, per se, appeared to
be the major reason for inflated forecasts. Furthermore, shortcomings in regards to
lack of information, management support and training became the major barriers to
estimating effective forecasts.
Following this, pertinent studies supported the idea that negative (deflated) and large
(wide-range) adjustments are better than positive (inflated) and small (narrow-range)
adjustments, when demand arrives instantaneously in a short period, such as
promotions (Syntetos et al., 2009; Fildes et al., 2009). Despite the important role of
direction and size made for adjustments, the role of forecasters (e.g. training level,
confidence and bias) is a significant concern, and necessitates further clarification to
contribute to the forecasting literature (Fildes et al., 2009; Lawrence et al., 2006).
For instance, an experimental study by Önkal et al. (2013) has demonstrated the
impact of advice and types of information on the direction of adjustments and
forecasters’ confidence. In detail, the size of adjustments decreased through
93
forecasters’ active information sharing in meetings compared to individually
estimated forecasts. Having specific information also triggered forecasters to apply
larger adjustments for consensus forecasts compared to individual forecasts.
In fact, generating consensus forecasts in meetings calls for forecasters’ collective
effort, responsibility and motivation to be able to have a consensus on a single
forecast, while the information that they exchange with and / or offer to each other
eases the estimation of consensus forecasts (Lawrence et al., 2006). The
aforementioned limited evidence supports the relation of information sharing,
forecasters and forecasting strategies through the generation of accurate forecasts.
However, the literature is lacking in knowledge shedding light on practitioners’
forecasting process in CF. Empirical studies should close this gap by considering the
role of information sharing on the forecasting strategies, as well as forecasters and
forecasting meetings that affect consensus forecasts (Önkal et al., 2013; Eksoz and
Mansouri, 2012; Fildes et al., 2009; Lawrence et al., 2006).
Supporting the previously mentioned arguments, a survey by Fildes and Goodwin
(2007) considered the views of 149 respondents and found that although companies
from various industries largely adjust statistical results by 33.7 percent, a wide range
of companies use only judgment-based, quantitative and a combination of
forecasting methods by 25.1, 24.8 and 16.6 percent respectively. Promotions, price
changes and special days further appeared to be the leading reasons that direct
companies to apply judgmental adjustments. These outcomes intrinsically underline
the necessity of urgent research on forecasting strategies and processes. It is also
attractive to blend such research with the information sharing practices of partners,
forecasters and the forecasting methods used. The underlying reason behind this
proposition is that all the above-mentioned factors depend upon the environment,
providing information, organisational behaviours and forecasters. Partners’
forecasting processes in CF need to be clarified since the dynamic environment of
FSC provides soft data (e.g. rumour or hearsay data), where forecasters’ expertise
and correct forecasting methods need to be employed (Önkal et al., 2013; Småros,
2007; Lawrence et al., 2006; Sanders and Manrodt, 2003).

94
2.6.2. Forecasting method selection criteria
Despite the fact that the aforementioned forecasting strategies have pluses and
minuses in terms of their application, the criteria adopted to select appropriate
forecasting methods are also fundamental to measure the forecasting performance.
Zhao et al. (2002) formerly stressed the importance of forecasting method selection
over the value of information shared and collaborations, which enables partners to
save costs and to increase motivation for better regular information sharing. For
instance, when Mentzer and Kahn (1995) previously surveyed the opinion of 207
forecasters, they identified the accuracy (92 percent), credibility (92 percent) and
customer service performance (92 percent) as major parameters on the effectiveness
of forecasting methods, and the preference of forecasters became regression analysis
for product-groups and exponential smoothing for the product line, item level and
item based location forecasts.
In addition to these findings, McCarthy et al. (2006) showed that the importance of
accuracy for companies was reduced by 76 percent in all horizons that represent the
anticipated demand for products for a particular period. This reduction was indeed
more discernible for mid-term and long-term compared to short-term forecasts,
which decreased by 7 percent and 9 percent respectively. The authors attributed this
difference to a lack of familiarity with forecasting methods and training in addition
to product assortments. Their results identified customer satisfaction and supply
chain costs as important determinants for forecast accuracy. However, companies did
not adopt them as primary criteria through the selection of methods.
These unclear relations between the horizon and preference of forecasting methods
as well as ambiguous parameters that affect method selection criteria have
engendered further research to reveal the underlying reasons that worsen accuracy
within companies. Exploring the role of production postponement on the forecast
accuracy is also an important matter (McCarthy et al., 2006), which is an important
factor for manufacturers. Partners’ familiarity with forecasting methods, satisfaction
with their results, ease of use, and application of methods are worth further
clarification to extend the body of knowledge in the forecasting literature (Mentzer
and Kahn, 1995).

95
By relying on the views of 322 expert forecasters, Yokum and Armstrong (1995)
stressed that the timeline of estimating forecasts and cost savings over forecast
decisions are significant for companies. They suggested that multiple criteria for
choosing forecasting methods and determining forecasting performance (e.g.
interpretation, flexibility, ease of using available information and ease of method
use) be considered. None the less, the maintenance and development costs were
interestingly not drawn attention to in their results, and constituted the blind side of
their research. McCarthy et al. (2006) referred to a lack of training as a presumable
reason for the effectiveness of methods. This requires development cost and studies
in the FSC underlined the importance of maintenance and set up costs in terms of
retailers’ preference for forecasting methods (Ali et al., 2009). Forecasting method
choices do not only rely on the accuracy, partners’ corporate objectives may also
lead to taking additional parameters into account to be satisfied from forecasts. It is
therefore worthwhile to expand the criteria options in the forecasting literature in an
attempt to offer fresh and applicable implications for practice (McCarthy et al.,
2006; Mentzer and Kahn, 1995; Yokum and Armstrong, 1995).
2.6.3. Duration of forecasts
The studies by Mentzer and Kahn (1995) and McCarthy et al. (2006) referred to the
same list of forecasting methods, but the choice of companies differed by forecast
horizon. For short-term forecasts (less than 3 months), the study by Mentzer and
Kahn (1995), for instance, recommended the jury of executive opinion, as a
judgment-based forecasting methods, and simulation, life-cycle-analysis and expert
systems, as quantitative forecasting methods, to be employed in the forecasting
process. On the other hand, sales force composite as a judgment-based and moving
average with life-cycle-analysis became the preferable quantitative methods of
practitioners according to McCarthy et al. (2006). Even though similar preferences
were found by both studies for the mid-term (4 months to 2 years), they stressed
different forecasting methods for the long-term forecasts (more than 2 years). For
instance, customer expectations, by Mentzer and Kahn (1995), and sales force
composite, by McCarthy et al. (2006), emerged as considerably preferred judgment-
based forecasting methods in the long-term. However, McCarthy et al. (2006)
indicated straight-line-projection and box-Jenkins in response to the outcomes of

96
Mentzer and Kahn (1995) as neural network, box-Jenkins, decomposition and expert
systems as quantitative forecasting methods for long-term forecasts.
It is apparent that the limited sample size of these studies (e.g. the sample size of the
study by McCarthy et al. (2006): 86 and the sample size of the study by Mentzer and
Kahn (1995): 186) limit the reliability of these comparisons. The forecasting
literature offers forecast combinations in the case of confronting increased demand
variability in the long-term (Armstrong, 2001). Short-term forecasts allow efficient
purchasing and inventory management (Småros, 2002) whilst combinations bring
competitive advantage too (Aburto and Weber, 2007). Regarding this conundrum on
the duration of forecasts generated, it is promising to add further insights to the
horizon of forecasts. As forecast duration plays a substantial role in the forecasting
process (Zotteri and Kalchschmidt, 2007), partners’ overlapping preferences cause
contradiction with each other in CF (Småros, 2007; 2002).
Following this, estimating forecasts frequently has a vital impact on the accuracy
(Aviv, 2001), which is a prerequisite along with a large amount of data for effective
CF (Fliedner, 2006). To some extent, relevant surveys identified forecasting methods
for a wide range of horizons, less than 3 months for short-term and over 2 years for
long-term (McCarthy et al., 2006; Mentzer and Kahn, 1995). Fildes and Goodwin
(2007) stressed that forecasts are estimated on a monthly basis by 67.8 percent of
companies from various industries, including the food sector. Their findings are in
line with a study by Klassen and Fores (2001), who found that 38 percent of USA
and Canadian firms update forecasts every month and 24 percent update quarterly.
According to Fildes and Goodwin (2007), 21 percent update forecasts yearly while
only 7 percent update forecasts on a weekly basis. This limited evidence neither
takes in to account the forecasts of time-sensitive product-groups in the FSC nor
focuses on manufactures’ CF. This is why it is worth shedding light on the required
forecast horizon of perishable, seasonal, promotional and newly launched products in
the FSC (Småros, 2005).
From a different point of view, some studies have suggested the quantitative
forecasting methods of neural network for short-term and fuzzy logic for long-term

97
forecasts in the clothing industry (Thomassey, 2010). Whilst there is a paucity of
work identifying appropriate methods based on forecast horizons, a combinations of
methods is still questionable in connection with judgment-based forecasting methods
(Sanders and Manrodt, 2003; Armstrong, 2001). The forecasting literature needs
empirical studies that examine a broad range of forecasting methods and uncover
their impact on information sharing and collaborations (Zhao et al., 2002), as a
supplementary contribution to forecast accuracy (Goodwin, 2002).
2.6.4. Comparison of forecasting methods
Regarding the methods that were mostly compared in the literature, Ali et al. (2009)
compared the forecasting methods for promotional and short-life products. They
found that machine-learning-regression-tree outperformed the traditional methods of
exponential smoothing, regression analysis and the machine-learning-multiple-
support-vector-regression. However, the limitations of this method include
interpretation, high complexity and information preparation cost due to the large
amount of information (e.g. advertising and price changes), based on mean absolute
error. The suggestions of the authors were to adopt exponential smoothing in the
short-term without promotions, and to employ machine-learning-regression-tree
during promotions. This is because, the cost of maintenance and setup for these
forecasting methods as well as data preparation are extant concerns in the FSC.
When Ching-Chin et al. (2010) offered a new forecasting system for newly launched
tea, cosmetic and soft drink products, they found that exponential smoothing and
sales index was superior for seasonal tree groups of tea products, when limited
information was available. In addition, exponential smoothing and sales index were
better than moving average for short-life cosmetic products having unstable demand.
Exponential smoothing further outperformed moving average for soft drink products
based on mean absolute percentage error. However, the limitations of these
comparisons were their reliance on very little data and focus on sharp sales in a
highly competitive market. The limitations of this study by Ching-Chin et al. (2010)
were further to not consider judgment-based forecasting methods and product
characteristics such as colour, style or design. These limitations in the forecasting
98
literature await the attention of academics to estimate better forecasts for time-
sensitive and / or short-life product-groups in the FSC.
A study by Alon et al. (2001) compared artificial neural network with winters
exponential smoothing, box-Jenkins autoregressive-integrated-moving-average and
multivariate regression analysis in the USA retail sector. Their comparisons were
based on trend, seasonality and interaction of series. The findings of this study
confirmed the superior role of artificial neural network, regardless of variability and
forecast horizon. Winters exponential smoothing and box-Jenkins likewise worked
well, but only for the stable demand. Nevertheless, the limitations of artificial neural
network appeared to be the requirements for software, high expertise, much time and
the difficulty of interpretation. Alon et al. (2001) recommended a comparison of
these factors against the accuracy of forecasting methods, apart from comparing the
performance of artificial neural network, multivariate regression analysis and
traditional methods to extend the body of forecasting literature.
Interestingly, while Nikolopoulos et al. (2007) found the superior role of artificial
neural network compared to multivariate regression analysis, the argument was the
more acceptable role of multivariate regression analysis for adjustments as opposed
to the speed of artificial neural network and ease of application. The choice of
forecasting methods for the adjustment of forecasts seems to need further
clarification for the forecasting literature and practice. It is tolerably reasonable to
argue that making such comparisons generates more pragmatic contributions for
practitioners while particular product-groups are subject to their forecasting process.
To reduce inventory levels and to improve replenishments in the FSC, Aburto and
Weber (2007) addressed the combination of seasonal autoregressive-integrated-
moving-average and artificial neural network by using promotional observations. In
addition to the superior role of artificial neural network against autoregressive-
integrated-moving-average, their combinations quantified external influences (e.g.
special days, holidays, behaviour of customers) on the demand. Ease of
understanding, non-risk of over-fitting, gaining explicit knowledge for complicated
series emerged as the benefits of autoregressive-integrated moving average against

99
the shortcomings of artificial neural network, including risks of over-fitting and
training requirements. The implications of this study aided partners to have a
competitive advantage in the short-term. Despite this, the authors stressed the
necessity of comparing multivariate regression analysis with new forecasting
methods, such as support vector machines, in the FSC (Aburto and Weber, 2007).
2.6.5. Accuracy measurement techniques
The wide range of studies that compared diverse forecasting methods used different
techniques to measure their accuracy. In detail, some used mean absolute percentage
error (Trapero et al., 2012; Alon et al., 2001; Sanders and Ritzman, 1995), especially
for newly launched and short-life products (Ching-Chin et al., 2010), while others
referred to mean average error (Carbonneau et al., 2008) for promotions due to a
wide range of SKUs (Ali et al., 2009). However, some adopted mean squared error
(Nikolopoulos et al., 2007) while others used both mean absolute percentage error
and mean squared error (Chen and Boylan, 2008; Aburto and Weber, 2007).
Although relevant surveys stressed the dominance of mean absolute percentage error
with a usage of 52 percent (Mentzer and Kahn, 1995), the technique of percentage
error played a prominent role with the usage of 45 percent in relevant studies
(McCarthy et al., 2006). The superior role of mean absolute percentage error with
44.3 percent of usage was also confirmed by Fildes and Goodwin (2007).
The mean average error is largely used in industry with a usage of 35.6 percent as an
alternative to mean absolute percentage error (Fildes and Goodwin, 2007) while
some studies showed mean error as a popular technique (Klassen and Flores, 2001).
In addition to these techniques, there are alternative ways to measure accuracy for
intermittent demand as well (Syntetos and Boylan, 2005). In fact, forecast errors
occur when companies employ judgment-based forecasting methods and judgmental
adjustments (Sanders and Manrodt, 2003). These errors negatively influence
production capacity and scheduling, and the inventory levels of manufacturers.
Therefore, it is promising to enrich the forecasting literature through empirical
studies explaining how these techniques either individually or in combination
influence the accuracy and supply chain (Thomassey, 2010; Kerkkänen et al., 2009;
McCarthy et al., 2006).

100
2.6.6. Forecasting meetings
In CF, partners need to conduct regular forecasting meetings to compare their sales
forecasts, to uncover / solve disagreements and to generate final order forecasts for
associated product-groups (Siefert, 2003). These practices considerably facilitate the
replenishment operations of manufacturers (Ireland and Crum, 2005). Forecasting
meetings are an important phase for partners in CF, where “two or more individuals
initially each have their own individual forecast(s) (and justifications) in hand, and
the group’s task is to aggregate them in some way in order to achieve a group
forecast” (Kerr and Tindale, 2011, p. 16). Forecasting meetings can be managed by
either retailers or manufacturers, and the experience and capability of forecasters
along with having access to information over IT systems seem to be determinants for
the estimation of better forecasts in meetings (Siefert, 2003).
There are several factors directing the performance of forecasting meetings, such as
level of interaction, productive conflicts, structure of the meeting and number of
forecasters, and these factors second-hand imply the techniques that are used by
partners to meet (Kerr and Tindale, 2011; Graefe and Armstrong, 2011). Some
authors have argued that the techniques used for forecasting meetings are not very
important if forecasters have the same information (Sniezek, 1990). In forecasting
meetings, partners need to aggregate their forecasts in a timely manner, and to have a
consensus on a single forecast. This process becomes even more important when the
aim is to generate forecasts for time-sensitive product-groups, such as promotions
and newly launched products. Whilst partners’ overlapping views prevent them from
having a consensus on a single forecast in meetings (Småros, 2007; Fliedner, 2006;
2003), the literature offers a wide range of meeting techniques to be scrutinised in
clarifying their impact on the forecasts generated for a dynamic market, such as in
the FSC (Graefe and Armstrong, 2011; Lawrence et al., 2006).
Partners’ main intention in such meetings is to create a platform aggregating the
forecasts of related products at the correct level to be able to generate accurate order
forecasts in collaborations (Kerr and Tindale, 2011). When partners meet, they use
diverse information sources, which differ based on existing market dynamics, the
collaboration level and products (Ramanathan, 2013; Danese, 2007). Interpreting

101
complex and dispersed data and then merging them to make forecasts is rather
challenging work for forecasters. While this difficulty culminates with partners’
forecasting related disagreements that harm consensus forecasts, partners’ meetings
gain even more importance in CF (Småros, 2007). This is why it is rational to
examine various meeting techniques for managerial implications. The current
research is committed to elaborating these techniques in an attempt to close this
pragmatic gap for timely consensus forecasts in the FSC.
There are several techniques enabling forecasters to meet either face-to-face or via
multimedia to generate better forecasts in collaboration. Face-to-face-meeting is one
of the traditional ways of providing efficient interplay among forecasters and
merging the latest information into forecasts (Kerr and Tindale, 2011). However, it is
likely to cause bias in meetings due to its unstructured format. Therefore, forecasters
need to spend a great deal of time and effort (Graefe and Armstrong, 2011).
Although face-to-face-meeting is an expensive technique and is difficult to be
scheduled for regular and long-run meetings because of managerial issues, it
increases forecasters’ satisfaction level on consensus forecasts (Graefe and
Armstrong, 2011).
Nominal-Group is an alternative technique to face-to-face-meeting with its
structured format that was developed by Van de Ven and Delbecq (1974; 1971). In
the Nominal-Group, forecasters firstly estimate forecasts individually, and then
discussions are made to debate individual forecasts. The results of discussions lead
them to amend their forecasts. Afterwards, forecasters’ final forecasts are aggregated
to become the group’s final order forecast, which they need to have consensus on
(Graefe and Armstrong, 2011). Studies have found that Nominal-Group produces
more accurate forecasts than face-to-face-meeting alongside being more satisfactory
for forecasters, although it requires a great deal of time and effort like face-to-face-
meeting (Graefe and Armstrong, 2011; Van de Ven and Delbecq, 1974). It also
elucidates decisions owing to forecasters’ increased participation, even though they
cannot interact throughout individual and final forecast estimations (Graefe and
Armstrong, 2011).

102
On the other hand, Delphi-Technique is a survey approach in which a number of
rounds are conducted whilst forecasters share views on a unanimous and multimedia
level platform (Kerr and Tindale, 2011). This feature of Delphi-Technique
differentiates itself from the techniques of Nominal-Group and face-to-face-meeting.
However, its structure is similar to Nominal-Group because of documentary level
interactions (Graefe and Armstrong, 2011). A study by Rowe and Wright (2011)
informatively addressed the Delphi-Technique to clarify the ways and conditions of
applying it. Accordingly, forecasters’ trust in and commitment to each other,
experience and dominancy was appeared to be critical parameters in its efficiency.
According to the laboratory experiments by Graefe and Armostrong (2011), face-to-
face-meeting was superior to individual forecasts and staticised group, while
Nominal-Group was inferior to staticised group, which leads forecasters to estimate
consensus forecasts by taking the average of individual forecasts.
Notwithstanding the dominance of Delphi-Technique over staticised group
technique, forecasters’ interaction and experiences, forms of feedback and the
structure of process followed at meetings are rather influential matters in its
efficiency (Rowe and Wright, 1999). For instance, studies which addressed disperse
partners in the European agri-food sector have found how Delphi-Technique is an
effective initiative in terms of increasing participation and response rate while
forecasters’ motivation and small group size are important matters for less bias in
meetings (Frewer et al., 2011). Despite these necessities for Delphi-Technique, it
increases communication and constructive discussions in easing consensus between
partners (Graefe and Armstrong, 2011). Previously, Van de Ven and Delbecq (1974)
had already confirmed its effectiveness in judgmental adjustments compared to face-
to-face-meeting, with the amount of individual views and forecasters’ satisfaction
level from forecasts being major criteria for the effectiveness of Delphi-Technique in
their research.
When environmental uncertainties and casual costs are taken into account,
Prediction-Markets become a preferable approach for partners. This relies upon
various contract models such as “Winner-takes-all, Index and Spread” (Wolfers and
Zitzewitz, 2004, p. 3). The hallmark of Prediction-Markets allows partners to trade

103
over contracts. For instance, if one side believes that forecasts are less (more) than
expected, the other side is responsible for buying (selling) the products on-hand.
Virtually, such contracts make both sides more active in meetings, and enable
continuous information sharing due to price rolling in the uncertain market (Graefe
and Armstrong, 2011).
However, compared to face-to-face-meeting it does not allow efficient
communication (Kerr and Tindale, 2011), because contracts allow partners to make
changes to final forecasts without making reasonable clarifications with each other
(Graefe and Armstrong, 2011). Despite this, Wolfers and Zitzewitz (2004) supported
the claim that Prediction-Markets are capable of estimating accurate forecasts by
employing different types of information. Van Bruggen et al. (2010) likewise found
a supportive result, with Prediction-Market overtaking individual forecasts in the
heterogeneous market due to private information shared between partners.
Nevertheless, it is less favourable than face-to-face-meeting and Nominal-Group for
forecasters apart from its inferior role to face-to-face-meeting, according to Graefe
and Armstrong (2011), who employed the same information for different groups.
In summary, despite the limited contributions of the aforementioned experimental
studies, there is an important gap when it comes to collectively analysing partners’
forecasting meetings in CF (Önkal et al., 2012). In detail, less attention has been to
the comparative performance of meeting techniques, to the role hierarchy (Graefe
and Armstrong, 2011) and to the structure of meetings along with group size (Rowe
and Wright, 2011; 1999). These ambiguities become even more important when the
structure of markets is taken into account (Van Bruggen et al., 2010). This is why it
is necessary to clarify the interaction of information sharing and types of information
shared (Önkal et al., 2011; Van Bruggen et al., 2010) along with understanding how
information is utilised in meetings (Frewer et al., 2011).
Given the second objective of this research, which focuses on the forecasting process
of manufacturers both at the internal and external level, it seems promising to
scrutinise the role of these meeting techniques in the CF of manufacturers and to
offer new knowledge to the forecasting and SCM literature. This research also distils

104
the strengths and weaknesses of the aforementioned meeting techniques, as
presented in Table 2.7. This distillation has important implications for practitioners
in choosing the appropriate technique/s based on the existing market structure, level
of collaboration or product-groups that they forecast in meetings.

105
Table 2.7. Strengths and weaknesses of techniques used for forecasting meetings
Strengths Weaknesses Relevant references
Face-to-face
meeting
*Allowing efficient interaction between forecasters
*Enabling merger of latest information into forecasts
*Enhancing forecasters’ satisfaction from consensus
forecasts
*Having an unstructured format
*Increasing bias of forecasters because of its unstructured format
*Taking much time, effort and cost
*Preventing scheduling of long-term consistent meetings
Graefe and Armstrong
(2011); Kerr and Tindale
(2011)
Nominal-
Group
*Having a structured format
*Generating more accurate forecasts than face-to-face-
meeting
*Enhancing forecasters’ satisfaction from consensus
forecasts
*Providing further understanding of forecast decisions due
to increased participation of forecasters
*Taking much time, effort and cost, like face-to-face-meeting
*Not allowing forecasters to interact either at individual or at final
consensus forecast estimations, unlike face-to-face-meeting
*Generating less accurate forecasts than staticised group technique
in limited conditions
Graefe and Armstrong
(2011); Van de Ven and
Delbecq (1974; 1971)
Delphi-
Technique
*Having a survey based approach enabling unanimous
decisions over a multimedia level platform, unlike
Nominal-Group and face-to-face-meeting
*Allowing documentary level (structured) interaction, like
Nominal-Group
*Generating more accurate forecasts than face-to-face-
meeting, individual forecasts and staticised group technique
*Increasing response rate and communication
*Increasing interaction between forecasters
*Showing better performance for judgmental adjustments
compared to the face-to-face-meeting
*Requiring experience
*Necessitating trust and commitment between forecasters
*Escalating hierarchical problems between forecasters
*Being negatively affected by form of feedback given between
forecasters
*Entailing generation of a specific structure based on partners’
collaboration
*Requiring high level motivation for forecasters
*Causing bias in the case of having a large group size in meetings
Frewer et al. (2011);
Graefe and Armstrong
(2011); Rowe and
Wright (2011; 1999);
Van de Ven and Delbecq
(1974)
Prediction-
Markets
*Working effectively when the environment is uncertain
and causes excessive costs
*Allowing partners to trade over contracts
*Increasing the participation of forecasters
*Supporting continuous information exchange between
partners
*Allowing use of diverse information types, which supports
forecast accuracy
*Not allowing efficient communication between forecasters, unlike
face-to-face-meeting
*Allowing partners to make changes to forecasts without making
reasonable explanations due to types of contracts
*Not satisfying forecasters adequately, unlike face-to-face-meeting
and Nominal-Group
*Showing lower performance than face-to-face-meeting in case
of using same information
Kerr and Tindale (2011);
Van Bruggen et al.
(2010); Wolfers and
Zitzewitz (2004)
Source: Developed by the author

106
2.6.7. Role of forecasters
The forecasting process is a very challenging phase for forecasters in producing
timely and accurate forecasts, since managerial pressures, cultural impacts, limited
times and external factors have a big impact on their performance (Fildes et al.,
2009; Davis and Mentzer, 2007). Having a consensus on a single forecast is rather an
obstacle for CF due to partners’ different forecasting approaches with regard to
aggregation levels and forecasters’ diverse opinions, involving the adjustments of
statistical forecasts based on existing market conditions (Småros, 2007; Fliedner,
2006). Lack of reliable information, training and / or experience are also likely to
increase their bias and / or confidence, and therefore influence their decisions during
the adjustments of forecasts in meetings (Önkal et al., 2013; McCarthy Byrne et al.,
2011; Syntetos et al., 2009; Fildes et al., 2009). Following this, the forecasting
literature has stressed that generating accurate forecasts in meetings is largely
associated with forecasters’ relations and the structure of meetings (Sniezek, 1989),
with the accuracy level varying between the forecasts that are generated individually
and in meetings (Önkal et al., 2011).
It is clear that the forecasting meetings of partners become more productive when
they hosts multiple forecasters who share diverse opinions due to increased
motivation and reduced forecast errors (Van Swol, 2011; Kerr and Tindale, 2011).
Forecasters’ advice given to each other is an important contribution to incorporating
individually estimated forecasts (Lawrence et al., 2006) while their feedback
underpins both individually and jointly generated forecasts (Sanders, 1997). In
collaborations, partners’ cross-functional communication and forecasters’ ownership
seem to be more important than IT systems and information sharing processes in
terms of increasing forecasting performance (Davis and Mentzer, 2007). In essence,
all these discussions underpin the need to have diverse capabilities in CF for accurate
results (Aviv, 2001).
Past studies have underlined how forecasters’ motivation positively influences their
judgmental adjustments (Webby and O'Connor, 1996), and the study by Fildes et al.
(2009) confirmed this approach through the examination of adjustments and
forecasters’ bias. Småros (2007) observed how the lack of motivation in meetings

107
influenced the forecast accuracy of newly launched products in the FSC. Overall,
these outcomes strengthen the literature stressing the necessity for further
scrutinising the role of forecasters in meetings (Fliedner, 2006; 2003).
Some authors have discussed the role of organisations in forecasters’ motivation,
such as reward strategies, cross-functional cooperation and performance
measurement criteria (Davis and Mentzer, 2007). From a different point of view, the
impact of advice on forecasts is linked to the advisor (Lawrence et al., 2006) and the
information, which triggers the advisor to advise (Yaniv, 2004). Accepting advice
was found to be related to the level of confidence, trust and social interaction
between forecasters (Van Swol, 2011). Despite the existing findings, the interaction
of forecasters in meetings and their advice given to each other needs to be examined
further to formulate a more rigid approach in terms of generating accurate consensus
forecasts (Önkal et al., 2012; Fildes et al., 2009). Closing this gap in the literature
will, accordingly, guide managers in managing the freshness and quality of products
on the shelves of retailers due to timely consensus forecasts.
The literature involves different types of feedback (e.g. outcome, performance,
cognitive process, task properties), which are given based on objectives and play an
important role on the forecast accuracy (Lawrence et al., 2006; Goodwin and Fildes,
1999; Sanders, 1997). The effect of feedback on the accuracy relies on the level of
understanding, timing and presentation style (Lawrence et al., 2006). It was found
that forecasters’ satisfaction from the forecasting process is related to their training
and the feedback received while their seriousness of tackling problems depends upon
their training, feedback exchange and knowledge used for forecasts, and training
increases their motivation (McCarthy Byrne et al., 2011). However, forecasters’ bias
and having similar perspectives are considerable drawbacks for accurate forecasts in
meetings (Kerr and Tindale, 2011). Overall, to add further insight to these
arguments, it is essential to clarify the role of forecasters in terms of their motivation,
advice acceptance and feedback given to each other when they forecast products that
have volatile demand over intermittent data, such as during promotions (McCarthy
Byrne et al., 2011; Van Swol, 2011; Davis and Mentzer, 2007).

108
Due to the fact that the lack of trust and commitment between partners is an explicit
barrier to CF (Fliedner, 2006; Taylor and Fearne, 2006; Fliedner, 2003), there have
been calls for building trust and commitment for transparent and long-term
collaborations (Francis et al., 2008; Vlachos and Bourlakis, 2006; Mentzer et al.,
2000). Commitment shows the “desire to maintain valued relationships” (Moorman
et al., 1992, p. 316), while trust provides “willingness to rely on exchange partner in
whom one has confidence” (Moorman et al., 1993, p. 82). Given that different
dimensions of trust (e.g. affective trust and trust in competency) provide effective
information sharing and decision making in the supply chain (Ha et al., 2011), trust
is key for generating a consensus forecast in meetings (Chang et al., 2007).
Accepting advice is also connected with trust, which correlated with the expertise of
forecasters who advise (Van Swol, 2011; Mayer et al., 1995). It is therefore
worthwhile to clarify the role of trust and commitment between forecasters, whether
they are likely to increase motivation in forecasting meetings (Flynn et al., 2010;
Davis and Mentzer, 2007) and to underpin long-term collaborations between partners
(Vlachos and Bourlakis, 2006).
2.7. Information sharing
In collaborations, the role of information sharing was approached in several
industries from different perspectives such as the types of information shared, its
quality, IT systems and partners’ response rate (Du et al., 2009; Fliedner, 2006).
Relevant studies clearly concluded that effective information sharing increases
transparency, performance and profitability in supply chains (Zhou and Benton Jr,
2007; Taylor and Fearne, 2006).
In supply chains, partners conduct either centralised or decentralised information
sharing. In centralised information sharing, partners share demand information at
every level of the supply chain. This approach allows them to rapidly react to
demand changes (Sari, 2008) and to reduce bullwhip effects. Through decentralised
information sharing, due to limited data exchange, partners do not share demand
information and generate their own forecasts over the actual demand (Chen et al.,
2000). The difficulties that partners confront in the European grocery sector are in
terms of selecting relevant / correct information, designing their information systems

109
and controlling the quality of data. In response to these challenges, Zhou and Benton
Jr, (2007), for instance, offered three major principles: types of information shared,
its quality and the IT systems used for data exchange between partners. The authors
also argued that these elements are important to enhance transparency and response
rate in addition to reducing forecast errors in supply chains.
From a different viewpoint, Zhu et al. (2011) compared the circumstances of no
information sharing, bilateral information sharing and the usage of sole retailer
forecasting data to reveal the impact of these scenarios on profitability and accuracy
within a manufacturer-retailer relationship. With no information sharing, partners
generate forecasts separately without sharing any forecast information. During the
bilateral information sharing, they transfer forecast information reciprocally. In case
of only using the retailer’s forecast data, the manufacturer relies on the retailer
forecast to predict demand, and then decide wholesale prices for the retailer. The
results of this study found that while the manufacturer’s forecast has higher
variability than actual demand, the manufacturer has more profitability during
bilateral information sharing compared to no information sharing. On the other hand,
if the retailer’s forecast has higher variance than the actual demand variability, both
sides have higher profitability during bilateral information sharing compared to the
case of only using the retailer forecast.
Essentially, the results of Zhu et al. (2011) suggest the benefits of bilateral
information sharing to augment forecast accuracy and profitability, but their study
does not consider environmental influences, where promotions, advertisement
campaigns and unknown behaviour of consumers on the newly launched products
have a vital impact on the demand. In FSC, these external impacts raise demand
variability, which in turn necessitates close information sharing between partners
(Taylor and Fearne, 2006). There is a paucity of studies regarding the role of
information sharing (Fliedner, 2006) while promotions (Chen et al., 2000) and
uncertain market dynamics, providing recent information (Sanders and Manrodt,
2003), are considered in collaborations. Given the dynamic structure of the FSC,
which provides a wide range of information over recent changes in the market, it is a

110
promising platform to analyse information sharing practices of partners to close this
gap in the literature.
The structure of the information sharing process is another important matter, and
affects the way of sharing different types of information, with IT systems being the
key enabler to maintain the value of information shared in a timely manner (Zhou
and Benton Jr, 2007; Zotteri et al., 2005; Thonemann, 2002). Retailers’ effort is
likewise important in updating and sharing the information required for
manufacturers (Chen et al., 2000). The underlying reason is that while only retailers’
forecasts are considered, manufacturers encounter difficulties in generating timely
forecasts, and it is imperative to use additional information in response to demand
changes (Chang et al., 2007). This is why reinforcing bilateral information sharing
between partners provides transparent information exchange and increases the
response rate of manufacturers against instant demand changes. This approach
further increases visibility on future events and enhances the efficiency of production
planning for manufacturers (Danese and Kalchschmidt, 2011).
It is known that employing diverse information sources in heterogeneous markets,
involving a diverse product range and various customer expectations, enables
partners to generate better forecasts (Zotteri et al., 2005). An increased degree of
information exchange between partners necessitates high level supply chain practices
to use relevant information correctly. These practices include supply chain planning,
JIT production and effective delivery operations of manufacturers (Zhou and Benton
Jr, 2007). If partners have a willingness to share different types of information, they
are likely to be in a win-win situation during CF (Aviv, 2001). Regarding the
heterogeneous structure of FSC, in addition to the amount of information shared,
exchanging various sources is beneficial for collaborations (Van Swol, 2011; Zotteri
et al., 2005). The literature has approached the information context based on its
direction, whereby information flows from retailers to manufacturers or vice versa,
and it constitutes company related diverse information sources (Zhou and Benton Jr,
2007). Although manufacturers and their information sharing with retailers are the
main concern of this research, further understanding about retailer information is
essential for objective and sustainable contributions to the literature. This is why the

111
current research reviews the information sharing literature from both the
manufacturers’ and retailers’ point of view.
2.7.1. Manufacturer-retailer information
2.7.1.1.Retailer information
The number of products that partners merchandise is significant for their information
sharing process. According to Thonemann (2002), although sharing advance
information makes it possible to increase supply chain performance and product
availability, it conversely exposes manufacturers to confronting inventory level
variability. While multiple product-groups are concerned in collaborations, sharing
product-related particular information reduces demand variability and associated
costs. Observations in the European grocery sector uncovered the different
expectations of manufacturers and retailers with regard to information shared with
each other (Småros, 2007). The literature has also stressed the inconsistent
information sharing practices of partners due to lack of trust and commitment, which
in turn lower the quality of CF (Fliedner, 2006; 2003). It is clear that partners
confront difficulties in terms of maintaining a balance between reciprocal
satisfaction from information sharing and organisational objectives, and this restricts
them from exchanging a wide range of data with each other.
In FSC, manufacturers are more likely to lose retailer information due to poor
internal relations between related departments. Their long production plans gave rise
to lose the value of information in relevant case studies, in spite of retailers’ timely
sharing of POS data (Småros, 2007). Despite manufacturers’ poor internal
coordination, employing only retailer forecast information is not enough for better
forecasts. Case studies, which were dedicated to increasing forecast accuracy for
newly launched products, illustrated how partners’ intense relation during the
forecasting process is not generally viable. The suggestion was to give priority to
sharing various information sources in CF such as POS data and forecasts, which in
turn enables manufacturers to have access to accurate and timely information from
retailers (Småros, 2003). It is clear that manufacturers estimate better forecasts when
information sharing is bilateral (Zhu et al., 2011). To put it differently, although
retailers can generate better forecasts due to their closeness to customers (Sari, 2008;

112
Aviv, 2001), manufacturers’ forecasts are, in the same manner, beneficial for reliable
forecasts. Hence, these forecasts should be shared to strengthen the retailers’
forecasts. However, manufacturers’ forecast quality relies largely on the retailers’
sources, which imposes on them a responsibility to sharing further data with
manufacturers apart from forecasts (Lee et al., 2000). Correspondingly, these
arguments point to the necessity of mutual understanding and data exchange to cope
with volatile demand for time-sensitive products in the FSC.
Sharing organisational information, such as price changes, assortments and
promotional plans, leads partners to employ more rewarding CF with regard to
inventory and forecasting performance (Taylor, 2006). Sharing promotional plans
with manufacturers likewise helps them to provide short shelf life foods in a fresh
manner (Du et al., 2009), which is an important matter to satisfy retailers in CF due
to their short replenishment requests from manufacturers (Småros, 2007). Obtaining
these sources allows manufacturers to show further effort and spend more time in
improving the accuracy rather than seeking correct information (Småros, 2002; Aviv,
2002). For instance, Småros (2003) exemplified how manufacturers spent less time
on the forecasting process and generated more accurate forecasts when a European
based retailer shared assortment changes, promotions, price changes and updated
POS data in collaboration. Moreover, Småros (2003) stressed that sharing the
aforesaid information sources leads partners to collaborate on planning rather than
forecasts, which enhances visibility in supply chains and improves the ability to
respond to demand changes.
A case study by Ramanathan (2013) examined two manufacturers’ information
requests from their buyers, and uncovered how the types of products influence
manufacturers’ information request from retailers. For instance, while sales and
discount related data did not become the interest of a manufacturer, these sources
became the main demand of another manufacturer, which was working on the
forecasts of short shelf life textile products. Following this, promotional sources and
competitors’ information appeared to be other important sources that were requested
by manufacturers in the case of Ramanathan (2013). In essence, these cases that

113
considered a limited number of companies are in line with the forecasting literature
(Fildes et al., 2009; Syntetos et al., 2009).
While these cases highlighted the importance of information types that change based
on product characteristics, the forecasting literature stressed how contextual data
increased forecast accuracy through judgmental adjustments where particular
information was used for promotions (Fildes et al., 2009; Syntetos et al., 2009;
Sanders and Ritzman, 1995; Sanders and Manrodt, 1994). Nonetheless, the literature
needs more empirical work to generalise the role of information types, when
manufacturers and retailers collaboratively forecast different types of product-groups
(Ramanathan, 2013). Such research in the heterogeneous FSC, which hosts time-
sensitive seasonal, perishable and / or promotional products, is more likely to
enlighten practitioners (Danese, 2007). In this regard, it is important to recall the
final research question of the current research, which interrogates manufacturers’
information sharing for better forecasts of these time-sensitive and / or short-life
products, in response to this gap in the information sharing literature.
Retailers’ shelf information is an important source for product quality and
availability. There is strong evidence in the UK FSC, which shows retailers’
technological shortcomings that prevent timely tracking shelf information. This is
also an obstacle to preserving product quality and availability (Taylor and Fearne,
2006). Recording retailer sources by updating them systematically and then sharing
with manufacturers on time is vital for optimal forecasts alongside effective
inventory, delivery and production operations (Taylor, 2006). Disseminating
customer-related information within the supply chain helps partners to cope with
demand variability as well (Sari, 2008).
In a volatile market, historical and the latest information are furthermore requisite,
with historical information referring to retailers’ long-term and product-related old
information and the latest information involving recent activities, such as
environmental events, competitor-related information and rumour (Sanders and
Manrodt, 2003). In spite of the fact that the source of recent information is important
from the point of view of reliability (Flynn et al., 2010; Sanders and Manrodt,

114
2003), the uncertain market provides such information at an unexpected time, which
implies recent demand changes. These sources are unable to be used in statistical
forecasts due to limited time, and need to be merged with forecasts afterwards. The
importance of such sources was also revealed in the textile and packaging industries
(Ramanathan, 2013). In addition, if newly launched and / or seasonal products are
subject to the forecasting process, the antecedent sales of pertinent products or
substitutions are valuable cues for forecasters (Sanders and Ritzman, 2004; Småros,
2003).
In general, willingness and the understanding of retailers with regard to exact
information required for manufacturers is an important matter for satisfying
information sharing between partners (Aviv, 2002). Given this posture of retailers in
CF and the closeness to customers making it possible to have a wide range of
information (Sari, 2008), initiating information sharing from retailers makes
collaborations more beneficial in managing purchasing, production, inventory and
replenishment operations (Fang and Meng, 2010; Fliedner, 2006). Partners’
behaviour of sharing these information sources and recent environmental factors are
rather important factors in collaborations (Flynn et al., 2010; Sanders and Manrodt,
2003). There are still questions awaiting answers from academics to comprehend the
role of diverse information sources in the accuracy, forecasting process and methods
used by partners (Fildes et al., 2009; Sanders and Manrodt, 2003). From a different
viewpoint, forecasters are further curious in terms of which information is most
critical, which will guide them in making correct decisions for forecasts while the
environment that provides additional data should be considered through these
analyses (Van Swol, 2011; Sanders and Manrodt, 2003).
2.7.1.2.Manufacturer information
Larsen et al. (2003) theoretically presented the different information sharing
practices of partners based on their level of integration in CPFR. For instance, it was
stressed that exchanging sales orders and inventory levels of products seems
adequate for partners, which implement basic CPFR practices. The case studies by
Danese (2007; 2006) then illustrated the different level of information sharing based
on the level of CPFR implementation.

115
In detail, some partners exchanged limited data without synchronising their business
plan at the basic level CPFR while others jointly made decisions over sales and order
forecasts at the limited and full level of CPFR. The full CPFR distinguishes itself
from the basic and limited CPFR practice by conjoining partners’ business and
forecast plans, where this synchronisation is to a certain extent at the limited level
CPFR. To get benefit from full CPFR, conducting extensive information sharing
based on market characteristics and products involved are essential (Danese, 2007).
Despite the level of collaboration, sharing information rests upon partners’
willingness, which seems one of the significant barriers to CF (ECR Europe, 2001)
and necessitates mutual trust (Danese, 2006), which is another concern of this
research.
Regarding the implementation of developing (or limited) or advanced (or full) CPFR
process, manufacturers should share their production and capacity plans with
retailers apart from sharing product-related information, such as inventory data and
the lead-times of newly launched products. These sources are important to enrich
retailers’ forecasts when they share promotional plans, inventory level and POS data
with manufacturers (Larsen et al., 2003). The underlying reason is that partners
focus largely on integrating their supply chains during developing CPFR due to the
limited number of SKUs involved. Partners in advanced CPFR integrate both
internally and externally to get full benefit from collaborations, and they apply
advanced IT systems as well (e.g. Enterprise Resource Planning (ERP) and
production planning) (ECR Europe, 2001).
Studies support the idea that sharing procurement related information helps retailers
to maintain the freshness of short shelf life foods (Du et al., 2009). Production
planning and delivery related information likewise eases product tracking in supply
chains and reduces forecast errors (Zhou and Benton Jr, 2007). Sharing these sources
and inventory related data with retailers brings about manufacturers’ effective
internal-external integration when they follow a single business plan (ECR Europe,
2001). While manufactures’ forecasts rely largely on their production, it is important
to share production related data and sales forecasts with retailers, because such data
enable retailers to clearly understand for what purpose forecasts are used by

116
manufacturers (Zotteri and Kalchschmidt, 2007). In addition to these information
sources, ECR Europe (2001) classified the types of information, which should be
shared within the company and between partners based on the three different CPFR
practices, as shown in Table 2.8.
Table 2.8. Requirements for manufacturers and retailers for CPFR implementation
CPFR models
Basic Developing Advanced
Partners’ willingness to
collaborate No Yes Yes
Partners’ departments involved in collaboration
Sales / purchasing
Company
Trading
Partner Company
Trading
Partner
Yes Yes No Yes Yes
Logistics Yes No No Yes Yes
Marketing Yes Yes No Yes Yes
Production Yes
No
(Not for
retailers)
No
Yes
(Not for
retailers)
Yes
Demand / materials
planning Yes Yes Yes Yes Yes
Scope of collaboration
Promotion planning Yes Yes Yes
Sales forecast One of the
two One of the two
Yes
Order forecast Yes
Replenishment Optional Optional Yes
Manufacturers’ information exchange with retailers
Inventory Optional No / Distribution centre
level
Distribution centre / POS
level
Shipments to distribution
centre Yes Yes Yes
Shipments from
distribution centre to
store
Optional Yes Yes
Sales at distribution
centre level Optional Optional Yes
POS data Optional No Yes
Retailers’ information exchange with manufacturers
Inventory Optional No/Distribution centre
level
Distribution centre / POS
level
Shipments to distribution
centre - Yes Yes
Shipments from
distribution centre to
store
Yes Yes Yes
Sales at distribution
centre level Yes Optional Yes
POS data Optional No Yes
Source: ECR Europe (2001, p. 54)
117
In FSC, sustaining visibility on demand and securing product availability at stores
are vital entailments (Bourlakis and Weightman, 2004). Ahumada and Villalobos
(2009) pointed out the negative impact of unclear production, delivery and marketing
information on the shelf life of perishable and seasonal products because of
manufacturers’ lack of production and distribution plans. Products that have a short
shelf life, such as vegetables and fruits, are likely to decompose during production
and / or delivery. These deteriorated products not only reduce the retailers’
satisfaction in terms of providing good quality products on the shelves, but also
reduce manufacturers’ profit. Given the major expectations of retailers (e.g. short
lead-times, availability of high quality and fresh products and low inventory levels)
(Småros, 2007), satisfying retailers in collaborations and increasing profitability
reside in manufacturers’ capability of effectively scheduling production and timely
delivering products to either stores or the distribution centres of retailers (Chen et al.,
2009).
This is why sharing production scheduling and stock levels of related products with
retailers eases partners’ agreement on collaborative planning, prevents excessive
stocks and reduces associated transportation and inventory costs (Arshinder et al.,
2008; Chen and Paulraj, 2004; Karoway, 1997). Further, this information exchange
helps manufacturers to clearly understand and meet short-term demand, which will
accordingly lead them to reduce their surplus capacity (Fliedner, 2006). Observations
in Europe have already clarified the negative impact of long production plans while
partners’ collaboration hinged on newly launched products (Småros, 2007). Hence,
further research is essential to elucidate the ways of using correct information
(Ahumada and Villalobos, 2009) as well as the role of manufacturers during
information sharing with retailers (Småros, 2007).
Such an investigation in the FSC becomes even more important when manufacturers
have difficulty of responding to instant demand changes. Manufacturers are likely to
have long lead-times with regard to production and / or the purchasing of raw
materials, with these delays accordingly dissatisfying retailers in collaboration
(Kaipia, 2008). As a remedy, relevant case studies that considered agricultural
products in the FSC modified the CPFR framework with collaborative transportation
118
management to provide more effective delivery practices. It has been found that
sharing delivery information and transportation schedules are very beneficial in
CPFR. This is because, such an information exchange enables companies to reduce
their inventory level and improve delivery practices (Du et al., 2009).
When Zhou and Benton Jr, (2007) empirically examined manufacturers’ information
sharing and supply chain practices in North America, they raised the importance of
various information sources that underpin collaborations. These sources consist of
production capacity, orders, delivery schedule, the lead-time of relative products and
recent changes in delivery. In essence, these diverse studies offer a wide range of
information to be shared based on either product characteristics, level of
collaboration or market structure. When time-sensitive products (e.g. milk, eggs and
meat) are taken into account, their quality and freshness are likely to deteriorate due
to any recent changes, such as long deliveries and bad weather conditions. In these
situations, the importance of recent information that represents the latest changes
becomes even more important for accurate CF. In practice, when Wal-Mart and
Warner-Lambert, for instance, implemented their pilot CPFR, they exchanged
weather related data and similar supportive recent information with each other,
which brought about their consensus on a single but reliable forecast (Danese, 2007).
Through reviewing the literature, Arshinder et al. (2008) stressed that partners can
easily coordinate their supply chain by sharing different types of information, such
as demand, inventory, lead-time, production scheduling, capacity and cost related
data. From a different standpoint, it has been argued that although partners are in an
agreement about sharing diverse information, regular information exchange may not
add extra value to their information sharing. Such a data exchange only leads to
check forecast errors, while logistic operations and IT systems are vital for satisfying
information sharing (Kerr and Tindale, 2011). For integration, technological
investments and managerial agreements are requisite, whilst a lack of IT systems
limits the application of CF for a wide range of products (Aryee et al., 2008; Sari,
2008; Fliedner, 2006). It is likewise clear that generating accurate forecasts for
different products hinges on different information types that represent product
characteristics and / or markets (Ramanathan, 2013). In response to these conflicting

119
and limited analyses, it is crucial to analyse diverse information types, and to clarify
in what way related information should be shared (Danese, 2007; Zhou and Benton
Jr, 2007; Taylor and Fearne, 2006). This substantial gap gives more value to the final
objective of current research due to its interest in different information types and the
way of sharing such sources for reliable forecasts in the FSC.
2.7.2. Quality level of information
According to the literature, the quality level of information gauges the extent to
which partners are satisfied with each other when they exchange different types of
information (Petersen, 1999). Related studies have ascribed the quality level of
information to several parameters, such as availability, accuracy, timeliness,
external-internal connectivity, completeness, relevance, accessibility and frequency
(Zhou and Benton Jr, 2007; Vijayasarathy and Robey, 1997; Neumann and Segev,
1979). It is also known that such parameters determine partners’ gratification as to
whether data are exchanged at the expected time and in a requested form in
collaborations (Zhou and Benton Jr, 2007).
In FSC, partners’ disagreements through information sharing were attributed to
inaccurate data, timeliness, inconsistency, technology related obstacles and lack of
information, which obstruct managing demand, production and shelf availability
(Taylor and Fearne, 2006; Taylor, 2006). In response to this, studies have revealed
that making information available and sharing relevant information not only provides
reliable information, but also increases forecast accuracy and delivery performance.
Moreover, partners can be satisfied from information sharing, while cross-functional
communication improves in their departments, and they reciprocally share updated
information frequently (Zhou and Benton Jr, 2007). Interestingly, a recent study by
Zhou et al. (2014) has added a valuable dimension to the quality of information by
offering practitioners to align their level of practices in supply chains based on the
level of data quality for better business performance (e.g. companies’ revenue and
profitability). In CF, sharing different information types frequently not only
underpins partners’ forecasts, but also improves inventory management for related
products (Aviv, 2007; 2002; 2001).

120
Following this, while partners bilaterally share adequate information in an accurate
form, it improves their motivation to generate reliable forecasts in addition to their
desire to sustain regular information sharing with each other (Du et al., 2012; Webby
and O'Connor, 1996). Therefore, it can be asserted that conducting high quality
information sharing relies upon the type and / or amount of information shared.
Besides that it is connected with the extent to which partners follow the same vision
as well as show trust and interdependence with each other. This approach puts
emphasis on partners’ willingness to invest in IT systems for a satisfactory
information sharing in collaborations (Zacharia et al., 2011; Li and Lin, 2006;
Simatupang and Sridharan, 2002).
Furthermore, benefiting from information sharing relies largely upon partners’
assimilation of received information, so it is vital to share relevant information on
time to respond to demand changes and to manage related supply chain operations
effectively (Hartono et al., 2010). For instance, Wal-Mart and suppliers exchanged
the stock levels of related products that they collaborated on. Despite unexpected
changes in demand, this helped Wal-Mart to give timely orders to suppliers. The
retailer secured its competitive position in the market and reduced stock related costs
while suppliers underpinned the loyalty of the retailer to brands in addition to
reduced stock levels (Simatupang and Sridharan, 2002).
Forslund and Jonsson (2007) demonstrated that manufacturers who did not have
access to retailers’ forecast information resorted to safety stock for end products to
meet demand. On the other side, manufacturers that had access to retailers’
information effectively met the demand of retailers. Case studies in the FSC revealed
that manufacturers’ access to POS data led them to rapidly react against stock-out
and to increase forecast accuracy (Småros, 2007). However, only having access to
retailers’ information is not sufficient for manufacturers due to the importance of
information quality for time-sensitive products. The reason behind this aspect is that
manufacturers’ interpretation and usage of relevant information rely largely on its
quality (Forslund and Jonsson, 2007). Maintaining information quality then hinges
on partners’ top management investing in IT systems and creating a platform for

121
long-term forecast collaborations (Hartono et al., 2010). Thereby, the value of
information is sustained for accurate forecasts (Moon et al., 2003).
Effective inventory management for promotional products primarily depends upon
the product-related data that need to be shared frequently between partners (Aviv,
2002), as such frequent information sharing allows manufacturers to timely replenish
products for retailers, and to be more responsive against unexpected changes in
demand (Aviv, 2001). Expeditious information sharing is more rewarding for
accuracy compared to partners’ active supply chain practices (Aviv, 2007).
Information that is updated according to early sales figures in specific periods, such
as weekly, has a noteworthy role in improving forecast accuracy (Småros, 2002). For
instance, Fisher (2000) recorded increased forecast accuracy, from 45 percent to 92
percent, in the clothing industry, while partners updated initial forecasts on a weekly
basis. Relying on the short shelf life and newly launched products (Ahumada and
Villalobos, 2009; Småros, 2007), partners need to use related and reliable
information to produce accurate forecasts. This action underpins their responsiveness
to instant demand changes (Danese, 2007; Taylor and Fearne, 2006; Taylor, 2006).
Overall, it is worth summarising that recording information regularly and sharing it
with partners in an adequate form as well as in a timely manner improves forecast
accuracy. In FSC, manufacturers and retailers, however, do not have these treatments
(Taylor and Fearne, 2006). Despite the fact that retailers’ instant price changes are
influential in forecasts (Taylor, 2006), manufacturers’ information is valuable too,
enabling retailers to have a clear understanding about the purpose of manufacturers’
forecasts (Zotteri and Kalchschmidt, 2007). In this respect, the body of the
information sharing literature should be extended further to offer rigorous
benchmarks over the information quality, which will, in turn, enhance forecast
accuracy as well as partners’ satisfaction from information sharing (Zhou et al.,
2014; Zhou and Benton Jr, 2007; Li and Lin, 2006).

122
2.7.3. Role of Information Technology (IT) systems in CF
Studies in the FSC have emphasised the role of IT systems, as technology evolves
each passing day and diverse IT systems are offered for partners for either internal or
external information sharing (Taylor, 2006). In practice, this technological
transformation and partners’ diverse preferences decelerate information exchange,
increase associated costs and pose risks of having forecast errors (Taylor and Fearne,
2006). Given the size of partners, IT systems become one of the poor cycles of
collaborations due to investment costs and related risks (Sari, 2008; Mentzer et al.,
2000). In fact, when environmental uncertainties and demand variability are
considered, these systems further strengthen communication and interaction between
departments alongside the effective information sharing of partners. For instance, the
study by Aryee et al. (2008) demonstrated that IT systems (e.g. EDI and web-based
interchange) significantly increase the organisational and financial performance of
companies. The criteria of the study by Aryee et al. (2008) for organisational
performance involved production life cycle, new product time to market and
percentage of obtaining forecast / demand data, while financial performance was
based on return on investment, sales growth and market share. In other words, the
benefits of investing in IT systems are not limited to data exchange and integration,
it also raises companies’ profitability.
Even though some views do not advocate the necessity of IT systems for long-term
collaborations between partners (Småros, 2007), these systems underpin partners’
interdepartmental relation in collaborations (Sanders, 2008). In manufacturers, IT
systems not only connect production, logistics, and purchasing, but also increase
transparency and enable them to measure lead-times based on real-time information
(Arshinder et al., 2008). For instance, case studies in the textile and packaging
industry observed that making investment in IT systems enhances forecast accuracy
due to increased transparency during information transfer between partners. It should
not be overlooked that manufacturers’ ability to use the required information is an
important matter. Otherwise, it is likely to make information sharing more
complicated, requiring further investment in IT (Ramanathan, 2013). In essence,
whilst this outcome is contrary to the case of Småros (2007), it is in line with the
case study by Danese (2006). By relying on multiple case studies, Danese (2006)

123
proposed the necessity of sophisticated IT systems when partners proceed from basic
to advanced (or full) CPFR owing to the obligation of collaborating on a single plan
and consensus forecasts. These contradictory and limited case studies further raise
question marks on the IT systems not only about effectively integrating partners’
supply chain, but also about utilising different information types in a timely manner
for accurate forecasts.
Previously, it was stressed that IT systems in CF enable agile information transfer,
and improve flexibility in the supply chain (Fliedner, 2006). Relevant evidence
further showed how partners could utilise these systems in joint forecasts to
synchronise their decisions and to generate better forecasts, where partners
exchanged demand, production, purchasing and inventory related information with
each other (Kerr and Tindale, 2011). Some case studies noted that even though IT
systems are not a key barrier for successful collaborations, its investment with the
skills of manufacturers, including responsiveness and flexibility, provides a
sustainable advantage for communication (Ramanathan et al., 2011). Such an
investment substantially improves partners’ satisfaction as well, owing to having a
responsive supply chain against instant demand changes (Ireland and Crum, 2005)
and sustaining information quality (Ramanathan et al., 2011). These improvements,
in turn, improve the accuracy of forecasts too (Forslund and Jonsson, 2007). In
essence, there are several technological applications used by practitioners in the food
industry, some of which are EDI, ERP and Statistical-Control-Cards. So, it is
worthwhile to review these applications concisely to refresh existing knowledge on
the IT systems.
In FSC, EDI helps partners to facilitate their integration throughout collaborations.
For instance, a study by Hill and Scudder (2002) demonstrated that firm size, sales
volume and number of employees play a key role in the usage of EDI in response to
the ineffectual role of organisational characteristics, product range and
competitiveness. These results, per se, hint that there is no limitation for partners in
using EDI when they collaborate over various product-groups. According to Hill and
Scudder (2002), partners’ size is an important factor in using EDI, with this outcome
underpinning some views that stressed the limited application of CF for a broad

124
range of product-groups due to the necessity of costly IT investments (Sari, 2008;
Fliedner, 2003; McCarthy and Golicic, 2002). In this respect, it seems reasonable to
claim that small size manufacturers can still conduct basic collaborations with
limited information sharing. When they intend to expand the implementation of CF
to time-sensitive product-groups, there will then be a requirement for them to make
investments in IT systems as was illustrated by several case studies (Ramanathan et
al., 2011; Danese, 2007; 2006).
Although EDI enhances partners’ efficiency in the supply chain, it further improves
manufacturers’ coordination with suppliers compared with retailers. The reason here
is that EDI is primarily used by manufacturers in an attempt to share warehouse and
purchasing orders with suppliers rather than sharing promotions, delivery
information and / or production plans with retailers (Hill and Scudder, 2002). EDI
leads partners to reduce expensive paperwork and human errors during information
sharing, according to Hill and Scudder (2002). Additionally, it reduces lead-times,
increases transparency, and provides better order tracking performance in
collaborations (Aviv, 2002). Past literature has documented how EDI is an effective
tool for strategic collaborations due to its benefit of enabling partners to quickly
respond to instant demand changes. Following this, EDI enables partners to
accelerate information sharing and to reduce costs in terms of operations and
inventory management (Bamfield, 1994). In other words, even though EDI was
found to be more supplier oriented IT system in few studies, it also underpins
manufacturers’ collaboration with retailers due to reduced lead-times, which is one
of the most significant challenges of CF practice (Småros, 2007). Because retailers’
satisfaction rests upon short replenishment and delivery practices (Kaipia, 2008),
reducing lead-times with EDI is an important contribution to the CF practices of
partners in the FSC.
From a different viewpoint, empirical studies in the IT industry have explored how
EDI has had more attention from USA companies compared to European companies
(Mendelson and Pillai, 1998). Past studies that considered the UK grocery and
fashion industry documented how retailers increase their profit with EDI due to close
partnerships while manufacturers on the other hand claim that they cannot gain

125
satisfactory benefits from EDI due to retailers’ different IT systems and insistence on
pursuing short lead-times (Bamfield, 1994). In essence, these outcomes are in line
with the observations of Taylor and Fearne (2006), who stressed the overlapping IT
preferences of partners in the UK FSC, which reduced the speed of information
exchange in addition to higher administration costs. In this respect, although the
literature has highlighted the benefits of IT systems in supply chains, it is promising
not only to clarify their role and performance in the FSC, but also to add insight into
partners’ organisational characteristics and preferences about IT systems (e.g. EDI)
(Hill and Scudder, 2002).
On the other hand, ERP technologies are the “packaged software systems using
database technology and a single interface to control all the information related to a
company’s business-including customer, product, employee, and financial data”
(ECR Europe, 2001, p. 104). ERP systems are one of the main IT systems that are
used to increase integration between departments in terms of partners’ internal
processes. They further assist companies to share demand forecasts, and to optimise
different departments’ cross-functional planning activities (Fliedner, 2006). For
instance, ERP in CF enables manufacturers to manage their production and delivery
practices effectively based on retailers’ demand (Paula et al., 2003). According to
VICS (2002), ERP is one of the indispensable systems that one of the partners has to
have, if they want to gain benefits from CPFR.
Contrary to this view, studies in the European grocery sector illustrated how
manufacturers’ ERP systems are likely to prevent quantifying forecast accuracy
throughout CF when the production cycle is longer than the expected time for newly
launched products (Småros, 2007). In a similar vein, unsuccessful ERP applications
appeared to be in the pharmaceutical industry (Motwani et al., 2002). In essence, this
is an opportunity for academics to pay further attention to these unsuccessful IT
applications. Analysing the role of diverse IT systems for manufacturers seems a
promising response to the aforementioned contradictory views, and to shed further
lights on the application of these systems in collaborations (Chang et al., 2007).

126
Finally, CPFR related studies have emphasised the existing labour-intensive
operations and poor forecasting processes of retailers in collaborations. To resolve
such challenges, Statistical-Control-Cards have become an alternative solution for
practitioners. The underlying reason is that Statistical-Control-Cards have a good
capability of showing actual and forecast sales to partners simultaneously, which is
important when POS data and / or sales information is exchanged between partners.
In addition, case studies in the FSC illustrated how Statistical-Control-Cards enabled
manufacturers to monitor mature products’ demand, which, in turn, eased
information sharing between partners by reducing retailers’ responsibility for sharing
related information in CF (Småros, 2002). When the short shelf life of products is
considered in CF, partners then need more rigorous applications that will lead them
to not only provide transparent information sharing but also rapidly react to demand
changes. Therefore, the aforementioned arguments show the need for future research
on the IT systems of manufacturers in the FSC.
2.8. Summary
This chapter has comprehensively reviewed the literature on CPFR and the related
research themes of supply chain integration, the forecasting process and information
sharing. The findings, limitations and future research suggestions of related studies
were emphasised to be able to identify new research areas for the CF practices of
manufacturers in the FSC. In this respect, this research made it possible to identify
gaps between theory and practice about manufacturers’ practises that require further
research for achieving long-term and accurate CF. The key areas that require future
research are summarised below.
Regarding the CPFR practice, the literature is rich in successful CF practices of
manufacturers and retailers in several industries, mostly in North America.
Nonetheless, European based practitioners could not obtain sustainable benefits from
CF in the FSC due to their overlapping expectations, which mostly appear during
their supply chain integration and the processes of forecasting as well as information
sharing. Conducting accurate and long-term CF becomes even more challenging
when collaboration is built upon perishable, seasonal, promotional and newly
launched products. Whilst existing knowledge in the literature is scant in relation to

127
CF, it is promising to examine partners’ CF in Europe and North America to create a
pragmatic roadmap, guiding them in conducting long-term and accurate CF for
associated product-groups in the FSC.
When it comes to integrating partners’ supply chain in the FSC, partners’
interdepartmental integration needs to be very efficient to convey this integration at
an external level. Although manufacturers’ poor internal integration gives rise to
conflicts in CF, there are not adequate empirical studies addressing both internal and
external integration from the manufacturers’ point of view. Such empirical work
would be of great value in the literature and for practice. In detail, manufacturers’
supply chain integration has mysteries with regard to their departmental
communication, internal forecasting process and related infrastructure along with IT
investments to collaborate with retailers. The research theme of supply chain
integration requires further investigation to clarify what the key facets of integration
practices are that manufacturers should adopt in the competitive food industry.
Adding further understanding to partners’ level of integration with each other will be
another intriguing contribution to extend the body of knowledge in the SCM
literature. The reason behind this is that the role of organisational characteristics,
objectives and top management vision are still important areas of interest when
partners tend to integrate externally. These factors are likely to influence partners’
CF, requiring further empirical analysis over these parameters. The level of
commitment, trust and loyalty between partners and their flexibility in the volatile
FSC are rather important elements that should be examined, while few studies
considered their impact on the long-term collaborations.
On the other hand, partners’ forecasting process is very important for CF. It is
worthwhile to put further emphasis on their forecasting strategies. Particularly,
examining the role of judgmental adjustments and forecast combinations in
collaborations seems an interesting opportunity due to their pragmatic approach and
ambiguous impact on the CF. Whilst time-sensitive product-groups are in the focus
of forecasts, getting benefit from these strategies becomes an important remedy for
volatile demand. In addition, few case studies explored partners’ different

128
approaches in terms of the horizon and frequency of forecasts. Despite the fact that
there are conflicting views that presumed partners’ agreement on these forecasting
practices, partners’ different preference on the forecast horizon and frequency
arguably reduces forecast accuracy and prevents long-term CF. This ambiguity and
the limited evidence call for urgent research to shed light on the forecasting
literature. The literature also includes a wide range of studies addressing several
forecasting methods and their selection procedures. When time-sensitive and / or
short-life products are subject to forecasts, it appears that there is not a strong
guideline for forecasters to choose appropriate methods. Comparing different
forecasting methods based on product characteristics will provide attractive
contributions for practitioners. Such research can also be extended by clarifying the
impact of accuracy measurement techniques in CF, when specific forecasting
methods are used for forecasts.
When partners meet to aggregate their forecasts in meetings, they confront several
difficulties due to their disagreements on varying factors. The forecasting literature
has identified several reasons and group forecasting techniques that are likely to
influence partners’ meetings and the attitude of having a consensus on a single
forecast. Given the lack of empirical evidence on this topic, further research is
needed to add more understanding on partners’ meetings for consensus forecasts in
CF. The role of forecasters and their behaviours are another enigma for CF. Several
studies previously confirmed their impact on the forecast accuracy, collaborations
and group meetings. When the dynamic structure of FSC is of concern, forecasters
need more understanding about major attitudes and / or skills that influence the
forecasts of time-sensitive and / or short-life products. Questioning the role of
forecasters in CF will bring a new dimension to collaboration practices by conveying
integration from the organisational-level to the personal-level.
Finally, it is clear that partners’ limited information sharing is one of the significant
barriers to their CF. Specifically, exploring correct / relevant information that should
be shared between partners is rewarding when partners collaborate over particular
product-groups. The reason behind this is that information that is exchanged between
partners significantly influences their satisfaction and forecast accuracy. It is

129
apparent that partners in the FSC still have disagreements in terms of transferring
information in a timely manner and in an adequate form. Examining diverse
information types based on product characteristics will be an important contribution
to the information sharing literature.
Another paradox is the necessity of investments to create a sustainable platform for
information sharing within and between partners. While some case studies have
argued that IT systems are not essential for long-term CF, others illustrated its
importance for the forecast accuracy and the application of CF for a wide range of
product-groups. In reply to these limited studies and overlapping views, it is
beneficial to clarify how investing in IT systems influences their CF and forecast
accuracy. On the other hand, several studies have examined the quality level of
information and uncovered diverse parameters that measure the satisfaction level of
partners. Despite this, the literature lacks empirical studies that explain what
benchmarks are vital for partners to be able to be satisfied by information sharing
when they collaboratively forecast specific product-groups in the FSC.

130
3. CHAPTER 3: DEVELOPMENT OF HYPOTHESES
AND CONCEPTUAL MODEL
3.1. Overview
Through reviewing the systematic literature, evidence from a plethora of research
confirmed the existing gap relating to the CF of manufacturers in the food chain,
concerning how they cannot conduct long-term collaboration with retailers (see
Chapter 2). This is connected with unsatisfactory forecasts when they gravitate to
collaborate with retailers over perishable, seasonal, promotional and newly launched
products. The absence of a solid remedy to this problem allowed the current research
to build literature-based propositions and a conceptual model. Data that were
gathered through the qualitative data collection process of the current research
validated existing CF challenges in practice.
This pragmatic evidence purified the propositions and conceptual model of the
current research for reliable implications for practice. Reviewing the grey literature
then elicited a vast body of samples and diverse views supporting the necessity for
academic research to close the extant gap in this field. In this respect, empirically
examining CF from the manufacturers’ point of view based on associated product-
groups became the main interest of the current research for accurate forecasts and
long-term collaborations in the FSC. The existing propositions of this research were
transformed to hypotheses under the frame of the theoretical prospectus of Whetten
(1989) to offer rigorous and applicable contributions to the literature and the food
industry. This chapter therefore to:
Gives a rationale for the hypothesis development process of the current research
based on a theoretical frame in the academic field.
Identifies major hypotheses through the interrogation of vital problems that
appear in the supply chain integration, forecasting process and information
sharing of manufacturers.
Discuss the rationale of hypotheses in response to research questions which aim
to achieve long-term and accurate CF in the FSC.

131
Conceptualise hypotheses under a single model as a development process of a
rigid conceptual model.
Structure the causal relationships of hypotheses on the conceptual model to
display associated causalities that will be tested empirically.
3.2. Theoretical background and hypothesis development
The current research follows the theoretical concepts of Whetten (1989) to offer
rigorous contributions to theory. Whetten (1989, p. 490) focused on three major
questions that require clarification in terms of theory development and theoretical
contribution in the academic fields. These questions are:
What are the building blocks of theory development?
What is a legitimate value-added contribution to theory development?
What factors are considered in judging conceptual papers?
In response to the aforementioned questions, Whetten (1989) offered four theoretical
concepts as a guideline for academics. These concepts consist of “what, how, why
and the combinations of who, where and when”. In this context, the hypothesis
development process of the current research is based on these four theoretical
concepts.
Firstly, regarding the first theoretical concept of “what”, it relies on the selection of
variables and constructs that have logical explanations in their consideration of the
conceptual model. In other words, the first concept is with regard to identifying core
factors, which are likely to remedy the existing CF problems of manufacturers and to
enhance long-term and accurate CF in the FSC. Associated factors in this research
represent the hypotheses offered to be tested empirically. Variables are the
representatives of associated factors (or hypotheses) in reality. To put it differently,
variables are key clues that can be observed in practice, and are perceived as the
creator of associated factors. To identify these constructs and associated variables,
the comprehensiveness and parsimony criteria of Whetten (1989) were employed.
The comprehensiveness criterion considers the relevance of variables and constructs
in the associated research fields. In detail, the major research fields that offer

132
associate constructs (or hypotheses) are the focus of this phase. The relation between
constructs and their variables are questioned in related research fields. In practice,
the comprehensiveness criterion represents the major processes of manufacturers
who confront difficulties in achieving long-term and accurate CF with retailers.
Through an extensive review of the literature, the current research has identified
major constructs and associated variables in three major research themes. These
themes are supply chain integration, the forecasting process and information sharing,
and are interrogated by the three research questions of the current research
separately.
The criterion of parsimony helps to make concrete decisions on whether it is
essential to eliminate related variables due to their limited contribution to the model.
The parsimony criterion of the current research comprises the purification processes
of systematic literature-based propositions. Reviewing the literature systematically
made it possible to identify a large number of propositions as a remedy to the CF
problems of manufacturers. Pragmatic data that were obtained from a single semi-
structured interview and three online group discussions guided the current research
to limit the number of propositions based on their pragmatic importance in the field.
Then, the review of the grey literature offered additional sources as a guideline to
complete the second proposition elimination process. This screening process was
conducted in relation to the propositions that were rationalised based on the
qualitative data of this research. In doing so, the parsimony criterion was satisfied,
and the hypotheses of the current research were formulated.
Secondly, the theoretical concept of “how” aims to add more insight into the relation
between the constructs and variables selected beforehand. This concept makes it
possible to clarify the direction of arrows between hypotheses, which leads to adding
causality to the hypothetical relationships and to constructing the complete form of a
conceptual model. Through the analyses of the systematic review, qualitative data
and the grey literature, the current research built hypothetical relationships based on
a new CF practice. This CF practice constituted of a number of major variables that
form its entire structure, aiming to achieve long-term and accurate CF for
manufacturers. Enhancing long-term and accurate CF in the FSC became the two

133
performance criteria for this practice. The CF practice was further hypothesised to be
the predictor of manufacturers’ forecast satisfaction when they forecast perishable,
seasonal, promotional and newly launched products along with retailers.
The logic behind considering the satisfaction factor / construct (or hypothesis) as the
outcome of the CF practice relies on manufacturers’ subjective objectives in the
FSC. Given the fact that organisational objectives vary based on a wide range of
factors, such as position in the market, target sales and future strategies,
manufacturers’ satisfaction from forecasts is likely to change in parallel with
organisational objectives. To generalise the practicability of CF in the food chain, the
current research has formulated a hypothetical relationship between this practice and
the forecasts satisfaction of manufacturers in relation with the seasonal, perishable,
promotional and newly launched products. The current research then formulated
hypotheses to identify factors having an impact on this CF practice. These factors
and their variables were extracted from the research themes of supply chain
integration, the forecasting process and information sharing. Until this point,
combining the theoretical concepts of “what” and “how” made it possible to develop
hypothetical relationships and to organise the domain aspect of the conceptual
model.
Thirdly, the theoretical concept of “why” looks for reasons not only to justify the
selection of constructs and variables, but also to add more insight into the underlying
causality between hypotheses in the conceptual model. In this phase, related studies
dedicated to the related research themes were analysed. This analysis exploited not
only contributions and suggestions for future research, but also limitations that were
not taken into account in the associated prior studies. Through the comparative
investigation of associated studies, a vast body of research findings and research
opportunities were identified. When evaluations were then synchronised with the
results of the qualitative data analysis, rigorous evidence was obtained, with such
evidence making it possible to explain the logic behind the hypothetical relationships
in a rational way.

134
In this sense, when the “why” concept was regarded along with the theoretical
concepts of “what” and “how”, it created a solid opportunity for this research to
empirically verify associated hypothetical relations and to improve the reliability of
the conceptual model. This approach enhanced the value of the theoretical
contributions rather than only offering empirical findings to the literature. This is
why the reader can easily judge the posited hypothetical relationships in terms of
how compelling and rational the contributions of the current research are to extend
existing knowledge. Food practitioners can also interpret how the conceptual model
of this research enhances long-time and accurate CF when perishable, seasonal,
promotional and newly launched products are subject to their collaborations.
Finally, Whetten (1989)’s unified theoretical concept of “who, where and when” was
considered. This concept theoretically intends to put limitations onto the conceptual
model. In other words, this aim here is to demonstrate the hypothetical relationships
in a particular domain, and to validate the conceptual model in a certain
circumstance. Therefore, the current research is limited to dyadic manufacturer-
retailer collaborations in the FSC that were built upon time-sensitive and / or short-
life product-groups (e.g. perishable, seasonal, promotional and newly launched
products). The foremost focus is restricted to food manufacturers that are located in
the UK & Ireland, Europe and North America.
In doing so, the hypotheses development process was completed based on the
theoretical concepts of Whetten (1989). This theoretical approach brought additional
clarity to the hypothesised relationships and the boundaries of the conceptual model.
The limitations of the current research, in turn, generated an opportunity to
recommend a broad range of future research opportunities. The following section
addresses the new CF practice and discusses its rationale by outlining associate
hypotheses.

135
3.2.1. The CF practice
CF is a forecasting practice, “in which the knowledge and information that exists
internally and externally is brought together into a single, more accurate, forecast
that has the support of the entire supply chain” (Helms et al., 2000, p. 395). This
practice constitutes one of the three phases of CPFR, which is a nine-step “business
practice that combines the intelligence of multiple trading partners in the planning
and fulfilment of customer demand” (VICS, 2004, p. 5). However, to propose a
concrete and applicable CF in practice, the current research pays careful attention to
the major obstacles that impede manufacturers from employing long-term and
accurate CF with retailers (Ramanathan and Gunasekaran, 2012; Nyaga et al., 2010;
Småros, 2007).
The literature has identified a wide range of reasons for the failure to implement
long-term and accurate CF in dyadic manufacturer-retailer collaborations. While the
dominance of retailers appeared to be one the most important reasons for unfortunate
forecast collaborations (Aviv, 2007; Småros, 2007), their unsophisticated forecasting
process, reluctance and opportunistic behaviour during information sharing with
manufacturers escalated conflicts in collaborations (Taylor and Xiao, 2010; Taylor,
2006). Correspondingly, while a lack of trust and commitment had a negative impact
on joint operations, such as in the forecasting process (Vlachos and Bourlakis, 2006;
Fliedner, 2006; 2003), unsophisticated information sharing between partners and
their departments became another cause of unsatisfactory forecasts (Zhou and
Benton Jr, 2007; Taylor and Fearne, 2006). Relying on manufacturers’
organisational characteristics, lack of confidence in generating sales forecasts, long
lead-times and production plans as well as limited interdepartmental integration
comprised the principal obstacles that prevent them from conducting long-term and
accurate CF with retailers (Småros, 2007; Helms et al., 2000).
Because the European grocery sector witnessed non-productive forecast
collaborations over the perishable, seasonal, promotional and newly launched
products (Småros, 2007), it is inevitable to put these product-groups at the forefront
of CF. The logic behind this is that preserving the freshness and shelf availability of
short shelf life of perishable and seasonal products requires the substantial effort of

136
partners. This effort calls for partners’ collaborative effort in the processes of
forecasting and information sharing (Fliedner, 2006; 2003). Manufacturers’
competence in production, distribution and inventory management is essential to be
able to maintain the quality of these short-life products (Ahumada and Villalobos,
2009; Du et al., 2009).
Managing demand during promotions is another challenge as promotions differ due
to the different durations and discounts offered, which, in turn, exacerbate sales
variability (Ramanathan and Muyldermans, 2010). In a similar vein, forecasting
newly launched products in a collaborative effort is problematic owing to a lack of
historical information and variety of consumer choices (Småros, 2003; Bitran and
Mondschein, 1997). In addition to these product based CF challenges, the study by
Småros (2007) illustrated the existing gap between theory and practice, and reported
the paucity of empirical research addressing CF from the manufacturers’ point of
view for long-term and accurate CF. The current research is therefore committed to
closing this substantial gap by offering a new CF practice to the field. To create such
a rigid and theoretical approach, enhancing long-term and accurate CF became the
two foremost performance criteria, which are united under the construct of
Collaborative Forecasting Performance in this research.
From the forecasting point of view, the literature supports the criterion of accuracy
as the representative of forecast efficiency. Accuracy is already one of the two
performance criteria for the new CF practice. Nonetheless, companies in practice
value additional factors such as customer service, ease of use, interpretation and
inventory turns (McCarthy et al., 2006; Yokum and Armstrong, 1995; Mentzer and
Kahn, 1995). In this sense, to generalise the reliability of the research findings from
the practitioners’ point of view, the satisfaction factor was additionally identified as
an important outcome for the CF practice, in addition to Collaborative Forecasting
Performance. The Forecast Satisfaction of manufacturers in this research is based on
the forecasts of perishable, seasonal, promotional and newly launched products.
These forecasts are estimated in meetings along with retailers, and represent the
consensus forecasts of partners’ CF. Consequently, both Collaborative Forecasting

137
Performance and Forecast Satisfaction are posited as the primary outcomes of the
CF practice, and are hypothesised as follows:
H1a. The CF practice of manufacturers has a significant and positive influence
on Collaborative Forecasting Performance
H1b. The CF practice of manufacturers has a significant and positive influence
on their Forecast Satisfaction for associated product-groups.
To be able to increase the Collaborative Forecasting Performance and Forecast
Satisfaction of manufacturers, the CF practice in this research began with the
combination of a number of variables that build its core. It is important to emphasise
that these variables are not the representative of this approach. Because each variable
has a unique feature and adds different value to this approach, they formulate the
characteristics of the CF practice. These variables were identified through the
widespread examination of the literature review, and then supported by qualitative
data. The reasons behind the selection of these variables are discussed below.
3.2.1.1.Trust and commitment
In collaborations, trust represents “the willingness of a party to be vulnerable to the
actions of another party based on the exception that the other will perform a
particular action important to be trustor, irrespective of the ability to monitor or
control that another party” (Mayer et al., 1995, p. 712). Commitment then “refers to
an implicit or explicit pledge of relational continuity between exchange partners”
(Dwyer et al., 1987, p. 19). In other words, the quality of relationships between
manufacturers and retailers depends upon the effort they put into building trust and
commitment to satisfy each other, which in turn conveys permanence to their
collaboration (Fischer, 2013). Previously, the literature stressed that trust and
commitment are the major constraints to accomplish strategic objectives in the long-
term collaborations (Mentzer et al., 2000).
In FSC, partners’ unwillingness to share information seems to be a fundamental
reason for missing trust and commitment, and collaborations that lack these attitudes
are not expected to survive in the long-run (Fliedner, 2006; Vlachos and Bourlakis,

138
2006; Crum and Palmatier, 2003). This limited information sharing between partners
engenders the hazard of misusing information, and accordingly worsens forecasts, so
this shortage calls for the development of trust for accurate forecasts (Gulati, 2011).
From a different perspective, the study by Fischer (2013) confirmed that partners’
effective communication is the key enabler to build trust in the European agri-food
sector. These results are in line with an experimental study by Özer et al. (2011),
who demonstrated that partners’ continuous interaction and exchange of forecast
information rely on trust. By relying on these diverse studies, it is reasonable to infer
that while partners’ poor information exchange worsens forecasts and dependability
on each other, continuous information sharing is the enabler of building trust in
collaborations. In other words, there is a reciprocal influence between sharing
information and building trust between partners.
Since studies have clarified how the success of collaborative supply chains relies on
a high level commitment between partners (Simatupang and Sridharan, 2002), it is
timely to recall the necessity of trust and commitment in the forecasting meetings of
partners (Van Swol, 2011; Flynn et al., 2010; Davis and Mentzer, 2007). Because
the dynamic structure of FSC brings volatility to demand, it is essential for partners
not only to be flexible and join their forecast decisions, but also to show commitment
to and trust in each other (Van der Vaart et al., 2012; Ha et al., 2011; Taylor and
Fearne, 2006; Johnston et al., 2004). In fact, trust not only raises commitment and
brings about joint plans, but also brings reliability to partnerships in the long-term
(Nyaga et al., 2010; Barratt, 2004; Barratt and Oliveira, 2001).
For instance, Vlachos and Bourlakis (2006) in the Greek food sector have found that
trust and commitment are the leading requirements for reliable collaborations, and
Småros (2007) in Europe observed manufacturers’ eagerness for additional data from
retailers causing loss of trust in collaborations. Knowing that the underlying reasons
for unfortunate collaborations rest upon the absence of trust and commitment (Nyaga
et al., 2010; Småros, 2007; Fliedner, 2006; Vlachos and Bourlakis, 2006), it is
rational to build partners’ CF in the frame of trust and commitment. This is why trust
and commitment are the two foremost formative variables for the CF practice of the
current research.

139
3.2.1.2.A joint business plan
The current research regards the development of a joint business plan as the key
antecedent of the CF practice. Joint business plan is a collaborative task of partners
that must happen along with collaborative arrangement (VICS, 2004). Linking plans
is the second step of the CPFR process, where partners engage in strategies and share
experiences to create a basis for continuous product based information sharing
(Danese, 2006; Siefert, 2003; ECR Europe, 2002). Although Ramanathan and
Gunesakaran (2014) found that collaborative planning is not a significant factor for
future collaborations, Nyaga et al. (2010) argued that joint planning and decision
making build trust in the long-term collaborations. In this regard, it is worth
remembering that lack of trust and commitment is one of the most crucial problems
of partners that worsen their collaboration (Vlachos and Bourlakis, 2006; Fliedner,
2006; 2003). While recalling that this blockage adds further insights to the
arguments of Nyaga et al. (2010), it offers a prudent response to the results of
Ramanathan and Gunesakaran (2014). In this manner, it is reasonable to claim that
linking the business plans of partners is essential for CF in the FSC.
Synchronising partners’ business plans enables them not only to improve
communication, but also to solve exceptions on the joint sales forecasts, which are
the leading barriers of CF (Danese, 2007; Fliedner, 2006; 2003). Synchronisation of
plans allows partners to jointly manage operational activities and to generate more
accurate consensus forecasts (Danese, 2007; Larsen et al., 2003). This joint effort
that improves collaboration is, per se, likely to support long-term CF, where partners
can get maximum benefit from the CPFR process (Noekkentved, 2000). In practice,
Levi Strauss & Co is a good example to support these arguments, since this company
successfully conducted its replenishment operations over a single plan with partners,
and explored exceptions in order forecasts (Aviv, 2001). Therefore, linking business
plans of partners has become the basis of the CF practice in this research.
3.2.1.3.Consensus-based internal forecasts
In manufacturers, multiple forecasts, which are generated based on departments’
diverse objectives and information, are another obstacle to CF (Helms et al., 2000).
In collaborations, reaching agreement on retailers’ orders and then conducting timely

140
replenishment operations are largely related to the manufacturers’ forecasts that are
generated by their departments. This is because partners’ consensus forecasts that
represent retailers’ orders are generated through the aggregation of those forecasts
that are evaluated within partners’ departments (Ireland and Crum, 2005; Siefert,
2003). In other words, retailers’ orders involve the combination of retailers’ and
manufacturers’ different forecasts. This procedure adds further value to
manufacturers’ interdepartmental relations and forecasting.
Due to the significant role of interdepartmental relations in these forecasts, this
conflict not only causes additional inventory and loss of information, but also
exacerbates internal-external disagreements, which limit manufacturers having
consensus with retailers (Taylor and Fearne, 2006; Fliedner, 2006; 2003; Helms et
al., 2000). If partners cannot generate consensus forecasts in a timely manner, this
will cause delays to delivery and prevent shelf availability. Consequently, retailers
will not be satisfied with CF, and there will be no reason to conduct long-term
collaborations (Kaipia, 2008; Småros, 2007; Simatupang and Sridharan, 2002). For
instance, according to McCarthy et al. (2006), 53 percent of USA firms work cross-
functionally to incorporate departmental forecasts whilst 54 percent employ CF. In
the European grocery sector, Småros (2007) also illustrated how manufacturers’ poor
interdepartmental relations harmed CF for newly launched products.
When demand is uncertain, the literature suggests cross-functional integration
through information sharing and the forecasting process for satisfactory and accurate
forecasts (Oliva and Watson, 2011; Nakano, 2009; Davis and Mentzer, 2007;
Sanders and Ritzman, 2004; McCarthy and Golicic, 2002). This necessitates
departments’ agreement on a single forecast (Lawrence et al., 2006; Sanders and
Manrodt, 2003). Given manufacturers’ multiple forecasts, which are estimated based
on related departments’ different objectives and give rise to internal-external
conflicts (Helms et al., 2000), they, in the first instance, should be satisfied with their
own forecasts before meeting with retailers. Further, they need to agree on a single
forecast to foster the process of evaluating consensus forecasts with retailers. By
relying on the aforementioned evidence and arguments, the current research

141
identifies the consensus-based internal forecasts of manufacturers as one of the
backbones of the CF practice.
3.2.1.4.Sharing of order forecasts
In CPFR, while manufacturers generate sales forecasts by relying on retailers’ POS
data, they exchange these forecasts with retailers to reveal potential product based
exceptions (CPFR: Step 3 and 4, please see Section 2.3.1. Steps of CPFR for details).
When product based disagreements are fixed on the sales forecasts, these forecasts
represent partners’ order forecasts. Afterwards, manufacturers synchronise their
inventory strategies and order forecasts to evaluate order quantity based on
“inventory target per product” and “the destination of product” (CPFR: Step: 5 and
6) (VICS, 2004; 2002). In this step, production capacity and delivery operations are
managed based on the forecast that is formed through the combination of order
forecasts and inventory strategies (Danese, 2007). For efficient production and
delivery management, manufacturers look for answers to the questions of “how
much advance notice is necessary to transport the product to its destination? and
does the order information reflect temporal differences?". Then, they apply short-
term forecasts for actual orders, and long-term forecasts to track the joint business
plan with retailers (Siefert, 2003, p. 38).
While manufacturers improve their order forecasts based on inventory strategies to
manage production and delivery, retailers’ order forecast, on the other hand, do not
include such modifications. From the retailers’ point of view, these changes cause a
lack of visibility on the orders and delivery operations of manufacturers (VICS,
2002). When partners meet to solve exceptions and to aggregate these distinct order
forecasts (CPFR, Step 7 and 8), they confront challenges (Fliedner, 2006; 2003), due
to overlapping views on aggregating order forecasts at different levels (Ireland and
Crum, 2005; Zotteri et al., 2005; Siefert, 2003). For that reason, manufacturers need
to share order forecasts before meeting with retailers to clarify the changes that were
made to manage production and delivery. Sharing these modified order forecasts will
allow retailers to clearly understand for what purpose order forecasts are used by
manufacturers (Zotteri and Kalchschmidt, 2007). Otherwise, partners will confront
disagreements in the meetings, and will not be able estimate consensus forecasts in a

142
timely manner. If partners cannot solve disagreements in collaborations that are
based upon time-sensitive / or short-life products, it will give rise to inaccurate
forecasts, delays in replenishment operations and consequently absence of products
on shelves. Overall, this drawback becomes a significant barrier to long-term and
accurate CF (Småros, 2007; Helms et al., 2000). Given the importance of forecasting
meetings and forecasters’ role in generating consensus forecasts (Graefe and
Armstrong, 2011; Van Swol, 2011; Davis and Mentzer, 2007), it is rational to share
order forecasts with retailers before the forecasting meetings. Thus, the final
antecedent of the CF practice in this research involves the sharing of order forecasts
for manufacturers. Relevant references for variables constituting the domain of the
CF practice are presented in Table 3.1, and Figure 3.1 exhibits the CF practice along
with its formative variables and the expected outcomes of Collaborative Forecasting
Performance as well as Forecast Satisfaction.

143
Table 3.1. Relevant references of formative variables constituting the CF practice
Formative variables Codes Relevant references
Trust CF_3
Akkermans et al. (1999); Barratt (2004); Chang et al. (2013); Crum and
Palmatier (2003); Davis and Mentzer (2007); Du et al. (2012); Fischer (2013);
Fliedner (2006; 2003); Flynn et al. (2010); Francis et al. (2008); Gulati (2011);
Ha et al. (2011); Johnston et al. (2004); Mayer et al. (1995); Mentzer et al.
(2000); Moorman et al. (1993); Özer et al. (2011); Sinkovics et al. (2011);
Taylor and Xiao (2010); Taylor and Fearne (2006); Van der Vaart et al. (2012);
Van Swol (2011); Van der Vaart and Van Dook, (2008); Vlachos and Bourlakis
(2006)
Commitment CF_4
Akkermans et al. (1999); Chang et al. (2013); Chang et al. (2007); Crum and
Palmatier (2003); Davis and Mentzer (2007); Du et al. (2012); Dwyer et al.
(1987); Flynn et al. (2010); Johnston et al. (2004); Lockamy III and
McCormack (2004); Mentzer et al. (2000); Moorman et al. (1992); Simatupang
and Sridharan (2002); Van der Vaart et al. (2012); Van der Vaart and Van
Dook, (2008); Zhao et al. (2011)
A joint business plan CF_5
Aviv (2001); Danese (2007; 2006); ECR Europe (2002); Fliedner (2006; 2003);
Ireland and Crum (2005); Larsen et al. (2003); Mentzer, et al. (2000); Nyaga et
al. (2010); Ramanathan and Gunesakaran (2014); Siefert (2003); Simatupang
and Sridharan (2002); VICS (2004)
Consensus-based
internal forecasts CF_6
Davis and Mentzer (2007); Fliedner (2006; 2003); Helms et al. (2000); Ireland
and Crum (2005); Kaipia (2008); Lawrence et al. (2006); McCarthy and Golicic
(2002); Nakano (2009); Oliva and Watson (2011); Sanders and Ritzman (2004);
Sanders and Manrodt (2003); Siefert (2003); Simatupang and Sridharan (2002);
Småros (2007); Taylor and Fearne (2006)
Sharing of order
forecasts CF_7
Chang et al. (2007); Danese (2007; 2006); Davis and Mentzer (2007); Fliedner
(2006; 2003); Helms et al. (2000); Ireland and Crum (2005); Paula et al. (2003);
Siefert (2003); Småros (2007; 2003; 2002); Van Swol (2011); VICS (2004;
2002)
Source: Developed by the author
Source: Developed by the author
Figure 3.1. The CF practice
The CF
practice
Collaborative
Forecasting
Performance
Sharing of order forecasts
(CF_7)
Consensus-based internal
forecasts (CF_6)
Commitment (CF_4)
Trust (CF_3)
Joint business plan
(CF_5)
Long-term CF (CF_2)
Accurate CF (CF_1)
Forecast
Satisfaction
Perishable
products
Newly launched
products
Promotional
products
Seasonal products
H1b
H1a

144
3.2.2. Integration of manufacturers
Supply chain integration not only encapsulates supplier (or upstream) integration and
customer (or downstream) integration (Frohlich and Westbrook, 2001), but also
involves “horizontal integration within the firm since the various internal functions
comprising a company are as much a part of the supply chain as are the company’s
suppliers and customers” (Vickery et al., 2003, p. 524). Accordingly, the current
research considers a supply chain integration that embraces partners’ organisational
behaviours, characteristics, operational practices and technological infrastructure at
both the external and internal level (Van der Vaart et al., 2012; Stevens, 1989).
In other words, the outlook of this research towards supply chain integration refers to
manufacturers’ external coordination with retailers as well as interdepartmental
functions as an extension of external coordination over strategic and technological
efforts (Flynn et al., 2010; Sahin and Robinson Jr., 2005; Vickery et al., 2003). This
distinctive feature of the current research also earns the support of the literature, as
“external collaboration looks at relations with suppliers and customers in terms of
the length of trading, technology transfer between trading partners, and risk sharing,
amongst others”. On the other hand, “internal collaboration examines the linkages,
relationships, organisational structure, and training within the single organisation”
(Aryee et al., 2008, p. 563). By relying on the academic evidence, integration
practices in this research therefore encompass manufacturers’ External Integration
with retailers as well as Internal Integration of their departments.
3.2.2.1.External integration
Partners’ different expectations through information sharing and in the forecasting
process constitute the blockages that prevent long-term and accurate CF (Fang and
Meng, 2010; Småros, 2007; Aviv, 2007; 2002). As retailers adopt information
sharing, efficient delivery and multifaceted collaborations, manufacturers on the
other hand look for trust in collaborations (Vlachos and Bourlakis, 2006).
Manufacturers’ intention to increase forecast accuracy triggers an additional
information request from retailers, and their long lead-times and different forecasting
outlook seem to be contrary to retailers’ priority of short lead-times and store level
demand (Småros, 2007; Helms et al., 2000).

145
Småros (2007) argued that IT systems are not a major barrier to long-term CF, and
this view is in line with Barratt (2004), who supported the idea that it is not
necessary to build collaborations upon technologies. However, due to the fact that IT
systems are costly investments, they hinder partners from applying CF for a wide
product range in the long-run (Sari, 2008; Fliedner, 2003; McCarthy and Golicic,
2002). Regarding the size of organisations, investing in IT systems will be another
drawback for small-scale manufacturers (Mentzer et al., 2000), and retailers in
practice (e.g. Tesco and Sainsbury’s) insist upon complete electronic integration for
long-term collaborations (Fearne and Hughes, 2000). IT systems direct managers
towards relevant information and accelerate their decision making in collaborations
(Mendelson and Pillai, 1998). It is clear that technology evolves each passing day
and offers new IT systems to the industry. Incompatible different systems that are
chosen by partners give rise to reduce the speed of data exchange and to increase
errors as well as administration costs (Taylor and Fearne, 2006). In fact, agile
information sharing is essential for CF (Aviv, 2007), and this puts pressure on
partners to collaboratively invest in IT systems for longer CF (Fliedner, 2003;
McCarthy and Golicic, 2002).
If partners integrate over the IT systems, it will allow them to access data from the
partner organisation in a timely manner, and to lay the basis of trust-based
relationships (Sinkovics et al., 2011). This approach, which allows the spreading of
information in the entire supply chain, will underpin manufacturers’ production
planning, inventory management and delivery plans (Thonemann, 2002). Related
case studies have also illustrated how investing in IT systems has enhanced
efficiency through data exchange, which in turn underpinned manufacturers’
inventory management and production process. Such an investment is most likely to
increase the quality of information due to improved transparency about the
information exchanged (Ramanathan et al., 2011).
This is why, having mutual agreement on the IT based information exchange will
enhance partners’ desire for a constructive forecasting process, and this will increase
forecast accuracy as well (Taylor and Fearne, 2006; Mentzer et al., 2000). In
practice, the IT systems of Sony, for instance, enabled the company to regularly

146
track customers’ sales for better customer service and to be more responsive to
demand (Zhou and Benton Jr, 2007). Dell Computers, similarly, integrated with its
partners over the business-to-business IT systems to obtain inventory and order
information on a daily basis, which increased transparency in their collaborations
(Sinkovics et al., 2011).
For long-term partnerships, strategically collaborating based on long-term objectives
is important, but this requires partners’ tight integration, both during information
sharing and in the forecasting process (Mentzer et al., 2000). To accomplish such an
integration, partners need to show interdependence with each other (Du et al., 2012;
Zacharia et al., 2011; Hong et al., 2005; Chen and Paulraj, 2004), whilst their top
management pursues the same vision to invest in IT systems (Li and Lin, 2006;
Barratt, 2004; Mentzer et al., 2000). For instance, one of the oldest and most
successful relationships, H.J. Heinz Ltd and Oshawa foods partnership, was built
upon the same vision of top managements in the 1990s (Crum and Palmatier, 2003).
To cope with unexpected situations (e.g. demand variability and long lead-times),
partners likewise need to act in a compatible manner by adopting a reciprocal
willingness and commitment to be flexible and to improve performance in complex
supply chains (Van der Vaart et al., 2012; Ha et al., 2011; Ireland and Crum, 2005;
Johnston et al., 2004).
Furthermore, showing openness, honesty and mutual understanding are important
attitudes for transparent information sharing and accurate forecasts in collaborations
(Ha et al., 2011; Spence and Bourlakis, 2009; Taylor and Fearne, 2006). In essence,
the reason behind calling for such as an effortful and integrative CF depends largely
on the heterogeneous structure of FSC, escalating information distortion and hosting
a wide range of time-sensitive and / or short-life product-groups that have fluctuating
demand. Supporting this argument of the current research, by considering the results
of ten case studies, Danese (2011) illustrated how supply chain complexity and
product variety influence the partners’ business areas that they integrate, such as
planning, information sharing and forecasting. Given the benefits of increased
responsiveness against instant demand changes when partners closely integrate in
supply chains (Danese et al., 2013), it is reasonable to argue that manufacturers
147
should externally integrate with retailers by exhibiting continuous effort to counter
potential challenges. Accordingly, the next hypothesis of the current research is as
follows:
H2a. External Integration has a significant and positive influence on the CF
practice of manufacturers
3.2.2.2.Internal integration
In FSC, a manufacturer’s poor interdepartmental integration is an important problem
that causes inefficient use of demand / forecast data along with loss of information
(Småros, 2007). Multiple and inconsistent forecasts by manufacturers that are
generated based on departmental objectives and resources are likewise significant
obstacles to accurate CF. These multiple forecasts do not only exacerbate internal
conflicts (Fliedner, 2006; 2003; Helms et al., 2000), but also prevent consensus with
retailers (Hill, 1999). Forecasters’ lack of confidence in sales forecasts, inconsistent
data recording, and lack of IT systems in manufacturers appear to be major reasons
for these shortcomings (Taylor and Fearne, 2006; Helms et al., 2000). In response to
these difficulties, improving Internal Integration will allow manufacturers to react to
instant demand changes and to enhance performance in business (e.g. growth in
sales, profit and market share, and return on sales and investment) as well as in
operations (e.g. timely launching new products, on time deliveries and short lead-
times) (Flynn et al., 2010). Accordingly, there will be no reason for manufacturers to
do not have a competitive advantage in the market (Davis and Mentzer, 2007).
The Internal Integration of manufacturers involves transparency from purchasing to
delivery, rapid information exchange to support external ties with retailers and also
responsiveness to demand changes (Stevens, 1989). In essence, these capabilities are
already expected by retailers in sustaining product availability on shelves
(Ramanathan et al., 2011). For instance, a survey based study by Williams et al.
(2013, p. 545) demonstrated that organisations’ Internal Integration is strongly
related to their responsiveness in supply chains, with responsiveness here
representing the external flexibility to respond to changes that occur in dynamic
markets, such as in the food industry. Following this, the authors have interestingly

148
found that Internal Integration not only enhances visibility about the demand (e.g.
customers’ POS data, promotions and inventory as well as forecasts), but also
improves supply chain visibility, which is defined as “access to high quality
information that describes various factors of demand and supply”. According to
another survey based study by Schoenherr and Swink (2012), when partners
externally integrate in collaborations, their interdepartmental integration shows a
moderating effect on the delivery performance (e.g. delivery performance to commit
data, fill rate, perfect order fulfilment and order fulfilment lead-time) and flexibility
(e.g. production flexibility, cash-to-cash cycle time, asset turns and inventory days of
supply).
By considering this evidence, it is possible to argue that if manufacturers improve
integration between their departments, outcomes will not be limited to the
operational and / or financial benefits, they will also develop a broad vision and
visibility in the market to invest in the future. It should, however, not be forgotten
that improving integration at the internal level requires partners to adopt a common
culture in CF by synchronising internal practices as an extension of external
operations (Fliedner, 2006). In this respect, effectively managing inventories and
having proper internal IT systems for timely information sharing seem to be the
foremost requirements for integrating both internally and externally in the FSC
(Taylor and Fearne, 2006; Power, 2005; Stevens, 1989).
As the FSC is highly vulnerable compared to other chains, it causes external
dynamics (e.g. economic conditions, unexpected events, seasonality and promotions)
(Bourlakis and Weightman, 2004). Because these external factors are likely to affect
manufacturers’ internal dynamics (e.g. lack of data, poor information systems and
communication), it becomes very challenging to sustain the quality and freshness of
perishable and / or seasonal products in collaborations, and settling these conflicts
rests upon the extent to which partners integrate both internally and externally
(Vlajic et al., 2012). Therefore, it is worthwhile for manufacturers to record the
production and delivery related data regularly, and then to share them with retailers
in an attempt to improve forecasts and to facilitate the management of inventory,
delivery and production (Taylor, 2006). This is because inter-organisational

149
interaction plays an important role in managing demand against internal-external
dynamics and product-related ambiguities (Davis and Mentzer, 2007).
The benefits of cross-functional integration between marketing and production
departments, for instance, are already apparent due to increased flexibility, product
quality and timely deliveries (Paiva, 2010; Lockamy II and McCormack, 2004).
Because manufacturers’ skills in delivery practices are the key enabler of flexibility
(Kaipia, 2008), integrating a large number of departments is most likely to underpin
manufacturers’ integration with retailers as well (Braunscheidel and Suresh, 2009;
Gimenez and Ventura, 2005; Droge et al., 2004). In other words, as long as
manufacturers have strong integration between their departments, there is no reason
for them to confront difficulties through the integration with retailers (Zhao et al.,
2011)
When the concern is to find a way to build such a comprehensive and continuous
integration among several departments, S&OP seems a robust candidate for
manufacturers. This is because S&OP not only improves cross-functional
communication between the departments of marketing, production, finance and
supply chain, but also synchronises their diverse sources and identifies departmental
responsibilities (Grimson and Pyke, 2007). It is timely to recall that manufacturers’
multiple forecasts, which represent departments’ diverse objectives, cause
disagreements and delays in generating consensus forecasts with retailers (Fliedner,
2006; 2003; Helms et al., 2000). As a remedy, the strategic feature of S&OP, for
instance, can eases the alignment of departments’ different objectives (Oliva and
Watson, 2011). This alignment expedites the generation of a single consensus-based
forecast in manufacturers (Mello, 2013). Accordingly, they can generate consensus
forecasts with retailers in a timely manner (Olhager, 2013; Thomé et al., 2012).
Considering the necessity for manufacturers to link business plans with retailers in
CF (VICS, 2010), S&OP likewise helps manufacturers to combine their operational
and strategic objectives in a single business plan with retailers (Thomé et al., 2012).
Given that FSC is highly dynamic and S&OP has the capability of adopting market
uncertainties, merging S&OP with the CF of manufacturers will most likely to
150
remedy their internal conflicts (Nakano, 2009). Therefore, the current research
recommends the S&OP practice for manufacturers to improve their Internal
Integration. To underpin this offer, it is worthwhile to recall the successful
collaboration of The Lowe’s Home Improvement and Whirlpool, who combined
their CPFR and S&OP practices (Smith et al., 2010). Furthermore, by relying on the
aforementioned arguments and diverse analyses, the current research argues for the
importance of Internal Integration as a significant element in manufacturers’ CF in
the FSC. By extending this argument, this research claims that Internal Integration is
also a prerequisite for better integration with retailers at the external level. Therefore,
the following hypotheses are formulated:
H3a. Internal Integration has a significant and positive influence on the CF
practice of manufacturers
H3b. Internal Integration has a significant and positive influence on External
Integration during the CF practice of manufacturers
3.2.3. Forecasting process
Manufacturers’ forecasting process is non-negligible in CF. Forecasting challenges
are not limited to departments’ incompatible multiple forecasts that trigger internal-
external conflicts (Taylor and Fearne, 2006; Fliedner, 2006; 2003; Helms et al.,
2000). There is a divergence between the literature and practice in terms of the
Forecast Horizon preferences of partners in CF. Some simulation-based studies have
presumed that partners collaborate on the same Forecast Horizon (Aviv, 2002;
2001), yet partners’ disagreements on planning horizons worsened CF in practice
(Småros, 2007). It is clear that there is a substantial gap in the literature about
whether partners have such disagreements on Forecast Horizon. Further to that, the
literature is limited to scant knowledge in terms of the required horizon in
forecasting the time-sensitive and / or short-life products in the FSC. There are only
a limited number of studies addressing the horizon of forecasts by considering longer
periods, such as from three months to two years (McCarthy et al., 2006; Mentzer and
Kahn, 1995). Whilst there are contrary views that defended shorter time periods such
as a month (Fildes and Goodwin, 2007; Klassen and Flores, 2001), the literature is

151
lacking in comprehensive empirical work that particularly examines the Forecast
Horizon of perishable, seasonal, promotional newly launched products in the FSC.
Partners’ overlapping expectations through forecasting meetings are another obstacle
for consensus forecasts, and forecasters play a critical role in these meetings too
(Van Swol, 2011; Småros, 2007; 2003). In meetings, forecasters use a wide range of
information to generate consensus forecasts. It requires substantial effort to
aggregate different information in a timely manner, and forecasters’ disagreements
already cause delays in generating these forecasts (Småros, 2007; Fliedner, 2006).
Given the managerial pressures, limited times and external factors that are likely to
affect forecasters’ performance (Fildes et al., 2009; Davis and Mentzer, 2007), this
process becomes even more important when the requirement is to forecast time-
sensitive and / or short-life products. Potential delays and / or inaccurate forecasts
engender time lags in replenishments, stock-out and absence of product availability
on shelves, and all these shortcomings then harm partners’ profit and therefore
collaboration. Whilst the literature has considered different types of meeting
techniques and forecasters’ disagreement in meetings are apparent, it needs to be
extended further by offering alternative solutions to these challenges (Önkal et al.,
2012; Graefe and Armstrong, 2011; Lawrence et al., 2006). Therefore, the argument
of the current research on the forecasting process is based on manufacturers’
Forecast Horizon, Group Forecasting with retailers and Forecasters’ Competence
required in meetings.
3.2.3.1.Forecast horizon
When simulation studies have aimed to improve performance in supply chain
through CF, it was presumed that partners have an agreement on the same Forecast
Horizon for long-life products (Aviv, 2002; 2001). However, when short-life and / or
newly launched products became subject to collaborations, retailers showed a
tendency to short-term forecasts for purchasing and store level demand in response
to manufacturers’ long-term forecasts due to long lead-times and production plans
(Småros, 2007; 2003).

152
While prior literature has surveyed a wide range of forecasting methods over
Forecast Horizon to reveal the change of forecasting management over twenty years,
the horizons of short-, mid- and long-term forecasts referred to “less than three
months’, ‘four months to two years’ and ‘over two years’ respectively (McCarthy et
al., 2006; Mentzer and Kahn, 1995). On the other hand, Fildes and Goodwin (2007)
stressed that organisations’ forecasts are monthly in several industries, which
corroborates the work by Klassen and Fores (2001). Furthermore, McCarthy et al.
(2006) showed worsened forecast accuracy in all Forecast Horizon for product-
based forecasts in time, while incoherent forecasts were more discernible for the
mid-term and long-term forecasts, so it is worth adding more insight to Forecast
Horizon for product-based forecasts.
Although combining multiple long-term forecasts that have a high variability
increases accuracy (Lawrence et al., 1986) and enhances competitiveness in the
market (Aburto and Weber, 2007), short-term forecasts lead to managing purchasing
and inventory effectively (Småros, 2003). This dilemma thereby causes another
challenge in deciding on the correct horizon based on product characteristics and
organisational objectives in CF. A limited number of case studies exemplified how
the partners’ different preferences about the Forecast Horizon of newly launched
products causes conflicts (Småros, 2007; 2003). Simulations, however, conjectured
partners’ similar approach to Forecast Horizon for long-life products (Aviv, 2002;
2001).
Given the contradictory findings of these studies that considered a limited number of
product-groups, it is worth adding further understanding to the role of Forecast
Horizon for particular product-groups, such as perishable, seasonal, promotional and
newly launched products. Whilst Forecast Horizon has a substantial role in the
forecasting processes (Zotteri and Kalchschmidt, 2007), elaborating Forecast
Horizon in manufacturers’ CF will provide further implications to the forecasting
process of partners. Therefore, the next hypothesis of the current research is:
H4. Forecast Horizon has a significant and positive influence on the CF practice
of manufacturers

153
3.2.3.2.Group forecasting
In CF, partners conduct regular Group Forecasting meetings to generate demand
forecasts and to identify / resolve exceptions over the item level forecasts. Then, they
generate order forecasts, and re-identify / resolve exceptions for consensus over a
single order forecast (Ireland and Crum, 2005). During these meetings, partners’
cross-functional teams make critical decisions through generating / adjusting
forecasts, evaluating the impact of seasonality, promotions and / or external factors.
All such decisions are made based on the pre-established procedures that are
identified through front-end agreement and highlighted in a joint business plan
(Siefert, 2003). In meetings, manufacturers’ forecasts focus on production plans and
lead-times, while retailers’ forecasts consider inventory levels, which causes
conflicts in having consensus on a single forecast (Småros, 2007; 2003).
On the other hand, the Group Forecasting techniques are vital to structure meetings
for consensus between partners’ cross-functional teams (Kerr and Tindale, 2011;
Graefe and Armstrong, 2011). For instance, face-to-face-meeting is an effective way
of merging the latest information with forecasts (Kerr and Tindale, 2011). However,
despite forecasters’ satisfaction from forecasts, its unstructured format causes bias
and hierarchical pressures, and necessitates spending substantial time, effort and
cost, which militate against scheduling regular meetings (Graefe and Armstrong,
2011). Partners’ Group Forecasting in CF relies largely on the pre-scheduled
meetings and decision making procedures (Ireland and Crum, 2005).
Therefore, Nominal-Group is an alternative to face-to-face-meeting with its
structured format (Van de Ven and Delbecq, 1974; 1971). In Nominal-Group,
forecasters individually estimate forecasts before debating results, and then have a
consensus on the aggregated final forecast. Nominal-Group outperforms face-to-
face-meeting and is more satisfactory, although it requires a great deal of time and
effort, like face-to-face-meeting. Nominal-Group makes it possible to elucidate
decisions owing to forecasters’ increased participation, enabling effective usage of
information in Group Forecasting (Graefe and Armstrong, 2011), which is essential
for CF (Ireland and Crum, 2005; Aviv, 2001).

154
Whilst the literature stresses the benefits of having different opinions for
constructive discussions in meetings (Kerr and Tindale, 2011; Davis and Mentzer,
2007; Aviv, 2001), a survey approach of Delphi-Technique reinforces
communication between forecasters on a unanimous and multimedia level platform.
These features distinguish Delphi-Technique from Nominal-Group and face-to-face-
meeting, and make it superior to face-to-face-meeting (Graefe and Armstrong,
2011). Although its structure is similar to Nominal-Group because of documentary
level interactions (Graefe and Armstrong, 2011), it requires additional information
sharing between forecasters to add more understanding to the changes made to order
forecasts for consensus (Helms et al., 2000). Thus, the performance of Delphi-
Technique relies on both forecasters and the structure of meetings (Rowe and
Wright, 2011; 1999). For instance, case studies in the European agri-food sector
illustrated increased participation and response rate, and motivation and small group
size became essential to avoid bias for the Delphi-Technique (Frewer et al., 2011).
Nevertheless, it is not possible to overlook partners that collaborate over different
contract models. The Group Forecasting technique of Prediction-Markets seems to
be appropriate for these partners to cope with environmental uncertainties and casual
costs (Wolfers and Zitzewitz, 2004). Prediction-Markets give a chance for partners
to merchandise over different types of contracts and to conduct continuous
information sharing, but their drawback is to allow one of the partners to change the
final forecasts without having confirmation from the other partner (Graefe and
Armstrong, 2011). This shortcoming makes Prediction-Markets inferior to face-to-
face-meeting (Kerr and Tindale, 2011). On the other hand, this technique makes it
possible to exchange the different types of information among partners (Wolfers and
Zitzewitz, 2004), and this feature is a noteworthy ingredient to keep in the
heterogeneous FSC. Overall, in view of the aforementioned diverse and non-
transparent analyses, it is indispensable to analyse Group Forecasting (Önkal et al.,
2012; 2011). This is why the next hypothesis of the current research is formulated:
H5. Group Forecasting has a significant and positive influence on the CF
practice of manufacturers

155
3.2.3.3.Forecasters’ competence
Producing timely and accurate forecasts is a challenge for forecasters due to
managerial pressures, limited times and / or external factors (Fildes et al., 2009;
Davis and Mentzer, 2007). Past literature stressed forecasters’ motivation in terms of
effectively adjusting forecasts (Webby and O'Connor, 1996) while case studies in the
FSC implied how scant motivation in Group Forecasting influences the forecasts of
newly launched products (Småros, 2007). These implications confirm the literature
stressing the conflict of forecasters in Group Forecasting (Fliedner, 2006; 2003).
Prior literature clarified how forecast accuracy over the relationship of forecasters
and / or cross-functional teams relies on the structure of meetings (Sniezek, 1989). In
a later study, Önkal et al. (2011) demonstrated varying performance between
individual and group forecasts. Although the role of organisations is important in
motivating forecasters to generate better forecasts (Davis and Mentzer, 2007), their
personal knowledge that is gained through experience seems an important driver for
accurate forecasts (Sanders and Ritzman, 2004). Particularly, if this knowledge is
based on specific product-groups, it becomes even more valuable for forecasts
(Edmundson et al., 1988). At the same time, overlapping experience on the particular
product-groups is likely to worsen consensus in collaborations (Van Swol, 2011).
This is why it is promising to generalise the role of experience in terms of judging
market dynamics and adjusting statistical forecasts based on the latest information in
Group Forecasting (Lawrence et al., 2006; Rowe and Wright, 1999).
The influence of advice on forecasts relies on the forecaster who advises and the
information that triggers him / her to give advice (Lawrence et al., 2006). Accepting
advice, however, depends on forecasters’ confidence, trust, commitment and
interaction with each other (Van Swol, 2011; Rowe and Wright, 2011). It should not
be forgotten that unreliable information, lack of training and / or experience are
likely to engender either bias or overconfidence, which can in turn ruin forecasters’
adjustments in meetings (Önkal et al., 2013; McCarthy Byrne et al., 2011; Syntetos
et al., 2009; Fildes et al., 2009). This is because overconfidence, for instance, is
likely to trigger bias in Group Forecasting (Kerr and Tindale, 2011; Bolger and

156
Wright, 2011; Sanders and Ritzman, 2004). Such interrelated attitudes of forecasters
make their role in CF and Group Forecasting more conspicuous.
Following this, although variant feedback between forecasters improves accuracy
(Lawrence et al., 2006; Goodwin and Fildes, 1999; Sanders, 1997), its effect relies
upon the level of understanding, timing and presentation (Lawrence et al., 2006).
Satisfaction from Group Forecasting likewise relates to forecasters’ training and
feedback, and tackling relevant problems depends on the knowledge of using
forecasts alongside training and feedback (McCarthy Byrne et al., 2011). Conducting
successful collaboration between partners is largely associated with their cross-
functional teams’ training, common understanding of organisational expectations
and the forecasts generated during Group Forecasting (Ireland and Crum, 2005).
It is clear that lack of trust and commitment inhibits partners from collaborating in
the long-run (Fliedner, 2006; 2003) while trust improves their information sharing
and decision making (Ha et al., 2011). Accepting advice between forecasters is also
related to trust (Van Swol, 2011), which calls for further research on advice (Önkal
et al., 2012). Trust and commitment are likely to increase forecasters’ motivation in
Group Forecasting (Flynn et al., 2010; Davis and Mentzer, 2007) and to mediately
underpin long-term collaborations (Vlachos and Bourlakis, 2006). Therefore, the
aforementioned analyses are the arguments for attributing the competence of
forecasters to both CF and Group Forecasting in the following hypotheses:
H6a. Forecasters’ Competence has a significant and positive influence on the CF
practice of manufacturers
H6b. Forecasters’ Competence has a significant and positive influence on Group
Forecasting during the CF practice of manufacturers

157
3.2.1. Information sharing
In collaborations, information sharing is a key practice for partners to enhance
transparency, performance and forecast accuracy (Zhu et al., 2011; Zhou and Benton
Jr, 2007). It becomes even more important when time-sensitive and / or short-life
product-groups are subject to collaborations. Taking into account these products in
the forecasting process raises the importance of selecting relevant / correct
information and controlling their quality (Taylor and Fearne, 2006; Zotteri et al.,
2005). In the European grocery sector, case studies exemplified the importance of
information for better forecasts of perishable, seasonal, promotional and newly
launched products (Småros, 2007). There are a number of studies that emphasise the
different types of information that need to be exchanged in CF (Danese, 2007; 2006)
while the quality of information has been the interest of a plethora of research
(Hartono et al., 2010; Li and Lin, 2006; Li et al., 2006).
The focus in the literature, however, became the information that flows from retailers
to manufacturers, such as promotions, inventory data and POS data (Ramanathan,
2013; Williams et al., 2013; Chang et al., 2007; Taylor and Fearne, 2006). There is a
paucity of research addressing the types of information that flow from manufacturers
to retailers (Småros, 2007). Hence, the literature needs to be further extended to
guide partners about what sort of information should be shared with retailers for
better forecasts (Ramanathan, 2013; Barratt and Oliveira, 2001). Following this,
partners’ disagreement during information sharing mostly occur due to inaccurate
data, timeliness, inconsistency and lack of information, which obstruct managing
demand, production and shelf availability (Taylor and Fearne, 2006; Taylor, 2006).
These shortcomings highlight the necessity of maintaining the quality of information
in collaborations, which is essential for the forecasts of time-sensitive and / or short-
life product-groups. Although studies addressed a number of benchmarks to measure
the quality of information (Zhou et al., 2014; Zhou and Benton Jr, 2007), there is not
a rigid benchmark, particularly, evaluating the quality of information that belongs to
food manufacturers and is used in CF for perishable, seasonal, promotional and
newly launched products. Hence, the hypothesis development process of the current

158
research is based on the different Information Types of manufacturers and
Information Quality for better CF in the FSC.
3.2.1.1.Information types
Whilst supply chain performance is dependent on the information being shared in
terms of types, time and the way it is shared (Holmberg, 2000), forecast accuracy
pertains to the characteristics of information (Ramanathan, 2013). These
characteristics can be classified into supplier, manufacturer, customer, retailer and
distribution information (Zhou and Benton Jr, 2007). It is clear that there is a
contradiction between the literature and practice, on whether retailers’ proximity to
customers provides better forecasts (Aviv, 2002; 2001) or if they do not add
additional value to CF (Småros, 2007). The literature is rather lacking in empirical
studies examining the relation between forecast accuracy and bilateral information
sharing between partners in uncertain markets, for instance during promotions (Zhu
et al., 2011).
The benefits of mutually sharing information in collaborations were clearly
uncovered by mathematical models (Zhu et al., 2011). In addition, the literature
previously emphasised how partners’ bilateral information exchange enhances the
benefits of CF during promotions (Fliedner, 2006; Aviv, 2001). This supports the
claim that in response to retailers’ information (e.g. price changes, historical data and
promotional plans) that strengthen manufacturers’ forecasts (Taylor, 2006; Småros,
2003; Aviv, 2002), manufacturers need to share information with retailers to enhance
forecast accuracy as well as visibility in the supply chain. For instance, sharing
production plans of relevant products not only enhances transparency and reduces
forecast errors (Flynn et al., 2010; Zhou and Benton Jr, 2007), but also enables
manufacturers to conduct timely replenishment operations in addition to increased
supply chain performance (Ramanathan and Gunasekaran, 2014; 2012; Lee et al.,
2000). Following this, when the primary focus of forecasts is production for
manufacturers, sharing production related information will allow retailers to
understand the reasons behind the forecasts, which will in turn increase the accuracy
of collaborative forecasts (Zotteri and Kalchschmidt, 2007).

159
In FSC, perishable products (e.g. vegetables and living animals) typically decay
through production and delivery, and this corrodes their quality and reduces retailers’
satisfaction and manufacturers’ revenue. These shortages accordingly give rise to the
importance of production scheduling and the delivery skills of manufacturers,
enabling them to settle effective production, timely deliveries and to minimise
transportation costs (Chen et al., 2009). Therefore, sharing the stock level and
production schedule of relevant products brings about collaborative planning
between partners, and reduces inventory levels along with the associated costs
(Arshinder et al., 2008; Chen and Paulraj, 2004; Karoway, 1997). In doing so,
manufacturers can accurately understand retailers’ short-term demand needs, which
makes it possible to reduce their capacity requirements (Fliedner, 2006).
In response to retailers’ historical information, when manufacturers share recent
information (e.g. environmental factors, weather conditions, product / company
related data and past experience), forecasts become more reliable for partners
(Sanders and Ritzman, 2004). Notwithstanding that the provision of the latest
information is important (Sanders and Manrodt, 2003), sharing such information
provides time-based forecast improvement for retailers, as well as making it possible
to generate more accurate consensus forecasts in partners’ meetings (Lawrence et al.,
2006). The above arguments lead to the following hypothesis:
H7. Sharing various Information Types with retailers has a significant and
positive influence on the CF practice of manufacturers
3.2.1.2.Information quality
Quality of information is one of the major determinants in revealing the extent to
which information transfer meets partners’ expectations through collaborations
(Petersen, 1999). The information sharing literature measured Information Quality
by considering several dimensions, such as accuracy, credibility, timeliness and
currency, which represents the partners’ level of satisfaction from the information
that they exchange (Zhou and Benton Jr, 2007; Vijayasarathy and Robey, 1997;
Neumann and Segev, 1979). Nevertheless, partners in the FSC are not satisfied
through CF due to inaccurate and inadequate data, lack of timeliness, inconsistency

160
and technological obstacles, in which these difficulties worsen their information
sharing process (Småros, 2007; Taylor, 2006; Taylor and Fearne, 2006).
Because Information Quality appears to be a significant performance metric when
partners jointly make decisions through information sharing and in the forecasting
process (Ramanathan et al., 2011; Forslund and Jonsson, 2007), partners, as a
remedy, ought to share accurate and relevant information frequently to feed their
forecasts with reliable information in a timely manner (Zhou and Benton Jr, 2007).
In essence, the underlying reason for this requirement is the necessity of aligning
partners’ supply chain practices based on the quality level of information that they
exchange for better profitability in collaborations (Zhou et al., 2014).
The literature clearly stressed how frequent information exchange improves forecasts
and eases inventory management (Aviv, 2007; 2002; 2001). Because adequate and
timely sharing of accurate information enhances partners’ motivation to generate
reliable forecasts, these practices, per se, show partners’ willingness to share further
information (Du et al., 2012; Webby and O'Connor, 1996). Benefiting from
information sharing likewise relies largely upon partners’ assimilation of the
information received, but sharing relevant information in a timely manner is the
foremost necessity to react to market dynamics and to take required actions in supply
chains (Hartono et al., 2010). For instance, when suppliers in the USA shared the
stock level of relevant products with Wal-Mart, it enabled the retailer to place timely
orders in response to rapid demand changes. This in turn enabled Wal-Mart to have a
competitive price advantage and to reduce inventory costs as well as loss of sales,
and suppliers reduced stock-out and enhanced brand loyalty in the market
(Simatupang and Sridharan, 2002).
Sharing quality information not only relates to the type of information, but also it is
related to partners’ collaborative relation, which is built upon the same vision, trust
and interdependence as well as the willingness to invest in IT systems (Zacharia et
al., 2011; Sinkovics et al., 2011; Li and Lin, 2006; Simatupang and Sridharan,
2002). The support of top managements is also another vital factor in terms of
enhancing Information Quality between partners (Hartono et al., 2010), and among

161
departments (Ireland and Crum, 2005). Correspondingly, if the time-sensitive feature
of perishable, seasonal, promotional and newly launched products is considered
(Ahumada and Villalobos, 2009), the forecasting process needs to be fostered with
various information sources frequently and consistently to generate accurate
forecasts and to become more responsive to rapid demand changes (Danese, 2007;
Taylor and Fearne, 2006). Based on this evidence it is promising to posit that
sustaining quality information sharing between partners is vital for CF. Further,
Information Quality is important for sharing various information sources. In this
respect, manufacturers’ External Integration with retailers seems to be a preceding
step for maintaining Information Quality in CF. Consequently, the current research
finally formulates the following hypotheses:
H2b. External Integration has a significant and positive influence on
Information Quality during the CF practice of manufacturers
H8a. Information Quality has a significant and positive influence on the CF
practice of manufacturers
H8b. Information Quality has a significant and positive influence on various
Information Types during the CF practice of manufacturers
The conceptual model is presented in Figure 3.2, and Table 3.2 summarises the
hypotheses and relevant references underpinning the arguments of the current
research.

162
Source: Developed by the author
Figure 3.2. Conceptual Model
External
Integration Internal
Integration Information
Quality
Information
Types
Forecast
Horizon Group
Forecasting Forecasters’
Competence
The CF practice
Forecast
Satisfaction
Collaborative
Forecasting
Performance
H3b
H3a H2a
H2b
H8a H8b
H7
H4
H5
H6b
H6a
H1a
H1b

163
Table 3.2. Relevant references of hypotheses
Hypotheses Relevant references
Collaborative
Forecasting
Performance
Danese (2011; 2007); Fliedner (2006; 2003); Fischer (2013); Ramanathan and Gunasekaran (2014; 2012); Nyaga et
al. (2010); Noekkentved (2000); Småros (2007; 2003); Vlachos and Bourlakis (2006)
Forecast
Satisfaction McCarthy et al. (2006); Mentzer and Kahn (1995); Yokum and Armstrong (1995)
External
Integration
Adebanjo (2009); Akkermans et al.(1999); Arshinder et al. (2008); Aryee et al.(2008); Aviv (2007; 2002); Barratt
(2004); Barratt and Oliveira (2001); Chang et al. (2007); Chen and Paulraj (2004); Danese et al. (2013); Danese
(2011; 2007; 2006); Devaraj et al. (2007); Droge et al.(2004); Fischer (2013); Frohlich and Westbrook (2001);
Flynn et al. (2010); Fliedner (2006; 2003); Gimenez and Venturea (2005); Ha et al. (2011); Handfield and Nichols
(1999); Hill and Scudder (2002); Helms et al. (2000); Hong et al. (2005); Ireland and Crum (2005); Johnston et al.
(2004); Li and Lin (2006); Mason and Lalwani (2006); Mentzer et al. (2000); McCarthy and Golicic (2002);
Nakano (2009); Power (2005); Ramanathan et al. (2011); Olhager (2013); Olhager et al. (2001); Oliva and Watson
(2011); Ramanathan and Gunasekaran (2014; 2012); Sanders and Manrodt (2003); Sari (2008); Schoenherr and
Swink (2012); Småros (2007; 2003); Sinkovics et al. (2011); Spence and Bourlakis (2009)Taylor and Fearne (2006);
Taylor (2006); Thomé et al. (2012); Van der Vaart et al. (2012); Van der Vaart and Van Donk (2008); Vickery et al.
(2003); Vlachos and Bourlakis (2006); Vlajic et al. (2012); Yan and Dooley (2014); Zacharia et al. (2011); Zhao et
al. (2011); Zhou and Benton Jr, (2007)
Internal
Integration
Adebanjo (2009); Akkermans et al. (1999); Aryee et al. (2008); Barratt and Oliveira (2001); Braunscheidel and
Suresh (2009); Chang et al. (2007); Chen et al. (2000); Danese et al. (2013); Danese (2007; 2006); Davis and
Mentzer (2007); Droge et al.(2004); Fliedner (2006; 2003); Flynn et al. (2010); Francis et al. (2008); Kaipia (2008);
Handfield and Nichols (1999); Helms et al. (2000); Hill and Scudder (2002); Lockamy II and McCormack (2004);
Mason and Lalwani (2006); Mentzer et al. (2000); Nakano (2009); Olhager (2013); Olhager et al. (2001); Oliva and
Watson (2011); Paiva (2010); Paulraj et al. (2008); Power (2005); Ramanathan et al. (2011); Ramanathan and
Gunasekaran (2014; 2012); Sari (2008); Schoenherr and Swink (2012); Småros (2007; 2003); Stevens (1989);
Taylor and Fearne (2006); Taylor (2006); Thomé et al. (2012); Van der Vaart et al. (2012); Vickery et al. (2003);
Vlajic et al. (2012)Williams et al. (2013); Yan and Dooley (2014); Zhao et al. (2011)
Forecast Horizon Aburto and Weber (2007); Aviv (2002; 2001); Fildes and Goodwin (2007); Klassen and Fores (2001); McCarthy et
al. (2006); Mentzer and Kahn (1995); Småros (2007; 2003); Thomassey (2010); Zotteri and Kalchschmidt (2007)
Group
Forecasting
Aviv (2001); Davis and Menter (2007); Frewer et al. (2011); Graefe and Armstrong (2011); Helms et al. (2000);
Ireland and Crum (2005); Kerr and Tindale (2011); Lawrence et al. (2006); Önkal et al. (2012; 2011); Rowe and
Wright (2011; 1999); Siefert (2003); Småros (2007; 2003); Van Bruggen et al .(2010); Van de Ven and Delbecq
(1974; 1971)
Forecasters’
Competence
Aviv (2001); Bolger and Wright (2011); Davis and Menter (2007); Edmundson et al. (1988); Fildes et al. (2009);
Fliedner (2006; 2003); Flynn et al. (2010); Ireland and Crum (2005); Goodwin and Fildes (1999); Ha et al. (2011);
Kerr and Tindale (2011); Lawrence et al. (2006); McCarthy Byrne et al. (2011); McCarthy et al. (2006); Moon et al.
(2003); Oliva and Watson (2011); Önkal et al. (2013; 2012; 2011); Rowe and Wright (2011; 1999); Sanders and
Manrodt (1994); Sanders (1997); Sanders and Ritzman (2004); Småros (2007); Sniezek (1989); Syntetos et al.
(2009); Van Swol (2011); Vlachos and Bourlakis (2006); Webby and O’Connor (1996)
Information Types
Ahumada and Villalobos (2009); Arshinder et al. (2008); Aviv (2002; 2001); Barratt and Oliveira (2001); Chang et
al. (2007); Chen et al. (2009; 2000); Chen and Paulraj (2004); Danese (2011; 2007; 2006); Danese and
Kalchschmidt (2011); Du et al. (2009); Fliedner (2006); Flynn et al. (2010); Holmberg (2000); Karoway (1997);
Larsen et al. (2003); Lee at al. (2000); Nakano (2009); Ramanathan and Gunasekaran (2014; 2012); Ramanathan
(2013; 2012); Sanders and Ritzman (2004); Sanders and Manrodt (2003); Sinkovics et al. (2011); Småros (2007;
2003); Thomé et al. (2012); Thonemann (2002); Taylor and Fearne (2006); Taylor (2006); Van Swol (2011); Vlajic
et al. (2012); Zacharia et al. (2011); Zhu et al. (2011); Zhou and Benton Jr, (2007); Zotteri et al. (2005); Zotteri and
Kalchschmidt (2007)
Information
Quality
Aviv (2007; 2002; 2001); Barratt and Oliveira (2001); Cachon and Fisher (2000); Danese (2007); Du et al. (2012);
Du et al. (2009); Fischer (2013); Fliedner (2006); Forslund and Jonsson (2007); Hartono et al. (2010); Kerr and
Tindale (2011); Li and Lin (2006); Li and Wang (2007); Mendelson and Pillai (1998); Neumann and Segev (1979);
Oliva and Watson (2011); Özer et al. (2011); Peterson (1999); Ramanathan et al. (2011); Ramanathan, (2012);
Simatupang and Sridharan (2002); Småros (2007; 2003); Taylor and Fearne (2006); Taylor (2006); Thonemann
(2002); Vijayasarathy and Robey (1997); Vlajic et al. (2012); Webby and O’Connor (1996); Zhao et al. (2002);
Zhou and Benton Jr, (2007); Zhou et al. (2014); Zotteri et al. (2005)
Source: Developed by the author

164
3.3. Summary
In conclusion, this chapter has elaborated the theoretical concepts of Whetten (1989).
The theoretical concepts of “what, how, why and the combinations of who, where
and when” enabled the current research to construct the CF practice and to build
associated hypothetical relationships on a conceptual model in a legitimate and
theoretical way. For instance, the concept of “what” guided this research to select
constructs (or factors / hypotheses) and their variables in a logical way by adding
further insight into their impact on the CF problems of manufacturers, which prevent
long-term and accurate CF in the FSC. Then, by following the concept of “how”, the
aim became to add more understanding to the relation between constructs and
variables. Thus, the current research provided further understanding of the
hypothesised relationships discussed, and then built the complete form of the
conceptual model, which indicates the direction of the arrows between hypotheses.
The theoretical concept of “why” then played a guideline role not only in justifying
the selection of constructs and variables, but also in adding more insight into the
underlying causality between hypotheses in the conceptual model. Therefore, the
current research advocates hypothetical relationships in a rational way, and allows
the reader to judge how compelling and rational the contributions are to extend the
existing knowledge in the literature. Further to this, following a rigid theoretical
approach consolidates the argument on the conceptual model that aims to enhance
long-term and accurate CF as well the forecast satisfaction of manufacturers.
Thereby, food practitioners can interpret how the conceptual model will enhance
long-time and accurate CF when perishable, seasonal, promotional and newly
launched products are subject to their collaborations in the FSC.
Finally, the theoretical concept that combines "who, where and when” represents the
limitations of the current research. In other words, the research contributions will be
generalised under the particular circumstances that made it possible to build
hypothetical relationships and the conceptual model. For instance, the findings will
be based on dyadic manufacturer-retailer collaborations in the FSC. The conceptual
model offered is limited to the point of view of manufacturers, who are located in the
UK & Ireland, Europe and North America. The conceptual model therefore does not

165
represent the opinion of retailers in CF. Arguments of the current research are
likewise restricted to the time-sensitive and / or short-life product-groups (e.g.
perishable, seasonal, promotional and newly launched products). These limitations in
turn open new research fields for the academic field to be able to extend the body of
the literature.
As far as the CF practice offered in this research is considered, it has been built upon
the two major performance criteria. They are (i) to guide manufacturers to conduct
long-term CF with retailers, and (ii) to improve the forecast accuracy of perishable,
seasonal, promotional and newly launched products that partners collaborate on. It is,
however, clear that organisations in practice have different strategic and operational
objectives, and this pragmatic vulnerability is likely to influence the reliability of the
aforementioned accuracy criterion. In other words, when manufacturers collaborate
with retailers, forecast accuracy may not be the primary objective of collaboration.
Instead, partners are likely to aim at increasing supply chain performance and / or
reducing inventory costs. Therefore, the current research has built a new construct
that represents manufacturers’ forecast satisfaction with perishable, seasonal,
promotional and newly launched products. This approach not only enhances the
reliability of this CF practice from practitioners’ point of view, but also brings a new
dimension to the forecasting literature by offering a new benchmark for evaluating
the value of forecasts.
The CF practice for manufacturers has been constructed of five preconditions that
form its complete domain. They are (i) trust, (ii) commitment and (iii) joint business
plan as well as (iv) consensus-based internal forecasts along with (v) sharing of order
forecasts. By relying on the plethora of prior research conducted in the field, trust
and commitment became the two major variables of the CF practice. The reason
behind these variables is to sustain manufacturers’ willingness to contribute to
information sharing and the forecasting process with retailers, and committing to this
continuity is most likely to build permanent partnerships in CF. Then, linking the
business plan with the retailers’ plan has been the following prerequisite for this CF
practice. The logic here is to synchronise partners’ strategic objectives in a single
business plan to be able to ease the front-end agreement process in CF. In doing so,
166
partners will be able to conduct forecast collaborations in a transparent way by
knowing the decisions should be made beforehand.
As regards the consensus-based internal forecasts, this has been another antecedent
of the CF practice as a remedy for manufacturers’ lack of cross-functional
integration between their departments. Given the departments’ multiple forecasts,
which cause internal-external disputes in CF, this variable assists manufacturers to
generate a single consensus-based forecast before initiating the collaborative forecast
process with retailers. This single forecast, which has the full support of all
departments, is most likely to underpin consensus forecasts with retailers. Finally,
the CF practice involves the variable of the sharing of order forecasts, which aims to
enhance transparency on the forecast objectives of manufacturers. While
manufacturers improve their order forecasts based on inventory strategies to manage
production and delivery, retailers’ order forecasts are lacking in such modifications.
This disconnection gives rise to conflicts when partners meet to aggregate their order
forecasts. Because partners’ order forecasts represent different objectives, they aim
to aggregate forecasts at a different level. Whereas, in case of informing retailers
about the changes made on forecasts, they will have a clear understanding of why the
manufacturers modified the forecasts. Thereby consensus forecasts will be generated
without having disagreements in meetings. This is the main logic behind instructing
manufacturers to share order forecasts with retailers based on the CF practice.
To be able accomplish this aforementioned CF practice in the FSC, the current
research has developed its arguments on the three research themes: supply chain
integration, the forecasting process and information sharing. These research themes
made it possible to offer a wide range of hypothetical relationships and to defend
their impact on the CF of manufacturers in a reasonable way. For instance, by
relying on the research theme of supply chain integration, the hypothetical argument
not only encapsulated manufacturer’s external relation with retailers, but also
extended the discussion to the internal level by considering their interdepartmental
relation as an extension of external relations with retailers. Externally,
manufacturers’ relation with retailers was debated based on their flexibility and
dependency on collaborations. These determinants seem to be essential to cope with

167
market dynamics and unexpected conflicts in collaborations. Technological
difficulties between partners were then considered, in which such challenges in
practice worsen information sharing and therefore negatively affect partners’ CF. It
was essential to highlight the role of top management, as they play a vital role in
creating a promising platform to get full benefit from CF.
Internally, the focus of the current research involved manufacturers’ capability to
exhibit effective delivery operations and inventory management. Due to their long
lead-times in production and / or replenishment operations, manufacturers need to
improve these skills to rapidly react to the instant demand changes of time-sensitive
and / or short-life products. Improving cross-functional communication between
departments via effective IT systems was then highlighted to enhance visibility in
their information sharing process. Given the fact that the European grocery sector
witnessed manufacturers, who lost information within their departments, it is also
necessary to record related data within manufacturers to feed forecasts with
transparent information. Apart from these arguments, the current research stressed
the benefits of S&OP as an alternative solution for better integration between the
departments of manufacturers. Although this subject has not been in a hypothetical
relationship, the current research rationally discussed the benefits of linking S&OP
to manufacturers’ CF by relying on academic research and pragmatic evidence, such
as collaborations between Lowe’s and Whirlpool.
Regarding the theme of the forecasting process, the current research has addressed
the horizon of forecasts for associated product-groups, partners’ group meetings and
the competence of forecasters that is required in these meetings. While simulation
studies presumed that there is not a challenge between partners for the horizon of
forecasts for long-life products, case studies illustrated partners’ disagreements about
the forecast horizon of short-life products. Although a number of past studies
addressed this issue when different forecasting methods were compared, the results
did not seem beneficial due to the long-time periods that were involved for the
horizon of forecasts, such as from three months to two years. A limited number of
studies revealed that the horizon of forecasts are on a monthly basis in several
industries, but there is a scarcity of research addressing the horizon of forecasts in

168
the FSC. The current research therefore encapsulated the forecast horizon of time-
sensitive and / or short-life products from manufacturers’ point of view.
It is apparent that partners’ forecasting meetings involve several conflicts and
disagreements that prevent consensus, such as their irregular meetings, uncertain
decision making procedures and the impact of hierarchy, as well as inefficient
discussions along with incompetent data usage in meetings. The importance of these
conflicts escalates when time-sensitive and / or short-life products are the subject of
meetings. Whilst the literature offers a wide range of meeting techniques, this
research addressed these techniques as a remedy to partners’ disagreements. This is
the reason behind the argument of the current research in advocating the impact of
forecasting meetings on the CF of manufacturers. When the focus is forecasting, it is
imperative to consider the competence of forecasters in meetings. In addition to their
market based experience of the products involved in CF, their reciprocal behaviours
are crucial for both forecast accuracy and consensus in meetings. These behaviours
that were taken into account by the current research capture their advice and
feedback given to each other, motivation and willingness to have a consensus as well
as having confidence in each other along with being satisfied with final order
forecasts.
Finally, the current research extended the discussions to manufacturers’ information
sharing based on the different types of information that are required for CF as well as
their quality. Unlike prior studies, the focus here became the analysis of different
types of information that flow from manufacturers to retailers. There is a surfeit of
research highlighting the necessity of diverse information types, but all associated
sources belong to retailers, such as promotions, inventory and POS data. There is not
solid empirical work that addresses the value of manufacturer information for CF. To
close this gap in the literature, the current research pointed to the impact of
inventory, production planning and scheduling related information along with the
data that involve recent internal-external changes in terms of manufacturers.
The quality of associated information types became another interest of the current
research. It is clear that sharing diverse information without losing its value is a vital

169
factor for accurate forecasts of time-sensitive and / or short-life products. It is also
known that partners’ satisfaction from information sharing is related to the value of
the information shared. This engenders further prominence for the current research
due to its intention of exploring the ways of satisfying partners through information
sharing for promising CF. This is the logic behind the fact that current research
interrogated how manufacturers’ CF can be better when relevant and accurate
information is shared frequently and in an adequate form. Further to this, this
research debated manufacturers’ effective response rate, when on time and consistent
information sharing takes place between partners.

170
4. CHAPTER 4: RESEARCH METHODOLOGY AND
DATA COLLECTION
4.1. Overview
To be able to theoretically validate the hypothetical arguments that were presented
previously, this chapter explains the research methodology in-depth. Because the
research philosophy adopted plays an important role on the methodological approach
for academic research, reasonable discussions are provided on the philosophical
stance of the current research. In particular, both the research approach and the
epistemological paradigm embraced are clarified in a justifiable way. Discussions
then encapsulate existing research strategies, as it is important to follow a solid
strategy to achieve the research aim and objectives. Further clarification is brought to
the research design that was followed to complete the research process in a logical
way.
This chapter portrays the strategic research process in a flowchart and provides
transparency to the data collection process. Because alternative data collection
strategies are addressed, the intention, then, becomes to justify the logic behind
following a mixed design (triangulation). Presenting the structural and chronological
data collection process provides further transparency to the research. Justifications
also involve the benefits of the social networking sites used for the data collection
process. In this way, this chapter addresses the qualitative data collection process and
explains the motives for employing the associated qualitative data collection
methods along with the data analysis procedures. The qualitative data collection
process was also discussed to provide awareness of the impact of qualitative data on
the research. Consequently, this chapter;
Explains the quantitative data collection process and rationale for the
employment of an online survey questionnaire along with the clarification of the
survey questionnaire design.
Provides a rationale for the target population and sampling frame, explains the
sampling technique and sample size, and elucidates the stages followed to
collect quantitative data.

171
Assesses the sample size and response rate, and justifies their validity based on
data characteristics, comparison analyses and alternative data analysis
techniques.
Validates the cohesiveness of the associated data analysis technique by
comparison with the alternative techniques used by prior studies.
4.2. Rationale for research methodology
4.2.1. Research approaches and philosophies
There is a broad consensus that it is legitimate for any academic research to describe
research approaches and philosophies beforehand in an attempt to bring clarity to its
methodological stance in the field (Wilson, 2010; Lee and Lings, 2008; Bryman and
Bell, 2007). Regarding the foremost objectives of academic studies, which are to
contribute to knowledge, methodology and to practice, it is worth describing the
research as a way of “generating knowledge about what you believe the world is”
(Lee and Lings, 2008, p. 6). Nevertheless, the way of generating knowledge rests
upon the approach and the assumption that the research assimilates over the
methodology that it follows.
The nature of research embraces two diverse approaches: deductive and inductive
approaches (Wilson, 2010; Creswell, 2003). While the deductive approach “begins
with and applies a well-known theory”, the inductive approach, in contrast, is a
“theory building process, starting with observation of specific instances, and seeking
to establish generalisation about the phenomenon under investigation” (Hyde, 2000,
p. 83). Unlike the inductive approach, the deductive approach is a process of
building conclusions through logical and rational arguments and extending
knowledge over a particular theory (Lee and Lings, 2008; Ghauri and Grønhaug,
2005). This is because the deductive approach “is concerned with developing
hypothesis (or hypotheses) based on existing theory, and then designing a research
strategy to test associated hypotheses” (Wilson, 2010, p. 7). This principle of the
deductive approach gives the researcher responsibility to argue hypothetical
relationships in a persuasive way and to justify causalities based on quantitative data
(Saunders et al., 2007).

172
If research is based on an inductive approach, its process commences from
observations by looking for opportunities to generalise a particular theory (Lee and
Lings, 2008). This perspective involves the qualitative research strategy, unlike the
deductive approach (Bryman and Bell, 2007). By relying on qualitative research, the
inductive approach allows the researcher to gain more insight into the research
context, and to be flexible by allowing changes through the research process
(Wilson, 2010). This flexibility is most likely to expand through the progress of
research, and makes it possible to realise that research is only a part of the research
process. The deductive approach, however, needs a more structured approach, and
gives priority to focus on the samples on the target population to be able to
generalise findings (Saunders et al., 2007). The distinctive features of these two
research approaches are presented in Table 4.1.
Table 4.1. Major differences between deductive and inductive approaches to
research
Deduction emphasizes Induction emphasizes
*Scientific principles *Gaining an understanding of the meanings
humans attach to events *Moving from theory to data
*The need to explain causal relationships between
variables
*A close understanding of the research
context
*The collection of quantitative data
*The collection of qualitative data
*The application of controls to ensure validity of
data
*The operationalization of concepts to ensure clarity
of definition
*A highly structured approach
*A more flexible structure to permit changes
of research emphasis as the research
progresses
*Researcher independence of what is being
researched
*A realization that the research is part of the
research process
*The necessity to select samples of sufficient size in
order to generalize conclusions *Less concern with the need to generalize
Source: Wilson (2010, p. 7); Saunders et al. (2007)
While these research approaches guide the researcher to generate knowledge in a
legitimate way, the philosophical stance then sheds further light on the knowledge
generation process (Lee and Lings, 2008). There are two major research
philosophies, also called paradigms, which add insights into the nature of knowledge
from the researcher’s standpoint (Wilson, 2010; Mangan et al., 2004). In detail,

173
research philosophy is dependent upon the researcher’s views, which guide him / her
to decide the way of generating knowledge for academic research (Wilson, 2010). To
have a clear understanding about how the researcher will conceive the research, it is
imperative to understand research philosophies. For instance, Easterby-Smith et al.
(2002) highlighted three fundamental reasons why research philosophies need to be
understood clearly.
Firstly, because research philosophies make it possible to have a clear understanding
of how the research should be designed. In other words, the researcher develops a
clear wisdom about what sort of evidence is required, what the way to collect the
associated evidence is and how evidence should be inferred. Secondly, because
research philosophies clarify which research design is the best. To put it in another
way, the researcher identifies the way of choosing the correct method/s to collect
rigorous evidence and to interpret it in a justifiable way. Finally, because research
philosophies guide the researcher to build and adopt correct research design based on
a theory or phenomenon that is the focus of research. In this way, the researcher has
a philosophical insight into choosing a proper research design based on the
phenomenon of interest.
There are four different world-view elements that add further understanding to the
research philosophies, perception and values of the researcher and way/s of
conducting the research. They are epistemology, ontology and axiology as well as
methodology (also called research strategy) (Wilson, 2010; Lee and Lings, 2008). To
start with, epistemology relates to the nature of knowledge. The major question that
epistemology asks is “what is acceptable knowledge?” (Wilson, 2010, p. 10).
Epistemology wants to know “whether or not the social world can and should be
studied according to the same principles, procedures and ethos as the natural
sciences” (Bryman and Bell, 2007, p. 16). Consequently, epistemology involves two
different research philosophies / paradigms: positivism and interpretivism, which are
compared in Table 4.2. (Wilson, 2010; Lee and Lings, 2008).

174
Table 4.2. Epistemological research philosophies / paradigms
Positivism Interpretivism
Research approach *Deductive *Inductive
Ontological stance *Objective / objectivism *Subjective / subjectivism
Axiological value *Value free *Biased
Science *Scientific *Social / Humanistic
Focus of researcher
*Facts
*Causality
*Hypothetical relationship
*Meaning / perception
*Understand the logic behind in
detail
*Development of rational ideas
Methodology *Quantitative research *Qualitative research
Source: This table was constructed by purifying diverse information from: Easterby-Smith
et al. (1991); Hussey and Hussey (1997), Lee and Lings (2008), Mangan et al. (2004) and
Wilson (2010)
The research philosophy of positivism is largely objective, and the researcher has
minimum interaction with the participants of the research. These participants are
likely to be interviewees, group attendees and / or respondents to the survey (Bryman
and Bell, 2007). This philosophical stance therefore prevents the researcher from
adding personal bias into the research process. Therefore, it relies on the empirical
research to enhance the reliability of the findings, and research should be conducted
in a structured format by adopting the deductive approach, called the quantitative
data collection strategy (Wilson, 2010).
On the other hand, interpretivism is “an epistemology that supports the view that the
researcher must enter the social world of what is being examined” (Wilson, 2010, p.
11). The researcher that adopts an interpretivist stance is fully subjective, and
interacts with the participants of the research. Contrary to positivism, interpretivism
therefore allows the researcher to contribute to the research processes with personal
bias. This is because the researcher needs to embrace the inductive approach, which
relies on the qualitative data collection strategy (Lee and Lings, 2008). The
epistemological approach of interpretivism requires a high level interpretation, hence
it is likely to cause problems with regard to the reliability of findings. Because the
inductive approach is considered, the objective of interpretivism is not to generalise
findings. It is rather interested in illustrating the subjective judgments of the
researcher based on research findings (Wilson, 2010).
175
The second world-view element, ontology, is about the nature of reality. Based on
ontology, the researcher has to make a decision whether s/he considers “the world is
external to social actors, or the perceptions and actions of social actors create social
phenomena” (Wilson, 2010, p. 11). The physiological logic behind ontology is to
understand how the researcher perceives the social world. Therefore, ontology asks
“what the world we are studying actually is” (Lee and Lings, 2008, p. 11). The
researcher will decide whether s/he will adopt a subjective or an objective stance in
the research process. While the subjective stance is dependent upon the research
philosophy of interpretivism, the objective stance, in contrast, relies on positivism,
which is truly objective (Wilson, 2010). Subjectivism encourages the researcher to
understand the logic behind subjective ideas and attitudes, and therefore the
researcher has a responsibility to interact with participants of the research. On the
other hand, the ontological stance of objectivism assumes that the social phenomena
are associated with external reality. This is because objectivism relies on the research
philosophy of positivism and is based on high level reality (Wilson, 2010).
Regarding the world-view element of axiology, it is related to the aim of the
research, and clearly asks: “What are you trying to do? do you try to explain and
predict the world or are you only seeking to understand it? can you even do one
without the other?” (Lee and Lings, 2008, p. 11). This definition of axiology shows
the concern about the perceptions of the researcher. Because axiology is about the
nature of value, the researcher’s value plays an important role through the research
process. If the researcher is positivist, his/her value is not influential in the research
process owing to its ontological stance of objectivism, representing the positivist
research philosophy. If the researcher is interpretivist, his/her value is important and
should be linked to the research. This represents the ontological stance of
subjectivism that is associated with the epistemological paradigm of interpretivism.
Accordingly, the researcher needs to show enormous effort not only through the data
collection, but also during the interpretation of results to present valid findings to the
theory (Wilson, 2010).
The final world-view element is methodology. Methodology asks; “how you are
going to go about your research” (Lee and Lings, 2008, p. 12). The answer to this

176
question relies largely on the aforementioned research philosophies and the
ontological stance of the researcher as well as the axiological value, which clarifies
whether or not the values of the researcher will be related to the research. There are
two alternative research methodologies that can be followed: qualitative and
quantitative methodologies (Wilson, 2010). Nevertheless, there is a broad agreement
that whichever research philosophy and stance is adopted in the research, the
researcher has to generate knowledge in a rational and justifiable way and to
rigorously argue the validity of the findings (Wilson, 2010). This requirement
consequently raises the importance of triangulation or mixed design (Creswell and
Plano Clark, 2011), which is “the combination of qualitative and quantitative
approaches in the methodology of a study” (Tashakkori and Teddlie, 1998, p. ix).
This strategy, mixed design, is further elaborated in the following section.
In summary, by relying on the aforementioned rationalisations, the current research
is built upon the deductive approach. The logical justification for embracing this
approach is fourfold. Firstly, the current research focuses on the well-known CF
phenomenon to improve Collaborative Forecasting Performance from the
manufacturers’ point of view in the FSC. Hence, findings are based on the existing
theory, and the intention is to generate new knowledge by extending the extant
literature dedicated to CPFR. In other words, the current research moves from theory
to data (Wilson, 2010; Saunders et al., 2007). Secondly, the contributions of this
research are associated with the hypothetical relationships, in which causalities
among the hypotheses are portrayed in the conceptual model (Jick, 1979).
Thirdly, although qualitative information was gathered through the hypothesis
development process, hypothetical relationships are validated as a result of the
quantitative research strategy, which requires a sufficient sample to generalise
findings for the target population. This necessity, therefore, enables the current
research to follow a highly structured data collection process (Hyde, 2000). Finally,
this research is fully objective and the bias of the author is precluded from the
research process. The reason behind that is that during the quantitative data
collection process, there was minimum interaction between the participants and the
author of the current research (Wilson, 2010).

177
As far as the philosophical stance is concerned, due to the fact that the deductive
approach is followed, this research’s epistemological paradigm is based on
positivism. The reason behind embracing this research philosophy relies on the
research’s quantitative research strategy, which involves highly structured empirical
research employed to generalise findings for the target population. In doing so,
contributions are presented in an objective way by reflecting the results of empirical
analyses (Lee and Lings, 2008). Following this, the author of the current research
perceives that the research phenomenon of CF is dependent upon external factors. To
put it another way, the ontological stance of the author is objectivism. The author
purposed to conduct an objective study and to generalise findings about the specific
phenomenon of CF, rather than merging subjective views and attitudes in the results
of the research (Wilson, 2010). This is the logic behind the contributions of the
current research being accurately presented in a rational way.
In parallel to the research philosophy and the ontological stance, the value of the
author is absent from the research process. The author’s personal attitudes and
beliefs were omitted from the research process. Thereby, the axiological value of the
current research is value free, and research findings are objectively conveyed to the
reader in a persuasive way (Wilson, 2010; Bryman and Bell, 2007). Finally, the
research methodology in this research involves both qualitative and quantitative
research strategies. This attitude makes it possible to capture a wide range of data
and to provide rigorous contributions to theory, methodology and practice (Creswell
and Plano Clark, 2011; Mangan et al., 2004; Hussey and Hussey, 1997). The
methodological aspect of the current research is summarised in Table 4.3, and the
research strategies are further justified in the following section.

178
Table 4.3. Methodological aspect of the current research
Aspect Type Rationale
Approach Deductive
*Moving from the CF phenomenon to quantitative data
*Contributing to knowledge based on hypothetical relationships
*Conducting a truly objective and quantitative data collection process
*Testing hypotheses based on empirical analysis
*Generalising research findings for the target population
Epistemology
(Research
philosophy)
Positivism
*Embracing the deductive approach
*Building a highly structured data collection and analysis process
*Sustaining a minimum interaction with the participants of the
research during the quantitative data collection process
*Omitting the personal bias of the author from the research process
Ontology Objectivism
*Adopting the research philosophy of positivism
*Conducting a truly objective quantitative data collection process
*Precluding the subjective views of the author from the research
process
*Accurately presenting the research findings by relying on empirical
analyses
Axiology Positivist
*Having the ontological stance of objectivism
*Excluding the personal value of the author from the research process
*Following a truly objective and quantitative data collection process
*Objectively conveying the research findings to the reader without
adding the subjective judgements and / or beliefs of the author
Perspective Critical
*Developing the preliminary research propositions through the
systematic review of literature
*Limiting the number of propositions through the critical analysis of
the single semi-structured interview
*Delimiting the number of propositions through the critical analysis of
the three online group discussions
*Developing the research hypotheses over the residual propositions
through the critical review of grey literature
Design Descriptive
*Focusing on a particular research phenomenon of CF
*Reviewing the literature over the research themes of:
-Supply chain integration
-Forecasting process
-Information sharing
*Developing both quantitative and qualitative research strategies
*Contributing to theory by way of objective and explanatory findings
Level Organisation
*Focusing on the food industry
*Investigating dyadic manufacturer-retailer forecast collaborations
*Analysing forecasts collaborations from the manufacturers’ point of
view
*Examining forecast collaborations for perishable, seasonal,
promotional and newly launched products
Explanation Systematic
*Systematically reviewing the literature over the research themes of:
-Supply chain integration
-Forecasting process
-Information sharing
*Conducting a systematic and sequential data collection process
*Conducting a systematic and sequential data analysis process
*Conveying the research process and the findings of the research to
the reader in a systematic and sequential way
Abstraction Empirical *Empirically analysing the hypothesised relationships of the research
*Statistically demonstrating the reliability of the conceptual model
*Empirically contributing to the forecasting and SCM literature
Source: Developed by the author

179
4.2.2. Research strategies and triangulation
The preceding section scrutinised major differences between two diverse research
approaches as well as research philosophies. In addition, the concomitant stances of
the ontology and axiology were elaborated while two different research strategies
were remarked on in relation to these approaches and philosophies. This elaboration,
in essence, intended to add further understanding to the philosophical stance of the
current research. To shed light on the methodological strategy, it is worth remarking
that the deductive approach and the positivist research philosophy are linked to the
quantitative research strategy to test theory-based hypotheses (Wilson, 2010;
Creswell, 2003). Conversely, the inductive approach and the interpretivist research
philosophy are connected with the qualitative research strategy to generalise a new
theory (Wilson, 2010; Bryman and Bell, 2007).
The quantitative research strategy is based on numerical analysis to validate findings.
This is because, “quantitative studies emphasize the measurement and analysis of
causal relationships between variables, not processes” (Denzin and Lincoln, 2000, p.
8). Given the major objective of quantitative research is generalising findings from a
target population (Wilson, 2010), the researcher needs to designate the common
characteristics of the target population rather than focusing on details. To accomplish
this, it is essential to “draw a large and representative sample from the population of
interest, measure the behaviour and characteristics of the sample, and attempt to
construct generalisations regarding the population as a whole” (Hyde, 2000, p. 84).
Therefore, a survey questionnaire seems to be the most common quantitative data
collection method to arrive at the sample of the target population (Wilson, 2010).
On the other hand, the qualitative data collection strategy comprises qualitative
methods that put an emphasis on words instead of numbers, unlike quantitative
methods (Bryman and Bell, 2007; Creswell, 2003). This is because qualitative
research is more about analysing the social world and its participants from the
perspective of the researcher, which requires the subjective interpretation of research
findings (Bryman and Bell, 2007). Contrary to quantitative research, qualitative
research focuses on details and scrutinises the underlying reasons behind the logic
(Näslund, 2002). Hence, qualitative researchers need to stay close to the research

180
participants, such as by using interviews and observations (Wilson, 2010). The
associated data collection methods of these research strategies are presented in Table
4.4.
Table 4.4. Data collection methods of research strategies
Method
Methodology
Quantitative research Qualitative research
Observation *Preliminary work, e.g. prior to
framing questionnaire
*Fundamental to understanding
another culture
Textual analysis *Content analysis, i.e. counting in
terms of researchers’ categories
*Understanding participants’
categories
Interviews *‘Survey research’: mainly fixed-
choice questions to random samples
*‘Open-ended’ questions to small
samples
Transcripts *Used infrequently to check the
accuracy of interview records
*Used to understand how participants
organize their talk and body
movements
Source: Silverman (2010, p. 123; 2006, p. 19)
Overall, both qualitative and quantitative research strategies have strengths and
weaknesses; however, their weaknesses have engendered a general contradiction in
the academic field. For instance, the subjective perspective of the qualitative
research strategy appeared to be its blind side in the academic field. Particularly,
given the bias of the researchers, which occurs due to his/her subjective judgments
on qualitative findings, such research is lacking in objective contributions (Bryman
and Bell, 2007). Therefore, it becomes problematic not only to generalise findings
for a particular population (Creswell and Plano Clark, 2011), but also to replicate
similar research due the restrictions of scrutinising reality (Bryman and Bell, 2007).
Following this, although qualitative research makes it possible to gather detailed
data, owners of data consist of a limited number of individuals (Patton, 1991) and
diverse views of individuals are not representative of target population, which limits
the reliability of findings (Silverman, 2010).
On the other hand, quantitative research is criticised in terms of neglecting details
and excluding individuals from the social world (Wilson, 2010). It is argued that
following such a superficial process limits the understanding of the social world
(Payne and Payne, 2004). Another criticism was raised due to the lack of context in
quantitative research, where participants of such research can be neither observed

181
nor heard in the research process (Creswell and Plano Clark, 2011). This, in turn,
omits such research from exploring details and taking into account personal attitudes,
while excluding the subjective bias of the researcher inhibits the research from
uncovering complexity in the social world (Bryman and Bell, 2007).
Therefore, the general paradox over these research strategies gave raise to
disagreements between researchers and theorists, and these strategies were adopted
as completely diverse paradigms (Bryman and Bell, 2007; Tashakkori and Teddlie,
1998). While this divergence seemed to be “considerable blurring” by some others
(Hussey and Hussey, 1997, p. 47), some authors labelled it as a “paradigm war”
(Tashakkori and Teddlie, 1998, p. 11). Apart from these arguments, there are authors
who disapproved of such a distinction between qualitative and quantitative strategies
(Tashakkori and Teddlie, 1998). As a remedy, Howe (1988) offered the paradigm of
pragmatism, arguing that the quantitative and qualitative research strategies need to
be brought together. Based on the pragmatic paradigm, researchers are “free to
choose the methods, techniques, and procedures of research that best meet their
needs and purposes” (Creswell, 2003, p. 12).
This paradigm allows the researcher to use both quantitative and qualitative methods
in a single study, and this combination constitutes the notion of triangulation or
mixed methods (Creswell and Plano Clark, 2011; Tashakkori and Teddlie, 1998). In
time, a wide variety of definitions has developed for mixed methods. For instance,
former literature defined this triangulation as “the combination of methodologies in
the study of the phenomenon” (Denzin, 1989, p. 234). Creswell and Plano Clark
(2011, p. 2) then provided a stronger description, and defined mixed methods as
“those that include at least one quantitative method (designed to collect numbers)
and one qualitative method (designed to collect words), where neither type of
methods is inherently linked to any inquiry paradigm”. There is a broad consensus
that a mixed method is very beneficial to gather reliable and diverse information to
provide rigorous contributions to the literature and practice (Mangan et al., 2004;
Deshpande, 1983; Jick, 1979; Webb et al., 1966).

182
In essence, a mixed method draws its strength by joining the strengths of the
qualitative and quantitative research strategies, and answers questions that cannot be
answered by only quantitative or qualitative research (Creswell and Plano Clark,
2011). Because of the fact that qualitative and qualitative research strategies convey
the power of diverse philosophical stances, the mixed method seems a rigorous
research strategy to close gaps in management research. By relying on the paradigms
of positivism and interpretivism (also called phenomenology), Mangan et al. (2004,
p. 568) explained this rationale as follows: “positivism is relevant for getting an
overview and for considering the board structure of decisions, whereas
phenomenology is useful for finding out the microlevel about the behaviour of the
decision maker.”
Jick (1979) supported the idea that using a mixed method makes it possible to
explore unforeseen sides of a particular phenomenon and to augment the
implications of findings. By advocating the benefits of mixed methods, Webb et al.
(1966, p. 3) likewise stressed that “the most persuasive evidence comes from a
triangulation of measurement processes”. Given the fact that qualitative research
strategy embraces the bias of the researcher (Wilson, 2010), Hussey and Hussey
(1997) defended the reliability of mixed methods, since triangulation of both
qualitative and quantitative methods is more likely to mitigate bias compared with a
single method. From the logistics and SCM perspective, Näslund (2002) argued that
mixed methods are the most appropriate strategy if the aim is to build rigorous
research in logistics.
In a similar vein, Mangan et al. (2004) highlighted the benefits of mixed method,
and described its application to a study, dedicated to the Irish logistics sector. These
authors also encouraged researchers to triangulate qualitative and quantitative
research strategies for multifaceted contributions to management research. A study
by Evangelista et al. (2013) is another example for the mixed method. When these
authors aimed to explore the role of IT systems on the logistics process of small and
medium sized third party logistics providers, the combination of survey
questionnaire, focus groups and case studies constituted their triangulation research
strategy. Providing a guideline to researchers for the usage of mixed methods also

183
became one of the important contributions of their study. Nevertheless, there are
considerable challenges for the employment of mixed methods. In detail, it requires
“certain skills, time, and resources for extensive data collection and analysis”
(Creswell and Plano Clark, 2011, p. 13).
Easterby-Smith et al. (1991) added further clarification to the triangulation strategy,
and identified four types of triangulation. These are (i) data triangulation, (ii)
investigator triangulation and (iii) methodological triangulation as well as (iv)
triangulation of theories. To start with, “data triangulation” is a mixed method that
focuses on data, and the researcher collects different types of data at different times
and / or from different sources. In other words, this triangulation type is data based,
and aims to triangulate both qualitative and quantitative data of a single
phenomenon. Unlike data triangulation, “investigator triangulation” is researcher
oriented, and multiple researchers independently collect data that relate to a single
phenomenon. Then, researchers compare the results of autonomously collected data.
On the other hand, “methodological triangulation” relies predominantly on the data
collection methods. The researcher uses both qualitative and quantitative methods to
gather numbers and words about a single phenomenon. The combination of these
sources accordingly constitutes the domain of research. Finally, “triangulation of
theories” distinguishes itself from other triangulation methods by building a bridge
between different research disciplines. The researcher here works on a theory from
one discipline in an attempt to explain the other theory or phenomenon from another
discipline. Based on the foregoing comparative analyses and arguments, the current
research reasonably claims that its strategy is based on the mixed design that
triangulates both qualitative and qualitative research (Creswell and Plano Clark,
2011). In detail, the triangulation strategy here consists of “data triangulation” and
“methodological triangulation”. The logical justification for embracing the
triangulation strategy in this research is fourfold.
Firstly, this research developed hypothetical relationships for the phenomenon of CF
by agreeing on the deductive approach. Therefore, it is essential to develop a
quantitative research strategy to empirically test hypotheses (Wilson, 2010).

184
However, “qualitative research can be employed in the task of generating rich,
unstructured information in order to develop hypotheses, or measurements, to be
later quantified” (Lee and Lings, 2008, p. 380). This is because the research strategy
consists of two phases. The first phase is the hypothesis development phase that
involves systematic review, qualitative research and the review of grey literature
respectively and provides qualitative data. The second phase is the hypothesis testing
phase that contains an online survey questionnaire conducted to gather quantitative
data. Secondly, the expertise of practitioners in the hypothesis development phase
provides a pragmatic value to the hypotheses developed (Bryman and Bell, 2007). In
other words, the hypotheses of the current research are not only based on the review
of broad literature, but they are also the representative of expert views that matter in
the fields of SCM and forecasting.
Thirdly, given the fact that this research is based on qualitative and quantitative data
including words and numbers, triangulation involves both data and methods. This
strategy leads to reducing any personal bias that emerges from qualitative data
(Hussey and Hussey, 1997), and also to accentuating pragmatic details which are
difficult to be obtained from quantitative methods and data (Wilson, 2010).
Therefore, the findings found from quantitative data can represent the outcomes of
qualitative data (Bryman and Bell, 2007; Creswell, 2003; Jick, 1979). Finally, this
research responds to the consensus among authors that encourages the employment
of triangulation in the fields of information sharing, SCM and logistics (Evangelista
et al., 2013; Mangan et al., 2004; Näslund, 2002). Given the interest of research that
relies on the FSC, triangulating qualitative and quantitative methods and data is a
promising way to offer pragmatic contributions to the literature. Research design,
methods and data collection strategies are further explained in the following sections.

185
4.3. Research design
Before explaining the qualitative and quantitative research strategies, this research
explains the research design, where the intention was to construct a time-based plan
that clarifies the research process in a logical and chronological way to answer
research questions (Wilson, 2010; Bryman and Bell, 2007). The point of origin for
this research was therefore to adopt the systematic approach offered by Flynn et al.
(1990). This approach, which is presented in Figure 4.1, also made it possible to
generalise findings to be able to produce valuable publications as a contribution to
the research field.
Source: Flynn et al. (1990, p. 254)
Although this research employed both qualitative and quantitative methods to
capture a wide range of data, the focus is on the phenomenon of CF. Hence, the
research is predominantly descriptive, and followed the guidelines of Blumberg et al.
(2005), Rowley (2002) and Wilson (2010) to design a strategic research process
(please see Figure 4.3), which involves the following steps respectively;
Identification of research problems in CF through the review of the literature
Development of research questions in response to research problems
Design of a triangulation research strategy for a rigorous data collection process
Figure 4.1. Systematic approach of research
Establish the
theoretical
foundation
*Theory building *Theory
verification
Select a
research design *Single case
study *Multiple case
studies *Panel study *Focus group *Survey
Select a data
collection
method *Historical
archive analysis *Participant
observation *Outside
observation *Interviews *Questionnaires *Content analysis
Implementation *Population
selection *Sample
selection *Scale
development *Questionnaire
construction *Pilot testing *Mailing *Analysis of
non-respondent
characteristics *Data entry
Data
analysis Publication
Reliability and validity considerations underlie all stages

186
When the triangulation research strategy was developed based on the research
problems and research questions, the focus then became to develop and test the
hypotheses through the implementation of following phases:
Phase 1: Hypothesis development phase
Systematic review of literature
Development of preliminary propositions and a conceptual model
Interview with a supply chain manager who works for a leading UK based food
manufacturer
Coding and critical analysis of the transcript of the interview via QSR NVivo 9
Modification of propositions and the conceptual model
Completing of three online group discussions via LinkedIn business groups
Coding and critical analysis of the transcripts of the group discussions via QSR
NVivo 9
Modification of propositions and the conceptual model
Critical review of grey literature
Development of hypotheses and finalisation of the conceptual model
Phase 2: Hypothesis testing phase
Design of an online survey questionnaire and delivery to the manufacturers
located in the UK & Ireland, Europe and North America
Statistical analysis of the hypotheses via PLS
At the beginning of the research process, the most common way of exploring
existing research problems, which is the literature review, guided the research to
complete the process from the identification of research problems to the
development of research questions (Wilson, 2010). As was justified in the previous
section, this research benefits from the triangulation research strategy, which consists
of two phases, hypothesis development and hypothesis testing phases (Creswell and
Plano Clark, 2011; Bryman and Bell, 2007; Jick, 1979).
The hypothesis development phase (phase 1) involves three consecutive data
collection processes: systematic review, qualitative data collection and the review of
grey literature. The processes of systematic review and the critical review of grey

187
literature were previously explained in Chapter 2. Literature review. Therefore, the
intention here is to clarify the qualitative data collection process. This process
includes the single semi-structured interview and three online group discussions.
These exploratory methods made it possible to gain further insight into the
application of CF in practice (Zikmund, 2003). Although this research conducted a
single semi-structured interview, coding and analysing the interview transcript with
the software package QSR NVivo 9 brought about exploring pragmatic variables and
enriching the value of hypotheses for practice (Bazeley, 2007; Jick, 1979). Then,
based on the outcomes of the interview, the literature-based propositions and the
conceptual model were modified correspondingly (Wilson, 2010).
As regards the group discussions, this research benefited from the business oriented
social networking service LinkedIn, and conducted three online group discussions at
SCM and forecasting oriented business groups. Given the fact that LinkedIn is
predominantly a business oriented platform (Mirabeau et al., 2013), valuable
information was gathered from senior- and medium-level managers who are
employed in the fields of SCM and forecasting around the world. Similar to the
interview, the transcripts of group discussions were analysed via QSR NVivo 9, and
the outcomes were used to modify the propositions and conceptual model of this
research (Bazeley, 2007). Continuing the review of grey literature then made it
possible to underpin propositions with additional evidence and to develop
hypotheses along with the finalisation of the conceptual model. The single semi-
structured interview and three group discussions are further clarified in the following
section.
The hypothesis testing phase (phase 2) involves the online survey questionnaire,
which is the most common method for descriptive research in collecting accurate
information from the sample of the target population (Wilson, 2010). In this phase,
by purifying the results of the literature review based on the qualitative data, the
measurement items that represent the constructs (hypotheses) in the conceptual
model originated. In order to enhance the reliability of the measurement items, the
multi-items scale development procedure guided this research, as was suggested by
Churchill Jr, (1979).

188
This procedure, presented in Figure 4.2, underpinned the research design due to the
suggestions of conducting an exploratory study as a preliminary step to developing
measurement items. Further to that, the suggestion of Churchill Jr, (1979) about
developing multiple items as the representative of constructs (hypotheses) also
enhanced the reliability. The online survey questionnaire was then delivered to the
manufacturers located in the UK & Ireland, Europe and North America. Under the
guideline of Peng and Lai (2012), this research employed the quantitative data
analysis technique of PLS to test the hypotheses.
Source: Churchill Jr, (1979, p. 66)
Figure 4.2. Multi-items scale development procedure
1. Specify domain of
construct
2. Generate sample of
items
3. Collect data
6. Assess reliability
7. Assess validity
8. Develop norms
4. Purify measure
5. Collect data
Exploratory research
process
Development of survey
questionnaire
Survey questionnaire

189
Did the research
select robust
data collection
methods?
No
Yes
Research: Improving Collaborative
Forecasting Performance in
the Food Supply Chain
Systematic review
(Tranfield et al., 2003) Research themes:
*Supply chain integration *Forecasting process *Information sharing
Identification of
research problems in CF Start
Did the research
identify rigorous
and pragmatic
problems?
Yes
No
Development of
research questions
Development of preliminary
propositions & a
conceptual model
Design of a
triangulation
strategy for a rigid
data collection process
Literature
review
A single semi-structure
interview with a supply
chain manager who
works for a food
manufacturer
Design of
questions for
interview/s
Pilot
study
Critical review of
grey literature
Analysis of survey
data with PLS (Peng and Lai, 2012)
Delivery of survey questionnaire
to manufacturers located in the: *UK & Ireland *Europe (North, South, East, West) *North America (USA & Canada)
Development of hypotheses
and finalisation of the
conceptual model
Design of survey
questionnaire by purifying
the results of literature
review based on qualitative
data (Churchill Jr, 1979)
Chronological data collection strategy 1. Systematic review 2. Semi-structured interview/s 3. Group discussion/s via LinkedIn 4. Critical review of grey literature 5. Online survey questionnaire
Methodological
comparison of prior
research
Coding and analysis of
the interview transcript
via QSR NVivo 9
(Bazeley, 2007)
Modification /
distillation of
propositions & the
conceptual model
Design of
questions for group
discussion/s
Pilot
study
Three group discussions via
LinkedIn at the business
groups: *Forecasting Net (2 discussions)
*Business Forecasting &
Planning Innovation
Coding and analysis of
the group discussions
transcripts via QSR
NVivo 9 (Bazeley, 2007)
Modification /
distillation of the propositions & the
conceptual model
Did the research
explore sufficient
evidence to underpin
qualitative results?
No
Yes
Pilot
study
Contributions to the
SCM and forecasting
literature
Managerial
implication to the
food practitioners
Start the data
collection
process
End: Submission
of the PhD thesis
End of the
data
collection
process
Source: Developed by the author
Figure 4.3. Strategic research process - Flowchart

190
4.4. Data collection process – mixed design
Developing a wide-scale research strategy at the early stages of any research brings
further transparency to the research process in terms of deciding which method/s will
be used and why as well as understanding the relation between method/s, paradigm/s
and target population (Silverman, 2010; Mason, 1996). By embracing the
triangulation research strategy, this research conducted both a qualitative and
quantitative data collection process. However, the qualitative data collection process
here is the preceding step of the quantitative process, and aimed to provide an in-
depth understanding about the CF of manufacturers in the FSC.
While the qualitative data collection process of the current research consisted of the
single semi-structured interview and three online group discussions (Creswell and
Plano Clark, 2011; Silverman, 2010), the quantitative data collection process purely
embraced the online survey questionnaire method (Wilson, 2010; Lee and Lings,
2008). The structural and chronological data collection process of this research is
presented in Figure 4.4. This research distinguishes itself by extensively exploiting
the social media networking sites during the qualitative and quantitative data
collection process.
In detail, social media sites are highly appealing to academic and business
researchers (Boyd and Ellison, 2007), and relevant networks such as Facebook,
LinkedIn and Twitter are attractive tools as a way of reaching the respondents for
any qualitative and qualitative research (Mirabeau et al., 2013). This research, hence,
benefited from the business oriented social networking service LinkedIn not only to
contact the participants of group discussions, but also to reach the respondents of the
online survey questionnaire. The following section further scrutinises the role of
social network sites to offer a rationale for the usage of the social networking site
LinkedIn and to encourage researchers to benefit from associated sites in academic
research.

191
Figure 4.4. Structural and chronological data collection process
Source: Developed by the author
Qualitative and quantitative data collection methods
Data analysis methods and associated guidelines
Outcomes of associated methods
..
•Systematic review of literature over the research themes of:
•Supply chain integration
•Forecasting process
• Information sharing
. •A single semi-structured interview with a UK based food manufacturer
• Interviewee: Supply chain manager
..
•Three online group discussions via LinkedIn business groups:
•Forecasting Net (2 discussions)
•Business Forecasting & Planning Innovation
•Critical review of grey literature over the research themes of
•Supply chain integration
•Forecasting process
• Information sharing
..
•Online survey questionnaire delivered to the manufactureres located in the
•UK & Ireland
•Europe (North, South, East, West)
•North America (USA & Canada)
Systematic review
(Tranfield et al., 2003)
Qualitative data analysis software QSR Nvivo 9
(Bazeley, 2007)
Qualitative data analysis software QSR Nvivo 9
(Bazeley, 2007)
Critical analysis of the author
Partial least squares (PLS) technique
(Peng and Lai, 2012)
Development of preliminary propositions and a conceptual model
Modification / distillation of propostions and the
conceptual model
Modification / distillation of propostions and the conceptual model
Development of hypotheses and
finalisation of the conceptual model
1. Contributions to the SCM and
forecasting literature
2. Managerial implications to the food practitoners

192
4.4.1. Rationale for using social networking sites for academic research
To be able to generate promising contributions for any business oriented academic
research, the priority must to be reaching participants from the target industry and
capturing reliable information first hand. Cycyota and Harrison (2006) stressed that
senior managers and executives are not only the main participants of research
conducted in the field of management, but also they are the main sources to obtain
vital research variables. Nevertheless, there are two substantial barriers in front of
the academic researchers. The first challenge is to find relevant participants based on
the research area of interest. The second challenge is to convince them to devote
time and to contribute to the research (Miles and Huberman, 1994).
Interestingly, while Mirabeau et al. (2013) reviewed the management-related
literature, they highlighted the researchers’ lack of interest in getting benefit from
social networking sites in an attempt to reach target respondents. Yet, there is a
steadily ascending trend about the popularity of social networking services in recent
years (Efthymiou and Antoniou, 2012). These services seem to be a good candidate
for researchers in reaching potential respondents for academic research (Fielding et
al., 2008). Boyd and Ellison (2007, p. 211) define the social network sites as “web-
based services that allow individuals to (1) construct a public or semi-public profile
within a bounded system, (2) articulate a list of other users with whom they share
connection, and (3) view and traverse their list of connections and those made by
others within a system." The American Psychology Association puts forward the role
of social media in academic research as an opportunity, and exemplifies how
psychological researchers utilise social media sites to reach survey participants,
particularly to undergraduates (Phillips, 2011).
As a matter of fact both paper-based techniques and Internet-based services serve
same objective in terms of reaching respondents for any research that conducts
interviews, surveys or other data collection methods (Mirabeau et al., 2013; Fielding
et al., 2008). However, there are some risks and handicaps as well in employing
social networking sites for academic research. For instance, losing the control of
delivering research information and / or focusing on irrelevant respondent segments
are matters for the reliability of research findings (Picazo-Vela et al., 2012). Taking

193
into account the limited interest of senior managers or organisations that do not use
the social networking sites, researchers may not achieve a sufficient sample size. If
researchers also regard only their personal network through the data collection
process, their results are most likely to be biased (Mirabeau et al., 2013). Each
networking site has different rules and procedures that researchers need to take into
account. For instance, researchers cannot use the social networking sites of the
American Psychology Association, such as Facebook and Twitter, to contact the
participants of the association (Phillips, 2011). Hence, it is important to have a clear
understanding about the ways of benefiting from social networking sites properly.
Regarding the social network sites such as Facebook, Twitter and Myspace,
LinkedIn differentiates itself from some ordinary networking sites that people tend to
socialise on in a daily life. For instance, Harwood (2013) provided a distinctive
description about LinkedIn, and stressed that “LinkedIn is not merely a social
network aimed for business users. Rather, it should be viewed as an online network
of influential people all over the world”. The author also emphasised that if LinkedIn
is utilised properly, it can result in building very good connections and discussions
with chief executives and senior managers. Whilst LinkedIn seems such a good
candidate to reach managers, academic researchers, on the other hand, confront
difficulties in improving the response rate of data collection methods. For instance,
when Cycyota and Harrison (2006) analysed the response rate of studies that
surveyed executives and were published in high-ranking journals, the questionnaire
response rate of these studies appeared to be approximately 24 percent. Furthermore,
the authors warned that if academic researchers do not look for new data collection
ways, there is an expectation that they will have only 4 percent response rate by
2050.
According to recent statistical work, LinkedIn had 300 million users, and two new
members enrol on the site per second. LinkedIn also hosts members from 200
different countries that use 20 different languages, and has 3 million business pages
that had been used by companies to launch 1.2 million products / services since the
foundation of LinkedIn (Smith, 2014). These statistical results are valuable
testimonials to the fact that LinkedIn has a strong potential not only to increase the

194
sample size of any survey, interview or group discussions, but also to expand the
geographical scope of academic research in any field. In a similar vein, social
networking sites are more persuasive for participants and are likely to increase their
willingness to participate in surveys, as they make it possible to conduct an
anonymous data collection process compared with the usage of email surveys (Fang
et al., 2014).
Another promising feature of LinkedIn is that it has a very comprehensive search
tool whereby researchers can reach a wide range of senior managers by using
keywords, which in turn helps to check candidate respondents’ profile and to decide
whether they are appropriate candidates for the research area of interest (Mirabeau et
al., 2013). In detail, the researcher can filter the number of potential candidates for
surveys based on their country, seniority level, industry, company size and relevant
business groups, and this feature enables the researcher to develop a promising
sampling frame in the data collection process. LinkedIn has 2.1 million business
groups, and a vast number of managers discuss 200 different organisational problems
per minute, such as manufacturing, supply chain and forecasting (Smith, 2014).
Joining such discussions makes it possible to be involved with business problems
that managers confront in daily life. To be able to initiate group discussions for a
particular research area, it is however important to join the most relevant group/s to
be able to contact appropriate participants and to capture promising sources. When
group discussions are initiated and a participant adds his/her comments on the
discussion panel, the researcher receives instant notification from LinkedIn, which
feature makes it possible to track the progress of group discussions (Harwood,
2013).
Overall, the aforementioned justifications and statistical results are the motivation of
the current research in exploiting the business oriented social networking site
LinkedIn through the data collection process. LinkedIn was initially used for the
qualitative data collection process, and three online group discussions were
commenced in the SCM and forecasting oriented business groups. This made it
possible to capture in-depth information about the CF practices of organisations in
practice and to build reliable connections with senior managers around the world.

195
Expanding the network with associated participants then underpinned the
quantitative data collection process. This is because the online survey questionnaire
looked for respondents from LinkedIn as well. Through the quantitative data
collection process, this research also benefited from the online databases, a vast
number of food and beverage federations and personal contacts of the author who
have managerial positions in the food manufacturing companies. The data collection
stages of this research are elaborated in Section 4.6.4. Quantitative data collection
stages.
4.5. Qualitative data collection process
The qualitative data collection process of this research came before the quantitative
data collection process. The main intention here was not to rely on interpretivist
philosophy and then form the complete context of the research based on qualitative
data, but, instead, to (Creswell and Plano Clark, 2011; Zikmund, 2003; Deshpande,
1983; Jick, 1979; Churchill Jr., 1979):
Have a clear understanding about the employment of CF phenomenon in
practice
Gain an in-depth insight into the role and responsibilities of manufacturers in CF
Explore the role of perishable, seasonal, promotional and newly launched
products in CF
Seek an opportunity to find out new research area/s that had not been explored
in the literature
Use past experience and personal beliefs of participants in terms of CF
Appraise the relevance and rigour of the research questions in a real
environment
Capture the foremost pragmatic variables to screen the results of the systematic
review
Purify the literature-based propositions
Modify the conceptual model and develop hypothetical relationships
Obtain rigorous information to generate measurement items for the scales of the
online survey questionnaire
Enhance the validity of the research findings in practice, and

196
Enrich the value of managerial implications by toning the outcomes of
qualitative and quantitative data analyses
Based on the aforementioned objectives, this research found an opportunity to
conduct a single semi-structured interview with a leading UK based food
manufacturer and three online group discussions on the business oriented social
media service LinkedIn.
4.5.1. A single semi-structured interview
4.5.1.1.Rationale for employing semi-structured interview
Interviewing is the most common technique in qualitative research. The reason why
researchers habitually prefer this technique relies on its flexibility, as the structure of
interview considered and time dedicated differ based on research questions and
respondents (Lee and Lings, 2008). There are different types of interview techniques,
such as unstructured, semi-structured and structured. While unstructured interviews
are in-depth and allow interviewees to discuss subjects in an open manner, structured
interviews, in contrast, rely heavily on inflexible questions that demand concise
answers from interviewees (Wilson, 2010). This research adopted a moderate
attitude and embraced the semi-structured interview technique. In this direction, the
interview proceeded based on a number of structured questions, but also the
interviewee had an opportunity to scrutinise key points during the interview. Further,
conducting a face-to-face interview enabled the author of this research to follow a
flexible approach and to link the verbal and non-verbal communication of the
interviewee during the interview.
The semi-structured interview technique similarly became the choice of prior studies
that were dedicated to the SCM and forecasting phenomena. Apart from studies that
followed only qualitative research, quantitative research oriented studies likewise
preferred this technique for the development of survey questionnaires. Danese (2011;
2007; 2006; 2004), Småros (2007), Ramanathan (2013; 2012) and Ramanathan et al.
(2011) are only a few of numerous studies that conducted semi-structured interviews
for their qualitative research. McCarthy Byrne et al. (2011), Nakano (2009) and

197
Vlachos and Bourlakis (2006) as well as Zhou and Benton Jr, (2007) alike embraced
this technique in their survey based studies.
Vlachos and Bourlakis (2006), for instance, interviewed key decision makers in the
Greek food sector as a preceding step to testing their survey questionnaire. When
Zhou and Benton Jr, (2007) wanted to analyse the information sharing and supply
chain practices of manufacturers in the USA, they similarly conducted in-depth
interviews to validate their survey questionnaire. From the forecasting perspective, to
examine the motivation of sales people in the forecasting process, McCarthy Byrne
et al. (2011) employed in-depth interviews alongside reviewing the literature.
Thereby, these authors captured valuable information to identify the variables of the
survey questionnaire. These studies are good examples that used interviews in
quantitative research, and therefore support the perspective of the current research in
using the semi-structured interview as the early step of the quantitative data
collection process.
This research took the opportunity of interviewing the supply chain manager of a
leading UK based food manufacturer. The company operates in several European
countries, and owns more than ten brands along with a vast number of product-
groups in the industry. In general, because of well-known food brands, the company
has close partnerships with several retailers in the UK and Europe. The company
generally conducts CF with retailers involving perishable, seasonal, promotional and
newly launched products. For confidentiality reasons, the name of the company and
the supply chain manager cannot be shared. Before the interview, the current
research developed the interview questions based on the results of systematic review,
with some questions relying heavily upon the preliminary propositions and the
conceptual model. The author of this research then conducted three pilot-tests with
researchers from the fields of operations management and SCM. Based on the
feedback obtained from the pilot-tests, the quality and clarity of the interview
questions were improved before the interview (Silverman, 2010). The interview
questions are presented in APPENDIX-I.

198
4.5.1.2.Process of the semi-structured interview
Overall, the interview consisted of two meetings. During the first meeting, the author
and the supply chain manager met to introduce each other and to exchange general
knowledge about the research and the company. The research aim and objectives
were clearly conveyed to the manager, and the CF practices of the company with
retailers and associated product-groups also became subject of the meeting. Then,
the second meeting date was adjusted to conduct the semi-structured interview.
The second meeting was primarily dedicated to the semi-structured interview. The
interview was completed in about one and half hours, and the note-taking method
was used to make the interview transcript. The interview proceeded in the form of
question and answer; however, the manager was encouraged to share in-depth
information on critical questions. This is a common way of uncovering vital clues
about the research questions (Wilson, 2010). During the interview, the preliminary
propositions and the conceptual model of the research were introduced to the
manager. His general views were then requested to be able to learn from his
experience and to assess the reliability of the conceptual model and propositions in
practice. At the end of the interview, the manager was further encouraged to share
his suggestions in terms of considering specific variables to be reviewed in the
literature.
4.5.1.3.Qualitative analysis of the semi-structured interview
This research favoured the qualitative data analysis software package QSR NVivo 9
to analyse the transcript of the interview. NVivo is a software package that was
developed by QSR International. It guides researchers to organise unstructured
qualitative data and to analyse them in a structured form (QSR, 2013). It is very
promising software for pattern analysis, theory testing and theory building. NVivo is
likewise preferred for description, comparisons and evaluation of a wide range of
qualitative data (Bazeley, 2007).
This software has five prime features that improve the process of analysing
qualitative data. Firstly, it has the solid ability of managing any unstructured data.
Published articles and any documentary sources can also be reviewed in a structured
199
form, in addition to the transcripts of interviews, questionnaires, group discussions
and observations (Bazeley, 2007). NVivo allows the uploading of word and pdf
documents, videos and pictures, spreadsheets along with web data (QSR, 2013).
Secondly, researchers can systematically manage ideas. Complex ideas that are
generated through the analysis of qualitative data can be recorded in an organised
form (Bazeley, 2007). Thirdly, the software has a widespread search feature, and any
subject and / or word can be found within complex qualitative data. Then, each
search can be recorded to effortlessly arrive them afterwards (QSR, 2013). Fourthly,
NVivo has graphical features. It helps researchers to structure hypothetical
relationships and to build and / or modify conceptual models. Associated ideas that
represent hypothetical relationships can be linked to conceptual models. This, in
turn, makes it possible to have a clear understanding of complex causalities in
conceptual models (Silverman, 2010). Finally, NVivo has a reporting feature, and
the outcomes of qualitative data analysis can be reported in a structured form.
Reports can also be exported as a word or pdf document (QSR, 2014; 2013; Bazeley,
2007).
To be able to get benefit from the aforementioned benefits of this software, the
interview transcript was uploaded to QSR NVivo 9 as a word document. For the
analysis process, the principles of Patton (2002), who suggested identifying,
codifying and categorising, then classifying and labelling the qualitative data, were
embraced. These principles earned the support of Easterby-Smith et al. (2002) as
well when the intention is to test hypothetical relationships. For the utilisation of
QSR NVivo 9, the guidelines of Bazeley (2007) and Lewins et al. (2011) were
considered during the analysis process, and this made it possible to distil vital
variables from the transcript of the interview. When the results of qualitative data
analysis were explored, the research modified the literature-based conceptual model
and propositions by benefiting from the graphical feature of QSR NVivo 9.

200
4.5.1.4.Outcomes of the semi-structured interview
The results of the interview analysis provided an in-depth understanding about the
foremost CF problems that occur in the real environment. Particularly, outcomes
strongly validated the existing challenges that prevent partners from conducting
long-term and accurate CF in the FSC. For instance, by confirming the literature, the
interview findings exemplified how manufacturers confront difficulties in
conducting long-term CF with retailers. This outcome relies on the manager’s
comment, where he stressed; “Collaborative forecasting works well in a short
period, like 9 weeks, but the same performance cannot be obtained in the long-term
period, I mean for 52 weeks”. In a similar vein, findings showed that manufacturers
mostly do not satisfy from the forecasts during CF. The outcome that made it
possible to validate inaccurate forecasts in CF lies in the manager’s comment; “The
accuracy of collaborative forecasting is satisfied close to the delivery time of
products; however, at the beginning of the forecasting period it is not satisfied. It
changes unexpectedly”. These results not only confirm that manufacturers confront
difficulties in conducting long-term and accurate CF in the FSC, but also suggest the
impact of fluctuating demand in CF. Evoking the aim of the current research, which
is to achieve long-term and accurate CF in the FSC, the outcomes of this single
interview enrich the value of the research for practice.
There was further support for the idea that trust and commitment are two important
determinants in CF. The manager, for instance, remarked; “Trust and commitment
are weak in the long-term. We are satisfied in the short-term (9 weeks), but not in the
long-term. We really need further attention and commitment of retailers to generate
better forecasts in the long-term (52 weeks)”. This outcome has been one of the core
origins in developing the CF practice for manufacturers. It is important to remember
that the CF practice in this research encapsulates the literature-based five formative
variables, two of which are trust and commitment. The significance of trust and
commitment accordingly receives the support of pragmatic views in addition to the
literature. When this research identified the variable of “willingness” during the
analysis of interview transcript, this outcome made it possible to interpret that both
the company and its partners have willingness to pursue collaborations. For instance,
the manager stressed that; “I believe that retailers are happy to conduct

201
collaborative forecasting with us. They have a willingness to pursue collaborations,
like us”.
In essence, this subjective belief gives rise to contradictions on the willingness
factor. The reason is that while the manager expected further trust and commitment
from retailers in the long-term, on the other hand, he confirmed both sides’
willingness to conduct CF. In the literature, the commitment is to show “desire to
maintain valued relationships” (Moorman et al., 1992, p. 316). However, trust is to
provide “willingness to rely on an exchange partner in whom one has confidence”
(Moorman et al., 1993, p. 82). In collaborations, trust is also known as, “the
willingness of a party to be vulnerable to the actions of another party based on the
exception that the other will perform a particular action important to the trustor,
irrespective of the ability to monitor or control that other party” (Mayer et al., 1995,
p. 712). Commitment then “refers to an implicit or explicit pledge of relational
continuity between exchange partners” (Dwyer et al., 1987, p. 19).
The perception of the manager on willingness seems to capture the happiness of
retailers in sustaining collaborations. According to the literature, it is reasonable to
describe the willingness factor as an observed outcome of trust representing the
vulnerability and rapid action of partners in pursuing confidentiality. This, per se,
suggests that despite the existing willingness of partners to sustain CF, they cannot
be satisfied in terms of rapidly reacting to expectations in CF. While this single
interview is limited to highlighting the sensibility of manufacturers, retailers’ views
are still uncertain. Based on these paradoxical and limited outcomes, it seems that
empirically analysing the importance of trust and commitment in CF will offer
promising contributions to the literature and practice.
Externally integrating with retailers also appeared to be a necessity in CF. Increasing
the frequency of communication and agreeing on a single plan seem critical
determinants to utilise CF. The company successfully fulfils these requirements and
achieves its objectives in CF. In detail, the company and its partners communicate
almost on a daily basis, and joint business plans. While partners’ yearly plans allow
the company to pursue its strategic objectives, weekly plans then make it possible to

202
respond to instant demand changes and to satisfy retailers in CF. This finding
supports the case study by Danese (2007). This is because the author exemplified
how partners’ effective information sharing and joint business plan allowed them to
accomplish CPFR goals, which were to reduce inventory costs and to increase
responsiveness against instant demand changes.
There is a broad consensus that partners need to conduct CPFR by adopting a single
vision and linking their business plans, if they want to take advantage of this
business initiative (Danese, 2007; McCarthy and Golicic, 2002; Ireland and Bruce,
2000). Therefore, this qualitative finding not only solidifies arguments on the
partners’ integration, but also brings pragmatic value to the CF practice of this
research, which embraces the join business plans as a notable necessity for long-term
and accurate CF in the FSC.
Another important outcome was about the IT systems. The qualitative analysis
revealed that IT systems are vital for CF. The company has an advanced IT system to
share information internally and externally. Their access to retailers’ systems further
improves agility and transparency through information sharing. In doing so, the
company obtains reliable information on a regular basis. Nonetheless, it appears that
different IT systems in CF cause time to be spent in the forecasting process. For
instance, the manager remarked that; “We don’t have any problem with IT
systems…we have an advanced system…the only issue is that some retailers have
different IT systems from us, and we spend time to convert the retailer data and to
utilise them in our system. This issue is time-consuming, and negatively affects our
information sharing and forecasting within the company.”
This outcome is in line with case studies that illustrated partners’ different IT
systems that engendered forecast errors and administrative costs in the UK FSC
(Taylor and Fearne, 2006; Taylor, 2006). The arguments of Småros (2007)
exacerbate the paradox on the IT systems, as the author claimed that investing in IT
systems is not essential for large-scale CF. It can be inferred that the finding of this
interview implies the importance of IT systems for timely and accurate forecasts,
differently from Småros (2007). Barratt (2004) previously argued that technology is

203
not necessary in collaborations, though the literature is rich in opposing views
(Fliedner, 2006; McCarthy and Golicic, 2002; Ireland and Bruce, 2000). This is
because the discussions of the current research on the IT systems have gained more
importance, as the necessity of these systems has been advocated for effective
integration in CF.
Manufacturers’ interdepartmental integration also came into prominence based on
the qualitative outcomes of the interview. The company does not have any difficulty
in terms of integrating departments in CF, since there is a robust awareness that
communication among departments is crucial and it influences the practices of
production, forecasting and the supply chain. Associated remarks of the manager
clearly indicates the importance of communication between departments, because he
mentioned that; “The communication between the forecasting and production
departments is crucial, since the forecasting department transfers information to
production, and then the production department develops supply chain and
production plans.” In essence, this view of the manager adds further understanding
to the observations of Småros (2007), who clearly illustrated how the lack of
integration between the departments of a manufacturer caused to loss of information
and this in turn negatively influenced the CF of manufacturer in the FSC. Therefore,
it can be inferred that cross-functional communication is an important factor to
improve integration between the departments of manufacturers.
In the meantime, it is worth mentioning that the company effectively employs S&OP
and extends this practice to its CF with retailers. This is a good example to support
the strategic feature of S&OP, as it makes it possible to align departments’ different
objectives (Oliva and Watson, 2011) and to generate a single consensus-based
forecast in manufacturers (Mello, 2013). While the literature emphasised
manufacturers’ multiple forecasts that worsen CF with retailers (Helms et al., 2000),
studies, on the other hand, clarified how S&OP enabled manufacturers to generate
consensus forecasts with retailers in a timely manner (Olhager, 2013; Thomé et al.,
2012). There is also broad agreement that cross-functional integration between
departments enhances flexibility, product quality and timely deliveries (Paiva, 2010;
Lockamy II and McCormack, 2004). Regarding this qualitative finding that is in line

204
with broad views, the CF practice of the current research gains a pragmatic meaning
due to its assumptions that defend the necessity of consensus-based single forecasts
in manufacturers. Therefore, the arguments of this research on the interdepartmental
integration of manufacturers make further sense.
Regarding the production capacity, the qualitative data analysis allowed the research
to infer that there are difficulties in balancing forecasts and production. Particularly,
when forecasts outweigh the capacity, it causes additional stocks and accordingly
inventory costs. Therefore, manufacturers’ ability to plan and schedule production
seems an important matter in CF. Supporting this, the manager commented that;
“when forecasts are over the capacity, it obliges us to make stock, so it causes high
inventory costs. We would like to balance production capacity and forecasting to
mitigate inventory costs.” It is interesting that Småros (2007) similarly observed the
difficulties of manufacturers in effectively managing production capacity in the
European grocery sector. Knowing that partners’ order forecasts are influential on
manufacturers’ production planning and delivery operations (Danese, 2007),
manufacturers’ capability of planning and scheduling production gains more
importance in CF. For that reason, this research discussed the role of production
planning and scheduling when manufacturers’ interdepartmental integration was
taken into account during the hypothesis development process.
Finally, the lack of regular forecasting meetings between partners appeared to be an
important outcome of this interview. In detail, the reluctance to dedicate time and
conduct regular meetings in CF caused conflicts between the company and retailer
partners. The frequency of meetings conducted between the company’s collaborative
team and retailers change based on the extant situation. These meetings could be on
a monthly or weekly basis. It appears that there is instability in conducting regular
forecasting meetings in CF. On the other hand, the forecasting literature lacks a
pragmatic contribution, and needs to be enriched with further knowledge to be able
to add further insight into the partners’ forecasting meetings (Önkal et al., 2012;
2011). Accordingly, arguments have been improved on the forecasting meetings of
partners to extend the forecasting literature.

205
Overall, although the analysis of the aforementioned single interview implies
important clues for the CF of manufacturers, results are limited to the views a single
interviewee. To elucidate qualitative findings, it is essential to conduct empirical
analysis. Therefore, the outcomes of the interview made it possible to reduce the
number of the literature-based propositions and to modify the conceptual model in
this regard. It is worth mentioning that by relying on the results of this single
interview, Eksoz and Mansouri (2012) and Eksoz et al. (2012) offered valuable
propositions to the SCM and forecasting literature.
4.5.2. Three online group discussions
4.5.2.1.Rationale for employing online group discussions
In the literature, group discussions are also known as focus groups (Wilson, 2010).
The focus group is “a form of qualitative data collection which involves the
simultaneous participation of a number (usually around five to eight) of respondents,
along with a moderator or facilitator” (Lee and Lings, 2008, p. 221). This qualitative
method requires continuous effort on the part of the researcher to attract suitable
participants to contribute to the research and to keep them interested during the
group discussions (Wilson, 2010). Despite the effort that needs to be put into the
data collection process, group discussions have concrete strengths that allow
researchers to interact with the group participants and to obtain data beyond a single
response. Focus group discussions focus on “a particular topic, and should be used
because the researcher wishes to explore the way that topic is discussed or
constructed by the group, not as a set of individuals” (Lee and Lings, 2008, p. 221).
Discussions can be conducted in the forms face-to-face, telephone and online
applications (Curry et al., 2009; Rezabek, 2000; Murray, 1997).
Previously, Zikmund (1997) highlighted a vast number of strengths for this method.
For instance, group discussions allow researchers to gather a wide range of
information compared to interviews. Differently from other qualitative methods, the
interaction of participants accumulates new ideas about a single topic. These
interactions in groups, moreover, reduce the pressure of participants that they
frequently experience during interviews. According to Zikmund (1997), this method
helps researchers to collect more data in a shorter period compared to interviews.

206
This research conducted online focus group discussions on the business oriented
social networking service LinkedIn, which is a promising way to contact senior
managers (Smith, 2014; Harwood, 2013; Mirabeau et al., 2013). The rationale for
conducing online group discussions on LinkedIn was justified in Section 4.4.1., It is,
however, worth further clarifying the online version of focus group discussions due
to the fact that they can be conducted synchronously or asynchronously (Rezabek,
2000; Murray, 1997)
A number of studies considered group discussions, yet their choice generally differed
between face-to-face and online applications. For instance, Ramanathan (2013)
conducted face-to-face group discussions with seven representatives of textile and
packaging manufacturers separately to elaborate the impact of different types of
information on the forecast accuracy. Similarly, while Oh et al. (2012) aimed to
analyse the impact of IT systems on retailers’ selling activities, they conducted face-
to-face focus group discussions with retail participants and consumers. On the other
hand, Picazo-Vela et al. (2012) favoured online group discussions to discuss the role
of social networks on government portals, and these authors’ discussions
interestingly attracted 250 public servants.
Stewart and Williams (2005) also employed online group discussions over two
different research projects, and then discussed the difference between synchronous
and asynchronous online group discussions. Identically, Fox et al. (2007) focused on
the online group discussions, but these authors further discussed the role of
synchronous discussions on a research that addressed the appearance concerns of
young people, who have chronic skin conditions. Clarifying these different types of
online group discussions, synchronous discussions are live and participants
contribute to the discussions in the same period. Its structure is similar to face-to-
face discussions, but it is faster moving (Stewart and Williams, 2005). Asynchronous
online discussions are not live and rely on comments. Participants can contribute to
the discussions whenever they want within a specific period of time (Murray, 1997).
Emails, news or business groups are the common ways of conducting asynchronous
online discussions, whilst synchronous discussions tend to be conducted in chat
rooms or in the form of online conferencing / webinars (Rezabek, 2000).

207
There are arguments that conducting online group discussions gives rise to
challenges for researchers. In detail, during the synchronous discussions, researchers
are likely to confront ethical, personal or pragmatic difficulties (Fox et al., 2007).
For instance, Stewart and Williams (2005, p. 412) claimed that conducting group
discussions on an online platform raises question marks on the “epistemology,
empiricism, authenticity authority, (re)-representation and ethics.” In addition, these
authors argued that although synchronous discussions allow researchers to capture
information in an oral form and to exchange information, ethical issues may affect
the data collection process due to its real-time feature. It is likewise challenging to
attract participants to join a real-time platform. On the other hand, asynchronous
online discussions allow researchers to earn in-depth understanding over the subject
of interest and to increase the number of participants (Tates et al., 2009). This is
because asynchronous online discussions accumulate discussions and / or ideas, and
are not live, so participants can add comments within a limited period of time
(Stewart and Williams, 2005).
Apart from these arguments comparing asynchronous and synchronous online group
discussions, they seem to be more preferred compared with other traditional offline
group discussions. The reason is that the online group discussions are inexpensive
and allow the researcher to reach a vast number of relevant participants on an online
platform (Edmunds, 1999). Online group discussions mitigate hierarchy and
underpin group dynamics. They are likely to improve relationships between the
researcher and participants from different regions (Fox et al., 2007). Researcher can
expedite the data collection process and capture a wide range of information on a
single subject (Fielding et al., 2008). Overall, these comparison analyses between
online and offline group discussions are the reason why the online group discussions
are suitable for the qualitative data collection process. Preferring the asynchronous
online discussions likewise seems a reasonable preference of the current research.
Whilst their narrative feature allows researchers to have an in-depth understanding of
the subject of interest, they do not cause any ethical consideration, unlike
synchronous online group discussions (Tates et al., 2009; Stewart and Williams,
2005).

208
4.5.2.2.Process of the online group discussions
According to recent statistics, the business oriented social networking service
LinkedIn has 2.1 million business groups, and 200 conversations appear in those
groups per minute (Smith, 2014). In general, each business group focuses on a
number of business topics. To be able to access group discussions, it is essential to
be a member of the associated group, and the owner or board of the group needs to
ratify the membership. When the membership is confirmed, the LinkedIn member
also becomes a member of that group. This gives access to any discussion by adding
comments and initiating a new discussion to learn the views of associated group
members. Group members can likewise initiate polling. For instance, the group
member asks a single question on the page of a business group, and then offers a
number of different options for participants to vote on the best option based on their
personal belief / experience. In addition to voting, partners can add their comments
to give a rationale for their vote or to contribute to discussions with additional
knowledge.
When the SCM and forecasting related business groups were searched amid the
LinkedIn groups, it was found that there were 1,808 SCM1 and 452 forecasting
2
oriented business groups. However, to be able to choose the most appropriate
business groups, the research identified three criteria. Firstly, the author of this
research needed access to the business groups beforehand. The logic behind the first
criterion was to save time and to commence the discussions in the shortest time.
Given the fact that having access to a group depends largely on the initiative of the
group owner, it was reasonable to choose groups that already allow the author to
commence discussions. Secondly, the author should choose a business group that not
only allows discussions about forecasting and SCM, but also has close professional
relationships with the members of associated groups. While selecting SCM and
forecasting related business groups is likely to increase the response rate of
participants, having good past experience between the author and core members of
any group will most probably encourage the rest of the group members to contribute
to the discussions. Finally, the author needed to choose at least two different
1 Website: https://www.linkedin.com/vsearch/f?adv=true&trk=federated_advs
Keyword search: Supply chain management 2 Keyword search: Forecasting
209
business groups to commence online discussions. This approach, thereby, enabled
the author to expand discussions to more participants and to accumulate diverse
views from different business groups.
Based on these three criteria, the research commenced two asynchronous online
group discussions with the LinkedIn business groups of “Forecasting Net” and
“Business Forecasting & Planning Innovation”, also called Big Data / Analytics /
Strategy / FP&A / S&OP / Strategic Planning / Predictive & Business Analytics, in
March 2012. Table 4.5 presents the detailed information about the online group
discussions of the current research. The author of this research published the same
abstract to these two business groups, and then requested the opinion of group
members. The abstract introduced the aim and objectives of the research, and offered
the literature-based vital promotions to gather the comments of practitioners.
The intention here was to assess the existence of literature-based propositions in
practice and to encourage participants to share their experience of the associated
propositions. By doing so, the research aimed to narrow down the literature gap and
to focus on propositions that have pragmatic value in the field. The online discussion
in the group of “Forecasting Net” took forty-eight days and attracted interest of two
participants, who provided fifteen comments. On the other hand, the online group
discussion with the “Business Forecasting & Planning Innovation” group ended in
seventeen days, and it captured the comments of four participants, who had different
positions in the industry and provided ten comments to the discussion.
In December 2012, the research commenced the third online group discussion with
the business group of “Forecasting Net”. Differently from the previous discussions,
this online group discussion was polling oriented. Instead of publishing an abstract, a
single question was asked and then a number of options were offered by requesting
the votes of group members. This final online group discussion particularly focused
on the promotional products and asked about the critical factors that influence the
forecast of promotions in practice. To be voted on by participants, the research
offered four literature-based options to participants: (i) forecasting method, (ii)
forecasters’ knowledge about the market and (iii) forecasters’ knowledge about

210
product/s as well as (iv) old promotional data about product/s. While polling
obtained twelve votes, this discussion gathered twelve comments from three
participants. It is worth stressing that LinkedIn allows group members to vote only
one option and once for polling oriented discussions. This, in turn, suggests that the
final discussion of the current research received twelve votes in total from twelve
different participants, while only three participants decided to add additional
comments apart from their votes. Associated abstracts and the questions that were
published for the online group discussions are presented in APPENDIX-II.
Table 4.5. LinkedIn-based online group discussions
LinkedIn business groups
Forecasting
Net
Business Forecasting &
Planning Innovation
Forecasting Net
(Polling)
Per
iod
of
tim
e
Start 21st March 2012 26
th March 2012 20
th December 2012
End 8th
May 2012 12th
April 2012 28th
December 2012
Duration 48 days 17 days 8 days
Nu
mb
er o
f
Group members 1,360 99,997 1,360
Participants 2 4 3
Comments of
participants 15 10 12
Total comments 28 19 22
Votes - - 12
Position of participants who
added comments to the
discussions
*Marketing &
business
development
director
*Academic
Researcher
*Financial planning &
analysis manager
*Supply chain senior
consultant
*Loyalty marketing
director
*Interim supply chain
manager
*Marketing & business
development director
*Strategic resource
planning manager
*Logistics manager
Country of participants UK and Europe UK and USA UK, USA and Europe
Source: Developed by the author
4.5.2.3.Qualitative analysis of the group discussions
Similar to the analysis of the interview transcript, the qualitative data analysis
software package QSR NVivo 9 guided the research to analyse the transcripts of the
three online group discussions. The only additional effort was made to give further
emphasis to the position and the region of the participants. Consequently, apart from
codifying, categorising and analysing the unstructured qualitative data (Patton,
2002), the classification process was extended to the participant level. This allowed
the research to gain further insight into the seniority level of the participants and

211
their region. During the analysis process, the guidelines of Bazeley (2007) and
Lewins et al. (2011) assisted the research to enhance the quality of the data analysis.
By exploiting the graphical features of QSR NVivo 9, the research modified the
conceptual model and propositions based on the results of qualitative analysis (QSR,
2014; 2013; Bazeley, 2007).
4.5.2.4.Outcomes of the online group discussions
The first online group discussion that was commenced with the business group of
“Forecasting Net” did not attract the interest of a large number of members. Only
two members added valuable comments to the discussion. However, the seniority
level and experience of the participants in the field made it possible to capture
valuable clues for the research. The research primarily encouraged the members to
discuss trust, forecasting methods and frequency, and the forecasting capabilities of
partners as well as manufacturers’ production capacity along with promotion types
and associated risks. Interestingly, trust and commitment factors attracted
participants in the CF of manufacturers. Thus, their arguments predominantly related
to these determinants.
As far as the trust factor is considered, this factor in practice seems to be one of the
most significant entailments for long-term CF between manufacturers and retailers.
For instance, one of the participants commented that; “It was to be expected that
trust is one of the most important factors of success between manufacturers and
retailers…, my common sense says that in the absence of mutual trust any
collaboration is bound to fail in a short period of time.” This statement shares
similar idea with the literature, and solidifies arguments on trust. The reason is that
while literature argued that partners’ lack of information sharing was a vital reason
for limited trust and commitment, these factors also engendered short-term
collaborations (Fliedner, 2006; Vlachos and Bourlakis, 2006; Crum and Palmatier,
2003).
Along with the partners’ trust problems, the commitment factor was a subject of the
discussion. Based on the comments of the participants, it is reasonable to deduce that
commitment is just as important as trust, and is a necessary parameter in CF. The

212
following comment supports this argument; “At least in my mind is the level of
commitment in the different parts of the value chain. This can either be enforced as a
contractual obligation or just be a mutually agreed way of doing business to improve
predictability and competitiveness in the value chain. I can't help by remembering
the concept of Just in Time in Japan involving a high level of commitment between
the different parts of the value chain resulting in smaller inventory levels based on
better communication and improved forecasting accuracy in both the demand and
supply sides”.
In essence, this outcome not only validates the positive impact of commitment on
collaborations bringing competitive advantage, but also offers evidence to support its
influence on the forecasting accuracy. It is apparent that partners’ collaborative effort
in sharing information and jointly investing in relationships improves trust and
commitment, and this in turn brings confidence in sustaining long-term
collaborations (Nyaga et al., 2010; Barratt, 2004; Barratt and Oliveira, 2001).
Nonetheless, the role of commitment in the forecast accuracy is not as transparent as
it is in the information sharing (Nyaga et al., 2010). The argument that was
reinforced by the case of the JIT production system further enriches the value of
commitment in improving both information sharing and forecast accuracy. The
literature discussed the necessity of trust in improving partners’ limited information
sharing (Gulati, 2011), while the study by Fischer (2013) confirmed partners’
effective communication as the premise of building trust in the European agri-food
sector. Accumulating these analyses and the qualitative outcomes of this discussion
provides a rigid rationale for the research in defending the role of trust and
commitment as two of the foremost antecedents of the CF practice.
Partners’ conflicts on the horizon of forecasts also became subject of this discussion,
whilst the literature reported contradictory views on whether partners agree on the
same horizon in generating forecasts (Småros, 2007; Aviv, 2002; 2001). By
considering the comments of the participants, the qualitative analysis made it
possible to advocate the existence of conflicts on the horizon of forecasts.
Supporting this, one of the participants commented that; “The time buckets of
forecasting often differs between the retailer and manufacturer, however

213
manufacturers who are more heavily engaged in collaborative forecasting are more
likely to adapt their forecasting to match. This may involve generating monthly
statistical forecasts and then breaking into weeks, making the necessary adjustments
for special events (e.g. promotions) and then comparing these with the retailers'
weekly forecasts…, also important is the forecasting horizon where the retailer only
needs to forecast in the short term for the purpose of replenishment whereas the
manufacturer has a longer lead time of production. The manufacturer's focus is on
planning production and as such the horizon is longer. As such it may be impractical
to forecast weekly in the medium term and hence monthly buckets are used.”
This comment first endorses the observations of Småros (2007), who illustrated
retailers’ short-term forecasts for inventory level demand compared to
manufacturers’ long-term forecasts due to long lead-times. Second, it qualitatively
supports the demonstrations of Fildes and Goodwin (2007), who stressed
organisations’ monthly forecasts by corroborating the work by Klassen and Fores
(2001). These evaluations thereby justify the arguments of the current research,
where the intention has been to shed further light on the horizon of forecasts in the
FSC.
The second group discussion of the research, which was conducted with the group of
“Business Forecasting and Planning Innovation”, attracted the interest of four senior
managers. During this discussion, the participants commented on a wide range of
subjects. However, the leading interest of participants related to retailers’ IT systems,
information types and third parties in collaborations, which provide additional data
and undertake logistics responsibilities. Given the fact that the focus of this research
is manufacturers, the outcomes that were captured on these subjects were not taken
into account. Nonetheless, there were motivating outcomes that were related to
manufacturers’ inadequate IT systems and poor forecasting capabilities. The
comment that stressed this issue was; “The number of UK food manufacturers who
have no systems and indeed little expertise in managing demand and supply is quite
staggering.” This comment necessarily evokes the case study by Francis et al.
(2008). These authors gave examples of the UK based manufacturers’ insufficient

214
capabilities in terms of production, inventory and lead-time activities that negatively
influenced the shelf life of products and relationships with retailers.
Supporting these arguments, another participant reinforced the shortcomings of
manufacturers in promotions and commented that “I have also seen many instances
though of lack of communication between the commercial function and the supply
chain function. This can and does lead to issues related to promotions in particular -
just recently I saw a promotion that had been agreed at commercial level but then
the retailer supply chain function were found to know nothing about it... However, it
is also very clear that manufacturers are also lacking in some key aspects of supply
chain management: - not understanding what their safety stocks should be, not
having forecasting or planning solutions, not understanding the difference between
planning and scheduling, not understanding the difference between forecasting and
demand management, not having mrp functionality.” In the same line with this
qualitative outcome, claiming the shortcomings of manufacturers based on the
experience of participants, Francis et al. (2008) called further attention to
manufacturers’ operations by stressing their extant shortcomings. Therefore,
examining CF from the manufacturers’ point of view has become more valuable for
this research.
Furthermore, the trust factor, one more time, appeared as an important element along
with the adoption of similar objectives and sharing of different types of information.
One of the participants commented that “We must be careful however not to assume
that merely collecting more and more data such as POS data will solve the
problems. The UK retail market is highly promotional, has very high SKU turnover
so that true collaboration involves more than just data sharing - it involves trust
building and honest sharing of intentions.” It is clear that the current research has
captured invaluable information from these discussions that are in line with the
literature and encourage the empirical analysis to generalise findings in the field.
Unlike previous online group discussions, the final discussion of the current research
invited participants to a poll at the group of “Forecasting Net”. The research asked
the question “which factor is most critical in estimating the forecast of promotions?”

215
Then, the literature-based alternative options were offered; (i) forecasting method,
(ii) forecaster’s knowledge about the market and (iii) forecasters’ knowledge about
product/s, and (iv) old promotional data about product/s. By considering the votes of
twelve participants, the polling revealed that forecasters’ knowledge about the
market (33 percent) and old promotional data of product/s (33 percent) are the most
critical elements for promotional forecasts. Participants interestingly did not favour
forecasters’ knowledge about product/s (9 percent) while forecasting methods (25
percent) seemed to be a considerable factor. Regarding the experience of forecasters,
this outcome seems to be in line with the forecasting literature. This is because, when
judgmental adjustments and bias became subjects of the literature, forecasters’
experience appeared to be an important matter for forecasts in addition to their
training and sharing of information (Önkal et al., 2013; McCarthy Byrne et al., 2011;
Syntetos et al., 2009; Fildes et al., 2009). However, market based experience,
interestingly, seems superior to product based experience, according to this group
discussion. Overall, these outcomes have supported the arguments of the current
research on the role of forecasters in forecast accuracy and encouraged further
research when partners collaboratively forecast promotional products in CF.
4.6. Quantitative data collection process
The quantitative data collection process is the main methodological procedure of the
current research. The goal here is to gather numerical data from a sufficient sample
of the target population with the method of online survey questionnaire. This
research constructed the hypothesised relationships based on the existing
phenomenon of CF with the help of rational justification from prior research,
conducted in the fields of supply chain integration, the forecasting process and
information sharing.
Because of the deductive approach and the epistemological paradigm of positivism,
it is essential for this research to generalise the hypothesised relationships in the FSC
(Saunders et al., 2007). This in turn requires reaching a sufficiently large sample
from the population of food manufacturers, where the survey questionnaire is the
most prevalent way of accomplishing this intention (Wilson, 2010; Hussey and
Hussey, 1997; Pinsonneault and Kraemer, 1993). The following section provides the

216
rationale for the employment of a survey questionnaire in gathering quantitative data
for empirical analysis.
4.6.1. Rationale for employing online survey questionnaire
The survey questionnaire is “a method of data collection that comprises a set of
questions designed to generate data suitable for achieving the objectives of a
research project” (Wilson, 2010, p. 148). The survey questionnaire is an accustomed
method for quantitative research (Lee and Lings, 2008). It provides solid advantage
for research in an effort to reach the target population in a quick and inexpensive
manner (Zikmund, 2003).
According to Pinsonneault and Kraemer (1993), there are three major objectives to
be able to employ the method of survey questionnaire. Firstly, a survey questionnaire
is an appropriate method if the research aims to test hypothetical relationships based
on a particular subject or phenomenon. Secondly, this method is eligible if the
research needs to collect quantitative data by asking questions about the pre-defined
measurement items. Finally, a survey questionnaire is applicable if the research aims
to generalise findings to the whole population based on the characteristics of a
sufficient sample. In response to the first objective of Pinsonneault and Kraemer
(1993), this research examines the CF phenomenon through the analysis of
hypothesised relationships that were interlinked in the conceptual model, it is
therefore necessary to test associated causalities amid the hypotheses (Wilson, 2010).
In this context, the first objective is matched by this research to be able to employ
the survey questionnaire method.
Regarding the second objective, which requires pre-defined measurement items for
the survey questions, it is worth remembering that the basis of this research relies on
the systemic review (Tranfield et al., 2003). In other words, the research hypotheses
and the conceptual model have been built upon the outcomes of rigid studies that
were dedicated to the research themes of supply chain integration, the forecasting
process and information sharing. The measurement items that play the representative
role of each hypothesis earn the approval of prior research. In this way, the current
research is compatible with the second objective of Pinsonneault and Kraemer

217
(1993). Finally, although the research underpins the literature-based outcomes with
qualitative data, generalising its findings depends predominantly upon the reliability
of quantitative data (Lee and Lings, 2008; Denzin and Lincoln, 2000). It is vital to
reach a sufficient sample of the target population, and to measure the behaviour and
characteristics of the sample so as to extrapolate findings to the whole population
(Hyde, 2000). This motive accordingly justifies the final objective of Pinsonneault
and Kraemer (1993) and reasonably impels the research to employ the survey
questionnaire for the quantitative data collection process.
This research underpins the motivation of employing a survey questionnaire by
exemplifying 26 articles that embraced the same method, which are presented in
Table 4.6. To distil these articles from the literature, the research considered three
criteria. Firstly, the data collection method of the article should rely on the survey
questionnaire. Secondly, the article should contribute to at least one of the three
research areas of supply chain, information sharing and forecasting. Finally, the
article should contribute to the arguments of the current research in relation to the
development of hypotheses or the CF practice. It is worth stressing, however, that
the reason for presenting these articles is not to list whole survey based articles, but,
instead, to clarify the suitability of the survey questionnaire in diverse research areas.
Hence, it is not claimed that these 26 articles include an overall list of the survey
based studies considered in this research.

218
Table 4.6. Survey questionnaire oriented studies
No Article Journal Geography
Relevant research theme/s
Industry
Supply
chain
Information
sharing Forecasting Food Other
1 Bourlakis et al. (2014) Industrial Marketing Management UK
x x
x
2 Danese et al. (2013) Transport Research Part E Italy
x x
x
3 Danese and Kalchschmidt (2011) International Journal of Production Economics Italy
x x
x
4 Fildes and Goodwin (2007) Journal on the Practice of Operations Research, Interfaces UK
x
x x
5 Fischer (2013) Supply Chain Management: An International Journal Italy
x x
x
6 Flynn et al. (2010) Journal of Operations Management USA
x x
x x
7 Ha et al. (2011) International Journal of Operations & Production Management South Korea
x x
x x
8 He et al. (2013) International Journal of Production Economics UK
x x
x
9 Hill and Scudder (2002) Journal of Operations Management USA
x x
x
10 Klassen and Flores (2001) International Journal of Production Economics Canada
x
x
11 Lorentz et al. (2013) Supply Chain Management: An International Journal Finland
x x x
x
12 McCarthy Byrne et al. (2011) Industrial Marketing Management USA
x
x
13 McCarthy et al. (2006) Journal of Forecasting USA
x
x
14 Mentzer and Kahn (1995) Journal of Forecasting USA
x
x
15 Nakano (2009) International Journal of Physical Distribution & Logistics Management Japan
x x x
x x
16 Paiva (2010) International Journal of Production Economics Brazil
x
x x
17 Ramanathan and Guneasekaran (2014) International Journal of Production Economics UK
x x x
x
18 Sanders and Manrodt (2003) OMEGA The International Journal of Management Science USA
x
x x
19 Sanders and Manrodt (1994) Journal on the Practice of Operations Research, Interfaces USA
x
x
20 Van der Vaart et al. (2012) International Journal of Operations & Production Management The Netherlands
x x
x
21 Vijayasarathy and Robey (1997) Information & Management USA
x
x x
22 Vlachos and Bourlakis (2006) Supply Chain Forum: An International Journal Greece
x x
x
23 Yan and Dooley (2014) Journal of Supply Chain Management USA
x x
x x
24 Zhou et al. (2014) International Journal of Production Economics China
x
x
25 Zhou and Benton Jr. (2007) Journal of Operations Management USA
x
x
26 Zotteri and Kalchschmidt (2007) International Journal of Production Economics Italy x x x
Source: Developed by the author

219
4.6.2. Design of the online survey questionnaire
To be able to gather accurate information by employing a survey questionnaire, it is
imperative to design and test questions along with associated measurement items in a
transparent and justifiable way (McClelland, 1994). There are two major factors that
need to be taken into account to capture reliable information by survey
questionnaire. First, the researcher needs to construct the survey from the most
appropriate questions that capture the main value of the constructs. Second, the
survey questionnaire should reach the most relevant audience, who have a clear
wisdom about the subject of research interest (Wilson, 2010). Whilst this section
aims to explain the first factor, the second factor is addressed in the following
section, which is dedicated to the target population and sampling of the research.
By considering the procedures of Flynn et al. (1990), this research constructed the
survey questionnaire from five-point Likert-type scales. For the measurement of
scales, minimum four and maximum seven measurement items represented each
construct, to ensure that there are a sufficient number of items capturing the value of
each construct, as was suggested by Churchill Jr, (1979). The measurement items
representing the constructs were also explored through the extensive review of the
literature rather than employing existing items used by prior studies. Exploring
literature-based multiple items for a single construct made it possible to measure
internal consistency as well as discriminant and convergent validity during the data
analysis process. Differently from previous studies, the current research employed
four different ranges over the scales in measuring the perception of the audience, and
all the scales were purely five-point Likert-type.
For instance, to measure manufacturers’ CF, integration and forecasting related
practices, related constructs consisted of the literature-based diverse measurement
items that were stressed to be important in developing an efficient CF, improving
supply chain integration and Group Forecasting between partners, along with
considering the competence of forecasters. However, the development of
measurement items for the construct of Collaborative Forecasting Performance was
rather based on the major CF problems of manufacturers, improving the forecast
accuracy and extending the duration of forecast collaborations. This construct, within

220
the knowledge of the author, seems to be tested for the first time for the CF
phenomenon, and therefore it is presumed as a newly developed construct in the
model. Accordingly, the respondents were given a scale that has a range from 5:
Strongly Agree; 4: Agree; 3: Neither Agree nor Disagree; 2: Disagree, to 1: Strongly
Disagree. Measuring the level of agreement in a survey questionnaire is one of the
most common ranges, if the researcher wants the confirmation of respondents over
the associated constructs. Literature involves a plethora of research that follows this
approach (please see, e.g. Hill and Scudder (2002), Lockamy III and McCormack
(2004), Nakano (2009) and Vlachos and Bourlakis (2006)).
For the horizon of forecasts, the research intended to increase accuracy for the range
of scale over a particular period of time. The reason for this there is a paucity of
research clarifying the exact horizon of forecasts for the time-sensitive and / or short-
life product-groups. To bring extra precision to the horizon of forecasts, the
measurement items were developed based on the close periods that practitioners are
likely to consider through the generation of forecasts for the associated product-
groups, according to the forecasting literature. Therefore, the respondents were given
a scale that ranges from 5: 1 month or less, 4: 1 to 3 months, 3: 3 to 6 months, 2: 6 to
12 months, to 1: 12 to 24 months. This helped respondents to choose the most
appropriate horizon for associated product-groups in a precise way. Maintaining
rigour and clarification during the design of the survey is the key determinant in
enhancing the quality of quantitative data (DeVellis, 2003; Clark and Watson, 1995).
When the subject is forecasting, maintaining the transparency of the scales becomes
even more important in the academic field. This was the motivation for precise time
intervals constituting the range of associated scales under the guideline of prior
studies in the field (please see, e.g. Fildes and Goodwin (2007), McCarthy et al.
(2006), Mentzer and Kahn (1995) and Klassen and Flores (2001)).
On the other hand, to measure constructs that targeted manufacturers’ information
sharing operations, the measurement items were developed by considering the
different types of information of manufacturers and the benchmarks used to measure
the quality of information sharing. This approach led to not only adding further value
to manufacturer information, but also exploring new benchmarks in enhancing the

221
quality of information shared with retailers. In terms of ranges, this research
preferred to offer respondents a scale that ranges from 5: Always, 4: Most of the
Time, 3: Sometimes, 2: Rarely to 1: Never. This type of range in survey scales is
commonly chosen to measure the frequency level of associated items. Given the fact
that this research has discussed the sharing of information in the CF of
manufacturers, measuring the frequency level of related items was the foremost
objective of the survey questionnaire. This purpose led the research to differentiate
the range of scales based on the objective of constructs. The literature is also
abundant in studies that intend to measure the frequency level of measurement items
in the survey questionnaire (please see, e.g. Flynn et al. (1990), Zhou et al. (2014)
and Zhou and Benton Jr, (2007)).
Finally, to be able to measure the satisfaction level of respondents from forecasts, the
research developed the construct from the measurement items representing the
forecast satisfaction of manufacturers for the perishable, seasonal, promotional and
newly launched products. Given the paucity of studies considering the forecast
satisfaction of the associated product-groups from the manufacturers’ point of view,
this construct, within the knowledge of the author, seems to be tested for the first
time for the CF phenomenon in the FSC. Therefore, it is presumed as a newly
developed construct in the model, like the construct of Collaborative Forecasting
Performance. This construct also consisted of a scale that has the range of 5: Very
satisfactory, 4: Satisfactory, 3: Neither Satisfactory nor Unsatisfactory, 2:
Unsatisfactory, and 1: Very Unsatisfactory. It is worth recalling that although the CF
of manufacturers in this research has been taken into account to enhance the duration
and accuracy of CF, satisfaction from forecasts is a prime determinant in the
forecasting literature. This enables the research to obtain accurate and reliable data
that can be generalised for the overall population. Therefore, by embracing the prior
forecasting literature, this research preferred the satisfaction range for the associated
scale (please see, e.g. McCarthy et al. (2006), Mentzer and Kahn (1995) and Sanders
and Manrodt (1994)).
Overall, it is common that researchers construct five-point Likert-type scales from
different ranges in a single study. There is plenty of research that favours multiple

222
ranges during the scale development to enhance the precision of constructs for
respondents (please see, e.g. Chen and Paulraj (2004), Flynn et al. (2010), Hill and
Scudder (2002), Nakano (2009) and Zhou and Benton Jr, (2007)). During the design
of the survey questionnaire, this research took into account the suggestions of
DeVellis (2003) and Clark and Watson (1995). The recommendations of these
authors ensured that the questionnaire is free of ambiguity, jargon and double-
barrelled items, and that questions are adequately short to ensure the clarity of the
constructs. To be able to enhance the response rate of the survey, attention was also
paid to the consistent font size, style and colours during the design of the survey
questionnaire (Bryman and Bell, 2007).
Four academics and four practitioners from the food industry were then asked to
review the questionnaire to warrant its structure, readability, ambiguity and
completeness (Dillman, 1978). Validating the quality of a survey by academics and
practitioners independently further strengthened the structure of the survey.
Academics focused on measurement items to ensure that they clearly represent
related constructs, which matters for the validity of the findings. Practitioners
assured the perception of the constructs and associated measurement items in
practice to ensure that respondents would discern correct practices that are the
interest of research. The survey questionnaire is presented in APPENDIX-III.
4.6.3. Target population and sampling
If the major data collection method is survey questionnaire, it is essential to have a
strategic sampling process to collect adequate information by reaching target
respondents in a rational and justifiable way. In social research, sampling is the
assortment of information from a group of the population of interest (Wilson, 2010;
Churchill Jr. and Iacobucci, 2004). To be able to collect adequate information from a
sufficient sample of the target population, Wilson (2010) offers a structured
sampling process consisting of six stages. These stages are: to (i) define the target
population, (ii) select the sampling frame, (iii) choose the sampling technique, (iv)
determine the sample size, (v) collect the data and (vi) assess the response rate.

223
By drawing on these stages, this research initially focuses on the definition of the
target population. Population is not only “a complete group of entities sharing some
common set of characteristics” (Zikmund, 2003, p. 369), but also “the universe of
units from which the sample is to be selected” (Bryman and Bell, 2007, p. 182). In
this stage, it is worth remembering the focus of the current research is the CF of
manufacturers in the FSC. While the region based comparison analyses and
justifications were earlier addressed in Section 1.5.2. FSC in Europe and North
America, it has been explained that the CF problem predominantly appears in Europe
whilst manufacturers in North America seems to be more mature in employing CF in
the FSC. The logic behind studying CF in relation to the perishable, seasonal,
promotional and newly launched products was further scrutinised in Section 1.5.4.
Time-sensitive and / or short-life product-groups in the FSC. Correspondingly, the
target population of the current research consists of manufacturers that
collaboratively forecast associated product-groups with retailers and are located in
the UK & Ireland, North America and Europe.
4.6.3.1.Sampling frame
By definition, a sample is “a subset or some part of a larger population” (Zikmund,
2003, p. 369). It is also known as “the segment of the population that is selected for
investigation” (Bryman and Bell, 2007, p. 182). In other words, sampling can be
defined as the procedure of “using a small number of items or parts of a larger
population to make conclusions about the whole population” (Zikmund, 2003, p.
369). Before the selection of the sample, it is important to clarify the sampling frame
of research, which is a “listing of all units in the population from which the sample
will be selected” (Churchill Jr. and Iacobucci, 2004. p. 182). Selecting a sampling
frame is not only a difficult task, but also a time-consuming process. For this reason
it has to be ensured that the frame adequately represents the target population
(Wilson, 2010; Malhotra et al., 1996)
In an attempt to select a rigid sampling frame for the food manufacturers, this
research benefited from a wide range of sources. For instance, when the social
networking service LinkedIn was utilised to reinforce the sampling frame, the
research exploited the online databases of Bloomberg, Financial Analysis Made Easy

224
(FAME) and Osiris. The websites of a vast number of food and beverage federations
were also taken into account during this process. The relevant contacts of the author,
who have managerial positions in food manufacturing companies, were also
considered as part of the sampling frame.
Previously, the motivation of the taking advantage of social networking sites during
the data collection process was justified in Section 4.4.1. This justification also
explains the logic behind regarding LinkedIn as part of the sampling frame of the
current research (Smith, 2014; Vermeiren and Verdonck, 2011). To be able to
provide sufficient data from LinkedIn, the research utilised the “Advanced People
Search Tool” of LinkedIn3, which makes it possible to classify members based on
particular criteria. Regarding the online databases, Bloomberg4 is an online database
that provides descriptive and statistical information about 52,000 companies around
the world. In a similar vein, FAME5 is a financial database and offers rating
information about companies. However, FAME is a rather UK and Ireland oriented
database and involves information only about companies located in these areas.
Identical to Bloomberg and FAME, Osiris6 is an international database that offers
both financial and descriptive information about companies around the world. These
databases were comprehensively utilised from the library of Brunel University.
Detailed descriptions of data collection from these databases are offered in section
4.6.4. Quantitative data collection stages.
Regarding the websites of food and beverage federations, by conducting an extensive
search via google, a vast number of federations, which active in the UK and Ireland,
Europe and North America, were explored. Then, the list of members of associated
federations was merged into the sampling frame of the current research. The
professional contacts of several managers, who have clear wisdom about the subjects
3 URL for Advanced People Search – LinkedIn: www.linkedin.com/search?trk=advsrch
4 URL for Database of Bloomberg:
http://www.brunel.ac.uk/services/library/databases/archive/bloomberg 5 URL for the UK and Ireland based Database of FAME:
http://www.brunel.ac.uk/services/library/databases/archive/fame OR
https://fame2.bvdep.com/version-
201442/Search.QuickSearch.serv?_CID=1&context=30K96PW86DKR8MQ 6 URL for the database of Osiris: https://osiris.bvdinfo.com/version-
2014512/Search.QuickSearch.serv?_CID=1&context=CNI65R6Y9LVIG9P OR
http://www.brunel.ac.uk/services/library/databases/archive/osiris

225
of interest, were also taken into account. In doing so, the sampling frame involved
food manufacturers that were found from LinkedIn, Bloomberg, FAME, Osiris and
the websites of associated federations and personal contacts of the author. Because a
vast number of lists was revealed through the sampling search process, the research
generated four selection criteria to be able to enhance the representativeness of the
sampling frame (Wilson, 2010).
These criteria involve candidate respondents’ (i) region, (ii) industry and (iii) the
product-groups that their company provides to retailers as well as (iv) seniority level.
The first criterion led to purifying candidate respondents based on regions, as the
research interest was to find respondents from the UK & Ireland, Europe and North
America. Although the candidate research process was conducted over the search
tool of LinkedIn, this research benefited from the internet encyclopedia of
Wikipedia7 to categorise the regions and countries of candidates in a transparent and
rational way. Because the intention here was to consider Europe in four segments
and to shed further lights on the CF of manufacturers located in particular areas,
candidate respondents were searched from six different regions: the UK & Ireland,
North America, Eastern Europe, Northern Europe, Southern Europe and Eastern
Europe.
Table 4.7 presents the target regions of the sampling frame and associated countries.
It is worth accentuating that the UK & Ireland, per se, are involved in the region of
Northern Europe. However, there is an abundance of research that depicts the
capabilities of manufacturers in the UK FSC and raises question marks over this area
(e.g. Adebanjo (2009), Adebanjo and Mann (2000), Francis et al. (2008), Taylor and
Fearne (2006) and Taylor (2006)). Adding further insight into the practices of
manufacturers located in these areas is the logic behind separating the UK & Ireland
from Northern Europe and considering them as a separate region.
7 URL for the classification of regions in Europe: http://en.wikipedia.org/wiki/Regions_of_Europe

226
Table 4.7. Target regions of the sampling frame
No Regions Countries comprised the associated region/s
1 United Kingdom &
Ireland The UK and Ireland
2 North America The USA and Canada
3 Eastern Europe Belarus, Bulgaria, Czech Republic, Hungary, Moldova, Poland,
Romania, Russian Federation, Slovakia, Ukraine
4 Northern Europe Denmark, Faroe Islands and Greenland, Estonia, Finland,
Iceland, Latvia, Lithuania, Norway, Sweden
5
Southern Europe
Albania, Andorra, Bosnia and Herzegovina, Croatia, Cyprus,
Greece, Italy, Malta, Montenegro, Portugal, San Marino, Serbia,
Slovenia, Spain, Turkey
6 Western Europe Austria, Belgium, France, Germany, Liechtenstein,
Luxembourg, Monaco, Netherlands, Switzerland
Source: Developed by the author
The second criterion considered the related industries of candidate respondents in
line with regions, which were selected based on the first criterion. The search tool on
LinkedIn likewise assisted the research to explore associated industries. By using the
keywords of “Food” and “Beverage”, the four most relevant industries were
identified for the selection of the sampling frame. These industries are “Dairy
Production”, “Food Production”, “Food & Beverages” and “Consumer Goods”. For
personal contacts and manufacturers that were found from databases and the
websites of federations, the research considered candidates that are in charge in the
dairy, beverage and food industries, which predominantly provide different types of
time-sensitive and / or short-life product to retailers.
Of the third criterion, the LinkedIn profile of members guided the research to reach
associated manufacturing companies’ websites. The research also looked at the
websites of candidates found from databases and the websites of federations to
analyse the product-groups of manufacturers. During this process, the author
comprehensively examined a vast number of manufacturers’ websites to ensure that
their product range involves time-sensitive and / or short-life products. In doing so, a
wide range of products, such as vegetables, fruits and poultry that are time-sensitive
and / or have short-life were taken into account under this criterion. This process
took long-time to ensure that clarity and accuracy over the sampling frame of this

227
research were maintained. This criterion clearly validates the claims of Malhotra et
al. (1996) and Wilson (2010) who stress that selecting a sampling frame is a
challenging and time-consuming task when the intention is to ensure that the frame
adequately represents the target population.
Finally, the research categorised candidates based on their position in the industries.
The classification of candidates was constituted in six groups by bearing in mind the
departmental responsibilities that matter in CF (Danese, 2007; Barratt, 2004; Helms
et al., 2000; Ireland and Bruce, 2000). The first group, therefore, involved
forecasters, forecast analysts and forecast managers. The second group focused on
marketing and sales managers while the third group was composed of supply chain
and logistics managers. The fourth and fifth groups consisted of production and
finance managers respectively. The final group involved candidates who have
different managerial positions, and was named as others. Consequently, the sampling
frame included the regions, industry and associated product-groups as well as the
seniority level of candidate respondents.
Through the utilisation of LinkedIn, Bloomberg, FAME, Osiris and the website of
federations as well as personal contacts, this research listed 5277 candidate
respondents comprising the sampling frame. It is clear that there is always a
limitation in the sampling frame of any research. This is because, each unit that was
not included in the sampling frame is more likely to cause non-coverage error, which
is also called non-sampling error. Therefore, it has to be borne in mind that some
characteristics of the population were not covered in the sampling frame of this
research (Bryman and Bell, 2007; Churchill Jr. and Iacobucci, 2004). In social
science research, it is argued that this is a common difficulty that researchers
confront. For instance, Churchill Jr. and Iacobucci (2004. p. 324) documented that
“there is rarely a perfect correspondence between the sampling frame and the target
population of interest”. Therefore, this research aimed to further justify the rigour of
the sampling frame and to mitigate the risks of arguments claiming that the frame
does not reflect the target population perfectly.

228
As a remedy, Wilson (2010) offered to compare the sampling frame with the
sampling frame of previous studies. Thereby, comparison analyses proceeded
between the sampling frame of this research and previous studies. Whilst the
sampling frame of this research included 5277 candidate respondents, the sampling
frame of previous studies changed from 250 to 5000 (please see, e.g. Flynn et al.
(2010) [4569], Hill and Scudder (2002) [931], McCarthy et al. (2006) [480], Mentzer
and Kahn (1995) [478], Vlachos and Bourlakis (2006) [250] and Zhou and Benton
Jr, (2007) [745]).
4.6.3.2.Sampling technique
There are two different types of sampling technique: probability (random) sampling
and non-probability (non-random) sampling. Based on the probability sampling,
“each population element has a known, nonzero chance of being included in the
sample”. In contrast, if the non-probability sampling is employed, “there is no way
of estimating the probability that any population element will be included in the
sample” (Churchill Jr. and Iacobucci, 2004, p. 324).
To put it another way, probability sampling ensures that every unit of the population
of interest has the same chance of being part of the sample (Wilson, 2010), and
therefore makes it possible to obtain a demonstrative outcome due to minimised
sampling error (Bryman and Bell, 2007). Because whole population is considered as
the candidate of the sample based on non-probability sampling technique, there is no
likelihood of deducing a statistical outcome (Churchill Jr. and Iacobucci, 2004). This
is the reason why non-probability sampling is largely preferred by qualitative
research and / or case studies while probability sampling is preferred in quantitative
research (Wilson, 2010). This inference provides further understanding why
“probability or random sampling has the greatest freedom from bias but may
represent the most costly sample in terms of time and energy for a given level of
sampling error” (Brown, 1947, p. 337). Non-probability sampling involves the quota,
snowball, convenience and purposive (or judgmental) sampling techniques. In
addition, probability sampling consists of simple random, systematic, stratified
random, cluster sampling, and multi-stage sampling techniques (Wilson, 2010;
Bryman and Bell, 2007).

229
Based on this rationale, the survey questionnaire reached all the list of the sampling
frame [5277] by employing the probability sampling of stratified random sampling
(Bryman and Bell, 2007). Stratified sampling is “where the population is divided
into strata (or subgroups) and a random sample is taken from each subgroup”, and
these subgroups can be candidate respondents’ region, seniority level and gender
(Wilson, 2010, p. 195). The criteria that conveyed the sampling frame in this
research constitute subgroups that group the population, which are the candidate
respondents’ (i) region, (ii) industry and (iii) the product-groups that their company
provides to retailers as well as (iv) seniority level. Stratified sampling is preferred
when the target population is heterogeneous and has high level variation. In these
cases, stratified sampling helps in collecting accurate data obtained over the sample
of the target population and reduces the risk of having sampling error (Wilson,
2010). Overall, due to this probability sampling ensures every unit has nonzero
chances of being included in the sample (Churchill Jr. and Iacobucci, 2004) the
probability of each unit that was included in the sample was known in this research
(Bryman and Bell, 2007).
4.6.3.3.Sample size
The literature is rich with the arguments that were dedicated to clarifying what
should be the correct sample size to be able to employ different statistical analysis
techniques (Hair et al., 2010). In essence, the notion of research philosophy
considered in academic research plays an important role in assessing the sufficiency
of a sample size (Wilson, 2010). For research that relies on the paradigm of
interpretivism, it is not necessary to have a large sample size owing to the lower
concern with generalising results for the population of interest (Bryman and Bell,
2007). On the other hand, if research adopts the positivist paradigm and intends to
generalise findings for a whole population, it is necessary to capture a large sample
size to recognise this purpose theoretically (Saudners et al., 2007).
There is a broad consensus among authors that sample size is associated with the
statistical method preferred for data analysis (Wilson, 2010; Hair et al., 2010;
Saunders et al., 1997). To be able to provide a rational judgment for the reader, this
research unified the suggestions of Saunders et al. (1997) and Wilson (2010).

230
Accordingly, the decision was made to assess the actual sample size and response
rate by (i) considering the characteristics of the sample data, which is dependent
upon the sampling technique, (ii) comparing the sample size and response rate with
prior studies, and (iii) analysing the features of appropriate data analysis techniques
to make sure of cohesiveness between the sample size and data analysis technique
selected.
The next section clarifies the stages followed to complete the data collection process.
These stages include the utilisation of LinkedIn, online databases of Bloomberg,
FEMA and Osiris and the websites federations as well as the personal contacts of the
author. The subsequent section is then dedicated to assessing the actual sample size
and response rate of the current research by considering the suggestions of Saunders
et al. (1997) and Wilson (2010).
4.6.4. Quantitative data collection stages
To capture quantitative data from the target population, the decision was taken to
randomly reach the whole list of the sampling frame involving the 5277 candidate
respondents. The data collection process of this research consisted of four stages, and
each stage proceeded in parallel to provide coherence over the data collected. These
stages are explained below.
4.6.4.1.Stage – 1: Social networking service LinkedIn
During this data collection stage, the author identified 475 candidates that were
strongly relevant to be part of the survey questionnaire. To be able to contact these
candidates, the author initially upgraded his LinkedIn membership from the free
account to the premium account. Although this way was expensive, it accelerated the
data collection process and allowed the research to contact relevant candidates first
hand. Then, the candidates were contacted via the LinkedIn message service. The
initial message involved a short paragraph that introduced the aim of the survey
questionnaire and clarified the merit of filling in the survey. The link to the online
survey questionnaire was also shared in the LinkedIn message, which made it
possible to further inform candidates with a concise cover letter and to accelerate the

231
data collection process. This was the first phase of reaching the candidate
respondents from LinkedIn.
For reminder emails, the full list of email addresses of the candidate respondents
was, one by one, transferred to the online survey software and insight platform of
Qualtrics8. The current research took advantage of the mass e-mailing features of
Qualtrics and shared the survey questionnaire with candidates straightforwardly. It is
worth stressing that the research provided an informative cover letter for candidate
respondents, which is vital for any survey questionnaire (Wilson, 2010). The cover
letter clarified the nature of the research, objectives to achieve and the expected
benefits that respondents would obtain. The ethical procedures of the research were
also concisely noted in the cover letter to encourage the participation of respondents
to the survey questionnaire. The statement of ethics approval of this research is
presented in APPENDIX-IV, which was approved by the Research Ethics
Committee of Brunel Business School. Furthermore, respondents were offered a
summary of the research results via cover letter (Diamantopoulos and Winklhofer,
2001). At this stage, the research accurately reached all 475 respondents; however,
only 70 usable survey questionnaires were received. Due to non-respondents and
company procedures that prevented managers from being part of the survey, the
research did not receive return from the rest of 405 respondents. This accordingly
allowed the research to have a 14.74 percent response rate over the business oriented
social networking service LinkedIn.
Before proceeding to the second stage, which relies on the online databases of
Bloomberg, FAME and Osirirs, it is worth clarifying the benefits of using a web-
based survey questionnaire and the online survey software of Qualtrics. By
benefiting from the free membership feature of Qualtrics, a valuable opportunity
arose to send reminder emails for LinkedIn-based candidates at once, and to save
time for the delivery of surveys. Web-based surveys are beneficial to mitigate
missing data, continuously track the progress of each survey, and to reach a vast
number of candidates from different regions (Bryman, 2004). By benefiting from the
extensive survey design feature of Qualtrics, this research obliged respondents to
8 The URL of online survey software Qualtrics: http://www.qualtrics.com/

232
complete each question in the survey, as the system did not allow respondents to
proceed to the following question. In doing so, this research did not have any
missing data. The online survey software of Qualtrics has also a feature of limiting
multiple responses, because of which the accuracy and reliability of quantitative data
were maintained in this research. In addition, employing a web-based survey
guaranteed confidentiality and anonymity to encourage respondents to be part of the
research (Bryman, 2004). Web-based surveys ease the ways of recording data and
transferring them to data analysis software, which allows to save more time for the
data analysis process (Bryman and Bell, 2007; Bryman, 2004).
4.6.4.2.Stage – 2: Online databases of Bloomberg, FEMA and Osiris
In the second stage, the author extensively benefited from the library of Brunel
University having access to these databases, and discovered 3517 candidate
respondents as part of the sampling frame. Initially, the email addresses of the
candidates were, one by one, registered with Qualtrics and additional information
was recorded such as the name, position and region of candidates. This detailed
registration was time-consuming, but resulted in an ability to track the progress of
respondents. When the registration process was completed and the author ensured
that the full list of candidates were in the system of Qualtrics, the survey
questionnaire was delivered to candidates at once by using the mass e-mailing
feature of Qualtrics.
Nevertheless, the outcome of this stage was not promising like LinkedIn. Although
2012 survey questionnaires arrived with candidates, the research obtained only 5
usable survey questionnaires. The rest of the 1505 survey questionnaires did not
reach the candidates because of the emails that were out of use. For reminder emails,
the author re-sent the survey questionnaire to 2012 candidate respondents that had
received the survey beforehand, yet the number of returned survey questionnaires did
not change. Therefore, this stage caused 2007 non-respondents, who did not respond
to the survey questionnaire due to the restricted company procedures. The data
collection process over this stage was completed with a 0.25 percent response rate. It
can be argued that these databases involve a wide range of information about
companies and managers around the world, but the frequency of updating existing
233
data is still a question mark. This is because, although there was a wide range of
financial and descriptive information about companies, it was not transparent
whether the contact information about the candidates was updated. Therefore, this
stage did not provide a valuable contribution to the data collection process of this
research.
4.6.4.3.Stage – 3: Websites of food and beverage federations
In the third data collection stage, the aim was to reach candidates identified from the
websites of food and beverage federations operating in the UK and Ireland, Europe
and North America. At this stage, the research revealed 1260 appropriate
manufacturers that were eligible to be part of the research. As happened in the first
and second data collection stages, the email addresses of candidates were registered
with the system of Qualtrics, and then the survey questionnaire was delivered to all
candidates at once.
Because the survey questionnaire was delivered over the online software of
Qualtrics, the research ensured that 923 emails arrived whilst 337 did not reach the
target respondents due to the emails being out of use. For reminder emails, this
research unfortunately could not benefit from the online software of Qualtrics, unlike
in stages one and two. This is because the online software has a particular quota that
can be used free by members during the survey delivery process. This research had
already exceeded that quota over the first and second stages. Hence, the reminder
emails were delivered to 923 candidates directly by the email address of the author.
Sending reminder emails became one of most challenging and time-consuming tasks
at this stage. Overall, this stage made it possible to have 17 usable respondents and
906 non-respondents due to the limitations of companies refusing to join the survey.
As a result, the third stage of the data collection process, which relied upon the
websites of federations, was completed with a 1.84 percent response rate.
4.6.4.4.Stage – 4: Personal contacts of the author
In the final data collection stage, the author benefited from personal contacts and
attempted to contact 25 candidates who were working in food manufacturing
companies. Unlike previous data collection stages, a printed survey questionnaire

234
became the method of reaching candidates. Initially, the author contacted candidate
respondents by phone and informed them about the aim of this research and the
progress of the survey questionnaire. During the phone call, 5 candidates were not
found and 7 candidates did not agree to be part of the survey due to the company
procedures that prevented them from sharing corporate information. Therefore, 13
candidates were considered to deliver the survey.
For the delivery of the survey questionnaire, the author preferred to make an
appointment during the phone call with these 13 candidates and to deliver the survey
questionnaire first hand instead of using a prepaid envelope. For the rest of the 5
candidates, who were not found by phone call, the survey questionnaire was posted
to candidates with prepaid envelopes. Unfortunately, the research did not receive any
return from those 5 candidates. The research fortunately received 13 usable surveys
from candidates to whom the survey questionnaires were delivered by visits.
Consequently, the final data collection stage managed to obtain 13 usable survey
questionnaires, and was completed with a 65 percent response rate.
In summary, the data collection process of this research was designed based on four
stages, which involved the business oriented social networking service LinkedIn,
online databases of Bloomberg, FAME and Osiris, and the websites of food and
beverage federations as well the personal contacts of the author. Overall, the research
attempted to deliver the survey questionnaire to all 5277 candidates that constituted
the sampling frame. While 3430 emails reached to these candidates, 105 usable
surveys were obtained which led to a 3.06 percent response rate at the end of the data
collection process. The summary of each data collection stage is presented in Table
4.8.

235
Table 4.8. Outcomes of quantitative data collection stages
Number of
Stage Type of Contact Survey
delivered
Survey did
not reach
Survey
reached
Non-respondents &
surveys restricted
due to company
procedures
Survey
returned
Response
rate
(percent)
1
LinkedIn message
475 0 475 405 70 14.74 Online software of
Qualtrics (Reminder)
2
Databases of Bloomberg, FEMA and Osiris
Online software of
Qualtrics 3517 1505 2012 2007 5 0.25
Online software of
Qualtrics (Reminder)
3
Websites of food and beverage federations
Online software of
Qualtrics 1260 337 923 906 17 1.84
(Reminder)
4
Personal contacts
Printed survey
questionnaire 25 5 20 7 13 65
Total: 5277 1847 3430 3325 105 3.06
Source: Developed by the author
4.6.5. Assessment of sample size and response rate
The response rate represents the number of candidate respondents who successfully
completed the survey questionnaire divided by the number of candidates identified in
the sample of the research (Wilson, 2010). Whilst the target sample of the current
research was 5277, the number of respondents that agreed to complete the survey
questionnaire was 105. This means that this research has to make theoretical
inferences based upon 105 usable responses representing a 3.06 percent response
rate.
Despite the fact that the research conducted the data collection process over four
different stages and applied the three different methods of online software of
Qualtrics, email and printed survey questionnaire, the response rate only reached
3.06 percent. This is evidence that the data collection process is one of the most
difficult tasks and requires an extensive effort to obtain sufficient usable responses
from surveys (Wilson, 2010; Saunders et al., 1997). This outcome is also in line with
the study by Cycyota and Harrison (2006), who warned researchers that there is a

236
substantially reduced response rate in survey based studies. However, having a low
response rate and / or sample size do not necessarily mean that the theoretical
contributions of the current research are not representative of the target population
(Saunders, 1994).
Research findings can still provide valuable insights as there are similar studies
based on low response rate and sample size (please see, e.g. Melewar et al. (2000)
and Melewar and Saunders (1998)). In this regard, the current research provides a
rationale for the small sample size and response rate by (i) considering the
characteristics of sample data, (ii) comparing the sample size and response rate with
prior studies and (iii) analysing the features of candidate data analysis techniques,
which will lead to ensuring that there is a rigid correspondence between the sample
size and data analysis technique selected (Wilson, 2010; Saunders et al., 1997).
4.6.5.1.Characteristics of sample data
Despite the small sample size and response rate, it is important to ensure that the
characteristics of the data are accurate enough to represent the target population
(Saunders et al., 1997). It is therefore worth underlining that reflecting the
characteristics of the population in the characteristics of the sample data hinges
heavily upon the sampling technique used to select a sampling frame (Wilson, 2010).
This research employed the probability of stratified sampling technique to be able to
select the sampling frame (Bryman and Bell, 2007). While the most considerable
weakness of this technique is to be time-consuming in selecting the subgroups of the
population in a rational and justifiable way, it is superior to all other probability
sampling techniques owing to the feature of making it possible to acquire vital sub-
populations as representative of the population (Malhotra and Birks, 2006).
In other words, as the sampling frame criteria of the current research captured target
regions, industries, time-sensitive and / or short-life product-groups as well as the
seniority levels of candidate respondents, it is reasonable to argue that the sample
captured relevant characteristics of the population (Wilson, 2010). Due to the rigid
survey design, this research also did not have any missing data because respondents
were obliged to respond to each question in the survey. Consequently, it can be

237
defended that the existing data is sufficiently accurate to discuss the findings based
on the limited sample and response rate.
4.6.5.2.Comparison analysis for sample size and response rate
Comparing the sample size and response rate of this research with previous studies
seems a reasonable way to clarify the power of existing data (Wilson, 2010;
Saunders et al., 1997). Despite the unfortunate usable samples and response rate, it is
realistic to argue that this research exhibited a widespread effort to reach a
considerable number of candidates. For instance, when Zhou and Benton Jr, (2007)
surveyed manufacturers in North America to evaluate their supply chain and
information sharing practices, the authors delivered only 745 surveys and obtained
an 18 percent response rate with 125 usable samples. Due to advantage of persuading
a large part of the sampling frame to fill in their survey, the response rate rose yet the
sample size was not excessive in their study. This sample size also did not prevent
the study from offering rigid contributions to the literature. In a similar vein, the
study by Zhou et al. (2014) had an 18 percent response rate with 125 usable samples,
and offered implications to practice in terms of the information quality and supply
chain practices of partners, like Zhou and Benton Jr, (2007).
On the other hand, Flynn et al. (2010) contacted 4569 companies, and 1356 surveys
were delivered to respondents. This study obtained a 13.5 percent response rate with
617 usable responses, and extended the body of literature on the supply chain
integration practices of manufacturers. In response to these studies, this research
overall delivered 5277 survey and 3430 surveys reached respondents. Even though
the number of surveys sent to respondents was much higher than these studies, only
105 surveys were usable. However, in the LinkedIn-based data collection stage, the
research obtained a 14.74 percent response rate with 70 usable responses while the
final stage, which was based on a printed survey questionnaire, managed to obtain a
65 percent response rate with 13 usable surveys. These two stages alone enabled the
research to obtain 83 usable responses and a 16.76 percent response rate. It is
apparent that the response rate of the current research declined to 3.06 percent owing
to the intention of reaching candidates from online databases and the websites of
food and beverage federations. In other words, these comparisons clarify that even

238
though the response rate is reasonably low, the research has adequate sample size to
argue for its contributions to the literature.
Supporting this, McCarthy et al. (2006) contacted 480 forecasting executives and
obtained only 86 usable responses, which is below the sample of this research. This
small sample size did not prevent the study from extending the body of forecasting
knowledge about diverse forecasting methods and presenting various criteria for
practitioners in evaluating the effectiveness of forecasts. In a similar vein, Sanders
and Manrodt (2003) emailed 2394 surveys, 50 of which did not arrive due to address
errors, and obtained 240 usable responses. This enabled the study to explore major
differences between organisations that employ judgmental and quantitative
forecasting methods based on a 10.3 percent response rate. Overall, it can be argued
that the sample size of the current research is, more or less, adequate to claim its
findings as a contribution to the literature and practice, since the literature witnesses
similar studies that have small samples. The reason behind having a low response
rate is also explored, which is because of online databases and the websites of
federations limiting number of respondents. The reliability of LinkedIn can be
advocated too, since this social networking service made it possible to accurately
reach all candidate respondents first hand.
4.6.5.3.Types of data analysis technique
It is clear that the existing sample size, predominantly, leads to choosing “the
analytical techniques that can be used” to test hypothetical relationships (Reynolds et
al., 2003, p. 87). Whilst the sample size of the research is one of the determinants of
selecting the most appropriate technique, it is also worth considering the structure of
the constructs, model complexity and research objectives to ensure the reliability of
the research findings found from the data analysis technique used (Peng and Lai,
2012). Literature offers different types of statistical analysis techniques, the most
common ones being Structural Equation Modeling (SEM) and PLS (Hair et al.,
2010; Byrne, 2010).
SEM is “a statistical methodology that takes a confirmatory (i.e. hypothesis-testing)
approach to the analysis of a structural theory bearing on some phenomenon”

239
(Byrne, 2010, p. 3). On the other hand, PLS is a statistical analysis technique that
“focuses on explanation of variance (prediction of constructs) rather than covariance
(explanation of relationships between items)” (Hair et al., 2010, p. 775). In other
words, while SEM puts emphasis on the confirmation of causalities between
constructs, PLS is rather exploratory and clarifies overall variances in a conceptual
model (Peng and Lai, 2012). There are an abundance of studies which employed the
confirmation oriented SEM technique (e.g. He et al. (2013), Ramanathan and
Muylderman (2010) and Ramanathan and Gunasekaran (2014)) while others relied
upon the exploratory technique of PLS (e.g. Braunscheidel and Suresh (2009), Perols
et al. (2013), Oh et al. (2012) and Sawhney (2013)).
Hence, before justifying the data analysis technique of the current research in the
following chapter, it seems worthwhile to scrutinise these two techniques and to
compare their strengths and weaknesses. One of the most favoured features of SEM
is to rely on causalities among hypotheses, and then to evaluate the complete
conceptual model at once. In doing so, it generates fit statistics for the researcher
which are used to theoretically validate the conceptual model based on existing data
(Byrne, 2010). Due to its parameter oriented feature, SEM is favoured in studies
which are purely based upon well-known theories (Peng and Lai, 2012). By
employing SEM, the researcher can test latent constructs that have multiple observed
variables as well. It is beneficial for studies that are dependent upon experimental,
non-experimental and cross-sectional as well as longitudinal data (Lei and Wu,
2007).
Nonetheless, it is limited when it comes to analysing conceptual models relying on a
limited sample size (Peng and Lai, 2012). The most common rule of thumb for SEM
is to have a minimum of 200 usable responses (Shah and Goldstein, 2006), and the
essential sample size is more likely to increase based on the complexity of model. It
is also restricted when it comes to analysing hypothetical relationships between
constructs that have a limited number of measurement items. If, for instance, a
construct is represented by one or two observed variables, SEM is not appropriate to
analyse such causalities in conceptual models (Hair et al., 2010). Because SEM
needs a large sample size, conceptual models with high complexity require a large

240
number of observations to validate hypotheses. This, in turn, reduces its utility for
studies involving complex conceptual models (Peng and Lai, 2012; Hair et al.,
2010). Another shortcoming of SEM is relevant to the structure of constructs. If the
conceptual model has formative constructs, SEM is not appropriate to estimate
hypothetical relationships (Jarvis et al., 2003). The logic behind this limitation is
about the structure of formative items. In detail, while reflective constructs
determine observed variables, formative constructs are, inversely, determined by
formative items (Diamantopoulos and Winklhofer, 2001; Chin, 1998b). Therefore,
employing SEM in such cases brings about zero covariance between constructs
(MacCallum and Browne, 1993).
In response to these strengths and weakness of SEM, this research firstly has low
sample size, 105, which is under the minimum threshold value of 200. This, in turn,
represents the first obstacle of choosing SEM as a proper technique (Lei and Wu,
2007; Kline, 2005). Secondly, the conceptual model of the current research involves
a construct evaluating the two foremost observed variables, which are to achieve
long-term and accurate CF (please see the construct of Collaborative Forecasting
Performance in Figure 3.1. The CF practice). SEM is merely capable of testing
constructs that have a minimum of three or more observed variables, and this
limitation represents the second obstacle with using SEM (Hair et al., 2010).
Thirdly, the literature does not suggest SEM if the conceptual model is highly
complex as it requires a large number of observations (Peng and Lai, 2012). This
research has both low sample size and aims to test thirteen different hypothetical
relationships over ten constructs. It is therefore reasonable to claim that the
conceptual model is too highly complex for the employment of SEM. If SEM is
employed in such conditions, the model of this research is most likely to cause
unacceptable results (Hox and Maas, 2001).
Finally, the hypothesised relationships in this research depend on a single formative
construct, which aims to achieve long-term and accurate CF in the FSC. This
formative construct, namely the CF practice, is formed by five variables (for detail
please see, Chapter 5, Section 5.3. Development of a formative construct: The CF
practice). Hence, its existence in the conceptual model engenders another significant

241
limitation in using SEM (Vinzi et al., 2010; Jarvis et al., 2003; Chin, 1998a). While
these shortcomings prevent the application of SEM for the current research, literature
witnesses studies that applied PLS to validate conceptual models. For instance, when
a study by Braunscheidel and Suresh (2009) aimed to increase the supply chain
agility of manufacturers, the authors favoured PLS. Their response rate was 7.4
percent due to 218 usable responses. Despite the tolerable sample size, the authors
preferred PLS to increase the trustworthiness of the complex conceptual model,
involving twelve hypothetical relationships. Literature is also wealthy in similar
studies favouring PLS as a proper technique (please see, e.g. Claassen et al. (2008),
Oh et al. (2012) and Sawhney (2013)).
The sense behind applying PLS relies upon its feature, because it addresses “a wider
range of problems given its ability to work efficiently with a much wider range of
sample size and model complexity and its less strict assumptions about the
underlying data” (Hair et al., 2010, p. 777). It is essential to estimate the required
sample size for only complex conceptual models. Literature, for instance, offers the
“10 times” rule of thumb based on the number of formative items and / or
endogenous variables in estimating the minimum sample size. This therefore hints at
the necessity of a minimum of 70 usable responses for the conceptual model of this
research (Peng and Lai, 2012; Chin, 1998a).
Whilst SEM is not appropriate to analyse constructs that have one or two observed
variables, PLS, in contrast, is capable of evaluating hypothetical relationships
between constructs having a limited number of observed items (Hair et al., 2010).
On the other hand, because SEM needs a large sample size to analyse complex
conceptual models, the existence of thirteen different hypothetical relationships over
ten constructs in the conceptual model of this research constitutes another drawback
that limits the application of SEM. Finally, employing SEM for conceptual models
having formative constructs engenders inadmissible results (Hox and Maas, 2001),
but PLS is capable of testing conceptual models with formative constructs (Jarvis et
al., 2003; Diamantopoulos and Winklhofer, 2001).

242
Overall, this comparison clarifies that PLS is superior to SEM based on the existing
sample size and the structure of the conceptual model in this research. Taking into
account the preferences of prior studies in terms of techniques used to analyse their
conceptual models also made it possible to underpin the suitability of PLS for this
research. Because of this, PLS is considered as most suitable technique to analyse
hypothetical relationships.
4.7. Summary
This chapter was dedicated to explaining the methodological foundation of the
current research and justifying the data collection process in a rational and legitimate
way. The initial intention here was to provide a clear understanding of the approach
and epistemological paradigm of the current research. Therefore, the reasons behind
adopting the deductive approach were discussed by considering the theoretical
validations. Then, further clarification was brought to the philosophical stance.
By scrutinising the qualitative and quantitative research strategies, a clear
understanding of their strengths and weaknesses was provided. This in turn provided
a reasonable justification, as the aim and objectives of the current research were
intended to be achieved by using the triangulation strategy. The research design was
also scrutinised and portrayed, the intention being to construct a time-based plan that
clarifies the research process in a logical and chronological way to answer the
research questions. Rationale was also provided for the business oriented social
networking service of LinkedIn used during the qualitative and quantitative
collection processes.
In terms of the qualitative data collection process, it was aimed at elaborating the
reasons for selecting the qualitative data collection methods of semi-structured
interviews and online group discussions. The associated data analysis technique of
QSR NVivo 9 was also discussed in an effort to provide further insight into its
impact on the qualitative contributions. Following this, the outcomes of the
qualitative data analysis process were conveyed to the reader in an unbiased manner.
At the end of the qualitative data collection process, the research primarily
developed valuable hypotheses that had the support of the literature and pragmatic

243
views while finalising the form of the conceptual model made it possible to initiate
the quantitative data collection process.
As far as the quantitative data collection process is considered, effort was made to
clarify its significance in generalising research findings in the research field.
Thereby, the quantitative data collection method of the survey questionnaire was
justified based on theoretical procedures. Presenting 26 studies that employed this
method beforehand was one justification for the reliability of the survey
questionnaire as a quantitative data collection method of this research. Given the
importance of survey questionnaire design in collecting accurate data, further
attention was paid to understanding the survey design process, which proceeded
under the guidelines of Churchill Jr, (1979) and Flynn et al. (1990).
In terms of the target population and sampling, the population of the research
involved manufacturers from the UK and Ireland, North America and Europe, where
they collaboratively forecasted time-sensitive and / or short-life product-groups with
retailers. Thereby, it was ensured that the characteristics of the target population suit
the research domain. In an attempt to select a rigorous sampling frame, this research
benefited from a wide range of sources. The business oriented social networking
service LinkedIn, for instance, was used to reinforce the sampling frame. The online
databases of Bloomberg, FAME and Osiris provided a vast number of relevant
candidates while the websites of relevant federations offered a considerable number
of samples. By considering the personal contacts of the author, the sampling frame
was similarly enlarged. This research then generated four selection criteria to be able
to enhance the representativeness of the sampling frame. These criteria were based
upon candidate respondents’ (i) region, (ii) industry and (iii) the product-groups that
their company provides to retailers as well as (iv) seniority level. At the end of the
process, 5277 candidate respondents were listed in the sampling frame.
To collect quantitative data, the decision was made to reach the whole list of the
sampling frame involving the 5277 candidate respondents acquired from LinkedIn,
the online databases of Bloomberg, FEMA and Osiris, and the websites of food and
beverage federations along with the personal contacts of the author. The data
244
collection process was completed through four different stages with each stage
proceeding in parallel to maintain the coherence of the data collection. The first data
collection stage relied upon the LinkedIn-based candidates, which led to a 14.74
percent response rate. The second data collection stage focused on the online
databases of Bloomberg, FEMA and Osiris. The research obtained only a 0.25
percent response rate for this stage.
The third data collection stage focused on the candidates found from the websites of
food and beverage federations, in which the research captured a 1.84 percent
response rate. The final data collection stage was dedicated to the personal contacts
of the author, and this stage was completed with a 65 percent response rate. Overall,
the research delivered survey questionnaires to all 5277 candidates that constituted
the sampling frame. While 3430 surveys touched these candidates, 105 usable
surveys were obtained which led to have a 3.06 percent response rate at the end of
the data collection process.
The research obtained few usable samples and a small response rate. The decision
was therefore made to assess the achievability of the usable samples and response
rate based on three assumptions. These were to (i) consider the characteristics of the
sample data, (ii) compare the sample size and response rate with prior studies, and
(iii) analyse the features of candidate data analysis techniques to ensure that there is
a rigid rationality between the sample size and data analysis technique selected. It is
known that reflecting the characteristics of the population in the characteristics of
sample data is heavily dependent upon the sampling technique used to select a
sampling frame. Because the probability of stratified sampling technique led the
research to select the sampling frame, the sampling frame criteria of the current
research captured target regions, industries, time-sensitive and / or short-life product-
groups as well as the seniority levels of candidate respondents.
Regarding the sample size and response rate of prior studies, the comparative
analyses clarified that the research displayed a widespread effort to reach 5277
candidates while prior studies reached much fewer candidates. Although having a
3.06 percent response rate was considerably low, it was, more or less, in line with

245
prior studies, as there are studies with a lower sample size that have extended the
body of literature and provided implications to practice. Furthermore, analysing the
features of the candidate data analysis techniques led the research to have clear
wisdom that the proper data analysis technique is PLS, in which the rationale for this
technique is further scrutinised in the following chapter.

246
5. CHAPTER 5: DATA ANALYSIS AND FINDINGS
5.1. Overview
Subsequent to Chapter 4, this chapter clarifies the data analysis procedures. The prior
chapter addressed alternative data analysis techniques and intended to clarify the
leading reasons for favouring the data analysis technique of PLS. Yet before
explaining the data analysis procedures, this chapter gives a rationale for the
employment of PLS based on theoretical and pragmatic assumptions. This
justification aims to enhance the rigour of the data analysis process and to underpin
the reasons behind the selection of PLS.
As the existence of a formative construct in the conceptual model, namely the CF
practice, was stressed previously, the development of a new formative construct is
likewise elucidated. The comprehensive survey design allowed the research to obtain
descriptive information about the target population. Hence, the outcomes of
descriptive statistics are presented to clarify the characteristics of the samples. Given
the large number of non-respondents and small samples obtained during the data
collection stages, non-respondent bias is also evaluated to ensure that the findings
are unbiased. Accordingly, this chapter;
Examines the measurement model for reflective constructs over the related
procedures, comprising several reliability and validity analyses, to evaluate
relations between constructs and their observed variables.
Analyses the measurement model for the formative construct of the CF practice
by considering related procedures to validate the relationships between the
construct and its formative items.
Explains multiple model fit techniques used to validate the conceptual model in
PLS in an attempt to enhance the trustworthiness of the model and to generalise
its practicability.

247
Presents the hypothetical relationships in the model and describes their statistical
correlations to extend existing knowledge for the forecasting and supply chain
phenomena.
Assesses the size of path coefficients between the constructs to shed light on the
importance of constructs for managerial implications.
5.2. Rationale for using Partial least squares (PLS)
The PLS technique is an exploratory approach that weights observed variables of
constructs to evaluate the degree to which one part of the conceptual model predicts
another part of the model (Peng and Lai, 2012; Vinzi et al., 2010). PLS has
capabilities of plotting several dependent variables in the same model and evaluating
all relationships synchronically. It explicitly distinguishes itself from several
techniques by considering reflective and formative variables in the same model
simultaneously (Grefen et al., 2000). However, statistically, it follows a different
route compared to the confirmatory technique of SEM (Chin, 1995). Like SEM, it
does not estimate the maximum likelihood for optimum predictions; instead PLS
evaluates variables of the model via bootstrapping (Byrne, 2010; Hair et al., 2010).
To ensure that PLS is the appropriate technique within the existing conditions of the
current research, the four rigour assumptions of Peng and Lai (2012) were taken into
account. These assumptions involve (i) exploratory research objectives, (ii) small
sample size and the complexity of the conceptual model and (iii) the properties of
existing data, and (iv) the existence of formative constructs in the model.
Firstly, due to the scarcity of empirical studies involving the CF of manufacturers in
the FSC (Småros, 2007), this research is designed to explore the degree to which
factors from different research themes are associated with the performance of CF in
dyadic manufacturer-retailer collaborations. The research was particularly extended
to manufacturers’ CF when they collaboratively forecast perishable, seasonal,
promotional and newly launched products with retailers. This outlook enabled the
research to explore concrete and precise outcomes over the research themes of
supply chain integration, forecasting process and information sharing. With the
combination of systemic review, qualitative data and grey literature, several

248
exogenous variables were hypothesised to clarify the predictive power of relevant
endogenous variables. In this regard, these hypothetical relationships match the
requirements of the PLS technique (Lohmöller, 1989).
The reason behind this justification is that whilst SEM is appropriate to confirm how
existing data fits the theory as the representative of the population, this research
further adds insight to the relationships of a broad range of theoretical constructs,
necessitating the PLS technique (please see, e.g. Cheung et al. (2010)). Supporting
this, Peng and Lai (2012, p. 469) recommend that “if the nomological network has
not been well understood and researchers are trying to explore relationships among
theoretical constructs and to assess the predictive validity of the exogenous variables,
then PLS can be considered”. Therefore, this evidence underpins the research to
validate the first assumption of Peng and Lai (2012).
Secondly, the statistical power and reliability of findings in SEM rely heavily on a
large sample size (Shah and Goldstein, 2006). For SEM, the literature recommends a
minimum of 200 observations (Lei and Wu, 2007; Kline, 2005), and suggests having
a sample size from 5 to 20 times of the number of observed items (Tanaka, 1987;
Bentler and Chou, 1987). On the other hand, the “10 times” rule of thumb is offered
for PLS to estimate the required sample size (Peng and Lai, 2012; Chin, 1998a).
According to this rule, the numbers of formative items and / or endogenous variables
are considered. This research has five formative items, representing the CF practice,
and seven dependent variables along with overall forty-six observed variables. In the
worst case of considering the number of dependent variables, existing assets oblige
the research to have a minimum of 70 (e.g. 7 x 10) usable samples to be able to take
advantage of PLS. This requisite clearly matches the existing sample size of 105.
However, when it comes to employing SEM based on the structure of the conceptual
model, the sample size had to be 230 to 930 (e.g. 46 x 5 to 46 x 20). Accordingly,
these procedures clearly suggest that PLS is the most appropriate technique to
analyse the conceptual model of the current research.
Regarding the complexity of the conceptual model including multiple endogenous
variables, PLS seems more appropriate for data analysis, since such a complexity

249
causes additional model identification and convergence issues for SEM, and this in
turn requires larger sample size (Peng and Lai, 2012). In detail, this research
intended to test thirteen different hypothetical relationships over ten constructs.
Favouring SEM in the existing situation of research gives rise to have unacceptable
results (Hox and Maas, 2001). On the other hand, the repetitive feature of PLS
makes it possible to analyse mediations and several dependent variables in a single
model by separately analysing measurement models over path coefficients and factor
loadings. This feature favours the PLS technique with a sufficient sample size (Peng
and Lai, 2012; Helm et al., 2010). It is worth remembering the study by
Braunscheidel and Suresh (2009), who preferred PLS to increase the reliability of a
conceptual model involving twelve hypothetical relationships.
In terms of observed variables, minimum four and maximum seven items
represented each construct to ensure that there are a sufficient number of items
capturing the value of each construct as was suggested by Churchill Jr, (1979). Using
a large number of observed variables for each construct reduced the sample size,
since the time required for respondents to complete the survey increased. However, it
reduced bias in terms of estimating the strength of reflective constructs and
underpinned the choice of PLS (Peng and Lai, 2012). This is also another supportive
determinant because having a large number of observed variables in the survey
enables the research to increase the reliability of PLS results, which is an important
matter of generalising results for the target population.
Thirdly, it is clear that the existing data for SEM should have multivariate normal
distribution. If not, it causes errors and increases fit statistics in models (MacCallum
et al., 1992). Due to the regression based feature of PLS, without assuming the
population and scale of measurement it evaluates nominal, ordinal and interval
variables (Peng and Lai, 2012; Fornell and Bookstein, 1982). Given the five-point
Likert-type scales employed for the survey questionnaire, the scales in this research
already comprise only nominal and ordinal variables. Therefore, PLS is more
appropriate for sustainable data analysis, confirming the third assumption of Peng
and Lai (2012).

250
Finally, due to the lack of capability of SEM to test structural models that have
formative constructs, PLS is more effective for data analysis (Peng and Lai, 2012).
SEM indicates zero covariance between indicators (MacCallum and Browne, 1993),
but ordinary least squares analyses in PLS make it possible to identify iterative
models. This feature makes PLS superior to SEM in analysing models that have both
reflective and formative constructs (Vinzi et al., 2010; Chin, 1998b; 1998a). This is
because the literature offers PLS if the structural model includes formative
constructs (Diamantopoulos and Winklhofer, 2001). Given the fact that this research
has a formative construct, it is essential to employ PLS to be able analyse
hypothetical relationships in an accurate manner. These analyses therefore validate
the final assumption of Peng and Lai (2012). The following section justifies the
development of the formative construct: The CF practice.
5.3. Development of a formative construct: The CF practice
The CF practice was defined based upon five different formative items that capture
its entire aspect and represent major preconditions for the long-term and accurate CF
in the FSC. These formative items are trust, commitment and a joint business plan as
well as consensus-based internal forecasts along with the sharing of order forecasts.
The logic behind developing the CF practice and selecting these formative items
from the literature were clarified in Section 3.2.1. The CF practice. Thus, this section
aims to give theoretical validation to the formative structure of the CF practice.
Because these five items earned the support of both literature and qualitative data,
they underpin the content validity of CF. They also became the representative of the
CF practice in the survey. During the development of the survey and pilot-tests, four
academics and four practitioners examined each item, which led to validating their
theoretical and practical feasibility as was suggested by Andreev et al. (2009). There
is a broad range of misspecification for formative constructs in operations
management and information systems research (Roberts et al., 2010; Petter et al.,
2007) that cause Type I or II errors. To be able to provide a theoretical definition for
the CF practice, this research adopts the four criteria of Jarvis et al. (2003). These
criteria are (i) direction of causality from items to construct, (ii) unnecessary

251
interchangeability of items, (iii) unnecessary covariation among the indicators, and
(iv) different nomological net of the indicators.
Firstly, the formative construct of the CF practice was defined by combinations of
trust, commitment and joint business plan as well as consensus-based internal
forecasts along with the sharing of order forecasts. Initially, the outcomes of the
systematic review enabled the research to explore these items as vital determinants
for CF. This first step explains that these items emerged from the literature
(Diamantopoulos and Winklhofer, 2001). These items were also underpinned by the
single semi-structured interview, three online group discussions and the review of
grey literature. The CF practice in this research is defined as a “trust and
commitment based collaborative forecasting practice which links the business plans
of partners who generate consensus-based internal forecasts and share order
forecasts with each other”. This definition suggests that each item is essential to take
advantage of the CF practice. In other words, without having any one of these items
it is not possible to constitute the CF practice (Chin, 1998b).
While reflective constructs determine observed variables, formative constructs, in
contrast, are determined by observed formative variables (Peng and Lai, 2012). To
put it another way, “for formative measurement models, the direction of causality
flows from the measures to the construct, and it flows from the construct to the
measures for reflective measurement models” (Jarvis et al., 2003, p. 203). Given the
definition and structure of the CF practice, potential changes in any one of these
items cause changes to the structure of CF but not vice versa. This approach clearly
shows that the direction of causality in this construct is from the associated five
items to the CF practice. Therefore, each item has an impact on the implementation
of the CF practice (Diamantopoulos and Winklhofer, 2001). This outcome
accordingly validates the first criterion of Jarvis et al. (2003).
Secondly, the CF practice is comprised of five different items, and each item adds its
own unique characteristics to the domain of this construct. The unification of these
diverse characteristics then constitutes the main aspect of the CF practice. Due to the
distinguishing feature of these formative items that have consensus with each other,

252
they are not interchangeable (Bollen and Lennox, 1991). Each formative item adds a
different aspect to the formative construct and dropping an item varies the entire
scope of the CF practice (Petter et al., 2007; Jarvis et al., 2003). This is because
retaining all formative items of CF in the model is vital to assess its strength and to
reduce the risk of distorting its scope (Diamantopoulos and Winklhofer, 2001; Chin,
1998b).
While the necessity of a joint business plan, for instance, enables manufacturers to
follow a single path with retailers through the forecast collaboration, trust, on the
other hand, focuses on building reliable and confidential relations with each other.
The existence of commitment then makes it possible to ensure the relational
continuity in CF. When the requisite of consensus-based internal forecasts obliges
manufacturers to generate a single forecast, having the full support of related
departments, the sharing of order forecasts implies the necessity of sharing order
forecasts with retailers. In other words, each item provides completely different
treatment to the CF practice and its structure, therefore, supports the second criterion
of Jarvis et al. (2003).
Thirdly, a change in a relevant item of a reflective construct is expected to be
associated with a change in all other items reflecting the same construct (Peng and
Lai, 2012). In other words, any changes that occur to a reflective item is expected to
cause changes to another reflective item that belongs to the same reflective construct
(Petter et al., 2007). Considering the formative items for the CF practice, the value of
trust, commitment, and joint business plan as well as other formative items are not
necessarily to be attributed to each other. This is because the value of formative
items is independent, and they are not essential to be correlated with each other when
they determine the same formative construct (Jarvis et al., 2003). If the value of
trust, for instance, changes, it does not necessarily mean that the value of generating
consensus-based internal forecasts will be influenced in the model. This approach
further clarifies that each formative item of the CF practice has a distinguished
feature forming the construct, hence there is not an influential relationship between
these formative items, unlike reflective items. In consequence, the CF practice is a

253
formative construct in the model, and confirms the third criterion of Jarvis et al.
(2003).
Finally, due to the different aspect of trust, commitment and other formative items,
they are not interchangeable. Hence, they are not expected to have similar
antecedents, unlike reflective items sharing a common theme of the relevant
construct (Jarvis et al., 2003). This implies that formative items can be related either
negatively or positively in the construct, which feature makes the internal
consistency redundant for the CF practice (Diamantopoulos and Winklhofer, 2001).
Accordingly, each formative item is likely to show a different impact on the CF
practice. For instance, whilst one formative item can positively influence the CF
practice, another item can show a negative impact on it. This independency adds
further insight to the diverse dimensions of formative items constituting the domain
of the formative construct in this research. As a result, the different nomological
indicators of CF practice validate its formative structure in the model based on the
final criterion of Jarvis et al. (2003).
In summary, the four criteria of Jarvis et al. (2003) support the form of the CF
practice. It is worth recalling that the aim of this research is to enhance the long-term
and accurate CF when manufacturers collaboratively forecast perishable, seasonal,
and promotional as well as newly launched products. This is because the CF practice
is symbolised by two reflective items of long-term and accurate CF. These items
were posited as the primary hypotheses of the research under the reflective construct
of Collaborative Forecasting Performance. The underlying reasons for positing
these items as hypotheses are not only to theoretically validate the structure of the
CF practice (Bollen, 1989), but also to conceptually interpret the model over
Multiple Indicators and Multiple Causes (MIMIC) or two-construct models that are
applied to test the reliability of the model in PLS (Diamantopoulos et al., 2008;
Jarvis et al., 2003; Diamantopoulos and Winklhofer, 2001). The following section
presents the results of descriptive statistics and provides considerable insights to the
characteristics of research samples.

254
5.4. Descriptive statistics
Descriptive information of the research samples involves the position of respondents,
manufacturing companies’ number of years in operation, region, number of
employees and annual sales volume. Outcomes of descriptive statistics are presented
in Table 5.1. In terms of respondents, the response sample included “Supply Chain /
Logistics Managers” (25.7 percent) and “Forecaster / Forecast Analyst / Forecast
Manager” (22.9 percent), followed by “Marketing / Sales Managers”, “Production
Managers” and “Finance Managers”. Interestingly, a considerable number of
respondents also responded to the survey from the “Others” category (25.7 percent).
This category involved respondents who were of C-level executives, Operations and
Managing Directors, and Head of Supply Chain and Forecasting along with General
Managers. Based on different types of questions that were asked in the survey, it is
reasonable to argue that reliable information was collected due to a sufficient level of
seniority with regard to respondents (Phillips, 1981).
When 48.6 percent of manufacturers were more than 50 years in operation,
manufacturers from Southern Europe (25.7 percent) and the UK & Ireland (24.8
percent) led the survey while the contribution of manufacturers from North America
(21.9 percent) was considerably important. Following this, 31.4 percent of
manufacturers had 100 to 999 employees while companies employing 10000
employees and over (19 percent) and 1000 to 4999 employees (18.1 percent)
provided additional insight to the survey. Annual sales volume was £ 100 to £ 499.9
million by 21.9 percent of manufacturers, followed by 21 percent having annual
sales volume of £20 to £99.9 million.

255
Table 5.1. Results of descriptive statistics
Position of respondents Frequency Percentage
Forecaster / Forecast Analyst / Forecast Manager 24 22.9
Marketing / Sales Manager 17 16.2
Supply chain / Logistics Manager 27 25.7
Production Manager 9 8.6
Finance Manager 1 1
Other 27 25.7
Total: 105 100 percent
Number of years in operation Frequency Percentage
Less than 5 years 6 5.7
5 to 10 years 7 6.7
11 to 20 years 16 15.2
21 to 50 years 25 23.8
More than 50 years 51 48.6
Total: 105 100 percent
Region of Manufacturers Frequency Percentage
United Kingdom & Ireland 26 24.8
North America (The USA and Canada) 23 21.9
Eastern Europe (Belarus, Bulgaria, Czech Republic, Hungary,
Moldova, Poland, Romania, Russian Federation, Slovakia, Ukraine)
10 9.5
Northern Europe (Denmark, Faroe Islands and Greenland, Estonia,
Finland, Iceland, Latvia, Lithuania, Norway, Sweden)
9 8.6
Southern Europe (Albania, Andorra, Bosnia and Herzegovina,
Croatia, Cyprus, Greece, Italy, Malta, Montenegro, Portugal, San
Marino, Serbia, Slovenia, Spain, Turkey)
27 25.7
Western Europe (Austria, Belgium, France, Germany,
Liechtenstein, Luxembourg, Monaco, Netherlands, Switzerland)
10 9.5
Total: 105 100 percent
Number of employees Frequency Percentage
Under 20 employees 12 11.4
20 to 99 employees 15 14.3
100 to 999 employees 33 31.4
1000 to 4999 employees 19 18.1
5000 to 9999 employees 6 5.7
10000 employees and over 20 19
Total: 105 100 percent
Annual sales volume Frequency Percentage
Under (£20 - $30 - €23) million 19 18.1
(£20 - $30 - €23) to (£99.9 - $150.9 - €115.9) million 22 21
(£100 - $151 - €116) to (£499.9 - $755.9 - €578.9) million 23 21.9
(£500 - $756 - €579) to (£999.9 - $1511.9 - €1157.9) million 7 6.7
(£1 - $1.1512 - €1.158) to (£4.99 - $7.49 - €5.79) billion 16 15.2
(£5 - $7.5 - €5.8) billion and over 18 17.1
Total: 105 100 percent

256
It seems that the survey predominantly attracted the interest of mature companies
operating in the market for a long-time, such as 50 years or more. Even companies
within the developing position (e.g. 5 to 20 years) showed their desire to CF, and
these manufacturers participate in the UK & Ireland, North America and Southern
Europe. Comparing these implications with the annual sales volume of companies,
the maturity of companies in the market did not seem to be in parallel with their
annual sales, most of which were £ 100 and £ 499.9 million. Given the number of
employees, mature companies appeared not to prefer employing large number
employees as the survey largely witnessed manufacturers employing 100 to 999
employees, followed by larger manufactures employing 1000 to 4999 employees.
In terms of product-groups, 55.2 percent of manufacturers continually provided
perishable products to retailers while 38.1 percent sometimes considered seasonal
products in CF. While 41.9 percent of manufacturers occasionally considered
promotional products, the collaboration of 23.8 percent relied predominantly upon
promotional products in addition to 17.1 percent that frequently took into account
this product-group in their CF with retailers. Similar to perishable products, newly
launched products were sporadically subjected to collaborations by 37.1 percent of
manufacturers while this product-group always became subject to CF by 25.7
percent, but 21 percent mostly collaborated with retailers by considering newly
launched products. Frequency level of product-groups in terms of being subject to
CF is presented in Table 5.2.

257
Table 5.2. Frequency level of product-groups considered in CF
Product-Groups Frequency level of product-groups that manufacturers
provide to retailers
Alw
ay
s
Mo
st o
f th
e
tim
e
So
met
imes
Ra
rely
Nev
er
To
tal
Perishable
products
58 9 9 9 20 105
55.2 8.6 8.6 8.6 19 100 percent
Seasonal
products
17 16 40 18 14 105
16.2 15.2 38.1 17.1 13.3 100 percent
Promotional
products
25 18 44 13 5 105
23.8 17.1 41.9 12.4 4.8 100 percent
Newly launched
products
27 22 39 15 2 105
25.7 21 37.1 14.3 1.9 100 percent
The research compared the region of manufacturing companies to have a clear
understanding of which product-groups and to what extent subject to their CF in
different regions. The underlying reason for this comparison was to add further
insight to the region based characteristics of companies and to increase the attention
of researchers in dedicating further research to particular product-groups in specific
regions. In this regard, the Chi-Square statistics clarified that, excluding perishable
products, there is not a significant difference between regions, where manufacturers
collaboratively forecast associated product-groups with retailers.
Results of Chi-Square statistics are presented in Table 5.3. Statistical tests show that
there is no difference between manufacturers located in different regions when their
CF focuses on to seasonal, promotional and newly launched products. Interestingly,
the consideration of perishable products in CF is shown to be significantly different
between regions. Table 5.4. presents more detailed information with regard to the
frequency level of product-groups being subject to manufacturers’ CF practices in
different regions.

258
Table 5.3. Chi-Square tests of product-groups in different regions
Product-groups Related values Value df Asymp. Sig.
(2-sided)
Perishable
products
Pearson Chi-Square 32.692 20 .036
Likelihood Ratio 31.380 20 .050
Linear-by-Linear
Association .258 1 .611
N of Valid Cases 105
Seasonal
products
Pearson Chi-Square 26.703 20 .144
Likelihood Ratio 34.094 20 .025
Linear-by-Linear
Association 3.296 1 .069
N of Valid Cases 105
Promotional
products
Pearson Chi-Square 26.882 20 .139
Likelihood Ratio 29.728 20 .074
Linear-by-Linear
Association 3.216 1 .073
N of Valid Cases 105
Newly launched
products
Pearson Chi-Square 21.421 20 .373
Likelihood Ratio 23.337 20 .273
Linear-by-Linear
Association 4.493 1 .034
N of Valid Cases 105
A wide range of manufacturers from Western Europe (70 percent) and the UK &
Ireland (69.2 percent) constantly considered perishable products in CF with retailers.
In a similar vein, for manufacturers from North America (60.9 percent) and Southern
Europe (59.3 percent), CF was based largely upon perishable products. It is
interesting that 44.4 percent of manufacturers in Northern Europe did not consider
perishable products when 40 percent of manufacturers from Eastern Europe rarely
took into account perishable products in their CF. It is apparent that responses from
Northern and Eastern Europe are not sufficient. Yet there is still an intriguing
dilemma about why manufacturers in these regions do not allocate adequate time for
CF in forecasting perishable products along with retailers.

259
Table 5.4. Frequency level of product-groups considered in different regions
Regions
Total
United
Kingdom &
Ireland
North
America
Eastern
Europe
Northern
Europe
Southern
Europe
Western
Europe
Product-
groups Frequency No percent No percent No percent No percent No percent No percent
Perishable
products
Never 3 11.5 4 17.4 3 30 4 44.4 4 14.8 2 20 20
Rarely 1 3.8 1 4.3 4 40 1 11.1 2 7.4 0 0 9
Sometimes 2 7.7 3 13.0 2 20 0 0.0 2 7.4 0 0 9
Most of the
Time
2 7.7 1 4.3 0 0 2 22.2 3 11.1 1 10 9
Always 18 69.2 14 60.9 1 10 2 22.2 16 59.3 7 70 58
Total 26 100 23 100 10 100 9 100 27 100 10 100 105
Seasonal
products
Never 3 11.5 2 8.7 1 10 2 22.2 6 22.2 0 0 14
Rarely 3 11.5 0 0 4 40 0 0 8 29.6 3 30 18
Sometimes 12 46.2 10 43.5 2 20 3 33.3 9 33.3 4 40 40
Most of the
Time
4 15.4 6 26.1 0 0 2 22.2 3 11.1 1 10 16
Always 4 15.4 5 21.7 3 30 2 22.2 1 3.7 2 20 17
Total 26 100 23 100 10 100 9 100 27 100 10 100 105
Promotional
products
Never 1 3.8 3 13.0 1 10 0 0 0 0 0 0 5
Rarely 2 7.7 1 4.3 1 10 1 11.1 7 25.9 1 10 13
Sometimes 11 42.3 7 30.4 3 30 5 55.6 12 44.4 6 60 44
Most of the
Time
2 7.7 5 21.7 1 10 2 22.2 7 25.9 1 10 18
Always 10 38.5 7 30.4 4 40 1 11.1 1 3.7 2 20 25
Total 26 100 23 100 10 100 9 100 27 100 10 100 105
Newly
launched
products
Never 1 3.8 0 0 0 0 0 0 0 0 1 10 2
Rarely 4 15.4 3 13 1 10 2 22.2 5 18.5 0 0 15
Sometimes 6 23.1 6 26.1 5 50 2 22.2 15 55.6 5 50 39
Most of the
Time
5 19.2 6 26.1 1 10 3 33.3 5 18.5 2 20 22
Always 10 38.5 8 34.8 3 30 2 22.2 2 7.4 2 20 27
Total 26 100 23 100 10 100 9 100 27 100 10 100 105
Regarding the seasonal products, 30 percent of manufacturers from Eastern Europe
continuously focused on the seasonal products in their CF. Similarly Northern
Europe (22.2 percent), North America (21.7 percent) and Western Europe (20
percent) based manufacturers largely improved their collaborative forecasts with
retailers for seasonal products. On the other hand, only 15.4 percent of
manufacturers from the UK & Ireland continually improved CF with retailers over
the seasonal products, and the attention of 46.2 percent was at the moderate level in
collaboratively forecasting these products. The 43.5 percent of manufacturers from
North America likewise adopted a similar approach and did not pay high attention to
seasonal products in CF. Compared to perishable products, manufacturers located in
the UK & Ireland, North America, and Western Europe as well as Southern Europe
did not favour seasonable products. They predominantly intended to improve

260
collaborations with retailers by considering perishable products, instead of seasonal
products.
Of the promotional products, Eastern Europe based manufacturers put more effort
into collaborations compared with manufacturers from other regions, as 40 percent
always built their CF over promotional products, like seasonal products. 38.5 and
30.4 percent of manufacturers from the UK & Ireland and North America
respectively conducted CF with retailers over this product-group regularly. The
interest of manufacturers from other regions was at the moderate level in terms of
collaboratively forecasting promotional products. Even though there is not a
significant difference between the regions of manufacturers, it seems that
manufacturers from Eastern Europe (40 percent), the UK & Ireland (38.5 percent)
and North America (30.4 percent) put more emphasis on collaborations in
forecasting promotional products. It is worth stressing that the UK & Ireland based
manufacturers did not pay sufficient attention to seasonal products, yet promotional
and / or newly launched products attracted their interest in CF. Hence, it seems
promising to dedicate further research to these manufacturers when seasonal,
promotional and newly launched products are the subject of their CF in the UK &
Ireland.
Like promotional products, 38.5 percent of manufacturers from the UK & Ireland
took the leading position by constantly collaborating with retailers over the newly
launched products. Manufacturers from North America (34.8 percent) and Eastern
Europe (30 percent) also followed a similar vision for collaboratively forecasting
newly launched products along with retailers. While 33.3 percent of companies from
Northern Europe infrequently considered newly launched products in CF, the rest of
manufacturers’ interest in other regions was at the moderate level for the CF of this
product-group. Manufacturers from Northern Europe and Northern America paid
closer attention to newly launched products in CF compared to promotions, yet
further interest was shown to promotional products in the CF of manufacturers
located in Eastern Europe.

261
Overall, these results suggest that the CF of manufacturers from Eastern Europe
focuses largely on promotional, seasonal and newly launched products. Perishable
products seem to be the favour of CF in all regions excluding Eastern and Northern
Europe. In addition to Eastern Europe, a wide range of manufacturers from the UK
& Ireland and North America conduct CF based upon promotions. Interestingly,
manufacturers in the UK & Ireland show a rising interest in promotional and newly
launched products while these manufacturers do not pay a similar attention to
seasonal products in CF.

262
5.5. Non-response bias
Taking into consideration the widespread effort made to reach a large number of
respondents, only 105 usable responses were obtained. To evaluate late response
bias, this research compared early and late responses by considering manufacturers’
number of years in operation, region, and annual sales volume as well as number of
employees along with respondents’ position. Independent T-test statistics were
employed to reveal potential bias between pre-test group (N: 80) and the final group
(N: 25), which was obtained after the reminder of emails for the completion of the
survey questionnaire (Armstrong and Overton, 1977). As is presented in Table 5.5,
results show that there is not a significant difference between early and late
responses in this research. Therefore, it can be advocated that the contributions of
this research that are based on existing samples are bias free, and reflect the
characteristics of the samples in an objective manner.
Table 5.5. Independent T-statistics for non-response bias
Nominal variables of the
survey
Levene's Test for
Equality of
Variances
T-test for Equality of Means
F Sig. t df Sig. (2-
tailed)
Mean
Difference
Std. Error
Difference
95 percent
Confidence
Interval of the
Difference
Lower Upper
Number of
years in
operation
Equal variances
assumed .016 .898 .136 103 .892 .037 .275 -.509 .584
Equal variances
not assumed .137 40.599 .892 .037 .274 -.515 .590
Region
Equal variances
assumed 10.068 .002 -2.323 103 .022 -.930 .400 -1.724 -.136
Equal variances
not assumed -2.754 55.646 .008 -.930 .338 -1.607 -.253
Annual
sales
volume
Equal variances
assumed .562 .455 .763 103 .447 .308 .403 -.492 1.107
Equal variances
not assumed .757 39.705 .453 .308 .406 -.513 1.128
Number of
employees
Equal variances
assumed .833 .364 1.217 103 .226 .440 .362 -.277 1.157
Equal variances
not assumed 1.234 41.078 .224 .440 .357 -.280 1.160
Respondent
position
Equal variances
assumed 2.115 .149 .419 103 .676 .180 .429 -.671 1.031
Equal variances
not assumed .391 36.235 .698 .180 .460 -.754 1.114

263
5.6. Measurement model for reflective constructs
In PLS, good model fit is established over path coefficients, high value of R² and
internal consistency, which is also known as construct reliability and should be
above 0.7 for each reflective construct (Gefen et al., 2000). Through the review of
the methodological literature, this research distilled the reliability and validity
analysis procedures to evaluate the measurement model for reflective constructs in
PLS. To provide further clarification for these analysis procedures, their definitions,
threshold parameters and the outcomes of analyses are presented in Table 5.6.
Table 5.6. Analysis procedures for reflective constructs in the measurement model
Procedures
Definition
Threshold parameter
and value
Validated
(Yes /No) Relevant references
Construct
reliability
Reliability
coefficient
It evaluates the
correlation between
the scores of
observed variables
for the internal
consistency of a
construct
*Cronbach’s α ≥ 0.7 (for
existing scales)
*Cronbach’s α ≥ 0.6 (for
new scales)
Yes
Fornell and Larcker (1981);
Götz (2010); Hair et al.
(2010); Nunnally (1978)
Composite
reliability
It evaluates whether
or not observed
variables
commonly measure
the relevant
construct
Composite reliability ≥ 0.7 Yes
Braunscheidel and Suresh
(2009); Bogazzi and Yi
(1988); Chin (1998b); Hair
et al. (2010); Gefen et al.
(2000)
Construct
validity
Content
validity
It determines how
well observed
variables represent
the main aspect of
relevant construct
*Reflective items were
developed through the
systematic review, and
then verified by the
qualitative data and grey
literature
*Each item was reviewed
and confirmed by four
academics and four
practitioners
Yes
Andreev et al. (2009);
Braunscheidel and Suresh
(2009); Bollen and Lennox
(1991b); Chin and Gopal
(1995); Cohen et al. (1990);
Götz et al. (2010); Peng and
Lai (2012); Vinzi et al.
(2010)
Convergent
validity
It shows how well
the observed items
converge or load
together as the
representative of
relevant constructs
*Average Variance
Extracted (AVE) ≥ 0.5
*The loading values of
observed variables ≥ 0.7
Yes
Braunscheidel and Suresh
(2009); Chin (1998b);
Duarte and Raposo (2010);
Fornell and Larcker (1981);
Götz et al. (2010); Peng and
Lai (2012); Peter (1981);
Rodgers and Pavlou (2003);
Vinzi et al. (2010)
Discriminant
validity
It helps to clarify
dissimilarities
among a set of
items, representing
different constructs
*The square root of AVE
> the correlations between
latent variables
Yes
Chin (1998b); Braunscheidel
and Suresh (2009); Götz et
al. (2010); Hulland (1999);
Fornell and Larcker (1981);
Peng and Lai (2012)
Source: Developed by the author

264
For the construct reliability of measurement model, the measures of reliability
coefficient and composite reliability were taken into account (Peng and Lai, 2012).
Cronbach’s α is the most commonly used reliability coefficient that determines the
degree to which a group of observed variables evaluates the relevant constructs
(Götz et al., 2010). The α value should be minimum 0.7 for existing scales and 0.6
for new scales (Hair et al., 2010; Nunnally, 1978). As is shown in Table 5.7, the α
values of reflective constructs are bigger than 0.7 while the α value for newly
developed Collaborative Forecasting Performance and Forecast Satisfaction
constructs are greater than 0.6, supporting the reliability coefficient of the
measurement model.
Unlike Cronbach’s α, composite reliability does not consider equally weighted
measures which make the α value the lower bound criterion for reliability
(Braunscheidel and Suresh, 2009).The literature suggests the threshold value of 0.7
(Gefen et al., 2000; Chin, 1998b), but values over 0.6 are also presumed acceptable
by some authors (Bagozzi and Yi, 1988). In the conceptual model of this research,
all constructs have 0.7 values for composite reliability, and the results therefore
underpin the internal consistency of the model.
Table 5.7. Results of reliability analysis
Latent variables /
constructs
Cronbach’s α Composite
reliability
Average Variance
Extracted (AVE)
The CF practice - - -
Collaborative Forecasting
Performance
0.6394 0.8471 0.7348
External Integration 0.7831 0.8595 0.6051
Forecast Horizon 0.8881 0.9069 0.6618
Forecast Satisfaction 0.8034 0.8722 0.6315
Forecasters’ Competence 0.9445 0.9549 0.7523
Group Forecasting 0.9042 0.929 0.7241
Internal Integration 0.8085 0.8747 0.6363
Information Quality 0.9457 0.956 0.757
Information Types 0.8029 0.8707 0.6286
Threshold values Cronbach’s α ≥ 0.7(for existing scales) and 0.6 (for new scales);
Composite reliability ≥ 0.7; AVE ≥ 0.5
Construct validity was analysed by considering the content validity, convergent
validity and discriminant validity (Braunscheidel and Suresh, 2009). Content validity
determines how well observed variables represent the main aspect of the relevant

265
constructs (Götz et al.,2010). The reflective items of the survey emerged from the
systematic review, and then earned the support of the single semi-structured
interview, three online group discussions and grey literature respectively. Four
academics and four practitioners from the food industry then examined the scales of
the questionnaire to ensure its structure, readability, ambiguity and completeness
(Dillman, 1978). Academics focused on observed variables to ensure that they
theoretically represent the related constructs. Practitioners, on the other hand,
guaranteed the perception of constructs and associated variables in practice.
Validating the rigour of the survey by academics and practitioners independently
further strengthened the structure of the survey (Peng and Lai, 2012; Andreev et al.,
2009). Hence, this approach justifies the content validity of reflective constructs in
the model.
Convergent validity shows how well the observed variables converge on the relevant
constructs. It is measured by either considering Average Variance Extracted (AVE)
or the loading values of observed variables, which should be greater than 0.7 (Peng
and Lai, 2012; Götz et al.,2010). The AVE values need to be above 0.5 (Chin,
1998b; Fornell and Larcker, 1981). In other words, 50 percent or more variance
should be explained by a set of observed variables representing the related construct
for acceptable convergent validity. As is shown in Table 5.7, The AVE values of
each reflective construct exceed the threshold value of 0.5. In addition, although
Chin (1998b) accepts the lower bound of 0.5 and / or 0.6 for newly developed scales,
like Collaborative Forecasting Performance and Forecast Satisfaction, the loading
values of reflective items in this research are greater than 0.7 (please see Table 5.9).
Accordingly, these results show that the scales of this research has robust reliability.
Finally, to clarify dissimilarities among a different set of items, representing
different constructs, it is essential to measure discriminant validity (Hulland, 1999).
If the square root of AVE is greater than the correlations between latent variables,
discriminant validity is hold (Chin, 1998b; Fornell and Larcker, 1981). Table 5.8
shows that the square root of AVE for all reflective constructs is bigger than the
correlation between the scores of constructs in terms of its related row and column
values. This indicates that the variance shared between the construct and its relevant

266
items is greater than other latent variables in the conceptual model, supporting the
discriminant validity of the model.
Table 5.8. Results of discriminant validity
Th
e C
F
pra
ctic
e
Co
lla
bo
rati
ve
Fo
reca
stin
g
Per
form
an
ce
Ex
tern
al
Inte
gra
tio
n
Fo
reca
st
Ho
rizo
n
Fo
reca
st
Sa
tisf
act
ion
Fo
reca
ster
s’
Co
mp
eten
ce
Gro
up
Fo
reca
stin
g
Inte
rna
l
Inte
gra
tio
n
Info
rma
tio
n
Qu
ali
ty
Info
rma
tio
n
Ty
pes
The CF
practice
-
Collaborative
Forecasting
Performance
0.714 0.857205
External
Integration
0.6826 0.5378 0.777882
Forecast
Horizon
-0.1263 -0.1443 -0.2297 0.813511
Forecast
Satisfaction
0.5141 0.2859 0.2657 -0.1903 0.79467
Forecasters’
Competence
0.5728 0.4048 0.3955 -0.203 0.2488 0.867352
Group
Forecasting
0.6365 0.5202 0.3923 -0.1399 0.2783 0.7015 0.850941
Internal
Integration
0.6676 0.4732 0.5822 -0.31 0.357 0.4335 0.4442 0.797684
Information
Quality
0.5813 0.3563 0.596 -0.1349 0.1313 0.3235 0.3521 0.4473 0.870057
Information
Types
0.5821 0.4298 0.3918 0.044 0.3381 0.2911 0.4759 0.2736 0.5463 0.792843
Square root of AVE: on diagonal in bold and underlined format

267
Table 5.9. Constructs and measurement items
Codes Constructs and items Item
weights
Item
loadings Mean Median Std. Dev.
The CF practice
(Formative Construct)
5: Strongly Agree, 4: Agree, 3: Neither Agree nor
Disagree, 2: Disagree 1: Strongly Disagree
CF_3 Trust 0.2383 0.5324 3.88 4.00 0.958
CF_4 Commitment -0.0711 0.4934 4.13 4.00 0.921
CF_5 Joint business plan 0.4564 0.8207 3.45 4.00 1.160
CF_6 Satisfaction from internally estimated
forecasts 0.5196 0.7187 3.09 3.00 1.093
CF_7 Sharing of order forecasts
5: Always, 4: Most of the Time, 3: Sometimes, 2: Rarely,
1: Never
0.2738 0.585 3.24 3.00 1.148
Collaborative Forecasting Performance
5: Strongly Agree, 4: Agree, 3: Neither Agree nor
Disagree, 2: Disagree 1: Strongly Disagree
CF_1 Long-term collaborative forecasting 0.5658 0.848 2.94 3.00 1.216
CF_2 Accurate collaborative forecasting 0.6004 0.8663 3.44 4.00 0.970
Forecast Satisfaction
5: Very Satisfactory, 4: Satisfactory, 3: Neither
Satisfactory nor Unsatisfactory, 2: Unsatisfactory, 1: Very
Unsatisfactory
FSat_1 Forecast satisfaction from perishable
products 0.2859 0.7191 3.80 4.00 0.739
FSat_2 Forecast satisfaction from seasonal products 0.3236 0.8216 3.64 4.00 0.911
FSat_3 Forecast satisfaction from promotional
products 0.334 0.8621 3.20 3.00 1.032
FSat_4 Forecast satisfaction from newly launched
products 0.313 0.7687 2.85 3.00 1.026
External Integration 5: Strongly Agree, 4: Agree, 3: Neither Agree nor
Disagree, 2: Disagree 1: Strongly Disagree
EI_1 Level of interdependence 0.3347 0.8308 3.79 4.00 0.895
EI_2 Level of flexibility 0.2685 0.7739 3.82 4.00 0.959
EI_3 Level of technological infrastructure for
external information sharing 0.368 0.7473 3.34 3.00 1.082
EI_4 Level of same vision of top managements 0.316 0.7568 3.65 4.00 0.920
Internal Integration
5: Strongly Agree, 4: Agree, 3: Neither Agree nor
Disagree, 2: Disagree 1: Strongly Disagree
II_1 Level of delivery effort 0.2945 0.7336 4.07 4.00 0.775
II_2 Level of inventory management 0.2945 0.7952 3.81 4.00 0.878
II_3 Level of technological infrastructure for
timely internal information sharing 0.2974 0.8342 3.53 4.00 1.217
II_4 Level of recording information 0.3351 0.8239 3.80 4.00 0.955
Forecast Horizon 5: 1 month or less, 4: 1 to 3 months, 3: 3 to 6 months, 2: 6
to 12 months, 1: 12 to 24 months
FH_1 Forecast horizon of perishable products 0.2483 0.7674 3.32 4.00 1.297
FH_2 Forecast horizon of seasonal products -0.061 0.7561 2.99 3.00 1.252
FH_3 Forecast horizon of promotional products 0.2622 0.8093 3.48 4.00 1.241
FH_4 Forecast horizon of newly launched products 0.2712 0.8214 3.01 3.00 1.252
Forecasters’ Competence
5: Strongly Agree, 4: Agree, 3: Neither Agree nor
Disagree, 2: Disagree 1: Strongly Disagree
FC_1 Level of market based experience for the
products involved 0.1343 0.7562 3.52 4.00 0.910
FC_2 Level of advice 0.1702 0.8718 3.63 4.00 0.953
FC_3 Level of motivation 0.1788 0.9034 3.73 4.00 0.943
FC_4 Level of willingness 0.1807 0.9061 3.82 4.00 0.969

268
FC_5 Level of feedback 0.1401 0.8204 3.65 4.00 1.000
FC_6 Level of confidence in accepting suggestions 0.1631 0.9172 3.59 4.00 0.958
FC_7 Level of satisfaction on consensus forecasts 0.1812 0.8847 3.58 4.00 0.896
Group Forecasting
5: Strongly Agree, 4: Agree, 3: Neither Agree nor
Disagree, 2: Disagree 1: Strongly Disagree
GF_1 Level of continuous meetings 0.1982 0.7759 3.72 4.00 1.042
GF_2 Level of decision making procedures 0.257 0.864 3.68 4.00 0.976
GF_3 Level of hierarchy 0.2262 0.8551 3.64 4.00 1.093
GF_4 Level of constructive discussions 0.2473 0.8999 3.62 4.00 1.078
GF_5 Level of effective usage of information for
consensus 0.2435 0.8549 3.70 4.00 1.134
Information Types
5: Always, 4: Most of the Time, 3: Sometimes, 2: Rarely,
1: Never
ITypes_1 Share of inventory levels 0.377 0.7243 2.86 3.00 1.244
ITypes_2 Share of production plan 0.2786 0.8383 2.26 2.00 1.152
ITypes_3 Share of production scheduling 0.278 0.8577 2.22 2.00 1.143
ITypes_4 Share of recent information 0.3433 0.7425 2.97 3.00 1.267
Information Quality 5: Always, 4: Most of the Time, 3: Sometimes, 2: Rarely,
1: Never
IQL_1 Relevance 0.1486 0.8623 3.40 4.00 1.080
IQL_2 Adequacy 0.1657 0.9226 3.45 4.00 1.056
IQL_3 Accuracy 0.1566 0.8848 3.64 4.00 1.066
IQL_4 Timeliness 0.1452 0.7417 3.03 3.00 1.244
IQL_5 Frequency 0.1701 0.8644 3.26 3.00 1.110
IQL_6 Responsiveness 0.1732 0.8958 3.38 3.00 1.060
IQL_7 Consistency 0.1881 0.9066 3.30 3.00 1.055
Threshold
values: Item weights for formative items ≥ 0.10, Item loadings for reflective items ≥ 0.70
Source: Developed by the author
5.7. Measurement model for the formative construct
For formative constructs, the direction of causality is from items to construct, which
causes a different interpretation and measurement for the construct of the CF practice
(Götz et al., 2010). The literature suggests that due to low correlation between
formative items, which means that there is no internal consistency, formative
constructs cannot be assessed like reflective constructs (Hair et al., 2010;
Diamantopoulos and Winklhofer, 2001). Therefore, the guidelines of Peng and Lei
(2012) and Götz et al. (2010) assisted the research to analyse the formative construct
of the CF practice. By considering these guidelines and relevant literature, the
current research listed all reliability and validity analysis procedures followed to
evaluate the measurement model for the formative constructs (please see Table
5.10).

269
Table 5.10. Analysis procedures for formative construct in the measurement model
Procedures Definition Threshold parameter and
value
Validated
(Yes /No) Relevant reference
Content validity
It determines how well
observed variables
represent the main
aspect of relevant
constructs
*Formative items were
developed through the
systematic review, and then
verified by the qualitative data
and grey literature
*Each item was reviewed and
confirmed by four academics
and four practitioners
*Design of the CF practice is
based on the procedures of
Jarvis et al. (2003)
Yes
Anderson and Gerbing
(1991); Andreev et al.
(2009); Chin and Gopal
(1995); Diamantopoulos
and Winklhofer (2001);
Götz et al. (2010); Jarvis
et al. (2003); Rositter
(2002)
Indicator reliability
It shows the
contribution of latent
variables to relevant
construct
*The weighs of formative items
≥ 0.1
*T-statistics (sig) at 0.05 level
*CF_4 was kept in the model to
maintain the main aspect of the
CF practice due to low
multicollinearity
Yes
(excluding
CF_4: The
level of
commitment)
Andreev et al. (2009);
Chin (1998b); Duarte
and Raposo (2010); Götz
et al. (2010); Peng and
Lai (2012); Rositter
(2002)
Multicollinearity
It shows the latent
variables’ level of
dependency to
formative construct
*The Variance Inflation Factor
(VIF) ≥ 3.3
*Having high multicollinearity
complicates the definite impact
of latent variable on a construct
Yes (No
(collinearity)
Chin (1998b);
Diamatopoulos and
Siguaw (2006); Duarte
and Raposo (2010); Götz
et al. (2010); Joseph et
al. (2014)
Peng and Lai (2012)
External
validity
Two-
construct
model
It helps to evaluate the
significance of path
coefficient between
formative construct and
its two reflective items
*Two-construct model needs to
show a significant path
coefficient between the CF
practice and its two reflective
items of accurate and long-term CF
Yes
Diamantopoulos and
Winklhofer (2001); Götz
et al. (2010); Hauser and
Goldberger (1971)
Source: Developed by the author
Content validity of the CF practice is about its development in the research. It is
worth remembering that this research developed observed variables and constructs
by reviewing the literature systematically, and then the constructs were purified
based on qualitative data and the grey literature. These processes were previously
addressed in Chapter 2. Literature Review, and justified in Chapter 4. Research
Methodology and Data collection. The formative structure of the CF practice was
also theoretically validated based on the four criteria of Jarvis et al. (2003). This
verification was explained in Section 5.3. Development of a new formative
construct: The CF practice. Given the necessity of expert judgements in developing
new formative constructs as a contribution to theory, four academics and four

270
practitioners evaluated the credibility of the CF practice in the academic field and
practice (Rossiter, 2002; Diamantopoulos and Winklhofer, 2001). Therefore, both
expert judgments and the procedures of Jarvis et al. (2003) support the content
validity of the CF practice in the model.
Because the direction of causality is from items to formative constructs, formative
items are not necessarily to be correlated with each other, unlike reflective items
(Rossiter, 2002). Therefore, formative items’ contribution should be evaluated based
on their weights rather than loadings for indicator reliability (Götz et al., 2010; Chin,
1998b). The literature recommends that the weights of formative items should be
greater than 0.1 and the items’ T-statistics need to be significant for consistency with
the relevant theory (Andreev et al., 2009). Table 5.11 shows that except from the
commitment item (CF_4) the weights of all items are above the threshold value and
significant at 0.05 level.
Table 5.11. Weights and T-statistics of formative items
Codes Formative items Outer weights T-statistics
CF_3 Trust 0.2383 2.34**
CF_4 Commitment -0.0711 0.93
CF_5 Joint business plan 0.4564 5.40***
CF_6 Consensus-based internal forecasts 0.5196 7.90***
CF_7 Sharing of order forecasts 0.2738 3.62***
Notes: *** p < 0.001, ** p < 0.05, *p < 0.1; (based on𝒕(𝟒𝟗𝟗), two-tailed test)
The logic behind following different procedures for formative constructs, compared
with reflective constructs, relies on the structure of formative items (Peng and Lai,
2012). Formative items constitute the main domain of the CF practice, and they do
not correlate with each other. In other words, each formative item theoretically
conveys a different dimension to the construct, and a formative construct completes
its domain through the unification of this diversity (Götz et al., 2010). Eliminating
one of the formative items gives rise to lose the significant part of the CF practice
due to uncorrelated items (Jarvis et al., 2003). Eliminating an insignificant and low
weight formative item is appropriate if there is high multicollinearity (Peng and Lai,
2012). Multicollineary shows formative items’ dependency on a formative construct
(Götz et al., 2010; Chin, 1998b). To be able to decide whether the commitment item

271
(CF_4) will be kept in the model, the research evaluated the multicollinearity of the
formative construct.
The Variance Inflation Factor (VIF) is a common way of measuring the
multicollinarity of formative items, and its threshold value is 10 (Peng and Lai,
2012; Götz et al., 2010). Yet Diamatopoulos and Siguaw (2006) offered more
rigorous criteria of 3.3 for VIF, which was adopted in this research. The VIF values
were evaluated via Statistical Package for Social Sciences (SPSS). By considering
the five formative items of the CF practice, linear regression in SPSS made it
possible to keep each item as a dependent variable for once and to produce VIF
values for each item whilst other items were presumed as independent variables
(Joseph et al., 2014). Table 5.12 shows that all VIF values are under the threshold
value of 3.3, and there is no multicollinearity. This result accordingly indicates that
the formative items of the CF practice are bias free, and although the commitment
item is insignificant and has low weight value, it is essential to be kept in the model
to sustain the main domain of the of CF practice (Chin, 1998b).
Table 5.12. Multicollinearity statistics
Dependent item Independent item Tolerance VIF
CF_3
CF_4 0.655 1.527
CF_5 0.574 1.741
CF_6 0.857 1.167
CF_7 0.784 1.276
CF_4
CF_5 0.632 1.582
CF_6 0.872 1.146
CF_7 0.783 1.277
CF_3 0.734 1.362
CF_5
CF_6 0.986 1.014
CF_7 0.823 1.216
CF_3 0.382 2.616
CF_4 0.375 2.663
CF_6
CF_7 0.776 1.288
CF_3 0.381 2.621
CF_4 0.346 2.886
CF_5 0.659 1.517
CF_7
CF_3 0.385 2.598
CF_4 0.343 2.913
CF_5 0.607 1.647
CF_6 0.857 1.167
(Reminder of abbreviations: CF_3: Trust; CF_4: Commitment; CF_5: Joint business plan; CF_6:
Consensus-based internal forecasts; CF_7: Sharing of order forecasts)

272
In terms of construct reliability, “contrary to the procedure in reflective measurement
models, no evaluation is allowed of formative constructs that are based on the
internal consistency measure” (Götz et al., 2010, p. 699; Hulland, 1999, p. 201). The
reason behind this is related to the impact of formative items on the formative
construct: “Since the latent variable is viewed as an effect rather than a cause of the
item responses, internal consistency is irrelevant” (Rossiter, 2002, p. 307). This is
the reason why, construct reliability cannot be measured for the formative construct
of the CF practice (Götz et al., 2010). Instead, external validity is measured by way
of MIMIC (Hauser and Goldberger, 1971) or two-construct models (Götz et al.,
2010; Diamantopoulos and Winklhofer, 2001).
Although the MIMIC model is applicable by using reflective items to externally
verify the formative construct, Smart PLS is not capable of measuring the MIMIC
model (Götz et al., 2010). Therefore, its alternative two-construct model was
adopted by considering the reflective construct of Collaborative Forecasting
Performance as the representative of the CF practice (Diamantopoulos and
Winklhofer, 2001). When it comes to analysing external validity via two-construct
model, it is essential to have a significant path coefficient between CF and its
representative of Collaborative Forecasting Performance construct (Götz et al.,
2010). Figure 5.1 shows that there is a significant relationship between the CF
practice and its reflective items of accurate and long-term CF. This result
accordingly supports the external validity of the CF practice in the model.
It is reasonable to stress that the two reflective items of the CF practice, namely the
accurate and long-term CF, were posited as a primary hypothesis under the reflective
construct of Collaborative Forecasting Performance representing the aim of the
research. In this context, this research made it possible not only to theoretically
validate the domain of the CF practice (Bollen, 1989), but also to justify the external
validity of the CF practice by employing the two-construct model (Diamantopoulos
et al., 2008; Jarvis et al., 2003; Diamantopoulos and Winklhofer, 2001). On the other
hand, convergent and discriminant validity cannot be measured for formative items,
as these items are not expected to be interrelated (Fornell and Larcker, 1981). In
terms of nomological validity, it focuses on the relationships between the formative

273
construct and reflective constructs (Götz et al., 2010). Given the fact that the
conceptual model was built upon this formative construct of the CF practice, all
hypothetical relationships between reflective constructs and the CF practice will be
scrutinised in the following section. In this respect, it is not essential to check
nomological validity (Götz et al., 2010; Diamantopoulos and Winklhofer, 2001).
Source: Developed by the author
5.8. Model fit for the conceptual model
PLS analysis does not allow evaluating fit statistics (Duarte and Raposo, 2010).
Given the fact that formative items cannot be explained, fit statistics are not
recommended for PLS (Henseler and Sarstedt, 2013; Hair et al., 2012). As a remedy,
Tenenhaus et al. (2005) recommended the Goodness-of-Fit (GoF) criterion to
validate conceptual models in PLS. In addition to this criteria, the current research
applied additional techniques for the assessment of the structural model. These
techniques are determination coefficient (R²), effect size for predictive variables (ƒ²),
predictive relevance of Stone-Geisser test (Q²) and effect size of endogenous
variables (q²) (Joseph et al., 2014; Peng and Lai, 2012; Chin, 1998b; Cohen, 1988).
The definition of these procedures, threshold values and the outcomes of analyses
are presented in Table 5.13.
Figure 5.1. Two-construct model for the external validity of the CF practice
The CF
practice
Collaborative
Forecasting
Performance
Sharing of order forecasts
(CF_7)
Consensus-based internal
forecasts (CF_6)
Commitment (CF_4)
Trust (CF_3)
Joint business plan
(CF_5) Long-term CF
(CF_2)
Accurate CF (CF_1)
External Validity Path C.: 0.757
T-stat: 17.93***

274
Regarding the criterion of GoF, it is the “geometric mean of the average
communality and the average R²” (Duarte and Raposo, 2010, p.469). As shown in
Table 5.14, the GoF value of the conceptual model in this research is 0.53, and it is
over the threshold value of 0.36, confirming that the conceptual model performs well
based on the GoF criteria (Perols et al., 2013). As far as the determination coefficient
(R²) is considered, R², representing the level of the constructs’ explained variance, is
expected to be greater than 0.1 to be able to develop a reliable theoretical model
(Falk and Miller, 1992). The R² values of 0.67, 0.33 and 0.19 indicate the substantial,
moderate and weak variance explained for endogenous constructs (Peng and Lai,
2012; Chin, 1998b).
Having larger R² values in the conceptual model implies the larger percentage of
variance explained for constructs (Götz et al., 2010). Table 5.14 shows that the R²
values of all endogenous constructs are over the threshold value. In detail, while the
percentage of variance for the CF practice is substantially explained, except for
Forecast Satisfaction and Information Types, all constructs’ percentage of variance
is explained at the moderate level. Therefore, the conceptual model of this research
has a satisfactory combined predictiveness.

275
Table 5.13. Analysis procedures for the structural model
Procedures Definition Threshold parameter and value Validated
(Yes /No) Relevant reference
Goodness-of-Fit
(GoF)
GoF evaluates the quality
of the measurement model
over the average
communality (AVE) and
of the structural model
over the average of R²
*Although it is applied to validate
the conceptual model in PLS, it is
not recommended by contrary
views (Henseler and Sarstedt, 2013)
*GoF ≥ 0.36 (Threshold value)
0.53
(Larger GoF
represents
better model
fit)
Duarte and Raposo
(2010); Götz et al.
(2010); Henseler and
Sartedt (2013); Perols et
al. (2013); Tenenhaus et
al. (2005; 2004)
Determination
coefficient
(R²)
It shows the level of
explained variance for
endogenous constructs
*R² ≥ 0.1 (Threshold value)
*R² ≥ 0.67 (substantial); ≥ 0.33
(moderate); ≥ 0.19 (weak)
*Larger R² implies larger
percentage of variance explained
for endogenous constructs
Yes
(satisfactory
combined
predictiveness)
Backhaus et al. (2003);
Chin (1998b); Falk and
Miller (1992) Götz et al.
(2010); O’Leary-Kelly
and Vokurka (1998);
Peng and Lai (2012)
Effect size for
predictive /
independent
variables
(ƒ²)
It shows the particular
impact of an exogenous
variable based on
increased R² values that
remain unexplained on an
endogenous construct
* ƒ² ≥ 0.02 (Threshold value)
*ƒ² ≥ 0.35 (large); ≥ 0.15
(medium); ≥ 0.02 (small)
*(ƒ²) effect size of an independent
variable is measured based on the
change of R² value when that
independent variable is eliminated
from the conceptual model
*(f²) = (R² included - R² excluded) /
(1-R² included )
Yes
(all
endogenous
constructs’ ƒ²
values are
over the
threshold
value)
Cohen (1988); Götz et al.
(2010); O’Leary-Kelly
and Vokurka (1998);
Peng and Lai (2012)
Predictive
relevance of
Stone-Geisser
test
(Q²)
It helps to understand how
well the conceptual model
and PLS parameters
reconstituted the observed
latent variables
*Q² ≥ 0 (Threshold value)
*It is only measured for reflective
endogenous constructs
*Q² ≥ 0.35 (large); ≥ 0.15
(medium); ≥ 0.02 (small)
*Q² is measured via blindfolding
procedure in which a part of data
matrix is omitted for once, and then
the model is re-evaluated to predict
the omitted part of the model
Yes (Good
predictive
relevance for
endogenous
constructs)
Chin (1998b); Duarte
and Raposo (2010);
Giesser (1975); Joseph et
al. (2014);Stone (1974);
Tenenhaus et al. (2005)
Effect size (q²)
of endogenous
variables
It measures the effect size
of exogenous constructs on
a specific reflective
endogenous construct
based on the predictive
value of Q²
* q² ≥ 0.02 (Threshold value)
*q² ≥ 0.35 (large); ≥ 0.15
(medium); ≥ 0.02 (small)
*q² effect size of an independent
variable is measured based on the
change of Q² value when that
independent variable is eliminated
from the conceptual model
*q² = (Q² included - Q² excluded )
/ (1- Q² included)
Yes
(Good
predictive
relevance for
endogenous
constructs)
Cohen (1988); Joseph et
al. (2014)
Source: Developed by the author

276
Table 5.14. Variance explained, communality and redundancy
Latent variables / constructs Variance explained (R²) Communality Redundancy
Values Size
The CF practice 0.7411 Substantial 0.4119 0.1468
Collaborative Forecasting
Performance
0.5098 Moderate 0.7348 0.3743
External Integration 0.339 Moderate 0.6051 0.1932
Forecast Horizon - - 0.6618 -
Forecast Satisfaction 0.2643 Weak 0.6315 0.1668
Forecasters’ Competence - - 0.7523 -
Group Forecasting 0.492 Moderate 0.7241 0.3543
Internal Integration - - 0.6363 -
Information Quality 0.3552 Moderate 0.757 0.2682
Information Types 0.2984 Weak 0.6286 0.1644
(GoF): 0.5295 R² = 0.67 ≥ Substantial, 0.33 ≥ Moderate, 0.19 ≥ Weak
Note: Variance explained (R²) is measured for only endogenous constructs. The constructs of Forecast
Horizon, Forecasters’ Competence and Internal Integration are exogenous in the model, therefore their
explained variance cannot be measured
On the other hand, the effect size of independent variables (ƒ²) shows the particular
impact of exogenous variables based on increased R² values that remain unexplained
on an endogenous construct (Peng and Lai, 2012). Effect size of an independent
variable (ƒ²) is measured based on the change of R² value when it is eliminated from
the conceptual model (Cohen, 1988). The ƒ² values of 0.35, 0.15 and 0.02 are the
threshold of large, medium and small effect size for each exogenous construct in the
conceptual model (Cohen, 1988). Table 5.15 shows that although all predictor
variables for the CF practice have small effect size, the rest of the endogenous
constructs have a large effect size and f² of all endogenous constructs are greater than
the lower bound 0.02 in the model. This result indicates that all independent
variables of the conceptual model have the minimum required effect size for
associated dependent variables, supporting the following procedure: the effect size of
independent variables (ƒ²).

277
Table 5.15. Effect size of independent variables (ƒ²)
Effect size (ƒ²) over variance explained ( R²)
Predictor constructs R² included R² excluded f² Size
Internal Integration The CF practice 0.7411 0.7066 0.13 Small
External Integration The CF practice 0.7411 0.7053 0.14 Small
Information Quality The CF practice 0.7411 0.7343 0.03 Small
Forecast Horizon The CF practice 0.7411 0.7347 0.02 Small
Information Types The CF practice 0.7411 0.7195 0.08 Small
Forecasters’ Competence The CF practice 0.7411 0.7368 0.02 Small
Group Forecasting The CF practice 0.7411 0.7269 0.05 Small
Internal Integration External Integration 0.339 0 0.51 Large
External Integration Information Quality 0.3552 0 0.55 Large
The CF practice Collaborative Forecasting
Performance
0.5098 0 1.04 Large
The CF practice Forecast Satisfaction 0.2643 0 0.36 Large
Information Quality Information Types 0.2984 0 0.43 Large
Forecasters’ Competence Group Forecasting 0.492 0 0.97 Large
f² = (R² included - R² excluded) / (1-R² included )
Effect size f²: 0.35 ≥ Large; 0.15 ≥ Medium; 0.02 ≥ Small
As regards the predictive relevance of the Stone-Geisser test (Q²), it is an assessment
criterion for model fit that is only measured for reflective endogenous constructs
(Geisser, 1975; Stone, 1974). Q² helps to understand how well the conceptual model
and PLS parameters reconstituted the observed variables (Chin, 1998b). Having zero
or greater value Q² (Q² ≥ 0) indicates a good predictive relevance in the conceptual
model, and the values above 0.35, 0.15 and 0.02 exhibit large, medium and small
predictive relevance of the relevant endogenous variables respectively (Joseph et al.,
2014). Q² is measured via a blindfolding procedure in which a part of the data matrix
is omitted for once and the model is revaluated to predict the omitted part of the
conceptual model (Duarte and Raposo, 2010).
It is important to stress that the Q² values can be estimated by either cross-validated
redundancy or cross-validated communality approaches during the blindfolding
procedure (Joseph et al., 2014). Cross-validated communality “measures the capacity
of the path model to predict the manifest variables or data points from their own
latent variable score, and serves as an indicator of the quality measurement model”

278
(Duarte and Raposo, 2010, p. 472). The cross-validated redundancy “measures the
capacity of the model to predict the endogenous manifest variables using the latent
variables that predict the block in question, and serve as a sign of the quality of the
structural model” (Duarte and Raposo, 2010, p. 472; Tenenhaus et al., 2005).
According to Chin (1998b), values for omission distance in blindfolding can be from
5 to 10. Given the complexity of the conceptual model, greater numbers were also
preferred in similar studies (e.g. G: 30, see Duarte and Raposo (2010)). In this
research, the blindfolding procedure was estimated for omission distances at 10 and
30 to reveal whether there are potential differences in terms of the predictive
relevance of Q². In essence, this approach enables the research not only to enhance
the quality of Q², but also to allow the reader to judge the complexity of the model in
terms of deciding whether it is advisable to prefer larger omission distance for the
blindfolding procedure.
As shown in Table 5.16, all Q² values are greater than zero, and these results indicate
that there is a good predictive relevance for both endogenous constructs (via cross-
validated redundancy) and manifest / observed variables (via cross-validated
communality). It is worth stressing that the Collaborative Forecasting Performance
construct has large cross-validated redundancy. This outcome accordingly implies
the strong predictive relevance of the CF practice to accomplish accurate and long-
term CF, which are represented by the Collaborative Forecasting Performance
construct in the model. Overall, the results of the blindfolding procedure indicate that
the model of this research fits well. Each endogenous variable therefore has reliable
predictive relevance in constituting the conceptual model, validating the following
procedure: the predictive relevance of the Stone-Geisser test (Q²).

279
Table 5.16. Results of blindfolding procedure
Endogenous
constructs
Cross-validated communality
Cross-validated redundancy
Omission distance (G) Omission distance (G)
Q²
(G: 10)
Size
(G: 10)
Q²
(G: 30)
Size
(G: 30)
Q²
(G: 10)
Size
(G: 10)
Q²
(G: 30)
Size
(G: 30)
Collaborative
Forecasting
Performance
0.2169 Medium 0.2208 Medium 0.3548 Large 0.3558 Large
External
Integration 0.5607 Large 0.5460 Large 0.1909 Medium 0.1924 Medium
Forecast
Satisfaction 0.4597 Large 0.4519 Large 0.1562 Medium 0.1590 Medium
Information
Types 0.5644 Large 0.5540 Large 0.1596 Medium 0.1605 Medium
Group
Forecasting 0.6056 Large 0.5929 Large 0.3485 Medium 0.3488 Medium
Information
Quality 0.5390 Large 0.5279 Large 0.2613 Medium 0.2624 Medium
Predictive relevance Q² = 0.35 ≥ Large; 0.15 ≥ Medium; 0.02 ≥ Small
Finally, by using the predictive values of Q², the effect size of endogenous variables
(q²) was estimated whilst R² values were used to evaluate the similar effect size (ƒ²)
(Cohen, 1988). Similar to the effect size of independent variables (ƒ²), the values of
0.35, 0.15 and 0.02 represent large, medium and small effect size (q²) respectively
(Joseph et al., 2014). The effect size (q²) of each exogenous construct to endogenous
construct is evaluated based on two different values. The first value of “Q² included”
is obtained when the conceptual model is complete and includes all exogenous
constructs. Another value of “Q² excluded” is found when the relevant exogenous
construct is dropped from the model. By using these two different Q² values, the
effect size (q²) for each exogenous construct to endogenous construct is estimated.
Because the effect size of (q²) represents the impact of endogenous variables in the
complete model, it is essential to consider the value of Q² that was found based on
the analysis of cross-validated redundancy, instead of cross-validated communality
(Joseph et al., 2014). The results of effect size (q²), estimated based on the values of
predictive relevance (Q²), are presented in Table 5.17.
Overall, the results of q² show sufficient effect size for each exogenous construct on
the relative endogenous constructs with regard to the changes of predictive relevance
(Q²). In addition to the moderate level of effect size for all endogenous constructs,
excluding Forecasters’ Competence, the CF practice has a large effect size in

280
producing the predictive relevance (Q²) for the Collaborative Forecasting
Performance construct. The predictive relevance of the CF practice for the Forecast
Satisfaction construct is also at the moderate level. Accordingly, these results
confirm that the effect size (q²) for each endogenous construct is over the lower
bound of 0.02, and the conceptual model has sufficient effect size for endogenous
constructs over the predictive relevance (Q²), validating the final procedure: effect
size of endogenous variables (q²).
Table 5.17. Effect size of endogenous variables (q²)
Effect size (q²) over predictive relevance (Q²)
Omission
distance Predictor constructs
Q²
included
Q²
excluded
q² Effect
size
G:10 The CF practice Collaborative Forecasting
Performance
0.3548 0 0.5499 Large
G:30 0.3558 0 0.5523 Large
G:10 The CF practice Forecast Satisfaction
0.1562 0 0.1851 Medium
G:30 0.1590 0 0.1891 Medium
G:10 Internal Integration External Integration
0.1909 0 0.2359 Medium
G:30 0.1924 0 0.2382 Medium
G:10 External Integration Information Quality
0.2613 0 0.3537 Medium
G:30 0.2624 0 0.3557 Medium
G:10 Information Quality Information Types
0.1596 0 0.1899 Medium
G:30 0.1605 0 0.1912 Medium
G:10 Forecasters’ Competence Group Forecasting
0.3485 0 0.5349 Large
G:30 0.3488 0 0.5356 Large
q² = (Q² included - Q² excluded ) / (1- Q² included)
Effect size q² = 0.35 ≥ Large; 0.15 ≥ Medium; 0.02 ≥ Small
5.9. Findings for the structural model
Data analysis of PLS for the structural model explains the hypothetical relationships
between latent variables. In the conceptual model, the latent variables predicting
other constructs were called exogenous / independent variables while latent variables
that were predicted by other constructs were entitled endogenous / dependent
variables (Götz et al., 2010). Due to the prediction feature of PLS the strength of
each structural path and the values of R² (combined predictiveness) for endogenous
constructs show the goodness of the conceptual model (Chin, 1998b).

281
Bootstrap analysis in the Smart PLS software evaluated the statistical significance of
hypothesised relationships by resampling 5000 times based on 105 usable responses
to the survey questionnaire (Chung and Lee, 2001). Although Chin (1998b)
recommended that resampling 500 times is adequate during the bootstrap analysis
process, recent literature suggested considering as many samples as possible due to
the fact that increased resampling leads to reducing the effect of random sampling
error, which is likely to occur during the analysis process (Peng and Lai, 2012). The
results of bootstrapping analysis for the structural model are portrayed in Figure 5.2.
Figure 5.2. Results of the structural model
External
Integration Internal
Integration
Information
Quality
Information
Types
Forecast
Horizon
Group
Forecasting
Forecasters’
Competence
The CF practice
Forecast
Satisfaction
Collaborative
Forecasting
Performance
H3b
Path C.: 0.5822
T-stat: 9.11***
H3a
Path C.: 0.3054
T-stat: 3.15***
H2a
Path C.: 0.2736
T-stat: 2.58***
H2b
Path C.: 0.5960
T-stat: 8.86***
H8a
Path C.: 0.5822
T-stat: 0.88
H8b
Path C.: 0.5463
T-stat: 7.88***
H7
Path C.: 0.2306
T-stat: 2.55**
H4
Path C.: 0.0819
T-stat: 1.39
H5
Path C.: 0.1775
T-stat: 1.94*
H6b
Path C.: 0.7015
T-stat: 9.59***
H6a
Path C.: 0.1379
T-stat: 1.52
H1a
Path C.: 0.7140
T-stat: 16.05***
H1b
Path C.: 0.5141
T-stat: 5.92***
{***p < 0.001, ** p < 0.05, *p < 0.1; (based on 𝒕(𝟒𝟗𝟗), two-tailed test)}
Source: Developed by the author

282
In addition to the statistical significance of relationships between constructs, this
research explicated the size of path coefficients. As having a larger path coefficient
indicates the greater impact of related constructs on the CF practice, this symptom
makes it possible to expound findings beyond the statistical significance and to have
a clear understanding of the contributions of this research. This approach also
ensures the reliability of the constructs in terms of underpinning the CF practice, and
enriches the value of managerial implications for practitioners (Joseph et al., 2014).
In the first instance, the standardised path coefficient from CF to Collaborative
Forecasting Performance was robust and statistically significant (Path C: 0.7140; p
< 0.001), supporting H1a. This result empirically stressed that the CF practice is a
strong and direct predictor of Collaborative Forecasting Performance in the FSC.
Because of the fact that the size of path coefficient from CF to Collaborative
Forecasting Performance was substantially large, this outcome demands the
attention of practitioners by underpinning the reliability of the newly developed CF
practice in generating accurate forecasts for related product-groups and conducting
long-term collaborations with retailers. Following this, the standardised path
coefficient from CF to Forecast Satisfaction was significant too (Path C: 0.5141; p <
0.001), supporting H1b. The implication here is that in spite of the fact that the
satisfaction factor is a subjective facet and likely to differ based upon the objectives
of companies and / or forecasters, the implementation of the CF practice has a strong
and direct impact on the satisfaction of manufacturers when they forecast the time-
sensitive and / or short-life product-groups.
On the basis of above stressed hypotheses (H1a & H1b), it is timely to recall that the
aim of current research was “to identify factors that have a significant influence on
achieving the Collaborative Forecasting Performance of manufacturers, when they
collaboratively forecast perishable, seasonal, promotional and newly launched
products with retailers in the FSC”. The criteria of the Collaborative Forecasting
Performance for manufacturers were (i) to improve the forecast accuracy of
associated product-groups and (ii) to conduct long-term collaborations with retailers
(one year or more). Demonstrating the significant impact of the CF practice on the
Collaborative Forecasting Performance justified the reliability of the CF practice in

283
achieving long-term and accurate CF for manufacturers, and allowed the research to
develop a theoretical concept in achieving its aim. The research then made it possible
to generalise its contributions for practice by way of demonstrating the impact of the
CF practice on the Forecast Satisfaction of manufacturers.
In terms of the integration of manufacturers in the FSC, the standardised path
coefficient from External Integration to the CF practice was significant (Path C:
0.2736; p < 0.001). This result confirms that manufacturers need to integrate with
retailers to be able to take advantage of CF. Therefore, this result supports H2a. In a
similar vein, the path coefficient from External Integration to Information Quality
was significant (Path C: 0.5960; p < 0.001), supporting H2b. This outcome indicates
that manufacturers’ integration with retailers enables them to share good quality
information in CF. Nonetheless, due to the bigger size of path coefficient from
External Integration to Information Quality, the impact of External Integration on
sharing quality information recommends additional implications for practitioners
compared to its impact on the CF practice. In other words, whilst manufacturers’
integration with retailers delivers a vital impact on their CF, this integration conveys
a more promising outcome by increasing the quality of information exchanged in
CF. This finding also corroborates the findings of Hartono et al. (2010), who
explored the direct impact of top management and IT systems on the sharing of
quality information.
Like External Integration, Internal Integration of manufacturers was statistically
significant and a strong predictor of the CF practice (Path C: 0.3054; p < 0.001).
This finding confirms H3a, and therefore the importance of interdepartmental
relationships in CF. Internal Integration was likewise statistically significant and the
direct predictor of External Integration (Path C: 0.5822; p < 0.001), supporting H3b.
This result indicates that manufacturers’ interdepartmental integration is vital for
effective integration with retailers at the external level. This finding also validates
the arguments of Stevens (1989), who stressed on the importance of Internal
Integration in terms of effectively managing product flows into and out of the
companies. In addition, uncovering the significant impact of manufacturers’ Internal
Integration on the External Integration with retailers extended the limited findings

284
of Braunscheidel and Suresh (2009) to the downstream level, as their study merely
addressed Internal Integration in manufacturer-supplier collaborations. On the other
hand, the size of path coefficient from Internal Integration to External Integration
was superior to the coefficient size that represents the predictor role of Internal
Integration on the CF practice. Hence, manufacturers’ interdepartmental integration
seems to be a pivotal factor for successful integration with retailers, and this
Internal-External Integration eases the implementation of CF in achieving long-term
and accurate CF in the FSC.
These demonstrations on the supply chain integration of manufacturers led the
research to accomplish its first objective, which was “to analyse the supply chain
integration of manufacturers both externally and internally, in which external
integration spans their relation with retailers and internal integration surrounds
their interdepartmental relations”. Accordingly, it was expected to answer the first
research question, which asked; “What factors in terms of manufacturers’ supply
chain integration influence their collaborative forecasts with retailers in achieving
long-term and accurate CF?” By relying on the aforementioned hypotheses (H2a &
H3a), the answer to this question is that manufacturers’ Internal Integration and
External Integration influence their collaborative forecasts with retailers in
achieving long-term and accurate CF. By demonstrating additional causalities, the
existing knowledge is further extended. In particular, External Integration with
retailers significantly influences the protection of Information Quality in CF (H2b),
while Internal Integration of manufacturers has a significant impact on their
External Integration with retailers (H3b).
As regards the forecasting process of manufacturers, the standardised path
coefficient from Forecast Horizon to the CF practice was not significant, not
supporting H4. This research deduces from this outcome that considering different
horizons between partners for the forecasts of perishable, seasonal, promotional, and
newly launched products does not influence CF from the viewpoint of
manufacturers. However, it seems encouraging to extrapolate this outcome, as the
results of qualitative data analysis offered opposing outcomes from the single semi-
structured interview and three online group discussions. On the other hand, Group

285
Forecasting was found to have a significant and direct impact on the CF practice
(Path C: 0.1775; p < 0.1), supporting H5. Nonetheless, Group Forecasting seems
not as important as manufacturers’ Internal Integration and External Integration
with retailers for promising CF. This can be deduced by comparing the size of the
path coefficients of these factors. Given the paucity of studies addressing group
dynamics in collaborations, this finding closed the extant gap in the forecasting
literature (Önkal et al., 2012). It is also valuable to interpret this outcome by
stressing the importance of conducting structural forecasting meetings in practice.
As far as forecasters are considered in CF, it was found that the standardised path
coefficient from Forecasters’ Competence to the CF practice was not significant, not
supporting H6a. However, the impact of Forecasters’ Competence was statistically
significant and this factor showed direct impact on Group Forecasting (Path C:
0.7015; p < 0.001), supporting H6b. Given the significance of Group Forecasting on
the CF practice, finding the direct impact and large size path coefficient of
Forecasters’ Competence on Group Forecasting implies additional outcome for this
research. In other words, it can be argued that Forecasters’ Competence is indirectly
important for the CF practice.
Quantitative data analysis, conducted for the forecasting process of manufacturers,
made it possible to fulfil the second objective of this research, as the intention was
“to examine the forecasting process of manufacturers, when they generate the
forecasts of related product-groups within their departments, and when they
aggregate these forecasts with retailers’ forecasts in group meetings”. This objective
expected answers from the research to the second research question; “What factors in
terms of manufacturers’ forecasting process influence their collaborative forecasts
with retailers in achieving long-term and accurate CF?” In response, it was
demonstrated that manufacturers’ Group Forecasting influences their collaborative
forecasts with retailers in achieving long-term and accurate CF (H5). Because of the
significant impact of Forecasters’ Competence on the Group Forecasting,
Forecasters’ Competence indirectly influences collaborative forecasts with retailers
in achieving long-term and accurate CF (partially H6a). Accordingly, the second
research question was answered to extend the body of forecasting literature.

286
In terms of the information sharing practices of manufacturers, the standardised path
coefficient from Information Types to the CF practice was significant (Path C:
0.2306; p < 0.05), supporting H7. This significance seemed superior to the
significance of Group Forecasting, but comparable with Internal Integration and
External Integration. Based on the size of path coefficients, it can be inferred that
sharing different Information Types with retailers is statistically significant for CF,
and it seems a prevailing practice compared with partners’ Group Forecasting. Yet it
is comparable with manufacturers’ Internal Integration as well as External
Integration with retailers in terms of the extent to which it affects CF. In other
words, whilst integration practices of manufacturers earn more credit for CF, the
impact of sharing different types of information with retailers cannot be
subordinated. In addition, whilst the literature witnessed studies that added more
value to retailer information in CF (Ramanathan, 2013; Sari, 2008; Aviv, 2001), this
research brought a new dimension to the information sharing literature and offered
the value of manufacturer information for promising CF in the FSC.
Finally, the standardised path coefficient from Information Quality to the CF practice
was not found to be significant, not supporting H8a. Nonetheless, Information
Quality was found to be significant and showed a direct impact on the share of
different Information Types with retailers (Path C: 0.5463; p < 0.001), supporting
H8b. In this context, there was a direct impact of Information Types on the CF
practice as well as the strong impact of sustaining Information Quality on the share
of different Information Types. Accordingly, it is reasonable to argue that
Information Quality has an indirect influence on the CF practice, and this argument
needs to be interrogated for additional insights to the literature and practice.
By examining information sharing practices of manufacturers, this research achieved
its final objective, which was “to investigate manufacturers’ information sharing,
when they exchange various information sources with retailers, and when the quality
of information shared plays a vital role in the forecast accuracy of associated
product-groups”. This final objective addressed the final research question; “What
factors in terms of manufacturers’ information sharing influence their collaborative
forecasts with retailers in achieving long-term and accurate CF?”. It was

287
demonstrated convincingly that manufacturers’ share of different Information Types
influences their collaborative forecasts with retailers in achieving long-term and
accurate CF (H7). As sustaining Information Quality was found to be significant for
the sharing of diverse Information Types, it was argued that manufacturers’ effort
made to sustain Information Quality indirectly influences their collaborative
forecasts with retailers in achieving long-term and accurate CF (partially H8a).
Results of hypothesis testing are presented in Table 5.18.
Table 5.18. Results of hypothesis testing
Codes From To
Significant at Not
significant 0.001
level
0.05
level
0.1
level
H1a The CF practice Collaborative
Forecasting Performance ***
H1b The CF practice Forecast Satisfaction ***
H2a External Integration The CF practice ***
H2b External Integration Information Quality *** H3a Internal Integration The CF practice *** H3b Internal Integration External Integration *** H4 Forecast Horizon The CF practice --- H5 Group Forecasting The CF practice * H6a Forecasters’ Competence The CF practice --- H6b Forecasters’ Competence Group Forecasting ***
H7 Information Types The CF practice **
H8a Information Quality The CF practice ---
H8b Information Quality Information Types ***
Significant at 0.001 level: ***; at 0.05 level: **; at 0.1 level:*; Not significant: ---
In summary, the hypothesis testing results showed the significant impact of the CF
practice on the performance of CF. Therefore, the CF practice offered by this
research appeared to be the strong predictor of enhancing long-term and accurate CF
in the FSC. Despite the fact that satisfaction is a subjective facet, findings validated
the reliability of the CF practice and showed its significant and direct impact on the
Forecasts Satisfaction of manufacturers in CF. These outcomes made it possible not
only to accomplish the research aim, but also to generalise findings for the target
population. In terms of the supply chain integration of manufactures, Internal-
External Integrations were found to be significant for the implementation of the CF
practice while manufacturers’ Internal Integration became the strong predictor of

288
integrations conducted at the external level. Consequently, this research
accomplished its first objective and answered the first research question.
When forecasting practices were taken into account, the findings uncovered the
insignificant impact of Forecast Horizon on the CF practice. Conversely, Group
Forecasting of partners was found to be significant by showing a direct impact on
the CF practice. Although Forecasters’ Competence exhibited a significant and
direct impact on the Group Forecasting, it was found to be insignificant in practising
the CF practice. However, the significant impact of Group Forecasting on the CF
practice led to arguing the indirect impact of Forecasters’ Competence on the CF
practice. These findings then allowed the research to achieve the second objective by
responding to the second research question. As regards the information sharing of
manufacturers, the share of different Information Types demonstrated its significant
and direct impact on the achievement of CF practice. Maintaining Information
Quality was also found to be a significant and strong predictor of sharing diverse
Information Types in CF. The significance of Information Quality on the CF practice
was not found, yet its direct impact on the share of different Information Types led to
claiming its indirect impact on the CF practice. Accordingly, the final research
objective was achieved, and these contributions made it possible to answer the final
research question.

289
5.10. Summary
This chapter commenced with the aim of theoretically validating the appropriateness
of the data analysis technique PLS. The four rigour assumptions of Peng and Lai
(2012) confirmed that PLS is the most appropriate technique based on the existing
conditions of this research. These assumptions were (i) exploratory research
objectives, (ii) small sample size and the complexity of the conceptual model, and
(iii) properties of existing data along with (iv) the existence of formative constructs
in the model.
Given the existence of the formative construct in this research, namely the CF
practice, it was essential to give a rationale for its formative structure and to provide
a theoretical definition. Based on the four criteria of Jarvis et al. (2003), it was
confirmed that the CF practice is a formative construct and consists of five different
items. The criteria that validated its formative structure were (i) direction of causality
from items to construct, (ii) unnecessary interchangeability of items, (iii)
unnecessary covariation among the indicators, and (iv) different nomological net of
the indicators. To explain the characteristics of research samples, descriptive
statistics involved the position of respondents, manufacturing companies’ number of
years in operation, region, and number of employees as well as annual sales volume.
Given the importance of providing unbiased contributions to the literature and
practice, independent T-test statistics also confirmed that the research samples are
bias free. Therefore, data analyses and research findings were shared with the reader
in an objective and transparent manner.
For the measurement model of reflective constructs, Cronbach’s α led to determining
the degree to which a group of observed variables evaluates the relevant constructs.
Following this, all constructs in the model had 0.7 values for composite reliability,
and this led the research to support the internal consistency of the model. Then,
construct validity was affirmed over the content validity, convergent validity and
discriminant validity. The verification of convergent validity hinged on the value of
AVE and the loading values of observed variables, which were already greater than
0.7. Presenting the greater value of the square root of AVE compared to the

290
correlations between latent variables led the research to validate the discriminant
validity of the reflective constructs in the model.
In terms of the measurement model for the formative construct, the content validity
was confirmed by creating the CF practice based on the systematic review of
literature. The domain of this construct was confirmed by qualitative data and the
grey literature, and eight expert judgments affirmed its formative structure.
Theoretically, the four criteria of Jarvis et al. (2003) also ensured that the CF
practice of this research has the content validity. Due to the impact of formative
items on the construct, implying unrelated internal consistency, the research
considered the weights of formative items to approve the indicator validity. All
formative items, excluding the commitment factor, were over the threshold value of
0.1 and significant at 0.05 level. To decide whether the commitment factor would be
kept in the model, the multicollinearity statistics were employed by considering the
values of VIF for the formative items.
Having VIF values less than the threshold value of 3.3 permitted the research to keep
the commitment factor in the model. The external validity was then considered by
evaluating the significant path coefficient between the CF practice and its reflective
items of accurate and long-term CF, which were represented by the reflective
construct of Collaborative Forecasting Performance. Having a significant path
coefficient between CF practice and Collaborative Forecasting Performance
validated the external validity of the formative construct in the model.
The analysis of the conceptual model was completed based on five different analysis
procedures, which were Goodness-of-Fit (GoF), explained variance (R²) and effect
size for predictive variables (ƒ²) as well as blindfolding and predictive relevance (Q²)
along with the effect size of endogenous variables (q²). The analysis procedure of
GoF confirmed that the conceptual model of this research performs well. The second
procedure of R² then led the research to clarify the explained variance for
endogenous constructs.

291
The third analysis procedure was the effect size of independent variables (ƒ²). This
procedure led the research to explore the effect of exogenous variables on the
associated endogenous variables by considering the values of R². As regards the
fourth analysis procedure, the predictive relevance of the Stone-Geisser test (Q²) was
measured for the reflective endogenous constructs. This procedure made it possible
to understand how well the conceptual model and PLS parameters reconstituted the
observed variables. The research employed the blindfolding procedure and
confirmed that the conceptual model has a sufficient predictive relevance. The final
analysis procedure was the effect size of endogenous variables (q²). This procedure
confirmed that exogenous variables in the model have a sufficient influence on the
associated endogenous variables.
The findings of the structural model were then obtained through the bootstrap
analysis, where Smart PLS evaluated the statistical significance of hypothesised
relationships by resampling 5000 times based on 105 research samples. Primarily,
the hypothesis testing showed the significant impact of the CF practice on the
performance of CF (supporting H1a), and this outcome led to demonstrating the
direct impact of the CF practice in achieving long-term and accurate CF in the FSC.
The CF practice was found to be a significant and direct predictor for the Forecast
Satisfaction of manufacturers based on the associated product-groups (supporting
H1b).
External Integration with retailers was found to be a significant predictor of the CF
practice (supporting H2a). External Integration showed a significant and direct
impact on the Information Quality (supporting H2b). Following this, Internal
Integration of manufacturers demonstrated a significant impact on the CF practice
(supporting H3a). While this outcome increased the importance of interdepartmental
relations, External Integration was significantly predicted by manufacturers’
Internal Integration (supporting H3b).
As far as the forecasting process of manufacturers was considered, data analyses
demonstrated the insignificant impact of Forecast Horizon on the CF practice (not
supporting H4). Following this, Group Forecasting of partners was found to be

292
significant, and it demonstrated a direct impact on the CF practice (supporting H5).
This finding allowed the research to highlight the key role of forecasting meetings in
CF. Next, the insignificant impact of Forecasters’ Competence was found on the CF
practice (not supporting H6a). Inversely, Forecasters’ Competence demonstrated a
significant and direct impact on the Group Forecasting (supporting H6b). In spite of
the insignificant impact of Forecasters’ Competence on the CF practice, it
demonstrated a rigorous influence on the Group Forecasting, which was the strong
predictor of the CF practice. Accordingly, this research earned an opportunity to
argue that Forecasters’ Competence indirectly influences the CF practice.
As regards the information sharing of manufacturers, data analysis demonstrated the
significant and direct impact of sharing different Information Types on the CF
practice (supporting H7). This demonstration gave full credit to manufacturers’
information and led to defending their value in CF whilst prior literature put
emphasis on the retailer information. On the other hand, sustaining Information
Quality was found to be insignificant on the CF practice (not supporting H8a), while
it demonstrated a significant and direct impact on the share of diverse Information
Types with retailers (supporting H8b). This outcome led the research to assert the
indirect impact of Information Quality on the CF practice due to its significant role
in sharing diverse Information Types with retailers, which is the strong predictor of
the CF practice.

293
6. CHAPTER 6: DISCUSSION AND CONCLUSIONS
6.1. Overview
This chapter examines the overall research findings that extend the body of the
literature and provide applicable implications to practice. In this context, the scope of
the research is initially described clarifying how this research achieved its aim and
objectives, and answered each research question in a logical and justifiable manner.
Then, the scope of each chapter is summarised in an attempt to highlight key
contributions offered to theory, methodology and practice. After tabulating the key
contributions of each chapter, a particular emphasis is placed on theoretical and
managerial implications. Accordingly, further clarification is provided on how
research findings contribute to theory and what are the distinguishing features from
prior studies. Finally, future research opportunities are clarified, and limitations are
stressed as a contribution to extending the future research fields for the diverse
research themes.
6.2. Scope of research and key contributions
The current research has been dedicated to the CF practices of manufacturers and
retailers collaborating in the FSC. With a particular emphasis on manufacturers’
standpoint in CF, four different product-groups, namely perishable, seasonal and
promotional as well as newly launched products, have become the concentration of
CF under investigation. With the purpose of increasing the forecast accuracy of
associated product-groups and extending the duration of collaboration (one year or
more) between partners, this research developed three research questions. Each
research question relied extensively upon the research themes of supply chain
integration, forecasting process and information sharing respectively, since the
intention was to explore candidate factors in achieving long-term and accurate CF in
the FSC.
Through the systematic review, qualitative data analysis and critical review of grey
literature, thirteen hypotheses were developed depending upon ten constructs in the
conceptual model. Based upon survey data captured from manufacturers, located in
the UK & Ireland, North America and Europe, ten hypotheses were theoretically

294
validated by the exploratory data analysis technique PLS in response to the research
questions. With the intention of conveying this research to the reader, this thesis was
organised into six chapters.
6.2.1. Scope of chapter one – Introduction
In chapter one, the background of CPFR was initially addressed to provide
contextual knowledge and to present the arguments of prior literature dedicated to
this phenomenon. Then, attention was paid to describing the problems that appear in
CF, which is one of the three sub-stages of CPFR. Accordingly, the research gap was
explored in the dyadic manufacturer-retailer forecasts collaborations, and this gap
constituted pragmatic challenges preventing partners from conducting accurate and
long-term CF for perishable, seasonal, promotional and newly launched products in
the FSC.
Whilst there is a scarcity of research addressing the pragmatic problems in CF, the
aim and objectives of this research focused on the extant gap to extend the body of
the literature and to offer managerial implications. Accordingly, with a particular
emphasis on the food industry, the vulnerability of the market, the role of FSC in
Europe and North America, and environmental uncertainties were elaborated. To
give a rationale for the significance of associated product-groups, each product-
group was also examined based upon the findings and shortcomings of prior
literature. Following this, the research approach and philosophy were summarised to
provide a clear understanding of the methodological stance of the research. In an
attempt to inform the data collection process, which was used to respond to the
research questions, the summary of research strategy was conveyed to the reader.
6.2.2. Scope of chapter two – Literature review
In chapter two, systematic review and the critical review of grey literature
constituted the primary focus of the research. The systematic review methodology,
conducted under the guideline of Tranfield et al. (2003), was initially explained
(Section 2.2). This description provided a rationale for the review methodology,
where the aim was to review peer-reviewed articles published from 1971 to 2013 and

295
to share contributions, limitations and future research opportunities over the research
themes of supply chain integration, forecasting process and information sharing. A
new systematic review protocol was then introduced as a systematic path of
reviewing the literature. This protocol is one of the core contributions to
methodology (Figure 2.1). Research approach adopted through the analysis of
systematic review and data extraction was then documented transparently.
Accordingly, the results of the systematic review process were outlined. 29 different
journals that led to distilling 92 peer-reviewed articles were classified into four
groups, namely OM, F&DM, SCM&L and F&DM. Classifying journals into four
groups led to distinguishing their primary coverage topic areas, which, in turn,
facilitated the categorisation of secondary data upon the particular research themes
of this research. Presenting journals’ publication trends (Figure 2.2), classification in
four groups (Table 2.4), and geographical distribution of articles (based on the
affiliation of the first author) (Figure 2.3) became the following contributions to
increase the awareness in the field. Next, by considering the four journal groups,
methodological contributions of journals were discussed and presented (Figure 2.4),
followed by scrutinising the methodological contributions of 92 articles which were
categorised based on the three major research themes of this research (Figure 2.5).
After that, 28 articles were presented as a contribution to methodology (Table 2.5).
Then, with a particular emphasis on the systematic review and grey literature, the
phenomenon of CPFR was subject to the critical review process on the basis of prior
studies. Following this, the collaboration practices of S&OP, VMI and QR as well as
ECR were reviewed in an attempt to enhance the understanding of their theoretical
context and implementation in practice. With the combination of diverse findings
from prior literature, the research extracted the objectives, benefits of these four
collaboration practices and highlighted the required responsibilities of partners in
practice. This outcome represented one of the pragmatic contributions of this
research (Table 2.6). Then, the research theme of supply chain integration was
reviewed by exploring barriers that prevent integrations in the FSC.

296
Next, the review process relied purely upon the forecasting process by exploring the
extant gap over the forecasting strategies and forecasting methods along with their
selection criteria. While the review process addressed the forecasting meetings, four
different methods were reviewed. Then, the strengths and weaknesses of these
meeting methods, namely Face-to-Face Meeting, Nominal-Group and Delphi-
Technique as well as Prediction-Markets, were scrutinised and tabulated as a
contribution to practice (Table 2.7). Finally, the role of forecasters was reviewed to
have clear wisdom about the extant situation of forecasters in CF.
The final research theme of information sharing was then reviewed. Despite the fact
that the focus was manufacturers and this necessitates the analysis of manufacturer
information, diverse information sources belonging to retailers were additionally
analysed in chapter two. The quality level of information was likewise considered by
reviewing diverse benchmarks offered by prior literature while the role of IT systems
in CF was not overlooked through the review process.
6.2.3. Scope of chapter three – Development of hypotheses and conceptual
model
In chapter three, the primary focus became to justify the theoretical way followed to
develop the hypotheses and conceptual model. Therefore, the research concentrated
on the theoretical concepts of Whetten (1989) which involved “what, how, why and
the combinations of who, where and when”. In doing so, the reason behind
developing a new CF practice was elaborated, and the research argued its impact on
achieving long-term and accurate CF as well as enhancing the forecast satisfaction of
manufacturers. This rationalisation encapsulated the first two hypotheses of the
research (H1a & H1b). Then, five items constituting the theoretical domain of the CF
practice were scrutinised to add a clear understanding of CF in the FSC. These items
were trust, commitment and a joint business plan as well as consensus-based internal
forecasts along with the sharing of order forecasts. Relevant references supporting
the contributions of each item to the domain of the CF practice were also presented
(Table 3.1) whilst the CF practice was introduced to the reader as a new candidate
contributing to theory (Figure 3.1).

297
Emphasis was then placed on the integration of manufacturers in an attempt to
discuss the potential candidate factors in reply to the first research question. The
research offered two hypotheses, External Integration and Internal Integration, and
discussed their impact on the CF practice as potential contributors to achieving long-
term and accurate CF in the FSC (H2a & H3a). Elaborating causalities among these
hypotheses also became an additional argument in extending the body of the
literature over supply chain integration (H3b). Later, the forecasting process of
manufacturers was discussed, and the research offered the three hypotheses of
Forecast Horizon, Group Forecasting, and Forecasters’ Competence as potential
answers to the second research question (H4, H5 & H6a). These hypotheses’ impact
on the CF practice were discussed in a legitimate way, and they turned into potential
contributors to theory. By extending the hypothetical arguments, the impact of
Forecasters’ Competence on the Group Forecasting was hypothesised as a
supplementary candidate extending the body of forecasting knowledge (H6b).
Finally, by initiating the arguments on the information sharing of manufacturers, two
hypotheses were offered in response to the final research question, which were
Information Types and Information Quality (H7 & H8a). Along with the reasonable
debate over these hypotheses’ impact on the CF practice, the research expanded
theoretical arguments on the Information Quality. Then, hypothetical causalities
were defended between Information Quality and External Integration (H2b) and
between Information Quality and Information Types (H8b) in a legitimate manner.
Therefore, apart from offering rigorous answers to the final research question,
theoretical contributions were intended to be expanded by interlinking the two
different research themes of supply chain integration and information sharing. All
hypothetical relationships were then unified, and the conceptual model of the
research was presented as a candidate model in extending the body of knowledge
over three different research themes (Figure 3.2). In the end, relevant references
underpinning the hypothetical relationships were listed to guide the reader in judging
the theoretical arguments of the research (Table 3.2).

298
6.2.4. Scope of chapter four – Research methodology and data collection
In chapter four, the research methodology was justified in a transparent manner, and
the logics behind embracing the deductive approach and the epistemological
paradigm of positivism were conveyed to the reader. The epistemological paradigms
of positivism and interpretivism were also compared, and this comparison was
tabulated as an additional guideline for researchers (Table 4.2). Then, the world-view
elements of ontology, axiology, and methodology were reviewed. When the world-
view methodology was studied, the research presented its methodological aspect by
explaining its posture in a rationale way (Table 4.3). Then, research strategies and
the triangulation approach were discussed.
Next, attention was paid to explaining the research design. Accordingly, the strategic
research process was developed (Figure 4.3). Given the fact that this process
consisted of two phases, namely (i) hypothesis development phase and (ii)
hypothesis testing phase, each step followed in these phases was explained. After
that, the research’s data collection process – mixed design was clarified, and the
structural and chronological data collection process was portrayed to illuminate the
process (Figure 4.4). The research then emphasised the role of social networking
sites to give a rationale for the impact of the social networking service LinkedIn on
the data collection process. Justifying its employability in the academic field became
an additional contribution to methodology (Section 4.1.1)
Then, this chapter provided a clear understanding of the qualitative data collection
process of the research. Presenting the outcomes of the single semi-structured
interview became the following step, as these outcomes led the research to modify
the systematic review based propositions and conceptual model to increase the
pragmatic contributions in the field (Section 4.5.1.4). In this respect, the descriptive
information about these online group discussions was documented (Table 4.5), along
with the explanation of the qualitative data analysis process and the utilisation of
QSR NVivo 9. After that, the outcomes of each online group discussions were
discussed by underpinning results via literature-based findings (Section 4.5.2.4).

299
Following this, the research focused on the quantitative data collection process.
Descriptions commenced by justifying the reasons for employing the data collection
method of online survey questionnaire. This justification was underpinned by
distilling 26 articles from the literature (Table 4.6). Next, the design of the online
survey questionnaire was described, and it was clarified that this process was
conducted under the guidelines of Churchill Jr, (1979) and Flynn et al. (1990).
Clarifying the process followed to explore the target population and sampling
became the next step in chapter four. By considering the structured sampling process
of Wilson (2010), the research described the steps of (i) defining the target
population, (ii) selecting the sampling frame and (iii) choosing the sampling
technique, then (iv) determining the sample size and (v) collecting the data as well as
(vi) assessing the response rate.
The quantitative data collection stages were also conveyed to the reader. Initially, the
first data collection stage focusing of the social networking service LinkedIn was
described. It was followed by the second stage clarifying the utilisation of the online
databases of Bloomberg, FEMA, and Osiris. The third and fourth data collection
stages were then clarified, with being based on the websites of associated federations
and the personal contacts of the author respectively. At the end of the data collection
stages, the outcomes were tabulated (Table 4.8), where the research presented the
existence of 105 usable responses engendering a 3.06 percent response rate. Then,
particular emphasis was placed on assessing the reliability of the sample size and
response rate. Initially, the research recalled the interesting findings of Cycyota and
Harrison (2006), who warned researchers that there is a noticeably decreasing
response rate in survey based studies. The research then unified the suggestions of
Saunders et al. (1997) and Wilson (2010) to develop three assessment criteria for the
sample size and response rate. These criteria were to (i) consider the characteristics
of the sample data, which relies on the sampling technique, (ii) compare the sample
size and response rate with prior studies, and (iii) analyse the candidate data analysis
techniques’ features to ensure the coherence between the sample size and the data
analysis technique selected.

300
6.2.5. Scope of chapter five – Data analysis and findings
In chapter five, by extending the discussions on the data analysis technique of PLS,
theoretical validation was provided based on the four rigour assumptions of Peng
and Lai (2012). The formative structure of the CF practice was also validated based
on the four criteria of Jarvis et al. (2003) (Section 5.3). Then, the research notified
the results of descriptive statistics to the reader. The outcomes encapsulated the
position of the respondents, manufacturing companies’ number of years in operation,
region, and number of employees as well as annual sales volume. Descriptive
statistics were then focused on the product-groups to increase the awareness of
researchers in the field for future research (Section 5.4).
By employing T-test statistics, it was then confirmed that the research samples are
bias free. Then, the research conducted reliability and validity analysis procedures
for the measurement model of reflective constructs, the measurement model for the
formative construct and the structural model of the research. At the end of analysis
procedures, the research statistically confirmed the quality of the conceptual model.
In other words, while observed variables appropriately characterised related
constructs, each exogenous construct properly predicted associated endogenous
constructs, with both endogenous and exogenous constructs accurately creating the
complete form of the conceptual model.
Finally, the research applied the bootstrap analysis in the Smart PLS and evaluated
the hypothetical relationships in the conceptual model. The hypothesis testing
demonstrated the significant impact of the CF practice on the Collaborative
Forecasting Performance. This finding added important insights into the value of the
CF practice by confirming its impact on the achievement of long-term and accurate
CF in the FSC. Then, the data analysis explored the CF practice as a significant and
direct predictor of Forecast Satisfaction, representing manufacturers’ satisfaction
from forecasts generated for perishable, seasonal and promotional as well as newly
launched products. These two demonstrations led to confirming the arguments of the
current research on the CF practice, developed to accomplish the research aim.

301
In reply to the first research question, manufacturers’ External Integration with
retailers was found to be a significant predictor of the CF practice. Based on this
finding, manufacturers’ integration with retailers is a substantial necessity to achieve
long-term and accurate CF. Data analysis then exhibited the significant and direct
impact of External Integration on the Information Quality. In other words, when
manufacturers successfully integrate with retailers they will be able to sustain the
quality of information exchanged in CF. Internal Integration of manufacturers also
demonstrated a significant impact on the CF practice. This outcome confirmed the
significant role of interdepartmental relations of manufacturers in achieving long-
term and accurate CF. Then, the significant and direct impact of Internal Integration
was confirmed on the External Integration.
In terms of the second research question, data analysis revealed the insignificant
impact of Forecast Horizon on the CF practice. This finding made it possible to infer
that different choices of partners about the Forecast Horizons of perishable,
seasonal, promotional, and newly launched products do not influence the
performance of CF. Group Forecasting of partners was then found to be significant,
and it demonstrated a direct impact on the CF practice. To put it another way,
partners’ Group Forecasting is important in CF. Nevertheless, it is not as imperative
as either manufacturers’ Internal Integration or External Integration with retailers.
This inference emerged from the path coefficient size of hypotheses. Then, the
insignificant impact of Forecasters’ Competence was demonstrated on the CF
practice. However, Forecasters’ Competence showed a significant and direct impact
on the Group Forecasting. This finding arguably implied that Forecasters’
Competence indirectly influences the CF practice due to its predictor role on the
Group Forecasting.
As regards the final research question, data analysis demonstrated the significant and
direct impact of Information Types on the CF practice. This finding allowed the
research to advocate that sharing diverse Information Types with retailers is a
promising practice for long-term and accurate CF, and it is more valuable than the
implementation of Group Forecasting in CF. Based on the size of path coefficients,
the importance of Information Types in CF is also comparable with manufacturers’

302
Internal Integration and External Integration. Maintaining the Information Quality
was, however, found to be insignificant on the CF practice while it demonstrated a
significant and direct impact on the share of diverse Information Types with retailers.
By taking into account the significant role of Information Quality in sharing diverse
Information Types with retailers, it can be argued that Information Quality has an
indirect impact on the CF practice. Overall, the combinations of all findings,
responding to the research questions, led to recommending a concrete conceptual
model to the literature and practice (Figure 5.2). The summary of contributions
emerged from each chapter is presented in Table 6.1. The following section
extrapolates the research findings in detail and adds valuable contributions to both
theory and practice.

303
Table 6.1. Contributions to theory, methodology and practice
Achievements in chapter/s
Contributions to
Theory Methodology Practice
Guide the
reader /
researchers
1 *Research aim and objectives (Section 1.3)
*Research questions (Section 1.4) x
2
*Systematic review protocol (Section 2.2.1) & (Figure 2.1) x x
*Publication trend of systematically reviewed articles (Figure 2.2) x
*Geographical distribution of journals (Figure 2.3) x
*Methodological contributions of journals (Figure 2.4) x
*Methodological contributions of articles (Figure 2.5) x
*Classification of journals (Table 2.4) x
*List of articles purified based on their contributions to the food
industry, associated product-groups and research themes (Table 2.5) x x
*Objectives and benefits of collaboration practices along with the
responsibilities of partners in S&OP, VMI, QR and ECR (Table 2.6) x
*Strengths and weaknesses of techniques used in the forecasting
meetings (Table 2.7) x
3
*Relevant references of formative variables constituting the CF
practice (Table 3.1) x
*The CF practice aiming to achieve long-term and accurate CF and
the forecast satisfaction of manufacturers (Figure 3.1) x
*Conceptual model (Figure 3.2) x
*Relevant references of hypotheses (Table 3.2) x
4
*Comparison of epistemological research philosophies / paradigms
(Table 4.2) x x
*Methodological aspect of current research (Table 4.3) x x
*Strategic research process – Flowchart (Figure 4.3) x x
*Structural and chronological data collection process (Figure 4.4) x x
*Rationale for using social networking sites for academic research
(Section 4.4.1) x x
*Outcomes of the semi-structured interview (Section 4.5.1.4) x x
*LinkedIn-based online group discussions (Table 4.5) x x
*Outcomes of the online group discussions (Section 4.5.2.4) x x
*Survey questionnaire oriented relevant studies (Table 4.6) x x
*Outcomes of quantitative data collection stages (Table 4.8) x
5
*Development of a formative construct: the CF practice –
Theoretical definition (Section 5.3) x
*Descriptive statistics (Section 5.4) x
*The CF practice Collaborative Forecasting Performance (H1a) x x
*The CF practice Forecast Satisfaction (H1b) x x
*External Integration The CF practice (H2a) x
*External Integration Information Quality (H2b) x
*Internal Integration The CF practice (H3a) x
*Internal Integration External Integration (H3b) x
*Forecast Horizon The CF practice (H4) x
*Group Forecasting The CF practice (H5) x
*Forecasters’ Competence The CF practice (H6a) x
*Forecasters’ Competence Group Forecasting (H6b) x
*Information Types The CF practice (H7) x
*Information Quality The CF practice (H8a) x
*Information Quality Information Types (H8b) x
*Results of Structural Model (Figure 5.2) x x
Source: Developed by the author

304
6.3. Theoretical and managerial implications
6.3.1. The CF practice in the FSC
Through the systematic review, qualitative data analysis and critical review of grey
literature as well as quantitative data analysis, this research offers a new theoretical
approach for the CF of manufacturers. The CF practice aims to (i) increase the
forecast accuracy of perishable, seasonal and promotional as well as newly launched
products and (ii) guide manufacturers in conducting long-term collaborations with
retailers. Its implementation also seems to satisfy manufacturers from the forecasts
generated for associated product-groups. Practitioners can avail themselves of this
CF practice when they aim to conduct long-term and accurate CF with retailers. Its
application, however, entails fundamental preconditions, which are trust,
commitment, and joint business plans as well as consensus-based internal forecasts
along with the sharing of order forecasts with retailers.
Regarding these preconditions, manufacturers’ consensus-based internal forecasts is
the most significant factor for the implementation of the CF practice, which is
followed by joining business plans and sharing of order forecasts with retailers.
Building trust in CF is also a significant factor, but not like the former three
preconditions. Exhibiting commitment between partners is not a significant
entailment, yet the data analysis of this research made it possible to ensure that this
factor needs to be taken into account during the implementation of the CF practice.
In this regard, as long as manufacturers fulfil these preconditions, they can not only
conduct long-term and accurate CF with retailers, but also be satisfied from forecasts
generated for perishable, seasonal and promotional as well as newly launched
products.
In terms of the consensus-based internal forecasts, this practice clearly adds more
insight to manufacturers’ multiple forecasts generated by diverse departments over
different sources and objectives. As multiple forecasts exacerbate internal-external
conflicts in collaborations with retailers (Taylor and Fearne, 2006; Fliedner, 2006;
2003; Helms et al., 2000), generating consensus-based internal forecasts seems a
promising remedy for manufacturers. This indicates that manufacturers need to
generate a single forecast that fully satisfies relevant departments beforehand. This

305
calls for the cross-functional relationships of departments. For instance, McCarthy et
al. (2006) stressed how 53 percent of USA firms worked cross-functionally to
incorporate departmental forecasts while 54 percent employed CF. As departments’
cross-functional integration underpins accurate forecasts (Oliva and Watson, 2011;
Nakano, 2009; Davis and Mentzer, 2007), agreeing on a single forecast improves
CF with retailers (Fliedner, 2006; 2003).
To accomplish better consensus-based internal forecasts, S&OP seems a reliable
option for manufacturers. This is because, S&OP is a decision making process to
harmonise strategic, operational and financial plans to have a consensus on a single
plan, and such a plan holds risks, opportunities and actions relative to demand
forecasts and the supply chain (VICS, 2010). It is a long-term strategic plan that
allows manufacturers to synchronise their internal-external relation in CF with
retailers (Mello, 2013). Hence, merging S&OP to the CF practice offered by this
research will assist manufacturers, not only facilitating consensus between
departments, but also improving their integration with retailers. It is worth
underpinning this recommendation with the collaboration of The Lowe’s Home
Improvement and Whirlpool. These partners successfully linked the practices of
CPFR and S&OP, and increased sales by 12 percent through timely deliveries, which
led to reducing inventory costs by 5 percent (Smith et al., 2010).
Considering the necessity of joining business plans, it is one of the significant factors
for the CF practice. The finding is in line with past literature, where joint business
plans were stressed as a vital and collaborative task of engaging strategies and
building steps to solving conflicts between partners (VICS, 2004; Siefert, 2003;
Barratt and Oliveira, 2001). Because the CF practice aims to improve long-term and
accurate CF, joining business plans with retailers should be an essential practice.
Supporting this view, Nyaga et al. (2010), for instance, highlighted the necessity of
joining plans in long-term collaborations. There are contrary views too, and
Ramanathan and Gunesakaran (2014), for instance, showed that collaborative
planning is not a significant factor for future collaborations. However, these authors’
analyses were in the textile industry, and perceptions on future collaborations
regarded business expansion, collaboration on a new project and transparent

306
information sharing. Whilst their study was limited to promotions, this research
stresses long-term collaborations based upon the forecasts of particular product-
groups, including perishable, seasonal, promotional and newly launched products, in
the FSC. Therefore, researchers can benefit from these differing findings to
interrogate the importance of joint business plans in partners’ collaboration.
Another precondition for the CF practice is to share order forecasts with retailers.
This finding supports the observations of Småros (2007) in Europe, where partners
confronted challenges in transforming forecasts from the supply chain level to the
store level due to different forecasting approaches. The underlying reason is that
when partners share separately generated order forecasts, it enables them not only to
reflect recent changes in demand but also to clarify whether the order is for the short
or long-term (Ireland and Crum, 2005; Siefert, 2003). Furthermore, increasing
forecast accuracy relies largely upon the clear understanding about for what purpose
these forecasts are used (Zotteri and Kalchschmidt, 2007). For practitioners, this
indicates that sharing order forecasts with retailers enables retailers to have a clear
understanding about the reason for order forecasts (e.g. production planning and
supply chain) and to modify demand based on manufacturers’ forecasts. This
practice therefore makes it possible to conduct a transparent forecasting process in
meetings, easing consensus with retailers in CF.
Regarding the role of trust and commitment for the CF practice, the results of the
current research are contrary to earlier literature. In response to the significance of
trust (at 0.05 level), it was found that commitment is not a crucial item in forming
the CF practice. Past literature stressed that trust and commitment are two major
essentials of long-term collaborations (Vlachos and Bourlakis, 2006; Mentzer et al.,
2000). It is interesting that the qualitative data analysis of this research also claimed
the importance of both trust and commitment, contrary to the quantitative data
analysis. In detail, the outcomes of the semi-structured interview claimed the
necessity of trust and commitment in the long-term.
In terms of the trust factor, the current research supports the assertions of Taylor and
Fearne (2006), who stressed the importance of trust between partners for effective

307
demand management. The findings of online group discussions are also in line with
the quantitative data analysis and prior literature. These outcomes add further
understanding to the importance of trust, as the quality of relationships between
partners hinges upon their effort put into building trust, which in turn conveys
permanence to their collaboration (Fischer, 2013).
On the other hand, quantitative data analysis indicates that commitment is not a vital
requisite for the CF practice. This raises question marks, as past literature confirmed
its necessity for satisfactory relationships (e.g. coordination, participation in decision
marketing, information sharing and management activities) (Nyaga et al., 2010). Past
literature also gave full credit to the commitment to develop promising
collaborations (Dwyer et al., 1987). It is worth remembering that the qualitative data
analysis of this research also claimed its prominence in collaborations. In a similar
vein, Simatupang and Sridharan (2002) argued that commitment between partners is
the precondition of successful collaborations. Interestingly, while Nyaga et al.
(2010) confirmed the importance of commitment for profitability, sales growth, and
market share in collaborations, this factor, contrarily, was not found to be a
significant factor for a collaborative performance, including forecast accuracy, order
cycle times and order processing accuracy as well as on time deliveries.
Similar to Nyaga et al. (2010), the CF practice in this research aims to improve
forecast accuracy, and commitment was not found to be a significant factor.
However, the findings of these authors confirmed the commitment for financial and
operational practices. There are also a plethora of studies supporting the necessity of
both trust and commitment to cope with volatile demand in the FSC (Van der Vaart
et al., 2012; Ha et al., 2011; Johnston et al., 2004). These comparisons and contrary
views therefore need to be appraised with future research to clarify the role of
commitment on the forecast accuracy in addition to the trust factor in the FSC.
For managerial practice, it can be argued that building trust is an important element
for the implementation of the CF practice, yet creating such a trust-based
environment in collaborations is most likely to demand the other elements of the CF
practice. In other words, generating consensus-based internal forecasts is likely to

308
lead to sharing reliable order forecasts with retailers. Developing joint business plans
is an action of not only integrating strategic objectives and operational practices, but
also showing willingness and confidence in pursuing collaborations. Thereby,
partners are very likely to build trust with each other in CF. In this context; it is
promising to deduce that developing the CF practice adds a new dimension to the
forecasting and supply chain practices of manufacturers. This approach can guide
practitioners to generate accurate forecasts for perishable, seasonal and promotional
as well as newly launched products. Conducting long-term collaborations is also
achievable, yet the aforementioned preconditions need to be fulfilled in
collaborations. To fulfil these necessities and to get full benefit from the CF practice,
there are more responsibilities that should be taken, which were explored by
achieving the research objectives. They are discussed in the following sections.
6.3.2. Integration of supply chain
Accomplishing the first research objective led to the finding that integration
practices of manufacturers are the most contributing factors to long-term and
accurate CF. Unlike past studies, this research started to investigate the operations of
manufacturers from the internal level. These internal practices comprise the skills of
preparing and conducting effective delivery plans, inventory management for end
products, and the availability of IT systems for timely information sharing between
departments as well as the level of recording departmental information. The findings
of the research confirm that the Internal Integration of manufacturers is the strongest
antecedent of the CF practice.
This finding corroborates the observations by Småros (2007), who illustrated the
manufacturers’ loss of information when they collaboratively forecasted newly
launched products with retailers in the European grocery sector. The findings of
Ramanathan and Gunasekaran (2014) are also underpinned by this empirical
outcome, since they demonstrated the significance of timely delivery and investment
in IT systems for long-term and successful collaborations. Differently from prior
studies, this research not only underpins the existing literature, but also broadens it
by ascertaining how manufacturers’ inventory management and regular data

309
recording affect their CF with retailers. These results are beneficial for practitioners
and need to be taken into account through the forecast collaboration with retailers.
In addition, the findings show that Internal Integration is the vital predictor of
External Integration. External Integration comprises interdependence, flexibility and
availability of IT systems for information exchange along with top managements’
adoption of the same vision. The findings present manufacturers’ External
Integration with retailers as the second strongest and direct antecedent of the CF
practice. This makes manufacturers’ Internal Integration even more important to
extend the integration external level and to conduct promising CF with retailers in
the FSC. With this finding, the arguments of Stevens (1989) are supported, because
the author considered Internal Integration as the preceding step of integration with
suppliers and customers at the external level. Unlike Stevens (1989), this research
focuses on strategic and long-term integration with retailers while the study by
Stevens (1989) also considered suppliers based on the tactical and medium term
integration. Furthermore, this research extends the findings of Braunscheidel and
Suresh (2009) to the downstream level. These authors demonstrated the importance
of Internal Integration for External Integration with suppliers, yet the same vision
was followed in terms of building long-term relationships between partners.
In practice, this finding indicates that manufacturing companies need to not only
invest in IT systems and record departmental information, but also increase their
skills for timely deliveries and inventory management. This will allow manufacturers
to improve cross-functional communication and to prepare a rigid infrastructure for
successful integrations with retailers at the external level. As the IT systems are
critical for interdepartmental communications in the FSC (Taylor and Fearne, 2006;
Taylor, 2006), these findings offer valuable implications to sustain profitable CF.
Manufacturers can make use of these findings to create a good interdepartmental
platform, which will in turn help them to improve production and supply chain plans
in addition to better collaborations with retailers.
Exploring the significant impact of External Integration on the CF practice led to
offering opposing findings to a number of prior studies. In detail, Småros (2007)

310
argued that IT systems are not a primary barrier for long-term CF. Similar to Småros
(2007), Barratt (2004) claimed that technology is not essential in collaborations. This
finding extends the literature in the contrary way, and shares the same vision with
studies which stressed the role of costly IT systems restricting the application of CF
for a broad range of product-groups (Sari, 2008; Fliedner, 2003; McCarthy and
Golicic, 2002). In terms of product-groups, the current research extends the findings
of Aviv (2007; 2001). The author previously stressed the benefits of IT systems
when long-life cycle product-groups were taken into account in CF. This research
rather considered time-sensitive and / short-life product-groups in CF, and
demonstrated the importance of IT systems. Therefore, it is reasonable to stress that
IT systems are important to collaboratively forecast a wide range of product-groups.
These findings and comparative analyses offer important implications for
manufacturers to invest in IT systems regardless of the shelf life products being
subject to collaborations.
It is worth stressing that having different IT systems with some retailers was found
to be an important obstacle by Taylor and Fearne (2006). These authors exemplified
how partners’ different IT systems reduced the speed of information exchange and
engendered forecast errors along with the administrative costs in the UK FSC. The
outcomes of the semi-structured interview are also in line with prior literature. There
are also a number of studies, which argue the proliferation of IT systems resulting in
difficulties (Evangelista et al., 2013; Taylor, 2006). For instance, by examining the
role of IT systems in the third party logistics providers, a study by Evangelista et al.
(2013) addressed how widespread IT systems caused difficulties for small and
medium sized companies in selecting appropriate systems. The examination of IT
systems in this research is limited to the integration level of manufacturers; as such it
seems promising to question how different IT systems affect forecast accuracy and
information exchange in the FSC. Such an examination will provide encouraging
insights to practitioners who not only participate in the FSC, but also in the logistics
sector.
On the other hand, clarifying the importance of interdependence and top
management vision through the integration with retailers led to following a similar
311
path with past studies. This is because prior literature similarly found that these
practices are the major drivers of long-term collaborations (Zacharia et al., 2011;
Hong et al., 2005; Mentzer et al., 2000). Chen and Paulraj (2004) also defended the
necessity of interdependence for better networks between partners, rather than
driving forward the power in supply chains. Barratt (2004) stressed the support of
top management, yet the author placed emphasis on its role for inter-organisational
operations.
This research rather supports the vision of top management for manufacturers in
terms of adopting the same strategic objectives with retailers. Following this, this
research found that being flexible in case of unexpected contradictions strengthens
integrations with retailers. This outcome adds a new dimension to the CF of
manufacturers in the FSC. In the literature, while some studies considered the
flexibility factor as a corporate behaviour by linking it to suppliers’ trust-based
relationships with buyers (Johnston et al., 2004), others considered it as a skill of
modifying production, inventory and short-term fluctuating demand from the
manufacturer’s standpoint (Ha et al., 2011). Therefore, this finding extends the
assessment of the flexibility factor from corporate behaviour and the internal abilities
of manufacturers to the External Integration level in CF.
For managerial practice, manufacturers need to show loyalty to retailers and to be
flexible in case of having some disagreements in terms of forecast collaborations.
This will not only help them to get further benefit from CF, but also to improve their
abilities of rapidly reacting to market dynamics (Ha et al., 2011). Being responsive
against instant demand changes is vital when time-sensitive and / or short-life
product-groups are subject to CF. This necessitates investments in IT systems for
timely information exchange with retailers. Such an investment will broaden the
application of CF for a wide range of product-groups (Sari, 2008). Yet the top
management plays a vital role through this integration process, calling for the
adoption of the same vision in CF. The reason is that collaborating over a single
vision with retailers intrinsically reflects manufacturers’ ability to be open to new
forms of partnerships and to make the required investments (Mentzer et al., 2000).
The successful collaboration of H.J. Heinz Ltd and Oshawa foods is an important

312
example, as these companies collaborated upon the same vision of their top
management teams (Crum and Palmatier, 2003). Tesco and Sainsbury’s, for instance,
expect to be proactive and open to multi-functional linkages from manufacturers,
calling for the approval of top management (Fearne and Hughes, 2000).
Another finding is the significant impact of External Integration on the Information
Quality. This result initially closes the gap in the literature due to the scarcity of
empirical studies addressing the impact of top management and IT systems on
sustaining Information Quality. Further, it strengthens the contributions of the study
by Hartono et al. (2010), which is the first study to find a significant impact of top
management and availability of IT systems on the sharing of quality information. On
the other hand, the research provides contrary evidence to the study by Li and Lin
(2006), where top management and the availability of IT systems did not influence
Information Quality. As a managerial implication, manufacturers should consider
how their interdependence to retailers and the behaviour of being flexible in case of
having disagreements affect Information Quality during information sharing, rather
than taking into account the dominance related conflicts.
In essence, these findings evoke the study by Chen and Paulraj (2004). These authors
stressed the non-power based relationships by implying the importance of
interdependence between partners. Given the fact that dominance is already a vital
barrier for CF (Aviv, 2007; Småros, 2007), further attention should be paid to
conducting collaborations shoulder to shoulder rather than exhibiting dominance
related attitudes. Considering the study by He et al. (2013) which revealed that
limiting dominance between partners reinforces information exchange and supply
chain performance, it can be a good opportunity to address the power of partners in
CF based on their degree of collaboration. It is important to highlight the complex
and dynamic structure of FSC (Bourlakis and Weightman, 2004). Therefore,
shedding further light on the role of top management and IT systems in terms of
maintaining Information Quality in CF seems a vital implication for manufacturers.
Managers can benefit from this research to have a clear insight about the ways of
conducting transparent information sharing with retailers during the alignment of
supply chains, which will in turn enable them to generate reliable forecasts in CF.

313
Overall, this research not only extends the body of literature on supply chain
integration, but also connects the supply chain knowledge to the information sharing
literature. Practitioners can benefit from this research by having a clear
understanding of the attitude that they adopt in collaborations and of investment
requirements to integrate internally and externally for promising CF in the FSC.
6.3.3. Group based forecasting
The third objective of the research made it possible to explore the significant role of
Group Forecasting in achieving long-term and accurate CF, in which partners meet
as a group to negotiate exceptions over product-related forecasts to have a consensus
on a single order forecast. Group Forecasting is a direct and strong predictor of the
CF practice, yet this impact is inferior to manufacturers’ Internal-External
Integration as well as the sharing of diverse Information Types. In this research,
Group Forecasting consists of partners’ regular meetings, pre-established decision
making procedures and level of hierarchy along with constructive discussions and
effective usage of information for consensus forecasts. Primarily, this finding closes
the gap in the literature due to the absence of studies devoted to Group Forecasting
(Önkal et al., 2012), which is a good platform for forecasters to judge forecasts over
market dynamics (Önkal et al., 2011).
Uncovering the significance of Group Forecasting in CF reinforces the previously
developed CPFR process, where meetings are vital in solving partners’ forecast
exceptions (Ireland and Crum, 2005) and are requisite for making decisions based on
pre-established rules to be able to facilitate consensus amid partners (Siefert, 2003).
The difference in the research is to extend partners’ forecasting meetings to a
number of Group Forecasting techniques. In this regard, partners earn alternative
options to utilise meetings based on existing situations through collaborations. As far
as the elements of Group Forecasting are considered, the level of hierarchy seems an
important matter in meetings, as was previously argued by Graefe and Armstrong
(2011) as one of the blind sides of face-to-face-meetings. Given that these authors’
experimental analyses considered non-hierarchical meetings, this finding empirically
validates the arguments of authors in the realistic food market. Nominal-Group does
not allow such a drawback due to its structured format (Van de Ven and Delbecq,

314
1974; 1971), which in turn implies this technique’s strengths in ruling out
hierarchical conflicts in CF.
Previously, Helms et al. (2000) stressed the risk of dominance in CF when partners’
forecasting teams meet to generate consensus forecasts, and such characters tend to
achieve superiority by influencing forecast results. Therefore, formalising the
concept of Group Forecasting as a non-hierarchical and structural platform leads to
making decisions based on pre-established procedures. Practitioners can take notice
of hierarchal impacts in meetings and modify their Group Forecasting by getting
benefit from this research. Accordingly, forecasters can generate / adjust forecasts or
merge external sources to forecasts based on pre-established procedures, enabling
them to objectively aggregate forecasts, which will in turn enhance participation in
Group Forecasting (Graefe and Armstrong, 2011).
Due to the importance of constructive discussions in Group Forecasting, the
multimedia based Delphi-Technique seems to be an alternative for partners, who do
not have sufficient time to conduct regular face-to-face-meetings. Such time
constraints are likely to occur when perishable, seasonal and promotional as well as
newly launched products are subject to collaborations. The characteristics of Delphi-
Technique are similar to Nominal-Group, enabling transparency on consensus
forecasts in meetings (Kerr and Tindale, 2011; Davis and Mentzer, 2007; Aviv,
2001; Helms et al., 2000). In spite of the fact that contract based collaborations are
beyond the scope of this research, if partners tend to collaborate over contracts, it can
be an option for them to apply Prediction-Markets. This technique will allow them to
share different types of information (Wolfers and Zitzewitz, 2004) and to reinforce
forecasts with additional information. Practitioners can get further benefit from this
research by considering Table 2.7 developed to present the strengths and weaknesses
of the aforementioned techniques used for forecasting meetings.
Relying on the role of forecasters, Forecasters’ Competence was not found to be
significant for the CF practice, but it showed a direct and strong influence on the
Group Forecasting. Forecasters’ Competence includes market based experience for
the products involved, level of advice, motivation, willingness and feedback as well

315
as confidence in accepting advice from each other along with satisfaction from
consensus forecasts. Previously, Van Swol (2011) discussed the role of experience,
and stressed the worsened consensus in meetings because of the overlapping
experience of forecasters on particular product-groups. This research shares similar
views to Van Swol (2011), and extends the literature by clarifying the requisite of
experience when perishable, seasonal and promotional as well as newly launched
products are forecasted in meetings. Stressing the importance of market based
experience for the products involved in this research equally reinforces the findings
of previous studies (Sanders and Ritzman, 2004; Edmundson et al., 1988), which
highlighted the product based knowledge as the most significant factor to improve
forecast accuracy during the judgment of forecasts. This outcome implies that
practitioners should give priority to the product-based knowledge through the
development of consensus forecasts in Group Forecasting, and not underestimate
market dynamics that are likely to escalate demand variability.
Drawing further attention to the role of advice given between forecasters in Group
Forecasting seems an important contribution for the forecasting literature (Önkal et
al., 2012). The value of advice here is dependent largely upon the advisor and the
information, which prompted him/her to give advice (Lawrence et al., 2006). This
obliquely hints at the importance of trust and commitment between forecasters. The
underlying reason is that previous studies already indicated that accepting advice is
pertinent to forecasters’ trust in and commitment to each other (Van Swol, 2011;
Rowe and Wright, 2011) whilst their overconfidence gives rise to bias in Group
Forecasting and harms collaborations (Kerr and Tindale, 2011; Sanders and
Ritzman, 2004). Further, previous literature stressed the important role of motivation
in effectively adjusting forecasts (Fliedner, 2006; 2003; Webby and O'Connor,
1996). Supporting this, case studies by Frewer et al. (2011) exemplified the
importance of motivation for the utilisation of the Delphi-Technique in the European
agri-food sector. Consequently, this research shares the same opinion with past
studies, and stresses the importance of Forecasters’ Competence in Group
Forecasting.

316
It is, however, important for forecasters to understand the underlying reason for
feedback given to each other, which relies on the level of understanding, timing, and
presentation (Lawrence et al., 2006). This accordingly eases the satisfaction from
consensus forecasts (McCarthy Byrne et al., 2011). The findings of the current
research advocate the same views as Ireland and Crum (2005) who indicated that
successful collaboration relies on cross-functional teams’ common understanding of
cooperative expectations and forecasts generated during Group Forecasting.
Confidence is another competence that forecasters need to exhibit to each other. If
Group Forecasting is managed through the Delphi-Technique or face-to-face-
meetings, this competence implies forecasters to trust each other through suggestions
given in Group Forecasting. The reason behind this is that these techniques allow
forecasters to provide insight when their colleagues bring new information to
meetings (Kerr and Tindale, 2011). Such a harmony among forecasters is very likely
to facilitate consensus forecasts, and positively influence the collaboration between
manufacturers and retailers.
When it comes to generating forecasts in Group Forecasting, forecasters however
should avoid having strong confidence in dictating personal views to other
forecasters. In that, such a dictatorial attitude not only harms the rationale for Group
Forecasting (Bolger and Wright, 2011), but also engenders dominance, which
worsens the coherence in meetings and, of course, consensus forecasts. In essence,
this implication adds more understanding on the experimental findings of Graefe and
Armstrong (2011), who illustrated the increased satisfaction of forecasters in
Nominal-Group, which does not allow forecasters to show such dominance due to its
structured form. Overall, despite the insignificant role of Forecasters’ Competence
in the CF practice, exploring its direct and strong impact on the Group Forecasting
indicates that forecasters are valuable for CF. Despite this, the forecasting literature
needs to be extended further with regard to the role of forecasters. For instance, it is
encouraging to question how forecasters’ qualifications and / or collaboration in
meetings affect the forecast collaborations of manufacturers with retailers.

317
On the other hand, the antecedent of Forecast Horizon was found to be insignificant
for the CF practice. This finding is contrary to the observations that uncovered
partners’ overlapping views with regard to the term of forecasts over short-life and
newly launched products in CF (Småros, 2007; 2003). Given the unilateral outcomes
of this research representing manufacturers, this ambiguity exacerbates doubts about
retailers’ view on the Forecast Horizon for future research. On the other hand,
revealing the Forecast Horizon of associated products as an insignificant factor
supports the presumptions of Aviv (2002; 2001), where the author addressed the CF
practices of partners based on long-life products. In essence, this finding on the
Forecast Horizon is likely to be attributed to manufacturers’ consensus-based
internal forecasts, which is one of the key items that form the CF practice in this
research.
The logic behind this judgment is to recognise that Forecast Horizon related
conflicts between partners largely occur due to manufacturers’ long lead-times and
production plans (Småros, 2007). In this research, consensus-based internal forecasts
are found to be a remedy for manufacturers’ multiple forecasts generated by
departments based on diverse objectives and sources, which in turn escalates
conflicts in CF (Fliedner, 2006; Helms et al., 2000). Consequently, this result hints
that while manufacturers are satisfied of their own forecasts, manage their delivery
plans effectively and share production plans with retailers, there could be no reason
for not agreeing on the Forecast Horizon of related product-groups with retailers.
Nevertheless, academics need to pay further attention to this result and to clarify
underlying reasons that direct partners to consider different Forecast Horizon in CF.
In this respect, this research serves to extend the forecasting literature on the Group
Forecasting by way of CF, and recommends future research on the Forecast Horizon
of related product-groups. For example, it could be interesting to learn the perception
of retailers on the Forecast Horizon of associated products and then to compare
related results to the findings of this research. The central implication for
practitioners here represents their constructive forecasting meetings, which is a
matter for consensus forecasts. When time-sensitive and / or short-life products are
subject to CF, Forecasters’ Competence plays a prominent role in meetings as a

318
remedy for generating accurate forecasts in a timely manner. This is very likely to
bring a competitive advantage to partners in the vulnerable food market. The results
of this research can guide practitioners to conduct encouraging meetings and to get
full benefit from forecasters for consensus forecasts in CF.
6.3.4. Information exchange
The final objective of this research made it possible to contribute to the information
sharing literature by disclosing the significance of sharing diverse Information Types
with retailers as one of the solutions for long-term and accurate CF in the FSC. In
response to past literature giving value to the retailer information (Ramanathan,
2013; Danese, 2007; Småros, 2007; Fliedner, 2006), this research draws the attention
of practitioners to manufacturers’ sources. Unlike past studies, this research extends
the literature and closes the gap between theory and practice by clarifying the
importance of various Information Types. These sources include manufacturers’
inventory levels, production planning and scheduling as well as recent information
that captures environmental factors, weather conditions and product / company
related data along with past experience, which needs to be merged into forecasts
afterwards.
The current research also correlates the information sharing and supply chain
integration literature, giving value to the sharing of production planning and
scheduling, and extends their findings to the strategic level. In particular, Flynn et al.
(2010) highlighted the necessity of sharing production planning and scheduling for
the customer-supplier integrations, where such integration underpins operational
performance, such as rapid response to demand changes, on time deliveries and new
product introductions to market. On the other hand, Zhou and Benton Jr, (2007)
addressed the sharing of production planning through information sharing for
effective supply chain practices, including supply chain planning, JIT production and
delivery practices. This research rather focuses on production planning and
scheduling as rewarding data that should be shared for accurate forecasts and long-
term collaborations by way of CF. In other words, this finding raises the importance
of production planning and scheduling from the operational level to the strategic
level, calling for long-term partnerships.

319
Interestingly, this outcome is contrary to the findings of Ramanathan and
Gunasekaran (2014). These authors highlighted the sharing of production planning
as a part of collaborative planning, which supports the success of collaboration and
does not influence the long-term collaborations. However, demonstrating the
significant impact of sharing various Information Types on the CF practice shows a
solid implication that the sharing of production planning is one of the building
blocks of long-term collaborations by way of information sharing. In a similar vein,
past literature confirmed that sharing production planning and scheduling related
data for the products of interest augments the understanding of the demand of
retailers. This practice, in turn, assists manufacturers to satisfy retailers by way of
procuring their short-term demand and to reduce excessive capacity requirements
(Fliedner, 2006).
In addition to the sharing of production scheduling for the products of interest in CF,
sharing inventory related data received the support of prior literature. This sort of
information sharing facilitates collaborative planning and reduces inventory costs
among partners (Arshinder et al., 2008; Chen and Paulraj, 2004; Karoway, 1997). In
this research, sharing inventory data of the products that are subject to CF supports
long-term collaborations and the generation of accurate forecasts. Hereby, it is
promising for practitioners to infer that sharing product-oriented inventory
information not only reduces costs in collaborations, but also leads to maintaining
the product availability that brings competitive advantage in the market.
Supporting this inference, Wal-Mart and its suppliers, for instance, gained valuable
benefits by exchanging their inventory related data in collaborations. Specifically,
while this information exchange enabled the retailer to give timely orders and to
reduce inventory costs, suppliers earned the retailer’s loyalty due to their increased
response against rapid demand changes, which brought a competitive advantage to
Wal-Mart (Simatupang and Sridharan, 2002). In the computer sector, Dell similarly
exchanged inventory data with both suppliers and customers, and this practice helped
the company to increase the capability of supply chain planning (Zhou and Benton
Jr, 2007). Prior literature and these practical anecdotes promote the reliability of the

320
findings offered by this research, and make it possible to provide implications for
practice.
Uncovering the impact of recent information to be shared in CF is also in line with
the previous literature highlighting its positive effect on the forecast accuracy and
consensus between partners (Lawrence et al., 2006; Sanders and Ritzman, 2004;
Sanders and Manrodt, 2003). It is clear that whilst forecasters generate forecasts for
newly launched and promotional products in dynamic markets, they need additional
information to cope with fluctuating demand (Helms et al., 2000). Hence, data
exchange should not be limited to only past and present sources, but also it is
significant for partners to inform each other about recent changes as well as future
events planned beforehand (Sanders and Manrodt, 2003). In this context, recent
information can be related to the environment, competition, weather conditions and
product / company related recent changes. It can also be related to the experience of
companies with regard to related product-groups or specific market circumstances
(Sanders and Ritzman, 2004). Notwithstanding the judgment capability of
forecasters, sharing such sources enables them to strengthen their forecasts and to
improve forecast accuracy. For managerial practice, manufacturers need to take
advantage of these findings and to share the aforementioned Information Types with
retailers to be able to improve the performance of CF.
Unexpectedly, Information Quality was not found to be a significant antecedent of
the CF practice. In this research, the quality level of information is based on its
relevance, adequacy and accuracy along with timeliness. It also involves the frequent
and consistent information sharing in addition to manufacturers’ responsiveness in
reply to information received from retailers. It is interesting that past studies revealed
the important role of Information Quality on supply chain performance and
associated practices (e.g. supply chain planning, delivery and production), which, in
turn, enhanced transparency and reduced forecast errors (Hartono et al., 2010; Zhou
and Benton Jr, 2007). For instance, related studies that addressed the sharing of good
quality information between partners demonstrated that accurate information flow is
the most significant factor while the indicators of timeliness and adequacy appear to
be the following factors improving supply chain performance (Chang et al., 2013).

321
In this research, Information Quality was yet to be the strong predictor of the CF
practice, which aims at improving the duration of collaboration and forecast
accuracy of the associated product-groups. Knowing that through the sharing of
quality information, partners are likely to develop reciprocal trust for long-term
collaborations (Chang et al., 2013), the findings of this research cause contradictory
outcomes, compared with the literature.
In this context, it is reasonable to deduce that manufacturers’ perception on the
Information Quality seems an uncertain field, when it comes to conducting CF with
retailers in the FSC. For instance, case studies in the food industry stressed the
benefits of maintaining Information Quality in terms of effectively managing
demand and reducing costs (Taylor, 2006; Taylor and Fearne, 2006). Zhou and
Benton Jr, (2007) then clarified that increasing the quality level of information
sharing helps manufacturers to improve delivery performance in collaborations. The
study by Zhou et al. (2014) has recently recommended practitioners to aligning their
supply chain based on the level of Information Quality considered during
information sharing. Accordingly, these findings on the Information Quality need to
be examined by academics, and addressing the contradictory finding of this research
is a good opportunity to extend to body of the information sharing literature.
Revealing the direct and strong impact of Information Quality on the sharing of
various Information Types is an important contribution of the current research to the
information sharing literature. Pragmatically, this outcome implies that managers
should bear in mind what criteria / benchmarks are vital during the sharing of various
Information Types with retailers. In detail, it can be deduced that while
manufacturers are prepared to share production planning and scheduling, stock levels
and even recent changes with retailers, they need to take note of sharing only
relevant and adequate sources, which accurately represent its main domain. It is
important to conduct timely information sharing and to frequently update data when
they need to be more responsive to data received by retailers.
Since the CF practice in this research focuses on conducting long-term
collaborations and improving forecast accuracy, it is essential for manufacturers to

322
consistently share of good quality information with retailers to be able to take
advantage of the CF practice. Extra insight here therefore is to indicate the indirect
impact of Information Quality on the forecast accuracy and long-term collaborations
due to its strong and direct impact on the sharing of different Information Types,
which is the strong predictor of CF practice in the model. However, this insight
needs future research to be able to generalise the role of Information Quality on the
forecast accuracy and the duration of collaborations.
This research not only provides implications to practice, but also encourages future
research on the Information Quality to enrich the existing knowledge in the
literature. Practitioners would benefit from the findings of this research when they
intend to design and / or improve the information sharing process with retailers in
the FSC. Academics can also get benefit from the contradictory findings of this
research to investigate how Information Quality affects the CF of partners with
regard to particular product-groups. It is also promising to examine various
information sources of manufacturers to explore their impact on the forecast
accuracy and transparency in the FSC.
6.4. Future research and limitations
Even though the current research extends the literature through the three different
research themes and recommends promising implications to practice, it could not
shed light on a number of intriguing factors, requiring future research. Particularly,
the horizon of forecasts is the main concern that needs to be studied from
manufacturers’ and retailers’ points of view in the FSC. Although results show its
insignificant impact on the CF practice, case studies illustrated partners’ conflict in
the European grocery sector. Academics need to put further emphasis on the horizon
of forecasts while specific product-groups are forecasted in collaborations. Taking
into account the shelf life of products can be an additional contribution to literature
and practice when the horizon of forecasts is subject to future research.
On the other hand, the quality level of information sharing was examined from
manufacturers’ point of view based upon several benchmarking factors. However,
results implied its indirect relation with the CF practice by uncovering its direct and

323
strong impact on the sharing of various sources, which is the strong predictor of CF
practice. Hence, taking into account the past literature that stresses the impact of
information quality on supply chains, and then comparing prior outcomes with the
overlapping findings of this research is most likely to allow researchers to add more
understanding on the quality level of information disseminated in the FSC.
Following this, the examination of FSC is still lacking in the standpoint of retailers
when the quality of information is subject to collaborations.
The competence of forecasters was not found to be a significant antecedent of the CF
practice, yet its direct and significant role in meetings implies the indirect influence
on CF. The role of forecasters in CF did not earn the attention of academics
adequately, and therefore to examine different characteristics seems to offer valuable
insights to the forecasting literature. For instance, examining the role of training
required for conducting group meetings and / or skills for aggregating the forecasts
of particular products seems to be an interesting topic for future research. In addition
to these future research fields, there are a considerable number of limitations that
need to be converted to opportunity by academics.
Firstly, this research is limited to only food manufacturers located in the UK &
Ireland, Europe and North America. Even though data were gathered from a broad
range of regions, replication of this research in a particular region is likely to give
more detailed results to be compared with existing findings. By considering the
descriptive results of this research, academics, for instance, can question why
manufacturers from Northern and Eastern Europe do not have adequate interest in
collaboratively forecasting perishable products with retailers. It is also worthwhile to
question why manufactures in Southern Europe do not put adequate emphasis on
seasonal products in CF with retailers.
The research showed the high interest of the UK & Ireland based manufacturers in
collaboratively forecasting promotional products, yet there is an important doubt
why these manufacturers do not pay similar attention to seasonal products in their
collaboration with retailers. Future research needs to place further emphasis on
manufacturers located in the UK & Ireland, and to examine the scope of

324
collaborations, which vary based on product-groups considered in CF. On the other
hand, manufacturers from Southern Europe look deficient in terms of collaborating
with retailers over promotional and newly launched products when they expressed
their interest in the collaborative forecasts of perishables. Therefore, the research
provides valuable insights for academics and encourages them to dedicate further
research to particular product-groups in particular regions. This approach not only
extends the body of literature, but also offers interesting implications to practitioners
located in those regions.
Secondly, retailers are not subject to this research, and therefore it is essential to
examine their role in CF. Given their closeness to customers, their contribution to CF
becomes even more important. Testing the conceptual model of this research in
dyadic manufacturer-retailer collaborations by way of case studies seems a
promising future research topic to explore unique insights in practice. For instance,
academics can test how the conceptual model of this research works in a case study
that is based on a single retailer and its multiple manufacturers providing different
product-groups. Such a future research design is most likely to uncover major drivers
and inhibitors in generating accurate forecasts and conducting long-term
collaborations in the FSC. The logic behind encouraging academics to give high
importance to the role of retailers in CF is also to explore their expectations from
collaborations with manufacturers. Because retailers seem to be in a leading position
in collaborations, their needs of pursuing collaborations are likely to be an important
matter for the supply chain literature. In essence, this research is a good example to
be compared with studies addressing CF from the retailers’ point of view. Since,
such a comparative future research is most likely to extend the body of literature by
exploring common and contradictory needs of partners for the development of
accurate and long-term CF in the FSC.
When it comes to considering the role of regions and peripheral factors in CF, future
research needs to question how partners’ distribution and replenishment operations
influence the performance of CF, because these practices are likely to be influenced
by external factors, such as the location of stores / production plants and / or weather
conditions. In particular, retailers’ region and the complexity of distribution channels

325
in regions connected with the location of stores play a vital role in CF, and these
practices deserve the attention of academics. Bearing in mind the logistics
capabilities of manufacturers is an important matter when future research considers
the geographical dissemination of retailers in particular regions. Generating such
pragmatic studies in the future can provide valuable implications for practitioners
and add a new dimension to forecasting and SCM phenomena.
Thirdly, through the development of measurement items for reflective constructs,
this research excluded several items that were explored during the review of the
literature. Hence, the current research does not claim that related items capture the
complete domain of reflective constructs in the conceptual model. This is why
considering different items over the related constructs is beneficial to extend the
literature and to provide further implications to practice. For instance, while
manufacturers’ interdepartmental relations are considered, future studies need to
place further emphasis on their ability to manage production capacity, production
systems used and production lead-times of particular product-groups. Externally,
manufacturers’ responsiveness to orders given by retailers is another concern of the
collaborations (see Fliedner (2006) for details). In other words, extending this
research to manufacturers’ operational practices seems to be an interesting
contribution to the operations management literature. In particular, production and
delivery capabilities of manufacturers deserve to be examined in order to explore
their impact on strategic collaborations that rely on long-term collaborations.
Regarding the information sharing practices in CF, although manufacturers’ data
were the subject of this research, there are more sources that are likely to influence
forecasting and transparency in the FSC, such as information in terms of price
changes, delivery and lead-times. From retailers’ point of view, it is also worthwhile
to question what types of information are beneficial for manufacturers, such as shelf
data, promotional plans and substitution related data, as retailer information needs to
be used through the forecasting of newly launched products. In terms of forecasting
practices, although forecasters became subject to this research, their characteristics
that cause bias and the level of training are important mysteries necessitating further
examination for the forecasting literature (see Lawrence et al. (2006), Fildes et al.

326
(2009) and McCarthy et al. (2006) for details). In addition, it seems very interesting
to ask how the training of forecasters influences their bias and accordingly accuracy
in CF.
Fourthly, although the conceptual model of this research was dedicated to the FSC
and particular product-groups, there are several industries that host similar product-
groups. FSC is likewise not restricted to only perishable, seasonal, promotional and
newly launched products. For instance, the clothing industry has fashion-based new
products, necessitating timely and reliable forecasts to cope with seasonal changes,
consumer behaviours and ongoing trends in the market. Future research can test the
conceptual model of this research in this industry to explore how it improves the
accuracy of seasonal, promotional and newly launched products and to reveal
whether there are additional industry oriented factors that affect partners’
collaboration. Tourism is another season related industry. Especially summer
seasons are critical to future demand based on number of visitors from previous
seasons. Therefore, this research can be extended to the tourism industry by focusing
on the collaborations of hotels, air carriers and / or tourism agencies.
Further, the pharmaceutical industry involves various products that have intermittent
demand, which require further understanding in terms of market and product
characteristics to merge recent information into forecasts. The product-groups of this
research could also provide practical insight for this industry in relation to employing
CF. Cosmetic and household industries are likely to be a good platform in terms of
examining the conceptual model of this research for particular product-groups. These
industries are a good platform for future research to extend this research and to
explore industry oriented insights for the forecasting and SCM literature. As regards
the FSC, the conceptual model of this research can be extended to broader product-
groups, such as products that have long shelf life and / or frozen foods. Such future
studies not only close the gap in the literature, but also provide industry and product
based implications for practitioners.
Fifthly, suppliers that provide raw material to manufacturers were not part of the
participant sample in this research. This limitation is another opportunity for

327
academics to extend the body of the SCM literature by examining the CF practices of
manufacturers. Given the fact that the literature is rich in studies addressing CF
between retailers and manufacturers, extending this research to the upstream level is
most likely to bring a new dimension to the CF practice in the three-echelon FSC.
Because, developing a future research linking suppliers to the forecast collaborations
of retailers and manufacturers not only reveals the impact of suppliers on
manufacturer-retailer partnerships, but also broadens the knowledge about the role of
suppliers in conducting long-term and accurate CF in the FSC.
In other words, such a future research is likely to extend the findings of this research
to three-echelon supply chains and to broaden existing knowledge on the themes of
supply chain integration, forecasting process and information sharing. Since
partners’ integration through forecasting and information sharing can change based
on the echelon of chains, additional and / or contrary findings are expected to be
explored when it comes to comparing results with this research. From
manufacturers’ point of view, it can be interesting to compare major necessities that
require to successfully collaborate with retailers and suppliers. Such future research
is very likely to enable manufacturers to adopt different perspective in terms of
collaborating with downstream and / or upstream levels in the FSC.
Sixthly, this research focused on the CF practice to improve long-term collaborations
and forecast accuracy between manufacturers and retailers in the FSC, but it gave
rise to have a number of insignificant factors in accomplishing its aim. Whilst the
literature offers long-term collaborations over strategic partnerships, operational
partnerships seem to be an option for short- and mid-term collaborations. In this
research, although manufacturers’ Internal Integration was found to be the most
important factor for long-term collaborations in CF, Information Quality,
Forecasters’ Competence and Forecast Horizon were found to be insignificant
elements for the development of CF practice, where the commitment factor was
found to be the insignificant entailment whilst the trust factor was.
The reason behind having these insignificant factors for the CF practice could be
attributed to the aim of this research, which was to improve the forecast accuracy of

328
associated product-groups in addition to extending the duration of collaborations
between partners. Therefore, conducting a future research addressing the factors of
Information Quality, Forecasters’ Competence, Forecast Horizon, trust, and
commitment in strategic partnerships, built upon the strong Internal Integration of
partners, seems to be an intriguing topic with the purpose of revealing their impact
on partnerships, where forecast accuracy is not the main subject of interest.
Finally, the focus of this research in the forecasting literature is limited to forecasting
meetings, the role of forecasters, and the horizon of forecasts. During the review of
the literature, several research areas were explored that are likely to be related to CF.
For instance, forecasting strategies of partners, involving judgmental adjustments
and forecast combinations, are some of the vital areas that academics need to pay
attention to. In forecasting meetings, forecasters try to cope with a wide range of
information. While promotional and newly launched products are subject to these
meetings, forecasters need to reinforce statistical results with contextual information
(e.g. advertising, past experience and rumours). In such circumstances, judgmental
adjustments play an important role in terms of improving accuracy. Therefore, future
research needs to focus on judgmental adjustments when particular product-groups
are collaboratively forecasted in meetings. Furthermore, manufacturers confront
difficulties when their departments generate multiple forecasts, and this causes
internal-external conflicts in CF. In this respect, it is an attractive research topic to
examine forecast combinations when manufacturers intend to generate forecasts
within their departments.
Manufacturers and retailers are likely to use different forecasting methods (e.g.
exponential smoothing, regression and artificial neural network) and accuracy
measurement techniques (e.g. mean absolute percentage error and mean average
error) in their forecasting process. Their preferences are likely to change based on
product-groups, market dynamics and organisational objectives. Although past
studies compared different forecasting methods in the FSC, they considered various
accuracy measurement techniques to validate the reliability of the methods.
Nevertheless, there is a paucity of pragmatic studies clarifying how practitioners

329
apply related methods in practice and what benchmarks they consider through the
selection of methods and the evaluation of their performance.
LIST OF ABBREVIATIONS
AVE Average Variance Extracted
CF Collaborative Forecasting
CPFR Collaborative Planning, Forecasting and Replenishment
ECR Efficient Consumer Response
EDI Electronic Data Interchange
ERP Enterprise Resource Planning
FAME Financial Analysis Made Easy
F&DM Forecasting and Decision-Making
FSC Food Supply Chain
GoF Goodness-of-Fit
ISF International Symposium on Forecasting
IS&M Information-Systems and Management
IT Information Technology
JIT Just-In-Time
MIMIC Multiple Indicators and Multiple Causes
MRP Manufacturing Resource Planning
OASIS Operations and Supply Chain Systems Group
OM Operations Management
PLS Partial Least Squares
POMS Production and Operations Management Society
POS Point-of-sales
QR Quick Response
SCM Supply Chain Management
SCM&L Supply Chain Management and Logistics
SEM Structural Equation Modeling
SKUs Stock-Keeping-Units
S&OP Sales and Operations Planning
SPSS Statistical Package for Social Sciences
VICS Voluntary Interindustry Commerce Standards
VIF Variance Inflation Factor
VMI Vendor Managed Inventory

330
REFERENCES
Aburto, L. and Weber, R. (2007) "Improved supply chain management based on
hybrid demand forecasts", Applied Soft Computing, vol. 7, no. 1, pp. 136-144.
Achabal, D.D., McIntyre, S.H., Smith, S.A. and Kalyanam, K. (2000) "A decision
support system for vendor managed inventory", Journal of Retailing, vol. 76,
no. 4, pp. 430-454.
Adebanjo, D. (2009) "Understanding demand management challenges in
intermediary food trading: a case study", Supply Chain Management: An
International Journal, vol. 14, no. 3, pp. 224-233.
Adebanjo, D. and Mann, R. (2000) "Identifying problems in forecasting consumer
demand in the fast moving consumer goods sector", Benchmarking: An
International Journal, vol. 7, no. 3, pp. 223-230.
Ahumada, O. and Villalobos, J.R. (2009) "Application of planning models in the
agri-food supply chain: A review", European Journal of Operational Research,
vol. 196, no. 1, pp. 1-20.
Akkermans, H., Bogerd, P. and Vos, B. (1999) "Virtuous and vicious cycles on the
road towards international supply chain management", International Journal of
Operations & Production Management, vol. 19, no. 5, pp. 565-582.
Ali, Ö.G., Sayın, S., van Woensel, T. and Fransoo, J. (2009) "SKU demand
forecasting in the presence of promotions", Expert Systems with Applications,
vol. 36, no. 10, pp. 12340-12348.
Alon, I., Qi, M. and Sadowski, R.J. (2001) "Forecasting aggregate retail sales: a
comparison of artificial neural networks and traditional methods", Journal of
Retailing and Consumer Services, vol. 8, no. 3, pp. 147-156.
Alvarado, U.Y. and Kotzab, H. (2001) "Supply Chain Management: The Integration
of Logistics in Marketing", Industrial Marketing Management, vol. 30, no. 2,
pp. 183-198.
Alvarez, G., Pilbeam, C. and Wilding, R. (2010) "Nestlé Nespresso AAA sustainable
quality program: an investigation into the governance dynamics in a multi-
stakeholder supply chain network", Supply Chain Management: An
International Journal, vol. 15, no. 2, pp. 165-182.
Anderson, J.C. and Gerbing, D.W. (1991) "Predicting the performance of measures
in a confirmatory factor analysis with a pretest assessment of their substantive
validities", Journal of Applied Psychology, vol. 76, no. 5, pp. 732-740.
Andreev, P., Heart, T., Maoz, H. and Pliskin, N. (2009) "Validating formative partial
least squares (PLS) models: methodological review and empirical illustration",
International Conference on Information Systems (ICIS) 2009 Proceedings.
Angulo, A., Nachtmann, H. and Waller, M.A. (2004) "Supply chain information
sharing in a vendor managed inventory partnership", Journal of Business
Logistics, vol. 25, no. 1, pp. 101-120.
Angus-Leppan, P. and Fatseas, V. (1986) "The Forecasting Accuracy of Trainee
Accountants Using Judgemental and Statistical Techniques", Accounting &
Business Research (Wolters Kluwer UK), vol. 16, no. 63, pp. 179-188.
Armstrong, J.S. (2001) "Combining Forecasts" in Principles of Forecasting: A
Handbook for Researchers and Practitioners, ed. J. Scott Armstrong, J. S.
Armstrong, J.S., Springer, USA, pp. 417-439.

331
Armstrong, J.S. and Overton, T.S. (1977) "Estimating Nonresponse Bias in Mail
Surveys", Journal of Marketing Research, vol. 14, no. 3, Special Issue: Recent
Developments in Survey Research, pp. 396-402.
Arshinder, Kanda, A. and Deshmukh, S.G. (2008) "Supply chain coordination:
Perspectives, empirical studies and research directions", International Journal
of Production Economics, vol. 115, no. 2, pp. 316-335.
Aryee, G., Naim, M.M. and Lalwani, C. (2008) "Supply chain integration using a
maturity scale", Journal of Manufacturing Technology Management, vol. 19,
no. 5, pp. 559-575.
Attaran, M. (2004) "Nurturing the Supply Chain", Industrial Management, vol. 46,
no. 5, pp. 16-20.
Aviv, Y. (2007) "On the benefits of collaborative forecasting partnerships between
retailers and manufacturers", Management Science, vol. 53, no. 5, pp. 777-794.
Aviv, Y. (2002) "Gaining benefits from joint forecasting and replenishment
processes: The case of auto-correlated demand", Manufacturing and Service
Operations Management, vol. 4, no. 1, pp. 55-74.
Aviv, Y. (2001) "The effect of collaborative forecasting on supply chain
performance", Management Science, vol. 47, no. 10, pp. 1326-1343.
Backhaus, K., Erichson, B., Plinke, W. and Weiber, R. (2003) Multivariate analyse
method en: eine anwendungsorientierte einf¨uhrung, 10th edn, Springer, Berlin.
Bagozzi, R.P. and Yi, Y. (1988) "On the evaluation of structural equation models",
Journal of the academy of marketing science, vol. 16, no. 1, pp. 74-94.
Bamfield, J. (1994) "Technological Management Learning: The Adoption of
Electronic Data Interchange by Retailers", International Journal of Retail &
Distribution Management, vol. 22, no. 2, pp. 3-11.
Barratt, M. (2004) "Understanding the meaning of collaboration in the supply chain",
Supply Chain Management: An International Journal, vol. 9, no. 1, pp. 30-42.
Barratt, M. and Oliveira, A. (2001) "Exploring the experiences of collaborative
planning initiatives", International Journal of Physical Distribution & Logistics
Management, vol. 31, no. 4, pp. 266-289.
Baumann, F. (2010) "The Shelf-Connected Supply Chain: Strategically Linking
CPFR with S&OP at the Executive Level.", Journal of Business Forecasting,
vol. 29, no. 4, pp. 21-28.
Bazeley, P. (2007) Qualitative Data Analysis with NVivo, SAGE Pub., London, UK.
Bentler, P.M. and Chou, C. (1987) "Practical issues in structural modeling",
Sociological Methods & Research, vol. 16, no. 1, pp. 78-117.
Bitran, G.R. and Mondschein, S.V. (1997) "Periodic pricing of seasonal products in
retailing", Management Science, vol. 43, no. 1, pp. 64-79.
Blumberg, B., Cooper, D.R. and Schindler, P.S. (2005) Business Research Methods,
Mc-Graw-Hill, Maidenhead, UK.
Bolger, F. and Wright, G. (2011) "Improving the Delphi process: Lessons from
social psychological research", Technological Forecasting and Social Change,
vol. 78, no. 9, pp. 1500-1513.
Bollen, K. and Lennox, R. (1991) "Conventional wisdom on measurement: A
structural equation perspective.", Psychological bulletin, vol. 110, no. 2, pp.
305.
Bollen, K. (1989) Structural Equations with Latent Variables, John Wiley & Sons,
New York.
Bourlakis, M.A. and Weightman, P.W.H. (2004) Food supply chain management,
Blackwell Pub., Oxford, UK.

332
Bourlakis, M., Maglaras, G., Gallear, D. and Fotopoulos, C. (2014) "Examining
sustainability performance in the supply chain: The case of the Greek dairy
sector", Industrial Marketing Management, vol. 43, no. 1, pp. 56-66.
Boyd, D.M. and Ellison, N.B. (2007) "Social Network Sites: Definition, History, and
Scholarship", Journal of Computer-Mediated Communication, vol. 13, no. 1,
pp. 210-230.
Braunscheidel, M.J. and Suresh, N.C. (2009) "The organizational antecedents of a
firm’s supply chain agility for risk mitigation and response", Journal of
Operations Management, vol. 27, no. 2, pp. 119-140.
Brown, G.H. (1947) "A Comparison of Sampling Methods", Journal of Marketing,
vol. 11, no. 4, pp. 331-337.
Bryman, A. and Bell, E. (2007) Business Research Methods, 2nd edn, Oxford
University Press, Oxford, UK.
Bryman, A. (2004) Social Research Methods, 2nd edn, Oxford University Press,
Oxford, UK.
Burgess, K., Singh, P.J. and Koroglu, R. (2006) "Supply chain management: a
structured literature review and implications for future research", International
Journal of Operations & Production Management, vol. 26, no. 7, pp. 703-729.
Burnette, R. (2010) "CPFR: Fact, Fiction, or Fantasy?", Journal of Business
Forecasting, vol. 29, no. 4, pp. 32-35.
Byrne, B.M. (2010) Structural Equation Modeling with AMOS: Basic Concepts,
Applications, and Programming, 2nd edn, Taylor & Francis Pub., New York,
USA.
Cachon, G.P. and Fisher, M. (2000) "Supply Chain Inventory Management and the
Value of Shared Information", Management Science, vol. 46, no. 8, pp. 1032-
1048.
Carbonneau, R., Laframboise, K. and Vahidov, R. (2008) "Application of machine
learning techniques for supply chain demand forecasting", European Journal of
Operational Research, vol. 184, no. 3, pp. 1140-1154.
Chang, H.H., Tsai, Y. and Hsu, C. (2013) "E-procurement and supply chain
performance", Supply Chain Management: An International Journal, vol. 18,
no. 1, pp. 34-51.
Chang, T., Fu, H., Lee, W., Lin, Y. and Hsuesh, H. (2007) "A study of an augmented
CPFR model for the 3C retail industry", Supply Chain Management: An
International Journal, vol. 12, no. 3, pp. 200-209.
Chang, T., Fu, H., Li, S. and Lee, H. (2009) "A case study for implementing a B2B
collaborative information system: a textile case", Journal of Manufacturing
Technology Management, vol. 20, no. 3, pp. 330-347.
Chen, F., Drezner, Z., Ryan, J. and Simchi-Levi, D. (2000) "Quantifying the
bullwhip effect in a simple supply chain: The impact of forecasting, lead times,
and information", Management Science, vol. 46, no. 3, pp. 436-443.
Chen, H., Daugherty, P.J. and Roath, A.S. (2009) "Defining and Operationalizing
Supply Chain Process Integration", Journal of Business Logistics, vol. 30, no. 1,
pp. 63-84.
Chen, H., Hsueh, C. and Chang, M. (2009) "Production scheduling and vehicle
routing with time windows for perishable food products", Computers &
Operations Research, vol. 36, no. 7, pp. 2311-2319.
Chen, H. and Boylan, J.E. (2008) "Empirical evidence on individual, group and
shrinkage seasonal indices", International Journal of Forecasting, vol. 24, no.
3, pp. 525-534.

333
Chen, I.J. and Paulraj, A. (2004) "Towards a theory of supply chain management:
the constructs and measurements", Journal of Operations Management, vol. 22,
no. 2, pp. 119-150.
Cheung, M-S., Myers, M.B. and Mentzer, J.T. (2010) "Does relationship learning
lead to relationship value? A cross-national supply chain investigation", Journal
of Operations Management, vol. 28, no. 6, pp. 472-487.
Chin, W.W. (1995) "Partial least squares is to LISREL as principal components
analysis is to common factor analysis", Technology Studies, vol. 2, no. 2, pp.
315-319.
Chin, W.W. and Gopal, A. (1995) "Adoption intention in GSS: relative importance
of beliefs", ACM SigMIS Database, vol. 26, no. 2-3, pp. 42-64.
Chin, W.W. (1998b) "The partial least squares approach for structural equation
modeling" in Modern Methods for Business Research, Marcoulides, G.A.
(ed), Lawrence Erlbaum Associates Publishers, Mahwah, NJ, US, pp. 295-336.
Chin, W.W. (1998a) "Commentary: Issues and Opinion on Structural Equation
Modeling", MIS Quarterly, vol. 22, no. 1, pp. vii-xvi.
Ching-Chin, C., Ka Ieng, A.I., Ling-Ling, W. and Ling-Chieh, K. (2010) "Designing
a decision-support system for new product sales forecasting", Expert Systems
with Applications, vol. 37, no. 2, pp. 1654-1665.
Choi, T. and Sethi, S. (2010) "Innovative quick response programs: A review",
International Journal of Production Economics, vol. 127, no. 1, pp. 1-12.
Chung, K. and Lee, S.M.S. (2001) "Optimal Bootstrap Sample Size in Construction
of Percentile Confidence Bounds", Scandinavian Journal of Statistics, vol. 28,
no. 1, pp. 225-239.
Churchill Jr., G.A. and Iacobucci, D. (2004) Marketing Research -
Methodological Foundations, 9th edn, Thomson-South Western, Mason, Ohio,
USA.
Churchill Jr., G.A. (1979) "A Paradigm for Developing Better Measures of
Marketing Constructs", Journal of Marketing Research (JMR), vol. 16, no. 1,
pp. 64-73.
Claassen, M.J.T., Weele, A.J.v. and Raaij, E.M.v. (2008) "Performance outcomes
and success factors of vendor managed inventory (VMI)", Supply Chain
Management: An International Journal, vol. 13, no. 6, pp. 406-414.
Clark, L.A. and Watson, D. (1995) "Constructing validity: Basic issues in objective
scale development", Psychological assessment, vol. 7, no. 3, pp. 309-319.
Clemen, R.T. (1989) "Combining forecasts: A review and annotated bibliography",
International Journal of Forecasting, vol. 5, no. 4, pp. 559-583.
Cohen, J. (1988) Statistical power analysis for the behavioral sciencies, 2nd edn,
Lawrence Erlbaum Associates, Hillsdale.
Cohen, P., Cohen, J., Teresi, J., Marchi, M. and Velez, C.N. (1990) "Problems in the
measurement of latent variables in structural equations causal models", Applied
Psychological Measurement, vol. 14, no. 2, pp. 183-196.
Cook, D.J., Murlow, C.D. and Haynes, R.B. (1997) "Systematic reviews: Synthesis
of best evidence for clinical decisions", Annals of Internal Medicine, vol. 126,
no. 5, pp. 376.
CRD (2001) Undertaking systematic reviews of research on effectiveness: CRD's
guidance for carrying out or commissioning reviews, 2nd edn. NHS Centre for
Reviews and Dissemination, University of York, York, UK.
Creswell, J.W. and Plano Clark, V.L. (2011) Designing and Conducting Mixed
Methods Research, 2nd edn, Sage, London, UK.

334
Creswell, J.W. (2003) Research Design: Qualitative, Quantitative, and Mixed
Methods Approaches, 2nd edn, Sage, London, UK.
Crum, C. and Palmatier, G.E. (2003) Demand Management Best Practices: Process,
Principles and Collaboration, J.Ross Publishing, USA, Florida.
Curry, L.A., Nembhard, I.M. and Bradley, E.H. (2009) "Qualitative and mixed
methods provide unique contributions to outcomes research", Circulation, vol.
119, no. 10, pp. 1442-1452.
Cycyota, C.S. and Harrison, D.A. (2006) "What (Not) to Expect When Surveying
Executives A Meta-Analysis of Top Manager Response Rates and Techniques
Over Time", Organizational Research Methods, vol. 9, no. 2, pp. 133-160.
Danese, P. (2006) "Collaboration forms, information and communication
technologies, and coordination mechanisms in CPFR", International Journal of
Production Research, vol. 44, no. 16, pp. 3207-3226.
Danese, P. (2004) "Beyond vendor managed inventory: the Glaxosmithkline case",
Supply Chain Forum: An International Journal, vol. 5, no. 2, pp. 32-39.
Danese, P. (2011) "Towards a contingency theory of collaborative planning
initiatives in supply networks", International Journal of Production Research,
vol. 49, no. 4, pp. 1081-1103.
Danese, P. (2007) "Designing CPFR collaborations: insights from seven case
studies", International Journal of Operations & Production Management, vol.
27, no. 2, pp. 181-204.
Danese, P. and Kalchschmidt, M. (2011) "The role of the forecasting process in
improving forecast accuracy and operational performance", International
Journal of Production Economics, vol. 131, no. 1, pp. 204-214.
Danese, P., Romano, P. and Formentini, M. (2013) "The impact of supply chain
integration on responsiveness: The moderating effect of using an international
supplier network", Transportation Research Part E: Logistics and
Transportation Review, vol. 49, no. 1, pp. 125-140.
Davis, D.F. and Mentzer, J.T. (2007) "Organizational factors in sales forecasting
management", International Journal of Forecasting, vol. 23, no. 3, pp. 475-495.
De Toni, A.F. and Zamolo, E. (2005) "From a traditional replenishment system to
vendor-managed inventory: A case study from the household electrical
appliances sector", International Journal of Production Economics, vol. 96, no.
1, pp. 63-79.
Denzin, N.K. (1989) The Research Act: A Theoretical Introduction to Sociological
Methods, 3rd edn, Prentice Hall., Englewood Cliffs, NJ, USA.
Denzin, N.K. and Lincoln, Y.S. (2000) Handbook of Qualitative Research, 2nd edn,
Sage, Thousand Oaks, CA, USA.
Deshpande, R. (1983) "Paradigms Lost: On Theory and Method in Research in
Marketing", Journal of Marketing, vol. 47, no. 4, pp. 101-110.
Devaraj, S., Krajewski, L. and Wei, J.C. (2007) "Impact of eBusiness technologies
on operational performance: The role of production information integration in
supply chain", Journal of Operations Management, vol. 25, no. 6, pp. 1199-
1216.
DeVellis, R.F. (2003) Scale Development - Theory and Applications, 2nd edn, Sage,
London, UK.
Diamantopoulos, A., Riefler, P. and Roth, K.P. (2008) "Advancing formative
measurement models", Journal of Business Research, vol. 61, no. 12, pp. 1203-
1218.

335
Diamantopoulos, A. and Siguaw, J.A. (2006) "Formative Versus Reflective
Indicators in Organizational Measure Development: A Comparison and
Empirical Illustration", British Journal of Management, vol. 17, no. 4, pp. 263-
282.
Diamantopoulos, A. and Winklhofer, H.M. (2001) "Index Construction with
Formative Indicators: An Alternative to Scale Development", Journal of
Marketing Research, vol. 38, no. 2, pp. 269-277.
Dillman, D.A. (1978) Mail and Telephone Surveys: The Total Design Method, Wiley
& Sons, New York, USA.
Disney, S.M. and Towill, D.R. (2003) "The effect of vendor managed inventory
(VMI) dynamics on the Bullwhip Effect in supply chains", International
Journal of Production Economics, vol. 85, no. 2, pp. 199-215.
Droge, C., Jayaram, J. and Vickery, S.K. (2004) "The effects of internal versus
external integration practices on time-based performance and overall firm
performance", Journal of Operations Management, vol. 22, no. 6, pp. 557-573.
Du, T.C., Lai, V.S., Cheung, W. and Cui, X. (2012) "Willingness to share
information in supply chain: A partnership-data-process perspective",
Information & Management, vol. 49, no. 2, pp. 89-98.
Du, X.F., Leung, S.C.H., Zhang, J.L. and Lai, K.K. (2009) "Procurement of
agricultural products using the CPFR approach", Supply Chain Management:
An International Journal, vol. 14, no. 4, pp. 253-258.
Duarte, P.A.O. and Raposo, M.L.B. (2010) "A PLS model to study brand preference:
an application to the mobile phone market" in Handbook of Partial Least
Squares Springer, pp. 449-485.
Duffy, R. and Fearne, A. (2004) "Partnerships and alliances in UK supermarket
supply networks" in Food Supply Chain Management, eds. M. Bourlakis and P.
Weightman, Blackwell Publishing, pp. 136-152.
Dwyer, F.R., Schurr, P.H. and Oh, S. (1987) "Developing Buyer-Seller
Relationships", Journal of Marketing, vol. 51, no. 2, pp. 11-27.
Eakin, J.M. and Mykhalovskiy, E. (2003) "Reframing the evaluation of qualitative
health research: reflections on a review of appraisal guidelines in the health
sciences", Journal of evaluation in clinical practice, vol. 9, no. 2, pp. 187-194.
Easterby-Smith, M., Thorpe, R. and Lowe, A. (1991) Management Research: an
Introduction, Sage, London, UK.
Easterby-Smith, M.P.V., Thorpe, R. and Lowe, A. (2002) Management research: An
Introduction, 2nd edn, Sage, London, UK.
ECR Europe (2002) European CPFR Insights, Accenture & Efficient Consumer
Response (ECR), Brussels.
ECR Europe (2001) A Guide to CPFR Implementation, Accenture & Efficient
Consumer Response (ECR), Brussels.
Edmunds, H. (1999) The focus group research handbook, NTC Business
Books/Contemporary Publishing, Lincolnwood, IL, USA.
Edmundson, B., Lawrence, M. and O'Connor, M. (1988) "The Use of Non-time
Series Information in Sales Forecasting: a Case Study", Journal of Forecasting
(1986-1998), vol. 7, no. 3, pp. 201.
Efthymiou, D. and Antoniou, C. (2012) "Use of Social Media for Transport Data
Collection", Procedia - Social and Behavioral Sciences, vol. 48, pp. 775-785.
Eksoz, C. and Mansouri, A. (2012) "Long-term and Accurate Collaborative
Forecasting Between Supply Chain Members: An Empirical Study in the UK

336
Food Sector ", The 32nd Annual International Symposium on Forecasting,
Boston, USA, pp. 1-24.
Eksoz, C., Mansouri, A. and Doran, D. (2012) "Exploring Collaborative Forecasting
in the UK Food Supply Chain ", 4th Production and Operations Management
World Conference, Amsterdam, The Netherlands, pp. 1-10.
Evangelista, P., McKinnon, A. and Sweeney, E. (2013) "Technology adoption in
small and medium-sized logistics providers", Industrial Management & Data
Systems, vol. 113, no. 7, pp. 967-989.
Fabbe-Costes, N. and Jahre, M. (2008) "Supply chain integration and performance: a
review of the evidence", International Journal of Logistics Management, vol.
19, no. 2, pp. 130-154.
Falk, R.F. and Miller, N.B. (1992) A primer for soft modeling. University of Akron
Press.
Fang, L. and Meng, X. (2010) "Research on Information Collaboration of
Agricultural Supply Chains Based on CPFR", Education Technology and
Computer Science (ETCS), Second International Workshop, pp. 794-797.
Fang, J., Wen, C. and Prybutok, V. (2014) "An assessment of equivalence between
paper and social media surveys: The role of social desirability and satisficing",
Computers in Human Behavior, vol. 30, pp. 335-343.
Fearne, A. and Hughes, D. (2000) "Success factors in the fresh produce supply
chain: Insights from the UK", British Food Journal, vol. 102, no. 10, pp. 760-
772.
Feng, Y., D’Amours, S. and Beauregard, R. (2008) "The value of sales and
operations planning in oriented strand board industry with make-to-order
manufacturing system: Cross functional integration under deterministic demand
and spot market recourse", International Journal of Production Economics, vol.
115, no. 1, pp. 189-209.
Fernie, J. (1994) "Quick Response: An International Perspective", International
Journal of Physical Distribution & Logistics Management, vol. 24, no. 6, pp.
38-46.
Fielding, N.G., Lee, R.M. and Blank, G. (2008) The Sage handbook of online
research methods, Sage, London, UK.
Fildes, R. and Goodwin, P. (2007) "Against your better judgment? How
organizations can improve their use of management judgment in forecasting",
Interfaces, vol. 37, no. 6, pp. 570-576.
Fildes, R., Goodwin, P., Lawrence, M. and Nikolopoulos, K. (2009) "Effective
forecasting and judgmental adjustments: an empirical evaluation and strategies
for improvement in supply-chain planning", International Journal of
Forecasting, vol. 25, no. 1, pp. 3-23.
Fiorito, S.S., May, E.G. and Straughn, K. (1995) "Quick response in retailing:
components and implementation", International Journal of Retail &
Distribution Management, vol. 23, no. 5, pp. 12-21.
Fischer, C. (2013) "Trust and communication in European agri-food chains", Supply
Chain Management: An International Journal, vol. 18, no. 2, pp. 208-218.
Fisher, M.L. (2000) "Rocket science retailing is almost here-Are you ready?",
Harvard business review, vol. 78, no. 4, pp. 115.
Fliedner, E. (2006) "Collaborative Supply Chain Forecasting: A Lean Framework",
Alliance Journal of Business Research, vol. 2, no. 1, pp. 33-48.
Fliedner, G. (2003) "CPFR: an emerging supply chain tool", Industrial Management
& Data Systems, vol. 103, no. 1, pp. 14-21.

337
Flynn, B.B., Huo, B. and Zhao, X. (2010) "The impact of supply chain integration on
performance: A contingency and configuration approach", Journal of
Operations Management, vol. 28, no. 1, pp. 58-71.
Flynn, B.B., Sakakibara, S., Schroeder, R.G., Bates, K.A. and Flynn, E.J. (1990)
"Empirical research methods in operations management", Journal of Operations
Management, vol. 9, no. 2, pp. 250-284.
Fornell, C. and Bookstein, F.L. (1982) "Two Structural Equation Models: LISREL
and PLS Applied to Consumer Exit-Voice Theory", Journal of Marketing
Research, vol. 19, no. 4, Special Issue on Causal Modeling, pp. 440-452.
Fornell, C. and Larcker, D.F. (1981) "Evaluating Structural Equation Models with
Unobservable Variables and Measurement Error", Journal of Marketing
Research, vol. 18, no. 1, pp. 39-50.
Forslund, H. and Jonsson, P. (2007) "The impact of forecast information quality on
supply chain performance", International Journal of Operations & Production
Management, vol. 27, no. 1, pp. 90-107.
Fox, F.E., Morris, M. and Rumsey, N. (2007) "Doing synchronous online focus
groups with young people: methodological reflections", Qualitative health
research, vol. 17, no. 4, pp. 539-547.
Francis, M., Simons, D. and Bourlakis, M. (2008) "Value chain analysis in the UK
beef foodservice sector", Supply Chain Management: An International Journal,
vol. 13, no. 1, pp. 83-91.
Frewer, L.J., Fischer, A.R.H., Wentholt, M.T.A., Marvin, H.J.P., Ooms, B.W.,
Coles, D. and Rowe, G. (2011) "The use of Delphi methodology in agrifood
policy development: Some lessons learned", Technological Forecasting and
Social Change, vol. 78, no. 9, pp. 1514-1525.
Frohlich, M.T. and Westbrook, R. (2001) "Arcs of integration: an international study
of supply chain strategies", Journal of Operations Management, vol. 19, no. 2,
pp. 185-200.
Gallear, D., Ghobadian, A. and Chen, W. (2012) "Corporate responsibility, supply
chain partnership and performance: An empirical examination", International
Journal of Production Economics, vol. 140, no. 1, pp. 83-91.
Gefen, D., Straub, D.W. and Boudreau, M. (2000) "Structural equation modeling and
regression: Guidelines for research practice", Communications of the
Association for Information Systems, vol. 4, no. 7, pp. 1-79.
Geisser, S. (1975) "The predictive sample reuse method with applications", Journal
of the American Statistical Association, vol. 70, no. 350, pp. 320-328.
Ghauri, P.N. and Grønhaug, K. (2005) Research methods in business studies: A
practical guide, Pearson Education, London.
Gimenez, C. and Ventura, E. (2005) "Logistics-production, logistics-marketing and
external integration: their impact on performance", International journal of
operations & Production Management, vol. 25, no. 1, pp. 20-38.
Goodwin, P. (2000a) "Correct or combine? Mechanically integrating judgmental
forecasts with statistical methods", International Journal of Forecasting, vol.
16, no. 2, pp. 261-275.
Goodwin, P. and Fildes, R. (1999) "Judgmental Forecasts of Time Series Affected
by Special Events: Does Providing a Statistical Forecast Improve Accuracy?",
Journal of Behavioral Decision Making, vol. 12, no. 1, pp. 37-53.
Goodwin, P. (2005) "Providing support for decisions based on time series
information under conditions of asymmetric loss", European Journal of
Operational Research, vol. 163, no. 2, pp. 388-402.

338
Goodwin, P. (2002) "Integrating management judgment and statistical methods to
improve short-term forecasts", Omega, vol. 30, no. 2, pp. 127-135.
Goodwin, P. (2000b) "Improving the voluntary integration of statistical forecasts and
judgment", International Journal of Forecasting, vol. 16, no. 1, pp. 85-99.
Goodwin, P., Önkal, D. and Thomson, M. (2010) "Do forecasts expressed as
prediction intervals improve production planning decisions?", European
Journal of Operational Research, vol. 205, no. 1, pp. 195-201.
Götz, O., Liehr-Gobbers, K. and Krafft, M. (2010) "Evaluation of structural equation
models using the partial least squares (PLS) approach" in
Handbook of Partial Least Squares: Concepts, Methods and Applications,
eds. V.E. Vinci, W.W. Chin, J. Henseler and H. Wang, Springer-Verlag, Berlin,
Germany, pp. 691-711.
Goudarzi, K., Borges, A. and Chebat, J.C. (2013) "Should retailers pay to bring
customers back? The impact of quick response and coupons on purchase
outcomes", Journal of Business Research, vol. 66, no. 5, pp. 665-669.
Graefe, A. and Armstrong, J.S. (2011) "Comparing face-to-face meetings, nominal
groups, Delphi and prediction markets on an estimation task", International
Journal of Forecasting, vol. 27, no. 1, pp. 183-195.
Greenhalgh, T. and Taylor, R. (1997) "How to Read a Paper: Papers That Go beyond
Numbers (Qualitative Research)", BMJ: British Medical Journal, vol. 315, no.
7110, pp. 740-743.
Grimson, J.A. and Pyke, D.F. (2007) "Sales and operations planning: an exploratory
study and framework", International Journal of Logistics Management, vol. 18,
no. 3, pp. 322-346.
Gulati, R. (2011) "Silo Busting: How to Execute on the Promise of Customer Focus"
in Collaborating Effectively Harvard Business Review Press, USA, Boston,
Massachusetts, pp. 93-120.
Ha, B.C., Park, Y.K. and Cho, S. (2011) "Suppliers' affective trust and trust in
competency in buyers: Its effect on collaboration and logistics efficiency",
International Journal of Operations & Production Management, vol. 31, no. 1,
pp. 56-77.
Hair, J.F., Sarstedt, M., Ringle, C.M. and Mena, J.A. (2012) "An assessment of the
use of partial least squares structural equation modeling in marketing research",
Journal of the Academy of Marketing Science, vol. 40, no. 3, pp. 414-433.
Hair, J.F., Black, W.C., Babin, B.J., Anderson, R.E. and Tatham, R.L. (eds) (2010)
Multivariate Data Analysis: A Global Perspective, 7th edn., Pearson, NJ, USA.
Handfield, R.B. and Nichols, E.L. (1999) Introduction to Supply Chain
Management, Prentice Hall New-Jersey, Englewood Cliffs, NJ.
Harris, J.K., Swatman, P.M.C. and Kurnia, S. (1999) "Efficient consumer response
(ECR): a survey of the Australian grocery industry", Supply Chain
Management: An International Journal, vol. 4, no. 1, pp. 35-42.
Hartono, E., Li, X., Na, K. and Simpson, J.T. (2010) "The role of the quality of
shared information in interorganizational systems use", International Journal of
Information Management, vol. 30, no. 5, pp. 399-407.
Harwood, D. (2013) The Benefits of LinkedIn for Businesses. Available at:
http://www.relevanceweb.com/blog/item/the-benefits-of-linkedin-for-businesses
(Accessed: 26 August 2013).
Hauser, R.M. and Goldberger, A.S. (1971) "The treatment of unobservable variables
in path analysis" in Sociological methodology, ed. H.L. Costner, Jossey-Bass,
London, pp. 81-117.

339
He, Q., Ghobadian, A. and Gallear, D. (2013) "Knowledge acquisition in supply
chain partnerships: The role of power", International Journal of Production
Economics, vol. 141, no. 2, pp. 605-618.
Helm, S., Eggert, A. and Garnefeld, I. (2010) "Modeling the impact of corporate
reputation on customer satisfaction and loyalty using partial least squares" in
Handbook of partial least squares Springer, pp. 515-534.
Helms, M.M., Lawrence, P.E. and Chapman, S. (2000) "Supply chain forecasting -
Collaborative forecasting supports supply chain management", Business
Process Managememt Journal, vol. 6, no. 5, pp. 392-407.
Henseler, J. and Sarstedt, M. (2013) "Goodness-of-fit indices for partial least squares
path modeling", Computational Statistics, pp. 1-16.
Hill Jr, S. and Mathur, S. (1999) "A Net Gain", Manufacturing Systems, vol. 17, no.
11, pp. 34-43.
Hill, C.A. and Scudder, G.D. (2002) "The use of electronic data interchange for
supply chain coordination in the food industry", Journal of Operations
Management, vol. 20, no. 4, pp. 375-387.
Hill, S. (1999) "CPFR builds the united partnerships of apparel", Apparel Industry
Magazine, vol. 60, no. 10, pp. 54.
Hogarth-Scott, S. and Parkinson, S.T. (1993) "Retailer-Supplier Relationships in the
Food Channel: A supplier perspective", International Journal of Retail &
Distribution Management, vol. 21, no. 8, pp. 11-18.
Holmberg, S. (2000) "A systems perspective on supply chain measurements",
International Journal of Physical Distribution & Logistics Management, vol.
30, no. 10, pp. 847-868.
Hong, P., Vonderembse, M.A., Doll, W.J. and Nahm, A.Y. (2005) "Role change of
design engineers in product development", Journal of Operations Management,
vol. 24, no. 1, pp. 63-79.
Howe, K.R. (1988) "Against the Quantitative-Qualitative Incompatibility Thesis or
Dogmas Die Hard", Educational Researcher, vol. 17, no. 8, pp. 10-16.
Hox, J.J. and Maas, C.J. (2001) "The Accuracy of Multilevel Structural Equation
Modeling with Pseudobalanced Groups and Small Samples", Structural
Equation Modeling: A Multidisciplinary Journal, vol. 8, no. 2, pp. 157-174.
Hulland, J. (1999) "Use of partial least squares (PLS) in strategic management
research: a review of four recent studies", Strategic Management Journal, vol.
20, no. 2, pp. 195-204.
Hussey, J. and Hussey, R. (1997) Business Research: A Practical Guide for
Undergraduate and Postgraduate Students, Macmillan Press Ltd, London, UK.
Hyde, K.F. (2000) "Recognising deductive processes in qualitative research",
Qualitative Market Research: An International Journal, vol. 3, no. 2, pp. 82-90.
Ireland, R. and Bruce, R. (2000) "CPFR: Only the Beginning of Collaboration",
Supply chain management review, vol. 4, no. 4, pp. 80-88.
Ireland, R.K. and Crum, C. (2005) Supply Chain Collaboration (Integrated business
management series), J. Ross Pub., Florida, USA.
Iyer, A.V. and Bergen, M.E. (1997) "Quick Response in Manufacturer-Retailer
Channels", Management Science, vol. 43, no. 4, Frontier Research in
Manufacturing and Logistics, pp. 559-570.
Jarvis, C.B., MacKenzie, S.B. and Podsakoff, P.M. (2003) "A Critical Review of
Construct Indicators and Measurement Model Misspecification in Marketing
and Consumer Research", Journal of Consumer Research, vol. 30, no. 2, pp.
199-218.

340
Jick, T.D. (1979) "Mixing Qualitative and Quantitative Methods: Triangulation in
Action", Administrative Science Quarterly, vol. 24, no. 4, Qualitative
Methodology, pp. 602-611.
Johnson, R.B., Onwuegbuzie, A.J. and Turner, L.A. (2007) "Toward a definition of
mixed methods research", Journal of mixed methods research, vol. 1, no. 2, pp.
112-133.
Johnston, D.A., McCutcheon, D.M., Stuart, F.I. and Kerwood, H. (2004) "Effects of
supplier trust on performance of cooperative supplier relationships", Journal of
Operations Management, vol. 22, no. 1, pp. 23-38.
Joseph, F.H.J., Hult, G.T.M., Ringle, C.M. and Sarstedt, M. (2014) A Premier on
Partial Least Squares Structural Equation Modeling (PLS-SEM), SAGE
Publications, Inc., London.
Kaipia, R. (2008) "Effects of delivery speed on supply chain planning", International
Journal of Logistics, vol. 11, no. 2, pp. 123-135.
Karoway, C. (1997) "Superior supply chains pack plenty of byte", Purchasing
Technology, vol. 8, no. 11, pp. 32-35.
Kerkkänen, A., Korpela, J. and Huiskonen, J. (2009) "Demand forecasting errors in
industrial context: Measurement and impacts", International Journal of
Production Economics, vol. 118, no. 1, pp. 43-48.
Kerr, N.L. and Tindale, R.S. (2011) "Group-based forecasting?: A social
psychological analysis", International Journal of Forecasting, vol. 27, no. 1, pp.
14-40.
Klassen, R.D. and Flores, B.E. (2001) "Forecasting practices of Canadian firms:
Survey results and comparisons", International Journal of Production
Economics, vol. 70, no. 2, pp. 163-174.
Kline, R.B. (2005) Principles and practice of structural equation modeling, 2nd edn,
Guilford press, New York.
Kurnia, S., Swatman, P.M. and Schauder, D. (1998) "Efficient Consumer Response:
a preliminary comparison of US and European experiences", The Eleventh
International Bled Electronic Commerce Conference, Citeseer, pp. 126.
Kurnia, S. and Johnston, R.B. (2003) "Adoption of efficient consumer response: key
issues and challenges in Australia", Supply Chain Management: An
International Journal, vol. 8, no. 3, pp. 251-262.
Kurt Salmon Associates, (1993) Efficient Consumer Response: Enhancing consumer
value in the grocery industry, Research Department, Food Marketing Institute,
Washington, DC.
Lambert, D.M. and Stock, J.R. (1993) Strategic Logistics Management, 3rd edn,
Dow Jones-Irwin, Homewood, IL, USA.
Lapide, L. (2010) "A History of CPFR", Journal of Business Forecasting, vol. 29,
no. 4, pp. 29-31.
Larsen, T.S., Thernøe, C. and Claus, A. (2003) "Supply chain collaboration:
Theoretical perspectives and empirical evidence", International Journal of
Physical Distribution & Logistics Management, vol. 33, no. 6, pp. 531-549.
Lawrence, M.J., Edmundson, R.H. and O'Connor, M.J. (1986) "The accuracy of
combining judgemental and statistical forecasts", Management Science, vol. 32,
no. 12, pp. 1521-1532.
Lawrence, M., Goodwin, P., O'Connor, M. and Önkal, D. (2006) "Judgmental
forecasting: A review of progress over the last 25 years", International Journal
of Forecasting, vol. 22, no. 3, pp. 493-518.

341
Lee, N. and Lings, I. (2008) Doing Business Research: A Guide to Theory and
Practice, Sage Pub., London, UK.
Lee, H.L., So, K.C. and Tang, C.S. (2000) "The Value of Information Sharing in a
Two-Level Supply Chain", Management Science, vol. 46, no. 5, pp. 626-643.
Lei, P. and Wu, Q. (2007) "Introduction to Structural Equation Modeling: Issues and
Practical Considerations", Educational Measurement: Issues and Practice, vol.
26, no. 3, pp. 33-43.
Lewins, A., Patashnick, J. and Silver, C. (2011) The Qualitative Tools in QSR NVivo
9: Introductory Training Workshop Handout, Qualitative Data Analysis
Services (QDAS), UK.
Li, G., Lin, Y., Wang, S. and Yan, H. (2006) "Enhancing agility by timely sharing of
supply information", Supply Chain Management: An International Journal, vol.
11, no. 5, pp. 425-435.
Li, S. and Lin, B. (2006) "Accessing information sharing and information quality in
supply chain management", Decision Support Systems, vol. 42, no. 3, pp. 1641-
1656.
Li, X. and Wang, Q. (2007) "Coordination mechanisms of supply chain systems",
European Journal of Operational Research, vol. 179, no. 1, pp. 1-16.
Lockamy II, A. and McCormack, K. (2004) "Linking SCOR planning practices to
supply chain performance: An exploratory study", International Journal of
Operations & Production Management, vol. 24, no. 12, pp. 1192-1218.
Lohmöller, J. (1989) Latent Variable Path Modeling with Partial Least Squares,
Springer, New York.
Lorentz, H., Töyli, J., Solakivi, T. and Ojala, L. (2013) "Priorities and determinants
for supply chain management skills development in manufacturing firms",
Supply Chain Management: An International Journal, vol. 18, no. 4, pp. 2-2.
Lowe, T.J. and Preckel, P.V. (2004) "Decision Technologies for Agribusiness
Problems: A Brief Review of Selected Literature and a Call for Research",
Manufacturing & Service Operations Management, vol. 6, no. 3, pp. 201-208.
MacCallum, R.C., Roznowski, M. and Necowitz, L.B. (1992) "Model modifications
in covariance structure analysis: the problem of capitalization on chance",
Psychological bulletin, vol. 111, no. 3, pp. 490.
MacCallum, R.C. and Browne, M.W. (1993) "The use of causal indicators in
covariance structure models: Some practical issues", Psychological bulletin, vol.
114, no. 3, pp. 533-541.
Malhotra, N.K., Agarwal, J. and Peterson, M. (1996) "Methodological issues in
cross-cultural marketing research: a state-of-the-art review", International
Marketing Review, vol. 13, no. 5, pp. 7-43.
Malhotra, N.K. and Birks, D.F. (2006) Marketing Research: An Applied Approach,
2nd edn, FT-Prentice Hall, Harlow, UK.
Mangan, J., Lalwani, C. and Gardner, B. (2004) "Combining quantitative and
qualitative methodologies in logistics research", International Journal of
Physical Distribution & Logistics Management, vol. 34, no. 7, pp. 565-578.
Martin, A. (ed)(1994) Infopartnering: The Ultimate Strategy for Achieving Efficient
Consumer Response., Oliver Wight Publication.
Mason, R. and Lalwani, C. (2006) "Transport integration tools for supply chain
management", International Journal of Logistics: Research and Applications,
vol. 9, no. 1, pp. 57-74.
Mason, J. (1996) Qualitative Researching, Sage, London, UK.

342
Mayer, R.C., Davis, J.H. and Schoorman, F.D. (1995) "An Integrative Model of
Organizational Trust", The Academy of Management Review, vol. 20, no. 3, pp.
pp. 709-734.
McCarthy Byrne, T.M., Moon, M.A. and Mentzer, J.T. (2011) "Motivating the
industrial sales force in the sales forecasting process", Industrial Marketing
Management, vol. 40, no. 1, pp. 128-138.
McCarthy, T.M. and Golicic, S.L. (2002) "Implementing collaborative forecasting to
improve supply chain performance", International Journal of Physical
Distribution & Logistics Management, vol. 32, no. 6, pp. 431-454.
McCarthy, T.M., Davis, D.F., Golicic, S.L. and Mentzer, J.T. (2006) "The evolution
of sales forecasting management: a 20-year longitudinal study of forecasting
practices", Journal of Forecasting, vol. 25, no. 5, pp. 303-324.
McClelland, S.B. (1994) "Training Needs Assessment Data-Gathering Methods::
Part 1, Survey Questionnaires", Journal of European Industrial Training, vol.
18, no. 1, pp. 22-26.
Melewar, T.C., Saunders, J. and Balmer, J.M.T. (2000) "The Saliency of Olins'
Visual Identity Structure in Relation to UK Companies Operating in Malaysia",
Corporate Reputation Review, vol. 3, no. 3, pp. 194-200.
Melewar, T.C. and Saunders, J. (1998) "Global corporate visual identity systems:
Standardization, control and benefits", International Marketing Review, vol. 15,
no. 4, pp. 291-308.
Mello, J. (2013) "Collaborative Forecasting: Beyond S&OP", Foresight: The
International Journal of Applied Forecasting, Spring, no. 29, pp. 26-31.
Mendelson, H. and Pillai, R.R. (1998) "Clockspeed and Informational Response:
Evidence from the Information Technology Industry", vol. 9, no. 4, pp. 415-
433.
Mentzer, J.T. and Kahn, K.B. (1995) "Forecasting technique familiarity, satisfaction,
usage, and application", Journal of Forecasting, vol. 14, no. 5, pp. 465-476.
Mentzer, J.T., DeWitt, W., Keebler, J.S., Min, S., Nix, N.W., Smith, C.D. and
Zacharia, Z.G. (2001) "Defining Supply Chain Management", Journal of
Business Logistics, vol. 22, no. 2, pp. 1-25.
Mentzer, J.T., Min, S. and Zacharia, Z.G. (2000) "The nature of interfirm partnering
in supply chain management", Journal of Retailing, vol. 76, no. 4, pp. 549-568.
Micheau, V.A. (2005) "How Boeing and Alcoa Implemented a Successful Vendor
Managed Inventory Program", Journal of Business Forecasting, vol. 24, no. 1,
pp. 17-19.
Miles, M.B. and Huberman, A.M. (1994) Qualitative data analysis: An expanded
sourcebook, 2nd edn, Sage.
Mirabeau, L., Mignerat, M. and Grangé, C. (2013) "The utility of using social media
networks for data collection in survey research", International Conference on
Information Systems (ICIS 2013): Reshaping Society Through Information
Systems Design, pp. 4201.
Mishra, B.K. and Raghunathan, S. (2004) "Retailer- vs. Vendor-Managed Inventory
and Brand Competition", Management Science, vol. 50, no. 4, Special Issue on
Marketing and Operations Management Interfaces and Coordination, pp. 445-
457.
Moon, M.A., Mentzer, J.T. and Smith, C.D. (2003) "Conducting a sales forecasting
audit", International Journal of Forecasting, vol. 19, no. 1, pp. 5-25.
Moorman, C., Deshpande, R. and Zaltman, G. (1993) "Factors affecting trust in
market research relationships", The Journal of Marketing, Vol. 57, pp. 81-101.

343
Moorman, C., Zaltman, G. and Deshpande, R. (1992) "Relationships between
providers and users of market research: the dynamics of trust within and
between organizations", Journal of Marketing Research, vol. 29, no. 3, pp. 314-
328.
Motwani, J., Mirchandani, D., Madan, M. and Gunasekaran, A. (2002) "Successful
implementation of ERP projects: Evidence from two case studies", International
Journal of Production Economics, vol. 75, no. 1–2, pp. 83-96.
Murray, P.J. (1997) "Using virtual focus groups in qualitative research", Qualitative
health research, vol. 7, no. 4, pp. 542-549.
Nakano, M. (2009) "Collaborative forecasting and planning in supply chains: The
impact on performance in Japanese manufacturers", International Journal of
Physical Distribution & Logistics Management, vol. 39, no. 2, pp. 84-105.
Näslund, D. (2002) "Logistics needs qualitative research – especially action
research", International Journal of Physical Distribution & Logistics
Management, vol. 32, no. 5, pp. 321-338.
Neumann, S. and Segev, E. (1979) "A case study of user evaluation of information
characteristics for systems improvement", Information & Management, vol. 2,
no. 6, pp. 271-278.
Nikolopoulos, K., Goodwin, P., Patelis, A. and Assimakopoulos, V. (2007)
"Forecasting with cue information: A comparison of multiple regression with
alternative forecasting approaches", European Journal of Operational Research,
vol. 180, no. 1, pp. 354-368.
Noekkentved, C. (2000) Collaborative Processes in E-supply Networks, European
SAP Centre of Expertise, Price-water house Coopers.
Nunnally, J.C. (1978) Psychometric Theory, McGraw-Hill, New York.
Nyaga, G.N., Whipple, J.M. and Lynch, D.F. (2010) "Examining supply chain
relationships: do buyer and supplier perspectives on collaborative relationships
differ?", Journal of Operations Management, vol. 28, no. 2, pp. 101-114.
Oh, L., Teo, H. and Sambamurthy, V. (2012) "The effects of retail channel
integration through the use of information technologies on firm performance",
Journal of Operations Management, vol. 30, no. 5, pp. 368-381.
O'Leary-Kelly, S.W. and J. Vokurka, R. (1998) "The empirical assessment of
construct validity", Journal of Operations Management, vol. 16, no. 4, pp. 387-
405.
Olhager, J. (2013) "Evolution of operations planning and control: from production to
supply chains", International Journal of Production Research, vol. 51, no. 23-
24, pp. 6836-6843.
Olhager, J., Rudberg, M. and Wikner, J. (2001) "Long-term capacity management:
Linking the perspectives from manufacturing strategy and sales and operations
planning", International Journal of Production Economics, vol. 69, no. 2, pp.
215-225.
Oliva, R. and Watson, N. (2011) "Cross-functional alignment in supply chain
planning: A case study of sales and operations planning", Journal of Operations
Management, vol. 29, no. 5, pp. 434-448.
Önkal, D., Lawrence, M. and Sayim, K.Z. (2011) "Influence of differentiated roles
on group forecasting accuracy", International Journal of Forecasting, vol. 27,
no. 1, pp. 50-68.
Önkal, D., Sayim, K.Z. and Lawrence, M. (2012) "Wisdom of group forecasts: Does
role-playing play a role?", Omega: The International Journal of Management
Science, vol. 40, no. 6, pp. 693-702.

344
Önkal, D., Sayım, K.Z. and Gönül, M.S. (2013) "Scenarios as channels of forecast
advice", Technological Forecasting and Social Change, vol. 80, no. 4, pp. 772-
788.
Özer, Ö, Zheng, Y. and Chen, K. (2011) "Trust in forecast information sharing",
Management Science, vol. 57, no. 6, pp. 1111-1137.
Paiva, E.L. (2010) "Manufacturing and marketing integration from a cumulative
capabilities perspective", International Journal of Production Economics, vol.
126, no. 2, pp. 379-386.
Patton, M.Q. (1991) Qualitative Evaluation and Research Methods, 2nd edn, Sage
Publications, Newbury Park, C.A.
Patton, M.Q. (2002) Qualitative Evaluation and Research Methods, 3rd edn, Sage,
London, UK.
Paula, M.d., Oliveira, J., de Souza, J.M. and Strauch, J. (2003) "Improving design
with collaborative planning, forecasting and replenishment through knowledge
management and CSCW", The 8th International Conference on Computer
Supported Cooperative Work in Design Proceedings, pp. 534-539.
Paulraj, A., Lado, A.A. and Chen, I.J. (2008) "Inter-organizational communication as
a relational competency: Antecedents and performance outcomes in
collaborative buyer–supplier relationships", Journal of Operations
Management, vol. 26, no. 1, pp. 45-64.
Payne, G. and Payne, J. (2004) Key Concepts in Social Research, Sage, London, UK.
Peck, H. (1998) "The development and implementation of co-managed inventory
agreements in the UK brewing industry", International Journal of Logistics:
Research and Applications, vol. 1, no. 3, pp. 297-311.
Peng, D.X. and Lai, F. (2012) "Using partial least squares in operations management
research: A practical guideline and summary of past research", Journal of
Operations Management, vol. 30, no. 6, pp. 467-480.
Perez, C., Castro, R.d., Simons, D. and Gimenez, G. (2010) "Development of lean
supply chains: a case study of the Catalan pork sector", Supply Chain
Management: An International Journal, vol. 15, no. 1, pp. 55-68.
Perols, J., Zimmermann, C. and Kortmann, S. (2013) "On the relationship between
supplier integration and time-to-market", Journal of Operations Management,
vol. 31, no. 3, pp. 153-167.
Peter, J.P. (1981) "Construct validity: a review of basic issues and marketing
practices", Journal of Marketing Research, pp. 133-145.
Petersen, K.J. (1999) The effect of information quality on supply chain performance:
an inter-organizational information system perspective, Michigan State
University, MI.
Petter, S., Straub, D. and Rai, A. (2007) "Specifying Formative Constructs in
Information Systems Research", MIS Quarterly, vol. 31, no. 4, pp. 623-656.
Phillips, M.L. (2011) Using Social Media in Your Research - Experts Explore the
Practicalities of Observing Human Behavior through Facebook and Twitter.
Available at: http://www.apa.org/gradpsych/2011/11/social-media.aspx
(Accessed: May/11 2014).
Phillips, L.W. (1981) "Assessing Measurement Error in Key Informant Reports: A
Methodological Note on Organizational Analysis in Marketing", Journal of
Marketing Research, vol. 18, no. 4, pp. 395-415.
Picazo-Vela, S., Gutiérrez-Martínez, I. and Luna-Reyes, L.F. (2012) "Understanding
risks, benefits, and strategic alternatives of social media applications in the
public sector", Government Information Quarterly, vol. 29, no. 4, pp. 504-511.

345
Pinsonneault, A. and Kraemer, K.L. (1993) "Survey Research Methodology in
Management Information Systems: An Assessment", Journal of Management
Information Systems, vol. 10, pp. 75-105.
Popay, J., Rogers, A. and Williams, G. (1998) "Rationale and standards for the
systematic review of qualitative literature in health services research",
Qualitative health research, vol. 8, no. 3, pp. 341-351.
Power, D. (2005) "Supply chain management integration and implementation: a
literature review", Supply Chain Management: An International Journal, vol.
10, no. 4, pp. 252-263.
QSR, I. (2014) QSR NVivo Features and Benefits. Available at:
http://www.qsrinternational.com/products_nvivo_features-and-benefits.aspx
(Accessed: 9 March 2014).
QSR, I. (2013) An overview of NVivo: Software to support qualitative and mixed
methods research. Available at:
http://download.qsrinternational.com/Resource/NVivo10/nvivo10-overview.pdf
(Accessed: 10 July 2013).
Ramanathan, U. (2013) "Aligning supply chain collaboration using Analytic
Hierarchy Process", Omega, vol. 41, no. 2, pp. 431-440.
Ramanathan, U. (2012) "Supply chain collaboration for improved forecast accuracy
of promotional sales", International Journal of Operations & Production
Management, vol. 32, no. 6, pp. 676-695.
Ramanathan, U. (2010) Analysing the role of information exchange for demand
forecasting in collaborative supply chains, PhD Dissertation, Nottingham
University Business School, UK.
Ramanathan, U. and Gunasekaran, A. (2014) "Supply chain collaboration: Impact of
success in long-term partnerships", International Journal of Production
Economics, vol. 147, Part-B, pp. 252-259.
Ramanathan, U. and Gunasekaran, A. (2012) "Supply chain collaboration: Impact of
success in long-term partnerships", International Journal of Production
Economics, [Online], Available from:
http://dx.doi.org/10.1016/j.ijpe.2012.06.002.
Ramanathan, U., Gunasekaran, A. and Subramanian, N. (2011) "Supply chain
collaboration performance metrics: a conceptual framework", Benchmarking:
An International Journal, vol. 18, no. 6, pp. 856-872.
Ramanathan, U. and Muyldermans, L. (2010) "Identifying demand factors for
promotional planning and forecasting: A case of a soft drink company in the
UK", International Journal of Production Economics, vol. 128, no. 2, pp. 538-
545.
Reynolds, N.L., Simintiras, A.C. and Diamantopoulos, A. (2003) "Theoretical
Justification of Sampling Choices in International Marketing Research: Key
Issues and Guidelines for Researchers", Journal of International Business
Studies, vol. 34, no. 1, pp. 80-89.
Rezabek, R.J. (2000) "Online focus groups: Electronic discussions for research", vol.
1, no. 1, pp. 1-20.
Roberts, N., Thatcher, J.B. and Grover, V. (2010) "Advancing operations
management theory using exploratory structural equation modelling
techniques", International Journal of Production Research, vol. 48, no. 15, pp.
4329-4353.
Robins, G. (1994) "Sailing into ECR’s uncharted waters", Stores, vol. 76, no. 10, pp.
43-44.

346
Rodgers, W. and Pavlou, P. (2003) Developing a predictive model: a comparative
study of the partial least squares vs maximum likelihood techniques (Working
Paper), Graduate School of Management, University of California, Riverside.
Rossiter, J.R. (2002) "The C-OAR-SE procedure for scale development in
marketing", International journal of research in marketing, vol. 19, no. 4, pp.
305-335.
Rowe, G. and Wright, G. (2011) "The Delphi technique: Past, present, and future
prospects - Introduction to the special issue", Technological Forecasting and
Social Change, vol. 78, no. 9, pp. 1487-1490.
Rowe, G. and Wright, G. (1999) "The Delphi technique as a forecasting tool: issues
and analysis", International Journal of Forecasting, vol. 15, no. 4, pp. 353-375.
Rowley, J. (2002) "Using case studies in research", Management Research News,
vol. 25, no. 1, pp. 16-27.
Sahin, F. and Robinson Jr., E.P. (2005) "Information sharing and coordination in
make-to-order supply chains", Journal of Operations Management, vol. 23, no.
6, pp. 579-598.
Sanders, N.R. (2008) "Pattern of information technology use: The impact on buyer–
suppler coordination and performance", Journal of Operations Management,
vol. 26, no. 3, pp. 349-367.
Sanders, N.R. and Manrodt, K.B. (1994) "Forecasting practices in US corporations:
survey results", Interfaces, vol. 24, no. 2, pp. 92-100.
Sanders, N.R. (1997) "The impact of task properties feedback on time series
judgmental forecasting tasks", Omega: The International Journal of
Management Science, vol. 25, no. 2, pp. 135-144.
Sanders, N.R. and Manrodt, K.B. (2003) "The efficacy of using judgmental versus
quantitative forecasting methods in practice", Omega: The International Journal
of Management Science, vol. 31, no. 6, pp. 511-522.
Sanders, N.R. and Ritzman, L.P. (2004) "Integrating judgmental and quantitative
forecasts: methodologies for pooling marketing and operations information",
International Journal of Operations & Production Management, vol. 24, no. 5,
pp. 514-529.
Sanders, N.R. and Ritzman, L.P. (1995) "Bringing judgment into combination
forecasts", Journal of Operations Management, vol. 13, no. 4, pp. 311-321.
Sargeant, J.M., Rajic, A., Read, S. and Ohlsson, A. (2006) "The process of
systematic review and its application in agri-food public-health", Preventive
veterinary medicine, vol. 75, no. 3–4, pp. 141-151.
Sari, K. (2008) "On the benefits of CPFR and VMI: A comparative simulation
study", International Journal of Production Economics, vol. 113, no. 2, pp. 575-
586.
Saunders, J. (1994) The Marketing Initiative: Economic and Social Research
Council Studies into British Marketing, Prentice Hall, Hemel Hempstead, UK.
Saunders, M., Lewis, P. and Thornhill, A. (1997) Research Methods for Business
Students, FT-Prentice Hall, London, UK.
Saunders, M., Lewis, P. and Thornill, A. (2007) Research Methods for Business
Students, 4th edn, Prentice Hall, London, UK.
Sawhney, R. (2013) "Implementing labor flexibility: A missing link between
acquired labor flexibility and plant performance", Journal of Operations
Management, vol. 31, no. 1–2, pp. 98-108.

347
Schoenherr, T. and Swink, M. (2012) "Revisiting the arcs of integration: Cross-
validations and extensions", Journal of Operations Management, vol. 30, no. 1–
2, pp. 99-115.
Shah, R. and Goldstein, S.M. (2006) "Use of structural equation modeling in
operations management research: Looking back and forward", Journal of
Operations Management, vol. 24, no. 2, pp. 148-169.
Sherman, R.J. (1998) "Collaborative planning, forecasting & replenishment (CPFR):
Realizing the promise of efficient consumer response through collaborative
technology", Journal of Marketing Theory and Practice, vol. 6, no. 4, pp. 6-9.
Shukla, M. and Jharkharia, S. (2013) "Agri-fresh produce supply chain management:
a state-of-the-art literature review", International Journal of Operations &
Production Management, vol. 33, no. 2, pp. 114-158.
Siefert, D. (2003) Collaborative Planning, Forecasting, and Replenishment: How to
Create a Supply Chain Advantage, AMACOM Pub., New York, USA.
Silverman, D. (2006) Interpreting Qualitative Data, 3rd edn, Sage, London, UK.
Silverman, D. (2010) Doing Qualitative Research, 3rd edn, SAGE Pub., London,
UK.
Simatupang, T.M. and Sridharan, R. (2002) "The Collaborative Supply Chain", The
International Journal of Logistics Management, vol. 13, no. 1, pp. 15-30.
Simchi-Levi, D., Kaminsky, P. and Simchi-Levi, E. (2003) Designing and Managing
the Supply Chain, 2nd edn, McGraw-Hill, IL.
Simchi-Levi, D. and Zhao, Y. (2003) "The value of information sharing in a two-
stage supply chain with production capacity constraints", Naval Research
Logistics (NRL), vol. 50, no. 8, pp. 888-916.
Sinkovics, R.R., Jean, R.B., Roath, A.S. and Cavusgil, S.T. (2011) "Does IT
integration really enhance supplier responsiveness in global supply chains?",
Management International Review, vol. 51, no. 2, pp. 193-212.
Småros, J. (2007) "Forecasting collaboration in the European grocery sector:
Observations from a case study", Journal of Operations Management, vol. 25,
no. 3, pp. 702-716.
Småros, J. (2005) Information Sharing and Collaborative Forecasting in Retail
Supply Chains, PhD Dissertation, Helsinki University of Technology
Laboratory of Industrial Management.
Småros, J. (2003) "Collaborative forecasting: a selection of practical approaches",
International Journal of Logistics: Research and Applications, vol. 6, no. 4, pp.
245-258.
Småros, J. (2002) "Collaborative Forecasting in Practice", Logistics Research
Network 2002 Conference, Birmingham, UK, pp. 1-8.
Smith, C. (2014) By the Numbers: 88 Amazing LinkedIn Statistics. Available at:
http://expandedramblings.com/index.php/by-the-numbers-a-few-important-
linkedin-stats/#.U2_2V_ldWSo (Accessed: 9 February 2014).
Smith, L., Andraski, J.C. and Fawcett, S.E. (2010) "Integrated Business Planning: A
Roadmap to Linking S&OP and CPFR", Journal of Business Forecasting, vol.
29, no. 4, pp. 4-13.
Sniezek, J.A. (1990) "A comparison of techniques for judgmental forecasting by
groups with common information", Group & Organization Management, vol.
15, no. 1, pp. 5-19.
Sniezek, J.A. (1989) "An examination of group process in judgmental forecasting",
International Journal of Forecasting, vol. 5, no. 2, pp. 171-178.

348
Spence, L. and Bourlakis, M. (2009) "The evolution from corporate social
responsibility to supply chain responsibility: the case of Waitrose", Supply
Chain Management: An International Journal, vol. 14, no. 4, pp. 291-302.
Stevens, G.C. (1989) "Integrating the supply chain", International Journal of
Physical Distribution & Logistics Management, vol. 19, no. 8, pp. 3-8.
Stewart, K. and Williams, M. (2005) "Researching online populations: the use of
online focus groups for social research", Qualitative Research, vol. 5, no. 4, pp.
395-416.
Stone, M. (1974) "Cross-Validatory Choice and Assessment of Statistical
Predictions", Journal of the Royal Statistical Society, Series B
(Methodological), vol. 36, no. 2, pp. 111-147.
Syntetos, A.A. and Boylan, J.E. (2005) "The accuracy of intermittent demand
estimates", International Journal of Forecasting, vol. 21, no. 2, pp. 303-314.
Syntetos, A.A., Nikolopoulos, K., Boylan, J.E., Fildes, R. and Goodwin, P. (2009)
"The effects of integrating management judgement into intermittent demand
forecasts", International Journal of Production Economics, vol. 118, no. 1, pp.
72-81.
Tanaka, J.S. (1987) "" How Big Is Big Enough?": Sample Size and Goodness of Fit
in Structural Equation Models with Latent Variables", Child development, , pp.
134-146.
Tashakkori, A. and Teddlie, C. (1998) Mixed methodology: Combining qualitative
and quantitative approaches, Sage, London, UK.
Tates, K., Zwaanswijk, M., Otten, R., Van Dulmen, S., Hoogerbrugge, P.M., Kamps,
W.A. and Bensing, J.M. (2009) "Online focus groups as a tool to collect data in
hard-to-include populations: examples from paediatric oncology", BMC
Medical Research Methodology, vol. 9, no. 15, pp. 1-8.
Taylor, T.A. and Xiao, W. (2010) "Does a Manufacturer Benefit from Selling to a
Better-Forecasting Retailer?", Management Science, vol. 56, no. 9, pp. 1584-
1598.
Taylor, D.H. (2006) "Demand management in agri-food supply chains: An analysis
of the characteristics and problems and a framework for improvement",
International Journal of Logistics Management, The, vol. 17, no. 2, pp. 163-
186.
Taylor, D.H. and Fearne, A. (2006) "Towards a framework for improvement in the
management of demand in agri-food supply chains", Supply Chain
Management: An International Journal, vol. 11, no. 5, pp. 379-384.
Tenenhaus, M., Amato, S. and Esposito Vinzi, V. (2004) "A global goodness-of-fit
index for PLS structural equation modelling", Proceedings of the XLII SIS
scientific meeting, pp. 739.
Tenenhaus, M., Vinzi, V.E., Chatelin, Y. and Lauro, C. (2005) "PLS path modeling",
Computational Statistics & Data Analysis, vol. 48, no. 1, pp. 159-205.
Thomassey, S. (2010) "Sales forecasts in clothing industry: The key success factor of
the supply chain management", International Journal of Production Economics,
vol. 128, no. 2, pp. 470-483.
Thomé, A.M.T., Scavarda, L.F., Fernandez, N.S., Scavarda, A.J. and . (2012) "Sales
and operations planning: A research synthesis", International Journal of
Production Economics, vol. 138, no. 1, pp. 1-13.
Thonemann, U.W. (2002) "Improving supply-chain performance by sharing advance
demand information", European Journal of Operational Research, vol. 142, no.
1, pp. 81-107.

349
Tranfield, D., Denyer, D. and Smart, P. (2003) "Towards a Methodology for
Developing Evidence-Informed Management Knowledge by Means of
Systematic Review", British Journal of Management, vol. 14, no. 3, pp. 207-
222.
Trapero, J.R., Kourentzes, N. and Fildes, R. (2012) "Impact of information exchange
on supplier forecasting performance", Omega, vol. 40, no. 6, pp. 738-747.
Van Bruggen, G.H., Spann, M., Lilien, G.L. and Skiera, B. (2010) "Prediction
Markets as institutional forecasting support systems", Decision Support
Systems, vol. 49, no. 4, pp. 404-416.
Van de Ven, A.H. and Delbecq, A.L. (1974) "The Effectiveness of Nominal, Delphi,
and Interacting Group Decision Making Processes", The Academy of
Management Journal, vol. 17, no. 4, pp. 605-621.
Van de Ven, A. and Delbecq, A.L. (1971) "Nominal versus Interacting Group
Processes for Committee Decision-Making Effectiveness", The Academy of
Management Journal, vol. 14, no. 2, pp. 203-2012.
Van der Vaart, T., Van Donk, D.P., Gimenez, C. and Sierra, V. (2012) "Modelling
the integration-performance relationship: Collaborative practices, enablers and
contextual factors", International Journal of Operations & Production
Management, vol. 32, no. 9, pp. 1043-1074.
Van der Vaart, T. and Van Donk, D.P. (2008) "A critical review of survey-based
research in supply chain integration", International Journal of Production
Economics, vol. 111, no. 1, pp. 42-55.
Van Swol, L.M. (2011) "Forecasting another’s enjoyment versus giving the right
answer: Trust, shared values, task effects, and confidence in improving the
acceptance of advice", International Journal of Forecasting, vol. 27, no. 1, pp.
103-120.
Vermeiren, J. and Verdonck, B. (2011) How to REALLY Use LinkedIn, 2nd edn, Step
by Step Publishing, Gent, Belgium.
Vickery, S.K., Jayaram, J., Droge, C. and Calantone, R. (2003) "The effects of an
integrative supply chain strategy on customer service and financial
performance: an analysis of direct versus indirect relationships", Journal of
Operations Management, vol. 21, no. 5, pp. 523-539.
VICS (2004) Overview: Collaborative Planning, Forecasting & Replenishment
(CPFR®), Voluntary Interindustry Commerce Standards (VICS), USA.
VICS, (2010) "Linking CPFR and S&OP: A Roadmap to Integrated Business
Planning 2010", Voluntary Interindustry Commerce Solutions (VICS), pp. 1-24.
VICS, (2002) Global Commerce Initiative Recommended Guidelines: Collaborative
Planning Forecasting and Replenishment (CPFR) Version 2.0, Voluntary
Interindustry Commerce Standards (VICS) Association.
Vijayasarathy, L.R. and Robey, D. (1997) "The effect of EDI on market channel
relationships in retailing", Information & Management, vol. 33, no. 2, pp. 73-86.
Vinzi, V.E., Trinchera, L. and Amato, S. (2010) "PLS path modeling: from
foundations to recent developments and open issues for model assessment and
improvement" in Handbook of Partial Least Squares Springer, pp. 47-82.
Vlachos, I.P. and Bourlakis, M. (2006) "Supply Chain Collaboration Between
Retailers and Manufacturers: Do They Trust Each Other?", Supply Chain
Forum: An International Journal, vol. 7, no. 1, pp. 70-80.
Vlajic, J.V., van der Vorst, J.G.A.J. and Haijema, R. (2012) "A framework for
designing robust food supply chains", International Journal of Production
Economics, vol. 137, no. 1, pp. 176-189.
350
Waller, M., Johnson, M.E. and Davis, T. (1999) "Vendor-Managed Inventory in the
Retail Supply Chain", Journal of Business Logistics, vol. 20, no. 1, pp. 183-203.
Washburn, T. (1995) "Create win-win-win promotions", The Nielsen Solution
Partnership, pp. 8-9.
Watson, E. (2005) "Nestlé switches to vendor managed inventory with Tesco", Food
Manufacture, vol. 80, no. 8, pp. 20-20.
Webb, E., Campbell, D. and Schwartz, R. (1966) Unobtrusive measures:
Nonreactive Research in the Social Sciences, Rand McNally & Company,
Chicago, USA.
Webby, R. and O'Connor, M. (1996) "Judgemental and statistical time series
forecasting: a review of the literature", International Journal of Forecasting,
vol. 12, no. 1, pp. 91-118.
Weintraub, I. (2000) "The impact of alternative presses on scientific
communication", International Journal on Grey Literature, vol. 1, no. 2, pp. 54-
59.
Whetten, D.A. (1989) "What Constitutes a Theoretical Contribution?", The Academy
of Management Review, vol. 14, no. 4, pp. 490-495.
Whiteoak, P. (1999) "The realities of quick response in the grocery sector A supplier
viewpoint", International Journal of Physical Distribution & Logistics
Management, vol. 29, no. 7, pp. 508-520.
Williams, B.D., Roh, J., Tokar, T. and Swink, M. (2013) "Leveraging supply chain
visibility for responsiveness: The moderating role of internal integration",
Journal of Operations Management, vol. 31, no. 7–8, pp. 543-554.
Wilson, J. (2010) Essentials of Business Research: A Guide to Doing Your Research
Project, SAGE Pub., London, UK.
Wolfers, J. and Zitzewitz, E. (2004) "Prediction Markets", Journal of Economic
Perspectives, vol. 18, pp. 03-25.
Yan, T. and Dooley, K. (2014) "Buyer-Supplier Collaboration Quality in New
Product Development Projects", Journal of Supply Chain Management, vol. 50,
no. 2, pp. 59-83.
Yaniv, I. (2004) "Receiving other people’s advice: Influence and benefit",
Organizational behavior and human decision processes, vol. 93, no. 1, pp. 1-13.
Yao, Y., Evers, P.T. and Dresner, M.E. (2007) "Supply chain integration in vendor-
managed inventory", Decision Support Systems, vol. 43, no. 2, pp. 663-674.
Yokum, J.T. and Armstrong, J.S. (1995) "Beyond accuracy: Comparison of criteria
used to select forecasting methods", International Journal of Forecasting, vol.
11, no. 4, pp. 591-597.
Zacharia, Z.G., Nix, N.W. and Lusch, R.F. (2011) "Capabilities that enhance
outcomes of an episodic supply chain collaboration", Journal of Operations
Management, vol. 29, no. 6, pp. 591-603.
Zhao, R., Kou, Y., Xian, G. and Mao, G.i. (2010) "Study on Technologies for
Information Monitoring and Quick Response of Agricultural Focuses and
Significant Events", Agricultural Sciences in China, vol. 9, no. 5, pp. 764-770.
Zhao, X., Huo, B., Selen, W. and Yeung, J.H.Y. (2011) "The impact of internal
integration and relationship commitment on external integration", Journal of
Operations Management, vol. 29, no. 1–2, pp. 17-32.
Zhao, X., Xie, J. and Leung, J. (2002) "The impact of forecasting model selection on
the value of information sharing in a supply chain", European Journal of
Operational Research, vol. 142, no. 2, pp. 321-344.

351
Zhou, H. and Benton Jr, W.C. (2007) "Supply chain practice and information
sharing", Journal of Operations Management, vol. 25, no. 6, pp. 1348-1365.
Zhou, H., Shou, Y., Zhai, X., Li, L., Wood, C. and Wu, X. (2014) "Supply chain
practice and information quality: A supply chain strategy study", International
Journal of Production Economics, vol. 147, Part C, pp. 624-633.
Zhu, X., Mukhopadhyay, S.K. and Yue, X. (2011) "Role of forecast effort on supply
chain profitability under various information sharing scenarios", International
Journal of Production Economics, vol. 129, no. 2, pp. 284-291.
Zikmund, W.G. (2003) Business Research Methods, 7th edn, Thomson South-
Western, Mason, Ohio, USA.
Zikmund, W.G. (1997) Business Research Methods, 5th edn, The Dreyden Press,
Fort Worth, TX, USA.
Zotteri, G. and Kalchschmidt, M. (2007) "Forecasting practices: Empirical evidence
and a framework for research", International Journal of Production Economics,
vol. 108, no. 1–2, pp. 84-99.
Zotteri, G., Kalchschmidt, M. and Caniato, F. (2005) "The impact of aggregation
level on forecasting performance", International Journal of Production
Economics, vol. 93–94, pp. 479-491.

352
APPENDIX-I: A single semi-structured interview
Company: UK based food manufacturer
Product-groups considered in CF: time-sensitive and / or short-life product-
groups (e.g. vegetable, poultry, meat and frozen food)
Interviewee: Supply chain manager
Date: 06th
December 2011
Duration of interview: from 10.00am to 11.30am (1 hour 30 min)
Types of record: Note-taking
Overview: Explanation of research aim and objectives and description about the
preliminary conceptual model of the research
Interview questions:
SECTION - 1) Collaborative forecasting performance
Q.1. Do you confront duration and / or accuracy related collaborative forecasting
problems in collaborations with retailers? Can you talk about how these difficulties
influence your (the company) relationship with retailers?
Q.2. Are there additional collaborative forecasting problems giving rise to conflicts
in collaborations? If yes, in what situations do you confront these problems? And
how do you deal with them?
SECTION - 2) Factors having an impact on the collaborative forecasting
performance (Preliminary propositions and the conceptual model were
introduced to the manager)
Q.4. Can you share your views and experience with regard to associated propositions
and their impact on the duration and accuracy of collaborative forecasting? What is
their realness in practice?
Q.5. Do you think that there are additional situations and / or factors that prevent you
from conducting long-term and accurate collaborative forecasting practices with
retailers?
Q.6. How these situations and / or factors influence the forecast accuracy and
collaborations with retailers?

353
SECTION - 3) The role of various product-groups in collaborative forecasting
Q.7. What is the extant performance of collaborative forecasting based on particular
product-groups that are considered in collaborations? (e.g. seasonal, perishable,
promotional and newly launched products, including short-life products such as
poultry, meat and vegetables) Does the performance of collaborative forecasting
satisfy you (in general)?
SECTION - 4) Information sharing, forecasting, decision making and risk
management procedures in collaborative forecasting
Q.8. What sort of operational/strategic practices do you implement to improve
information sharing, forecasting, decision making and risk management procedures
with retailer partners?
Q.9. How these practices influence the performance of collaborative forecasting?
Can you obtain tangible - positive – results by way of these practices?
Q.10. What is your overall view about existing collaborative forecasting problems
and the preliminary propositions offered as a remedy to these problems? Do you
have any additional suggestions in terms of examining specific situations / subjects
that are vital in practice to be investigated through the review of literature?

354
APPENDIX-II: Online group discussion -1
Group: Forecasting Net
Title: The Collaborative Forecasting (CF) problems of manufacturers and
retailers in the Food Supply Chain
Start-End Dates: 21st March 2012 – 8
th May 2012
Topic of discussion:
Hi everyone,
I am a PhD candidate at Brunel Business School, and conducting my research in the
Food Supply Chain by considering the practice of Collaborative Forecasting (CF),
implemented between manufacturers and retailers. The aim of the study is to explore
significant factors having an impact on the performance of CF with the development
of long-term and accurate CF between partners.
During the review of literature, I identified a number of important factors influencing
the accuracy and duration of the forecast collaborations. For instance;
-Trust
-Retailers’ forecast capabilities and shelf tracking performance
-Production capacity of manufacturers
-Promotion types & risks
-Forecasting methods used by partners (e.g. judgmental forecasting and time-series)
-Incompatible forecasting frequency of partners
I will be more than happy if you can share your views and experience by responding
to these questions:
1-) What is the role of these factors in practice?
2-) What sort of measures are taken in practice to cope with CF problems occurred
between manufacturers and retailers?
Thank you for your comments...

355
APPENDIX-II: Online group discussion -2
Group: Business Forecasting & Planning Innovation
Title: Collaborative Forecasting (CF) Problems in the Food Supply Chain
Start-End Dates: 26th
March 2012 – 12th
April 2012
Topic of discussion:
Hi everyone,
I am a PhD candidate at Brunel Business School, and conducting my research in the
Food Supply Chain by considering the practice of Collaborative Forecasting (CF),
implemented between manufacturers and retailers. The aim of the study is to explore
significant factors having an impact on the performance of CF with the development
of both long-term and accurate CF between partners.
During the review of literature, I identified a number of important factors
influencing the accuracy and duration of the forecast collaborations. For instance;
-Trust
-Retailers’ forecast capabilities and shelf tracking performance
-Production capacity of manufacturers
-Promotion types & risks
-Forecasting methods used by partners (e.g. judgmental forecasting and time-series)
-Incompatible forecasting frequency of partners
I will be more than happy if you can share your views and experience by responding
to these questions:
1-) What is the role of these factors in practice?
2-) What sort of measures are taken in practice to cope with CF problems occurred
between manufacturers and retailers?
Thank you for your comments...

356
APPENDIX-II: Online group discussion -3
Group: Forecasting Net
Title: Which factor is most critical in estimating the forecast of promotions?
Start-End Dates:: 20th
December 2012 – 28th
December 2012
Topic of discussion:
Which factor is most critical in estimating the forecast of promotions?
a) Forecasting Method
b) Forecaster’s knowledge about the market
c) Forecaster’s knowledge about product/s
d) Old promotional data about product/s
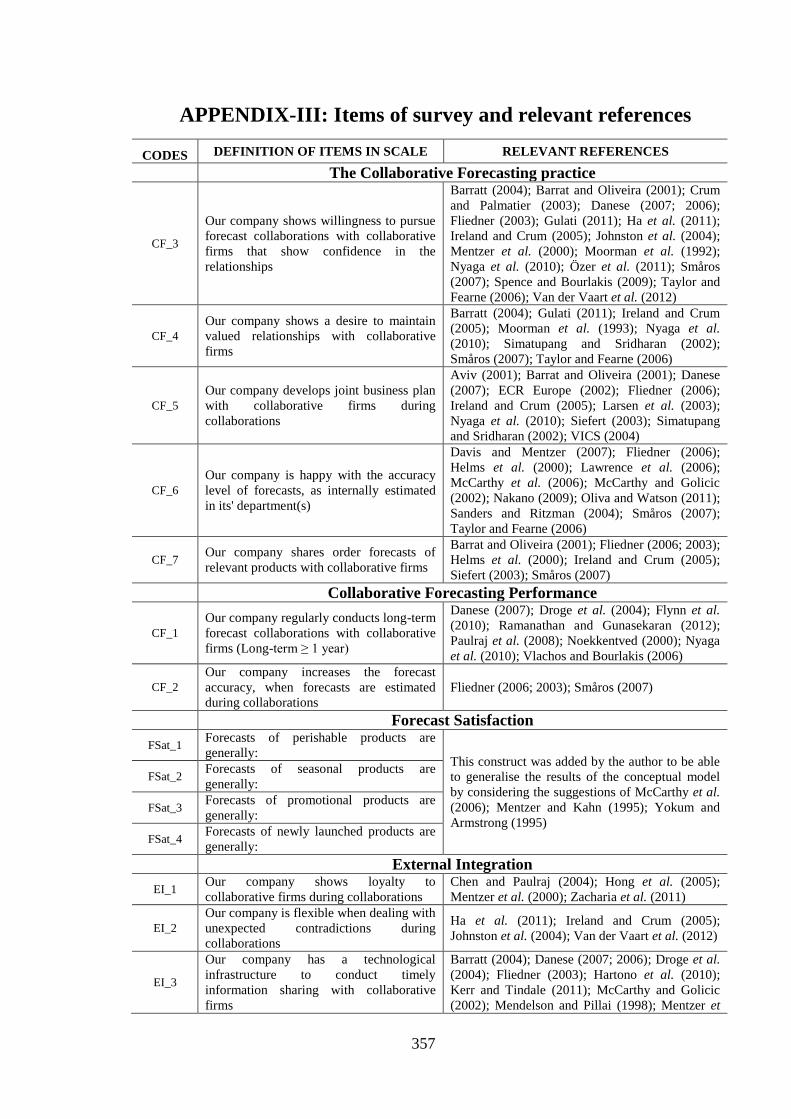
357
APPENDIX-III: Items of survey and relevant references
CODES DEFINITION OF ITEMS IN SCALE RELEVANT REFERENCES
The Collaborative Forecasting practice
CF_3
Our company shows willingness to pursue
forecast collaborations with collaborative
firms that show confidence in the
relationships
Barratt (2004); Barrat and Oliveira (2001); Crum
and Palmatier (2003); Danese (2007; 2006);
Fliedner (2003); Gulati (2011); Ha et al. (2011);
Ireland and Crum (2005); Johnston et al. (2004);
Mentzer et al. (2000); Moorman et al. (1992);
Nyaga et al. (2010); Özer et al. (2011); Småros
(2007); Spence and Bourlakis (2009); Taylor and
Fearne (2006); Van der Vaart et al. (2012)
CF_4
Our company shows a desire to maintain
valued relationships with collaborative
firms
Barratt (2004); Gulati (2011); Ireland and Crum
(2005); Moorman et al. (1993); Nyaga et al.
(2010); Simatupang and Sridharan (2002);
Småros (2007); Taylor and Fearne (2006)
CF_5
Our company develops joint business plan
with collaborative firms during
collaborations
Aviv (2001); Barrat and Oliveira (2001); Danese
(2007); ECR Europe (2002); Fliedner (2006);
Ireland and Crum (2005); Larsen et al. (2003);
Nyaga et al. (2010); Siefert (2003); Simatupang
and Sridharan (2002); VICS (2004)
CF_6
Our company is happy with the accuracy
level of forecasts, as internally estimated
in its' department(s)
Davis and Mentzer (2007); Fliedner (2006);
Helms et al. (2000); Lawrence et al. (2006);
McCarthy et al. (2006); McCarthy and Golicic
(2002); Nakano (2009); Oliva and Watson (2011);
Sanders and Ritzman (2004); Småros (2007);
Taylor and Fearne (2006)
CF_7 Our company shares order forecasts of
relevant products with collaborative firms
Barrat and Oliveira (2001); Fliedner (2006; 2003);
Helms et al. (2000); Ireland and Crum (2005);
Siefert (2003); Småros (2007)
Collaborative Forecasting Performance
CF_1
Our company regularly conducts long-term
forecast collaborations with collaborative
firms (Long-term ≥ 1 year)
Danese (2007); Droge et al. (2004); Flynn et al.
(2010); Ramanathan and Gunasekaran (2012);
Paulraj et al. (2008); Noekkentved (2000); Nyaga
et al. (2010); Vlachos and Bourlakis (2006)
CF_2
Our company increases the forecast
accuracy, when forecasts are estimated
during collaborations
Fliedner (2006; 2003); Småros (2007)
Forecast Satisfaction
FSat_1 Forecasts of perishable products are
generally: This construct was added by the author to be able
to generalise the results of the conceptual model
by considering the suggestions of McCarthy et al.
(2006); Mentzer and Kahn (1995); Yokum and
Armstrong (1995)
FSat_2 Forecasts of seasonal products are
generally:
FSat_3 Forecasts of promotional products are
generally:
FSat_4 Forecasts of newly launched products are
generally:
External Integration
EI_1 Our company shows loyalty to
collaborative firms during collaborations
Chen and Paulraj (2004); Hong et al. (2005);
Mentzer et al. (2000); Zacharia et al. (2011)
EI_2
Our company is flexible when dealing with
unexpected contradictions during
collaborations
Ha et al. (2011); Ireland and Crum (2005);
Johnston et al. (2004); Van der Vaart et al. (2012)
EI_3
Our company has a technological
infrastructure to conduct timely
information sharing with collaborative
firms
Barratt (2004); Danese (2007; 2006); Droge et al.
(2004); Fliedner (2003); Hartono et al. (2010);
Kerr and Tindale (2011); McCarthy and Golicic
(2002); Mendelson and Pillai (1998); Mentzer et

358
al. (2000); Ramanathan (2013); Ramanathan et al.
(2011); Sari (2008); Småros (2007); Taylor and
Fearne (2006); Taylor (2006); Zhou and Benton
Jr. (2007)
EI_4
The top management of our company
adopts the same vision with collaborative
firms
Chen and Paulraj (2004); Crum and Palmatier
(2003); Hartono et al. (2010); Ireland and Crum
(2005); Li and Lin (2006); Mentzer et al. (2000);
Moon et al. (2003)
Internal Integration
II_1 Our logistics department prepares and
conducts effective delivery plans
Chen et al. (2009); ECR Europe (2001); Lockamy
III and McCormack (2004); Ramanathan and
Gunasekaran (2014; 2012)
II_2 Our company successfully manages
inventory levels
Nakano (2009); Power (2005); Stevens (1989);
Taylor (2006); Taylor and Fearne (2006)
II_3
Our company has a technological
infrastructure for timely information
sharing between departments
Arshinder et al. (2008); Barratt (2004); ECR
Europe (2001); Fliedner (2006); Hill and Scudder
(2002); Paula et al. (2003); Paulraj et al. (2008);
Power (2005); Ramanathan et al. (2011); Sanders
(2008); Småros (2007); Taylor and Fearne (2006);
Zhou and Benton Jr. (2007)
II_4 Our company regularly records
information provided by its departments Taylor and Fearne (2006); Taylor (2006)
Forecast Horizon
FH_1 The forecast horizon of perishable
products is generally: Ali et al. (2009); Aviv (2002; 2001); Fildes and
Goodwin (2007); Klassen and Flores (2001);
Lawrence et al. (2006); McCarthy et al. (2006);
Mentzer and Kahn (1995); Småros (2007; 2003);
Zotteri and Kalchschmidt (2007)
FH_2 The forecast horizon of seasonal products
is generally:
FH_3 The forecast horizon of promotional
products is generally:
FH_4 The forecast horizon of newly launched
products is generally:
Group Forecasting
GF_1 Our company consistently attends
previously scheduled meetings Graefe and Armstrong (2011); Ireland and Crum
(2005); Siefert (2003)
GF_2 Forecast decisions are taken by following
pre-established procedures Ireland and Crum (2005); Siefert (2003)
GF_3 Managerial positions of forecasters play an
important role in forecast decisions Graefe and Armstrong (2011); Helms et al.
(2000); Rowe and Wright (2011)
GF_4 Forecasters implement constructive
discussions during meetings
Aviv (2001); Davis and Mentzer (2007); Graefe
and Armstrong (2011); Helms et al. (2000); Van
de Ven and Delbecq (1974; 1971); Kerr and
Tindale (2011)
GF_5
Information gathered during meetings is
used effectively to estimate consensus
forecasts
Byrne et al. (2011); Davis and Mentzer (2007);
Frewer et al. (2011); Graefe and Armstrong
(2011); Helms et al. (2000); Kerr and Tindale
(2011); Van de Ven and Delbecq (1974; 1971)
Forecasters’ Competence
FC_1 Forecasters have market based experience
for the products involved
Lawrence et al. (2006); Rowe and Wright (1999);
Sanders and Ritzman (2004); Van Swol (2011)
FC_2 Forecasters are willing to accept advice
from each other during meetings
Frewer et al. (2011); Lawrence et al. (2006);
Önkal et al. (2012); Van Swol (2011); Yaniv
(2004)
FC_3 Forecasters are motivated to arrive
consensus forecasts in meetings
Byrne et al. (2011); Davis and Mentzer (2007);
Flynn et al. (2010); Frewer et al. (2011); Kerr and
Tindale (2011); Småros (2007); Webby and
O’Connor (1996)
FC_4 Forecasters show willingness and intention Mayer et al. (1995); Rowe and Wright (2011);

359
to become involved with the forecasting
process
Van Swol (2011)
FC_5 Forecasters give feedback to each other
during meetings
Byrne et al. (2011); Goodwin and Fildes (1999);
Lawrence et al. (2006); Rowe and Wright (1999);
Sanders (1997)
FC_6
Forecasters have confidence in each other
when accepting suggestions given during
meetings
Davis and Mentzer (2007); Graefe and Armstrong
(2011); Kerr and Tindale (2011); Rowe and
Wright (2011); Sanders and Ritzman (2004); Van
Swol (2011)
FC_7
Forecasters are satisfied with final
consensus forecasts at the end of the
meetings
Byrne et al. (2011); Graefe and Armstrong
(2011); Van de Ven and Delbecq (1974)
Information Types
ITypes_1 Our company shares the inventory level of
products with relevant collaborative firms
Arshinder et al. (2008); Danese (2007); ECR
Europe (2001); Larsen et al, (2003)
ITypes_2 Our company shares the production plan of
relevant products with collaborative firms
Fliedner (2006); Flynn et al. (2010); Larsen et al.
(2003); Lee et al. (2000); Ramanathan and
Gunasekaran (2014; 2012); Zhou and Benton Jr.
(2007); Zotteri and Kalchschmidt (2007)
ITypes_3
Our company shares the production
scheduling of relevant products with
collaborative firms
Arshinder et al. (2008); Chen and Paulraj (2004);
Fliedner (2006); Flynn et al. (2010); Karoway
(1997); Larsen et al. (2003); Zhou and Benton Jr.
(2007)
ITypes_4
Our company informs collaborative firms
of recent changes (Recent changes include
the latest information of environment,
weather, product/company related data and
past experience into the forecast)
Helms et al. (2000); Lawrence et al. (2006);
Sanders and Ritzman (2004); Sanders and
Manrodt (2003)
Information Quality
IQL_1
Our company shares relevant information
with collaborative firms during
collaborations
Danese (2007); Hartono et al. (2010); Taylor and
Fearne (2006); Taylor (2006); Zhou and Benton
Jr, (2007)
IQL_2
Our company shares adequate information
with collaborative firms during
collaborations
Chang et al. (2013); Du et al. (2012); Webby and
O’Connor (1996)
IQL_3
Our company shares accurate information
with collaborative firms during
collaborations
Du et al. (2012); Hartono et al. (2010); Helms et
al. (2000); Li and Lin (2006); Webby and
O’Connor (1996); Zhou and Benton Jr, (2007)
IQL_4
Our company provides real-time
information to collaborative firms during
collaborations
Du et al. (2012); Hartono et al. (2010);
Mendelson and Pillai (1998); Vijayasarathy and
Robey (1997); Zhou and Benton Jr, (2007)
IQL_5
Our company frequently updates
information for collaborative firms during
collaborations
Aviv (2007; 2002; 2001); Danese (2007); Fisher
(2000); Forslund and Jonsson (2007); Flynn et al.
(2010); Hartono et al. (2010); Larsen et al.
(2003); Neumann and Segev (1979); Sanders
(2008); Zhou and Benton Jr, (2007)
IQL_6
Our company shares up-to-date
information in response to information
received from collaborative firms
Arshinder et al. (2008); Danese (2007); Hartono
et al. (2010); Ramanathan et al. (2011)
IQL_7
Our company engages in consistent
information sharing with collaborative
firms during collaborations
Fisher (2000); Småros (2002); Taylor and Fearne
(2006); Taylor (2006)

360
APPENDIX-IV: Statements of ethics approval