improving academic writing standard: a challenge for …pertanika.upm.edu.my/pertanika papers/jssh...
TRANSCRIPT

Pertanika J. Soc. Sci. & Hum. 24 (S): 187 – 204 (2016)
ISSN: 0128-7702 © Universiti Putra Malaysia Press
SOCIAL SCIENCES & HUMANITIESJournal homepage: http://www.pertanika.upm.edu.my/
ARTICLE INFOArticle history:Received: 19 November 2015Accepted: 04 May 2016
E-mail addresses:[email protected] (Nurhayati, IK),[email protected] (Kurniasih, Nia)* Corresponding author
Improving Academic Writing Standard: A Challenge for Universities
Nurhayati, IK1* and Kurniasih, Nia2
1Faculty of Communication and Business, Telkom University, Bandung, West Jawa 40257, Indonesia2Faculty of Art and Design, Institut Teknologi Bandung, Bandung, West Jawa 40132, Indonesia
ABSTRACT
The low rate of publications in internationally reputed scientific journals has become one of the main concerns of many Indonesian academicians and universities as these organisations are expected to contribute to knowledge and improve academic quality. One of the contributing factors is the researchers’ mastery of English to write for international journals. This paper examines lexical density and reading ease of scientific papers, some of the indicators used for evaluating the quality of scientific writing. This study adopted three methods from Halliday (1985), Flesch (1948) and Gunning (1952) in determining the lexical density, fog index and reading ease. These three determining factors were then statistically calculated using simple regression; the results showed they have a highly significant effect (70.1%) on the standard of academic writing. Thus, it is highly recommended that Indonesian academicians enhance the quality of their scientific papers through the process of editing and proofreading prior to submitting their papers to international journals.
Keywords: Writing skill, scientific papers, lexical density, reading ease, fog index
INTRODUCTION
Business competitiveness has led to companies to seize opportunities and manage challenges in the global environment. Similarly, in order for local universities to be internationally competitive, they have to be run and managed as world-class universities.
One of the requirements to be recognised as a world-class university is publication of research findings by faculty members in highly reputed journals.
Quality research published in reputed journals provide important contribution to specific fields of study. Peer evaluation

Pertanika J. Soc. Sci. & Hum. 24 (S): 187 – 204 (2016)
Nurhayati, IK and Kurniasih, Nia
188
and review from outside the university determine the quality of research. Generally, if a paper is rejected by a journal editor, it implies that the journal has very high standards and academic rigour. The high number of articles rejected due to poor quality, based on, among others, referees’ comments and feedback, shows that the journal is very selective and allows only quality articles with good reviews to be published, hence assuring its status as a respected publication. According to Sampson et al. (2010) refereed publications are of higher quality than non-refereed ones. The refereeing process entails content evaluation by scholars or peer reviewers which are used as a basis to accept or reject the work, irrespective of whether the author was invited to publish with the journal or not. The impact rating of the journal is based on the number of manuscripts submitted and subsequently published.
Dissemination of research results and findings in reputed journals are an integral part of the research process. Academics as researchers write not only to keep a record of their achievements, but more importantly for readers who expect good quality research papers. To be qualified for international journal publication, a manuscript must be written in a scientific style, which may not be easy for novices; yet, clear communications and concise writing style for a scientific audience can be taught (Davis, 1997). It should be written and published as a report that describes results of original research that
meet certain requirements (Day, 1983, p.1). He also stresses the importance of content, style and organisation of the paper.
The standard of writing level has received great attention in the last decades and various studies have been conducted on this. According to Flowerdew and Wang (2016), revision and changes made by an editor to an academic article helps to ensure their its eventual publication. The editor’s role is to improve the language used in the articles. Sunol and Saturno (2008) opined that improving an author’s language and eliminating the language barrier in writing is a win – win situation. To the knowledge of the present authors, there are no studies on the writing standard of Indonesian academicians in particular their grammar and lexical density.
Writing scientific papers for internationally reputed journals, especially in Indonesia, remains limited due to many factors, one of which is the researchers’ mastery of English (Sunol & Saturno, 2008). They reported that many researchers whose original work is in languages other than English are faced with difficulties when they have to write in English, a language that is not their mother tongue and consequently, some of them seek professional support in the form of translation. This is often seen as a means to resolve the problem that requires serious measures both by the academicians as researchers and faculty members and the university as an organisation that is responsible to contribute and disseminate knowledge.

Pertanika J. Soc. Sci. & Hum. 24 (S): 187 – 204 (2016)
Improving Academic Writing Standard
189
Indonesian academicians must improve their English writing skills as the low quality of their papers is a result of their limited mastery of English. This is indicated by the level of difficulties they face when writing their papers which is also the main reason this present research was conducted. The levels of the texts vary. Diction or choice of vocabulary or the number of vocabulary words in a text is one of the determining factors, and the number and diversity of vocabulary used in a text can be measured through lexical density and reading levels or FOG Index of the text, an index of readability formula proposed by American textbook publisher, Robert Gunning (Janna & Wray, 2012). Calculation of lexical density and readability involves words, number of clauses, and number of clause complex of both the spoken and written texts. Halliday (2004) (as cited in Presnyakova, 2011) wrote: “Typically, written language becomes complex by being lexically dense: it packs a large number of lexical items into each clause: whereas spoken language becomes complex by being grammatically intricate: it builds up elaborate clause complexes out of parataxis and hypotaxis.”
Determining whether a text uses a written or spoken language requires an understanding of its physical features, familiarity with the reason the text is produced, and understanding about how the text is decoded; it can be performed by taking into account features of written or spoken language presented by Eggins (1994).
The calculation of lexical density and grammatical intricacy of a text can be conducted manually by applying a formula used by Halliday (1985). Grammatical intricacy and lexical density of every text is different. Both determine whether a text is spoken or written, as described by Eggins (1994) in Table 1.
Table 1Lexical Density and Grammatical Intricacy In spoken and Written Language Q
Spoken Language Written LanguageLow lexical densityFew content-carrying words as a proportion of all words
High lexical densityMany content-carrying words as a proportion of all words
High grammatical intricacyMany clauses per sentence
Low grammatical intricacy Few clauses per sentence
To determine whether a text belongs to a written or spoken language would require an understanding of its physical features, the introduction of the original purpose of why the text is written, and an understanding of how the text is decoded (Eggins, 1994)
Lexical density in a text can be calculated using several formulas. The concept of density in this context refers to a kind of complexity that results from the development of words. In other words, this relates to the notion of lexico-grammar in terms of wording in the language (Halliday, 1985). There are at present several different measurements for lexical density. According to Ure (1971), lexical density

Pertanika J. Soc. Sci. & Hum. 24 (S): 187 – 204 (2016)
Nurhayati, IK and Kurniasih, Nia
190
refers to the number of lexical items divided by the number of running words. This formula was refined by Halliday (1985) as his first attempt to measure lexical density, and was further developed by O’Loughlin (1995).
Traditionally, according to Le et al. (2011) lexical items comprise nouns, verbs, adjectives and adverbs because they have independent meanings and new members can be added to these categories. Halliday (1985) uses the term ‘items’ rather than ‘words’ when discussing grammar and lexical items, as he argues they may contain more than one word in the usual sense. Taking several phrasal verbs such as stand up, take over, or call off, each of these consists of two words, a lexical verb and a preposition, but Halliday treats them as a lexical item. This contrasts the views of Ure (1971), who treats them as two separate words, one being the lexical word stand, take, or call, and the other being the preposition up, over, or off respectively.
METHODOLOGY
The present researchers aimed to understand the writing standard of academicians in Indonesia using the direct observation technique.
The authors scrutinised 56 scientific papers written in English by Indonesian academicians (lecturers). The papers were presented at an international conference held in Jakarta, Indonesia in 2014, organised by a private university in Bandung, Indonesia.
The purposive sampling technique was used in which each sample element was selected for a given purpose, usually because of the unique position of the sample elements. According to Herbert Rubin and Irene Rubin (1995), purposive sampling may involve studying the entire population of groups or a subset of a population. Furthermore, it is understood that a purposive sample may be deemed a “key informant survey.” It targets individuals who are knowledgeable about the issues under investigation. In this study, all the research samples (56 papers) were selected.
As discussed in the introduction, Sunol (2008) stated that many researchers whose original work is in languages other than English are faced with difficulties when they have to write in English, a language that is not their mother tongue; consequently, some of them seek professional support in the form of translation (Stephan, 2008). Based on this and the results of direct observation as well as a brief preliminary investigation of the 56 papers, the researchers assumed that the processes of editing and proofreading would most likely help improve the quality of academic papers. Below are the present study’s four research questions:
1. What are the lexical density, grammatical intricacy, fog index, and reading ease of the scientific papers produced by Indonesian academicians?
2. What is the reading ease and writing standard of the scientific papers produced by Indonesian academicians?

Pertanika J. Soc. Sci. & Hum. 24 (S): 187 – 204 (2016)
Improving Academic Writing Standard
191
3. To what extent do lexical density, ease of reading, and fog index affect the reading and writing standard of Indonesian academicians?
This research adopts the three formulas proposed by Halliday (1985), Flesch (1948) and Gunning (1952) to examine the lexical density of the sample, namely fifty-six (56) conference papers. The lexical items are manually counted using Microsoft Excel based on Halliday’s rules of determining lexical items and the results compared with Halliday’s standard of lexical density.
To find out the reading ease of the texts, data were calculated using Microsoft Excel, employing Flesch’s Reading Ease Formula. Next, the results were compared with Flesch’s standard of Reading Ease to find out the readers’ grades. Lastly, Gunning’s FOG index was used to calculate the readability of the text. To calculate the lexical density, a formula by Johannsson (2008, p.65) was adopted and which can be expressed as follows:
[1]
According to Halliday (1985), a typical average lexical density for written texts is between 3 and 6, depending on the text. The higher the index, the more difficult the text. The figures for spoken language, however, fall to between 1.5 and 2. The statistics obtained from the above methods were compared with Flesch’s (1948) Reading scale. Flesch Reading Ease measures sentence length and the number of syllables
every 100 words (Courtis & Hassan, 2002). Its formula is stated below, in which wl indicates the total number of syllables of the words in the passage and sl indicates the average number of words per sentence.
To find out the reading ease of a text, Zamanian & Heydari (2012) adopted the formula below:
RE = 206.835 – (1.015 x ASL) – (84.6 x ASW) [2]
In which RE is the acronym for Reading Ease; ASL is the Average Sentence Length (i.e. the number of words divided by the number of sentences); and ASW is the Average number of Syllables per Word (i.e. the number of syllables divided by the number of words). Flesch set the range of RE score from 0 to 100. High score indicates good readability. RE scores between 90.0 and 100.0 are considered accessible for 5th graders. The scores between 60.0 and 70.0 are considered accessible for 8th and 9th graders, and the scores of RE between 0.0 and 30.0 are considered easily accessible for college graduates (Zamanian & Heydari, 2012). A formula to evaluate readability for adults was developed by Gunning (1952) known as The Fog Index. It became popular, it uses two variables: average sentence length and the number of words with more than two syllables for each 100 words. The Fog index rates the readability of a text using the formula, Reading Level or Grade (Zamanian & Heydari, 2012)
To determine whether there is a significant effect of lexical density, readability and Fog index on reading and

Pertanika J. Soc. Sci. & Hum. 24 (S): 187 – 204 (2016)
Nurhayati, IK and Kurniasih, Nia
192
writing standard, quantitative calculations were performed using the following: Kolmogorov-Smirnov test to determine normality, multicollinearity classical assumption test to determine whether a regression model could find a correlation between independent variables in this research, heteroscedasticity test to see whether there was a variance between a residual and another observation in the regression model used in this research, and multiple linear regression analysis to determine the relationship between the dependent variables (Reading Level Index/writing level) and independent variables (Lexical Density, Gunning Fog Index, and Reading Ease).
The last stage of the analysis was to evaluate the writing of 5 (five) selected papers, out of the 56 edited papers approved for submission, using purposive sampling. The editing and proofreading were analysed using Flowerdew’s model (1999) that describe the revisions, namely addition, deletion, substitution, rearrangement, and correction.
RESULTS AND DISCUSSION
This section discusses and analyses the statistical data to highlight research findings. In measuring the lexical density, we have distinguished the grammar from lexical items. Grammar or ‘function words’, come in a closed system consisting of determiners such as articles, pronouns, prepositions, conjunctions, some classes of adverb and finite verbs. In contrast, lexical items, or ‘content words’, are named
lexical as they function in lexical sets that are, according to Halliday, part of an open system. Traditionally, nouns, verbs, adjectives and adverbs are the four word classes composing lexical items since they have an autonomous meaning and new members can be added to these categories:
The first finding on Lexical Density (LD) is described in Figure 1. Lexical density is calculated by obtaining the ratio between the lexical items with a total running words or advanced grammar unit called a clause. Lexical density has a representative reflective function of a written text and therefore, it is less active and far from being spontaneous as it is in the spoken language which is the language of action. Data showed the highest is 73%. As the number surpasses forty (40) per cent, it accounts for higher lexical density (Halliday, 1985). In other words, the texts or scientific papers written by the participants are more difficult. The second highest is 22%, and the rest of 2%, 2%, and 1%, indicating lower scores, which implies low levels of lexical density. Based on this figure, we can conclude that the majority of papers examined in this research are of higher lexical density, while only 5% are of lower level.
Figure 1. Lexical Density Level

Pertanika J. Soc. Sci. & Hum. 24 (S): 187 – 204 (2016)
Improving Academic Writing Standard
193
Details on difficult words found in the texts can be seen in Table 2 which shows the lowest number of difficult words found in the texts is 227and the highest is 2039. The mean of difficult words is 775 words, with 36 participants below the mean and 23 above the mean. It can be concluded that, in terms of difficult words, more than half of the papers submitted were still below average.
Table 2The Number of Hard Words of Indonesian Faculty’s Scientific Papers
Hard words Total UnitsThe lowest number 227 WordsThe highest number 2039 WordsMean 775 Words
Another feature of lexical density is the long words. Table 3 shows the lowest number of long words found in the text, which is 390, and the highest which is 3459. The mean is 1249 words, with 29 participants below the mean and 30 above the mean. Thus, in terms of long words, there is no big difference in the number of papers that belong to the category of below and above average (a difference of 1 participant).
Table 3The Number of Long Words of Indonesian Faculty’s Scientific Papers
Hard words Total UnitsThe lowest number 390 WordsThe highest number 3459 WordsMean 1249 Words
The lexical density, as shown in Table 3, was analysed using Flesch’s Reading Ease. The results show that 18 papers score as high as 0 – 30 RE, meaning the texts are very difficult according to Flesch’s standard; 17 papers scored between 30 – 40 RE, or difficult; 19 papers scored between 40 – 50 RE, meaning they were fairly difficult and 5 papers scored between 50 and 60 RE, which means they were standard papers. In terms of readability, the papers belong to three categories: very difficult, difficult, and fairly difficult; they were almost equal in this regard. A significant difference is seen in the number of papers rated as standard, which is considerably lower.
Figure 2. Reading Ease Scores of Indonesian
Data analysed using Flesh Reading Ease Level show that 63%, 32%, 3% and 2% of the papers are categorised as very difficult, difficult, fairly difficult and standard respectively. This is shown in Figure 4. Thus, in terms of Flesh Reading Ease, the majority of the papers are difficult.
Pertanika J. Soc. Sci. & Hum. 24 (S): 187 – 204 (2016)
Nurhayati, IK and Kurniasih, Nia
194
Figure 3. The Level of Reading Ease of Indonesian Academicians’ Papers
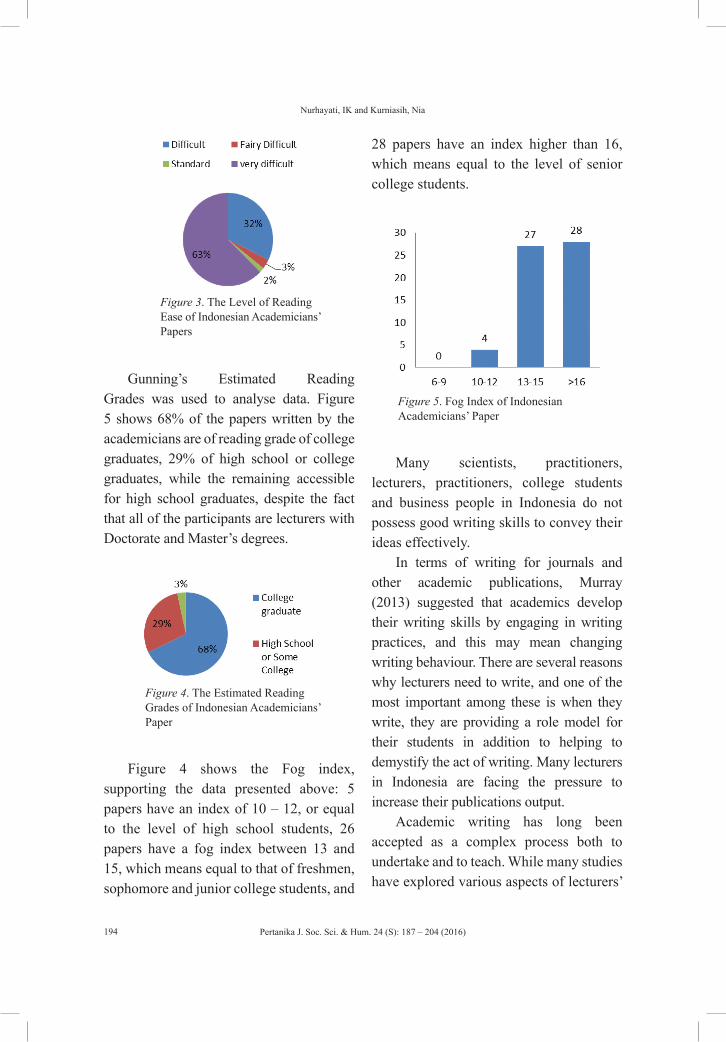
Gunning’s Estimated Reading Grades was used to analyse data. Figure 5 shows 68% of the papers written by the academicians are of reading grade of college graduates, 29% of high school or college graduates, while the remaining accessible for high school graduates, despite the fact that all of the participants are lecturers with Doctorate and Master’s degrees.
Figure 4. The Estimated Reading Grades of Indonesian Academicians’ Paper
Figure 4 shows the Fog index, supporting the data presented above: 5 papers have an index of 10 – 12, or equal to the level of high school students, 26 papers have a fog index between 13 and 15, which means equal to that of freshmen, sophomore and junior college students, and
28 papers have an index higher than 16, which means equal to the level of senior college students.
Figure 5. Fog Index of Indonesian Academicians’ Paper
Many scientists, practitioners, lecturers, practitioners, college students and business people in Indonesia do not possess good writing skills to convey their ideas effectively.
In terms of writing for journals and other academic publications, Murray (2013) suggested that academics develop their writing skills by engaging in writing practices, and this may mean changing writing behaviour. There are several reasons why lecturers need to write, and one of the most important among these is when they write, they are providing a role model for their students in addition to helping to demystify the act of writing. Many lecturers in Indonesia are facing the pressure to increase their publications output.
Academic writing has long been accepted as a complex process both to undertake and to teach. While many studies have explored various aspects of lecturers’

Pertanika J. Soc. Sci. & Hum. 24 (S): 187 – 204 (2016)
Improving Academic Writing Standard
195
perceptions about teaching writing across different contexts (Moore 2000; Björk et al., 2003; Murray 2006), there is a lack of evidence from the higher education professional development context and perspective. There are mounting pressures on academics to undertake research and to publish both in their own disciplines and in higher education pedagogy, practice and policy.
Research is an important reason for the establishment of universities. Universities serve as not only a learning centre but also as a centre for research, strategic knowledge, for bridging the gap between the public and private sectors. Universities have to be actively involved in supporting and promoting research development. The term research universities refers to universities that excel in research activities. Therefore, research universities contribute to the development of knowledge and science, to the understanding of human life and to serve various other societal needs.
In measuring the success of a research university, publication by its academics in good quality journals is imperative. Publication is the most important aspect and outcome of research. Through publications, a research activity disseminates its knowledge to be accessed by those who need them.
To determine whether there is a significant effect of lexical density, reading ease and fog index on the reading index and writing standard, quantitative calculations were performed using the Kolmogorov-Smirnov test to determine normality and multicollinearity classical assumption.
Test Result of Normality Classical Assumptions
A normality test is performed on data to determine whether they (data) have a normal or an abnormal distribution. Figure 6 shows the results of data processing using SPSS 20 as follows:
Figure 6. Normal Graphic P-Plot
Figure 6 shows a normal distribution of data used as variables. It can be seen on the points indicating the data that are spread around the diagonal line, and the distribution of the data points in the direction that follows the diagonal line. A normality test was also conducted using statistical calculations, namely Kolmogorov-Smirnov test, to generate more detailed numbers and to find out whether a regression equation can qualify the assumption of normality.

Pertanika J. Soc. Sci. & Hum. 24 (S): 187 – 204 (2016)
Nurhayati, IK and Kurniasih, Nia
196
Table 4Kolmogorov-Smirnov Test
One-Sample Kolmogorov-Smirnov Test
Unstandardised Residual
N 59
Normal Parametersa,bMean 0E-7Std. Deviation 1.97872971
Most Extreme DifferencesAbsolute .115Positive .056Negative -.115
Kolmogorov-Smirnov Z .880Asymp. Sig. (2-tailed) .421
a. Test distribution is Normal.b. Calculated from data.
The test results showed the probability value (asymptotic significance) > α (0.421) > 0.05 and therefore it can be concluded that the regression model in this study has proven the assumption of normality.
Results of Multicollinearity Classical Assumption Test
Multicollinearity test aims to find out whether a regression model can show a correlation between independent variables. Multicollinearity can be seen from VIF (Variance Inflating Factor); if VIF is not higher than 10 and the value of Tolerance is not any less than 0.1, the model can thereby be deemed free from multicollinearity (Sunjoyo et al., 2013, p. 65). The test results for multicollinearity can be seen in Table 4.2 below:
Table 5Multicollinearity Test
CoefficientsCollinearity Statistics
Tolerance VIF
.795 1.257
.636 1.573
.699 1.431a. Dependent Variables: Reading Level Index
Table 5 shows that the tolerance value of all variables is higher than 0,1 and the VIF value is lower than 10. This indicates that no multicollinearity has occurred in the variables.
Results of Heteroscedasticity Classical Assumption Test
Heteroscedasticity test aims to find out whether there are variances between a residual and another observation in a regression model. A good regression

Pertanika J. Soc. Sci. & Hum. 24 (S): 187 – 204 (2016)
Improving Academic Writing Standard
197
model is one without any occurrence of heteroscedasticity. One way to test the presence of heteroscedasticity is through
a scatterplot method, by observing the pattern of the dots. The figure below shows the results of the heteroscedasticity test:
Figure 7. Heteroscedasticity Test
As can be seen in Figure 7 the plots are randomly scattered, both above and below the number 0 and Axis Y; it can be concluded, therefore, that heteroscedasticity did not occur in the regression model. Thus, the regression model can be used for performing the test.
Results of Multiple Linear Regression Analysis
Multiple linear regression analysis was used to determine the relationship between the dependent variable (Reading Level Index/Writing level) and independent variables (Lexical Density, Gunning Fog Index, and
Reading Ease). Based on the results, the relationship can estimate a certain variable only when other variables are known. The regression equation is as follows:
Y = 5,621 + 0,271X1 + 0,641X2 + (-0,100)X3
Based on the equation, the following can be explained:
1. Constant (a) = 5,621. It indicates a value of constant, i.e. If variables Lexical Density (X1), Gunning Fog Index (X2), and Reading Ease (X3) = 0, then the Reading Level Index/writing level remains the same at 0,685.

Pertanika J. Soc. Sci. & Hum. 24 (S): 187 – 204 (2016)
Nurhayati, IK and Kurniasih, Nia
198
2. Coefficient X1 (b1) = 0,271. It indicates that the variable Lexical Density has positively affected the Reading Level Index/Writing Level. If variable Lexical Density increases by one unit and the other variables remain constant, the Reading Level Index/ Writing Level will increase by 0,271.
3. Coefficient X2 (b2) = 0,641. It indicates that the variable Gunning Fog Index has positively affected the Reading Level Index/Writing level. If the variable Gunning Fog Index increases by one unit and the other variables remain constant, the Reading Level Index/Writing standard will increase by 0,641.
4. Coefficient X3 (b3) = -0,100. It indicates that variable Reading Ease has negatively affected the Reading Level Index/Writing standard. If variable Reading Ease increases by one unit and the other variable remains constant, the Reading Level Index/Writing standard will decrease by 0,100.
Simultaneous Test (Test F)
This test determines whether there is a simultaneous effect between the independent variables (Lexical Density, Gunning Fog Index, Reading Ease) and the dependent variable (Reading Level Index/writing standard).
Table 6Result of Simultaneous Test
ANOVAa
Model Sum of Squares df Mean Square F Sig.
1Regression 531.800 3 177.267 42.933 .000b
Residual 227.092 55 4.129Total 758.892 58
a. Dependent Variable: Reading Level Indexb. Predictors: (Constant), Reading Ease, Lexical Density, Gunning Fog Index
Table 6 shows that the F count value is 42.933 with a significance level of 0.000. Therefore, in both calculations, the Fcount> Ftable (42.933> 2.772) and the significance level is 0.000<0.05. This shows that H0 was rejected and Ha was accepted, which means there was a significant difference between the three factors: Lexical Density,
Gunning Fog Index, and Reading Ease and Reading Level Index/writing standard simultaneously.
Partial Test (t Test)
The t test aimed to investigate if the independent variables (Lexical Density, Gunning Fog Index, and Reading Ease) partially affect the dependent variable (Reading Level Index/writing level).

Pertanika J. Soc. Sci. & Hum. 24 (S): 187 – 204 (2016)
Improving Academic Writing Standard
199
Table 7Result of Partial Test
Coefficients
ModelUnstandardized
CoefficientsStandardized Coefficients t Sig.
B Std. Error Beta
1
(Constant) 5.621 3.112 1.806 .076
Lexical Density .271 .040 .556 6.726 .000Gunning Fog Index .641 .158 .375 4.054 .000Reading Ease -.100 .035 -.252 -2.860 .006
a. Dependent Variable: Reading Level Index
Table 7 shows that:
1. The value of tcount for Lexical Density (X1) is bigger than the ttable, i.e. tcount (6.726) > ttable (2.004) and level of significance, 0,000 < 0,05. Thus, it can be concluded that partially there is a significant effect of Lexical Density (X1) on the Reading Level Index (Y).
2. The value of tcount for Gunning Fog Index (X2) is bigger than the ttable, i.e. tcount (4.054) > ttable (2.004) and level of significance, 0,000 < 0,05. Thus, it can be concluded that partially there is a significant effect of Gunning Fog Index (X2) on the Reading Level Index (Y).
3. The value of tcount for Reading Ease (X3) is smaller than ttable, i.e. tcount (-2.860) < ttable (2.004) and level of significance, 0,006 < 0,05. Based on the level of significance, it can be concluded that, partially, there is no significant difference for Reading Ease (X3) on the Reading Level Index (Y).
Size of Partial Effect
Analysis of the size of partial effect was conducted to determine to what extent each independent variable affected the dependent variable. The partial correlation analysis results are as follows:
Table 8Size of Partial Effect
Variables Standardized Coefficient Beta
Correlations Zero-Order
Magnitude of Partial Effect
Magnitude of Partial Effect (%)
Lexical Density (X1) .556 .646 .359 35,9%Gunning Fog Index (X2) .375 .673 .252 25,2%Reading Ease (X3) -.252 -.354 .090 9,0%Effects in Total .701 70,1%

Pertanika J. Soc. Sci. & Hum. 24 (S): 187 – 204 (2016)
Nurhayati, IK and Kurniasih, Nia
200
The size of partial effect was obtained by multiplying the standardised coefficient beta with zero-order. Table 4.5 shows that the partial effect of Lexical Density (X1) on Reading Level Index/writing level (Y) was 35.9%. The partial effect of Gunning Fog Index (X2) on Reading Level Index (Y) was 25.2%. The partial effect of Reading Ease (X3) on Reading Level Index (Y) was 9%. Thus, the total effects of Lexical Density, Gunning Fog Index, against Reading Level Reading Ease Index
together amounted to 70.1%. This is also apparent when viewed from the coefficient of determination.
Test Results of Determination Coefficient
The coefficient of determination was used to determine to what extent the independent variables (Lexical Density, Gunning Fog Index, and Reading Ease) affected the dependent variable (Reading Level Index/writing standard) based on R2 calculation. The results can be seen in the table below.
Table 9Test Result of Determination Coefficient
Model Summary
Model R R Square Adjusted R Square
Std. Error of the Estimate
1 .837a .701 .684 2.03198
a. Predictors: (Constant), Reading Ease, Lexical Density, Gunning Fog Indexb. Dependent Variable: Reading Level Index
Based on Table 9, the result shows that r2 was 0,701. The calculation for the determination coefficient, therefore, is as follows:
KP = 0,701 x 100% = 70,1%
This equation means the size of the effect of Lexical Density (X1), Gunning Fog Index (X2), and Reading Ease (X3) was 70,1%.
The present research shows that academics in Indonesia lack access to writing programmes or workshop or unable to afford editing services, which has
resulted in their manuscripts being handled by a number of ‘brokers’ before they reach publication stage (Lillis & Curry, 2006). The authors also mention two types of brokers, namely academic brokers, who focus on the content of research articles, and language brokers, who are more concerned with linguistic presentation.
A number of organisations, individual writers and researchers have benefited from the help of professional language brokers, editors or proofreaders, as their last resort to improve their writing prior to submission. Many of the respondents

Pertanika J. Soc. Sci. & Hum. 24 (S): 187 – 204 (2016)
Improving Academic Writing Standard
201
send their articles first to Indonesian proofreaders with sufficient English proficiency and considerable editorial experiences to correct articles; these articles are later sent to English native speakers whereby they benefit from further editing and proofreading. This has helped Indonesian academicians to improve the quality of their writing by minimising language and grammatical errors.
Based on the interview with the respondents, the editing process can be summarised as below: The editing process consists of four stages. In the first stage, the editor reviews the manuscript and corrects any surface-level issues, such as grammar and spelling, that could be easily fixed. In the second stage, the author and the editor
meet in person or hold an audio chat via Skype to review the entire manuscript again. In the third stage, the author then brings his/her manuscript to other players involved in the editing process such as his/her Ph.D. supervisor and colleagues for further editing. Before the author submits the final draft, at the final and fourth stage, editor reviews it one more time, suggesting some final touches when necessary.
Interviews with five (5) academicians whose articles were selected for the purpose of this study, show that they had gone through the processes of editing and proofreading with the help of a professional editor before they are approved for submission. The following result was obtained.
Table 10Revision Changes in the process of Editing and Proofreading
Sample Addition Deletion Substitution Rearrangement CorrectionTotal
Changes Made
1 33 41 25 21 36 156
2 29 22 16 31 29 127
3 14 19 13 21 38 105
4 26 31 11 17 29 114
5 11 26 7 11 23 78
Table 10 shows that editorial input or revision to the scientific papers include addition, deletion, substitution, rearrangement, and linguistic correction (morphemes, words, phrases, and clauses/sentences). Data showed a relatively similar
pattern between the five samples evaluated; most changes involved correction, which is slightly higher than deletions. Similarly, the addition of text is slightly higher than that of rearrangement.

Pertanika J. Soc. Sci. & Hum. 24 (S): 187 – 204 (2016)
Nurhayati, IK and Kurniasih, Nia
202
Figure 8. The Lowest Number of Occurrence
CONCLUSION
The low quality of articles or papers written by Indonesian academicians shows their limited mastery of English. This includes the choice of vocabulary or the number of vocabulary in a text, the number and diversity of vocabulary used in a text that can be measured through lexical density and reading levels or FOG Index of the text, an index of readability. The calculation of lexical density and readability involving words, number of clauses, and number of clause complex of the written texts have indicated that the papers written by the academicians to be presented or published in an international event are still not difficult.
Statistical calculations showed that the variables Lexical Density (X1), Gunning Fog Index (X2), and Reading Ease (X3) had significant effects on reading grades/writing standard, at 70.1%. The rest, however, has been affected by other factors not examined in this study.
Therefore, the researcher recommends that Indonesian academicians enhance the quality of their articles and improve
their capability in writing in English by improving their writing standard in terms of Lexical Density (X1), Gunning Fog Index (X2), and Reading Ease (X3). It is also recommended that universities facilitate and make the best effort to improve the quality of their human resources, namely the faculty members and researchers, in writing journal articles in English, hence the goal to keep up with other countries in terms of productivity of publications in internationally reputed journals can be reached. One possible solution to improving the quality of Indonesian academicians in terms of writing for international journal article is by seeking professional help from language editors and proof-readers who will perform the revisions and changes required before submissions.
REFERENCESBjörk, L., & Räisänen, C. (2003). Academic
Writing (3rd Ed). A University Writing Course. Copenhagen: Business School Press.
Courtis. J. K., & Hassan, S. (2002). Reading ease of bilingual annual reports. Journal of Business Communication, 39(4), 394-413.

Pertanika J. Soc. Sci. & Hum. 24 (S): 187 – 204 (2016)
Improving Academic Writing Standard
203
Davis, M. (1997). Scientific papers and presentations. San Diego, CA: Academic Press.
Day, R. A. (1983). How to write and publish a scientific paper. Philadelphia, PA: ISI Press.
Eggins, S. (1994). An introduction to system functional linguistics (pp. 60-61). London: Continuum.
Flesch, R. (1948). A new readability yardstick. Journal of Applied Psychology, 32(3), 221-233.
Flowerdew, J. (1999). Problems in writing for scholarly publication in English: the case of Hong Kong. Journal of Second Language Writing, 8, 243–264.
Gunning, R. (1952). The technique of clear writing. McGraww-Hill.
Halliday, M. A. K. (1985). Spoken and written language. Geelong Viet: Deakin University.
Janna, D., Wray, D., & Pope, M. (2011). Paradigms in Readability Research. In G. Socarrás & A. Medina (Eds.), Philological Research (pp. 91-102), Athens: Athens Institute for Educational Research.
Lillis, T., & Curry, M. J. (2010). Academic writing in a global context: the politics and practices of publishing in English (1st Ed.). Milton Park, Abingdon: Routledge.
Le, T., Yue, Y., & Le, Q. (2011). Linguistic complexity and its relation to language and literacy education. New York: Nova Science Publishers, Inc.
Moore, R. A. (2000). Preservice Teachers Explore their Conception of the Writing Process with Young Pen Pals. Reading Research and Instruction 40(1), 17-33
Murray, R. (2013). Writing for academic journals (3rd Ed.). Maidenhead: McGraw-Hill International.
Murray, R., & Moore, S. (2006). The Handbook of Academic Writing. Maidenhead: Open University Press.
O’Loughlin, K. (1995). Lexical density in candidate output on two versions of an oral proficiency test (pp. 26-28). Melbourne Papers in Language Teaching.
Sampson, J. P. Jr., Driscoll, M. P., & Carroll, P. S. (2010). Guidelines for writing promotion and tenure letters for faculty members. Tallahassee, FL: Florida State University, Office of the Dean of the Faculties.
Sunol, R., & Saturno, P. (2008). Challenge to overcome language barriers in scientific journals: Announcing a new initiative from the ISQua journal [Editorial]. International Journal for Quality in Health Care, 20(1), 1-2
Ure, J. (1971). Lexical density and register differentiation. Applications of Linguistics, 443-452.
Zamanian, M., & Heydari, P. (2012). Readability of texts: state of the art. Theory and Practice in Language Studies, 2(1), 43-53.
