improvement of planosol solum: part 2, optimization of design of roll-in ploughs in soil bin...
TRANSCRIPT
J . agric . Engng Res . (1996) 63 , 261 – 268
Improvement of Planosol Solum : Part 2 , Optimization of Design of Roll-In Ploughs in Soil Bin Experiments
K . Araya ; * M . Kodho ; * D . Zhao ; † F . Liu ; † H . Jia †
*Environmental Science Laboratory , Senshu University , Bibai , Hokkaido 079-01 , Japan † Heijian Agricultural Research Institute , Jiamusi , Heilongjiang , People’s Republic of China
( Recei y ed 1 0 April 1 9 9 5 ; accepted in re y ised form 1 6 No y ember 1 9 9 5 )
Soil bin tests were conducted in Japan to optimize the shape of a roll-in plough which was an improved form of the stand-up plough reported in Part 1 of this paper , for soil mixing of the second (Aw) and third (B) horizons to improve the planosol solum in China , leaving the first (Ap) horizon undisturbed . The stand- up type plough consisted of three plough bodies and had the least draught and gave good soil mixing in the work reported in the Part 1 paper . In order to improve the stand-up plough , the optimum radius of curvature of the mouldboard , the plough height and the working depth to achieve greater soil mixing , were determined with half-size model ploughs .
The results showed that with the roll-in type of plough , there was a relation between the radius of curvature of the mouldboard , the plough height and the working depth to cause soil mixing by rolling in . Using half-size model ploughs , with a working depth of 200 mm (Aw horizon 100 mm 1 B horizon 100 mm) , the best soil mixing was obtained when the height of the first plough body was 210 mm , the radius of curvature was 140 mm , the height of the second plough body was 250 mm and the radius of curvature was 167 mm . ÷ 1996 Silsoe Research Institute
1 . Introduction
In the field tests of Zhao et al . 1 and Araya’s soil investigations , 2 the improvement of planosol solum was achieved by mixing the Aw and B horizons in a one to one ratio underground leaving the Ap horizon undisturbed . In the Part 1 paper , 3 a stand-up plough and a drop-down plough were found to be ef fective for soil mixing . This paper deals with improvement of the stand-up plough , where furrow slices were simply stood up at 90 deg , through the development of a roll-in type plough whereby the furrow slices are rolled in and mixed up more on the mouldboard to obtain better soil mixing . The tests were made in a soil bin with half-size model ploughs .
Notation
F x horizontal force , draught , kN H plough height , mm
M x mixing rate [(no mixing) 0 # M x # 1 (perfect mixing)]
R r rolling rate R curvature radius of mouldboard , mm
F AW 5 B transfer rate [(no transfer ) 0 # T AW 5 B # 1 (perfect transfer)]
b operational cutting width , mm h operational depth , mm n number of clods s i distance between a clod and another
clod ( i 5 1 2 k ) , mm w soil moisture , %d . b . b angle of slip surface , deg w angle of soil – interface friction , deg d angle of soil – metal friction , deg z throwing angle , deg c angle of normal line , deg
2 . Experimental details
Laboratory plough tests were conducted in a mov- able soil bin which has been described in the Part 1 paper . 3 The soil in the soil bin was pseudogley soil which is a Japanese heavy clay . Soil moisture was controlled at about 22% d . b ., near the plastic limit . The mechanical properties of pseudogley soil and planosol solum are given in the Part 1 paper . 3 In order to determine the rate of soil rolling , the refuse of buckwheat was spread on the soil surface before ploughing . The soil was tilled by one plough and then a photograph of the tilled soil surface was taken . The soil rolling rate , R r is defined as the area of non-white
261 0021-8634 / 96 / 030261 1 08 $18 . 00 / 0 ÷ 1996 Silsoe Research Institute
K . A R A Y A E T A L . 262
soil surface / total travel area of the plough in the photograph .
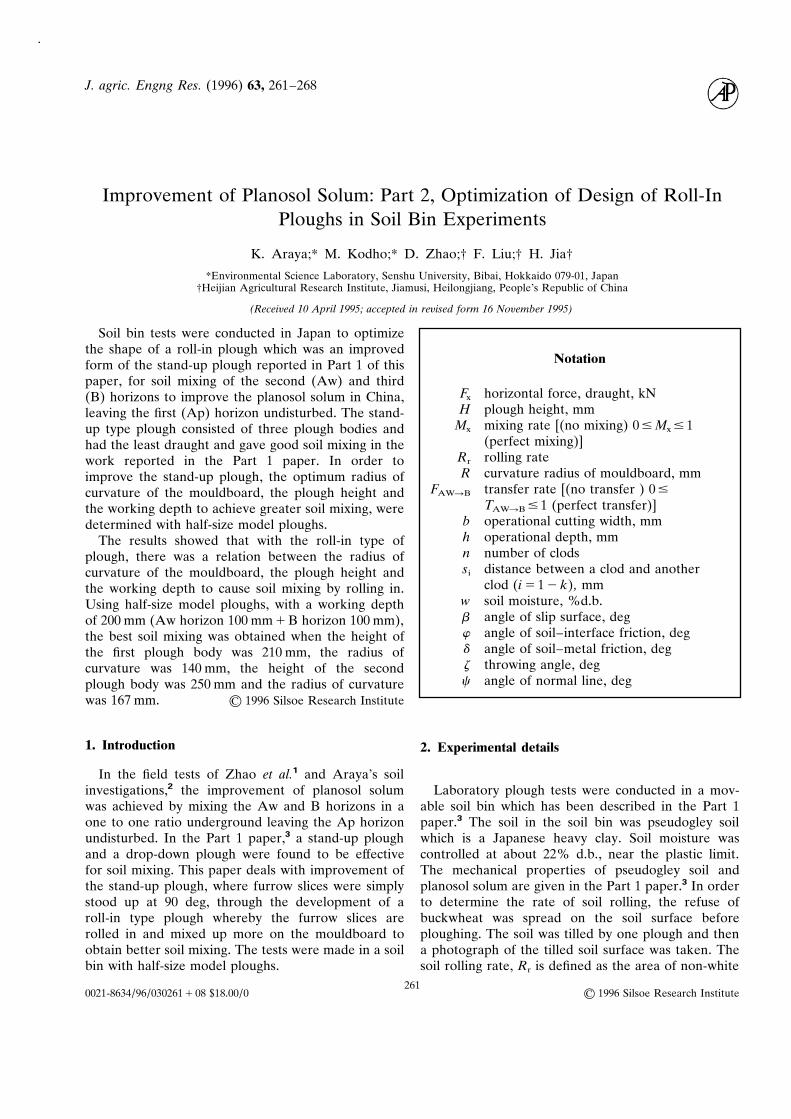
In the Part 1 paper , 3 the stand-up plough which consists of three plough bodies was developed . Here , the stand-up plough was improved , and long slat blades shown in Fig . 1 with a special curve similar to that of bulldozers blades were used for the mould- board which facilitates rolling-in of the soil . The ploughs in Fig . 1 are all half-scale models ; as with the model texts reported in the Part 1 paper , 3 the mould- board body (third body in Fig . 1 ) to till the Ap horizon was not included in the soil bin tests .
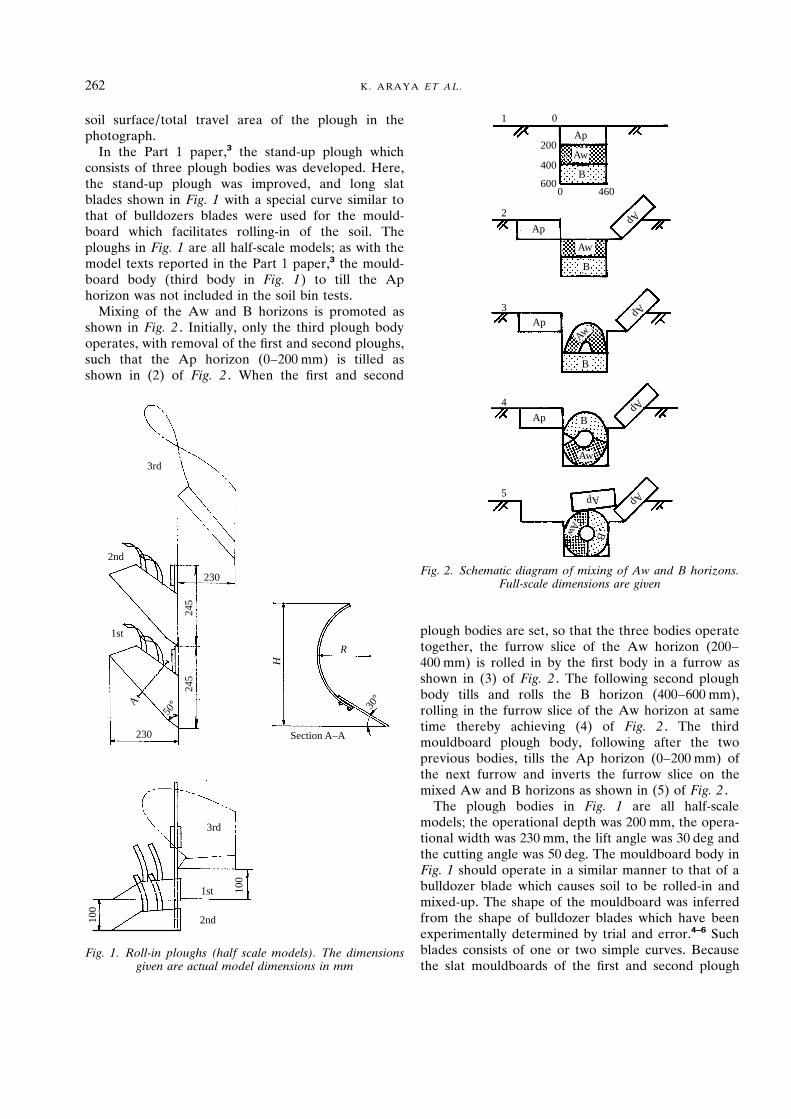
Mixing of the Aw and B horizons is promoted as shown in Fig . 2 . Initially , only the third plough body operates , with removal of the first and second ploughs , such that the Ap horizon (0 – 200 mm) is tilled as shown in (2) of Fig . 2 . When the first and second
3rd
2nd
230
1st
R
230
3rd
2nd
1st 100
100
Section A–A
30°
H
50°A
245
245
Fig . 1 . Roll - in ploughs ( half scale models ) . The dimensions gi y en are actual model dimensions in mm
1 0
200
400
600
Ap
Aw
B
0 460
Ap
Aw
B
Ap
Aw
B
Ap
Aw
B
Ap
Aw B
ApAp
ApAp2
3
4
5
Fig . 2 . Schematic diagram of mixing of Aw and B horizons . Full - scale dimensions are gi y en
plough bodies are set , so that the three bodies operate together , the furrow slice of the Aw horizon (200 – 400 mm) is rolled in by the first body in a furrow as shown in (3) of Fig . 2 . The following second plough body tills and rolls the B horizon (400 – 600 mm) , rolling in the furrow slice of the Aw horizon at same time thereby achieving (4) of Fig . 2 . The third mouldboard plough body , following after the two previous bodies , tills the Ap horizon (0 – 200 mm) of the next furrow and inverts the furrow slice on the mixed Aw and B horizons as shown in (5) of Fig . 2 .
The plough bodies in Fig . 1 are all half-scale models ; the operational depth was 200 mm , the opera- tional width was 230 mm , the lift angle was 30 deg and the cutting angle was 50 deg . The mouldboard body in Fig . 1 should operate in a similar manner to that of a bulldozer blade which causes soil to be rolled-in and mixed-up . The shape of the mouldboard was inferred from the shape of bulldozer blades which have been experimentally determined by trial and error . 4–6 Such blades consists of one or two simple curves . Because the slat mouldboards of the first and second plough
I M P R O V E M E N T O F P L A N O S O L S O L U M : P A R T 2 263
bodies are much smaller than a bulldozer blade , the curve of the plough mouldboard consists of one radius R only .
Seven slat blades with dif ferent heights H in the range of 55 to 275 mm were designed . Two or three tests were carried out for each combination of parameters .
The relation between the radius of curvature of each mouldboard and the plough height was deter- mined by the following analysis .
3 . Analysis of soil rolling-in
The object is to design the first and second plough bodies , through determination of the relations bet- ween the radius of curvature of the mouldboard R , the working depth h and the plough height H ( Fig . 1 ) to cause soil rolling . The process of soil rolling , can be analysed as follows .
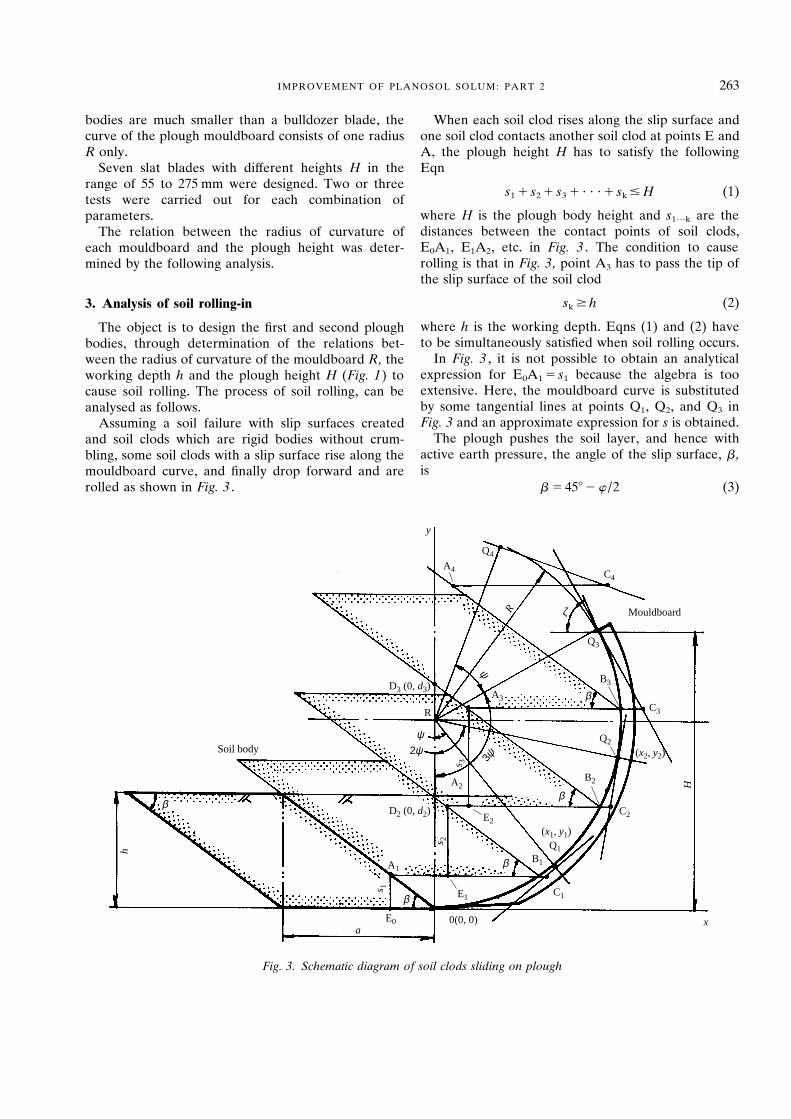
Assuming a soil failure with slip surfaces created and soil clods which are rigid bodies without crum- bling , some soil clods with a slip surface rise along the mouldboard curve , and finally drop forward and are rolled as shown in Fig . 3 .
When each soil clod rises along the slip surface and one soil clod contacts another soil clod at points E and A , the plough height H has to satisfy the following Eqn
s 1 1 s 2 1 s 3 1 ? ? ? 1 s k # H (1)
where H is the plough body height and s 1 ??? k are the distances between the contact points of soil clods , E 0 A 1 , E 1 A 2 , etc . in Fig . 3 . The condition to cause rolling is that in Fig . 3 , point A 3 has to pass the tip of the slip surface of the soil clod
s k $ h (2)
where h is the working depth . Eqns (1) and (2) have to be simultaneously satisfied when soil rolling occurs .
In Fig . 3 , it is not possible to obtain an analytical expression for E 0 A 1 5 s 1 because the algebra is too extensive . Here , the mouldboard curve is substituted by some tangential lines at points Q 1 , Q 2 , and Q 3 in Fig . 3 and an approximate expression for s is obtained .
The plough pushes the soil layer , and hence with active earth pressure , the angle of the slip surface , b , is
b 5 45 8 2 w / 2 (3)
y
D3 (0, d3)
A4
Mouldboard
Q4
C4
Q3
A2
E2
B1
Q1
C1
C2
B2
Q2
B3
C3
Soil body
D2 (0, d2)
E1
(x1, y1)
β
β
β
aE0
A1
0(0, 0) x
(x2, y2)
β
2ψψ
R
ζR
ψ
3ψs 3
s 2
s 1
H
h
β
A3
Fig . 3 . Schematic diagram of soil clods sliding on plough

K . A R A Y A E T A L . 264
where f is the angle of soil – interface friction . The number of soil clods , n , on the mouldboard is
approximately predicted by the following equation which was determined experimentally by soil bin tests
n 5 INT h ( R / h ) 1 2 j (4)
Function INT means an integer . With a throwing angle , z , of 60 deg (Ref . 5) at the
end of mouldboard in Fig . 3 , the plough height , H is
H 5 R S cot z
4 1 1 cot 2 z 1 1 D (5)
The angle of each normal line to the tangential lines at Q 1 , Q 2 and Q 3 is
c 5 120 8 / n (6)
where c is the angle of the normal line at points Q 1 , Q 2 and Q 3 .
The normal line RQ 1 is obtained as follows
y 5 2 x cot c 1 R (7)
The coordinate ( x 1 , y 1 ) of point Q 1 are
x 1 5 – R 2
1 1 cot 2 c (8)
y 1 5 2 cot c – R 2
1 1 cot 2 c 1 R
The x coordinate of point A 1 is
x 5 2 s 1
tan b (9)
The x coordinate of point C 1 is on a tangential line through point Q 1
x 5 R 2 2 ( y 1 2 R )( s 1 2 R )
x 1 (10)
Assuming A 1 B 1 5 a is nearly same as A 1 C 1 on the tangential line , the following equation is obtained
H R 2 2 ( y 1 2 R )( s 1 2 R ) x 1
1 s 1
tan b 1 a J
3 H R 2 2 ( y 1 2 R )( s 1 2 R ) x 1
1 s 1
tan b 2 a J 5 0 (11)
where a 5 h cot b (see Fig . 3 ) . With a $ 0 , s 1 $ 0
s 1 5 tan b h ax 1 2 R 2 2 R ( y 1 2 R ) j
x 1 2 ( y 2 R ) tan b (12)
With line A 2 B 1 . A 2 C 1 , the equation of A 2 C 1 can be obtained as
y 5 2 x tan b 1 d 2 (13)
where d 2 is the y coordinate of point D 2 . From Eqn (10) , the coordinates of point C 1 can be
obtained as
C 1 S R 2 2 ( y 1 2 R )( s 1 2 R ) x 1
, s 1 D (14)
[ s 1 5 2 R 2 2 ( y 1 2 R )( s 1 2 R )
x 1 tan b 1 d 2
Therefore , the equation of line A 2 C 1 is
y 5 2 x tan b 1 s 1 1 R 2 2 ( y 1 2 R )( s 1 2 R )
x 1 tan b (15)
As above , any normal lines RQ k are obtained from Eqn (7) as
y 5 2 x cot k c 1 R (16)
where k is 1 , 2 , 3 ? ? ? etc . The tangential lines through point Q k ( x k , y k ) are
x k x 1 ( y k 2 R )( y 2 R ) 5 R 2 (17)
The coordinates Q k ( x k , y k ) of point Q k are
x k 5 – R 2
1 1 cot 2 k c , y k 5 R 2 cot k c – R 2
1 1 cot 2 k c
(18)
The x coordinate of point A k is
x 5 1
tan b H R 2 2 ( y k 2 1 2 R )( s 1 1 s 2 1 ? ? ? 1 s k 2 1 2 R )
x k 2 1
3 tan b 2 s k J (19)
The x coordinate of point C k is
x 5 R 2 2 ( y k 2 R )( s 1 1 s 2 1 ? ? ? 1 s k 2 1 2 R )
x k (20)
Therefore , the values of s k can be obtained as
s k 5 tan b
x k 2 ( y k 2 R ) tan b
3 F ax k 2 R 2 1 ( y k 2 R )( s 1 1 s 2 1 ? ? ? 1 s k 2 1 2 R )
1 x k h R 2 2 ( y k 2 1 2 R )( s 1 1 s 2 1 ? ? ? 1 s k 2 1 2 R ) j
x k 2 1 G (21)
when k 5 1 , x 0 5 ̀ , y 0 5 0 and s 0 5 0 . If the working depth h to be tilled is given , the num-
ber of soil clods n can be estimated by substituting

I M P R O V E M E N T O F P L A N O S O L S O L U M : P A R T 2 265
any radius R into Eqn (4) . With throwing angle z , the plough height H is obtained from Eqn (5) , and then the angle c of the normal line can be obtained from Eqn (6) .
First , the contact point s 1 of the first clod is obtained from Eqns (7) to (14) and then , with this result , the contact points s 2 , s 3 ? ? ? of the second and the third clods are obtained from Eqns (16) to (21) . Substituting these values into Eqn (1) gives the plough height H . It needs to be confirmed , that the plough height H determined by Eqn (5) is larger than that given by Eqn (2) .
4 . Results and discussion
4 . 1 . Cur y ature radius , plough height and working depth to cause soil rolling
The condition for soil rolling , that is , the relation between the radius of curvature of the mouldboard , R , the plough height , H , and the working depth , h predicted by Eqns (1) to (21) is shown in Fig . 4 . The
relation between the three variables is expressed by a curved surface . For instance , a plough with R 5 50 mm and H 5 75 mm can roll soil up to h 5 20 mm , but at larger working depths than 20 mm , soil rolling would not be caused . As above , the limit h is 50 mm for a plough with R 5 80 mm and H 5 120 mm , h 5 70 mm for a plough with R 5 100 mm and H 5 150 mm and h 5 120 mm for a plough with R 5 140 mm and H 5 210 mm . The following soil bin tests were conducted to test these theoretical results .
The soil rolling rate of each plough was measured by varying the working depth as shown in Fig . 5 . A plough with a radius of curvature of R 5 140 mm and a plough height of H 5 210 mm could roll soil up to a working depth of h 5 120 mm but at working depths greater than 120 mm , soil went over the plough without rolling and hence , the soil rolling rate was less than one . The limit h was 60 mm for a plough with R 5 100 mm and H 5 150 mm ; the limit h was only 20 mm for a plough with R 5 80 mm and H 5 120 mm . With a plough with R 5 50 mm and H 5 75 mm , soil could not be rolled at any working depth .
Based on Figs 4 and 5 , the measured limits of
Limit of workingdepth to roll-in
200
Plo
ugh
heig
ht H, m
m
150
100
50
150
100
50
Mouldboard radius R, m
m
50
100
150
Working depth h, mm
Fig . 4 . Theoretical relation between mouldboard radius of cur y ature ( R ) , plough height ( H ) and working depth ( h ) to cause soil rolling - in

K . A R A Y A E T A L . 266
1.0
00
Working depth h, mm
Soi
l rol
ling
rate
Rr
50
0.5
100 150 200
R = 80H = 120
Lim
it h
Lim
it h
Lim
it h
R = 100H = 210
R = 140 mmH = 210 mm
R = 50H = 75
Fig . 5 . Soil rolling rate for dif ferent ploughs as a function of working depth . Soil moisture content w 5 2 1 ? 5 % d .b .
working depths were 10 to 20 mm smaller than the predicted ones . This was because , in the analysis of Fig . 3 , the clods moving on the mouldboard were assumed not to be crumbled ; however , the clods were actually crumbled , and hence the soil movement could be controlled by the mouldboard only at the smaller working depths .
4 . 2 . Soil mixing and transfer rates and draught
Two plough bodies were used to mix the Aw and B horizons . Based on the results of Figs 4 and 5 , the first plough body height , H 1 , should be 210 mm to roll the soil because the working depth is 100 mm . Here , by varying the second plough body height , H 2 , from 55 to 275 mm , the draught , mixing and transfer rates were determined as shown in Fig . 6 . The definitions of mixing and transfer rates are given in Part 1 (Ref . 3) . The working depth of the second plough is the depth of the B horizon of 100 mm in an ideal case such as Fig . 2 but is actually more than 100 mm because of the crumbling of the Aw horizon .
The draught of the first plough body alone is shown in Fig . 6 c and was 1 ? 2 kN . The second plough body penetrated into the soil , such as subsoilers do , when the second plough body height was smaller than 150 mm , and a triangular cavity was produced at the plough trace as shown in Fig . 7 a . Consequently , the soil mixing rate was about 0 ? 2 ( Fig . 6 b ) and little soil mixing was obtained . The transfer rate was about 0 ? 1 as shown in Fig . 6 a . When the second plough height ,
1.0
0
Tra
nsfe
r ra
te T A
w→
B
0.5
1.0
0
Mix
ing
rate
Mx
0.5
300
4
00
2nd plough height H2, mm
Dra
ught
Fx,
kN
200100
2 1st plough body
1st + 2nd plough bodies
Penetration No flow
Standing Rolling-up in
(a)
(b)
(c)
Fig . 6 . Draught , mixing rate and transfer rate as a function of height of the second plough body . First plough body : h 1 5 1 0 0 mm , H 1 5 2 1 0 mm . Second plough body : h 2 5
1 0 0 mm . Soil : w 5 2 1 ? 5 % m .c .d .b . and f 5 4 9 8
H 2 , was 150 to 200 mm , the furrow slice was made to stand up and was turned 90 deg in the furrow . The total draught of the first and second ploughs was decreased , the mixing rate was increased to 0 ? 5 and 0 ? 7 , and the transfer rate was also increased to 0 ? 3 to 0 ? 4 . When the second plough height , H 2 , was 200 to 250 mm , rolling of the furrow slice occurred on the mouldboard and the draught was increased more than when the furrow slice stood up . This was because when the furrow slice was standing up , it left the mouldboard , but when the furrow slice was rolled , it

I M P R O V E M E N T O F P L A N O S O L S O L U M : P A R T 2 267
Fig . 7 . Soil sections after ploughing : ( a ) H 1 5 2 1 0 mm , H 2 5 5 5 mm ; ( b ) H 1 5 2 1 0 mm , H 2 5 2 5 0 mm
held on to the plough for a longer period . However , the mixing rate here was increased further to about 0 ? 9 and the transfer rate became 0 ? 5 . This soil displacement at the rear of the plough is shown in Fig . 7 b , and the soil was rolled by the second plough body . When the plough height , H 2 , was more than 250 mm , the draught was sharply increased , and the mixing and transfer rates were sharply decreased . This was be- cause the clearance between the tip of the mould- board and the furrow wall became too small ; the soil rolled by the second plough remained permanently on
the second plough and did not flow into the plough trace .
Consequently , the best soil mixing rate was ob- tained when the height of the first plough was 210 mm , the curvature radius was 140 mm , the second plough height was 250 mm , and the curvature radius was 167 mm from Eqn (5) or Fig . 6 .
Because of the half-size model plough tests , a scale factor should be considered when the results of the model plough tests are applied to prototype ploughs . If the soil is the same and hence mechanical properties are the same , the operating depth is doubled and all scales become doubled and soil clods with the same shape on a doubled scale will be produced as in Fig . 3 because the angle of the slip surface , b is the same . Hence , the geometric relations are the same as those in the model tests and the scale factor between the model and the prototype ploughs will be unity , if the ef fect of travel velocity is not considered .
5 . Conclusions
1 . The condition for soil rolling to take place was examined theoretically and relations between the curvature radius of the mouldboard , R , the plough height , H , and the working depth , h were derived and shown graphically .
2 . The second plough body penetrated into the soil such as subsoilers do when the second plough height was smaller than 150 mm , and a triangular cavity was produced at the plough trace . Consequently , the soil mixing rate was about 0 ? 2 , and little soil mixing was obtained . The transfer rate was about 0 ? 1 .
3 . When the second plough body height was 150 to 200 mm , the furrow slice was made to stand up and was turned 90 deg in the furrow . The total draught of the first and second ploughs was decreased , the mixing rate was increased to 0 ? 5 to 0 ? 7 , and the transfer rate was also increased to 0 ? 3 to 0 ? 4 .
4 . When the second plough body height was 200 to 250 mm , the furrow slice was rolled on the mould- board and the draught was increased more than when the furrow slice was stood up . This was because when the furrow slice was standing up , it left the mould- board , but when the furrow slice was rolled , it was held on to the plough body for a longer period . However , the mixing rate here was increased further to about 0 ? 9 and the transfer rate 0 ? 5 .
5 . When the second plough body was more than 250 mm , the draught was sharply increased , and the mixing and transfer rates were sharply decreased . This was because the clearance between the tip of the mouldboard and the furrow wall became too small ;

K . A R A Y A E T A L . 268
the soil rolled by the second plough body remained permanently on the second plough body and did not flow into the plough trace .
6 . The best soil mixing rate was obtained when the height of the first plough body was 210 mm , the curvature radius was 140 mm , the second plough body height was 250 mm , and the curvature radius was 167 mm .
References 1 Zhao D ; Liu F ; Jia H Transforming constitution of
planosol solum . Journal of Chinese Scientia Agricultural Sinica 1989 , 22 (5) : 47 – 55
2 Araya K Influence of particle size distribution in soil compaction of planosol (Bai Jiang Tu) solum . Journal of Environmental Science Laboratory , Senshu University 1991 , 2 : 181 – 192
3 Araya K ; Kudoh M ; Zhao D ; Liu F ; Jia H Improvement of planosol solum : Part 1 , Experimental equipment and methods and preliminary soil bin experiments . Journal of Agricultural Engineering Research , 1996 , 63 : 251 – 260
4 Fujimoto Y Draught of bull-dozer blades with sand . Transactions of Construction Machines , 20th anniver- sary 1984 , 98 – 105
5 Nakajima M Development of lined blades . Journal of Komatsu Industries 1980 , 26 (4) : 12 – 23
6 Torihi T Capacity of bull-dozer blades . Journal of Komatsu Industries 1969 , 5 (4) : 42 – 51