improvement of in-service inspection in nuclear power · pdf fileiaea-tecdoc-1400 improvement...
TRANSCRIPT

IAEA-TECDOC-1400
Improvement of in-serviceinspection in nuclear power plants
July 2004

IAEA-TECDOC-1400
Improvement of in-serviceinspection in nuclear power plants
July 2004

The originating Section of this publication in the IAEA was:
Nuclear Power Engineering Section International Atomic Energy Agency
Wagramer Strasse 5 P.O. Box 100
A-1400 Vienna, Austria
IMPROVEMENT OF IN-SERVICE INSPECTION IN NUCLEAR POWER PLANTS IAEA, VIENNA, 2004 IAEA-TECDOC-1400 ISBN 92–0–108104–9
ISSN 1011–4289 © IAEA, 2004
Printed by the IAEA in Austria July 2004

FOREWORD
In-service inspection (ISI) is an important measure for assurance of equipment integrity and the avoidance of failure and thus a key tool in the management of nuclear power plant safety and lifetime. Inspection qualification is pursued in most nuclear power countries: the majority of the nuclear power plant operating countries, both developed and developing, have established their qualification infrastructure or are in the process of establishing it. Considerable experience on technical, organizational, regulatory and economic aspects of inspection qualification has been accumulated. The associated experience with risk informed inspection is rapidly increasing. Risk informed ISI is one of most successful applications of risk informed decision making technology in nuclear power plants. If properly implemented, risk informed in-service inspection programmes can lead to the improvement of plant safety and to the optimization of ISI resources utilization; the latter usually means cost reduction.
This TECDOC was prepared within the scope of the IAEA’s programme on Nuclear Power Plant Operating Performance and Life Cycle Management. The publication describes strategies for improving the effectiveness of ISI. The role of in-service inspection in maintaining or improving safety and the relationship of ISI improvement to cost are examined. The strategies for improving ISI effectiveness discussed in this document consider the entire framework of in-service inspection including effective selection of the proper inspection scope, inspection interval and effectiveness.
The IAEA wishes to thank all the participants and their Member States for their valuable contributions to this publication. The IAEA officers responsible for this publication were P. Trampus and H. Cheng of the Division of Nuclear Power.

EDITORIAL NOTE
The use of particular designations of countries or territories does not imply any judgement by the publisher, the IAEA, as to the legal status of such countries or territories, of their authorities and institutions or of the delimitation of their boundaries.
The mention of names of specific companies or products (whether or not indicated as registered) does not imply any intention to infringe proprietary rights, nor should it be construed as an endorsement or recommendation on the part of the IAEA.
CONTENTS1. INTRODUCTION.................................................................................................................. 1
1.1. Purpose ............................................................................................................................ 1 1.2. Scope ............................................................................................................................... 2
2. ISI EFFECTIVENESS ........................................................................................................... 32.1. Short review of past ISI................................................................................................... 3 2.2. Relevance of ISI effectiveness ........................................................................................ 5
2.2.1. Steam generator tubing......................................................................................... 5 2.2.2. RPV head penetrations ......................................................................................... 5 2.2.3. Austenitic weldments ........................................................................................... 62.2.4. Reactor internals................................................................................................... 6
2.3. Basic elements of ISI effectiveness................................................................................. 6 2.4. Relation of the basic elements of ISI effectiveness to structural integrity assessment ... 6 2.5. Relation of the basic elements of ISI effectiveness to cost ............................................. 7
2.5.1. Radiation dose considerations .............................................................................. 7 2.5.2. Relation of selection of scope with cost ............................................................... 7 2.5.3. Relation of NDE effectiveness with cost.............................................................. 92.5.4. Relation of NDE effectiveness with inspection interval .................................... 10
2.6. Criteria for NDE effectiveness ...................................................................................... 11 2.6.1. Criteria for status assessment ............................................................................. 11 2.6.2. Criteria for trending assessment ......................................................................... 12
2.7. Conclusive remarks to the aspects of ISI effectiveness ................................................ 13
3. OVERVIEW OF RISK-INFORMED INSPECTION.......................................................... 13 3.1. History of risk-informed inspection .............................................................................. 13
3.1.1. History of risk-informed inspection in Europe................................................... 13 3.1.2. History of risk-informed inspection in the USA ................................................ 14
3.2. Objectives of risk-informed inspection ......................................................................... 14 3.3. Consequence assessment............................................................................................... 14 3.4. Failure potential assessment.......................................................................................... 15 3.5. Risk ranking .................................................................................................................. 16 3.6. Risk impact assessment ................................................................................................. 16
4. DISCUSSION OF THE MASTER DIAGRAM .................................................................. 16
5. ISI EFFECTIVENESS IN VIEW OF THE MASTER DIAGRAM .................................... 24 5.1. Reconsidering ISI scope in connection with NDE effectiveness ................................. 24 5.2. The concept of the "unknown" ..................................................................................... 25
6. STRATEGIC CONSIDERATIONS .................................................................................... 26
7. CONCLUSIONS.................................................................................................................. 27
REFERENCES......................................................................................................................... 29
GLOSSARY............................................................................................................................. 31
ABBREVIATIONS.................................................................................................................. 33
CONTRIBUTORS TO DRAFTING AND REVIEW ............................................................. 35

1. INTRODUCTION
During the nuclear power plant’s (NPPs) operating lifetime, the operating organisation should examine the systems, structures and components (SSCs) for possible deterioration so as to determine whether they are acceptable for continued safe operation or whether remedial measures should be taken [1, 2]. In-service inspection (ISI) provides the systematic framework for these examinations. An effective ISI programme ensures both that the safety of the plant is not adversely affected after the commencement of operation and that the levels of reliability and availability of all plant SSCs remain in accordance with the assumptions and intent of the design and, consequently, a cost effective electricity generation is guaranteed.
This report was prepared under one of the IAEA projects, “Integrated NPP life cycle management including decommissioning”. The main objective of an integrated life cycle management programme is to enable NPPs to compete, without compromising safety, successfully in the changing energy markets throughout their service life and to facilitate life extension and eventual decommissioning through improved engineering, technological, economic and managerial actions. The Technical Working Group on NPP Life Management and other advisory groups nominated by the Member States provide recommendations on high priority needs of Member States in this area.
Two preceding standard publications in this field are the IAEA Safety Standard Series No. NS-R-2 entitled Safety of Nuclear Power Plants: Operation, which establishes, inter alia, the requirements about ISI that must be met to ensure safety; and the IAEA Safety Standard Series No. NS-G-2.6 entitled Maintenance, Surveillance and In-Service Inspection in Nuclear Power Plants, which recommends, inter alia, actions, conditions, and procedures regarding the ISI for meeting safety requirements. They supersede the Code on the Safety of Nuclear Power Plants: Operation, which was issued in 1988 as Safety Series No. 50-C-O (Rev.1) and three past IAEA Safety Guides: In-Service Inspection for Nuclear Power Plants, Safety Series No. 50-SG-O2 (1980); Maintenance of Nuclear Power Plants, Safety Series No. 50-SG-O7(1990);and Surveillance of Items Important for Safety in Nuclear Power Plants, Safety Series No. 50-SG-O8(1990). There are three TECDOCs in this field as well: Safety Series No. 50-P-2 entitled In-Service Inspection of Nuclear Power Plants: a Manual, the IAEA-EBP-WWER-11 entitled Methodology for Qualification of In-Service Inspection Systems for WWER Nuclear Power Plants and the IAEA Training Course Series No. 9 entitled Non-Destructive Testing: A Guidebook for Industrial Management and Quality Control Personnel.
1.1. PURPOSE
The purpose of this TECDOC is to:
• discuss and evaluate the status of ISI and its evolution in NPPs of IAEA Member States; • discuss and evaluate the criteria for effective ISI and the constitutive elements; • discuss and evaluate the implication of the introduction of risk informed ISI (RI-ISI)
concepts; • generate a common recommendation as to how to benefit from utilising the potential of
RI-ISI concepts for further development and, possibly, improvement of ISI effectiveness.
1

The specific concept of this report is to treat the two key issues, i.e. inspection qualification and RI-ISI, and their complementarities, to define fields and the logistics of their interaction and to assess the impact of such concepts on NPP life management.
The intention of this TECDOC is to further the exchange of information in order to achieve increasing harmonisation in the areas of ISI effectiveness, ISI practices, and of ISI Codes and Standards, thereby achieving a higher level of safety and reliability in NPP operation. The publication presents a rationale for ISI, taking into account risk informed assessment methodology (N.B. This rationale is valid for all NPPs irrespective of their type or age). The benefit from the application of this rationale is seen by the enhanced safety and the increased competitiveness of the operation of NPPs.
This TECDOC is intended for all institutions and individuals involved in ISI such as: • Utilities/NPPs, • Safety authorities, • Research and academic organisations, • Technical support organisations (TSOs), • System vendors, • ISI vendors, • Insurance companies.
However, it also addresses those organisations and individuals having interaction with ISI and working in the following areas:
• Structural integrity and component reliability, • Maintenance, repair and replacement, • Provision of parts and components for NPPs, • Plant operation and management. This report will also be suitable for providing briefing material for those taking decisions regarding ISI technically and financially, therefore directly involved in decisions implying risk.
1.2. SCOPE
The scope of this report encompasses non-destructive examination (NDE) itself as a fundamental part of ISI with regard to its feasibility and capability and its proof by qualification. It also discusses the technical disciplines having interaction with NDE as well as those models and criteria without involving NDE, but having influence on the process of risk informed assessment on the whole:
• NDE methodology, potential, performance and effectiveness, • Optimisation of NDE methodology, • ISI qualification, • ISI results and experience, • Unexpected phenomena, • Design, fabrication and operation, • Operational experience, • Code requirements,
2

• Assessment methodologies, • Integral structural integrity assessment, • Assessment of the probability of failure (without considering ISI), • Safety and/or cost consequences of failure including defence-in-depth consideration, • Code classification of components or component areas.
2. ISI EFFECTIVENESS
2.1. SHORT REVIEW OF PAST ISI
For entering into the domain of definitive considerations and recommendations for the improvement of ISI effectiveness, the status of ISI practices should be assessed in order to know whereupon to build. For this understanding some generally valid conclusions should be drawn from the history of practices based on ISI codes, their performance and especially the conclusions to be drawn from their shortcomings.
Generally the following observations with regard to ISI codes of the seventies to the mid-eighties can be made:
(1) A rigid safety classification of the components of an NPP was based on general experience with the operation of conventional vessels and plants.
(2) The ISI intervals were in a fixed periodicity, varying from Code to Code requirements. (3) The ISI scope encompassed:
• Generally all weldments of the reactor pressure vessel (RPV), within the fixed interval.
• Selected welds and other areas of the components classified as safety-related according to the state of the art information at that time.
There are three different procedures to define an ISI program: - Randomly sampled; - Damage oriented; - Risk-informed.
The first procedure is based on a sampling percentage of inspected welds (e.g. 25% for class 1, 7.5 % for class 2 piping…). In this case the ISI performance (e.g. target detectable defect) is based on standard codified values (like 10% of the wall thickness…). The second one considers only the potential degradation mechanism, without any consequence of break ranking; all the consequences are considered as high. The third one adds consequence of break to the damage oriented safety (or cost); this one needs to use in one hand some component reliability and in the other hand the consequences of leak or break on the plant safety.
(4) With regard to the NDE, a prescriptive code regulated the sensitivity calibration, recording and acceptance level by the application of mere amplitude criteria when using ultrasonic (UT) methodology. The recording level was related to the reflectivity of a model reflector and the sizing was generally performed using echo amplitude dynamics models.
The observations made with the inspections in accordance with the general code situation at that time (e.g. ASME Boiler and Pressure Vessel Code, Section XI) can be summarised as follows:
3
• Some defect phenomena like that for intergranular stress corrosion cracking (IGSCC) were detected primarily by leakage, the detection could not be attributed to systematic ISI (question of scope),
• Sensitivity level like that for IGSCC was inadequate in many cases (question of technique),
• Some components or for specific areas, the techniques were inappropriate (question of technique),
• Reliable sizing techniques were mainly unavailable for field use, with the exception of some countries having different code requirements (question of technique),
• Inspection intervals, especially in conjunction with a non-optimised sampling scope, were too long with regard to the kinetics for specific flaw growth.
• On the other hand, considerable parts of the scope were concentrated on locations having a low chance of incurring degradation.
The implementation of ISI into the field did benefit initially from the existence of cookbook-like instructions by the simplicity of following it; however, this rigid code caused a considerable delay for the implementation of advanced and more effective methodology.
International programs like PISC (Plate Inspection Steering Committee, later Programme for Inspection of Steel Components) gave considerable assistance for objectively assessing the status of ISI for the different components by demonstrating the lack of capability of the "traditional" methods and the benefits of the application of advanced ISI practices [3]. The results of these programmes triggered two major activities, which were accompanying each other:
(1) The implementation of a more advanced NDE methodology. (2) The implementation of systematic processes of formalised proof of the capability of the
methodology to be employed.
These efforts were started in the early 80s in the UK (called Inspection Validation) and subsequently in the USA (called Performance Demonstration according to ASME Code Section XI, Appendix VIII).
Within the third phase of the PISC programme, Action 8, "Support to Codes and Standards" was founded in the late 80s and concentrated on the complex of ISI qualification. The reason for this decision was the fact, that ISI qualification was regarded as the true heritage of PISC, as it was in a way rounding up all the important results of PISC. It offered as well a major chance for the harmonisation of ISI practices in various countries through generally valid principles for assessing the effectiveness of these practices.
At the end of the PISC, EBIV (European Bureau for Inspection Validation), later called ENIQ (European Network for Inspection Qualification) was founded, took over from PISC and shortly after drafted the first issue of the "Guidelines for the Qualification of Nondestructive Tests", followed by the second issue valid at present [4]. This initiative had increased its pace, as ISI qualification had also become an issue in France and in Sweden.
In the meantime EPRI had assembled most of the utilities in the Performance Demonstration Initiative (PDI) making fast progress in implementing the qualification process according to the ASME code requirements.
IAEA took the initiative to merge the expertise in the WWER operating countries and Western Europe as well as the US, generating the "Methodology for Qualification of In-
4

Service Inspection Systems for WWER Nuclear Power Plants". This publication combined the ENIQ and ASME approaches to provide a consistent and practical strategy [5].
At present, in the USA and in most of the ENIQ member countries inspection qualification has been established and more advanced ISI practices have been qualified or their qualification is in planning or under way.
At this stage, it is appropriate to critically review the progress achieved in terms of ISI effectiveness and its proof, especially in the light of the following questions:
• Has the process of qualification of NDE systems and the improvements of the methodology achieved led to a view of NDE as a discipline per se and of the NDE optimization for its own sake?
• What systematic input under scientific and plant engineering aspects has been maintained in the process of establishing qualification, when the crucial questions were dealt with, e.g. the determination of the defects to be used in the qualification?
• Is there consistency between the performance during the qualification test and the routine performance on site?
• Are the NDE experts aware of the need to interface with experts in other disciplines and vice versa, when ISI optimisation strategies are being determined? How far has the implementation of integrated models like RI-ISI progressed, which may give some relevant input to set the targets for ISI optimization?
In order to consider these questions, comments on some of these questions are given below.
2.2. RELEVANCE OF ISI EFFECTIVENESS
Effective ISI has become a factor of increasing relevance within the structural integrity assessment and mitigation, repair or replacement action. It is also an important part of plant life management with its need for a reliable diagnosis of the condition of the components and the prediction of their future status. Some examples of the past decade illustrate the relevance of effective ISI:
2.2.1. Steam generator tubing Several tubing degradation mechanisms have been encountered over the past three decades, each of them with differing characteristics of the eddy current signals. If optimised or advanced probes (e.g. with motorised rotating coils) are being used and the adequate data analysis algorithms and logistics are qualified and applied, these mechanisms can be identified, sized and a trend in degradation can be established. The results have considerable relevance and therefore are double- or even triple-checked in the data analysis process. The reason is the direct impact on plant power output by the number of plugged tubes and on plant energy availability (number and duration of unplanned outages) and cost by the eventual need for steam generator (S/G) repair or replacement. From the point of view of safety, SG tube rupture could initiate small break LOCA type accident, which involves RPV emergency core cooling and associated thermal transients for the primary system.
2.2.2. RPV head penetrations The head penetrations have emerged as a problem area of considerable significance in recent years. In view of the high radiation level, the complicated geometrical and clearance conditions, modular tools with complicated sensor carriers have been developed and qualified for the different inspection tasks and successfully applied on site. Similar to S/G results, the results of these inspections demonstrate a direct impact on plant availability and cost by the
5

need for repair or vessel head replacement and augmented inspections. Drastic damage, which has occurred, demonstrates the importance of properly interpreting the results of ISI and taking appropriate corrective action.
2.2.3. Austenitic weldments IGSCC has been found extensively in stainless steel piping of BWR recirculation lines and was initially only detected by leakage. The inspector qualification process, which was established in 1983, anticipated later ISI qualification procedures. Similar to the preceding examples, the results of these inspections have a direct impact on plant availability and cost by the need for mitigation activities like LPHSW (Last Pass Heat Sink Weld) and augmented ISI. Similar problems have emerged with the inspection of dissimilar metal welds in both PWR and BWR, where NDE simply missed defects, which turned into a leakage in the subsequent operation period.
2.2.4. Reactor internals In the bolts and weld areas of reactor internals defects have occurred. In view of the high radiation level and the minimal chances for a repair due to the severe access conditions, replacement appears to be the only alternative for effectively fixing the problem. However, as the loads and defect growth rate are generally small, a certain degree of defective areas can be tolerated. Both tasks impose a large responsibility for the ISI, in one case to give the final criterion for reactor internals replacement, in the other to supply a solid basis for trend analysis of the defective areas and the severity of the individual defects.
These examples demonstrate the strong impact of the ISI based evidence of the component's status on safety and cost of plant operation. If the ISI techniques are even able to characterise the flaws in terms of correlation with specific types and growth mechanisms. the relevance of the ISI based evidence is even higher, as it may allow for a trend assessment. This trend assessment can be the basis for the determination of the time interval to the next inspection in which the component can still be safely operated.
2.3. BASIC ELEMENTS OF ISI EFFECTIVENESS
The preceding considerations demonstrate that several factors contribute to ISI effectiveness and show some of the ways, in which they influence each other. For this reason, ISI effectiveness should not be limited to only one of its part called NDE effectiveness.
Effective ISI is constituted of the following elements:
(1) Safety-conscious and realistic determination of the ISI scope.(2) Safety-conscious and realistic determination of the ISI intervals.(3) Improved/optimised NDE effectiveness including its proof by qualification for the areas
determined as ISI scope.
2.4. RELATION OF THE BASIC ELEMENTS OF ISI EFFECTIVENESS TO STRUCTURAL INTEGRITY ASSESSMENT
Structural integrity assessment models and ISI are related in both directions: (1) ISI is to supply most reliable data about:
• Presence of flaws in a given component in terms of dimensions;
6

• Flaw location within the wall including ligament dimension; • Flaw characteristics including changes from previous inspections; and • Proximity to eventual other flaws, etc.
All these data are among the most important input data for the subsequent structural integrity assessment.
(2) Structural integrity assessment is formulating the requirements for the level of ISI performance like:
• Scope and inspection volume; • Flaw evaluation process; • Target detectable flaw size; • Sizing accuracy, at least indirectly; • Accuracy of the location of the flaw; • Need for more detailed characterisation of flaws beyond the sizing capability if
necessary; • Accuracy of the determination of the ligament between flaw and closest component
surface; and • Inspection interval determined from the ISI information and its assessed quality.
The relation or the interaction between structural integrity assessment models and ISI will be discussed in detail in the subsequent paragraphs in conjunction with the discussion of the so-called Master Diagram.
2.5. RELATION OF THE BASIC ELEMENTS OF ISI EFFECTIVENESS TO COST
The discussion of the aspects of ISI effectiveness within the preceding paragraphs was oriented towards the principles of safety. In the interest of the safe and, at the same time, cost effective operation of NPPs, it is also of importance to investigate the relation of ISI effectiveness and overall cost to the plant operation when employing effective ISI and to identify potential benefit of combining safety and cost aspects when considering ISI effectiveness improvement. This integrated consideration may also present some answers to the questions posed at the end of paragraph 2.1.
2.5.1. Radiation dose considerations Radiation dose accumulated by workers is a significant element of ISI planning and influences the cost in several ways. In some countries, explicit dose targets are set and financial penalties assigned for when accumulated dose exceeds established levels.
Dose considerations play a role in determining what type of NDE equipment and process (for example, automated-versus-manual inspection) is to be used and how many inspection personnel are to be used. Thus, dose contributes to the cost of ISI in an explicit way.
2.5.2. Relation of selection of scope with cost The subsequent considerations are merely qualitative, but quantitative data points can be filled in quite easily. The model in Fig. 1 is based on the following assumptions:
• The cost of ISI is increasing with increasing scope of the inspection and with a slight progression of additional ISI cost, if further areas are added to an already increased
7

scope (green dotted line). The ISI cost is also accounting for the a.m. radiation dose considerations.
• The ISI effectiveness is already at a high level as is outlined in paragraph 2.1. This level of performance is a fixed parameter, as in case of ineffective ISI, the quality of determination of the scope is irrelevant, as the ISI is not able to yield the necessary quality of results in order to help to prevent the component's failure and the associated costs.
• The "good selection" of ISI scope is picking the components or areas in the sequence of their relevance or close to this sequence (blue dotted line). These most relevant areas are associated with an almost infinite or very high cost consequence of failure. Therefore –in a qualitative way – the blue curve is asymptotic to the abscissa and is reaching a more moderate cost level of failure consequence at a relatively low percentage of the total feasible scope.
• The "bad selection" of ISI scope is produced by not picking the most relevant areas in their systematic sequence but in a more random fashion, therefore the red curve is arriving at a relatively moderate cost level at a considerable larger scope than the blue line. However, the achievable minimum cost level is higher than with the good selection, as the cost of inspecting areas, which are not as relevant, is already included. If relevant areas are omitted, there is a penalty of increased plant cost due to failure of the component. The increase of cost is depending on the cost-relevance of the failure of that specific component.
FIG. 1. Relation of NDE-performance with cost.
TOTAL COST, "BAD SELECTION"
TOTAL COST, "GOOD SELECTION"
ISI COST
COST
SCOPE100%
COST TO PLANT
COST TO PLANT
8
The total cost (additionally accounting for the ISI cost) reaches a minimum at the lowest data point of the "total cost curve" along the abscissa with a lower absolute value for the good selection. This can be regarded as the optimum selection of inspection areas from the mere standpoint of cost. The selection of additional areas under a mere safety-related aspect and with a lower cost implication could be added to this scope, if such cases do occur. The diagram is not accounting for the probability of the non-failure of the component or area, if it has not been inspected. However, this consideration can still be implemented, but is not relevant for the conclusion that a systematic selection of the scope of inspection is necessary. This systematic selection has to be based on models, which regard ISI in its entire field of interaction with other features within the structural integrity assessment.
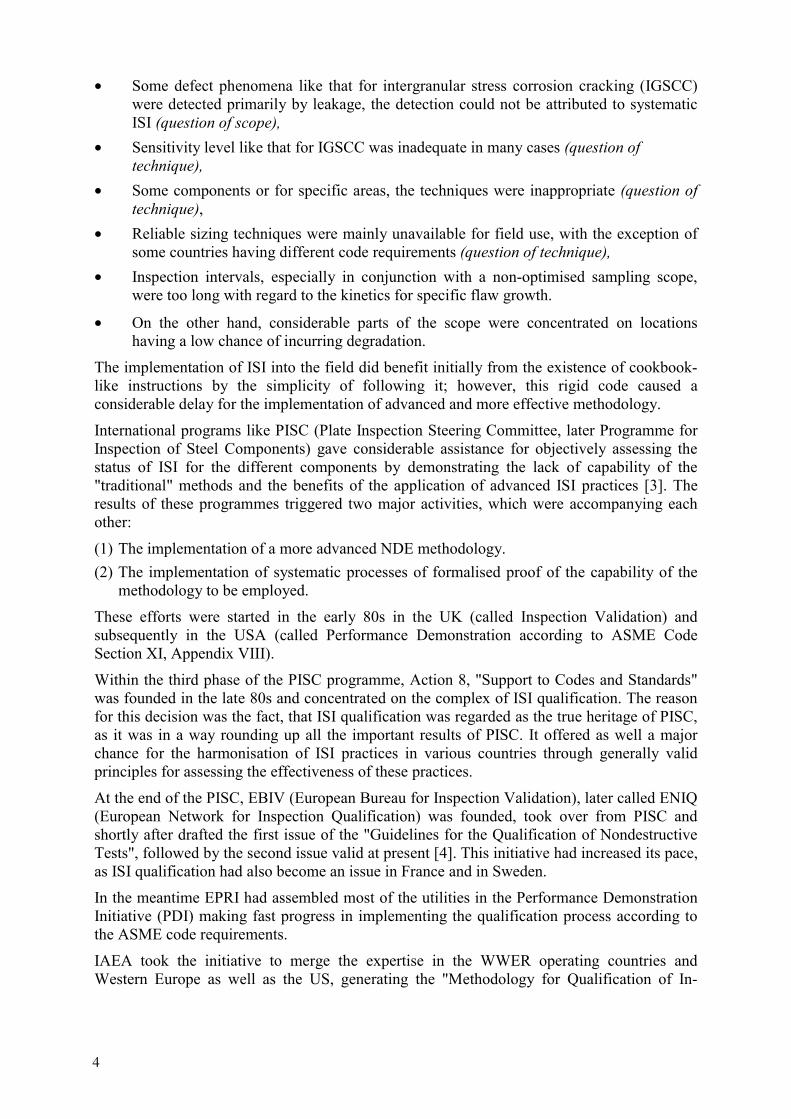
2.5.3. Relation of NDE effectiveness with cost For the qualitative consideration of the relation of NDE effectiveness with cost (Fig. 2), the assumptions made were quite similar to those of the above paragraph:
• Making improvements to NDE systems that are already at a high level of effectiveness is more costly than making similar incremental improvements to less effective systems.
• If NDE systems with a lower level of effectiveness are used, there is a ‘penalty’ of increased plant cost due to failure of the component. The increase of cost is depending on the cost-relevance of the failure of that specific component.
• The quality of the selection of the scope of inspection is at a high level, but this is a fixed parameter, as in case of bad selection of scope the wrong areas are being inspected and ISI is not able to help to prevent the component's failure and the associated costs.
FIG. 2. Relation of NDE-performance with cost.
The total cost reaches a minimum level at a relatively high effectiveness. This can be regarded as the optimum degree of improved inspection effectiveness solely from the standpoint of cost. This cost of the improvement could be further subdivided by the number of components or plants e.g. with the same or very similar design and materials, but which benefit from the same improvement effort.
COST OF IMPROVEMENT
TOTAL COST, "GOOD SELECTION OF SCOPE"
PLANT COST, "CONSEQUENCES"
COST
EFFECTIVENESS100% 50%
9
This diagram does not consider the cost of the inspection itself. At first sight, the employment of a more effective NDE methodology could be regarded as more costly. However, the experience e.g. with the implementation of UT phased array techniques shows that simpler probe systems (together with a combination of techniques and with the reduction of scanning areas and steps) have led to a better coverage and consequential savings of inspection time. The relation to the ISI intervals, which may also act as another offset of ISI cost, will be discussed in paragraph 2.5.4.
The diagram is not accounting for the probability of the non-failure of the component or area, if it has been inspected with an ineffective NDE methodology. However, this consideration can still be implemented, but is not relevant for the conclusion that a systematic improvement of NDE effectiveness is necessary. This systematic improvement of NDE effectiveness has to be based on models, which regard ISI in its entire field of interaction with other disciplines.
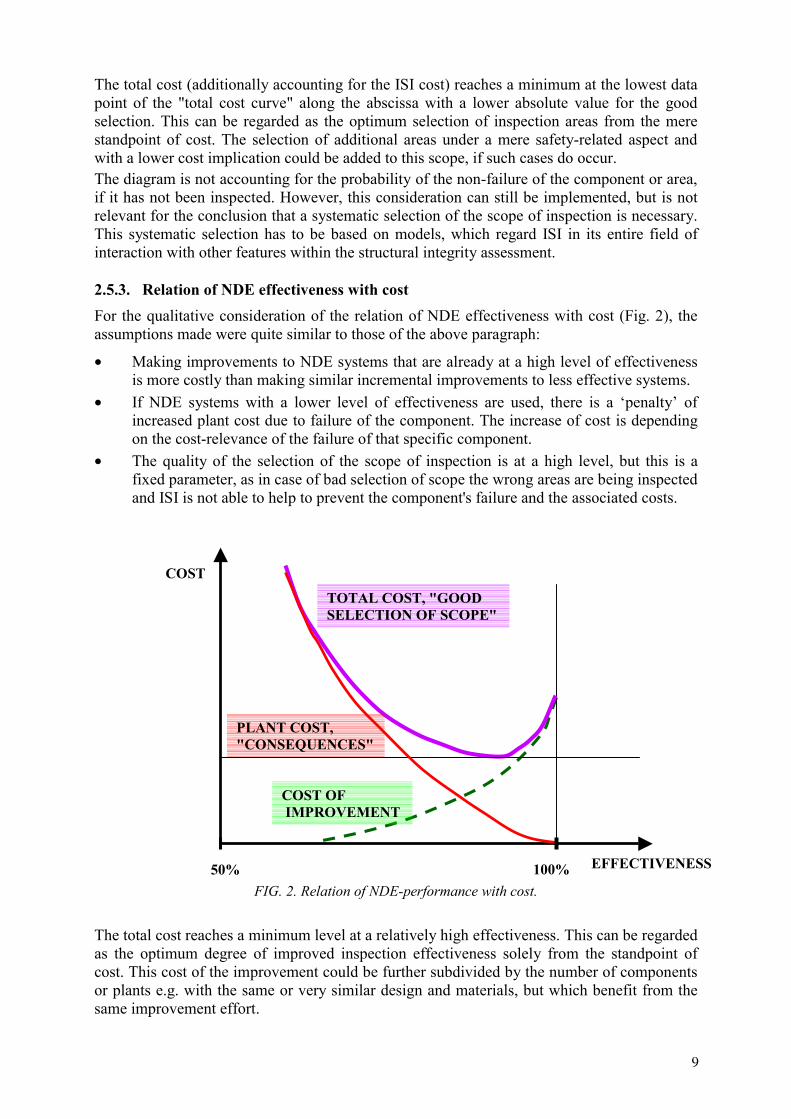
2.5.4. Relation of NDE effectiveness with inspection interval Again, the consideration of the relation of NDE effectiveness with the inspection interval is purely qualitative.
FIG. 3. Relation of NDE effectiveness with ISI interval.
For the generation of the diagram displayed in Fig. 3, the following assumptions are made:
• This consideration keeps all other factors, which may have an influence on the determination of the ISI interval, constant. This applies e.g. for factors stemming from plant operation, like transients caused by deviation from conditions of normal operation and numbers, it applies for the variety of flaw kinetics or unexpected phenomena. The crack growth rate is assumed to be only dependent on the crack size (through wall dimension) with a given growth mechanism.
FLAW SIZE
TIME
Di
De
Ii Ie
Critical Flaw Size
Safety Limit to critical Flaw
STi
STe
10

• The effective NDE methodology is capable of reliably detecting flaws with relatively small dimensions (De being the through wall dimension of the defect detectable with the effective methodology) and larger. The accuracy of sizing for the effective methodology is within a small sizing tolerance being STe.
• The ineffective NDE methodology is capable only to reliably detect flaws with relatively large dimensions (Di) and larger, and the accuracy of sizing is within a relatively large sizing tolerance (STi).
• For the purpose of simplification, the sizing tolerance for over- and under-sizing is assumed to be the same.
• These assumptions lead to the conclusion, that for both examples, NDE leads to the statement that no defect larger than that safely detectable is present. Accounting for the possibility of under- or over-sizing leads to the following statement: There is no defect present, which is larger than the defect corresponding to the minimum detectable plus the upper sizing tolerance (De + ½STe and Di + ½STi respectively). This means, that there may be two apparently different underlying defect populations as identified depending on the NDE effectiveness. This difference shall not be considered in the interest of the clarity of the model.
• This aforementioned diagnosis about the absence of defects, which are larger than the defect corresponding to the minimum detectable plus the upper sizing tolerance, has been established at the ‘time zero’. Over the ensuing time intervals, the defects will grow, depending on their size.
• The subsequent inspection has to be scheduled for the time when the maximum defect present has grown to the size corresponding to the safety limit (acceptable or allowable size).
Under these assumptions, the diagram demonstrates the potential extension of the inspection interval from Ii to Ie, if an effective NDE methodology is being employed. This consideration can only demonstrate a tendency and should be integrated into the comprehensive models like risk informed inspection.
2.6. CRITERIA FOR NDE EFFECTIVENESS
NDE effectiveness has been almost exclusively assessed by its capability to detect and to accurately size flaws. In this paragraph another capability will be discussed below, i.e. the characterization of flaws in order to be able to draw conclusions about the mechanism of flaw initiation and of its subsequent growth. For this reason, we will differentiate between "status or momentary assessment" and "trending assessment".
2.6.1. Criteria for status assessment These are the well-known criteria for detection and sizing, both affected by the influential parameters of the component and the influential parameters of the flaw sizes and the flaw characteristics as well as of the technique as the "answer". For these considerations the following criteria apply:
• Probability of detection (POD) as function of the defect size. Remark: It is often assumed, that a technique being able to detect small defects will be at least as able to detect the large flaws, which is not self-evident. This means the need for adding some larger flaws with e.g. an unfavourable orientation or larger composite flaws to the catalogue of flaws in order to be able to exclude a systematic lack of performance in the presence of larger flaws. This helps to avoid shortcomings as represented by the red dotted line in Fig. 4.
11

FIG. 4. Standard NDE effectiveness diagram.
• Probability of correct acceptance or rejection (PCA or PCR) of a flaw detected, represented by the sizing tolerance of the technique. For this case the question of eventual non-consistency of the sizing tolerances must be considered.
In many cases the assessment of the performance concentrates on these criteria, which are displayed in the traditional diagrams (Fig. 4) and are useful for the status assessment.
However, at least in case of subsurface defects, the correct determination of the ligament from the adjacent flaw tip to the surface is of importance as well. An assessment model accounting for this influence has already been presented within the PISC programme [6].
2.6.2. Criteria for trending assessment This consideration asks for more information concerning the flaw detected. For this assessment, the methodology must be able to supply criteria, which allow reliable conclusions to be drawn about the type of a defect, whether composite and/or faceted, which orientation, if planar or partly voluminous, its location within the weld cross section etc. This information is self-evidently not the only source of information, as there are contributions from other disciplines (e.g. welding metallurgy), which help to narrow the possible variety of flaw types. This characterization — within certain limits — allows for a trending assessment of defect growth.
In this respect the criteria for NDE effectiveness have to be determined even more carefully, as well as the strategy for the qualification of such methods. As an example, the selection of flaw parameters as well as their realistic simulation for the experimental evidence poses considerable problems.
12

2.7. CONCLUSIVE REMARKS TO THE ASPECTS OF ISI EFFECTIVENESS
In the above considerations we have discussed the criteria and guidelines for achieving a true improvement of ISI effectiveness. The ongoing implementation of innovative techniques demonstrates the potential to improve the effectiveness of NDE in terms of safety and of cost. However, as already mentioned, ISI effectiveness relies also on the quality of the selection of the scope together with the correct determination of the inspection interval. It has become obvious that most of these criteria lie in the field of interaction between ISI with its three major aspects determining its effectiveness and the other disciplines contributing to structural integrity assessment. However, the factors, which have become the most important ones, call for integrated conceptions being both safety conscious and cost effective, such as risk informed inspection. For this reason, in the next chapter we will discuss an overall concept in detail allowing for substantial conclusions to be drawn in terms of criteria and recommendations for ISI effectiveness improvement.
3. OVERVIEW OF RISK-INFORMED INSPECTION
3.1. HISTORY OF RISK-INFORMED INSPECTION
Periodic in-service inspection of nuclear plants began in the late 1970s and was based upon expert opinion drawing from experience and knowledge of conventional plant construction and operation. The ISI rules in some countries were endorsed through Code consensus processes.
3.1.1. History of risk-informed inspection in Europe The Steering Committee of the European Network for Inspection and Qualification (ENIQ) — a network which is driven by the European utilities — decided in April 1996 to set up a Task Group Risk (TG R) to harmonise the different national approaches on risk-informed in-service inspection in Europe. A core group of ENIQ TG R decided in September 1997 to participate in EURIS, a concerted action financed by the European Commission, to identify the advantages and drawbacks of the key elements of the existing risk-informed methodologies and to recommend changes and improvements in order to develop this report as a basis for a joint European approach. The final report of EURIS was published in March 2000 [7]. This report was further developed by ENIQ TG R to a “Discussion Document on Risk-Informed In-Service Inspection of Nuclear Power Plants in Europe” [8], which was approved by the ENIQ Steering Committee in December 2000. At present, ENIQ “Task Group Risk-informed inspection” (TG R) is developing a framework document outlining the requirements of what a risk-informed methodology should include, and why. The framework document will be built on
• the lessons learnt from a series of pilot studies carried out in France, Spain, Sweden, UK, Switzerland, and Finland;
• the results of the NURBIM project (Nuclear Risk Based Inspection Methodology —shared cost action funded by the European Commission); and
• existing reference documents such as the Swedish Nuclear Power Inspectorate’s Regulation SKIFS 1998:1 [9], the Spanish Risk-Informed In-Service Inspection Guideline for Piping [10], the US Regulatory Guide 1.174, etc.
The European regulators, on the other hand, decided in November 1996 to set up a Task Force (TF) under the Nuclear Regulators Working Group (NRWG) to agree on the philosophy and principles governing risk-informed in-service inspection. The TF, which was made up of representatives from AVN (Belgium), HSK (Switzerland), BfS (Germany), CSN (Spain), SKI
13

(Sweden), STUK (Finland) and SONS (Czech Republic), published a first consensus report in 1999 [11]. The TF was dissolved afterwards, but at the 59th meeting of the NRWG in May 2002 it was decided to re-establish the group to investigate the criteria that a risk-informed methodology must meet from a regulatory point of view. The first draft of the report is expected in spring 2003.
3.1.2. History of risk-informed inspection in the USA In the USA, the ASME formed a task force to study the application of risk-based methods to formulate policies, codes and standards. This task force led to initial research into application of risk-based concepts for passive components such as piping. The report of this group contained guidelines for risk-based inspection programs [12].
In 1993, EPRI began development of a full-scope risk-informed inspection methodology and applied it to two pilot plants that were reviewed by the NRC. The first application approved by NRC was for a US BWR in 1998. In this same time frame, the Westinghouse Owners Group developed a risk-informed ISI methodology. In 1995, ASME established a working group on implementation of RI-ISI and subsequently developed two Code cases addressing implementation (N-577 and N-578).
By the end of 2002, the NRC had approved 45 plant specific RI-ISI applications. This broad acceptance and successful implementation of RI-ISI led to extensions of risk-informed inspection methodology to other plant systems such as the high energy line break requirements in 2001 [13].
3.2. OBJECTIVES OF RISK-INFORMED INSPECTION
Development of an integrated, risk-informed in-service inspection program needs to meet several goals in order to be successful. These objectives are described as follows:
• Technically robust — Independent reviews by internal plant teams as well as by external teams (e.g. regulator) should result in no changes to the program (risk ranking, number and type of inspections).
• Consistent application — Prescriptive requirements should be developed so that the application is consistent and subjectivity related to personal experience and opinion, inputs to fracture mechanics codes, or conservatisms in probabilistic risk assessment (PRA) models is minimized.
• Reduce Unnecessary Burden — The technical basis of the methodology should lie within the methodology itself (and supporting documentation), thereby excessive calculation expense is not imposed upon the user. In addition, once the regulator has approved the methodology, review of its application to individual plants should be much easier than other alternatives. This would include reducing concerns related to software, training and qualification, and input assumptions such as whether vibratory or thermal fatigue is assumed operative (which although conservative from a failure potential perspective can be misleading from a relative risk ranking perspective).
• Maintain or Improve Plant Safety — Application of an integrated in-service inspection program, which incorporates risk-informed technology, should be shown to maintain or increase plant safety.
3.3. CONSEQUENCE ASSESSMENT
An integrated and consistent consequence assessment must be based not only on plant specific PRA insights and information but also on traditional PRA logic and structure.
14
Several PRA-related issues that need to be addressed include:
• A range of quality in plant specific PRA exists; • Quantification of full scope PRA is time consuming; • Piping is a passive element, and as such, piping failures are generally not explicitly
modeled in PRA; • Truncation of probabilities can be important; • PRA were typically developed to calculate core damage frequency (CDF) rather than
for developing relative risk measures; • Conservatisms in PRA exist at the basic event, component, train, system, fault tree and
event tree levels; • Difficulty in defining risk-based versus risk-informed results.
As such, an integrated, risk-informed process would have to be able to be implemented with these limitations, including the issue of a range of PRA quality. This process should provide a mechanism for the user, regulator and other stakeholders to assess the robustness of the plant specific PRAs (i.e. addresses PRA quality) and its impact on the in-service inspection program.
By developing an integrated process, it is expected that the quantitative basis, logic and structure of the consequence evaluations would not require plant specific justification (therefore contributing to reducing the level of effort and increasing the consistency of application). In addition, by de-coupling the consequence assessment from the degradation assessment and the use of a risk matrix approach, the integrated process creates independence from the failure potential evaluation thereby eliminating issues associated with relative risk measures, conservatisms and truncation.
In addition, in an integrated process, the consequence assessment procedure would be defined so that if there is no defence in depth (e.g. no mitigating equipment) for a given postulated failure, it is ranked as a high consequence. This represents another step beyond a simple risk-based philosophy. As example, this position supports the intuitive belief that large bore Class 1 piping is still important from a safety perspective, regardless of its failure potential.
3.4. FAILURE POTENTIAL ASSESSMENT
As with other aspects of the integrated process, use of risk information in determining failure potential needs to be carefully coordinated. That is, determining how best this information could be factored into the risk determination process while acknowledging the uncertainty associated with highly reliable components.
As with the consequence assessment, treatment of conservatisms need to be carefully weighed so that accurate and risk-informed results are obtained. Together with the aforementioned, the requirement to assure consistent applications will result in a set of prescriptive criteria having been defined for determining failure potential. This provides confidence to the user, regulator and other stakeholders.
In an integrated process, this would be defined so that updates of the RI-ISI program are extremely efficient. For example, if a new type of degradation is found or a plant modification is made, this new mechanism can be evaluated as to its applicability and none of the previous work is invalidated or needs to be redone.
It is also important that, in an integrated process, conservatisms in the failure potential evaluation process should only act to add inspections, whereas conservatisms in other methodologies/processes may mask other important components and artificially reduce inspections.
15

Finally, development of failure probability values need to be sensitive to defence in depth and to unknown mechanism considerations as well. This will assure that the integrated process is not controlled by low failure probabilities and in effect eliminate the contribution and insights from other risk-informed viewpoints (e.g. safety impact).
3.5. RISK RANKING
As has been previously discussed, the use of the risk matrix together with de-coupling the consequence and failure potential assessment eliminates the concerns associated with relative risk measures.
An integrated process would also contain an additional defence in depth measure in that any failures that result in a high consequence are determined to remain high risk or at least medium risk, regardless of how unlikely the event.
The matrix approach minimizes the subjectivity of personal opinion and stabilizes the process in time, thus providing for a safety-based, risk-informed process.
Furthermore, this integrated approach would allow plant changes or new information to be efficiently adapted because only the individual change or new information need be processed as the risk matrix, ranking criteria and all previously evaluated components would not be impacted.
3.6. RISK IMPACT ASSESSMENT
An integrated process provides criteria for assessing the risk impact associated with RI-ISI program to ensure that the process does in fact lead to maintained or increased safety. These criteria would need to be reflective of the application and its impact on plant risk and thus range from straightforward qualitative assessments to complex quantitative assessments. Both types of assessments need to assure technical quality and adherence to fundamental safety principles.
Furthermore, an integrated process would be developed with the expressed intent to minimize the resources needed to implement an integrated, risk-informed in-service inspection program.
4. DISCUSSION OF THE MASTER DIAGRAM
As a conclusion to the above considerations and in anticipation of the discussion within this paragraph, the contents of this report have been condensed into Fig. 5 (see next page), which is the systematic synthesis of the ISI rationale described in this report. We recommend the diagram be called Master Diagram of Risk-informed ISI.
16

FIG. 5. Master Diagram.
Loads and/or TransientsGeometry, Geometry, > DesignDimensions DimensionsLoads,Sresses, Loads,Sresses, Occurrence andTransients Transients PhenomenaMaterial Properties Material Properties
Fabrication OperationSpecifications, Procedures
Specifications, Procedures
Fabrication DefectsDefect Growth, Defect Initiation
Fabrication NDE In-Service NDE
Design Operation/al Changes
"Unexpected" Integral Structural Integrity
AssessmentUnexpected Defects'
Feedback from Capability and Reliability Tests
Parameters Techniques Instruments
Algorithms/Analysis Procedures Practices
Physical Background, Modelling
Qualification by Technical Justification and Practical Trials
Factors improving Performance
Factors influencing Performance, e.g. Human Factors
Interaction with Component: Geometry, Accessibility, Material Properties
NDE-MethodologyOptimization of ISI-Methodology
ISI-Experience, Results Code Requirements
Feedback from On-Site Experience
Assessment Methodologies
Degradation Assessment:
Stress AnalysisFatigue Analysis
Fracture Mechanics
Significance Value
Defect Category
Critical
Rejection Level Rejectable
Recording LevelQuality Case
Sensitivity Level
Noise Level Insignificant
NDE - Effectiveness
Range per Category
POF
very high
high
medium
low
very low
very low low mediu
m high very high Consequences
through:Data BasesModelsboth without NDE
Assessment of Probability of Failure (POF)
Code ClassificationReactor Pressure Vessel, Incredibility of Failure (IOF)Class 1Class 2Class 3Balance of Plant
Ensure for all Areas: Risk is smaller or equal vs. tolerable Risk
100%
POD/PCR
Defect Size
10exp(-3)
0,10,1
0,9 0,1
Event
Defense in Depth
Fatigue Analysis
Fracture Mechanics Analysis Other
Damages
Field Experience
SA specific Requests
Concerne
dLocations
ConcernedLocations
• All welds • Cast material • Nozzle corner • 3 pass bids;
<1/2t and >1/4t
Sensitive Locations
• amax 20 mm •T < TTransition
2
ISI Locations/Performance
Synthesis of all the different aspects; technical analysis
Complementary Sampling
Sensitive Locations
F <
A D
D2
C1
B1 D1
D3
Component-specific AnalysisDetermination ofAreas associated with:Critical Defects Acceptable DefectsNDE - EffectivenessNDE - IntervalsQualification Criteria C
B
Large Early Release Frequency (LERF)Fission Product Release Frequency (FPRF)Core Damage Frequency (CDF)Other Safety-related Cases
Categories of Consequences
Cost
Risk
17

The intent of this chapter is to give a short description of each single box in the schematic and its contribution and influence on the entire process and on the improvement of ISI effectiveness by the implementation of risk informed assessment methodology. For this purpose, the individual boxes are displayed in larger scale and are referenced by their letter in the Master Diagram (Fig. 5). The basis of this process is risk; therefore the kernel box for the risk assessment is box D (Fig.6) of the Master Diagram.
FIG. 6. Risk matrix.
The fundamental factors are the consequences from failure and the probability of occurrence of this failure. These two factors are independent from each other and form the axes of the risk assessment diagram (the axes are in logarithmic display). Both axes may be subdivided into 5 categories (decades):
• Very high (VH); • High (H); • Medium (M);• Low (L); • Very low (VL). This subdivision allows for a categorisation with adequate differentiation and assignment of the different input elements. The 3 boxes in the upper right corner of the risk matrix are excluded from the consideration at all. They represent too high risk levels to be taken seriously into consideration. The remainder of the boxes is subdivided into three risk categories represented by mid-grey, light grey and white. The red and the blue lines indicate two "Iso-risk lines" representing two different levels of risk.
Risk
Very high
High
Medium
Low
Very low
Very low Low Medium High Very
high CONSEQUENCES
POF
ISO-Risk Lines
18
Categories of Consequence
Large Early Release Frequency (LERF)
Fission Production Release Frequency (FPRF)
Core Damage Frequency (CDF)
Other Safety Related Cases
Cos
t
FIG. 7. Consequence categories.
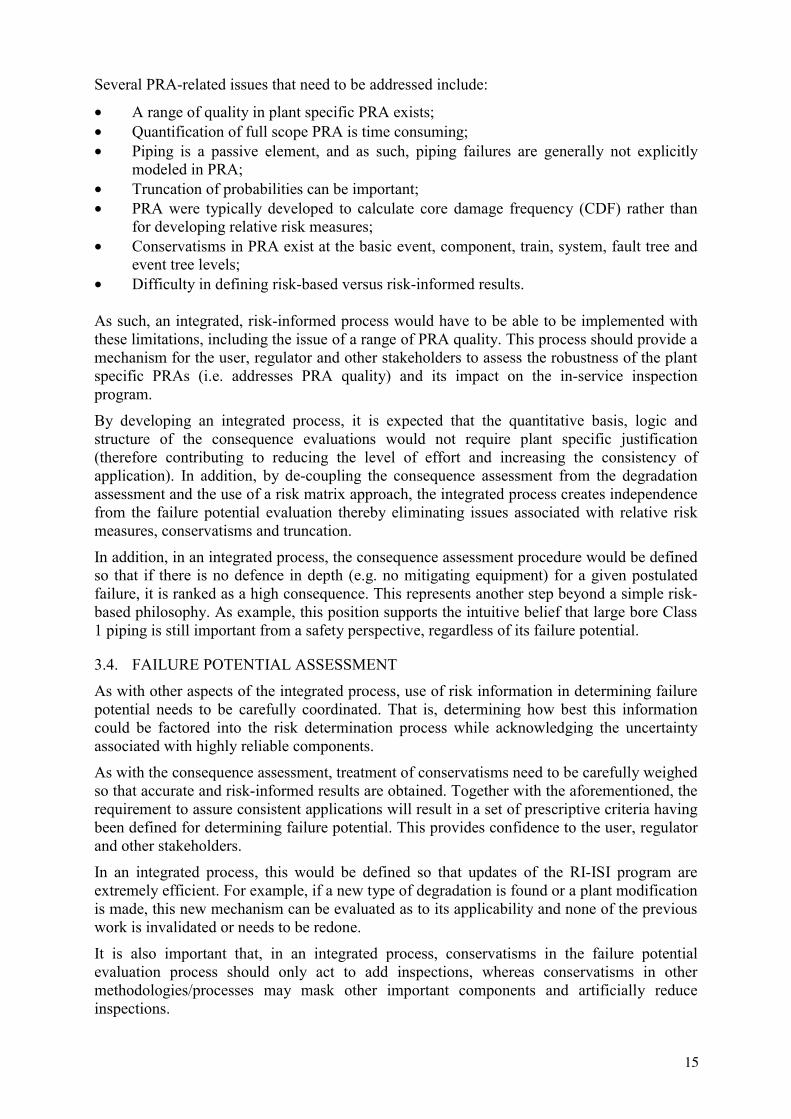
The main contributing elements as input for the risk map abscissa are contained in box D3 (Fig. 7).
This box outlines the categories of potential consequences like LERF (large early release frequency), FPRF (fission product release frequency), CDF (core damage frequency), as well as the cost factor of loss of availability and of eventual repair. The defence-in-depth concept includes a sequential breaching of safety barriers, therefore strongly affecting the categorisation into consequence levels.
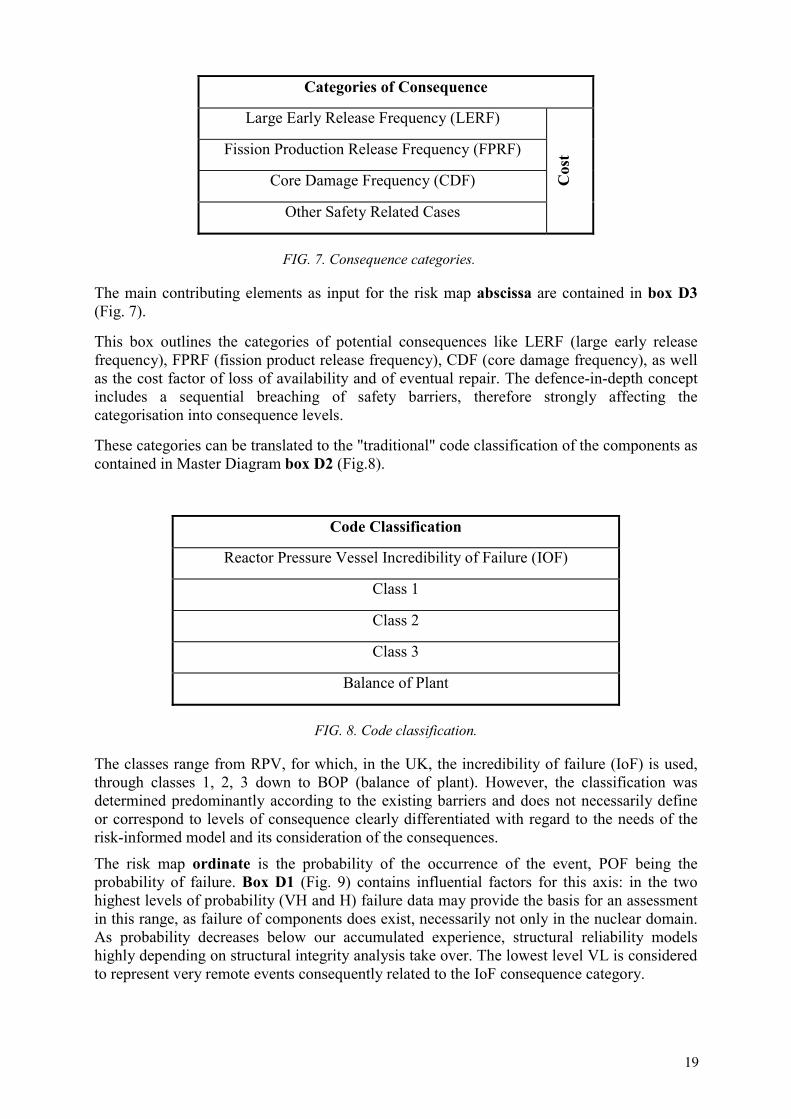
These categories can be translated to the "traditional" code classification of the components as contained in Master Diagram box D2 (Fig.8).
Code Classification
Reactor Pressure Vessel Incredibility of Failure (IOF)
Class 1
Class 2
Class 3
Balance of Plant
FIG. 8. Code classification.
The classes range from RPV, for which, in the UK, the incredibility of failure (IoF) is used, through classes 1, 2, 3 down to BOP (balance of plant). However, the classification was determined predominantly according to the existing barriers and does not necessarily define or correspond to levels of consequence clearly differentiated with regard to the needs of the risk-informed model and its consideration of the consequences.
The risk map ordinate is the probability of the occurrence of the event, POF being the probability of failure. Box D1 (Fig. 9) contains influential factors for this axis: in the two highest levels of probability (VH and H) failure data may provide the basis for an assessment in this range, as failure of components does exist, necessarily not only in the nuclear domain. As probability decreases below our accumulated experience, structural reliability models highly depending on structural integrity analysis take over. The lowest level VL is considered to represent very remote events consequently related to the IoF consequence category.
19

Assessment of Probability of Failure (POF)
Data bases
Models
Both without NDE
FIG. 9. Probability of failure.
As we consider the other boxes, we move into the domain affected by ISI or affecting ISI directly. Box A (Fig. 10) shows the disciplines, methodologies and criteria, which closely interact with ISI. It also shows aspects of the potential of NDE, the factors influencing the actual ISI methodologies and the criteria for ISI optimisation resulting from this mentioned interaction with specific attention to the implementation of the risk informed process. Emphasis is given to the process of the selection of the ISI-areas and the input of ISI to this selection as well as the consequences for ISI from it.
The first part deals with the input of the design aspects listed in the boxes, which cover a considerable number of criteria and assumptions. During operation, these same criteria,irrespective of their values, may change leading to defects, degradation or damages, which alter the status of structural integrity, which in turn most probably will lead to a change of the ISI programme. The fabrication aspects are particularly important for reassessment in case of modifications and repairs performed as well as in case of defects detected with more effective methodology available during operation.
Again, in operation, the values of these criteria potentially differ from theirs in fabrication. These changes most probably will have an impact on the structural integrity of the component under consideration. The defects having been present in the component from the fabrication process may grow during operation, or new defects may originate under boundary conditions differing from the design and fabrication basis.
The actual values and criteria are being assessed in terms of structural integrity by the listed assessment methodologies. In this consideration, ISI with its specific criteria and performance is the complement to the NDE performed during fabrication. A special criterion is the ISI experience with ISI data, which have a strong feedback interaction with most of the different boxes within box B. In this context, unexpected phenomena having an impact on structural integrity are to be considered and how they can be accounted for e.g. by worst case considerations or by the selection of specific additional ISI areas.
The two boxes in blue colour are dealing with the NDE methodology directly, differentiating between the criteria generally valid for characterising the specific NDE-methodology for a specific area and the criteria generally valid for the optimisation of the specific NDE methodology for a specific area. The final evaluation based on the performance of the optimised ISI and the results obtained with it results in an integrated structural integrity assessment approach accounting for the assessed capability of the NDE-methodology.
Another most important link in this interactive network is the ISI code requirements which is most decisive on the level of performance of the ISI being applied. These requirements are/should be accounting for the feedback of the other disciplines.
20

FIG. 10. Items interacting with ISI.
They should be – in anticipation of the considerations addressed later in this paper — parts of a performance-related code which in turn is strongly invoking the process of inspection qualification.
Box B (Fig. 11) is determining the NDE performance for a specific area and thereby relies on the following consideration:
NDE uses criteria, which are not only simple but also as indicative as possible. Assuming these criteria as NDE indicators, in UT terms, the indicator is mostly the amplitude, e.g. translated into distance amplitude curve (DAC) percentage. Other indicators may be the extent of an indication, eventually sound path dynamics etc. However, the actual size measured by an appropriate sizing method may also serve as indicator for this consideration. In the area of eddy current signal amplitude and phase, in the case of radiography reference defects in the form of a catalogue are used.
This means, that these indicators are based on flaw model assumptions, which — by abstraction, generalisation and simplification — try to describe the true flaw status. Taking into account the influencing factors of the flaw itself, like orientation, structure, through-wall-position, and also of the material (e.g. stainless steel) or geometry, it becomes obvious, that there may be discrepancies between the result stemming from the indicator and the true flaw status. In the case of a lower performance level of an NDE procedure, these discrepancies may assume a considerable magnitude or may even mean a complete loss of a meaningful result.
Loads and/or TransientsGeometry, Geometry, > DesignDimensions DimensionsLoads,Sresses, Loads,Sresses, Occurrence andTransients Transients PhenomenaMaterial Properties Material Properties
Fabrication OperationSpecifications, Procedures
Specifications, Procedures
Fabrication Defects
Defect Growth, Defect Initiation
Fabrication NDE In-Service NDE
NDE-MethodologyOptimization of
ISI-Methodology
ISI-Experience, Results Code Requirements
Feedback from On-Site Experience
Assessment Methodologies
Degradation Assessment:
Stress AnalysisFatigue Analysis
Fracture Mechanics
Feedback from Capability and Reliability Tests
Parameters Techniques Instruments
Algorithms/Analysis Procedures Practices
Physical Background, Modelling
Qualification by Technical
Justification and Practical Trials
Factors improving Performance
Factors influencing Performance, e.g. Human Factors
Interaction with Component: Geometry, Accessibility, Material Properties
Design Operation, Op. Changes
"Unexpected" Integral Structural Integrity
AssessmentUnexpected Defects'
21

FIG. 11. NDE effectiveness.
In contrast to Box B1, the diagram in box B goes beyond the simple criterion of defect through-wall-dimension, but considers the actual relevance of a defect (even defect types can be accounted for) and assigns it to the main categories of relevance. These categories may be broken down further, if a closer view of the correlation is desired. This consideration may also be broken down in terms of different indicators, if a set of them, even with different weighting factors is being used, and the contribution of each single indicator could be determined.
This diagram should be read as follows:
The left side reaching to the bold black vertical line is the domain of the NDE results characterised by the significance value, which is also called the indicator. The indicator value is corresponding to the ordinate of the left part of the diagram. The different levels of the indicator are characterised by the typical NDE related criteria like noise level, achieved sensitivity level, recording level etc. The vertically oriented coloured rectangles establish the relation to the defect domain on the right side by their colour corresponding to the different defect categories: The example in the diagram shows that the variation of the values of the indicator for the defect category "quality case" reaches from underneath the recording level until values exceeding the rejection level. The latter means an overcall, if the defects in the category "quality case" should all be recordable, then this procedure also is subject to undercalls. Whether the specific NDE procedure and system is effective or not, can be determined based on the degree of correlation between NDE indicator and true flaw status. For the ideal inspection system, a direct correlation would exist. It has been already indicated, that the displayed correlation demonstrates an adequate but not ideal inspection system, as it
Significance Value
Defect Category
Critical
Rejection Level Rejectable
Recording LevelQuality Case
Sensitivity Level
Noise Level Insignificant
NDE - Effectiveness
Range per Category
22

would have some ‘undercalls’ in terms of ‘Quality case’ defects, as the bandwidth of the indicator values for the related defects is reaching below the indicator ‘Recording level’. The system also has some ‘overcalls’ in terms of the bandwidth of the indicator values for the quality case defects, which is reaching into the range for rejectable defects.
Box B1 represents the traditionally used diagram for the assessment of NDE effectiveness as already discussed in paragraph 2.6.1 (see Fig. 4).
The most relevant information about inspection effectiveness can be extracted if both types of diagrams (of box B and B1) are being used together.
Box C (Fig. 12) lists the main criteria for the selection of the inspection areas.
Component Specific Analysis
Determination of Areas associated with
Critical Defects
Acceptable Defects
NDE – Effectiveness
NDE – Intervals
Qualification Criteria
FIG. 12. Component specific analysis.
It is important to note, that this selection is performed by a close interaction with the risk assessment represented by Box D. This process is expected to be iterative in most cases, specifically in the introductory phase of risk-informed inspection. This iterative process is providing relevant feedback to the consideration regarding NDE in terms of the need for optimisation, the resulting effectiveness and its proof by qualification.
Box C1 (Fig. 13) is the translation of box A into the process described by box C with realistic values for some relevant criteria. The NDE aspects are all concentrated into the word “performance”, which again underlines the relevance of the level of NDE performance, for which comprehensive and solid evidence has to be given by inspection qualification.
- Definition of symbols: • Fu: fatigue usage factor • Fa: fatigue usage factor for crack like defect areas • t : thickness of the component • A, C, D: level of criteria connected to transient category • a: crack size • T: temperature and Ttransition: brittle-ductile transition temperature • J: fracture resistance parameter • dJ/da: ductile tearing resistance modulus • Lr: reference stress = applied load / limit load • S. A.: Safety Authority
23

As presented in Fig. 13, quantitative criteria are proposed for 2 major damages: fatigue and rupture. For fatigue, we consider that a location is sensitive if the usage factor, evaluated in accordance with RCC-M, is greater than 1. For locations, where the usage factor is between 0.5 and 1, a specific evaluation is done to look at the uncertainties in number of cycles, load evaluation and fabrication quality (through end of fabrication report).
Fatigue Analysis
Fracture Mechanics Analysis
Other Damages
Field Experience
SA specific Requests
Concerned Locations
Fu < 0,5Fa > 1
Concerned Locations• All welds• Cast material• Nozzle corner• 3 pass bids; <1/2t and
>1/4t• Specific Safety Factors
2, 1.6, 1.2 for level A, C, D
Sensitive Locations• amax 20 mm• T < TTransition
• J<50kJ/m2 and dJ/da<20MPa
• Lf > 1
ISI
Locations/Performance
Synthesis of all the different aspects;
technical analysis,radioprotection and
economical approaches
Complementary Sampling
Sensitive Locations
Fu < 0,5Fa > 1
FIG. 13. Example of Strategy for selection of ISI areas.
For flaw tolerance and risk of rupture, we consider that a location is sensitive if the 3 bids height crack cannot fulfil the safety factors (2 in level A, 1.6 in level C and 1.2 in level D). This 3-bid height has to be greater than ¼ t and less than ½ t (t: thickness of the wall) or 20mm.In addition to that, we consider as sensitive locations: - Locations that can operate in the brittle regime: operating temperature less than transition
temperature of the location. - Location where ductile tearing properties are low: J<50KJ/m2 and dJ/da<20Mpa. - Location with high mechanical loads: cracked location limit load based on yield strength
greater than 1 (Lr > 1). All these verifications have to be done on weld areas, cladding areas, cast material areas and nozzle corners.
5. ISI EFFECTIVENESS IN VIEW OF THE MASTER DIAGRAM
5.1. RECONSIDERING ISI SCOPE IN CONNECTION WITH NDE EFFECTIVENESS
The considerations of the relation between ISI scope and cost have not explicitly included the element of risk. This relation as demonstrated in Fig. 1 should be reconsidered under the aspect of the risk-informed inspection concept.
We have to be aware, that the diagram is explicitly dealing with the consideration of the consequences, but at least implicitly with the probability of failure as well: Cost has been
24

considered as the consequence of a failure of a component or component area, the failure of which has been prevented by inspecting this very component or component area. The qualitative character of the diagram does not necessitate the quantification of the probability of failure “with no inspection” against “with inspection”, only a reduction of that probability by effective inspection is — reasonably — assumed. However, this diagram can be easily transformed into a quantitative diagram, which would allow assessing the true benefit from an inspection in a well-selected scope. This shall be considered in some more detail:
If we use cost as "consequence" in the risk matrix, then risk assessment gives a risk ranking in terms of potential losses from unscheduled outages. The first assessment must be with no inspection. If then we introduce an inspection scope, which must include some form of inspection efficiency or capability, then we can assess how this changes the risk with an increasing scope. Subtracting the risk after inspection from the risk before inspection gives a measure of the risk reduction provided by the inspection. If now one plots the accumulative risk by subtracting the risk reduction provided by each individual inspection in the scope, starting with the highest level of protection first and proceeding down the risk ranking, then one obtains a monotonically decreasing curve as the scope expands (see Fig.1).
However, if now the cost of each inspection is added, a plot of the total cost to the plant can be obtained. This curve will show a minimum in terms of the total cost. Beyond this point there is still a net value but the inspection cost outweigh the inspection benefits, which leads to an increase of the total cost to the plant beyond this point for each additional inspection. This curve converts the concept of inspection as a cost, the positive cumulative curve, into an asset that protects the utility against unscheduled losses.
If now the NDE effectiveness is introduced as a parameter, in case of reduced inspection efficiency, then the reduction of the probability of failure will decrease and the overall cost will increase compared to the effective inspection over the same scope. Therefore in the case of less NDE effectiveness, the minimum of the overall cost will move to the right and be at a higher level. The higher level can easily represent more cost than the accumulated cost of an effective inspection. Thus the better the inspection, the larger the scope of inspection that can be justified.
However, the consideration of dose application to personnel represents a limiting factor to extending the scope of even effective inspection too far. RI-ISI offers flexibility to address dose reduction. When several locations identified for inspection are being evaluated for being included in the scope, those within the same risk rank with the lowest dose burden can be chosen preferentially. Thus, the same level of risk can be addressed with the lowest dose.
Such comprehensive concept regarding all relevant cost and safety factors, the true value of the inspection can be put before the utility owners.
5.2. THE CONCEPT OF THE "UNKNOWN"
There may still be the argument, that all events cannot be predicted and the RI-ISI concept may still miss areas with substantial risk. Some assumptions in this direction have also been made in order to maintain sufficient transparency when discussing the basic diagrams as they have been presented.
An integrated risk-informed ISI methodology must allow for the possibility that degradation may occur in locations that are not expected to fail based on current knowledge of degradation mechanisms and service experience. In particular, locations with high consequence of failure
25

must be addressed even if no damage mechanism is predicted to occur there. These locations should be included in the inspection program.
For those locations where specific damage mechanisms have been projected to be potentially operative, damage specific NDE procedures can be specified for application. When no damage mechanism can be projected in locations to be inspected, and therefore, a damage specific NDE procedure cannot be specified, a generic volumetric or surface examination using the best judgment taking into account the location characteristics is typically applied following traditional code practices.
6. STRATEGIC CONSIDERATIONS
The elements of the Master Diagram have been defined in the preceding chapter and the logic connections of the elements in view of the process of risk informed inspection planning in its entirety have been presented. This chapter reflects some relevant aspects resulting from these mentioned connections and their consequences with regard to NDE effectiveness and its proof by inspection qualification.
The main task in dealing with this Master Diagram is to give the best possible definition of the abscissa and the ordinate of the risk diagram for each inspection area and to critically review the results of the selection of the inspection areas in terms of feedback to the NDE domain. This feedback in terms of the need for optimisation, the resulting effectiveness and its proof by qualification is underlining the characteristics of this process to be iterative in terms of the NDE effectiveness assessment and optimisation strategy. On the other hand, it is the basis to put an end to optimisation processes of NDE for the sake of NDE alone.
This relevant link gives the element of inspection qualification a specific meaning: NDE is strongly contributing to the determination of the POF, thereby to the level of risk (not directly influencing or changing it). For this reason, the means to determine effectiveness, i.e. the quality of the provided evidence is of great importance. This applies to the systematic scrutiny of the applicability of the already existing evidence as cited in the technical justification, the technical authenticity of the conclusions drawn in the process of technical justification as well as for the stringency imposed by the selection of the defects to be the basis of the practical exercise. These three aspects are not the only ones to be considered, but certainly among the most relevant ones.
Another important aspect of this entire process described by the Master Diagram is that the process of the selection of the inspection areas and of the determination of the inspection intervals is a dynamic process over the plant life. During plant operation, and specifically under the aspect of excursions from the operational parameters as planned by design, the status of the integrity, a component or a part thereof may change and ask for more stringent and comprehensive inspection programs, at least, for a unique inspection to ensure, that the old POF level is maintained. The precise documentation of the occurrences over the plant operation periods as well as the access to the experience of other plants is of utmost relevance for this dynamic process. However, the experience available from other plants should be filtered through the plant specific design and operational features. Under these considerations, the establishment of databases documenting plant life experience is very helpful.
Another important aspect is the establishment of a database about available test and qualification blocks with all the pertinent information of their parameters to be able to judge
26

the applicability in a qualification process under the aspects as cited above. The same applies for the availability and the exchange of technical evidence as the basis for technical justifications, as long as these data are applicable to the specific case. This aspect asks for well-defined presentation of the evidence data including the exhaustive specification of the boundary conditions, under which these data have been obtained. The availability and exchange of test blocks and of technical evidence among the nuclear family is very important and helps to save considerable cost in establishing qualification processes in the context of risk-informed inspection.
As mentioned before, NDE can only give a diagnosis, which means, that it can determine the integrity status of component or a part thereof, but it cannot directly change or influence the "inherent" POF or the associated risk. This can only be done by better defining the true status of the component or by the ensuing therapy, which would be some retrofit, repair or replacement measure.
With regard to all the strategic aspects mentioned, RI-ISI will contribute to a cost effective and safety-conscious operation of nuclear power plants.
7. CONCLUSIONS
This report describes principles for improving ISI effectiveness. Concepts for improving both elements of ISI are examined, namely, improving the selection of inspection scope and interval, and improving the effectiveness of NDE. Specifically, the use of risk-informed insights to improve the scope selection and the role of performance demonstration (or qualification) in improving the NDE effectiveness are discussed.
Several risk-informed ISI methodologies have been developed and are in use worldwide. Each has particular features that may make one or the other more appropriate for a particular plant application. Accordingly, plant managers could use practical guidance for evaluating these methodologies to determine the approach that would best fit their particular situations. For example, the available methodologies require somewhat different skill sets and different levels of support required from the plant staff. A particular plant manager may therefore need to evaluate the resources available to support implementation.
Plant managers also require guidance on how to select the optimum scope of application of RI-ISI, as some plants would benefit from a focused application of RI-ISI to selected systems. Scoping tools should be developed to aid plant staff to easily determine the most practical and effective scope selection.
A next logical step that could be taken would be to develop practical guidance for plant managers, ISI engineers, and NDE specialists that would help them apply these concepts.
The relationship between ISI effectiveness and cost has been discussed conceptually. Inspection scope selection and NDE effectiveness (including performance demonstration) have strong and complex influences on total cost. These complex relationships make it difficult for specialists to evaluate how best to optimize the scope-cost-NDE effectiveness relationship. Plant managers require practical tools and models that can be used to guide them to make informed decisions about approaches to be taken. These tools and models would take specific inputs related to technical and economic issues as well as particular requirements for each situation.
27

REFERENCES
[1] INTERNATIONAL ATOMIC ENERGY AGENCY, Safety of Nuclear Power Plants: Operation, Safety Requirements, Safety Standards Series No. NS-R-2, IAEA, Vienna (2000).
[2] INTERNATIONAL ATOMIC ENERGY AGENCY, Maintenance, Surveillance and In-service Inspection in Nuclear Power Plants. Safety Guide, Safety Standards Series No. NS-G-2.6, IAEA, Vienna (2002).
[3] Summary of the three phases of the PISC programme, PISC Report No. 17 (March 1992).
[4] European methodology for qualification of non-destructive testing (second issue), EUROPEAN COMMISSION, EUR 17299 EN, Luxembourg (1997).
[5] INTERNATIONAL ATOMIC ENERGY AGENCY, Methodology for qualification of in-service inspection systems for WWER nuclear power plants, IAEA-EBP-WWER-11, Vienna (1998).
[6] S.Reale, E.Capurro; Universita di Firenze, A structural integrity approach for defining the acceptance/rejection flaw size criteria in innovative plant components; Proceedings of the First international conference on NDE in relation to structural integrity for nuclear and pressurized components, Volume 2, p. 616, Amsterdam (1998).
[7] “Framework for Risk-Informed Inspection of Nuclear Power Plants in Europe”, Contract FI4S-CT98-0059 (2000).
[8] “Discussion Document on Risk-Informed In-Service Inspection of Nuclear Power Plants in Europe”, EUR 19742 EN (2000).
[9] Swedish Nuclear Power Inspectorate’s Regulation SKIFS 1998:1, ISSN 1400-1187, (1998).
[10] Guida de Seguridad 1.14, ISBN 84-95341-28-X, (2001). [11] “Report on Risk-Informed In-Service Inspection and In-Service Testing”, EUR 19153-
EN (1999). [12] ASME, Risk-Based Inspection-Development of Guidelines, Volume 2-Part 1,
Inspection of LWR components” (1992). [13] EPRI, Application of Risk-Informed Inspection Methodology to HELB, Technical
Report 10006937, (2001).
29

GLOSSARY amplitude The vertical height of a signal (measured from base to peak) on
a screen with its numerical value representing the energy received from a reflector
consequence The impact or the ultimate result of an event. Consequences can be measured in terms of impact on public safety, impact on the environment and cost or damage to the plant
core damage Uncovery and heatup of the reactor core to the point where damage to reactor fuel element or cladding is anticipated
core damage frequency An estimated frequency of occurrence of events leading to core damage
damage See degradationdefect Macroscopic imperfection. Includes flaws as well as other
macroscopic imperfections like over penetration in welds degradation Phenomena or process that attacks (wear, cracking etc) the
component material and might result in a reduction of component integrity
distance amplitude curve A curve constructed from the peak amplitude responses from reflectors of equal area at different distances in the same material. This techniques are important because of the amplitude of ultrasonic pulses varies with distance from the probe, and this needs to be compensated in order to perform the evaluation on a constant sensitivity level.
fission product release frequency
An estimate of the likelihood of radioactivity release involving release of airborne fission products
flaw Defective condition in which the metallurgical structure contains discontinuities such crack
incredibility of failure A systematic compound of measures from the design to the operational life of a component ensuring that its failure frequency is less than 10-7 per year
in-service inspection A periodic non-destructive examination of nuclear power plant components in order to provide information about their current condition and any damage, defect or degradation that might occur
inspection procedure A document specifying all essential parameters and setting out the precautions to be observed when applying an inspection technique for a specific inspection
inspection qualification The systematic assessment, by all those methods that are needed to provide reliable confirmation, of an inspection system to ensure it is capable of achieving the required performance under real inspection conditions
inspection system All parts of the non-destructive examination including equipment, inspection procedure and personnel which can influence the outcome and quality of inspection
31
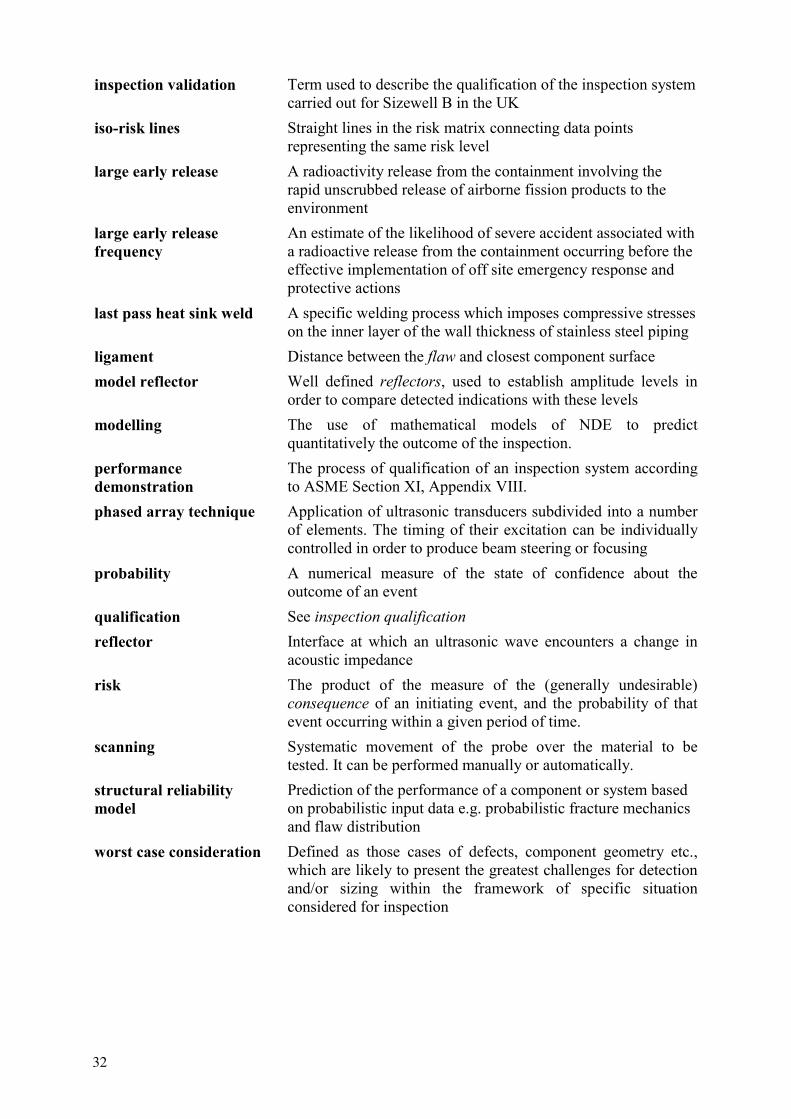
inspection validation Term used to describe the qualification of the inspection system carried out for Sizewell B in the UK
iso-risk lines Straight lines in the risk matrix connecting data points representing the same risk level
large early release A radioactivity release from the containment involving the rapid unscrubbed release of airborne fission products to the environment
large early release frequency
An estimate of the likelihood of severe accident associated with a radioactive release from the containment occurring before the effective implementation of off site emergency response and protective actions
last pass heat sink weld A specific welding process which imposes compressive stresses on the inner layer of the wall thickness of stainless steel piping
ligament Distance between the flaw and closest component surface model reflector Well defined reflectors, used to establish amplitude levels in
order to compare detected indications with these levels modelling The use of mathematical models of NDE to predict
quantitatively the outcome of the inspection. performance demonstration
The process of qualification of an inspection system according to ASME Section XI, Appendix VIII.
phased array technique Application of ultrasonic transducers subdivided into a number of elements. The timing of their excitation can be individually controlled in order to produce beam steering or focusing
probability A numerical measure of the state of confidence about the outcome of an event
qualification See inspection qualificationreflector Interface at which an ultrasonic wave encounters a change in
acoustic impedance risk The product of the measure of the (generally undesirable)
consequence of an initiating event, and the probability of that event occurring within a given period of time.
scanning Systematic movement of the probe over the material to be tested. It can be performed manually or automatically.
structural reliability model
Prediction of the performance of a component or system based on probabilistic input data e.g. probabilistic fracture mechanics and flaw distribution
worst case consideration Defined as those cases of defects, component geometry etc., which are likely to present the greatest challenges for detection and/or sizing within the framework of specific situation considered for inspection
32

ABBREVIATIONS
BOP Balance of Plant
BWR Boiling Water Reactor
CDF Core Damage Frequency
DAC Distance Amplitude Curve
FPRF Fission Product Release Frequency
IGSCC Intergranular Stress Corrosion Cracking
IOF Incredibility of Failure
ISI In-Service Inspection
LERF Large Early Release Frequency
LOCA Loss of Coolant Accident
LPHSW Last Pass Heat Sink Weld
NDE Non-destructive Examination
PCA Probability of Correct Acceptance
PCR Probability of Correct Rejection
PDI Performance Demonstration Initiative
PISC Program for Inspection of Steel Components
POD Probability of Detection
POF Probability of Failure
PRA Probabilistic Risk Assessment
PWR Pressurized Water Reactor
RI-ISI Risk Informed In-Service Inspection
RPV Reactor Pressure Vessel
SA Safety Authority
SG Steam Generator
SSC Systems, Structures and Components
UT Ultrasonic Testing
33

CONTRIBUTORS TO DRAFTING AND REVIEW
Ammirato, F. Electric Power Research Institute Center, United States of America Bieth, M. Joint Research Centre, European Commission, Petten, Netherlands
Chapman, O.J.V. O J V Consultancy, United Kingdom
Davies, L.M. United Kingdom
Engl, G. IntelligeNDT Systems & Services, Germany
Faidy, C. Electricite de France/SEPTEN, France Seldis, T. Joint Research Centre, European Commission,
Petten, Netherlands
Szabo, D. Paks NPP, Hungary
Trampus, P. International Atomic Energy Agency
Kang, Ki-Sig International Atomic Energy Agency
Zdarek, J. Nuclear Research Insitute, Czech Republic
Consultants Meetings
Vienna, Austria: 25–28 February 2002
Vienna, Austria: 26–29 November 2002
Vienna, Austria: 24–26 February 2003
Technical Meeting
Petten, Netherlands: 19–21 November 2002
35