improvement in soot concentration measurements by laser-induced incandescence (lii) through a...
TRANSCRIPT
Combustion and Flame 153 (2008) 650–654www.elsevier.com/locate/combustflame
Brief Communication
Improvement in soot concentration measurementsby laser-induced incandescence (LII) through a particle
size correction
J. Reimann, S.-A. Kuhlmann, S. Will ∗
Technische Thermodynamik, Universität Bremen, Badgasteiner Straße 1, D-28359 Bremen, Germany
Received 30 August 2007; received in revised form 21 January 2008; accepted 18 March 2008
Available online 22 April 2008
1. Introduction
Since the early 1990s, laser-induced incandes-cence (LII) has become an increasingly popular tech-nique for soot concentration measurements in flamesand engine exhausts, as it requires comparatively littleexperimental effort and it is based on the simple prin-ciple of heating up soot particles by a laser pulse andanalyzing the increased thermal radiation; for detailssee, e.g., Hofeldt [1] and Santoro and Shaddix [2].
For a high-fluence regime (i.e., with occurrence ofsignificant evaporation), Melton [3] in his theoreticalanalysis on soot concentration measurements by LIIalready derived a relation between the LII signal Smaxat the moment of maximum particle temperature andprimary particle diameter dp :
Smax ∝ dxp
with x = 3 + hcR
k�Hvλ−1
det = 3 + 0.154 · λ−1det (µm).
(1)
The individual symbols denote Planck’s constant h,the speed of light c, the universal gas constant R,Boltzmann’s constant k, the enthalpy of evapora-tion �Hv , and the detection wavelength λdet. Typi-cally, the visible spectral band is used for detection,so the exponent x in Eq. (1) differs only little from 3.Thus, it became widely accepted to set the maximum
* Corresponding author. Fax: +49 421 218 7555.E-mail address: [email protected] (S. Will).
0010-2180/$ – see front matter © 2008 The Combustion Institute.doi:10.1016/j.combustflame.2008.03.021
LII signal as proportional to the volume concentra-tion [4–6].
Equation (1) is based on the approximation thatthe laser energy absorbed equals the heat loss by sub-limation. While the absorption in the Rayleigh regimeis proportional to the particle volume, the evapora-tion term is linked to surface and soot vapor pressure.As larger particles have smaller specific surfaces, thebalance between laser absorption and evaporation re-sults in raised vapor pressures and thus somewhathigher temperatures. For that reason the detected sig-nal, which is the thermal radiation at the detectionwavelength, is increased due to the elevated tempera-ture and thus proportionality to particle volume is lost.It should be noted that it is difficult to experimentallydemonstrate differences in the particle temperaturesreached for various particle sizes. In a careful studyon peak soot temperatures after laser irradiation inthe high-fluence regime, De Iuliis et al. [7] found—within experimental error—a fairly constant tempera-ture of about 4000 K for different locations within twoflames. However, because of the strong dependenceof the LII signal on temperature, even slight tempera-ture differences may result in considerable deviationsin the LII signal, and indeed there are various exper-imental hints of deviations from the widely assumedproportionality between the LII signal and the volumefraction, as recently discussed by Bladh et al. [8].
Though initially neglected in the derivation ofEq. (1), the shrinking of particle size due to evapora-tion has little effect on this relation, as the fraction ofvolume evaporated is essentially independent of par-
Published by Elsevier Inc. All rights reserved.

J. Reimann et al. / Combustion and Flame 153 (2008) 650–654 651
ticle size. This statement holds because the amount ofevaporated material, which is identical to the changeof particle volume, is proportional to the laser energyabsorbed in excess of particle heating, which again isproportional to the particle volume, as other heat lossmechanisms in that period of time are negligible.
Potential errors in the approximation to set LII sig-nal as proportional to volume fraction obviously growwith increasing difference in particle size, e.g., be-tween different locations in a flame, and—because ofthe faster cooling of small particles—with a delayeddetection gate; cf. Ref. [9] and references therein.A drastic effect is to be expected in those cases whereparticle sizes differ significantly between the locationwhere LII calibration is performed and that of actualLII measurement, especially in another flame, as theLII calibration factor changes, which implicitly relieson the particle sizes encountered during calibration.A detailed numerical study of the errors associatedwith the assumption of direct proportionality was re-cently performed by Bladh et al. [8], yet to our knowl-edge no actual consideration of primary particle sizesfor an improved measurement of soot concentrationhas been implemented so far.
In the present Brief Communication we describea practical approach to such improved evaluation inthe case of a two-dimensional, i.e., imaging, mea-surement of soot volume fractions. In that type ofexperiment the common approach is to work in thehigh-fluence regime in order to render effects of in-homogeneities or partial absorption of the laser sheetnegligible. Accordingly, our present measurements,which are part of a study [10] on soot formation undermicrogravity conditions with the major aim of pro-viding a database for modeling, were performed in ahigh-fluence regime where the issue of a dependenceof the LII signal on primary particle size gains generalimportance. With the measurements presented here,the necessity for consideration of a suitable correctionis enhanced by the need to employ a delayed detec-tion and a strong difference in particle size betweencalibration and measurement. Although quantitativelythe influence of particle size is particularly strong inour case, the approach presented here may serve asa guideline also for other experiments in the high-fluence regime.
2. Setup and approach
Measurements of soot formation in laminar jet-diffusion flames (concentric tubes: fuel 8 mm, airco-flow 56 mm inner diameter, respectively) withvarious fuels under microgravity were performed inthe Bremen drop-tower. For the 2D-LII measure-ments the light of an excimer laser mounted at the
top of the drop-tower was guided into the fallingcapsule, formed to a light-sheet of approximately60 × 0.3 mm2, and redirected into the central partof the flame through a mirror mounted at an an-gle of 45◦. LII signals were acquired by two ICCDcameras aligned perpendicularly to and at oppositesides of the light sheet; the detection range was 390–455 nm (FWHM). Details on the experimental setupmay be found in Reimann and Will [10]. Mainly dueto the specially designed pointing assembly, an ex-cimer laser at 248 nm, which excited strong broad-band fluorescences and required the use of a detec-tion gate delayed by 100 ns for concentration mea-surements with one of the cameras, had to be usedas the sole laser system in the drop-tower. The laserproduced pulses of roughly 55 mJ, as monitored bya power meter, resulting in an average fluence of ap-proximately 300 mJ/cm2, which is somewhat abovetwice the value required to reach the evaporationthreshold (based on m̃ = 1.15 − 0.2i as index of re-fraction at 248 nm [11]). This high fluence was nec-essary to minimize the influence of inhomogeneitieswithin the beam profile, which is nominally close totop hat, but practically is rather poor because of verylong distances and numerous elements in the opticalpath. To obtain absolute values for soot concentrationfrom the LII signal, a calibration of the optical sys-tem was performed by a single-line extinction mea-surement through the central part of an ethene flameunder normal gravity. In doing so, the total soot loadobtained from the extinction of a HeNe-laser beamwhen passing through the flame was compared withthe relative LII signal integrated over this path to get acalibration constant, which was then used for all otherLII measurements. For the evaluation of the extinctionmeasurement a refractive index of m̃ = 1.57 − 0.56i
at 633 nm was used. For primary particle size mea-surement the other ICCD camera was also employed.where the detection gate was centered at 300 ns afterthe laser pulse. For ethene a detection gate of 15 nswas used for both cameras. In the case of methaneflames, which exhibit very low soot volume fractions,a detection gate of 35 ns was applied to obtain suf-ficient signal strength. For noise reduction, typically15 images were averaged. For the necessary auxiliaryinformation on primary particle sizes, a standard LIImodel was applied, where the aggregate structure ofsoot particles is considered through the utilization ofan average accommodation coefficient; for details andparameters see Kuhlmann et al. [12].
For temperature measurements two-color pyrom-etry was used, where natural flame emission isrecorded by the two cameras in two different wave-length bands, in our case centered at 600 nm and750 nm, respectively, with a spectral width of 40 nmeach. The recorded signals were averaged typically
652 J. Reimann et al. / Combustion and Flame 153 (2008) 650–654
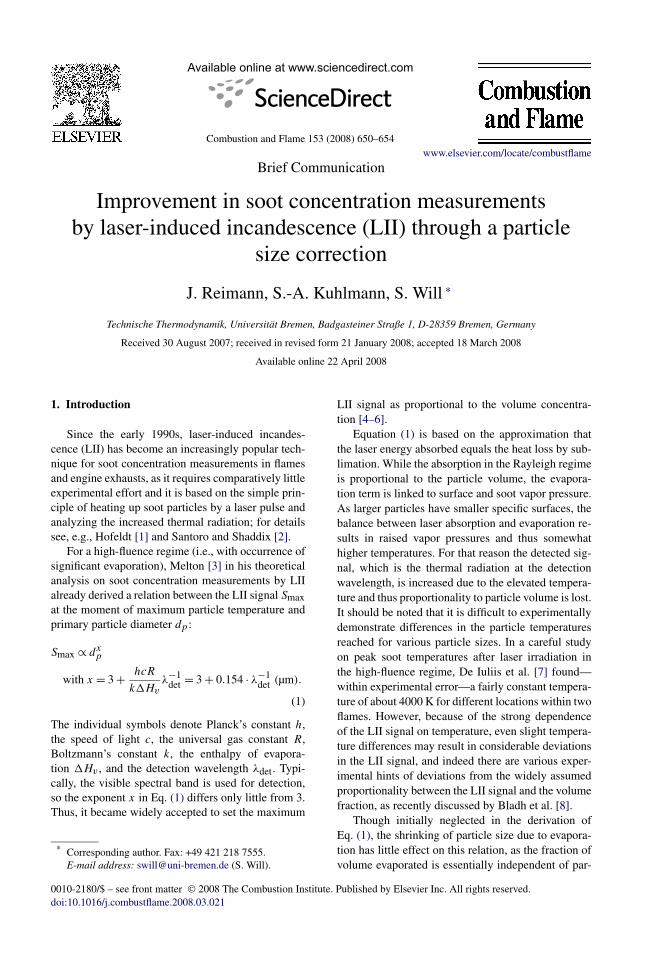
Fig. 1. Correlation between mean primary particle size and calculated LII signals at maximum and for detection delayed by100 ns. Calculations are based on a lognormal pdf of primary particle sizes and a detection window of 390–455 nm (FWHM).Individual plots are vertically shifted for better illustration.
over 30 images. For deconvolution of the line-of-sightintegrated data, a trimmed-mean filter [13] togetherwith a 3-point Abel inversion [14] was used. The re-fractive index was assumed to be constant over therelevant spectral range. For absolute temperatures,the setup was calibrated with quartz tungsten halo-gen lamps of known temperatures. The 600-nm bandwas then also employed for an independent determi-nation of soot concentration; cf. Refs. [15–17]. Forabsolute soot volume fractions, the same calibrationmeasurement and procedure as for the LII data wereused.
In order to analyze the correlation between theLII signal and the soot concentration, numerical cal-culations were performed for various mean primaryparticle sizes in the cases of a prompt detection (i.e.,peak signal, for comparison) and a delayed gate, re-spectively. An important issue in this context is thedistribution of primary particle sizes at a specific lo-cation in the flame. Typically, this distribution may bedescribed by a lognormal probability density function(pdf), and as an important test case we have chosen aself-preserving distribution with a geometric standarddeviation of σg = 1.45. Fig. 1 illustrates exemplarilyfor an underlying gas temperature of 1800 K that alsofor a distribution of particle sizes and polychromaticdetection the power-law approach of Eq. (1) may bereasonably employed in either case. For a prompt de-tection, an exponent of 3.31 results as compared toa value of 3.36 using Melton’s formula and the cen-
ter wavelength of detection. This deviation from strictproportionality considerably increases for the delayedgate to be used, ending up in an exponent of 3.48for σg = 1.45. Although a detailed discussion of theinfluence of variation of the underlying parametersis beyond the scope of the present communication,a few remarks are appropriate regarding the influenceof some key parameters. Generally, as a result of heatconduction, there is a slight dependence of the ex-ponent on the gas temperature for the delayed gate,namely of about −0.02/100 K. The influence of otherparameters in the case of delayed detection, as rele-vant here, is exemplarily depicted in Fig. 1. Thoughthe exact value of the exponent changes, a similarpower-law may also be derived for the case of a nar-row local distribution of particle sizes (with a valueof 3.53 for σg = 1.2) and the idealized case of amonodisperse size distribution (with a value of 3.58for σg = 1.0). Similarly, the value of the exponentchanges with laser fluence; as an example, a valueof 3.53 is obtained for delayed detection when onlyhalf the original fluence was used. It should also benoted that the width of the detection gate, if reason-ably small (few tens of nanoseconds), has practicallyno influence on the value of the exponent; the integra-tion over the detection gate results in a final value veryclose to that for the central value of a delayed gate.These considerations demonstrate that—although theexact results of course depend on the concise valuesof various parameters—even with, naturally, some

J. Reimann et al. / Combustion and Flame 153 (2008) 650–654 653
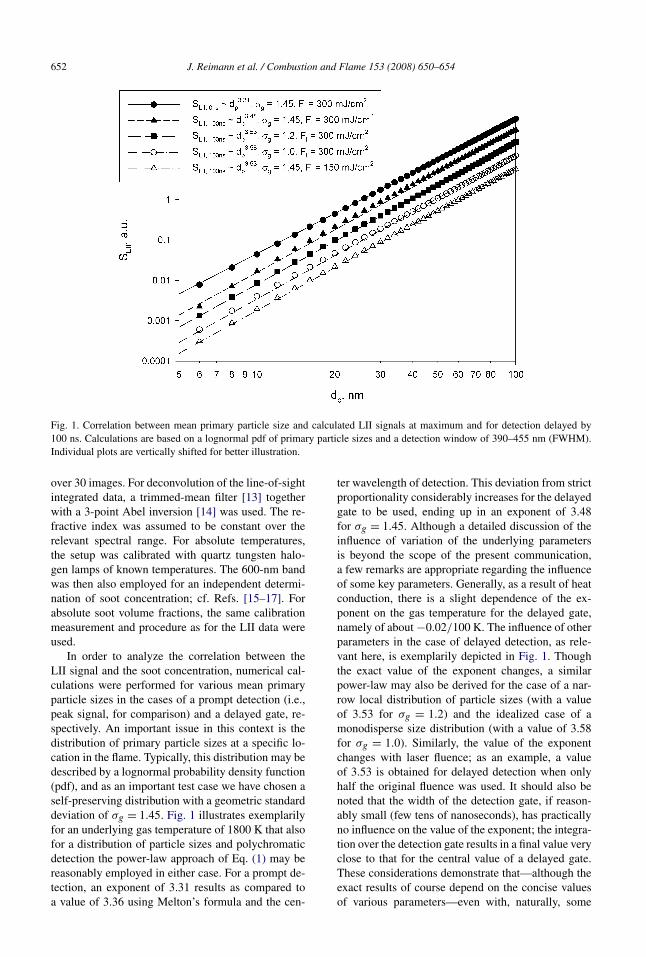
Fig. 2. From left to right: soot volume concentrations from two-color pyrometry, LII (uncorrected), LII after correction basedon particle sizes, and primary particle sizes. For better illustration two-color pyrometry data are mirrored. Regions of signalsinsufficient for data evaluation are shown in black; HAB denotes height above the burner. (a) Ethene flame with a fuel rate of2.1 mg/s under normal gravity; (b) methane flame with a fuel rate of 1.6 mg/s under microgravity.
uncertainties about the underlying parameters, simi-lar results are obtained, and complete neglect of theinfluence of particle size on LII concentration mea-surements results in a clearly enhanced error as com-pared with that from residual uncertainties in the in-dividual underlying parameters. The dependence onparticle size practically only vanishes when workingbelow the evaporation threshold and with prompt de-tection.
3. Results and discussion
An overview of the experimental results for anethene flame (reference, normal gravity—ng) anda methane flame (microgravity—µg), respectively, isdepicted in Fig. 2. The initial evaluation of experi-mental LII data was based on the common approachof proportionality of signal to volume concentration(column 2). Although emission pyrometry may beassociated with considerable error—due to the decon-volution procedure, especially near the centerline—there is a striking difference between LII and pyrom-etry results in the case of the methane flame, withmaximum concentrations deviating by a factor of 2.4,which may be explained by the neglect of particlesizes in the evaluation. This effect is most striking formethane, with maximum particle sizes of about 7 nm,as compared to 35 nm for the ng ethene flame; butalso for other fuels and flow rates, deviations gener-ally tend to increase with larger deviations in particle
size from calibration conditions. Note that an individ-ual calibration, e.g., for various fuels, not only causesadditional effort, but also is of little help because ofstrong differences between particle sizes under nor-mal and reduced gravity; in the case of methane acalibration under normal gravity is hardly possibledue to very low soot load.
To take the size dependence of LII measurementsinto account the usual assumption of proportionalitybetween LII signal and concentration was abandoned,but the LII signals were now correctly weighted onthe basis of the corresponding primary particle sizes;i.e., each pixel was weighted with a factor of d
−0.48p
(resulting from the ratio d3p/d3.48
p ), and a new cali-bration factor was calculated. The results of this pro-cedure are shown in Fig. 2, third column. For theethene flame the changes from the uncorrected valuesare comparatively small, as the central portion of thisflame was used for calibration. In the case of methane,however, the huge discrepancy between LII and two-color pyrometry is now eliminated by the correction,and good agreement is obtained.
4. Conclusions
In conclusion, the results revealed that primaryparticle size may distinctively affect LII concentrationmeasurements in the high-fluence regime and mustbe considered in some instances. In the present case,this problem was enhanced by the necessity for a de-

654 J. Reimann et al. / Combustion and Flame 153 (2008) 650–654
layed detection, but also for prompt detection one canexpect a significant influence on results for stronglydiffering particle sizes. If particle sizes are known,LII concentration measurements may be considerablyimproved by correct weighting of data on the basis ofprimary particle sizes. While the numerical value ofthe exponent to be used for this correction naturallydepends on the respective experimental conditions,the approach presented may be used as a practicalguideline.
Acknowledgments
The authors gratefully acknowledge financial sup-port by the European Space Agency in the frame ofthe MAP-project AO-99-007 and the assistance of theteam of ZARM-FAB in the preparation and executionof the experiments.
References
[1] D.L. Hofeldt, SAE-Paper 930079 (1993).[2] R.J. Santoro, C.R. Shaddix, in: K. Kohse-Höinghaus,
J.B. Jeffries (Eds.), Applied Combustion Diagnostics,Taylor & Francis, New York, 2002, pp. 252–286.
[3] L.A. Melton, Appl. Opt. 23 (1984) 2201–2207.
[4] R.L. Vander Wal, K.J. Weiland, Appl. Phys. B 59(1994) 445–452.
[5] B. Quay, T.-W. Lee, T. Ni, R.J. Santoro, Combust.Flame 97 (1994) 384–392.
[6] C.R. Shaddix, J.E. Harrington, K.C. Smyth, Combust.Flame 99 (1994) 723–732.
[7] S. De Iuliis, F. Cignoli, G. Zizak, Appl. Phys. B 83(2006) 397–402.
[8] H. Bladh, J. Johnsson, P.-E. Bengtsson, Appl. Phys. B90 (2008) 109–125.
[9] C. Schulz, B. Kock, M. Hofmann, H. Michelsen,S. Will, B. Bougie, R. Suntz, G. Smallwood, Appl.Phys. B 83 (2006) 333–354.
[10] J. Reimann, S. Will, Microgravity Sci. Technol. 16(2005) 333–337.
[11] B.M. Vaglieco, F. Beretta, A. D’Alessio, Combust.Flame 79 (1990) 259–271.
[12] S.-A. Kuhlmann, J. Reimann, S. Will, J. Aerosol Sci. 37(2006) 1696–1716.
[13] H.R. Myler, A.R. Weeks, The Pocket Handbook of Im-age Processing Algorithms in C, Prentice Hall, Engle-wood Cliffs, NJ, 1993.
[14] C.J. Dasch, Appl. Opt. 31 (1992) 1146–1152.[15] R.J. Hall, P.A. Bonczyk, Appl. Opt. 29 (1990) 4590–
4598.[16] S. di Stasio, P. Massoli, Meas. Sci. Technol. 5 (1994)
1453–1465.[17] D.R. Snelling, K.A. Thomson, G.J. Smallwood, Ö.L.
Gülder, E.J. Weckman, R.A. Fraser, AIAA J. 40 (2002)1789–1795.